
Case Study for the Predictive Environmental Risk Assessment of Hexamethylenetetramine Release to the Yodo River during a Massive Tsunami Attack

Abstract
:1. Introduction
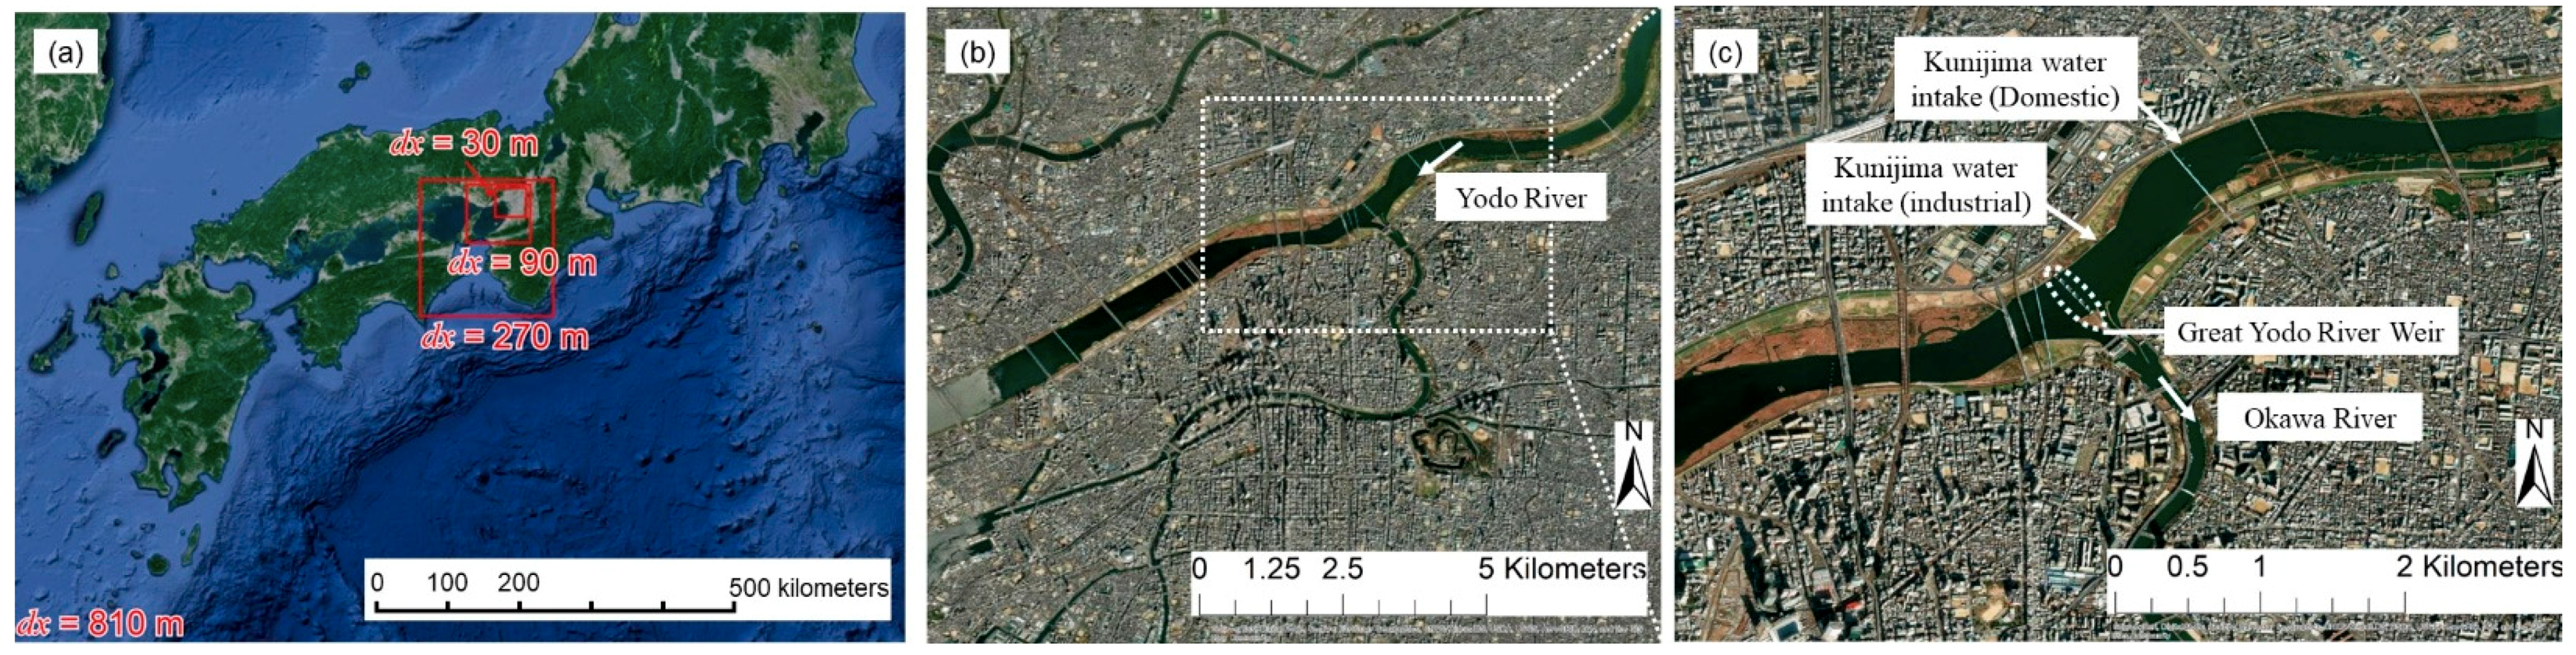
2. Target Area
3. Methods
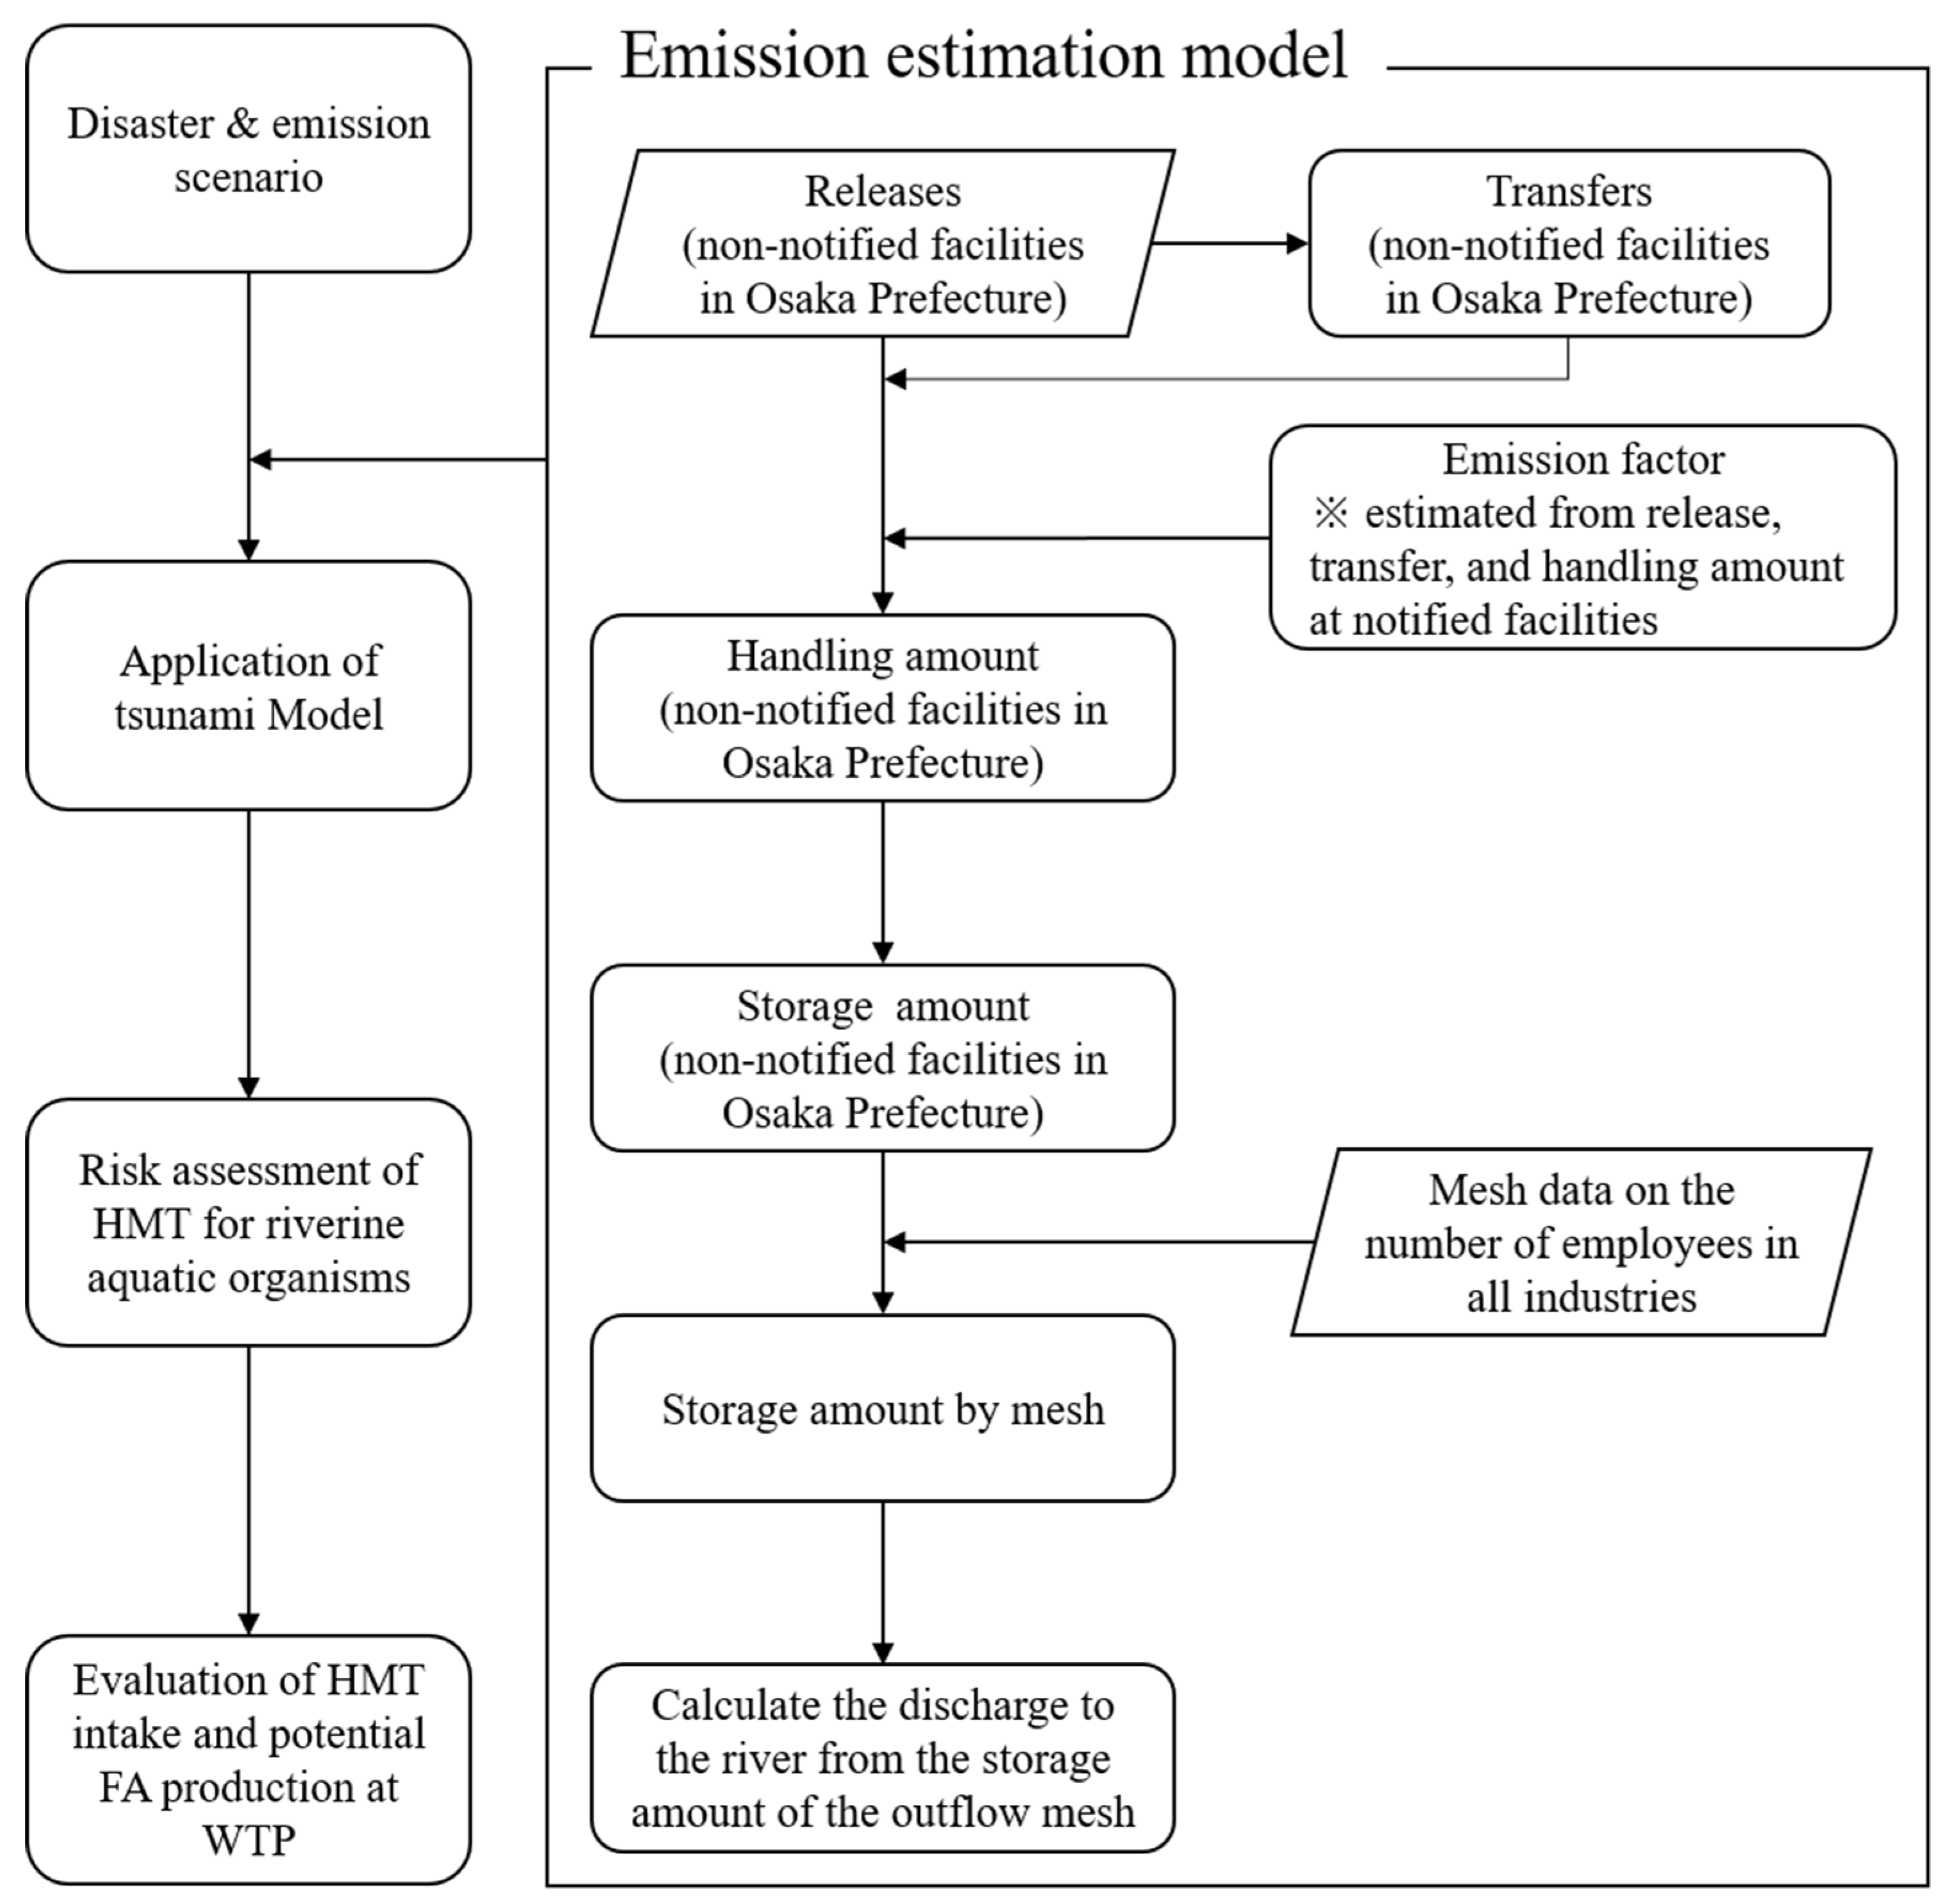
3.1. Framework of Analysis
3.2. Estimation of HMT Outflow during Disasters and Accidents
| Variables | Meaning |
| Transfers (non-notified facilities in Osaka Prefecture) (kg/year) | |
| Releases (non-notified facilities in Osaka Prefecture) (kg/year) | |
| Transfers (notified facilities in Osaka Prefecture) (kg/year) | |
| Releases (notified facilities in Osaka Prefecture) (kg/year) | |
| Handling amount (notified facilities in Osaka Prefecture) (kg/year) | |
| Emission factor [–] | |
| Handling amount (non-notified facilities in Osaka Prefecture) (kg/year) | |
| Storage amount (non-notified facilities in Osaka Prefecture) [kg/day] | |
| Storage amount by mesh (non-notified facilities) [kg/day] | |
| Number of employees in all industries in Osaka | |
| Number of employees in all industries by mesh |
3.3. Leakage from Facilities
3.4. Discharge into River
3.5. River Runoff and Tsunami Analysis Models and Settings
3.6. Risk Assessment of HMT to Riverine Aquatic Organisms
3.7. Risk Assessment of Potential FA Production at WTP
3.8. Threshold for Risk Determination
4. Case Study
4.1. Analysis Conditions
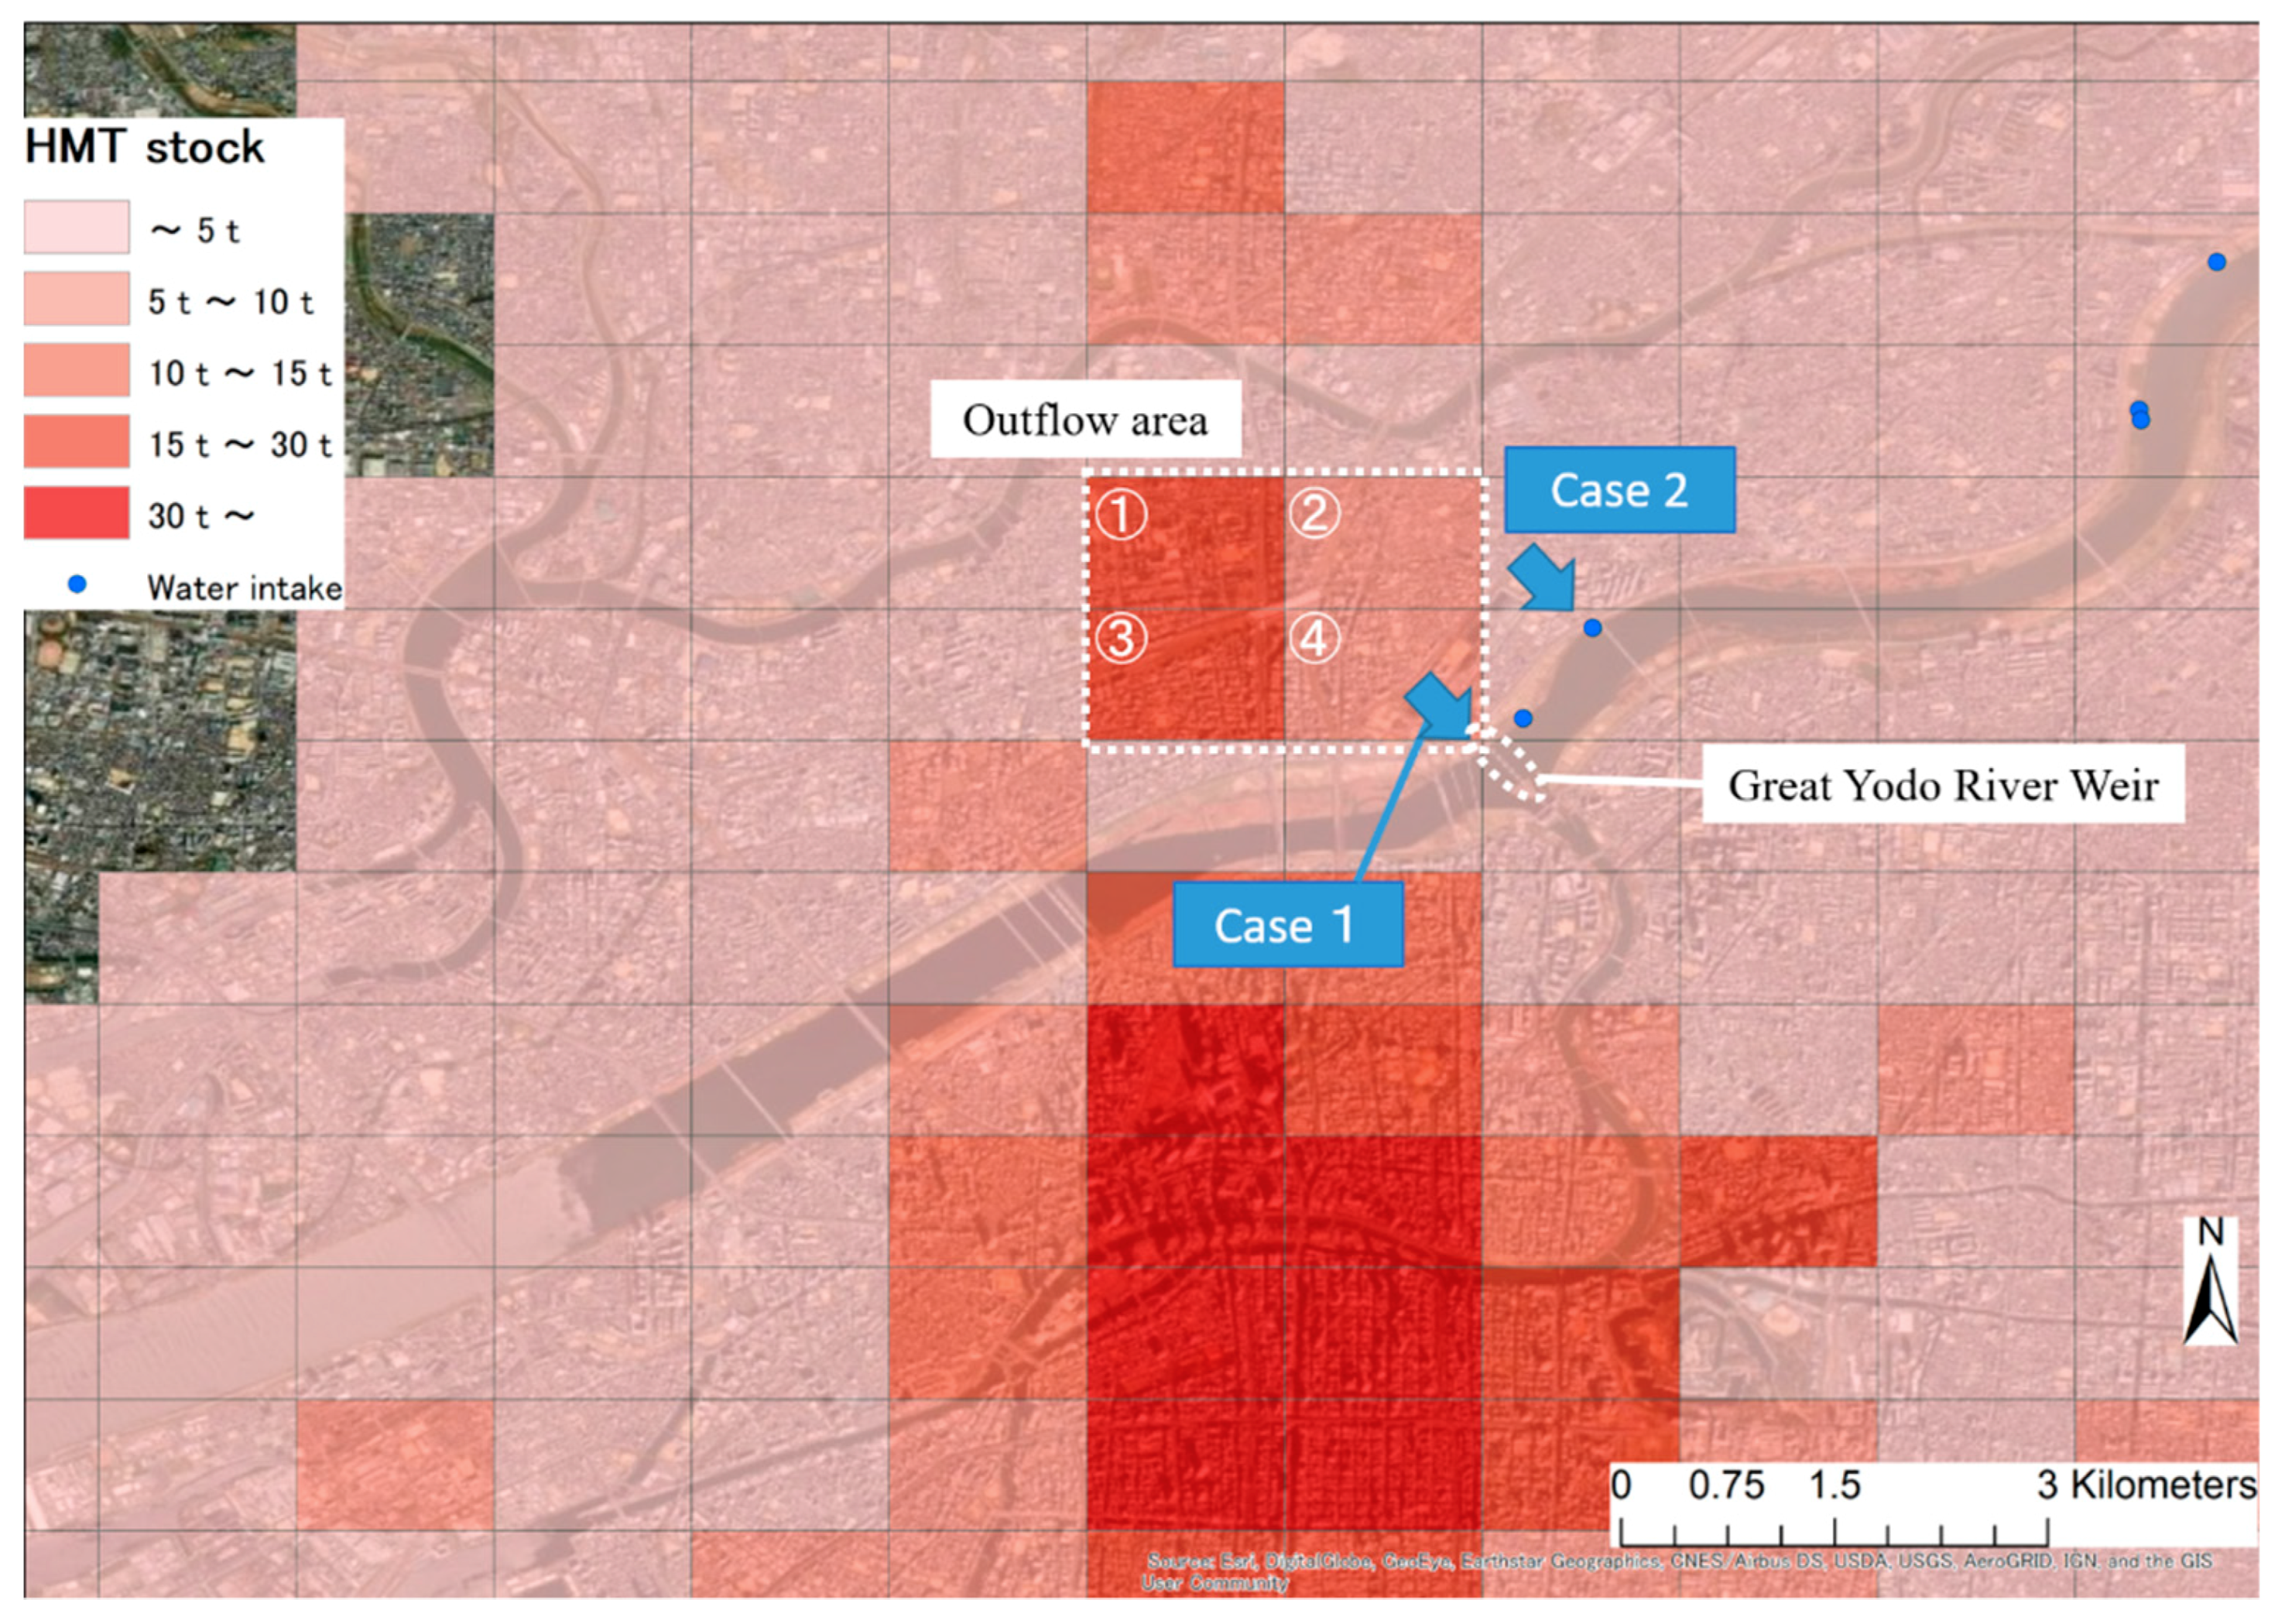
4.2. Case Setting
5. Results and Discussion
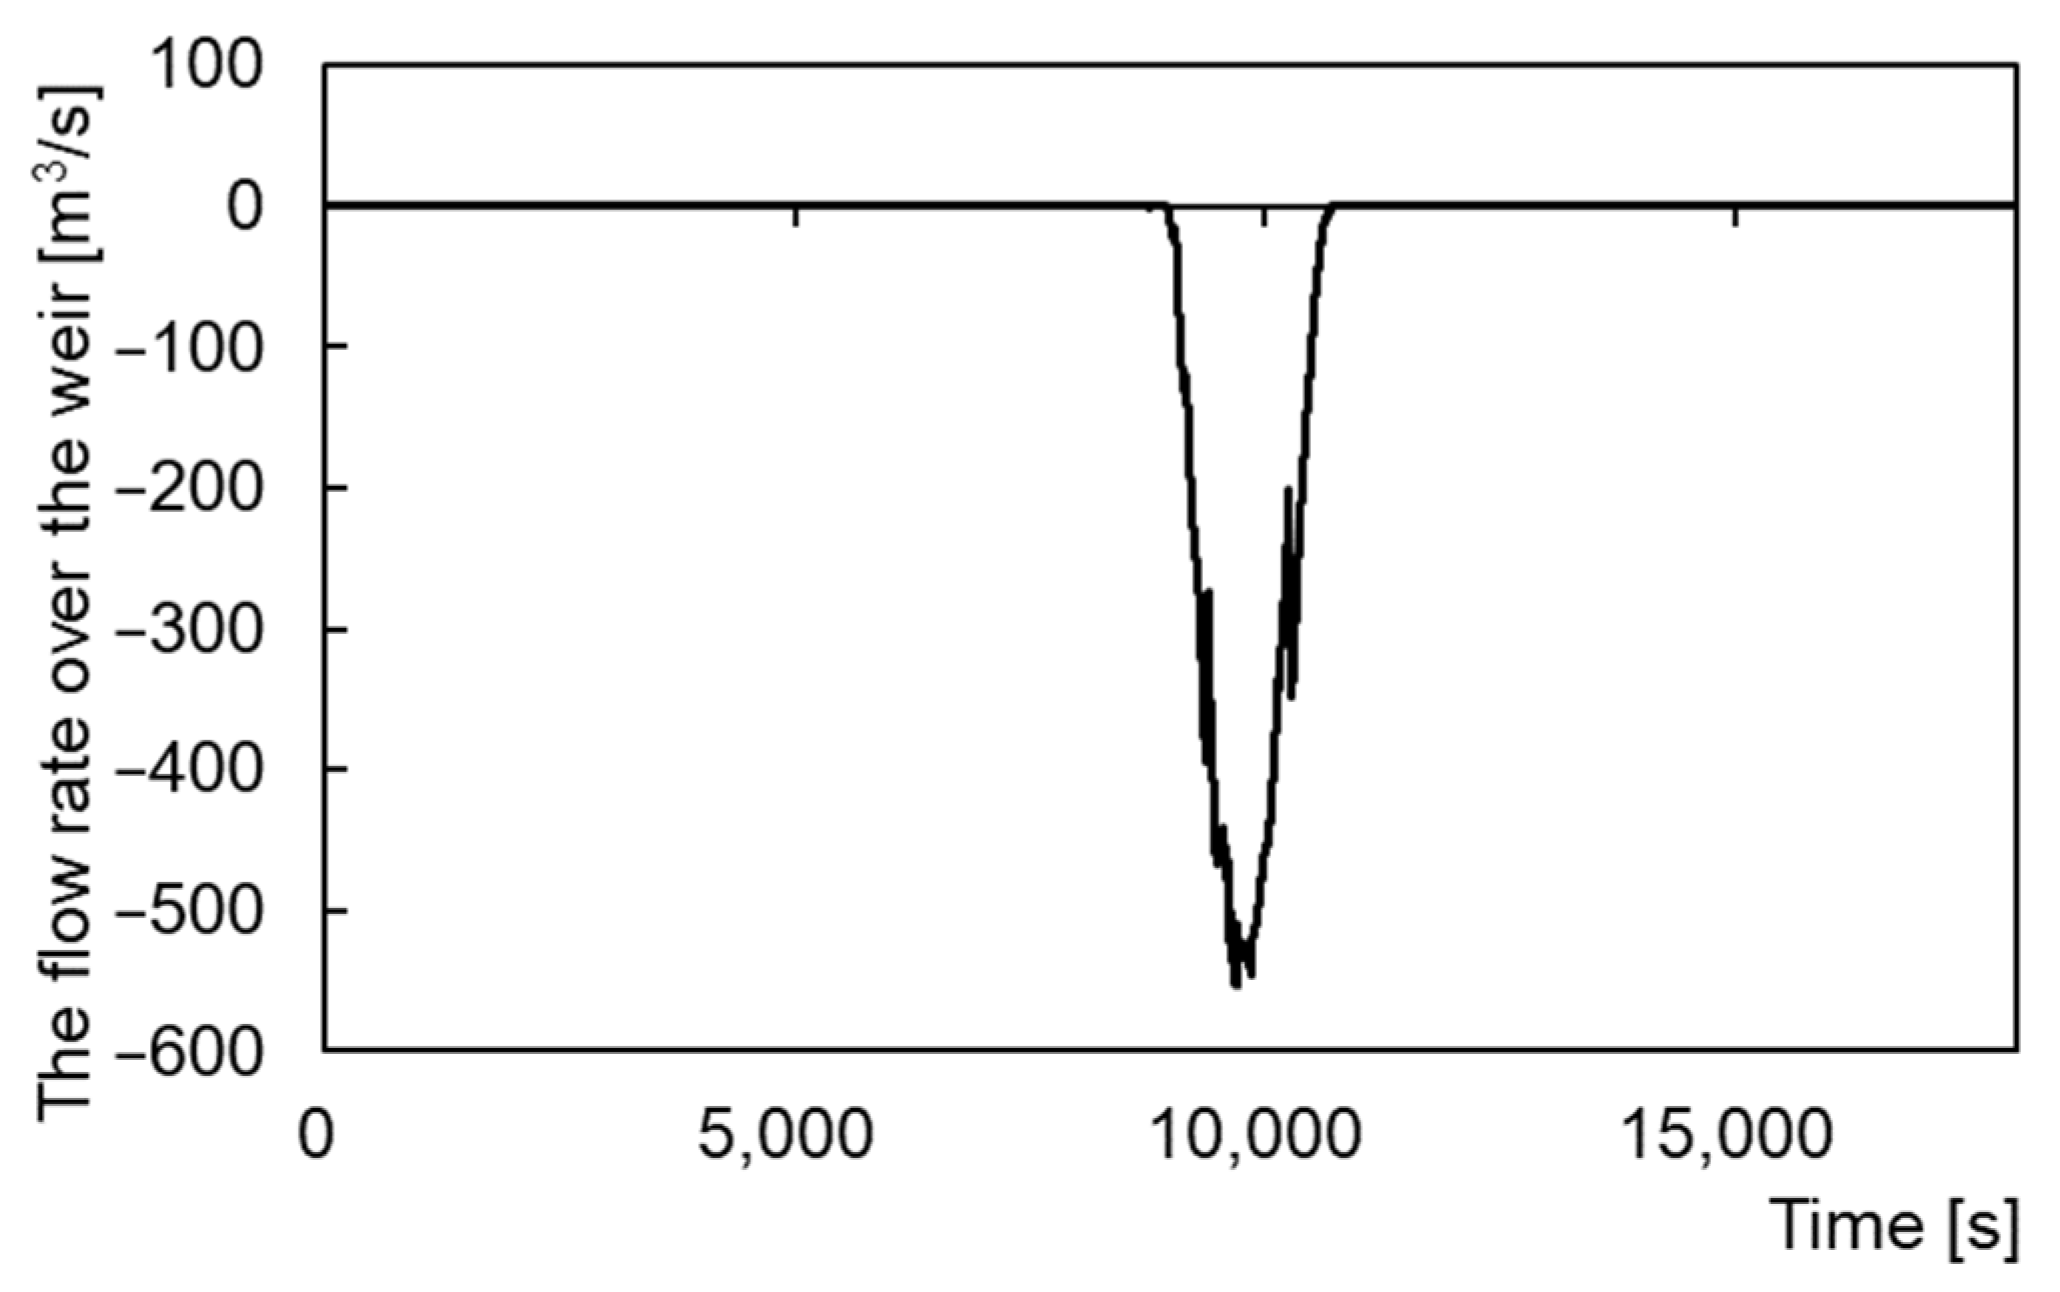
5.1. Examination of Water Flow at the Yodo River Weir, HMT Storage Amount, and Outflow Amount
5.2. Case 1
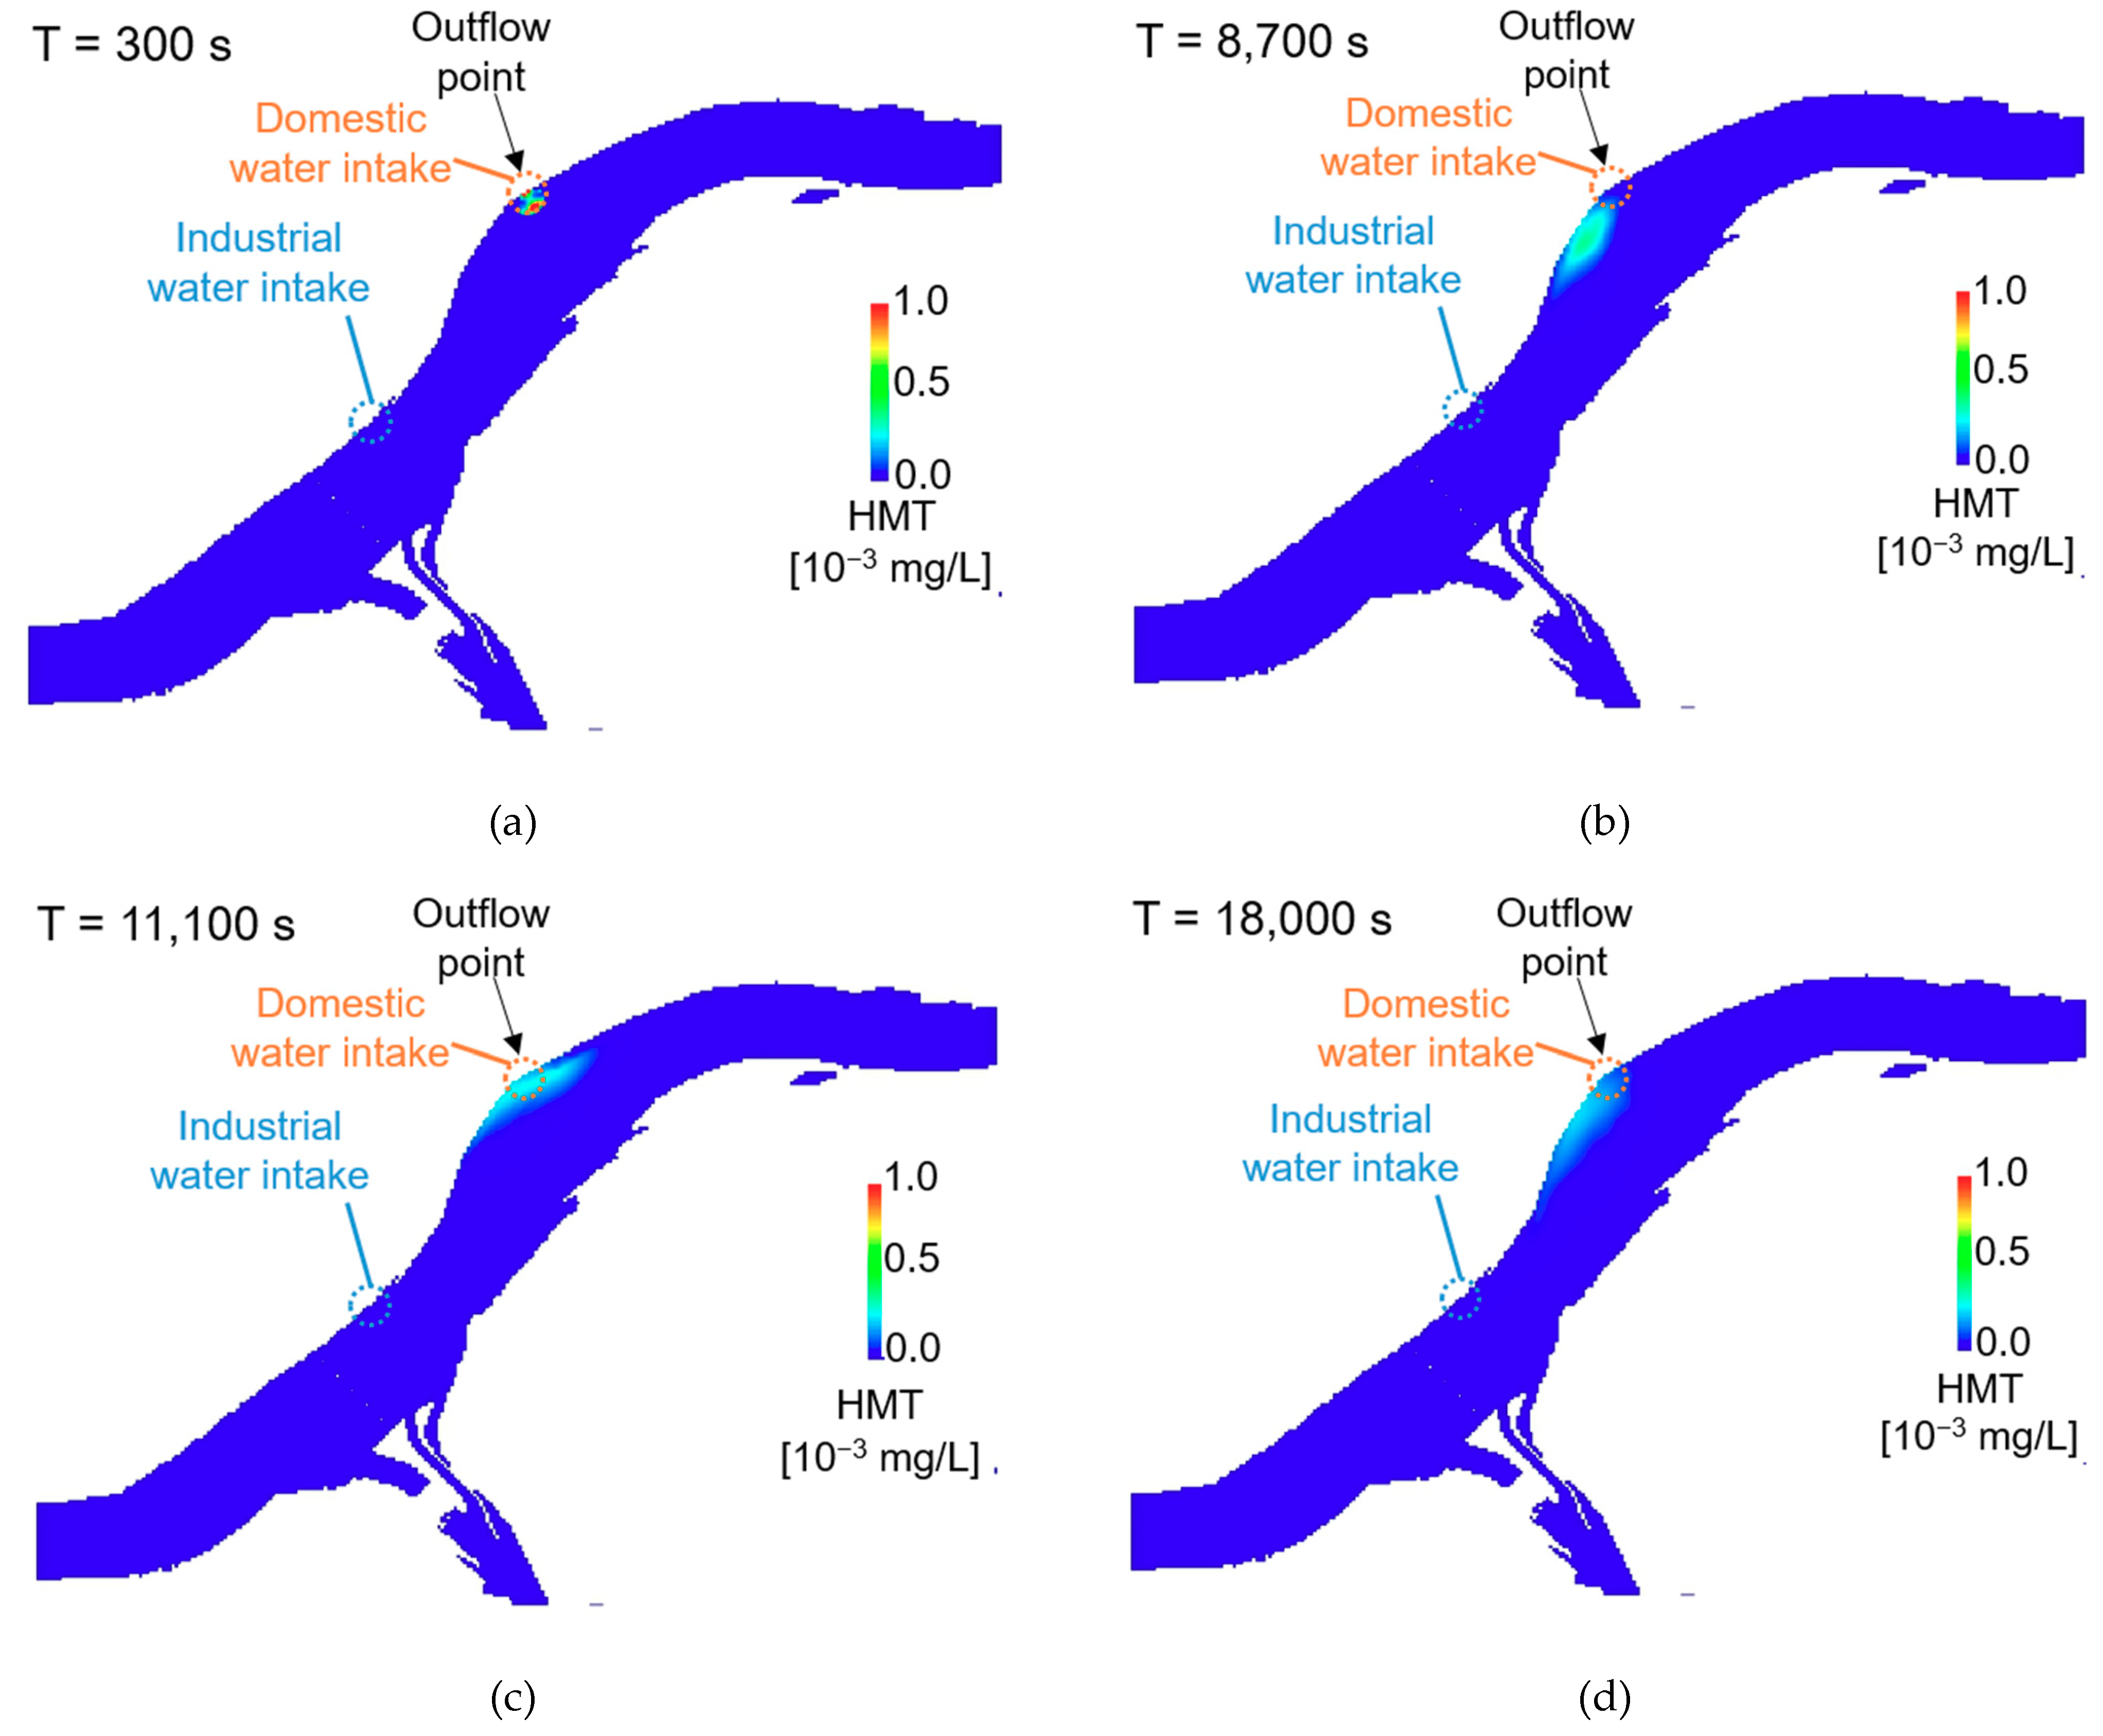
5.2.1. Behavior and Concentration Distribution of HMT
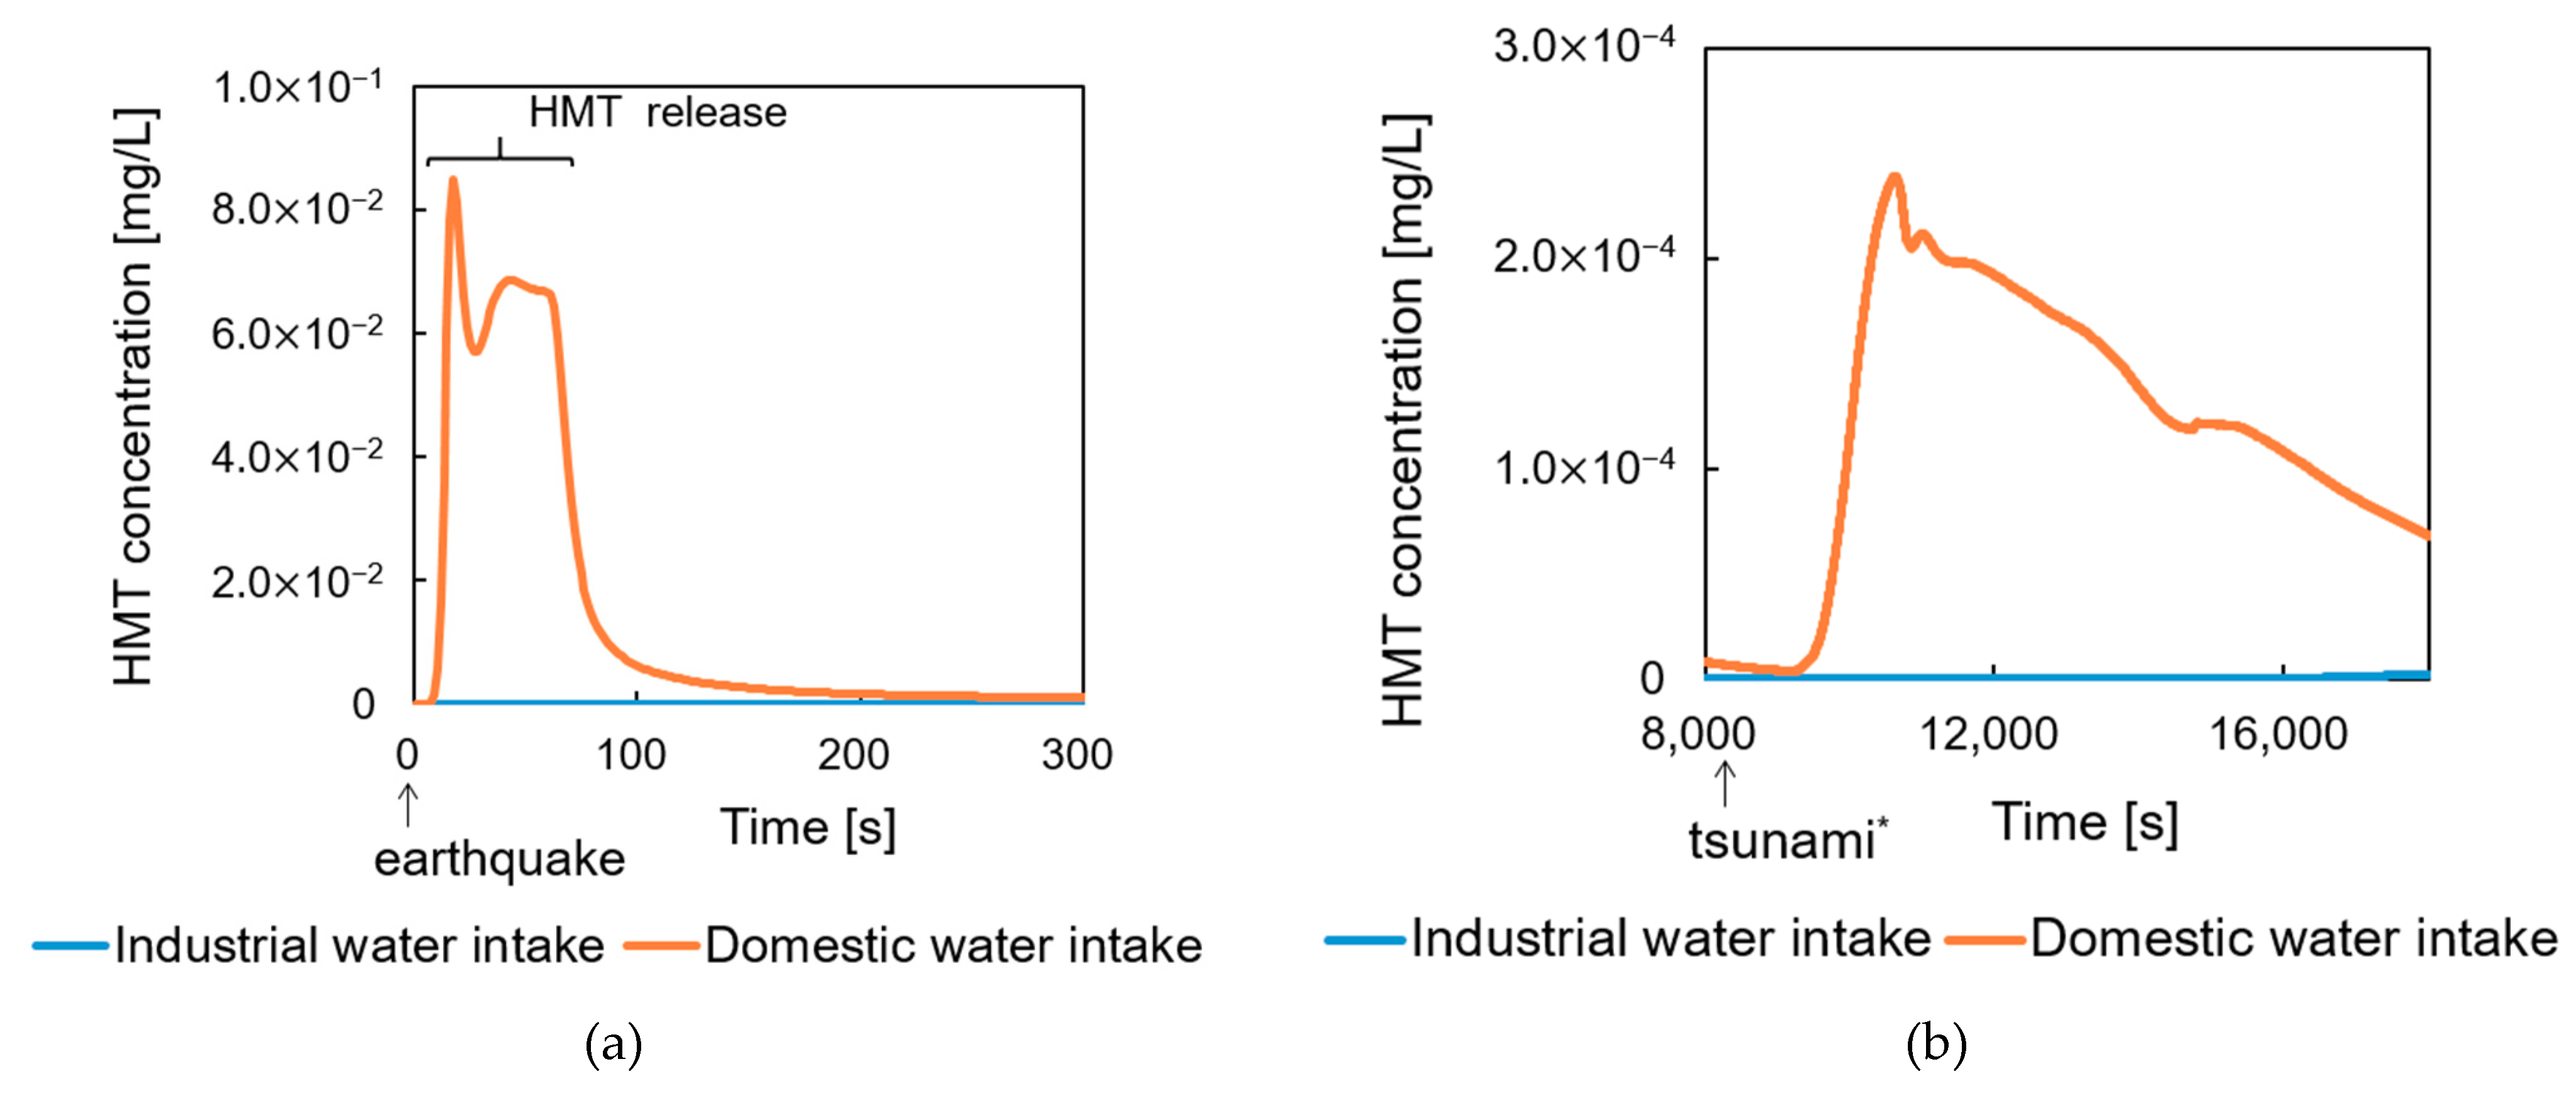
5.2.2. Risk Assessment of HMT to Riverine Aquatic Organisms and Humans
5.3. Case 2
5.3.1. Behavior and Concentration Distribution of HMT
5.3.2. Risk Assessment of HMT to Riverine Aquatic Organisms and Humans
6. Conclusions
Author Contributions
Funding
Institutional Review Board Statement
Informed Consent Statement
Data Availability Statement
Acknowledgments
Conflicts of Interest
References
- The Headquarters for Earthquake Research Promotion. Nankai Torafu De Hassei Suru Jishin (Earthquake Occurring in Nankai Trough). 2013. Available online: https://www.jishin.go.jp/regional_seismicity/rs_kaiko/k_nankai (accessed on 29 January 2021).
- Kishimoto, A. Natech (Shizen Saigai Kiin No Sangyou Jiko) Risuku No Hyouka To Kanri (Risk Assessment and Management of Natech (Natural-hazard-triggered technological accidents). JSSE 2014, 53, 214–219. [Google Scholar]
- Suarez-Paba, M.C.; Mathis, P.; Felipe, M.; Cruz, A.M. Systematic literature review and qualitative meta-analysis of Natech research in the past four decades. Saf. Sci. 2019, 116, 58–77. [Google Scholar] [CrossRef]
- Tanaka, H.; Nguyen, X.T.; Nguyen, T.H.; Kayane, K.; Min, R.; Umeda, M.; Sasaki, M.; Kawagoe, S.; Tsuchiya, M. Intrusion Distance and Flow Discharge in Rivers during the 2011 Tohoku Tsunami. J. Mar. Sci. Eng. 2020, 8, 882. [Google Scholar] [CrossRef]
- Nagashima, H.; Yoneyama, N. Tsunami Raishuuji No Kadounai Ensui Sojou Ni Kansuru Suuchi Kaiseki Shuhou No Teian (A Proposal of Numerical Analysis Method for Salinity Transport in Rivers during Tsunami Attack). JSCE B2 Coast. Eng. 2017, 73, 19–32. [Google Scholar]
- Suidou Suigen Niokeru Shoudoku Hukuseiseibutsu Zenku Busshitsu Osen Taiou Housaku Kentoukai (Study Group on Countermeasures for Contamination by Precursors of Disinfection Byproducts in Water Sources). Suidou Suigen Niokeru Shoudoku Hukuseiseibutsu Zenku Busshitsu Osen Taiou Housaku Nitsuite Torimatome (Summary of Measures to Deal with Contamination by Precursors of Disinfection Byproducts in Drinking Water Sources). Available online: https://www.mhlw.go.jp/topics/bukyoku/kenkou/suido/kentoukai/dl/shoudoku02.pdf (accessed on 29 January 2021).
- Tsuruta, T.; Morizane, K.; Hirabayashi, T. Koudo Jousui Shori Niyoru Horumuarudehido Zenku Busshitsu No Jokyosei (Removal of formaldehyde precursors by advanced water purification treatment). In Proceedings of the Dai 66kai Nihon Suidou Kyoukai Zenkoku Suidou Kenkyuu Happyoukai (Japan Water Works Association National Waterworks Research Conference), Saitama, Japan, 21–23 October 2015. [Google Scholar]
- Japan Water Research Center. Suidou Jigyou Ni Okeru Koudo Jousui Shori No Dounyu Jittai Oyobi Dounyuu Kentou Nado Ni Kansuru Gijutsu Shiryou (Technical Data on the Actual Status of Installation and Study of Advanced Water Purification Treatment in Waterworks). Available online: https://www.mhlw.go.jp/topics/bukyoku/kenkou/suido/jousui/01.html (accessed on 29 January 2021).
- The Ministry of Economy, Trade and Industry. PRTR Taishou Jigyousha (Target Business of PRTR). Available online: https://www.meti.go.jp/policy/chemical_management/law/prtr/3.html (accessed on 29 January 2021).
- The Ministry of Environment. PRTR Information Hiroba (PRTR Information Square). Available online: http://www.env.go.jp/chemi/prtr/risk0.html (accessed on 29 January 2021).
- Nakakubo, T.; Tada, Y.; Tokai, A. Assessment and Measure-effectiveness of the Effect to Water Supply Function by Release of Chemical Substances Caused by Earthquake. Jpn. J. Risk Anal. 2016, 26, 131–140. [Google Scholar] [CrossRef]
- Osaka City Waterworks Bureau. Waterworks Bureau Business Annual Report 30.4.1~31.3.31. Available online: https://www.city.osaka.lg.jp/suido/page/0000496406.html (accessed on 29 January 2021).
- Yodogawa Oozeki Koujishi Henshuu Iinkai (The Great Yodo River Weir Construction Records Editorial Committee). Yodogawa Oozeki Shi (The Great Yodo River Weir Records); Kensetsushou Kinki Chihou Seibikyoku Yodogawa Kouji Jimusho (Yodo River Construction Office, Kinki Regional Development Bureau, Ministry of Construction): Osaka, Japan, 1983; pp. 37, 232. [Google Scholar]
- Matsumiya, H.; Yoneyama, N.; Tanaka, T.; Samejima, R.; Sato, H. Numerical Analysis of Salt Water Behavior Caused by River-Runup of Tsunami in the Upstream Part of the Yodo River Weir. JNDS 2009, 28, 125–135. [Google Scholar]
- Takubo, R.; Yoneyama, N.; Ito, L.; Tokai, A. 2DH-3D hybrid numerical analysis of the chemical substance transport in Yodo River during huge tsunami attack. JNDS 2021. under review. [Google Scholar]
- Iwasaki, T.; Tokida, K.; Tatsuoka, F. Soil Liquefaction Potential Evaluation with Use of the Simplified Procedure. In Proceedings of the International Conferences on Recent Advances in Geotechnical Earthquake Engineering and Soil Dynamics, St. Louis, MO, USA, 26 April–3 May 1981; Volume session02/12. [Google Scholar]
- Osaka Prefectural Government. Thiiki Bousai Keikaku Higai Soutei, Nankai Trafu Jishin Taisaku, Shindo Bumpu Ekijouka Kanousei (Regional Disaster Prevention Plan and Damage Estimation, Nankai trough Earthquake Countermeasures, Seismic Intensity Distribution, Liquefaction Potential). Available online: http://www.pref.osaka.lg.jp/kikikanri/keikaku_higaisoutei/sindobunpu_etc.html (accessed on 29 January 2021).
- Ishikawa, Y.; Tokai, A. Development of Watershed Model for Chemical Risk Assessment in Aquatic System. JSWE 2006, 29, 797–807. [Google Scholar] [CrossRef] [Green Version]
- The Ministry of Environment. PRTR Information Hiroba, Heisei 19nenndo Todokedegai Haishutsuryou Suikei Houhou No Shousai, 1. Taishou Gyoushu Wo Itonamu Susokiri Ika Jigyousho Karano Haishutsuryou (PRTR Information Square, Details of the Method for Estimating Non-Notified Emissions in 2007, 1. Emissions from Facilities with Less than a Small Footprint that Operate in the Target Industry). Available online: https://www.env.go.jp/chemi/prtr/result/todokedegaiH19/syosai.html (accessed on 29 January 2021).
- The Ministry of Economy, Trade and Industry; The Ministry of Environment. PRTR Haishutsuryou Sanshutsu Manyuaru Dai 4.2han Heisei 31nen 3gatsu Sakusei Dai 1bu Kihonhen 2. Kihonteki Na PRTR No Jisshi Tejun (2) Haishutsuryou Idouryou No Kihonteki Na Sanshutsu Tejun (Manual for Calculating PRTR Emissions, etc., Version 4.2 Prepared in March, 1991 Part I. Basic Part 2: Basic PRTR Implementation Procedures (2) Basic Procedures for Calculating Emissions and Transfers). Available online: https://www.env.go.jp/chemi/prtr/notification/sansyutsu/1_2_2.pdf (accessed on 29 January 2021).
- The Ministry of Economy, Trade and Industry. PRTR Kensakun Heisei 30nendo (PRTR Kensakun 2018). Available online: https://www.meti.go.jp/policy/chemical_management/law/prtr/6a.html (accessed on 29 January 2021).
- Osaka Prefecture. Kagaku Busshitsu Haishutsu Haaku Kanri Sokushin Hou Oyobi Oosakafu Seikatsu Kankyou No Hozen Ni Kansuru Jourei Ni Motozuki Oosakafunai No Jigyousho Kara Todokedasareta Dai 1shu Shitei Kagaku Busshitsu No Haishutsuryou Idouryou Oyobi Toriatsukairyou No De-ta Heisei 22nendo Kara Heisei 28nendo (Data on Release, Transfer, and Handling Amounts of Class I Designated Chemical Substances Reported by Business Establishments in Osaka Prefecture in Accordance with the Law Concerning Reporting, etc. of Releases to the Environment of Specific Chemical Substances and Promoting Improvements in Their Management and Osaka Prefectural Ordinance on Preservation of Living Environment 2010–2016). Available online: http://www.pref.osaka.lg.jp/kankyohozen/shidou/kanri.html (accessed on 20 February 2021).
- Fujiki, O.; Nakayama, Y.; Nakai, H. Impact Assessment of River Water Contaminations Caused by Earthquakes. EICA 2009, 14, 28–36. [Google Scholar]
- e-Stat, Portal Site of Official Statistics. Keizai Sensasu Kiso Chousa; Zen Sangyou Jigyoushosuu Oyobi Zen Sangyou Juugyoushasuu (Basic Survey of Economic Census; Number of Facilities and Number of Employees in All Industries). Available online: https://www.e-stat.go.jp/gis/statmap-search?page=1&type=1&toukeiCode=00200552&toukeiYear=2014&aggregateUnit=S&serveyId=S002005112014&statsId=T000841 (accessed on 29 January 2021).
- Chemicals Evaluation and Research Institute. Research materials (Unpublished). Ministry of the Environment (2003b) Acute Swimming Inhibition Test of Hexamethylenetetramine against Daphnia Magna (Mitsubishi Chemical Safety Science Institute); Test Number: A020367-2. 30 May 2003. Available online: https://www.nedo.go.jp/qinf/contact.html (accessed on 20 February 2021).
- Masuzaki, D.; Tanaka, K.; Hirabayashi, T. Hekisamechirentetoramin No Sokutei Houhou Oyobi Koudo Jousui Shori Ni Okeru Shorisei (Measurement method of hexamethylenetetramine and its treatability in advanced water purification treatment). Oosakashi Suidoukyoku Suishitsu Shikenjo Chousa Kenkyuu Narabini Shiken Seiseki (Research and test results of the Water Quality Testing Laboratory, Osaka City Waterworks Bureau) 2013, 64, 33–39. [Google Scholar]
- Tsuruta, T.; Tanaka, K.; Hirabayashi, T. Horumuarudehido Zenkubusshitsu No Bunsekihou Oyobi Ozon Shorisei (Analytical Method for Formaldehyde Precursors and Ozone Treatability). Oosakashi Suidoukyoku Suishitsu Shikenjo Chousa Kenkyuu Narabini Shiken Seiseki (Research and test results of the Water Quality Testing Laboratory, Osaka City Waterworks Bureau) 2014, 65, 19–31. [Google Scholar]
- Tsuruta, T.; Morizane, K.; Hirabayashi, T. Horumuarudehido Zenkubusshitsu No Jousui Shorisei (Water Purification of Formaldehyde Precursors). Oosakashi Suidoukyoku Suishitsu Shikenjo Chousa Kenkyuu Narabini Shiken Seiseki (Research and test results of the Water Quality Testing Laboratory, Osaka City Waterworks Bureau) 2015, 66, 19–23. [Google Scholar]
- Tsuruta, T.; Kitamoto, Y.; Morizane, K.; Hirabayashi, T. Jousuishori Taiou Konnan Busshitsu (Horumuarudehido Zenku Busshitsu) No Bunsekihou No Kakuritsu To Shorisei (Establishment of analytical methods and treatability of substances (formaldehyde precursors) that are difficult to treat with water purification). JWWA 2017, 86, 2–13. [Google Scholar]
- Ministry of Health, Labour and Welfare. Suishitsu Kijun Koumoku To Kijunchi (51koumoku) (Water Quality Standard Substances and Standard Values (51 Substances). Available online: https://www.mhlw.go.jp/stf/seisakunitsuite/bunya/topics/bukyoku/kenkou/suido/kijun/kijunchi.html (accessed on 29 January 2021).
- Health Science Council, Living Environment Water Supply Committee, Water Quality Management Expert Committee. Suishitsu Kijun No Minaoshi Niokeru Kentou Gaiyou Horumuarudehido (Summary of Studies in the Review of Water Quality Standards Formaldehyde). Available online: https://www.mhlw.go.jp/topics/bukyoku/kenkou/suido/kijun/dl/k30.pdf (accessed on 29 January 2021).
- Til, H.P.; Woutersen, R.A.; Feron, V.J.; Hollanders, V.H.M.; Falke, H.E.; Clary, J.J. Two-year drinking-water study of formaldehyde in rats. Food Chem. Toxicol. 1989, 27, 77–87. [Google Scholar] [CrossRef]
- National Institute of Technology Evaluation. Kagaku Busshitsu No Risuku Hyouka Shuhou No Kaihatsu Purojekuto/Heisei 16nendo Kenkyuu Houkokusho (Project for Risk Assessment of Chemical Substances and Development of Risk Assessment Methods/2004 Research Report (Commissioned Projects of New Energy and Industrial Technology Development Organization)). Available online: https://www.nedo.go.jp/activities/ZZ_00096.html (accessed on 20 February 2021).
- Study Group on Giant Earthquake Model of Nankai Trough. Nankai Torafu No Kyodai Jishi Moderu Kentoukai (Dai 2ji Houkoku) Tsunami Dansou Moderu Hen (Study Group on Giant Earthquake Model of Nankai Trough (Second Report) Tsunami Fault Model Edition). Available online: http://www.bousai.go.jp/jishin/chubu_kinki/syousai/bunpu-chukin.html (accessed on 29 January 2021).
- Osaka City. Kougyouyou Suidou Jigyou Nitsuite (Industrial Water Supply Business). Available online: https://www.city.osaka.lg.jp/suido/page/0000015747.html#5 (accessed on 29 January 2021).
- NEDO (New Energy and Industrial Technology Development Organization). Initial Risk Assessment Report for Chemical Substances 1,3,5,7-Tetraazatricyclo[3.3.1.13.7]Decane. Available online: https://www.nite.go.jp/chem/chrip/chrip_search/dt/pdf/CI_02_001/risk/pdf_hyoukasyo/198riskdoc.pdf (accessed on 29 January 2021).


| Releases (notified facilities in Osaka Prefecture) (kg/year) [21] | 5 |
| Transfers (notified facilities in Osaka Prefecture) (kg/year) [21] | 4.8 × 10³ |
| Handling amount (notified facilities in Osaka Prefecture) (kg/year) [21] | 2.3 × 10⁵ |
| Releases (non-notified facilities in Osaka Prefecture) (kg/year) [10] | 95 |
| Number of employees in all industries [24] | 9.2 × 10⁶ |
| Analysis Area | Computational Grid Size | Coordinate of the South–West End | Range | |
|---|---|---|---|---|
| East–West | South–North | |||
| Horizontal 2D | 810 | (−716,000, −720,000) | 1,215,000 | 801,900 |
| 270 | (−173,300,−298,800) | 186,300 | 178,200 | |
| 90 | (−108,500, −196,200) | 81,000 | 72,900 | |
| 30 | (−61,700, −161,100) | 32,400 | 34,200 | |
| 10 | (−58,100, −150,150) | 26,300 | 21,150 | |
| 3D | 10/5 | (−45,500,−142,180) | 2950 | 2100 |
| Mesh Number | Number of Employees [24] | Non-Notified Storage Amount (kg) | |
|---|---|---|---|
| 1 | 3.9 × 10⁴ | 1.8 × 10⁴ | 26.9 |
| 2 | 1.2 × 10⁴ | 5.6 × 10³ | 25.9 |
| 3 | 3.9 × 10⁴ | 1.8 × 10⁴ | 25.9 |
| 4 | 1.4 × 10⁴ | 6.7 × 10³ | 23.3 |
| Case | Outflow | Discharge Point * | Distance from Discharge Point to Water Intakes [m] |
|---|---|---|---|
| 1 | The total storage amount of a 2 km × 2 km mesh with both high storage amount and liquefaction risk along the Yodo River | Right bank downstream of the Great Yodo River Weir | 300 (industrial) 1000 (domestic) |
| 2 | Water surface just above the domestic water intake | 750 (industrial) 0 (domestic) |
Publisher’s Note: MDPI stays neutral with regard to jurisdictional claims in published maps and institutional affiliations. |
© 2021 by the authors. Licensee MDPI, Basel, Switzerland. This article is an open access article distributed under the terms and conditions of the Creative Commons Attribution (CC BY) license (http://creativecommons.org/licenses/by/4.0/).
Share and Cite
Hamamoto, S.; Ito, L.; Yoneyama, N.; Tokai, A. Case Study for the Predictive Environmental Risk Assessment of Hexamethylenetetramine Release to the Yodo River during a Massive Tsunami Attack. Water 2021, 13, 549. https://doi.org/10.3390/w13040549
Hamamoto S, Ito L, Yoneyama N, Tokai A. Case Study for the Predictive Environmental Risk Assessment of Hexamethylenetetramine Release to the Yodo River during a Massive Tsunami Attack. Water. 2021; 13(4):549. https://doi.org/10.3390/w13040549
Chicago/Turabian StyleHamamoto, Shogo, Lisa Ito, Nozomu Yoneyama, and Akihiro Tokai. 2021. "Case Study for the Predictive Environmental Risk Assessment of Hexamethylenetetramine Release to the Yodo River during a Massive Tsunami Attack" Water 13, no. 4: 549. https://doi.org/10.3390/w13040549