Article

Stepwise Identification of Influencing Factors and Prediction of Typhoon Precipitation in Anhui Province Based on the Back Propagation Neural Network Model

1
School of Civil Engineering, Hefei University of Technology, Hefei 230009, China
2
Institute of Water Resources and Environment Systems Engineering, Hefei University of Technology, Hefei 230009, China
*
Author to whom correspondence should be addressed.
Water 2021, 13(4), 550; https://doi.org/10.3390/w13040550
Submission received: 21 December 2020 / Revised: 14 February 2021 / Accepted: 18 February 2021 / Published: 21 February 2021
(This article belongs to the Special Issue Hydrological Modeling in Water Cycle Processes)

Abstract

:
Typhoon is one of the most frequent meteorological phenomena that covers most of central-eastern China during the summer. Typhoon-induced precipitation is one of the most important water resources, but it often leads to severe flood disasters. Accurate typhoon precipitation prediction is crucial for mitigating typhoon disasters and managing water resources. Anhui Province, located in East China, is a typhoon affected region. Typhoon-related disasters are its major natural disasters. This study aims at developing a new back propagation (BP) neural network model to predict both the typhoon precipitation event and the typhoon precipitation amount. The predictors in the model are identified through correlation analysis of the above two target variables and a large set of candidate variables. We further improve the predictor selection through an iterative approach, which proposes new predictors for the BP model in each iteration by analyzing the differences of candidate predictors between the years with large prediction errors and the normal years. The results show that the accuracy of the BP-based summer typhoon event prediction model in the simulation period from 1957 to 2006 is 100%, and its accuracy in the validation period from 2007 to 2016 is 90%. In addition, the absolute value of the mean relative error predicted by the typhoon precipitation amount model for the simulation period is 20.9%. A significant error can be found in 2000 as the mechanism of typhoon precipitation in this year is different from that of other normal years. The error in 2000 is probably caused by the impact of vertical shear anomalies over the western Pacific which hinders the development of typhoon embryos. Additionally, the absolute value of the mean relative error predicted by the typhoon precipitation amount model in the validation period is 14.2%. A significant error also can be found in 2009, probably due to the influence of the asymmetry in the typhoon cloud system.

1. Introduction

China is one of the countries that are most affected by typhoons and typhoon-induced precipitation. On average, 7–8 typhoons land in China each year [1,2,3]. Precipitation during typhoons is one of the most important water resources that can be stored in the reservoir or alleviating regional drought. However, heavy typhoon precipitation often leads to serious flood disasters and lives and property losses. Therefore, typhoon precipitation prediction has become an important key for predicting typhoon disasters and managing water resources.
Many researchers have analyzed the spatial-temporal characteristics of typhoon precipitation. Wang et al. [3] analyzed spatial-temporal characteristics of typhoon precipitation over China during 1957–2004. They found that typhoon precipitation covers most of central-eastern China and gradually decreases from the southeastern coastal regions to the northwestern mainland; the maximum amount of typhoons precipitation appears in August, and the annual typhoon precipitation exists a decreasing trend in most of the stations over China. The results are in good agreement with the findings of Fang et al. [4], who analyzed the typhoon precipitation over China during 1961–2010 and found the decreasing typhoon precipitation in China is mainly due to the reduction of typhoon frequency. The results are also in good accordance with the findings of Chang et al. [5] based on the analysis of typhoon precipitation trends in East Asian summer monsoon during 1958–2010. Xiang et al. [6] also indicated a decreasing trend in the typhoon frequency in most areas of the South China Sea. Jiang et al. [7] identified extreme typhoon precipitation in China during 1959–2012 and found that the threshold of extreme typhoon precipitation was higher in Southeast China than in Northwest China. They also found that extreme precipitating typhoons occurred more frequently in the 1960s–1970s and after 2000, with the highest frequency during the flooding season from May to October. Consequently, the prediction of typhoon activity is the focus of the hydrometeorological department during the flood season.
Event-based typhoon precipitation prediction has been widely studied, and the identification of prediction factors has been identified as the most important step. The prediction methods can be divided into two categories: numerical simulations method and statistical method. Niu et al. [8] investigated the main influencing factors of typhoon precipitation in China during 1952–2000 by statistical analysis and numerical simulations method. Their results showed that the typhoon intensity, topography, activity of cold air, humidity field in the effecting area, and moisture are the main factors affecting the precipitation amount of a typhoon event. Wu et al. [9] predicted typhoon precipitation using a genetic algorithm (GA) integrated ensemble weather forecasting model. In their model, GA determined the weights of ensemble typhoon precipitation forecasts. Kong et al. [10] used statistical methods to analyze the correlation of heavy precipitation with multiple climatic factors in China from 1961 to 2015. They found Antarctic oscillation (AAO) and Pacific warm pool indices affected heavy precipitation in China globally, while the impacts of other climate indices are regional. Wang [11] established a typhoon precipitation forecasting model using the back propagation (BP) neural network method. In the prediction model, the rain gauge longitude, rain gauge latitude, rain gauge altitude, wind speed, and wind direction were selected to predict the site-specific typhoon precipitation in the next 24 h; the longitude, latitude, typhoon central pressure, maximum wind speed, and the lag-one day precipitation were selected to predict the area-average typhoon precipitation in the next 24 h. Wei [12] used data mining techniques to develop a typhoon precipitation prediction model. In the model, two climate scenarios were designed, one including the ENSO indices (Southern Oscillation index and the Nino 3.4 sea surface temperature anomaly) and the other without ENSO indices. The simulation results showed that the model accounting for ENSO effects could efficiently forecast total typhoon precipitation. Wei et al. [13] used big-data technology to develop a typhoon precipitation prediction system, in which deep neural networks and multiple linear regressions were used to establish typhoon precipitation prediction models.
However, little research has been done to predict typhoon precipitation over a specified area in a given time according to the relations of precipitation and its influencing factors. Hai et al. [14] explored the climatological characteristics of spring atmospheric circulation associated with typhoon precipitation in the Northwest Pacific. Moreover, an artificial neural network model for predicting typhoon generation frequencies in the Northwest Pacific was established. Xia et al. [15] identified strong correlations between summer typhoon precipitation with lagged atmospheric circulation and sea surface temperature (SST) anomalies. They established a multiple regression prediction model to predict typhoon frequency in the Northwest Pacific based on the above relationships. Based on the fact that dominant meteorological processes in Anhui Province alternate frequently in mid-July, Li et al. [16] divided the summer typhoon precipitation period into the plum rains period and drought period. They built a BP neural network to predict typhoon precipitation events in Anhui Province and used lagged atmospheric circulation indices as predictors. Similarly, in predicting typhoon frequencies in Chinese coastal provinces, most researches are devoted to discussing the relationship of the lagged sea surface temperature, 500 hPa height field, westerly trough, subtropical high, and other meteorological factors that are physically related to the typhoon events. Correspondingly, various models were proposed, including phase space similarity [17], projection pursuit regression [18], fuzzy neural network [19], binomial regression [20].
However, such methods mostly focused on typhoon precipitation events. Few studies have investigated the relationships between atmospheric circulations and the typhoon precipitation amount, especially the prediction of typhoon precipitation amount. Therefore, it is necessary to extend previous studies with long-term data to reexamine the relationship between typhoon precipitation amount and meteorological influencing factors. It is widely adopted that typhoon precipitation is the result of the interaction between large-scale circulation and the meso-microscale system. Further, typhoon precipitation is a product of the combination of the local flow field and thermodynamic field with topography and geomorphology [21]. Therefore, many factors affect the occurrence of a typhoon and its precipitation, and their relationships are complicated. The BP neural network has a good non-linear mapping ability, and it is an ideal model to predict typhoon-induced precipitation based on a series of influencing factors.
Anhui Province is located in East China and is heavily affected by typhoons. It is in the transitional region of the warm temperature zone and north China. This study identifies the summer typhoon precipitation and its characteristics in Anhui Province from 1957 to 2016 based on a recursive approach (The summer refers to June, July, and August). We first identify the influencing factors of typhoon precipitation events using correlation analysis, and develop a BP neural network model to predict the typhoon precipitation events. We further predict the summer typhoon precipitation amount in typhoon affecting years using another BP neural network model with the preliminary identified influencing factors and then analyze the errors in the BP model predictions. Based on the error analysis, we update our estimate of influencing factors, re-run the BP neural network based on the updated predictors, and repeat this process until the prediction results meet pre-determined requirements.
The remainder of this paper is structured as follows. Section 2 describes our collected data, introduces the summer typhoon precipitation events prediction model, and introduces the typhoon precipitation amount prediction model. Section 3 introduces the geographical situation of Anhui Province, analyses the characteristics of summer typhoon precipitation over Anhui, and constructs the typhoon precipitation events and typhoon precipitation amount prediction models. Section 4 presents our results in typhoon precipitation prediction and discusses the advantages and limitations of our proposed model. Finally, Section 5 makes final remarks about our main conclusions and future research needs.

2. Research Methods and Data Source
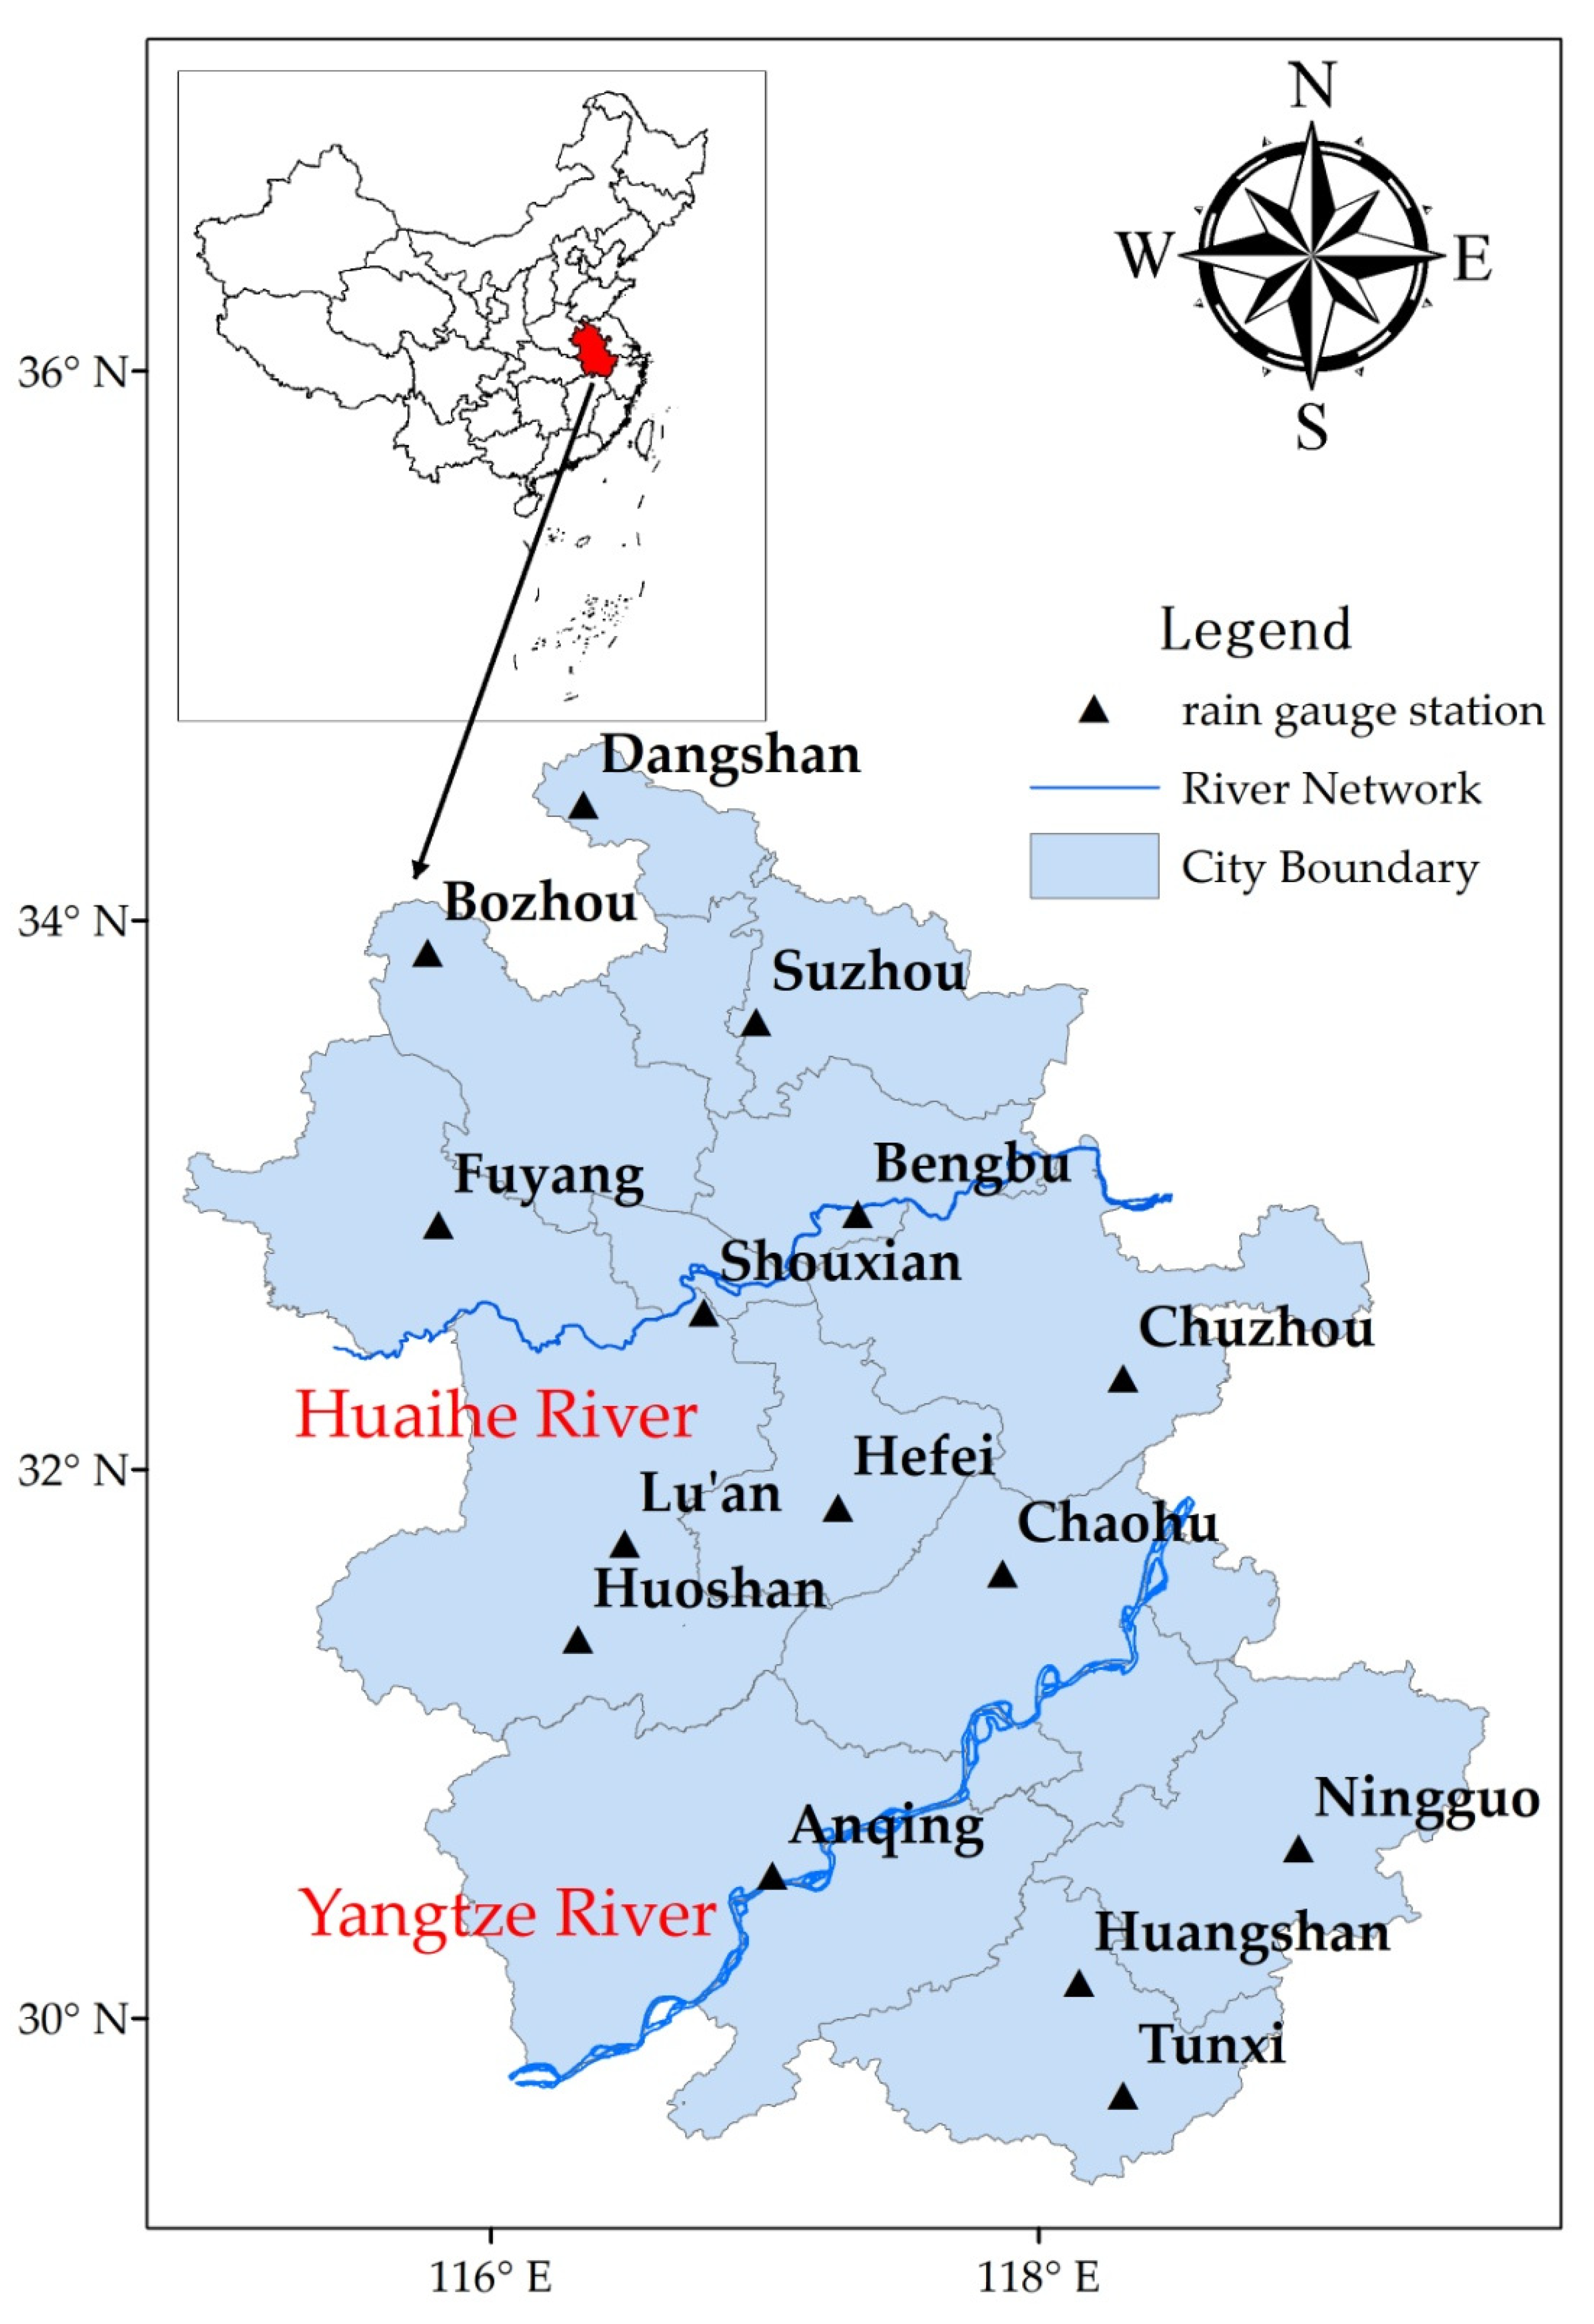
2.1. Data Source

The data employed in this study include: (1) The daily precipitation from 1957 to 2016 at 15 rain gauge stations in Anhui Province provided by China Meteorological Data Service Center (data.cma.cn, accessed on 9 March 2019); (2) The monthly average SST data and the Oceanic Nino index (ONI) from 1956 to 2016. For more information about the SST and ONI, please see the open-access article [22]; (4) The typhoon data provided by the Tropical Cyclone Data Center of China Meteorological Administration (tcdata.typhoon.org.cn, accessed on 15 May 2019); (5) The 74 atmospheric circulation indices (see Appendix A) from 1956 to 2016 provided by China National Climate Center (ncc-cma.net, accessed on 15 May 2019).
In order to keep as many stations as possible and ensure continuous observation, the relevant daily precipitation data has been preprocessed. If the observing station misses more than 5% in one year, the year will be eliminated. We use adjacent sites to replace the missing data in a site. If data from several adjacent sites are missing, we use the mean value of the consecutive years before and after the missing period to fill the daily precipitation data.

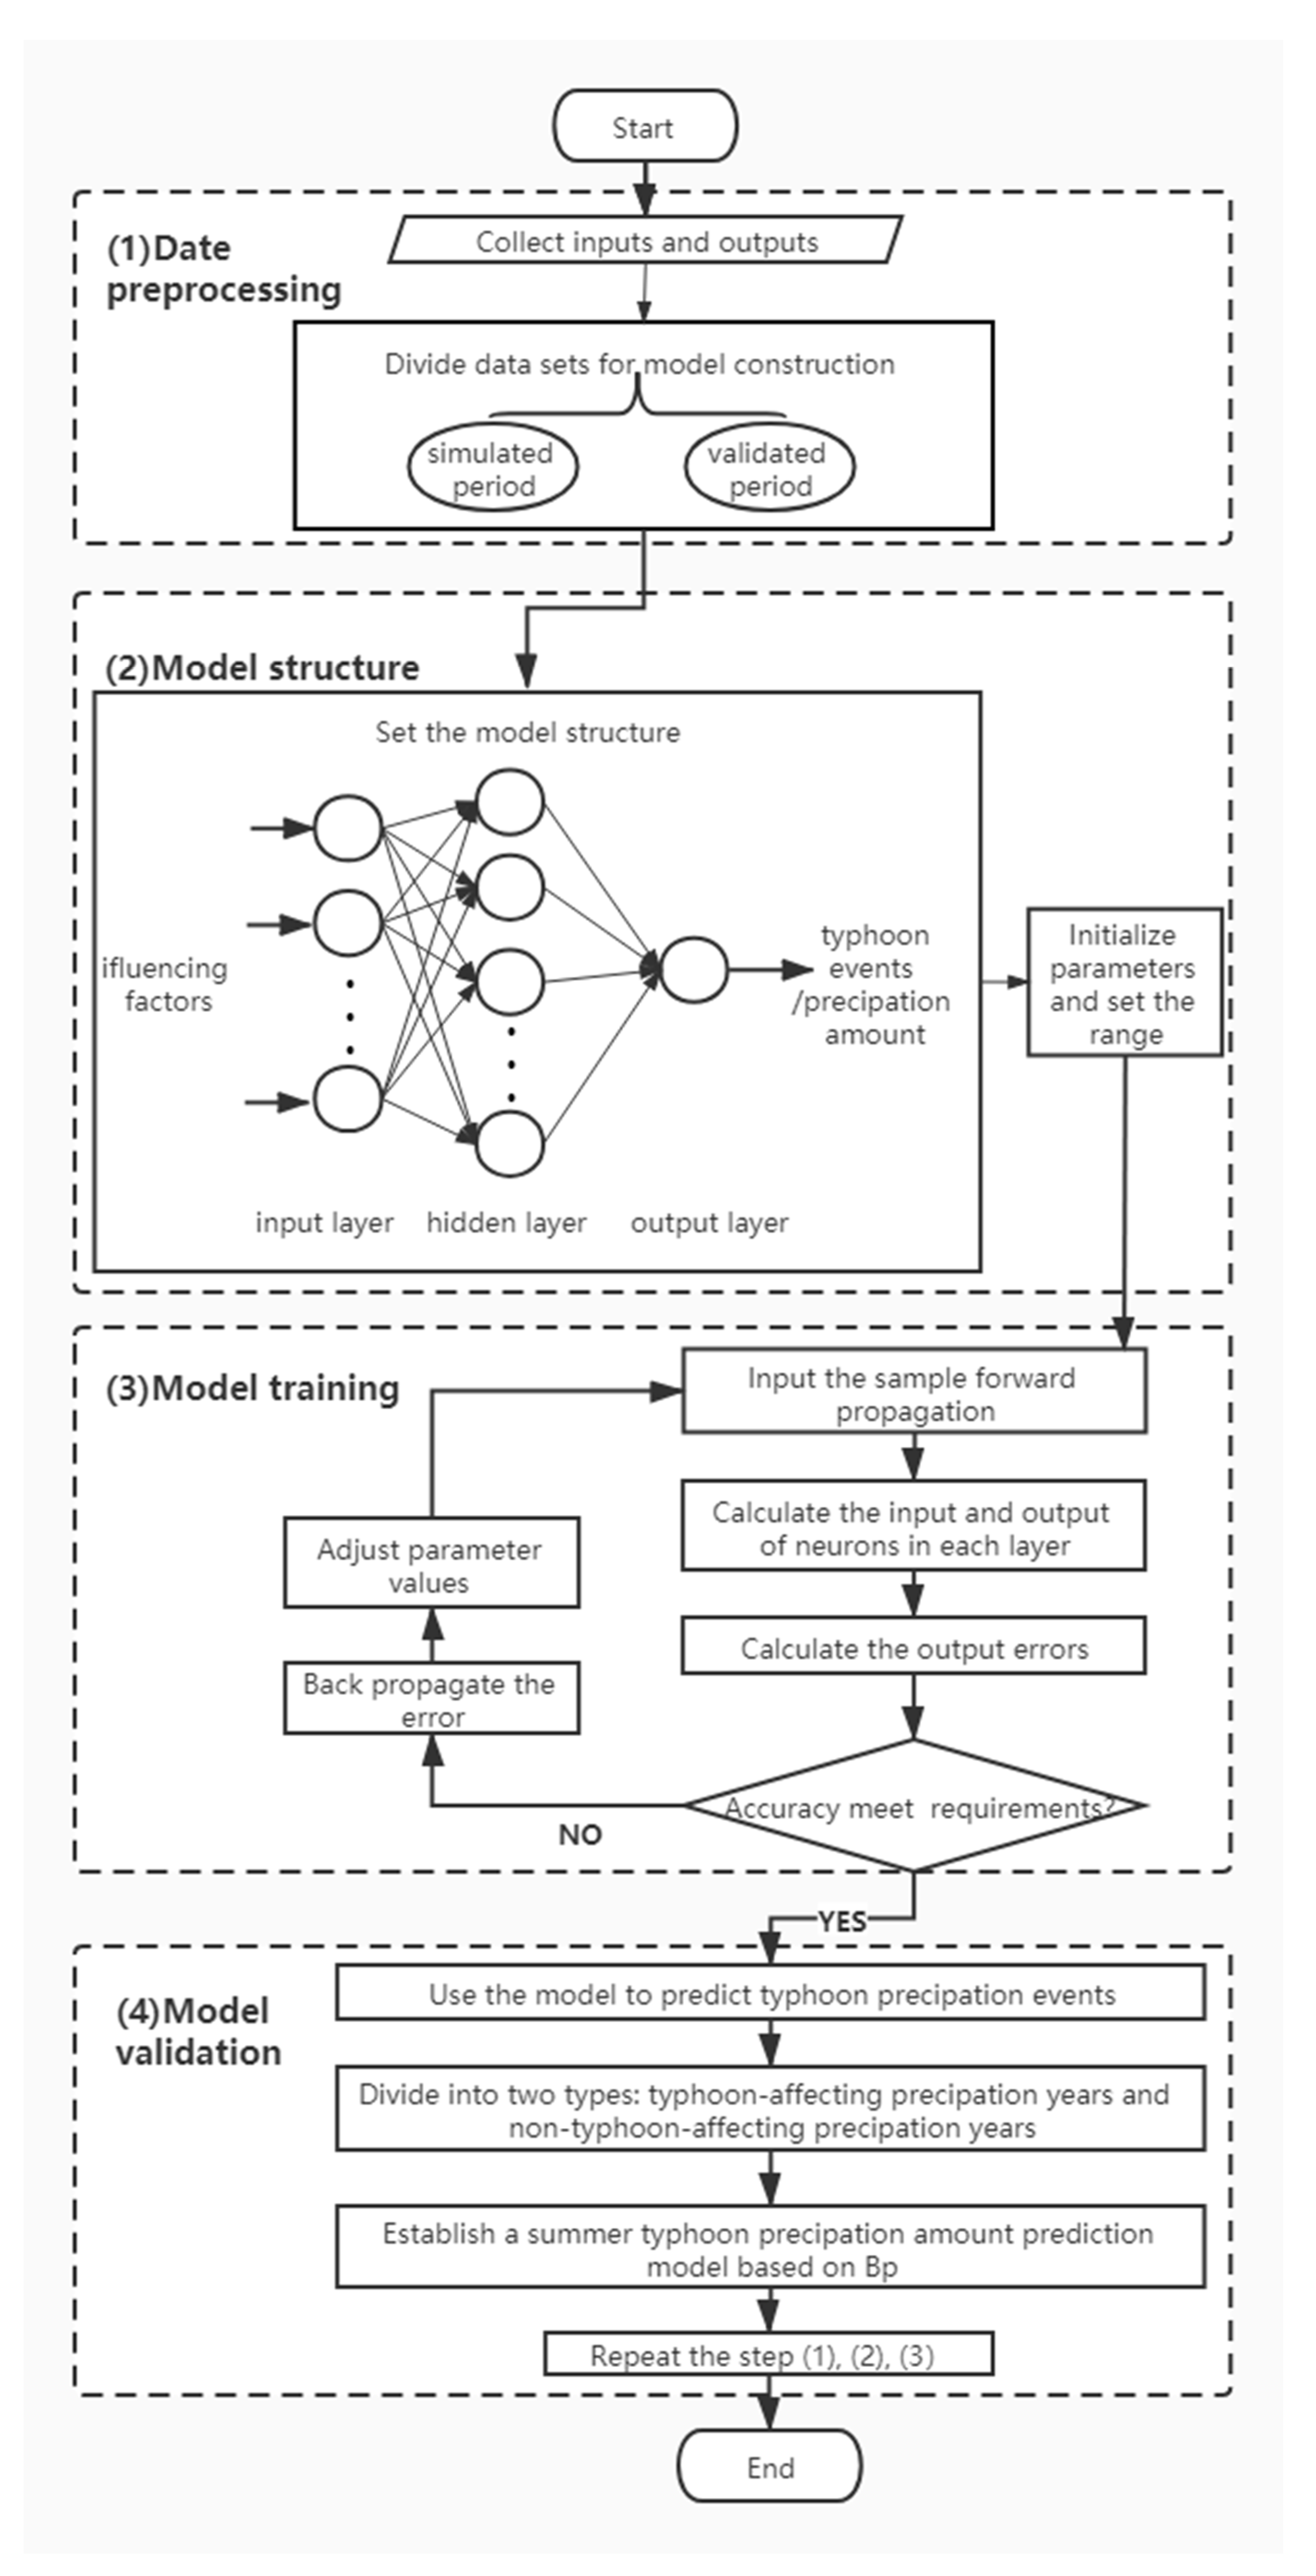
2.2. Research Methods

The concept of artificial neuron networks was first proposed in the 1940s. In the late 1980s, after the introduction of back-propagation, the application of BP neural network has been developed [23]. The BP neural network model iteratively back propagates the model errors to update the model parameters. One advantage of the BP neural network is its universal approximator capability in learning continuous functions with any desired degree of accuracy. BP neural network also has the characteristics of clear concept and strong nonlinear mapping ability [24,25]. It has become the preferred prediction method in hydrology and hydrometeorology. Here, the lagged influencing factors affecting summer typhoon precipitation events (and amount) in Anhui Province are used as inputs for the BP neural network model. Typhoon precipitation events (and amount) are used as outputs to establish an Anhui summer typhoon precipitation events (and amount) prediction model. Figure 1 illustrates the flowchart of the proposed method, and each step is described as follows. It mainly includes 4 steps:
Step 1: Data Preprocessing. The collected data contain typhoon characteristics, daily precipitation data, and atmospheric circulation indices (Section 2.1). The training set is used to build model structures and adjust the parameters of the constructed models. The validation set is used to validate an optimal parameter set, evaluate the performance of the constructed models, and confirm their generalizability. We set the typhoon affecting precipitation year from 1957 to 2006 as the simulation period, and the typhoon affecting precipitation year from 2007 to 2016 as the validation period.
We identify the BP neural network predictors from 74 circulation indices and Nino3.4 regional sea temperature. More specifically, we calculate the correlation coefficients between the summer typhoon precipitation events and the cumulative values for various month duration of the circulation indices from October of the previous year to May of the current year. The indices with a confidence level higher than 99% in the correlation analysis is used as the influencing factors. To speed up training and enhance model generosity, the sample indices x * i , j are usually treated as follows [26]:
x ( i , j ) = x * ( i , j ) x * min ( j ) x * max ( j ) x * min ( j ) ( i = 1 , 2 , , N ;   j = 1 , 2 ,   , M )
where N, M are the number of sample capacity and the sample indices, respectively. In addition, x * min , j and x * max , j are the minimum and maximum value of the jth input index, respectively.
Step 2: Model Structure and Parameter Setting. The architecture (the number of inputs, the number of hidden layer neurons, and the number of outputs) of the BP summer typhoon precipitation events prediction model is determined through a trial-and-error approach. Following the sample trial-and-error approach, ranges of three critical parameters (the learning rate, momentum, and the number of hidden layer neurons) in the BP neural network are set. Finally, we set a number of increments between maximal and minimal parameter values for the following analysis.
Step 3: Model Training. This step uses the error back-propagation technique to train the BP neural network model. More specifically, the neural network model first goes through a forward propagation step to calculate its output values, and the model errors are back-propagated through the neural network model to update model parameters. Such an iterative process continues until the model global error E is less than a pre-specified value or the learning iteration exceeds a given limit. A decision condition identifies whether the model global error E meets the requirement. If “yes”, the BP neural network model will be used to predict the typhoon precipitation events; if “no”, the model parameters will be further adjusted with the error back-propagation. The above steps are the calculating process of a standard neural network; please refer to [27] for details.
Step 4: Model validation. The prediction results of summer typhoon precipitation events are evaluated according to the performance measures. We then divide the samples into two types: the typhoon affecting precipitation years and non-typhoon affecting precipitation years. Based on the above steps, we establish a BP summer typhoon precipitation amount prediction model.
Then, the summer typhoon precipitation amount in typhoon affecting precipitation years is predicted with BP neural network model based on the previously identified factors. After that, we analyze the differences in primary influencing factors between the years with large prediction errors and the other years, and then update the identified influencing factors. We rerun the typhoon precipitation amount predicting BP neural network based on the updated influencing, and repeat the processes 1–3 until the prediction results meet the pre-specified requirements. By doing so, the influencing factors associated with typhoon precipitation amount are identified step by step. According to the different influencing factors, the models of typhoon precipitation amount are established, respectively.

3. Case Analysis

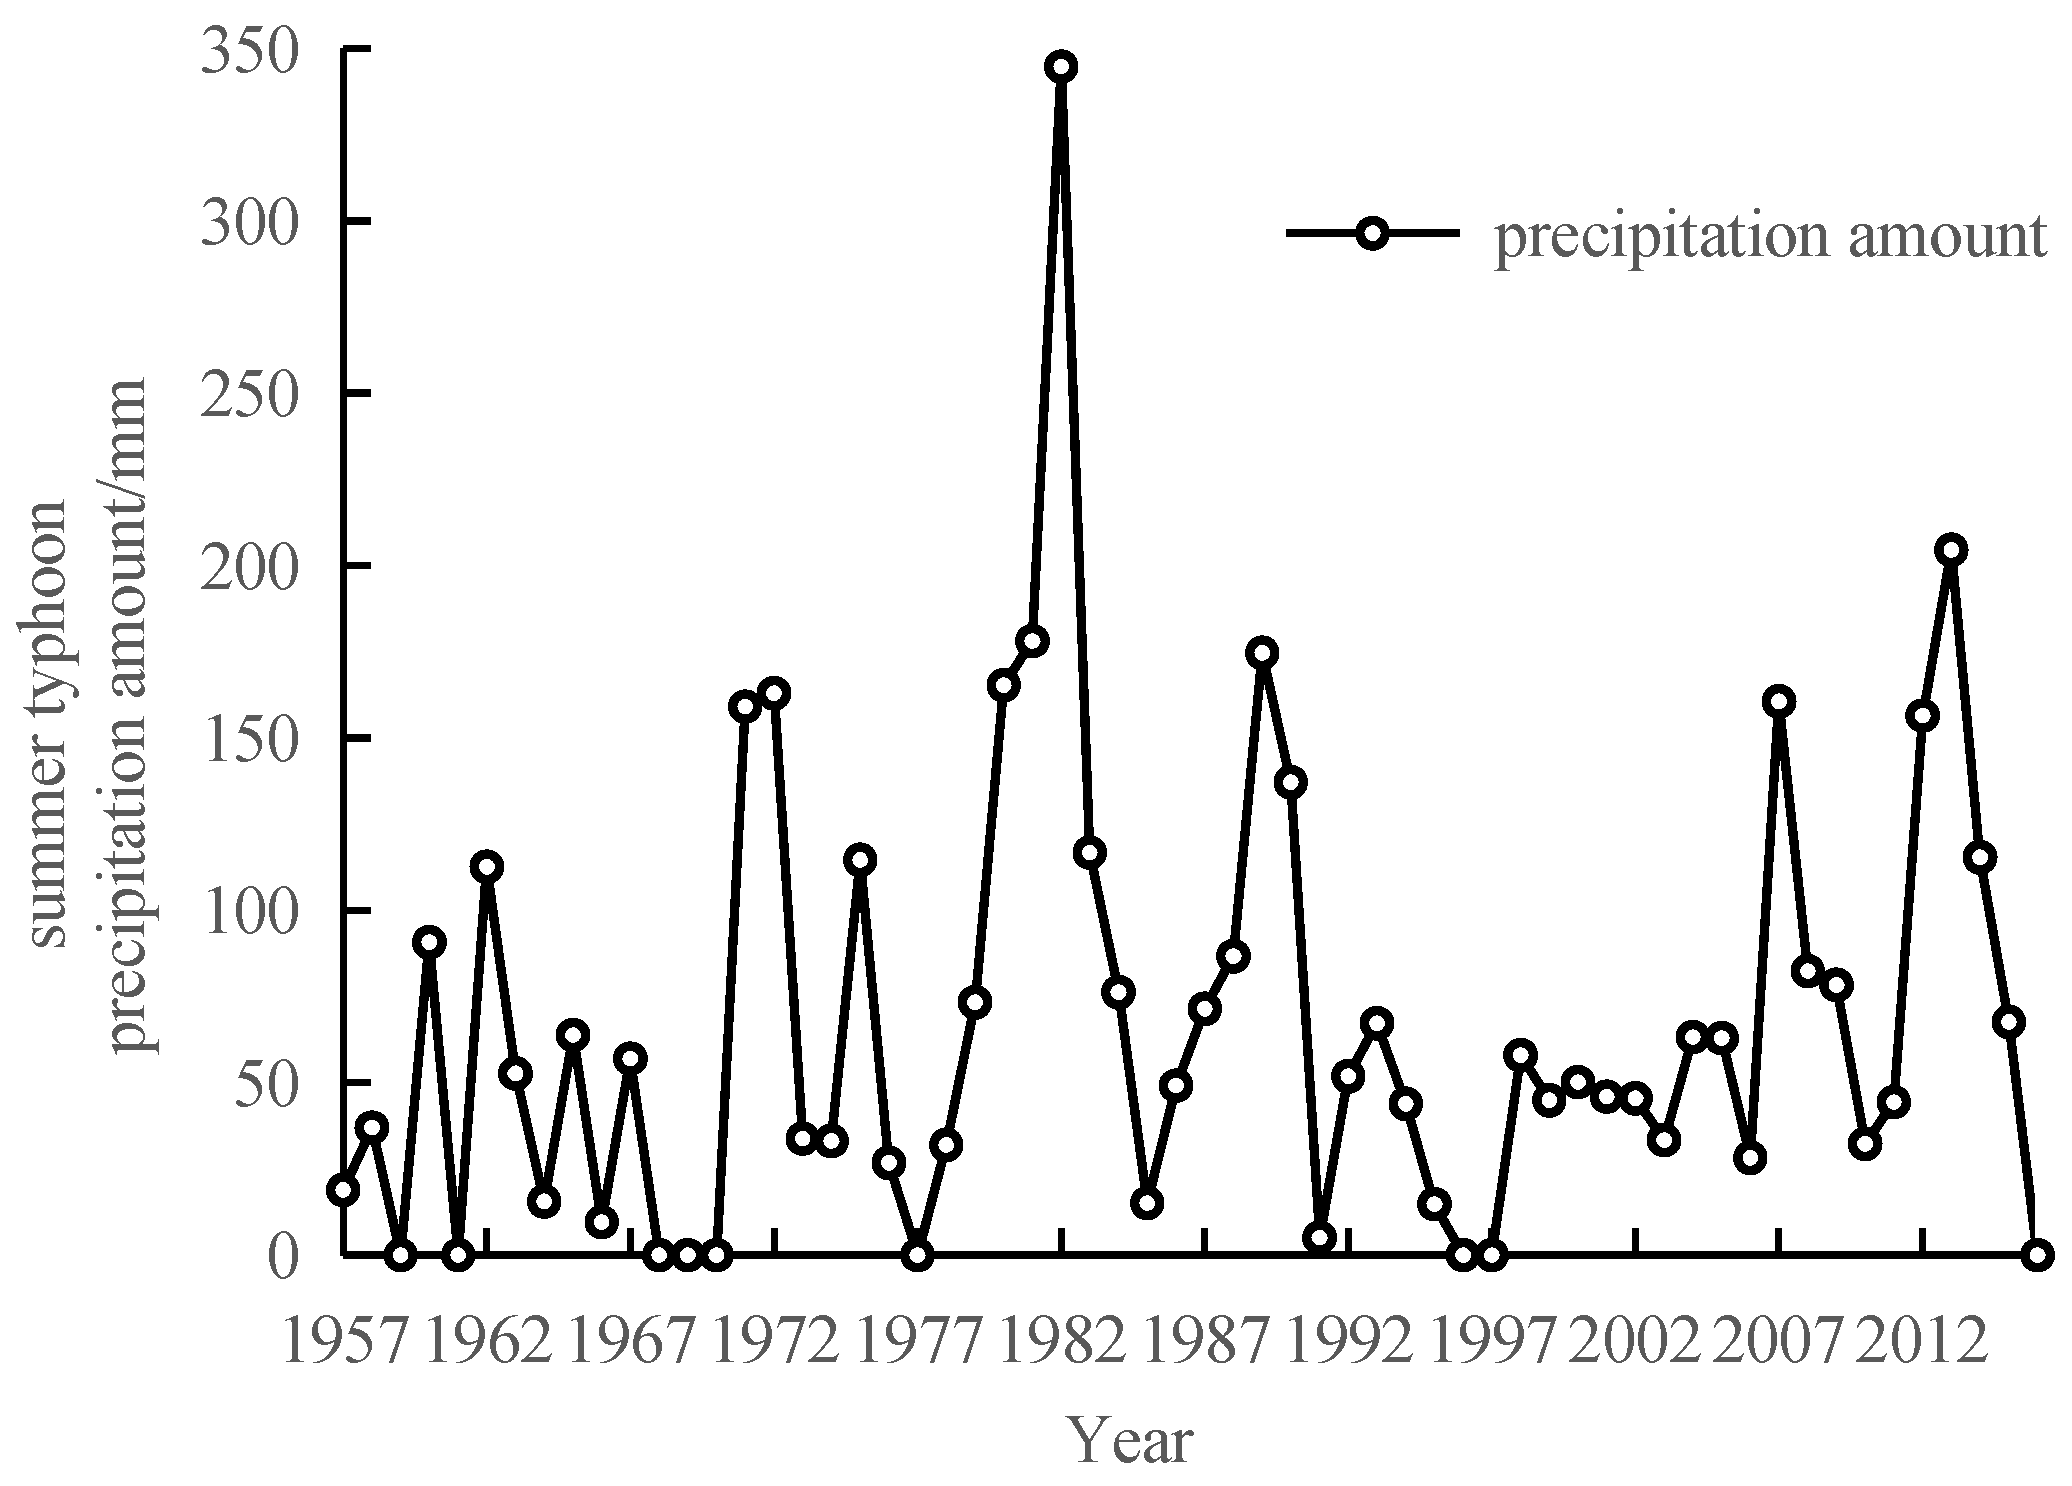
3.1. Analysis of the Characteristics of Summer Typhoon Precipitation in Anhui Province

Anhui Province is a provincial administrative region of China (from 114°54′ to 119°37′ E to 29°41′–34°38′ N), located in East China. It covers an area of 140,100 km2. China’s two major waterways, the Yangtze River and Huai River, flow through Anhui, as shown in Figure 2. Taking the dividing ridge of Yangtze River basin and Huai River basin as a dividing line, Anhui Province is divided into two parts. The north part is located at the southern edge of the North China Plain, and the south part is located at the Middle and Lower Yangtze Valley Plain. The study area contains 15 rain gauge stations, namely, Dangshan, Bozhou, Suzhou, Fuyang, Shouxian, Bengbu, Chuzhou, Lu’an, Huoshan, Hefei, Chaohu, Anqing, Ningguo, Tunxi, and Huangshan rain gauge station.
Landing typhoon affects the intensity and distribution of precipitation in the southeast coastal area of China, and it has usually caused extreme precipitation events in East China. The typhoon precipitation area can be roughly divided into two areas, namely, the typhoon circulation precipitation area and the typhoon long-distance precipitation area [28]. Therefore, the typhoon affecting precipitation is identified as the total precipitation of the continuous days with daily precipitation greater than 5 mm during the first seven days of typhoon landing. Meanwhile, within the seven day window, if the precipitation is lower than 5 mm for only one day, the typhoon affecting precipitation is still calculated as the total precipitation during the first seven days of typhoon landing [29]. We further define a typhoon precipitation event as the event with typhoon affecting precipitation larger than 25 mm. Any typhoon event with typhoon affecting precipitation lower than the threshold will be excluded in the following analysis. This is to constrain our analysis to the typhoon events that can generate surface runoffs (available water content of soil plough layer in the study area is about 20–40 mm [30]).
It can be seen from Figure 3 that the amount of summer typhoon precipitation in Anhui Province in the past 60 years was 0–344.8 mm. The summer typhoon precipitation in 1982 was the largest (344.8 mm), and that in 2013 was the second largest (204.6 mm). The average annual summer typhoon precipitation during 1957–2016 is 67.8 mm. It also can be seen from Figure 3 that there are 51 years in which landing typhoons affecting Anhui Province in summer during 1957–2016. The nine non-typhoon affecting precipitation years are 1959, 1961, 1968, 1969, 1970, 1977, 1996, 1997, and 2016. The average annual summer typhoon precipitation amount during the above 51 years is 79.7 mm.

3.2. Predicted Model of Typhoon Precipitation Events Based on BP

The BP neural network model performance depends on the choice of input factors [31]. We use 74 circulation indices from last October to current May as candidates for the influencing factors [32]. In addition, based on the finding that SST influences the precipitation prediction model of the typhoon landing in China [21,33], the Nino3.4 SST is selected as the 75th candidate factor for the BP neural network model.
For each of the 75 factors, we calculate their cumulative values for 1-month duration, (8 combinations), 2-month duration (7 combinations), 3-months duration (6 combinations), 4-month duration (5 combinations), 5-month duration (4 combinations), 6-month duration (3 combinations), 7-month duration (2 combinations), and 8-month duration (1 combination) from last October to current May to form the final candidate variables for BP neural network inputs. Altogether, the candidate input number is 2700 (75 × 36). For example, the accumulative value from Feb. to May is the sum of the values of four consecutive months, which are February, March, April, and May, respectively. Finally, the influencing factors were identified by using correlation analysis. The indices with a confidence level higher than 99% is used as the BP neural network input (Table 1).
Our identified influencing factors of typhoon precipitation events agree with the result of other researches [12,34], which suggested that the Hemispheric Polar Vortex index, Position of Asiatic Trough index, and Nino3.4 SST are suitable to predict typhoon prediction. In order to test model reliability, we take the year from 1957 to 2006 as the simulated period and the year from 2007 to 2016 as the validated period. Hence, a BP-based summer typhoon precipitation events prediction model is established. When determining BP neural network topology, the number of neurons nodes of input and output layer is the same as the number of the indices m. The number of neurons nodes of hidden layer Nh is determined by the experience of experts based on complexity of modeling and the size of training samples. It is suggested that the value of Nh can be available as follows [35]:
m N h 2 m + 1
The greater Nh is, the higher accuracy of the network. As a result, the generalization capacity of the network is lower, and the time of training is longer. The value of Nh shall be as small as possible under given accuracy of fitting. This means that the best smooth function is used to approach to the actual problems letting the error within the allowable range. In the summer typhoon precipitation events prediction model, the value of m is 8, which are the indices numbered from 1 to 8 in Table 1. Through trial-and-error, the optimal result of hidden layer neurons is eight. For the BP model output, we use “1” and “−1” to indicate the year with and without typhoon, respectively. The Step Sign Function is used to process the output value y of the output BP neural network. In the Step Sign Function, when y > 0, Y = sgn(y) = 1; when y ≤ 0, Y = sgn(y) = −1. The model predictions and actual values of typhoon precipitation events in the validation period are shown in Table 2.
In the 50 samples of the simulation period from 1957 to 2006, the BP model predicts typhoon precipitation events with an accuracy rate of 100%. According to Table 2, the accuracy in the validation period from 2007 to 2016 is 90%, with only one prediction error in 2012. To explain the occurrence of this prediction error, we analyze the differences in factors between typhoon “Haikui” in 2012 and other similar typhoons affecting Anhui Province [36]. Our results suggest that the typhoon “Haikui” landed at a time when the subtropical high over the Western Pacific strengthened westward. The monsoon swell was mixed with the typhoon circulation and continued to transport water vapor and energy to the “Haikui”. The confrontation between the subtropical high and the continental high ridge caused the typhoon “Haikui” to stagnate. The interactions of the above factors form an extreme precipitation area in Anhui Province. In short, the precipitation of typhoon “Haikui” was mainly affected by short-term weather changes, and its precipitation mechanism was different from that of other typhoons with similar influencing factors.

3.3. Predicted Model of Typhoon Precipitation Amount Based on BP

All typhoon affecting precipitation years from 1957 to 2006 are used as simulation samples, and all typhoon affecting precipitation years from 2007 to 2016 are used as validation samples. Following the same rule in Section 3.2, we use 74 circulation indices and the Nino3.4 SST as the candidate influencing factors, and generate 36 variables for each of the 74 indices as the candidate input for the BP model. The variation characteristics of sea temperature are usually described by the Nino index of the Central and Eastern Pacific. The Nino3.4 area index is selected as it covers more westward areas than other indices (e.g., the conventional SSTA index). The Nino3.4 area index also relates to an area where air–sea interaction is more active, which is of great significance to the development of monsoon. Here, we exclude the non-typhoon affecting precipitation year from the sample. Then the correlation coefficient between the amount and the primary influencing factor is calculated. Finally, the index is selected as the influencing factor of the summer typhoon precipitation amount model at a 95% confidence level, and the results are shown in Table 3 No. 1–8.
Our identified influencing factors of typhoon precipitation amount agree with the result of other researches [14,15], which suggested that the Polar Vortex index, Asian Zonal Circulation index, and Nino3.4 SST are suitable to predict typhoon precipitation. We further build a summer typhoon precipitation amount prediction model based on BP. The input factors of the model are the index numbered from 1 to 8 in Table 3. In the Model One, the value of m is 8, through trial-and-error, the optimal result of hidden layer neurons is 9. The training results are shown in Model One in Figure 4.
As is seen in Figure 4, Model One shows a good prediction performance on the typhoon precipitation amount. The absolute average error is 17.8 mm, and the absolute average relative error is 26.3%. Nevertheless, we noticed that among the five years (1960, 1972, 1980, 1981, and 1990) with the largest errors, four of them have typhoon precipitation amount greater than 130 mm. In comparison, the average summer typhoon precipitation in Anhui Province over the past 60 years is 67.8 mm. Our results show that the typhoon precipitation prediction model has large fitting errors for heavy annual typhoon precipitations. Therefore, by analyzing the correlation between the summer typhoon precipitation and its previous influencing factors, new influencing factors are identified to improve the prediction accuracy of the years with larger summer typhoon precipitation in Anhui Province [37]. Here, we select the year (1972, 1980, 1981, 1982, 1989, and 2013) with the top 10% of precipitation amount from the summer typhoon precipitation sequence in Anhui Province as the anomalous years. For these years, we calculate the average value of the previous 74 circulation indices. We then analyze the differences of 74 circulation indices between anomalous years and all typhoon affecting precipitation years (51 years in total) by using a t-test. The Subtropical High Strength in South China Sea index from March to May shows a statistically significant difference in the above test at the 95% confidence level, and its accumulative value from March to May is added as an additional input for the BP model (hereafter referred to as Model Two). The training results of Model Two are shown in Figure 4.
The input factors of Model Two are indices No. 1–9 in Table 3. For Model Two, the value of m is 9, through formula (2) and trial-and-error, the optimal result of hidden layer neurons is 11. It can be seen from Figure 4, Model Two has a better fitting performance than Model One in predicting summer typhoon precipitation in Anhui Province. It also has a significant fitting effect on the high precipitation years. The average absolute error for Model Two in the simulation period is 13.6 mm, and the absolute average relative error is 27.9%. Meanwhile, we can find that the five years with the largest absolute error in Model Two are 1975, 1978, 1980, 1989, and 2004. It should be noted that 1975 and 1989 are La Nina event years, and their summer typhoon precipitation are 114.6 mm and 174.7 mm, respectively. The calculated values of Model Two are 68.2 mm and 126.7 mm, respectively. Such model prediction errors may be due to the decrease of SST in the Western Pacific in La Nina year. Furthermore, it is reported that the remarkably enhanced equatorial convergence zones are conducive to the occurrence and development of typhoons, resulting in abnormally high summer typhoon precipitation in 1975 and 1989 [38,39]. 1978 and 2004 are El Nino event years, and their summer typhoon precipitation is 32.0 mm and 63.3 mm, respectively. The calculated values of Model Two are 69.2 mm and 92.4 mm, respectively. Such model prediction errors may be due to the significant weakening of convection activity in the western Pacific during the El Nino year, which is not conducive to the formation of typhoon embryos. Therefore, the predicted typhoon precipitation amounts in 1978 and 2004 are less than the actual value [40]. As indicated by other researches, the ONI index is closely related to typhoon events and can appropriately characterize ENSO events [41]. Thus, based on the correlation analysis, the accumulative value of the ONI index from February to March of the current year is used as an additional input factor for the new Model Three.
The input factors of Model Three are indices No. 1–10 in Table 3. For Model Three, the value of m is 10. The optimal result of hidden layer neurons is 9 based on the Formula (2) and trial-and-error. As can be seen from Figure 4, Model Three has a better fitting performance than Model Two in predicting summer typhoon precipitation in Anhui Province. The average absolute error of Model Three is 13.5 mm, and the absolute average relative error is 20.9%. A significant error can be found in predicting the typhoon precipitation amount in 2000, the summer typhoon precipitation amount in Anhui Province in 2000 was 50.2 mm while the calculated value of the Model Three is 83.2 mm. This is because the typhoon in 2000 has a different precipitation mechanism from typhoons in normal years. In 2000, the average divergent circulation over the Western Pacific was weak (200 hPa). In addition, the vertical shear in the upper and lower troposphere in the 2000 typhoon is higher than that in normal years, and it leads to a no-conducive environment for the development of typhoon embryos [42]. The predicted summer typhoon precipitation amounts for Model One, Model Two, and Model Three in typhoon affecting years are shown in Table 4.
It can be seen from Table 4 that the average relative error of Model One, Model Two, and Model Three during the validation period are 30.5%, 22.1%, and 14.3%, respectively; their average absolute errors are 38.0 mm, 22.8 mm, and 14.7 mm, respectively; their maximum absolute values of relative error are 52.6%, 46.6%, and 33.2%, respectively; and their minimum absolute values of relative error are 3.1%, 5.2%, and 1.8%, respectively. Furthermore, we can see from Table 4 that the prediction errors in 2009 and 2012 are relatively large in Model Three. According to the statistical analysis of typhoon events in 2009 [43], its event-based typhoon precipitation is 41% lower than the average event-based typhoon precipitation of normal years. The total typhoon precipitation of 2009 is 36% lower than the average typhoon precipitation of normal years. The prediction errors in 2009 are caused by the significant cloud structure asymmetry, i.e., the precipitation range brought by landing typhoon is relatively small.

4. Discussion

The 60 year (1957–2016) annual data used in the study is at least twice longer than that of other meteorological studies [44,45]. Results from our analysis are therefore robust enough to represent the typhoon precipitation conditions in Anhui. In this study, we use a 5 mm threshold to identify the typhoon-induced precipitation during the first seven days after typhoon landing; we further constrain our analysis to the typhoon events with an accumulative precipitation (during the typhoon-induced precipitation periods) greater than 25 mm. Our results suggest that the above thresholds in identifying typhoon events reasonably improve the model prediction performances. Moreover, the 25 mm threshold for typhoon precipitation identification could filter out smaller typhoon precipitation process, which further improves the prediction stability.
According to the above identification method, it can be seen that Anhui has experienced typhoon precipitation from April to November, and June to September is the period with the highest typhoon visit frequency over the past 60 years. The average number of typhoon precipitation events in a summer is 1.4. Our results agree with that of other researches. Liang et al. [46] analyzed the interannual variation and seasonal variation of landing typhoons in the Huai River Basin during 1954–2018. The results indicated that on average 1.5 landing typhoons affect the Huai River Basin each summer (July to September), and most of the typhoons traveled westward or northwest along the south side of the river basin. In this study, typhoon precipitation is defined as the daily precipitation within the first seven days after typhoon landing to improve the typhoon precipitation recognition accuracy.
In addition, the typhoon precipitation event influencing factors identified in this study agree with that of other researches. For instance, Xia et al. [15] select Intensity of Polar Vortex and Nino3.4 SST as the factors of a multiple regression that predicts typhoon events. Wu [17] selects SST as one of the factors of a fuzzy neural network model that predicts summer typhoon events. Wang et al. [47] indicate that the intensity of typhoon precipitation is closely related to the path of the typhoon, the position and intensity of the subtropical high, and the position and intensity of the westerly trough.
Our influencing factors of typhoon precipitation amount are also similar to that of other researchers. According to IPCC (Intergovernmental Panel on Climate Change) [48] and other researchers [10,49], 28 climatic indices are found to influence heavy precipitations in China. Among the 28 climatic indices, Intensity of Northern Hemispheric Polar Vortex, Tibet Altiplano, Nino3.4 SST, Subtropical High Strength in South China Sea, and ONI are identified as influencing factors in this study (Table 3). The above results thus validate the processing method proposed in this study.
However, our developed model is not without limitations, especially in the prediction of the typhoon frequency and precipitation amount of a single event. The established typhoon affecting precipitation model is only suitable for predicting the average typhoon affecting precipitation over a long period of time. In addition, our typhoon precipitation prediction model mainly considers the influence of the lagged atmospheric circulation and sea temperature, while other factors such as the dynamic condition change and topographic change are not accounted. Further, the thermodynamic mechanism of typhoons and the influence of short-term weather changes might influence the typhoon precipitation amount and require further exploration.
In the future, in order to understand the law of inter-annual variability of typhoon precipitation and enhance the typhoon precipitation amount prediction capability, we should emphasize the impacts of various conditions, such as the atmospheric circulation, and the ocean and land surface processes activity. In addition, under the condition of global warming, we should combine dynamic numerical prediction methods and dynamic statistical prediction methods to further improve the typhoon precipitation amount prediction model.

5. Conclusions

Based on the daily precipitation data of 15 stations from 1957 to 2016 in Anhui province and the typhoon data, the typhoon precipitation events affecting Anhui Province were separated from the daily precipitation data. Through the correlation analysis of the 74 circulation indices and the sea surface temperature with the typhoon precipitation amount, the influencing factors of summer typhoon precipitation were identified. Then, a BP prediction model for summer typhoon precipitation in Anhui Province was established. By analyzing the prediction errors, the influencing factors were updated iteratively. The main conclusions are as follows:
  • A point worth noticing is the constructed BP neural network model for predicting typhoon precipitation events has a high accuracy rate. In the simulation period from 1957 to 2006, the accuracy rate of the 50 samples is 100%; the accuracy rate of the 10 samples in the validation period from 2007 to 2016 is 90%, and the only misclassification is the typhoon event in 2012. It is possible that misclassification is caused by Short-term weather changes, which lead to a unique typhoon precipitation mechanism.
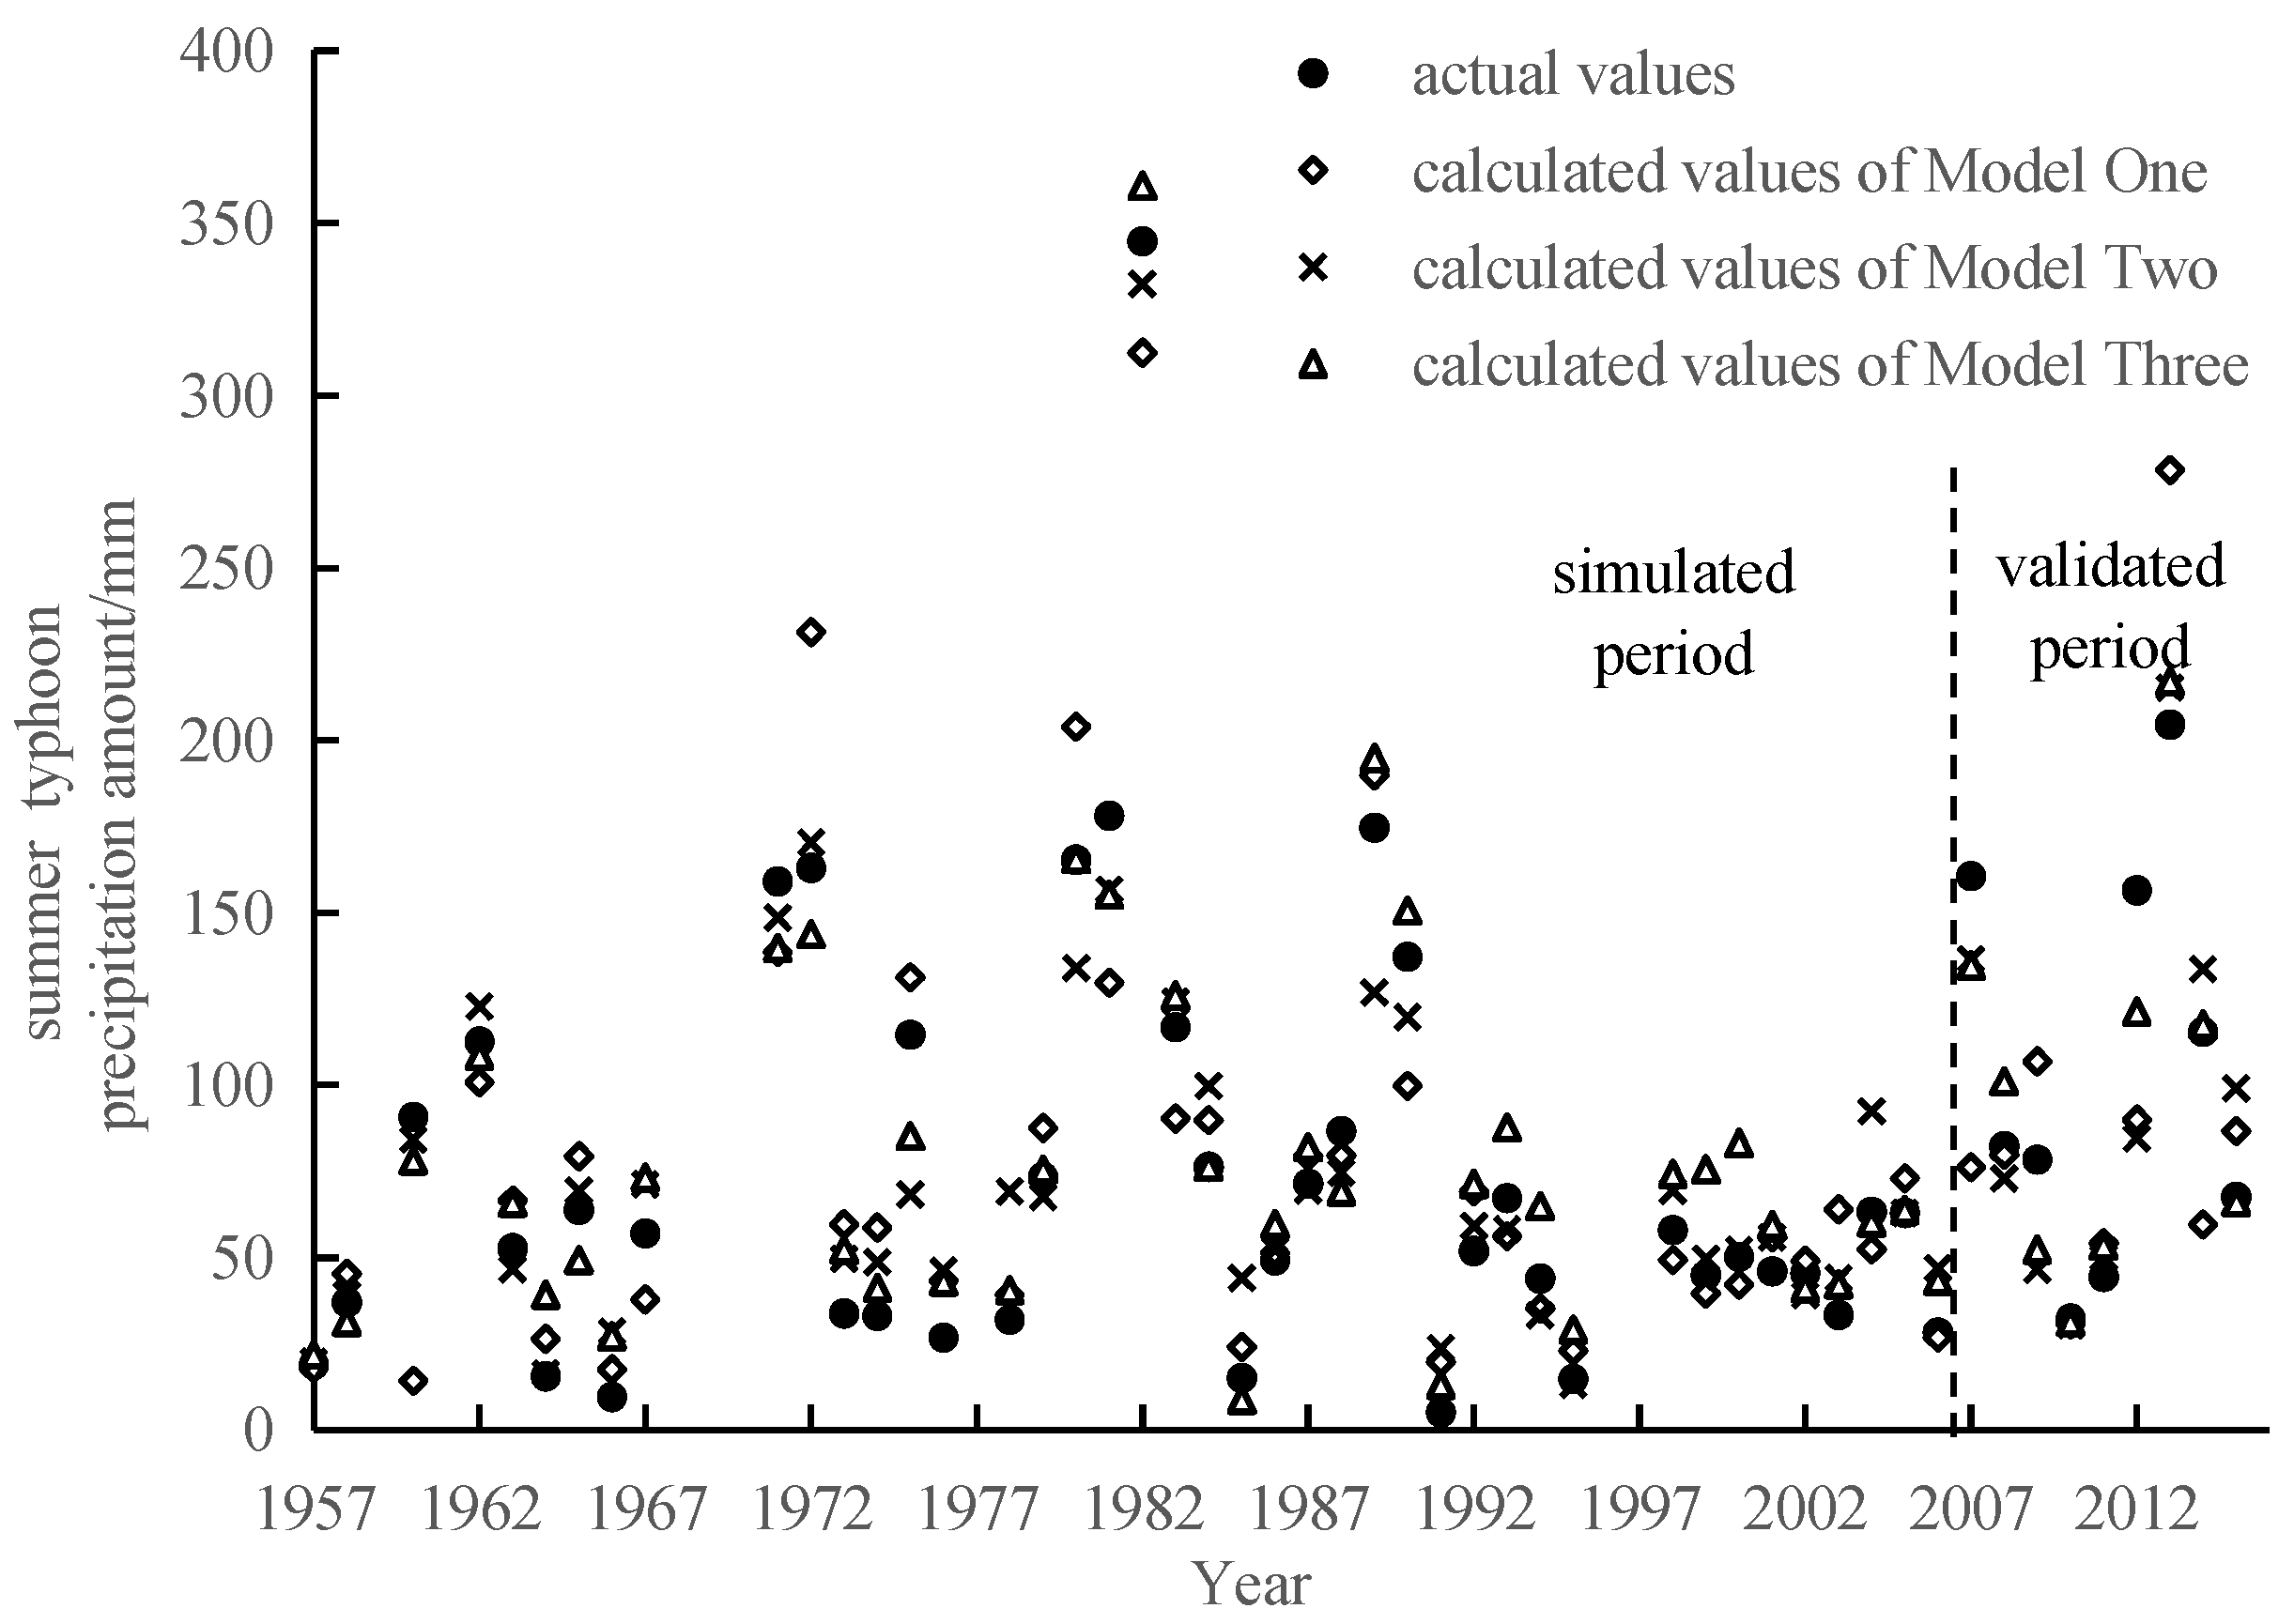
  • The BP prediction model of summer typhoon precipitation amount performs better with improved influencing factors selections. In the simulation period from 1957 to 2006, the average relative error of summer typhoon precipitation amount in Anhui Province is 13.5%, and the average absolute error is 20.9 mm. Moreover, the average relative error of summer typhoon precipitation amount in Anhui Province is 14.2%, and the average absolute error is 14.7 mm in the validation period from 2007 to 2016.
  • The influencing factors of the precipitation amount model include the Nino3.4 SST index, the ONI. 8 index, the Intensity of Northern Hemispheric Polar Vortex, Indiaburman Trough, Tibet Altiplano, Asian Zonal Circulation, India North Boundary of Subtropical High, India Subtropical High Area, and Subtropical High Strength in South China Sea.
  • During 1957–2016, there were 51 years in which landing typhoons affected Anhui Province in summer. The years with no typhoon precipitation were 1959, 1961, 1968, 1969, 1970, 1977, 1996, 1997, and 2016. The average annual summer typhoon precipitation amount during the above 51 years is 79.7 mm; the average number of typhoons affecting Anhui Province from June to August is 1.4 per year.

Author Contributions

Y.Z. conceived and designed the research; Y.Z. and Y.L. performed the data analysis and wrote the manuscript; extensive editing and revisions to the final manuscript and conclusions were contributed by J.J. and S.N.; Y.C. proposed some constructive suggestions about the research; D.Z. and P.Z. help to collect and analyze the data. All authors read and approved the manuscript.

Funding

The paper was funded by the National Key Research and Development Program of China under Grant No. 2017YFC1502405, the National Natural Science Foundation of China (Grant Nos. 51779067 and 51709071).

Institutional Review Board Statement

The study was conducted according to the guidelines of the Declaration of Helsinki, and approved by the Institutional Review Board.

Informed Consent Statement

Not applicable.

Data Availability Statement

Data available in a publicly accessible repository that does not issue DOIs. Publicly available datasets were analyzed in this study. This data can be found here: [data.cma.cn; tcdata.typhoon.org.cn; ncc-cma.net] (accessed on 15 May 2019).

Conflicts of Interest

The authors declare no conflict of interest.

Appendix A

Table A1. The data source from the Climate System Diagnosis and Prediction Office of the National Climate Center (ncc-cma.net, accessed on 15 May 2019).
74 Atmospheric Circulation Indices
1Index of Subtropical High Area in the Northern Hemisphere
2North Africa Subtropical High Area Index
3Index of the Area of North Africa, Atlantic and North America subtropical high
4India Subtropical High Area Index
5Western Pacific Subtropical High Area Index
6Index of the Area of the East Pacific Subtropical High
7North American Subtropical high Area Index
8Index of the Area of the Atlantic Subtropical high
9Subtropical High Strength in South China Sea
10Index of North American Atlantic Subtropical High Area
11Index of Pacific Subtropical High Area
12Northern Hemisphere Subtropical High Strength Index
13North Africa Subtropical high Intensity Index
14North Africa Atlantic North American Subtropical High Strength Index
15Indian Subtropical High Area Intensity Index
16Western Pacific Subtropical High Strength Index
17East Pacific Subtropical High Intensity Index
18North American Subtropical High Intensity Index
19Atlantic Subtropical High Intensity Index
20South China Sea Subtropical High Strength Index
21North American Atlantic Subtropical High Strength Index
22Pacific Subtropical High Strength Index
23Northern Hemisphere Subtropical High Ridge
24North African Subtropical High ridgeline
25The ridgeline of the North African Atlantic and North American Subtropical High
26India Subtropical High Ridge
27Ridgeline of the Western Pacific Subtropical High
28Ridge of the East Pacific Subtropical High
29North American Subtropical High Ridgeline
30Ridge of the Atlantic Subtropical High
31Ridge of the South China Sea Subtropical High
32Ridgeline of the North American Atlantic Subtropical High
33Ridgeline of the Pacific Subtropical High
34Northern Boundary of the Subtropical High in the Northern Hemisphere
35Northern boundary of the North African Subtropical High
36Northern Boundary of North Africa, Atlantic Ocean and North America Subtropical High
37India North Boundary of Subtropical High
38The northern boundary of the Western Pacific Subtropical High
39The northern boundary of the Eastern Pacific Subtropical High
40North Boundary of North American Subtropical High
41Northern Boundary of the Atlantic Subtropical High
42North Boundary of the South China Sea Subtropical High
43North Boundary of the North American Atlantic Subtropical High
44The Northern Boundary of the Pacific Subtropical High
45West ridge point of the Subtropical High of the Western Pacific
46Polar Vortex Area Index in Asia
47Pacific Ocean Polar Vortex Area Index
48North American polar vortex Area Index
49Polar Vortex Area Index in the Atlantic and European Regions
50Northern Hemisphere Polar Vortex Area Index
51Polar Vortex Intensity Index in Asia
52Pacific Vortex Intensity Index
53Polar Vortex Intensity Index in North America
54Polar Vortex Intensity Index in the Atlantic and European regions
55Intensity of Northern Hemispheric Polar Vortex
56Northern Hemisphere Polar Vortex Center Location
57Northern Hemisphere Polar Vortex Center Strength
58Atlantic European Circulation type W
59Atlantic European Circulation pattern C
60Atlantic European Circulation pattern E
61Eurasian Zonal Circulation Index
62Eurasian meridional Circulation Index
63Asian Zonal Circulation
64Asian Meridional Circulation Index
65Position of Asiatic trough
66East Asian trough strength
67Tibet Plateau 1
68Tibet Plateau 2
69Indiaburma Trough
70Cold Air
71Numbering Typhoon
72Landing Typhoon
73Sunspots
74Southern Oscillation Index

References

  1. Shen, Q.; Zhang, S.X.; Zhao, J.H.; Wang, X.J. Contribution of typhoon over coastal waters to summer rainfall in eastern China. Acta Phys. Sin. 2013, 62, 521–530. [Google Scholar]
  2. Niu, Y.; Fang, J.; Chen, R.; Xia, Z.; Xu, H. Network modeling and dynamic mechanisms of multi-hazards—A case study of typhoon Mangkhut. Water 2020, 12, 2198. [Google Scholar] [CrossRef]
  3. Wang, Y.M.; Ren, F.M.; Li, W.J.; Wang, X.L. Climatic characteristics of typhoon precipitation over China. J. Trop. Meteor. 2008, 24, 233–238. [Google Scholar]
  4. Fang, Y.S.; Huang, F.; Chen, Y.L.; Hu, B.B. Trends in total precipitation, extreme and typhoon precipitation over China in warm half year. Period. Ocean Univ. China 2015, 45, 12–18. [Google Scholar]
  5. Chang, C.P.; Lei, Y.H.; Sui, C.H.; Lin, X.H.; Ren, F.M. Tropical cyclone and extreme rainfall trends in east Asian summer monsoon since mid-20th century. Geophys. Res. Lett. 2012, 39, L18702. [Google Scholar] [CrossRef]
  6. Xiang, B.; Dong, X.N.; Li, Y.H. Climate change trend and causes of tropical cyclones affecting the South China Sea during the past 50 years. Atmos. Ocean. Sci. Lett. 2020, 13, 301–307. [Google Scholar] [CrossRef] [Green Version]
  7. Jiang, M.; Qi, L.B. Analysis on climatic characteristics of extreme precipitating typhoon in China during 1959–2012. Meteor Mon. 2016, 42, 1230–1236. [Google Scholar]
  8. Niu, X.X.; Du, H.L.; Teng, D.G.; Liu, J.Y. Main factors affecting the rainfall caused by landing typhoons. Torrential Rain Disasters 2010, 29, 76–80. [Google Scholar]
  9. Wu, M.C.; Yang, S.C.; Yang, T.H. Typhoon rainfall forecasting by means of ensemble numerical weather predictions with a GA-Based integration strategy. Atmosphere 2018, 9, 425. [Google Scholar] [CrossRef] [Green Version]
  10. Kong, F.; Fang, J.; Lu, L.L. The diagnosis of heavy rainfall in China and correlation of heavy rainfall with multiple climatic factors in China from 1961 to 2015. J. Trop. Meteor. 2018, 34, 34–47. [Google Scholar]
  11. Wang, C.J. Forecast of Typhoon Rainfall Based on BP Neural Network; Zhejiang Normal University: Hangzhou, China, 2013. [Google Scholar]
  12. Wei, C.C. Examining El Niño-Southern oscillation effects in the subtropical zone to forecast long-distance total rainfall from typhoons: A case study in Taiwan. J. Atmos. Ocean. Technol. 2017, 34, 2141–2161. [Google Scholar] [CrossRef]
  13. Wei, C.C.; Chou, T.H. Typhoon quantitative rainfall prediction from big data analytics by using the apache hadoop spark parallel computing framework. Atmosphere 2020, 11, 870. [Google Scholar] [CrossRef]
  14. Hai, Y.; Chen, G.H. Prediction of frequency of tropical cyclones forming over the Western North Pacific using an artificial neural network model. Clim. Environ. Res. 2019, 24, 324–332. [Google Scholar]
  15. Xia, L.L.; Zhu, Y.M.; Cheng, C.; Chen, X.Y. Interannual to interdecadal variations and prediction of tropical cyclone frequency over the western north pacific. Meteor. Environ. Sci. 2014, 37, 1–7. [Google Scholar]
  16. Li, Y.; Zhou, Y.L.; Zhou, P.; Jin, J.L.; Ning, S.W. Climate characteristics of typhoon precipitation in Anhui Province and prediction of typhoon precipitation events. Water Resour. Power 2021, 39, 1–5. [Google Scholar]
  17. Wu, H. A phase space projective method for monthly tropical cyclone forecasts. J. Trop. Meteor. 2007, 23, 383–387. [Google Scholar]
  18. Gao, J.Y.; Song, D.Z.; Lin, X.F. Forecasting model of annual and seasonal numbers of affecting tropical cyclone based on projection pursuit regression. J. Trop. Meteor. 2004, 20, 443–448. [Google Scholar]
  19. Wu, H.; Xing, C.Y.; Wu, S.A.; Zhu, J.J. Frequency prediction of tropical cyclones affecting Hainan in summer. J. Trop. Meteor. 2016, 32, 377–384. [Google Scholar]
  20. Weng, X.Y.; Hu, L.T.; Li, X.J.; Xie, D.S.; Liang, J. An intensity and frequency prediction model for China-landfalling tropical cyclones and its application. J. Trop. Meteor. 2010, 26, 470–474. [Google Scholar]
  21. Lo, D.C.; Wei, C.C.; Tsai, E.P. Parameter automatic calibration approach for neural-network-based cyclonic precipitation forecast models. Water 2015, 7, 3963–3977. [Google Scholar] [CrossRef] [Green Version]
  22. Schneider, D.P.; Deser, C.; Fasullo, J.; Trenberth, K.E. Climate data guide spurs discovery and understanding. EOS Trans. Agu. 2013, 94, 121–122. [Google Scholar] [CrossRef]
  23. Wang, J.; Shi, P.; Jiang, P.; Hu, J.; Qu, S.; Chen, X.; Chen, Y.; Dai, Y.; Xiao, Z. Application of BP neural network algorithm in traditional hydrological model for flood forecasting. Water 2017, 9, 48. [Google Scholar] [CrossRef] [Green Version]
  24. Jhong, Y.D.; Chen, C.S.; Lin, H.P.; Chen, S.T. Physical hybrid neural network model to forecast typhoon floods. Water 2018, 10, 632. [Google Scholar] [CrossRef] [Green Version]
  25. Liu, T.; Shao, J.A. Simulation of soil erosion intensity in the three gorges reservoir area using BP neural network. J. Nat. Res. 2018, 33, 669–683. [Google Scholar]
  26. Zhang, H.; Wang, Q.J.; Zhang, X.H. Influence of sample data preprocessing on BP neural network-based GPS elevation fitting. J. Geod. Geodyn. 2011, 31, 125–128. [Google Scholar]
  27. Jin, J.L.; Wei, Y.M. Generalized Intelligent Evaluation Method for Complex System and Its Application; Science Press: Beijing, China, 2008. [Google Scholar]
  28. Cong, C.H.; Chen, L.S.; Lei, X.T.; Li, Y. An overview on the study of tropical cyclone remote rainfall. J. Trop. Meteor. 2011, 27, 264–270. [Google Scholar]
  29. Huang, F.Z.; Zhou, Y.L.; Zhou, P.; Jin, J.L.; Yin, Z.J. Analysis of typhoon precipitation characteristics in recent 60 years in Anhui province. Water Resour. Power 2019, 37, 1–5. [Google Scholar]
  30. Chen, M.L.; Ning, S.W.; Jin, J.J.; Cui, Y.; Wu, C.G.; Zhou, Y.L. Risk assessment of agricultural drought disaster on the Huaibei plain of China based on the improved connection number and entropy information diffusion method. Water 2020, 12, 1089. [Google Scholar] [CrossRef]
  31. Guo, B.; Kong, W.H.; Jiang, L. Dynamic monitoring of ecological vulnerability in arid desert ecological region of northwest China and the quantitative analysis of its driving forces. J. Nat. Res. 2018, 33, 412–424. [Google Scholar]
  32. Yang, J.; Wang, Q.G.; Zhi, R.; Feng, G.L. Dynamic optimal multi-indices configuration for estimating the prediction errors of dynamical climate model in North China. Acta Phys. Sin. 2011, 60, 833–845. [Google Scholar]
  33. Huang, X.Y.; Zhao, H.S.; Huang, Y.; Lin, K.P.; He, L. A genetic neural network ensemble prediction model for tropical cyclones rainfall in Guangxi. J. Nat. Disasters 2017, 26, 184–196. [Google Scholar]
  34. Ma, D.Z.; Lin, Y.C.; Bao, Y.Y. Evolution of large-scale circulation and typhoon forecast. Meteor. Mon. 2000, 26, 31–35. [Google Scholar]
  35. Jin, J.L.; Wei, Y.M.; Zou, L.L.; Liu, L.; Zhang, W.W.; Zhou, Y.L. Forewarning of sustainable utilization of regional water resources: A model based on BP neural network and set pair analysis. Nat. Hazards 2012, 62, 115–127. [Google Scholar] [CrossRef]
  36. Chen, Y.H.; Wan, M.; Wu, F.; Tang, C.Y.; Qian, X.C. Analysis of the cause of precipitation difference induced by the typhoons “Jelawat” and “Haikui” with similar tracks. Meteor. Disaster Reduct. Res. 2014, 37, 18–23. [Google Scholar]
  37. Mao, W.Y. Study on predicting the summer precipitation in northern Xinjiang with previous circulation index. Meteor. Mon. 2009, 35, 91–98. [Google Scholar]
  38. Chu, H.Y.; Wu, R.S. Environmental influences on the intensity change of tropical cyclones in the Western North Pacific. Acta Meteor. Sin. 2013, 27, 335–343. [Google Scholar] [CrossRef]
  39. Urdiales, D.; Meza, F.; Gironás, J.; Gilabert, H. Improving stochastic modelling of daily rainfall using the ENSO index: Model development and application in chile. Water 2018, 10, 145. [Google Scholar] [CrossRef] [Green Version]
  40. Tu, S.F.; Xu, F.; Chang, S.J.; Ji, Q.Q.; Zhang, Y. Response of tropical cyclone in the northwest pacific for summer and autumn ENSO events. Meteor. Mon. 2019, 45, 920–930. [Google Scholar]
  41. Han, Z.; Guan, Y.P. Impacts of four types of ENSO events on tropical cyclones making landfall over mainland China based on three best-track datasets. Adv. Atmos. Sci. 2014, 31, 154–164. [Google Scholar]
  42. He, M.; Song, W.L.; Xu, L. Impact of large-scale circulation on the tropic cyclones in 2000. Meteor. Mon. 2002, 28, 15–20. [Google Scholar]
  43. Zhou, G.L.; Huang, C.X.; Tang, S.Y. The activities of typhoon affecting China in 2009. China Flood Drought Manag. 2010, 20, 50–51, 62. [Google Scholar]
  44. Wang, X.R.; Xu, M. The different temperature values standard year average and its statistical test. Meteor. Sci. Technol. 2003, 31, 33–37, 57. [Google Scholar]
  45. Bakker, A.M.R.; Van den Hurk, B.J.J.M.; Bessembinder, J.J.E.; Kroon, T. Standard years for large-scale hydrological scenario simulations. Environ. Model. Softw. 2011, 26, 797–803. [Google Scholar] [CrossRef]
  46. Liang, S.X.; Zhou, G.L.; Gao, W.Q.; Zhang, L.Y. Characteristic analysis of the typhoon landing impact on precipitation in Huaihe River Basin. China Flood Drought Manag. 2019, 29, 43–48. [Google Scholar]
  47. Wang, S.Y.; Sun, J.H.; Wang, F.H.; Lyu, S.L.; Yuan, Y. Research on the typhoon circulation field affecting precipitation in the eastern part of northern Anhui in the past 30 years. Meteor. Sci. 2019, 39, 827–833. [Google Scholar]
  48. IPCC AR5. Intergovernmental Panel on Climate Change 2013 Fifth a Fifth Assessment Report (AR5); Cambridge University Press: Cambridge, UK, 2013. [Google Scholar]
  49. Huang, D.Q.; Zhu, J.; Zhang, Y.C.; Huang, Y.; Kuang, X.Y. Assessment of summer monsoon precipitation derived from five reanalysis datasets over East Asia. Q. J. R. Meteor. Soc. 2016, 142, 108–119. [Google Scholar] [CrossRef]
Figure 1. Structure diagram of typhoon events and typhoon precipitation amount prediction model based on back propagation (BP).
Water 13 00550 g001
Figure 2. Schematic map of the geographical location and the location of rain gauge stations in the study area.
Water 13 00550 g002
Figure 3. Summer typhoon precipitation amount during 1957–2016 in Anhui Province.
Water 13 00550 g003
Figure 4. Predicted and observed typhoon precipitation amount of BP model in typhoon affecting years.
Water 13 00550 g004
Table 1. Identified influencing factors of typhoon precipitation events.
IndicesPeriodr
1Intensity of Northern Hemispheric Polar VortexLast November−0.4
2Position of Asiatic troughAccumulative value from February to May−0.33
3Intensity of Pacific Ocean Hemispheric Polar VortexAccumulative value from February to April−0.33
4Tibet Altiplano 1Last October−0.34
5India Subtropical High RidgeAccumulative value from March to May−0.35
6India North Boundary of Subtropical HighAccumulative value from March to May−0.37
7Indiaburman TroughFebruary−0.33
8Nino3.4 SSTAccumulative value from March to May−0.38
Table 2. Calculated values of model and actual values of typhoon precipitation events in validated period.
Year2007200820092010201120122013201420152016
Actual values111111111−1
Calculated value0.60.51.111.3−0.11.92.31.1−0.5
Y11111−1111−1
Table 3. Identified influencing factors of typhoon precipitation amount.
IndicesPeriodr
1Intensity of Northern Hemispheric Polar VortexLast October−0.37
2Indiaburman TroughLast November−0.37
3Tibet Altiplano 1Accumulative value from Last October to November−0.37
4Asian Zonal CirculationLast October−0.37
5India North Boundary of Subtropical HighMay−0.36
6India Subtropical High RidgeAccumulative value from Last October to May−0.4
7India Subtropical High AreaMay−0.38
8Nino3.4 SSTAccumulative value from February to Mar.−0.37
9Subtropical High Strength in South China SeaAccumulative value from March to May−0.38
10Oceanic Nino IndexAccumulative value from Februaryto Mar.0.45
Table 4. Predicted summer typhoon precipitation amount in typhoon affecting years.
YearActual Value (mm)Model OneModel TwoModel Three
Predictive Value (mm)Absolute Error (mm)Relative Error(%)Predictive Value (mm)Absolute Error (mm)Relative Error (%)Predictive Value (mm)Absolute Error (mm)Relative Error (%)
2007160.676.284.452.6136.524.115.0134.725.916.1
200882.479.82.63.172.99.511.4101.218.822.8
200978.4106.928.536.446.531.940.752.326.133.2
201032.330.71.65.030.32.06.031.31.02.9
201144.454.19.722.049.95.512.653.59.120.7
2012156.590.066.542.584.671.946.0121.335.222.5
2013204.6278.473.836.1215.210.65.2217.112.56.1
2014115.459.655.848.4133.718.315.8117.52.11.8
201567.786.719.028.299.231.546.666.01.72.4
Max //84.452.6/71.946.6/35.233.2
AVG //38.030.5/22.822.1/14.714.3
2016 is the non-typhoon affecting precipitation year. AVG is the abbreviation of average.
Publisher’s Note: MDPI stays neutral with regard to jurisdictional claims in published maps and institutional affiliations.

