
Phosphorous Supply to a Eutrophic Artificial Lake: Sedimentary versus Groundwater Sources

 ,
,  ,
,
Abstract
:1. Introduction
2. Methods
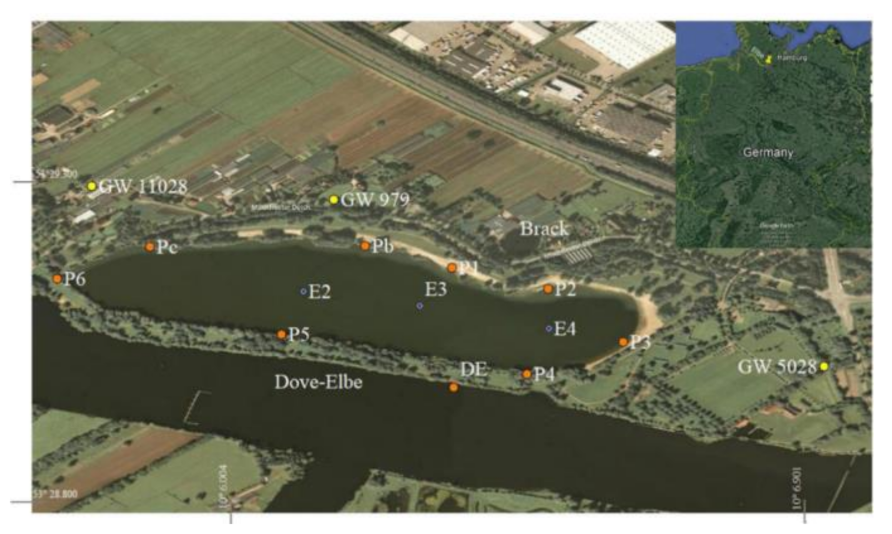
2.1. Study Area
2.2. Sampling Locations
2.2.1. Sediment and Sediment Pore Water Sampling
2.2.2. Push-Point Sampling
2.2.3. Lake Water and Groundwater Sampling
2.3. Chemical Analyses
2.3.1. Water Samples
2.3.2. Major Elements in Sediments
2.3.3. Stable Isotope Analyses
2.4. Calculation of Pore Water Fluxes
2.5. Water Stable Isotope Mass Balance
3. Results
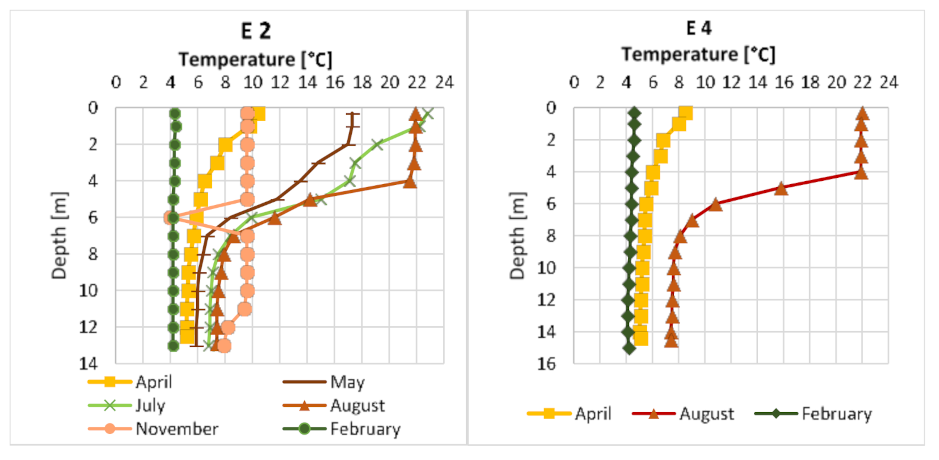
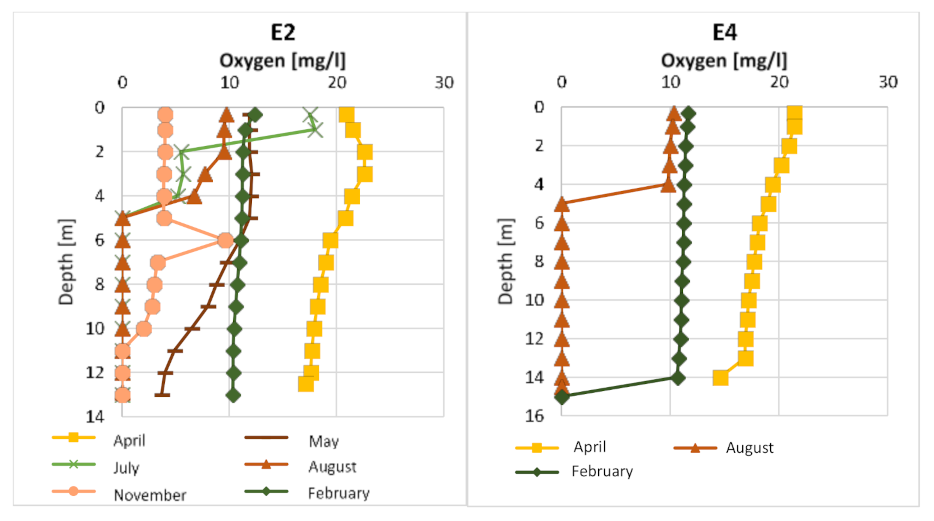
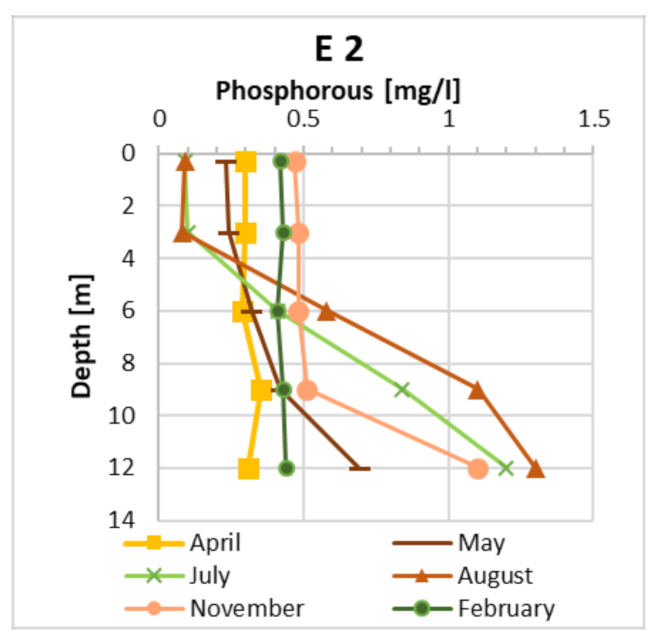
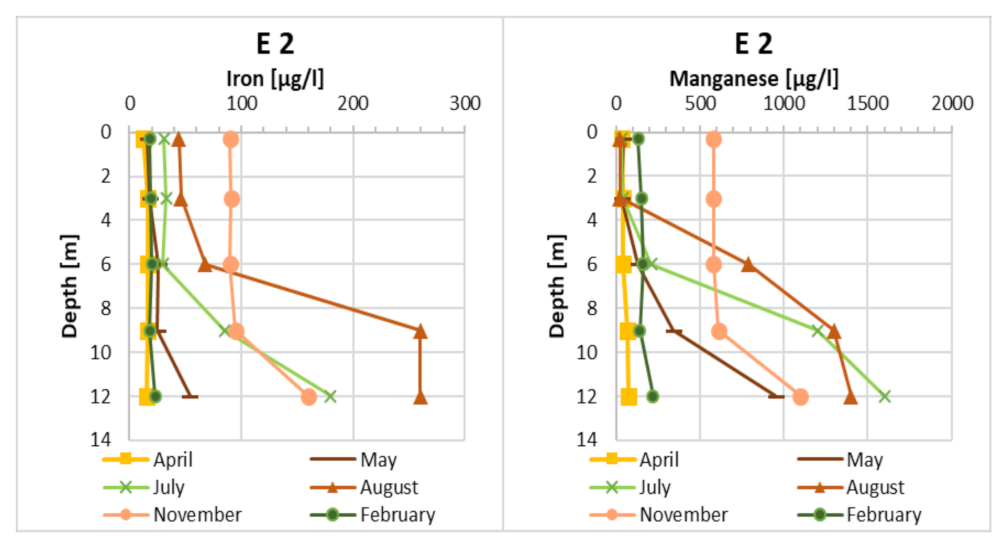
3.1. Water Column
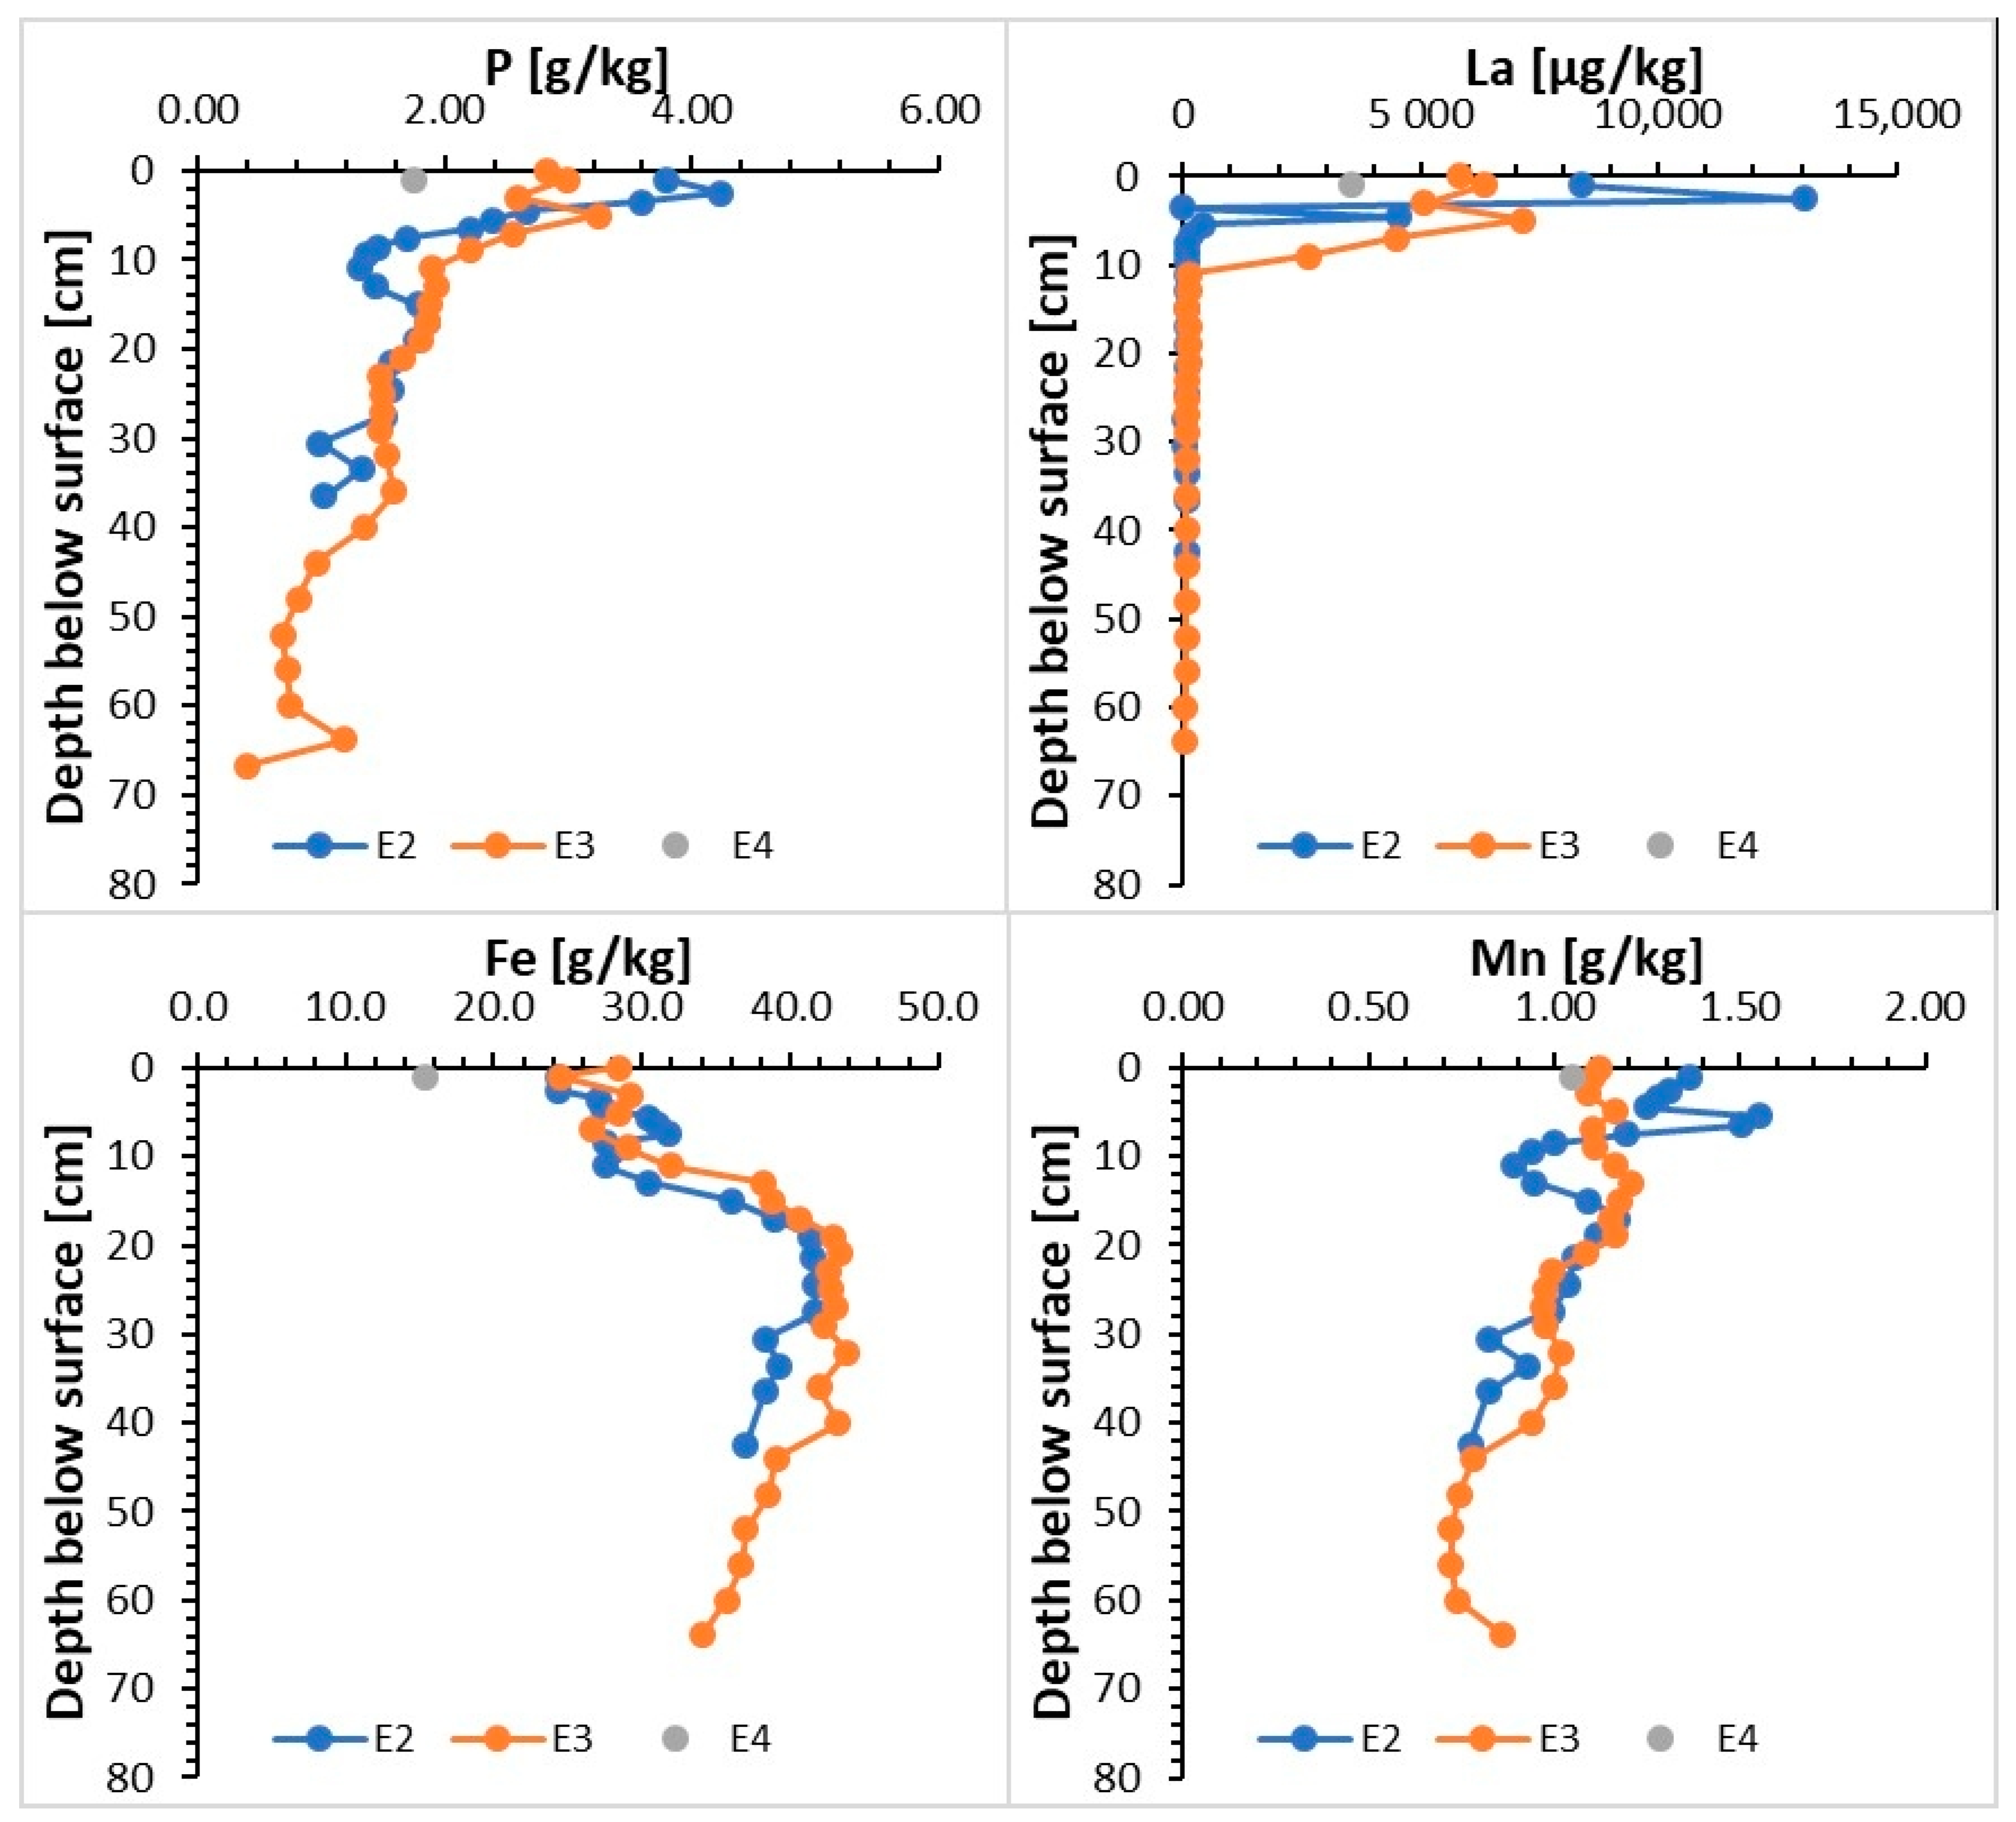
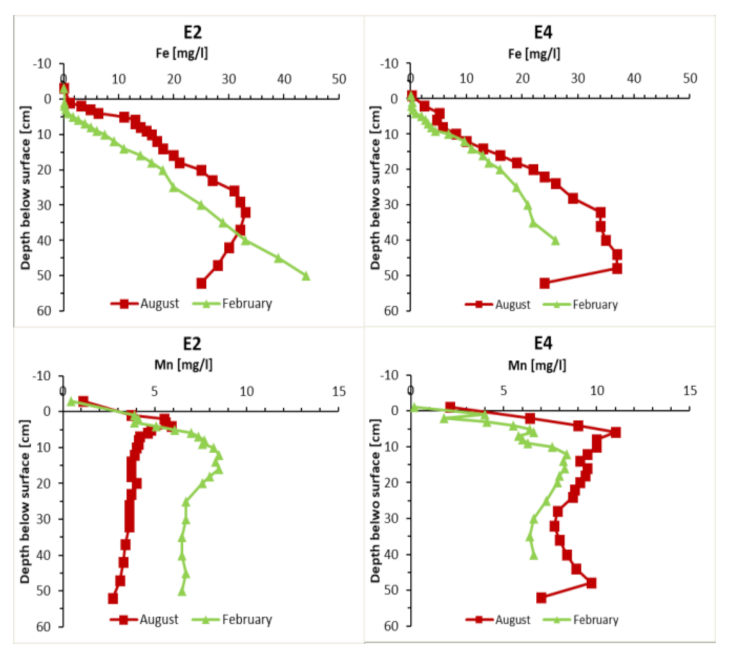
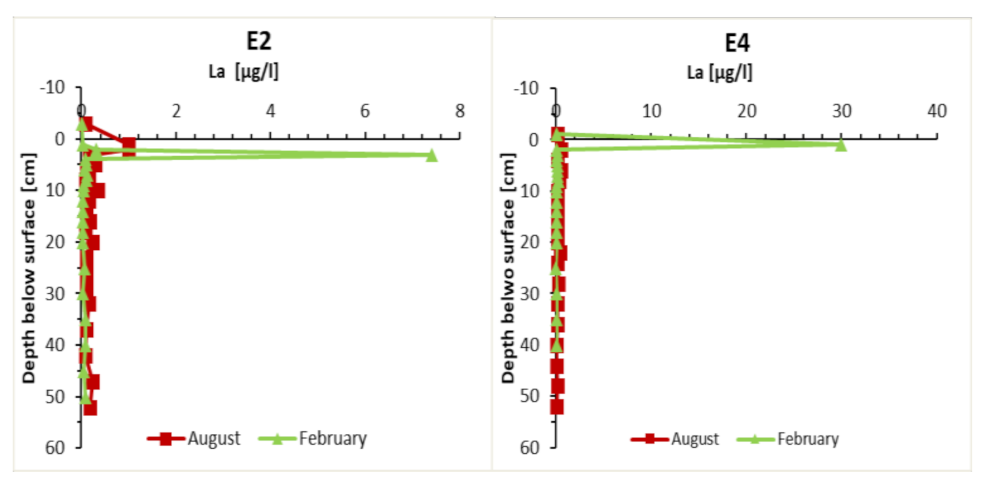
3.2. Phosphorous, Iron, and Lanthanum in Sediments
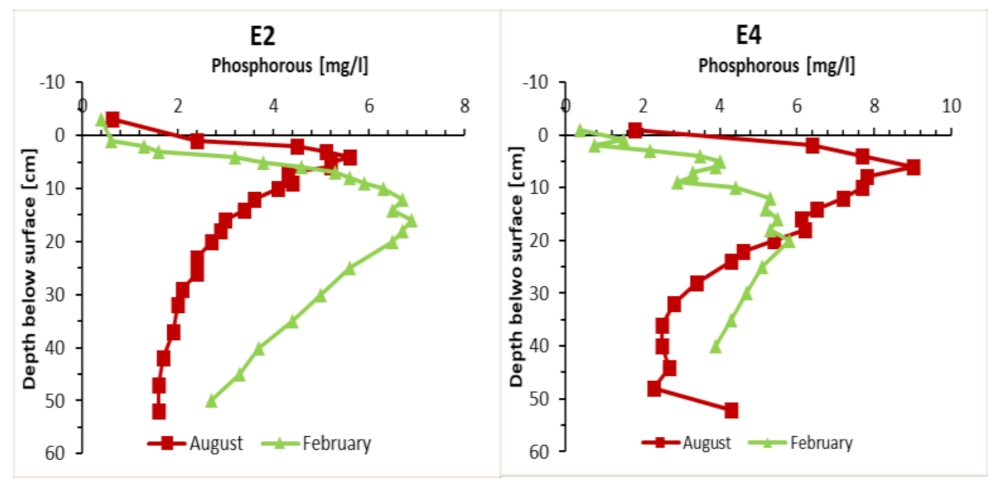
3.3. Phosphorous Distribution in Sediment Pore Waters
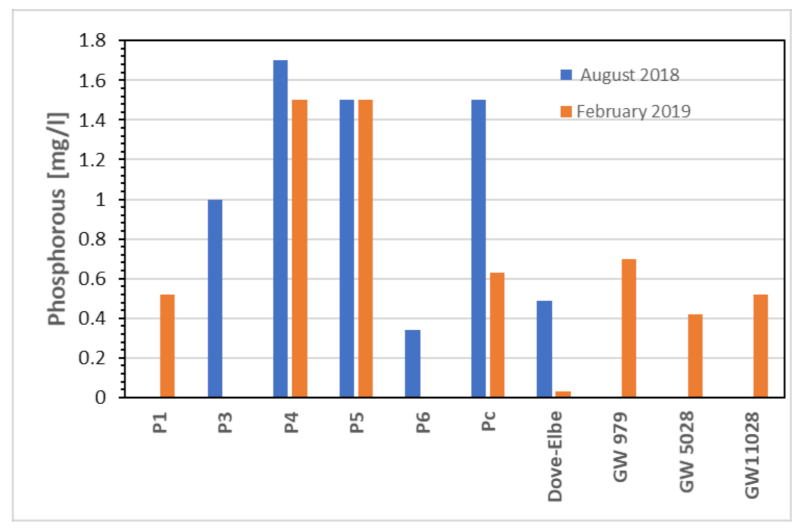
3.4. Phosphorous in Groundwater
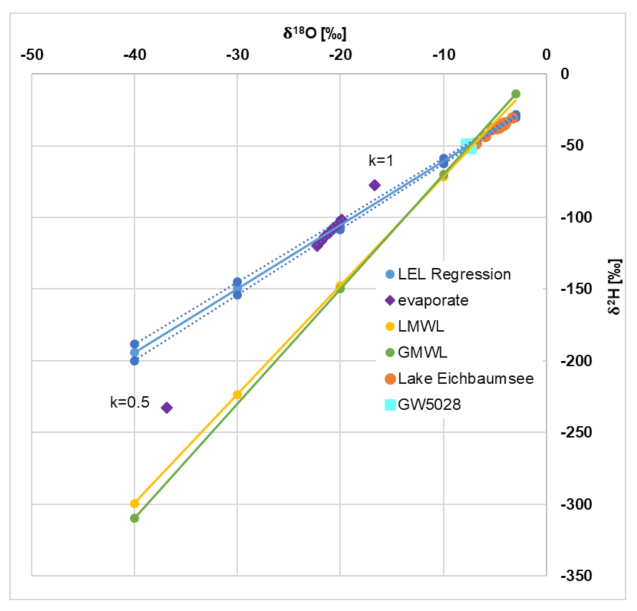
3.5. Water Stable Isotopes
4. Discussion
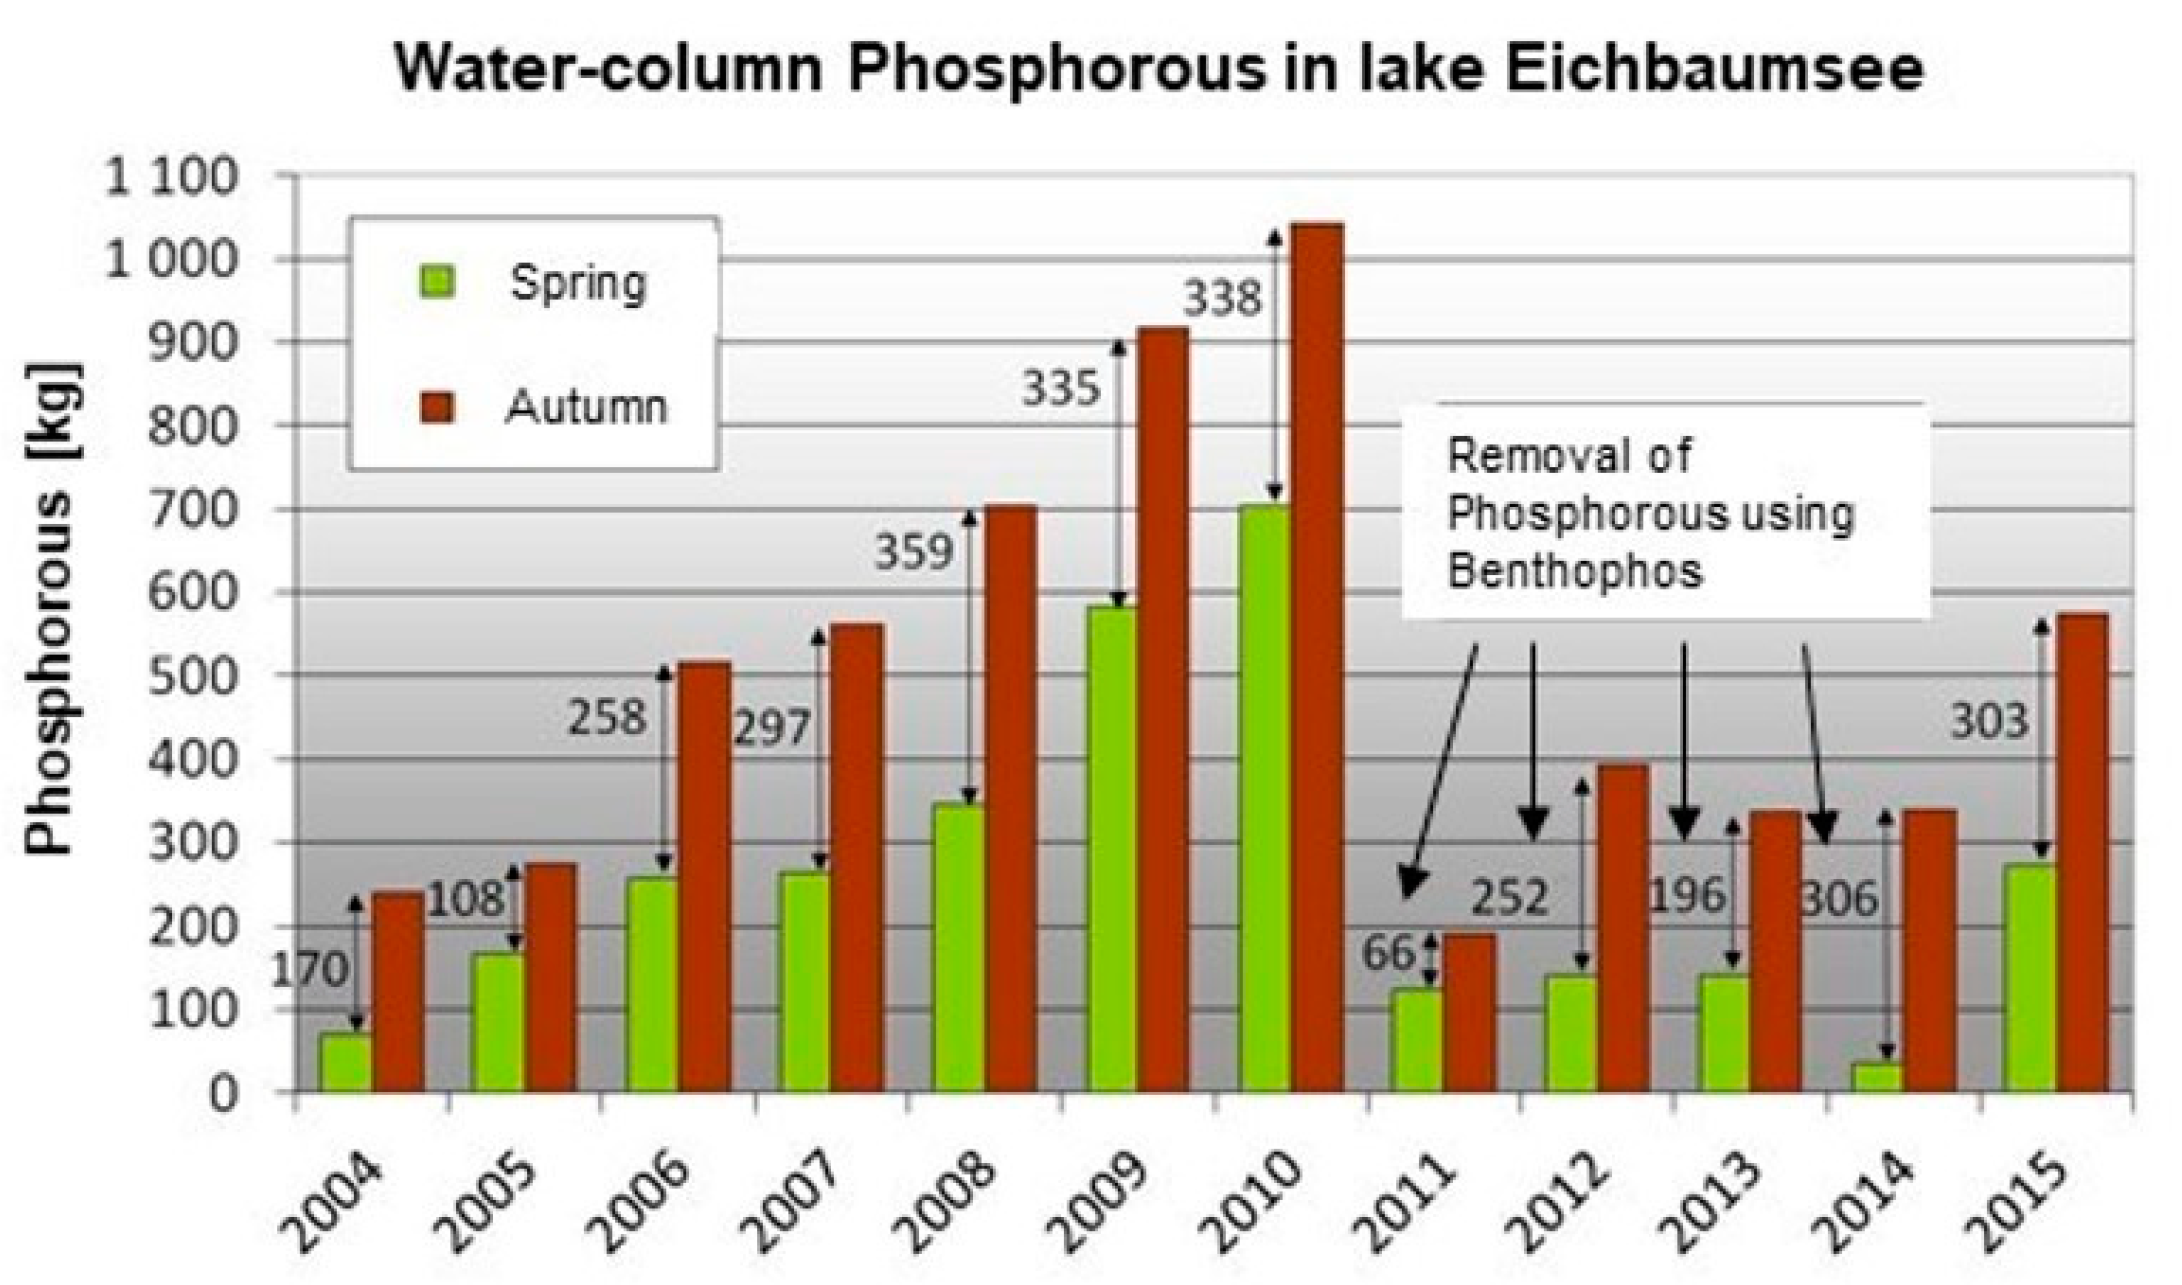
4.1. Changes in Lake Water Phosphorous Concentrations
4.2. Internal Cycling as a Phosphorous Source
4.3. Groundwater-Borne Phosphorous Flux
5. Conclusions
Supplementary Materials
Author Contributions
Funding
Institutional Review Board Statement
Informed Consent Statement
Acknowledgments
Conflicts of Interest
References
- Ho, J.C.; Michalak, A.M.; Pahlevan, N. Widespread global increase in intense lake phytoplankton blooms since the 1980s. Nat. Cell Biol. 2019, 574, 667–670. [Google Scholar] [CrossRef] [PubMed]
- Michalak, A.M.; Anderson, E.J.; Beletsky, D.; Boland, S.; Bosch, N.S.; Bridgeman, T.B.; Chaffin, J.D.; Cho, K.; Confesor, R.; Daloğlu, I.; et al. Record-setting algal bloom in Lake Erie caused by agricultural and meteorological trends consistent with expected future conditions. Proc. Natl. Acad. Sci. USA 2013, 110, 6448–6452. [Google Scholar] [CrossRef] [Green Version]
- Beaulieu, M.; Pick, F.R.; Gregory-Eaves, I. Nutrients and water temperature are significant predictors of cyanobacterial biomass in a 1147 lakes data set. Limnol. Oceanogr. 2013, 58, 1736–1746. [Google Scholar] [CrossRef]
- Conley, D.J.; Paerl, H.W.; Howarth, R.W.; Boesch, D.F.; Seitzinger, S.P.; Havens, K.E.; Lancelot, C.; Likens, G.E. Ecology: Controlling eutrophication: Nitrogen and phosphorus. Science 2009, 323, 1014–1015. [Google Scholar] [CrossRef] [PubMed]
- Søndergaard, M.; Jensen, J.P.; Jeppesen, E. Seasonal response of nutrients to reduced phosphorus loading in 12 Danish lakes. Freshw. Biol. 2005, 50, 1605–1615. [Google Scholar] [CrossRef]
- Magnuson, J.J.; Kratz, T.K.; Benson, B.J. Long-term-dynamics of lakes in the landscape-long-term ecological research on north temperate lakes; Oxford University Press: Oxford, UK, 2006; 464p. [Google Scholar]
- Welch, E.B.; Jacoby, J.M. On determining the principal source of phosphorus causing summer algal blooms in Western Washington Lakes. Lake Reserv. Manag. 2001, 17, 55–65. [Google Scholar] [CrossRef] [Green Version]
- Beutel, M.W.; Horne, A.J. Nutrient fluxes from profundal sediment of ultra-oligotrophic Lake Tahoe, California/Nevada: Implications for water quality and management in a changing climate. Water Resour. Res. 2018, 54, 1549–1559. [Google Scholar] [CrossRef]
- Rosenberry, D.O.; Winter, T.C.; Likens, G.E. Hydrologic Processes and the Water Budget; University of California Press: Berkeley, CA, USA, 2009; pp. 22–68. [Google Scholar]
- Lewandowski, J.; Meinikmann, K.; Nützmann, G.; Rosenberry, D.O. Groundwater—The disregarded component in lake water and nutrient budgets. Part 2: Effects of groundwater on nutrients. Hydrol. Process. 2015, 29, 2922–2955. [Google Scholar] [CrossRef]
- Rosenberry, D.O.; Lewandowski, J.; Meinikmann, K.; Nützmann, G. Groundwater—The disregarded component in lake water and nutrient budgets. Part 1: Effects of groundwater on hydrology. Hydrol. Process. 2015, 29, 2895–2921. [Google Scholar] [CrossRef]
- Stachelek, J.; Soranno, P.A. Does freshwater connectivity influence phosphorus retention in lakes? Limnol. Oceanogr. 2019, 64, 1586–1599. [Google Scholar] [CrossRef]
- Kazmierczak, J.; Postma, D.; Müller, S.; Jessen, S.; Nilsson, B.; Czekaj, J.; Engesgaard, P. Groundwater-controlled phosphorus release and transport from sandy aquifer into lake. Limnol. Oceanogr. 2020, 65, 2188–2204. [Google Scholar] [CrossRef] [Green Version]
- Arnoux, M.; Barbecot, F.; Gibert-Brunet, E.; Gibson, J.; Rosa, E.; Noret, A.; Monvoisin, G. Geochemical and isotopic mass balances of kettle lakes in southern Quebec (Canada) as tools to document variations in groundwater quantity and quality. Environ. Earth Sci. 2017, 76, 106. [Google Scholar] [CrossRef]
- Gibson, J.; Birks, S.; Yi, Y. Stable isotope mass balance of lakes: A contemporary perspective. Quat. Sci. Rev. 2016, 131, 316–328. [Google Scholar] [CrossRef]
- Petermann, E.; Gibson, J.J.; Knöller, K.; Pannier, T.; Weiß, H.; Schubert, M. Determination of groundwater discharge rates and water residence time of groundwater-fed lakes by stable isotopes of water (18O, 2H) and radon (222Rn) mass balances. Hydrol. Process. 2018, 32, 805–816. [Google Scholar] [CrossRef]
- Knöller, K.; Strauch, G. The application of stable isotopes for assessing the hydrological, sulfur, and iron balances of acidic mining lake ML 111 (Lusatia, Germany) as a basis for biotechnological remediation. Water Air Soil Pollut. Focus 2002, 2, 3–14. [Google Scholar] [CrossRef]
- Janssen, A.B.; van Wijk, D.; van Gerven, L.P.; Bakker, E.S.; Brederveld, R.J.; DeAngelis, D.L.; Janse, J.H.; Mooij, W.M. Success of lake restoration depends on spatial aspects of nutrient loading and hydrology. Sci. Total Environ. 2019, 679, 248–259. [Google Scholar] [CrossRef]
- Jeppesen, E.; Søndergaard, M.; Jensen, J.P.; Havens, K.E.; Anneville, O.; Carvalho, L.; Coveney, M.F.; Deneke, R.; Dokulil, M.T.; Foy, B.; et al. Lake responses to reduced nutrient loading—An analysis of contemporary long-term data from 35 case studies. Freshw. Biol. 2005, 50, 1747–1771. [Google Scholar] [CrossRef]
- Schindler, D.W.; Hecky, R.E.; Findlay, D.L.; Stainton, M.P.; Parker, B.R.; Paterson, M.J.; Beaty, K.G.; Lyng, M.; Kasian, S.E.M. Eutrophication of lakes cannot be controlled by reducing nitrogen input: Results of a 37-year whole-ecosystem experiment. Proc. Natl. Acad. Sci. USA 2008, 105, 11254–11258. [Google Scholar] [CrossRef] [Green Version]
- Nõges, T.; Laugaste, R.; Nõges, P.; Tõnno, I. Critical N:P ratio for cyanobacteria and N2-fixing species in the large shallow temperate lakes Peipsi and Võrtsjärv, North-East Europe. Hydrobiology 2008, 599, 77–86. [Google Scholar] [CrossRef]
- Rohrlack, T.; Dittmann, E.; Henning, M.; Börner, T.; Kohl, J.G. Role of microcystins in poisoning and food ingestion inhibition of Daphnia galeata caused by the cyanobacterium Microcystis aeruginosa. Appl. Environ. Microbiol. 1999, 65, 737–739. [Google Scholar] [CrossRef] [Green Version]
- Peterson, S.A. Lake restauration by sediment removal. JAWRA J. Am. Water Resour. Assoc. 1982, 18, 423–436. [Google Scholar] [CrossRef]
- Galvez-Cloutier, R.; Saminathan, S.K.M.; Boillot, C.; Triffaut-Bouchet, G.; Bourget, A.; Soumis-Dugas, G. An evaluation of several in-lake restoration techniques to improve the water quality problem (eutrophication) of Saint-Augustin Lake, Quebec, Canada. Environ. Manag. 2012, 49, 1037–1053. [Google Scholar] [CrossRef]
- Reitzel, K.; Hansen, J.; Andersen, F.Ø.; Hansen, K.S.; Jensen, H.S. Lake restoration by dosing aluminum relative to mobile phosphorus in the sediment. Environ. Sci. Technol. 2005, 39, 4134–4140. [Google Scholar] [CrossRef] [PubMed]
- Copetti, D.; Finsterle, K.; Marziali, L.; Stefani, F.; Tartari, G.; Douglas, G.; Reitzel, K.; Spears, B.M.; Winfield, I.J.; Crosa, G.; et al. Eutrophication management in surface waters using lanthanum modified bentonite: A review. Water Res. 2016, 97, 162–174. [Google Scholar] [CrossRef] [PubMed] [Green Version]
- Egemose, S.; Wauer, G.; Kleeberg, A. Resuspension behaviour of aluminium treated lake sediments: Effects of ageing and pH. Hydrobiology 2009, 636, 203–217. [Google Scholar] [CrossRef]
- Spieker, J.; Göring, H. Gewässerökologisches Monitoringprogramm 2015. Gutachten im Auftrag der Freien und Hansestadt Hamburg; Behörde für Stadtentwicklung und Umwelt, Amt für Umweltschutz, Gewässerschutz.—Hrsg.: (Konzepte Lösungen Sanierungen im Gewässerschutz); Planungsbüro für Gewässerschutz: Hamburg, Germany, 2016. [Google Scholar]
- Spieker, J.; Göring, H. See Hinterm Horn—Eichbaumsee: Vergleichende Untersuchungen zum Eisen-Phosphor-Kreislauf. Gutachten im Auftrag der Freien und Hansestadt Hamburg; Behörde für Stadtentwicklung und Umwelt, Amt für Umweltschutz, Gewässerschutz.—Hrsg.: Konzepte Lösungen Sanierungen im Gewässerschutz—Planungsbüro für Gewässerschutz: Hamburg, Germany, 2017. [Google Scholar]
- Seeberg-Elverfeldt, J.; Schlüter, M.; Feseker, T.; Kölling, M. Rhizon sampling of porewaters near the sediment-water interface of aquatic systems. Limnol. Oceanogr. Methods 2005, 3, 361–371. [Google Scholar] [CrossRef]
- Charette, M.A.; Allen, M.C. Precision Ground Water Sampling in Coastal Aquifers Using a Direct-Push, Shielded-Screen Well-Point System. Ground Water Monit. Remediat. 2006, 26, 87–93. [Google Scholar] [CrossRef] [Green Version]
- Fick, A. Über Diffusion. Ann. Phys. 1855, 170, 59–86. [Google Scholar] [CrossRef]
- Ullman, W.J.; Aller, R.C. Diffusion coefficients in nearshore marine sediments1. Limnol. Oceanogr. 1982, 27, 552–556. [Google Scholar] [CrossRef]
- Craig, H.; Gordon, L.I. Deuterium and oxygen-18 variations in the ocean and the marine atmosphere. In Proceedings of the Conference on Stable Isotopes in Oceanographic, Studies Paleotemperatures, Spoleto, Italy; Tongiorgi., E., Ed.; Consiglio Nazionale delle Richerche, Laboratorio de Geologia Nucleare: Pisa, Italy, 1965; pp. 9–130. [Google Scholar]
- Horita, J.; Wesolowski, D.J. Liquid-vapor fractionation of oxygen and hydrogen isotopes of water from the freezing to the critical temperature. Geochim. Cosmochim. Acta 1994, 58, 3425–3437. [Google Scholar] [CrossRef]
- Gonfiantini, R. Chapter 3—Environmental isotopes in lake studies. In The Terrestrial Environment; Fritz, B.P., Fontes, J.C., Eds.; Elsevier: Amsterdam, The Netherlands, 1986; pp. 113–168. [Google Scholar]
- Dinçer, T. The use of oxygen 18 and deuterium concentrations in the water balance of lakes. Water Resour. Res. 1968, 4, 1289–1306. [Google Scholar] [CrossRef]
- Zuber, A. On the environmental isotope method for determining the water balance components of some lakes. J. Hydrol. 1983, 61, 409–427. [Google Scholar] [CrossRef]
- Craig, H. Isotopic variations in meteoric waters. Science 1961, 133, 1702–1703. [Google Scholar] [CrossRef]
- Seiler, C.; Redelstein, R. Bericht zum Monitoring des Eichbaumsees im Jahr 2019; Gutachten im Auftrag der Freien und Hansestadt Hamburg, Institut für Hygiene und Umwelt: Hamburg, Germany, 2020. [Google Scholar]
- Amirbahman, A.; Pearce, A.R.; Bouchard, R.J.; Norton, S.A.; Steven Kahl, J. Relationship between hypolimnetic phosphorus and iron release from eleven lakes in Maine, USA. Biogeochemistry 2003, 65, 369–386. [Google Scholar] [CrossRef]
- Jensen, H.S.; Kristensen, P.; Jeppesen, E.; Skytthe, A. Iron:phosphorus ratio in surface sediment as an indicator of phosphate release from aerobic sediments in shallow lakes. Hydrobiologia 1992, 235, 731–743. [Google Scholar] [CrossRef]
- Chen, M.; Ding, S.; Wu, Y.; Fan, X.; Jin, Z.; Tsang, D.C.; Wang, Y.; Zhang, C. Phosphorus mobilization in lake sediments: Experimental evidence of strong control by iron and negligible influences of manganese redox reactions. Environ. Pollut. 2019, 246, 472–481. [Google Scholar] [CrossRef]
- Hupfer, M.; Lewandowski, J. Oxygen controls the phosphorus release from lake sediments—a long-lasting paradigm in Limnology. Int. Rev. Hydrobiol. 2008, 93, 415–432. [Google Scholar] [CrossRef]
- Schwefel, R.; Steinsberger, T.; Bouffard, D.; Bryant, L.D.; Müller, B.; Wüest, A. Using small-scale measurements to estimate hypolimnetic oxygen depletion in a deep lake. Limnol. Oceanogr. 2017, 63, S54–S67. [Google Scholar] [CrossRef]
- Epe, T.S.; Finsterle, K.; Yasseri, S. Nine years of phosphorus management with lanthanum modified bentonite (Phoslock) in a eutrophic, shallow swimming lake in Germany. Lake Reserv. Manag. 2017, 33, 119–129. [Google Scholar] [CrossRef]
- US Geological Survey. 2014. Available online: https://toxics.usgs.gov/highlights/phosphorous_migration.html (accessed on 26 October 2020).
- Meinikmann, K.; Hupfer, M.; Lewandowski, J. Phosphorus in groundwater discharge—A potential source for lake eutrophication. J. Hydrol. 2015, 524, 214–226. [Google Scholar] [CrossRef]
- Ommen, D.A.O.; Kidmose, J.; Karan, S.; Flindt, M.R.; Engesgaard, P.; Nilsson, B.; Andersen, F. Østergaard Importance of groundwater and macrophytes for the nutrient balance at oligotrophic Lake Hampen, Denmark. Ecohydrology 2011, 5, 286–296. [Google Scholar] [CrossRef]
- Holman, I.P.; Whelan, M.J.; Howden, N.J.K.; Bellamy, P.H.; Willby, N.J.; Rivas-Casado, M.; McConvey, P.J. Phosphorus in groundwater-an overlooked contributor to eutrophication? Hydrol. Process. 2008, 22, 5121–5127. [Google Scholar] [CrossRef]
- Jarosiewicz, A.; Witek, Z. Where do nutrients in an inlet-less lake come from? The water and nutrient balance of a small mesotrophic lake. Hydrobiol. 2014, 724, 157–173. [Google Scholar] [CrossRef]
- Heathwaite, A.; Dils, R. Characterising phosphorus loss in surface and subsurface hydrological pathways. Sci. Total Environ. 2000, 251–252, 523–538. [Google Scholar] [CrossRef]
- Holman, I.; Howden, N.; Bellamy, P.; Willby, N.; Whelan, M.; Casado, M.R. An assessment of the risk to surface water ecosystems of groundwater P in the UK and Ireland. Sci. Total Environ. 2010, 408, 1847–1857. [Google Scholar] [CrossRef] [PubMed] [Green Version]
- Nisbeth, C.S.; Tamburini, F.; Kidmose, J.; Jessen, S.; O’Connell, D.W. Analysis of oxygen isotopes of inorganic phosphate (δ18Op) in freshwater: A detailed method description. Hydrol. Earth Syst. Sci. Discuss. 2019, 2019, 1–18. [Google Scholar]
- Rücker, J.; Nixdorf, B.; Quiel, K.; Grüneberg, B. North German Lowland Lakes Miss Ecological Water Quality Standards—A Lake Type Specific Analysis. Water 2019, 11, 2547. [Google Scholar] [CrossRef] [Green Version]
- Bundesministerium für Umwelt und Bau/Umweltbundesamt (BMUB/UBA). Water Framework Directive—The Status of German Waters 2015; BMU/UBA: Bonn/Dessau, Germany. 2016. Available online: https://www.gewaesser-bewertung.de/files/wrrl_englische_version_dez_2016.pdf (accessed on 1 December 2020).


| Sample Type | Date | Locations |
|---|---|---|
| Sediments | April | E2, E3, E4 |
| Sediment pore water | April | E2, E4 |
| Sediment pore water | August 2018, February 2019 | E2, E4 |
| Push-point samples | August 2018, February 2019 | P1–P6; Pb, Pc |
| Groundwater | April 2018, February 2019 | GW 11028, GW 5028, GW 979 |
| Water column | April 2018, May 2018, July 2018, August 2018, November 2018, February 2019 | E2, E4 (only April, August, February) |
| Dove-Elbe | April 2018, August 2018, February 2019 | DE |
| Parameter | April 2018 | August 2019 | Unit |
|---|---|---|---|
| Lake surface area (S) | 240,000 | 240,000 | m2 |
| Lake water volume (V) | 1,727,000 | 1,727,000 | m3 |
| Precipitation (P) | 8400 | 17,011 | mm |
| Surface runoff (Si) | 2000 | 4050 | m3 |
| Humidity (h) | 0.72 | 0.72 | (-) |
| Evaporation | 16,200 | 29,940 | mm |
| δ18O Balance | |||
| δP | −6.51 | −6.64 | ‰ |
| δL | −4.27 | −3.88 | ‰ |
| δLs | −4.27 | −3.35 | ‰ |
| α+ | 1.01 | 1.01 | (-) |
| ε+ | 10.8 | 10.0 | (-) |
| εk | 3.97 | 3.49 | (-) |
| δA (k = 0.86) | −15.7 | −15.7 | ‰ |
| δA (k = 0.92) | −16.3 | −16.3 | ‰ |
| δE (δA = −15.7) | −26.9 | −21.0 | ‰ |
| δE (δA = −16.3) | −25.3 | −17.3 | ‰ |
| δG | −7.07 | −7.07 | ‰ |
| Gi | 3800–4100 | 3600–4800 | m3/d |
| Go | 3500–3800 | 3100–4200 | m3/d |
| δ2H Balance | |||
| δP | −46.9 | −45.1 | ‰ |
| δL | −35.3 | −30.5 | ‰ |
| δLs | −35.9 | −32.9 | ‰ |
| α+ | 1.10 | 1.09 | (-) |
| ε+ | 97.9 | 87.2 | (-) |
| εk | 3.49 | 2.96 | (-) |
| δA (k = 0.86) | −120 | −112 | ‰ |
| δA (k = 0.92) | −126 | −116 | ‰ |
| δE (δA = −120/−112) | −125 | −108 | ‰ |
| δE (δA = −126/−116) | −123 | −94.5 | ‰ |
| δG | −57.9 | −57.9 | ‰ |
| Gi | 1900–2200 | 2100–2700 | m3/d |
| Go | 1600–1900 | 1600–2200 | m3/d |
Publisher’s Note: MDPI stays neutral with regard to jurisdictional claims in published maps and institutional affiliations. |
© 2021 by the authors. Licensee MDPI, Basel, Switzerland. This article is an open access article distributed under the terms and conditions of the Creative Commons Attribution (CC BY) license (http://creativecommons.org/licenses/by/4.0/).
Share and Cite
Förster, W.; Scholten, J.C.; Schubert, M.; Knoeller, K.; Classen, N.; Lechelt, M.; Richard, J.-H.; Rohweder, U.; Zunker, I.; Wanner, S.C. Phosphorous Supply to a Eutrophic Artificial Lake: Sedimentary versus Groundwater Sources. Water 2021, 13, 563. https://doi.org/10.3390/w13040563
Förster W, Scholten JC, Schubert M, Knoeller K, Classen N, Lechelt M, Richard J-H, Rohweder U, Zunker I, Wanner SC. Phosphorous Supply to a Eutrophic Artificial Lake: Sedimentary versus Groundwater Sources. Water. 2021; 13(4):563. https://doi.org/10.3390/w13040563
Chicago/Turabian StyleFörster, Wiebe, Jan C. Scholten, Michael Schubert, Kay Knoeller, Nikolaus Classen, Michael Lechelt, Jan-Helge Richard, Udo Rohweder, Isabell Zunker, and Susanne C. Wanner. 2021. "Phosphorous Supply to a Eutrophic Artificial Lake: Sedimentary versus Groundwater Sources" Water 13, no. 4: 563. https://doi.org/10.3390/w13040563