1. Introduction
Sustainable Development Goal 6.1 aims to achieve universal and equitable access to safe and affordable drinking water for all by 2030. To be considered safely managed, water supplies should be located on premises, available when needed and free of faecal and priority chemical contamination [
1]. Despite investments, municipal piped water infrastructures struggle to meet burgeoning water demands across much of urban sub-Saharan Africa [
2]. Economic growth, increasing urbanisation, and rising urban populations, coupled with growing user demands and industrialisation, is resulting in demands outpacing piped supplies in many towns and cities [
3]. This maintains a past pattern of declining access to piped water in cities across Africa [
4].
Heterogenous water supply infrastructures compensate for unavailable or intermittent piped public water supplies [
5]. The role of water vendors has long been recognised, but households also turn to other non-piped supplies, including commissioning the construction of their own boreholes, both for drinking water and other household uses [
6,
7,
8]. Where these supplies are located on household premises, they can contribute to securing safely managed water supplies. Demand for packaged water (sachets or bottles), is also rising in the urban areas of many countries [
1]. Many of the heterogeneous infrastructures depend on groundwater supplies. Typically described as a ‘hidden’ or ‘invisible’ resource [
9,
10,
11] the significance of groundwater resources for urban water supplies in sub-Saharan Africa has gone largely unremarked in policy circles, and the role of households own provision, or ‘self-supply, even more so [
7].
The premier source of cross-country comparable data on domestic water use is published by the World Health Organization (WHO) and the United Nations Children’s Fund (UNICEF) through the Joint Monitoring Programme (JMP). In this paper we examine the extent to which existing datasets that are used by the JMP can inform estimates of groundwater dependency for urban populations in sub-Saharan Africa, and the role of self-supply practices.
Section 2 examines the heterogeneity of domestic water supplies, describes self-supply use of groundwater including drivers and concerns, and introduces the available data on urban groundwater use in sub-Saharan Africa and its reported limitations.
Section 3,
Section 4 and
Section 5 respectively analyse available data sets for Lagos Stage, Nigeria, for Nigeria as a whole and for sub-Saharan Africa. In each section, we outline the methods and datasets used and explore the potential insights provided into domestic groundwater use and self supply. In
Section 6 and
Section 7 we consider the implications of our analysis and draw conclusions on the role of groundwater as a self-supply strategy by households. The terms borehole and tubewell are used interchangeably.
2. Literature Review
2.1. “Self-Supply” in Urban Domestic Water Supplies
Domestic water supplies in towns and cities across sub-Saharan Africa comprise a heterogenous mix of piped and non-piped supplies, with groundwater contributing to both [
3,
5]. Individual decisions on the choice of household water supplies reflect matters of availability, affordability, reliability or convenience [
12]. The minimum core obligations for the human right to safe drinking water requires that an adequate standard of living is ensured with respect to its availability, accessibility, affordability and safety for personal and domestic use [
13], with no prescription regarding who should provide the service or how. Availability, accessibility and safety are reflected in the Sustainable Development Goal, target 6.1 [
1].
Globally, domestic water sources are classified as ‘improved’ or ‘unimproved’ and whether they meet the standards for ‘safely-managed’ [
14]. The terms ‘improved’ and ‘unimproved’ are classified according to delivery modes (e.g., piped water on or off dwelling/yard/plot, boreholes, traditional wells, or tanker). Neither the classifications, nor service levels, consider who provides that service. Data on water supply investments has largely focused on investments made by the public and private sectors in piped water infrastructures [
14], with the significance of investments made by households and small-scale water providers only recently gaining attention [
15,
16,
17]. Investments by households in water infrastructures may mitigate the reported low levels of official capital investment in sub-Saharan Africa [
14], reflecting arguments that cities with high levels of water insecurity rely on community adaptation through self-provision of services [
18].
The tendency for populations to self-supply is increasingly recognised as an important element of domestic water supplies in certain contexts, particularly where publicly-provided water supplies are not present or regarded as unreliable [
12,
19,
20,
21,
22,
23]. Often presented as a rural phenomenon or a coping strategy for the urban poor [
21,
24,
25], the role played by middle- and upper-income urban households in sourcing their own water supplies is gradually being recognised [
7]. Using modelling techniques, it has been estimated that up to 79% of the total urban population of continental Africa could potentially supply themselves with groundwater, with the likely number estimated at 32% [
26].
Definitions of self-supply vary. It can refer to any water supply mainly financed by the users themselves [
8,
27]. Others use the term to refer to the exploitation of groundwater sources by households (shallow wells or boreholes) [
22,
26]. The US Geological Survey defines self-supply as the act of withdrawal of water from a groundwater or surface-water source by a user rather than it being obtained from a public supply (source cited in [
28]).). The question as to whether household purchases of water from water vendors, through water tankers or bottled or sachet water, should be considered as self-supply or not remains open.
2.2. Groundwater Use and Urban Self-Supply
One of the attractions of self-supply using groundwater sources is the relative proximity of the water supply to the home, which can be accessed at relatively low recurrent cost and, in some situations, with low upfront investments [
12,
29]. Where hydrogeology is favourable and drillers can provide services, such a supply is accessible to many households and can enable a relatively rapid response to rising demands. More broadly, groundwater aquifers provide long-term storage and can act as a buffer in times of drought [
23,
30,
31,
32,
33,
34]. Despite the discourse of a proliferation of self-supply boreholes in towns and cities across sub-Saharan Africa [
6,
8] empirical evidence of the extent of this practice remains sparse.
Past studies of groundwater self-supply and municipal piped water supply find that the two act as close substitutes [
35,
36,
37]. Households make choices between the groundwater sources and municipal water supplies based on price, relative availability and reliability of the supplies (including the number of hours it is delivered), convenience of collection, the cost of accessing the supply (such as connecting to the municipal water supply), the perceived potability, or associated risk of ill-health, of a particular water source, and the expected need for water in the future [
35,
36,
37]. Easy access to close substitutes of comparable, or potentially superior, quality has been found to dampen a household’s willingness to pay for improved piped water services [
37].
Studies of household characteristics associated with investing in groundwater supplies or piped supplies are rare, in comparison to studies of the quantity of water demanded. Increasing household income is associated with a preference for piped water supplies and a reduction in the likelihood that the household will use a well [
37]. However, higher income households that maintained their use of a well in conjunction with piped water supplies tend to use higher volumes of well water and consume more water than those who use just a well or a piped water supply [
35]. Where personal conjunctive use occurs, wells account for around 60% of the daily water supply [
35]. In part, this may be due to the low opportunity cost of groundwater, following the original investment, and its use for non-personal purposes (i.e., not for drinking, cooking or personal hygene). The cost of equipment, education levels and a household’s opinion of piped water were not found to be significant influences on the consumption of non-piped water sources [
37].
Industry can also substitute self-supplied groundwater for municipal supplies [
38]. Once a firm has made the decision to invest in groundwater supplies, the sources become close substitutes with adverse implications for the economics of public water supplies. Although the low marginal cost of groundwater may be good for company efficiency it can undermine revenue generation for piped water supplies and, if withdrawals are high relative to recharge, can impact on the sustainability of the local aquifer [
38]. The localised effects of industrial abstraction on domestic self-supply remain under-explored.
Groundwater is increasingly recognised as an important resource to meet urban water demands across sub-Saharan Africa [
6,
12,
39,
40] with a growing literature on the long-term sustainability of urban groundwater resources [
23,
30,
34,
41,
42]. However, understanding of the actual make-up of urban groundwater use remains rudimentary [
3]. In particular, the lack of visibility of self-supply boreholes in domestic water statistics and policies give rise to numerous concerns [
12,
17,
22,
23,
43], including:
The risk of jeopardising water security for future generations;
The risk of inappropriate policy development and regulation;
An underestimation of the socio-economic consequences of household investments;
A lack of public awareness campaigns regarding managing water quality;
Inattention to the role and skills of drillers serving this market.
Urban groundwater is susceptible to contamination from unregulated borehole development, especially in situations with poor waste management, multiple points of penetration of the aquifer, inadequate sealing of the borehole after construction and/or risks of saline intrusion [
12,
44]. Conversely, where groundwater is already polluted, particularly the shallow aquifers underlying urban areas, then groundwater users may be at risk of poor quality water supplies [
6,
45,
46].
Over-abstraction of groundwater is also a risk. While there has been no substantial decline in the volume of water stored in the major aquifer basins of Africa over the last 15 years [
30,
47], groundwater levels in some cities have fallen because of large-scale localised pumping [
6]. In many areas, including within sub-Saharan Africa, it has been suggested that limits to pumping may have already been exceeded, with effects delayed and not yet visible [
41]. The significance of household domestic water abstraction, and the extent of the population whose water supplies may be at risk, now or in the future is uncertain.
2.3. Available Data on Urban Groundwater Use in Sub-Saharan Africa and Their Limitations
The standard data source used for the global analysis of drinking water, including cross-country and temporal comparisons, are based on national surveys and census data. The UNICEF/WHO Joint Monitoring Programme (JMP) [
48] collects, collates, harmonises and analyses national survey and census data from all countries, with comparative data available through the JMP website (
https://washdata.org accessed on 17 February 2021). Detailed analysis of the original national survey data is also possible for many of the individual surveys upon application to the respective data managers.
Challenges that affect cross-country analysis of survey data include variations in the definition of ‘urban’ between countries and variations in sampling in urban informal settlements [
49], both of which impact the reliability of comparisons between countries [
50,
51]. Aggregate data can also hide localised spatial inequalities [
52]. Criticisms of the term ‘improved water sources’ as a proxy for water quality [
51,
53,
54] contributed to the introduction of the concept of ‘safely managed’ drinking water supplies. However, it has been suggested that the categories are now becoming so wide that they cease to be useful [
51]. The focus of many surveys on the ‘main source of drinking water’ is also questioned, as this may underestimate the proportion of population also using unimproved sources (as an alternative or conjunctive water supply) [
49,
55,
56]. Questions regarding the usefulness of focussing on the delivery mode rather than source of the supply (e.g., groundwater) have also been asked, as this may significantly underestimate the use of some water resources, most notably groundwater [
6].
There is also concern that key parameters which influence household water behaviours remain overlooked, including the intermittency, or reliability, of supplies [
46,
53]; the heterogeneity of water infrastructures used; who invests in (or owns) different water supplies; and affordability. This paper addresses one aspect of the acknowledged gap—groundwater use financed by households, through investment in boreholes.
3. Lagos State, Nigeria
3.1. Data Sources
We draw on two substantive surveys that are included in the JMP datasets: the Multiple Indicator Cluster Survey (MICS) (
http://mics.unicef.org accessed on 17 February 2021), and the Performance Monitoring for Action (PMA) (
https://www.pmadata.org accessed on 17 February 2021 [
57]). We have focused on Lagos State in Nigeria, as residents are known to use heterogenous water supply options (e.g., piped water, groundwater, water supplied by tanker/cart, packaged water and surface water). As Lagos State is commonly regarded as comprising only urban or peri-urban areas, we can also be sure that data refers to urban water users. Finally, previous research suggests that self-supplied boreholes provide an important component of urban drinking water supplies in Lagos State [
7], offering reassurance that survey returns should include sufficient sample numbers for robust analysis. We draw on a third dataset, which is the findings of an independent survey of a random sample of 539 residents of Lagos State undertaken in 2017 [
58]. The use of three datasets enables triangulation of data covering the same geography and topic for a similar period of time. We also considered the Demographic and Health Survey (DHS) (
https://dhsprogram.com/data/, accessed on 17 February 2021), but this cannot be used as the Nigerian data is not disaggregated at the State level but rather for larger regional groupings.
Our analysis is based on the MICS 2016–2017 and PMA 2018 surveys, including summary results reported separately by the statistical authorities. The PMA 2018 dataset for Lagos State contains 6696 respondents and the MICS 2016–2017 dataset contains 1856 respondents. In the PMA dataset all respondents from Lagos State are classified as urban, whilst in the MICS data 6% are classified as rural. The MICS focuses on the primary source of drinking water used by respondents. Where respondents report packaged water, a subsidiary question allows for a second source to be reported as the main alternative source of water used in their household. The PMA dataset reports on the main source of water used for drinking purposes, the main source of water used for other purposes (which can be the same source) and all other sources of water used. The independent survey explicitly considers the prevalence of privately commissioned domestic boreholes [
58].
3.2. Findings
MICS and PMA data show that the main source of drinking water in Lagos State is packaged water, most notably sachet water (
Table 1). The relative importance of groundwater supplies and piped water both as a primary source of drinking water and as a secondary water source differs strongly between the two surveys. The PMA consistently reports a higher use of piped water supplies than the MICS. Taking the PMA data as a minimum and the MICS data as an upper estimate, between 41% and 74% of residents in Lagos State rely on well water to a greater or lesser degree for either their primary drinking water supply or as a secondary source of drinking water (calculated by combining the number of respondents that report using well water source as their primary drinking water supply, and the number of respondents reporting using well water as an alternative to their primary use of packaged water). Of those households using groundwater as a primary or secondary source, boreholes were the most common means of access (by 85% of respondents to the PMA survey and 88% of respondents to the MICS survey).
The PMA and MICS data do not report on the proportion of non-piped water supplies, such as wells, that are located on the premises of households, nor do they consider occasional use. The Capstick survey [
58] illustrates a heterogeneity of sources of water supply, with community boreholes with handpumps used by very few respondents, and rainwater used by many as an occasional water supply. Capstick et al. [
58] also find that around two-thirds of respondents report using their own private borehole at least daily and a further 4% use it at least weekly (
Table 2). The Capstick survey [
58] does not distinguish between the use of water for drinking and other domestic purposes, but shows the tendency for households to make use of multiple water sources. PMA data shows that on average households report using two sources of water for drinking purposes, with some reporting up to five sources.
In order to assess the extent to which non-piped water supplies are located on the premises of the household, we analysed the MICS data, which provides information on the location of the main drinking water source used. Almost one-third of boreholes used are located in the dwelling or yard (
Table 3). Interestingly, public taps and standpipes were reported to be in the dwelling or yard/plot for 23.4% of respondents. Any public source located in the dwelling, yard or plot, raises questions about accessibility for those not residing there or indeed of the survey methodology. Where protected wells are used, these are more likely to be located in the dwelling or yard of the household (69.7%), whereas almost four-fifths of those using unprotected wells (79.2%) report that they are located somewhere other than their premises.
Some 44% of respondents report using non-piped drinking water supplies that are located on their premises (
Table 4). The main drinking water sources reported to be accessible in the dwelling or yard of the household are packaged water, i.e., sachet plus bottled, (70.6%) or a borehole (22.7%).
The previous analysis illustrates the importance of packaged water and boreholes for water supplies that are located on the premises. This is central to securing safely-managed water supplies as defined in SDG 6.1. Noting that packaged water, by default, has to be purchased, and transported, or delivered to the home, this does, however, raise a question as to whether it should be classified as available on premises.
The Nigerian National Bureau of Statistics, Lagos Bureau of Statistics and UNICEF [
56] have undertaken more detailed analysis of MICS 2016–17 data and find that whilst 93.6% of the surveyed population in Lagos State uses an improved water source, less than one tenth of this population (8.9%) had access to a safely managed water supply (
Table 5). No piped water supplies were categorised as ‘safely-managed’ and just 3.7% of boreholes were classified as ‘safely-managed’, primarily because they were not located on premises or because tested water quality did not meet the required standard. In contrast, all (three) protected springs/wells in the sample were categorised as ‘safely-managed’ as were most (of the seven) packaged water samples. However, the low sample numbers for piped water, protected spring/well and sachet/bottled water prevents statistical comparisons.
Table 6 examines the relationship between household wealth and reported drinking water source using the ‘urban wealth’ measure contained in the MICS survey. This measure is calculated according to the assets that respondents report are owned by the household. The data is grouped in quintiles at the national level.
The propensity to use sachet water is evenly reported across the three higher wealth quintiles. The use of sachet water by those in the poorest and second wealth quintiles is also considerable, although proportionately lower than the average for all respondents. Respondents from the richest quintile were more likely to report using bottled water as their main source of drinking water than the sample average. High use of bottled water is also the case for those who reported that their main source of drinking water came from tap water piped into their dwelling (
Figure S1).
For the different income quintiles, MICS data does not differentiate sources by their location on or off-premises, other than for piped water. Further analysis of the MICS 2016–2017 data shows that those in the richest quintile are most likely to have access to piped water in their dwelling. A higher level of education, higher numbers of rooms used for sleeping and homes that are owned by the occupant are three other factors also more often associated with access to water sources that are located in the dwelling rather than in the yard or elsewhere, but the relationship is not conclusive (
Supplementary Material Tables S4–S6). The Capstick survey [
58] demonstrate that home ownership is the most important predictor of borehole ownership. It found no association between borehole ownership and income, gender, age or household size.
The MICS data also allows more granular, spatial analysis. Within Lagos State, a strong spatial variation is evident in the distribution of drinking water sources. Data published by the Nigerian Bureau of Statistics [
59], using weighted data at the level of the three Senatorial Districts in Lagos State, shows that water piped into the dwelling tends to be more commonly reported as the main source of drinking water in the Senatorial Ward of Lagos East, whilst use of boreholes for drinking water is reported more frequently in Lagos West and Lagos East compared to Lagos Central (
Table 7).
4. Nigeria
4.1. Data Sources
The 2019 JMP country file for Nigeria compiles data from 34 surveys of drinking water use undertaken between 1990 and 2018 (
Table S7). Of these, 26 include data pertaining to well use (i.e., boreholes/tubewells and hand dug wells) in urban areas for the whole country. Since 2006, there has been at least one national survey per year. Some surveys are part of a regular sequence while others are unique or infrequent. Two national censuses have been undertaken within the timeframe. We analsysed the datasets to assess consistency of results, the trend for urban groundwater use and the level of self-supply.
4.2. Findings
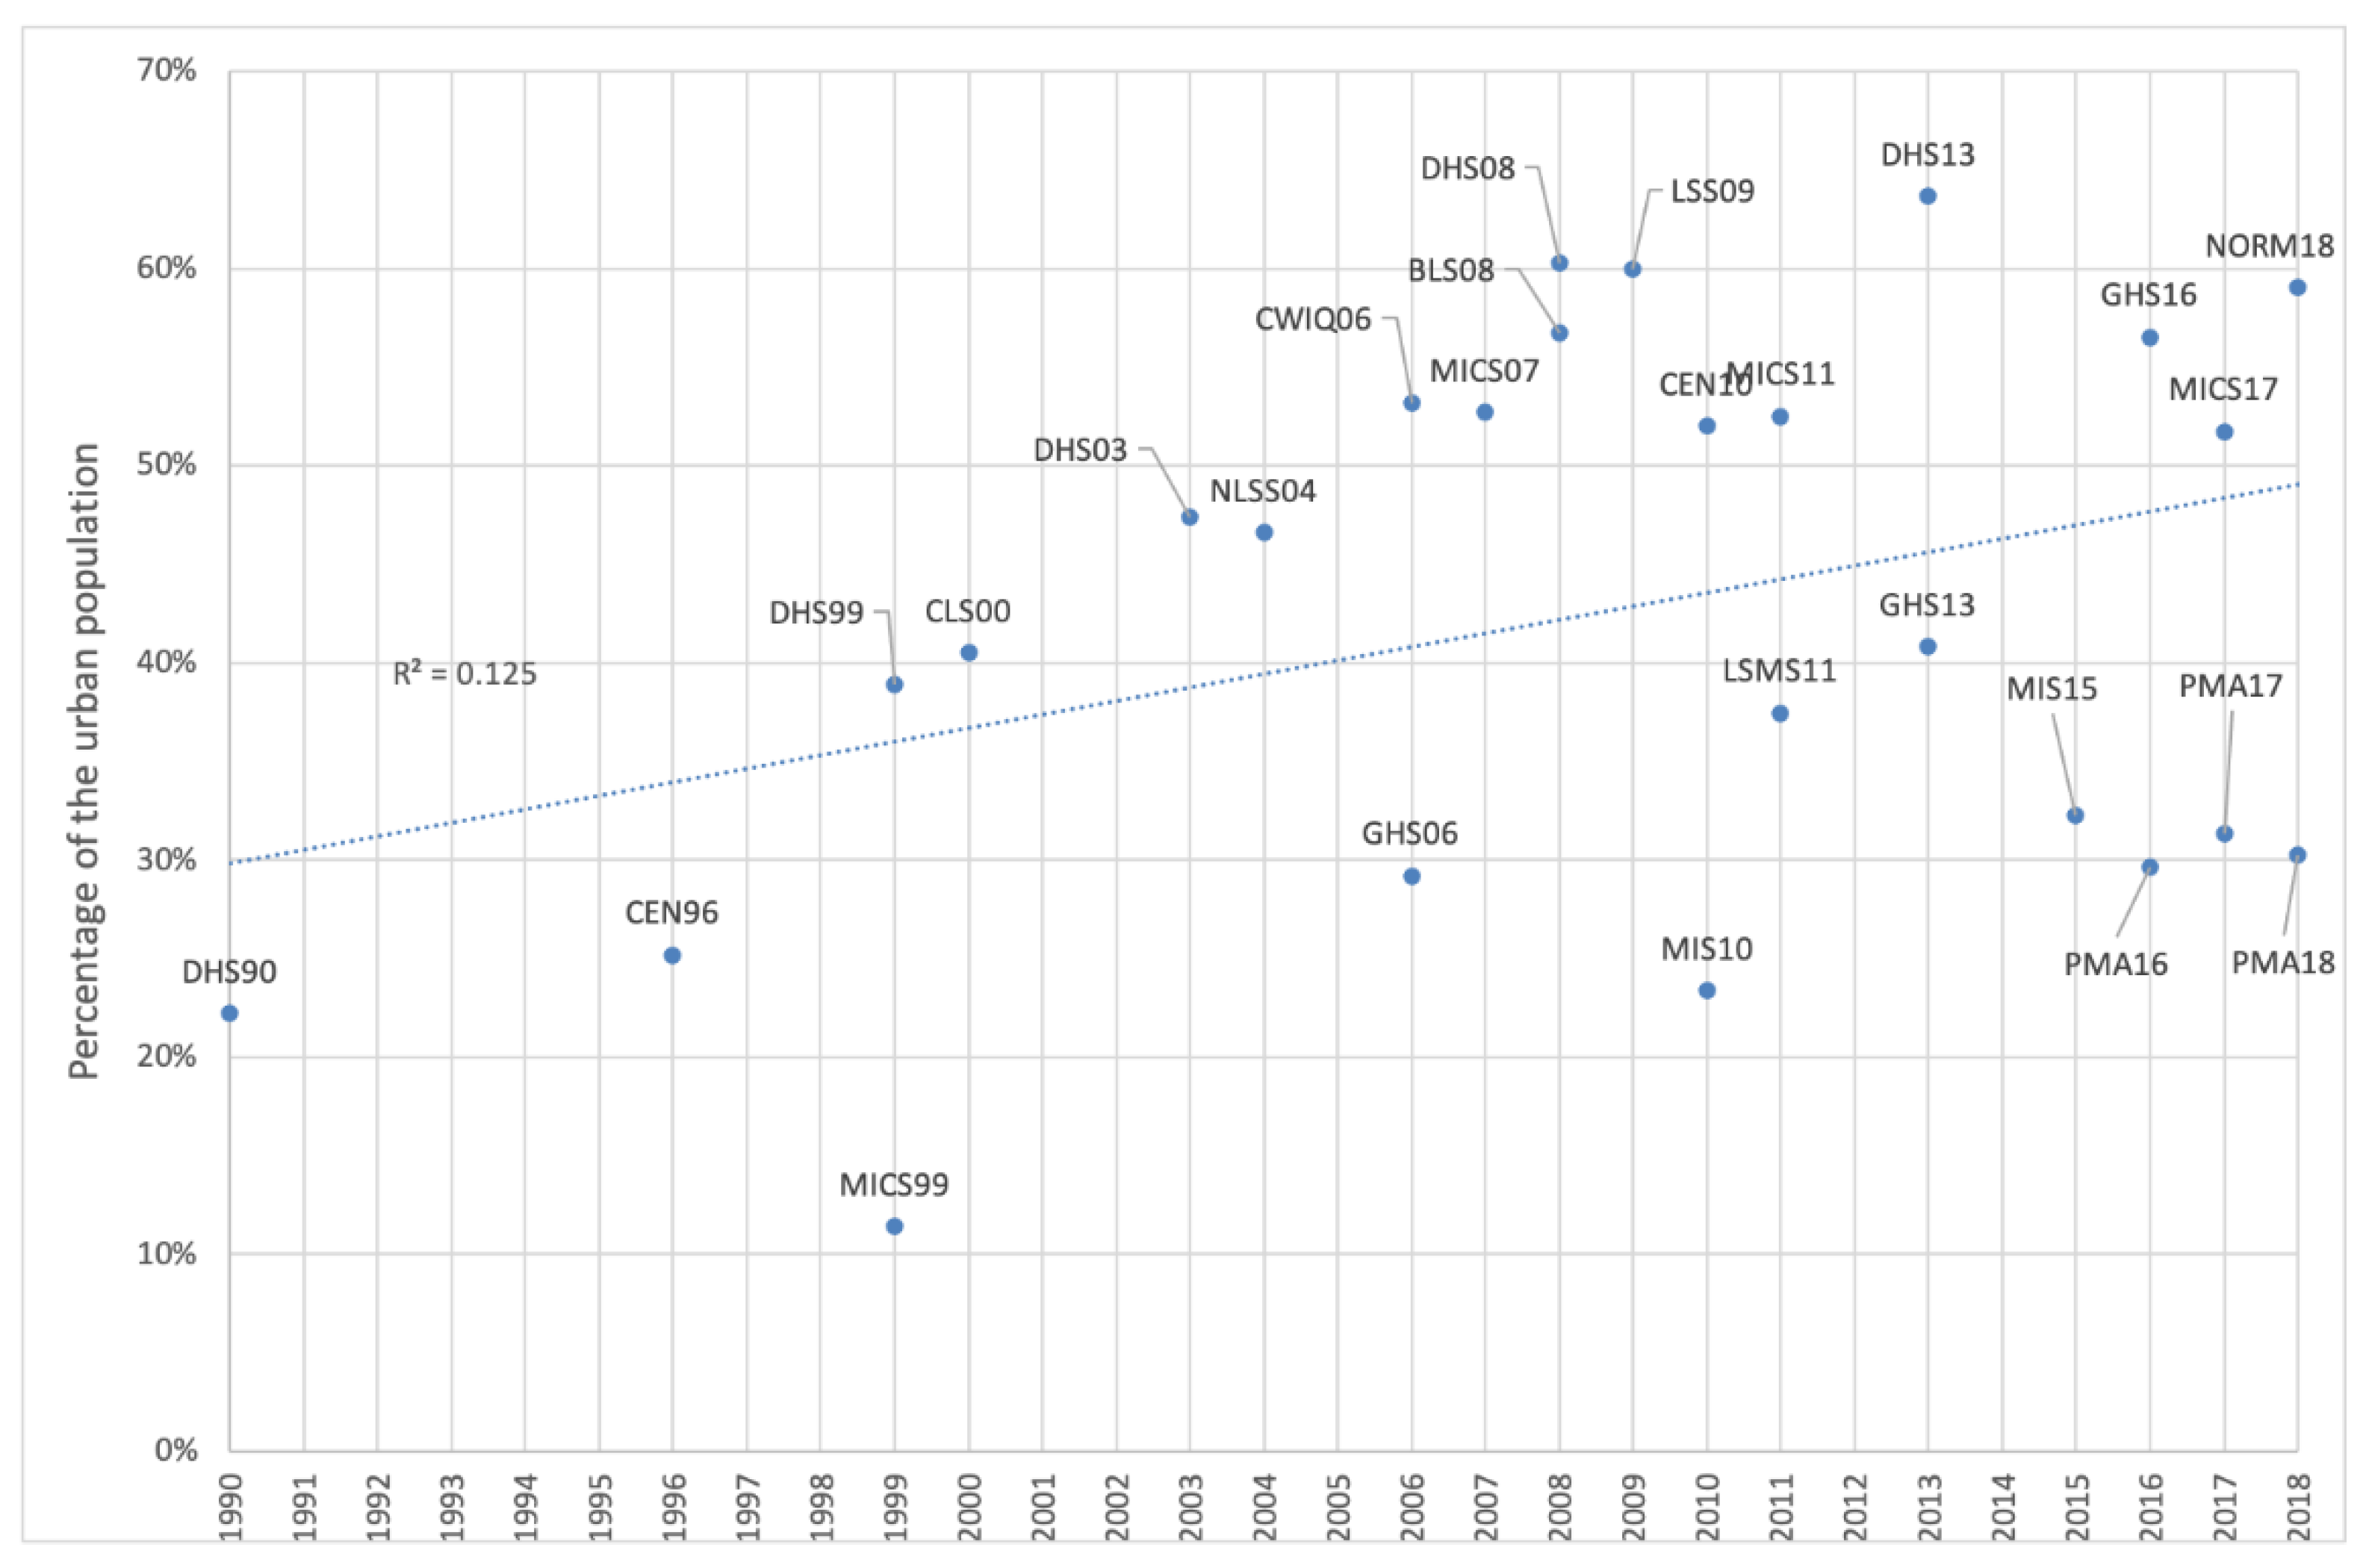
Figure 1 plots data on the urban population of Nigeria using wells as their main drinking water source from 1990 to 2018. In order to visualise trends, moving average trendlines have been plotted for all data sets that have at least two data points, i.e., Census (CEN), MICS, DHS, General Household Survey (GHS), PMA and Malaria Indicators Survey (MIS). With the exception of the PMA, all show an increase in the use of wells by the urban population over time, but with significant variations between and across the surveys. Notably:
The MICS data shows an increase in well use up to 2006, after which its reported use remained fairly constant by about 52% of the urban population.
The DHS, MICS, GHS and Census data indicate that between 2010 and 2017, between 52% and 64% of the urban population used wells as their main drinking water source.
Both the MIS and PMS data estimate considerably lower reliance on wells, at between 30% to 32% of respondents.
The difference between the PMA and MICS for Nigeria (of 20 to 30 percentage points at similar points in time) is consistent with the variation observed for Lagos State. Such large variations raise questions about the reliability of sampling frames and/or definitions for water source and emphasises the challenges of drawing conclusions from the data available.
Figure 2 plots all of the data points, irrespective of which dataset they belong to. It illustrates the considerable difference in survey results for the same years. The linear trendline suggests an increase in urban groundwater use, but, the R
2 value of 0.125, highlights the considerable variation in the data.
Further analysis of MICS 2016–2017 data for Nigeria (as the closest to the trendline) suggests a strong tendency towards self-supply. More than half of wells used as the main source of drinking water are reported to be located in the dwelling or yard of the household concerned (protected wells, 54%; unprotected wells, 52.2%), and almost a quarter (22.5%) of boreholes used as the main source of drinking water are reported as located in the dwelling or yard of the household. Of those drinking water services reported as located in the dwelling or the yard of the householder, sachet water is most commonly reported (30% of all on site sources), followed by a borehole (25.6%) and protected wells (19.9%). For full tabulations see
Tables S8 and S9.
5. Sub-Saharan Africa
5.1. Data Sources
To set the analysis in a wider context, we have examined data published by the JMP for sub-Saharan Africa ([
1];
https://washdata.org/ accessed on 17 February 2021). As illustrated for Lagos State, and Nigeria as a whole, a significant variation in the proportion of the urban population that reports using a particular drinking water source can be observed between different surveys. To limit the effects of this variation, we have taken the average of the two most recent datasets for each country where available (
Table S10). In most countries, the variation in reported drinking water sources between the two surveys is less than 10%, however, for ten countries there is a difference of more than ten percentage points (
Table S11). In 13 countries there is only one recent survey, and in these cases we make use of this source only.
5.2. Findings
The 2019 JMP Report [
1] states that between 2000 and 2017 the proportion of the urban population of sub-Saharan Africa with access to improved drinking water supplies increased from 78% to 84%, with the proportion using safely-managed drinking water supplies increasing from 42% to 50%. Over the same period, the proportion of the urban population in sub-Saharan Africa reporting that their main drinking water supply came from piped supplies fell from 65% to 56%, whilst the proportion reporting their main source of drinking water came from improved non-piped supplies rose from 22% to 32% [
8]. Non-piped drinking water supplies are predominantly from groundwater sources, followed by packaged water and other improved sources such as carts and tankers (See
Figure S2).
The rise in the proportion of the population relying on non-piped water as their main drinking water supply, and the fall in the proportion reporting use of piped water, is not evenly spread across Sub-Saharan Africa. Of the 51 countries for which data is available, 20 recorded an increase in the proportion of their urban population using piped water supplies as their primary source, while in 20 countries, there was a decrease (
Figure 3). During the same period, the proportion of the urban population accessing improved drinking water supplies from non-piped sources increased in 24 countries and fell in 13. There is no single route to an increase in the use of improved drinking water supplies. Of the 31 countries where the proportion of the population accessing improved drinking water supplies increased, this was dominated by increases in piped supplies in 15 countries, whereas in 16 countries it was dominated by increases in non-piped supplies.
Analysis shows that, overall, a quarter of the urban population of sub-Saharan Africa rely on groundwater point sources for their main drinking water supply. Again, this is not evenly distributed. In ten countries (South Sudan, Sierra Leone, Central African Republic, Chad, Liberia, Nigeria, Equatorial Guinea, Togo, Uganda, Guinea-Bissau), more than 40% of the urban population rely on groundwater point sources (
Table S12). Together these 10 countries comprise some 30% of the estimated urban African population [
1].
Similarly, use of boreholes as the main source of drinking water is also unevenly distributed across sub-Saharan Africa. Use ranges from less than 5% of the urban population in Namibia, South Africa and Botswana, to more than 25% in, Nigeria, Liberia, Togo, Chad and South Sudan (
Table S12, Figure S3). In 15 of the 40 countries (36%) for which data is available, more than 10% of the urban population reported boreholes as their main drinking water supply (
Table S13, Figure S4). Survey data on the extent of private boreholes (a proxy for self-supply boreholes) is only available for the three countries of Lesotho, Namibia and South Africa, (where they are estimated to serve 0.6%, 0.1% and 0.3% of the total urban population respectively).
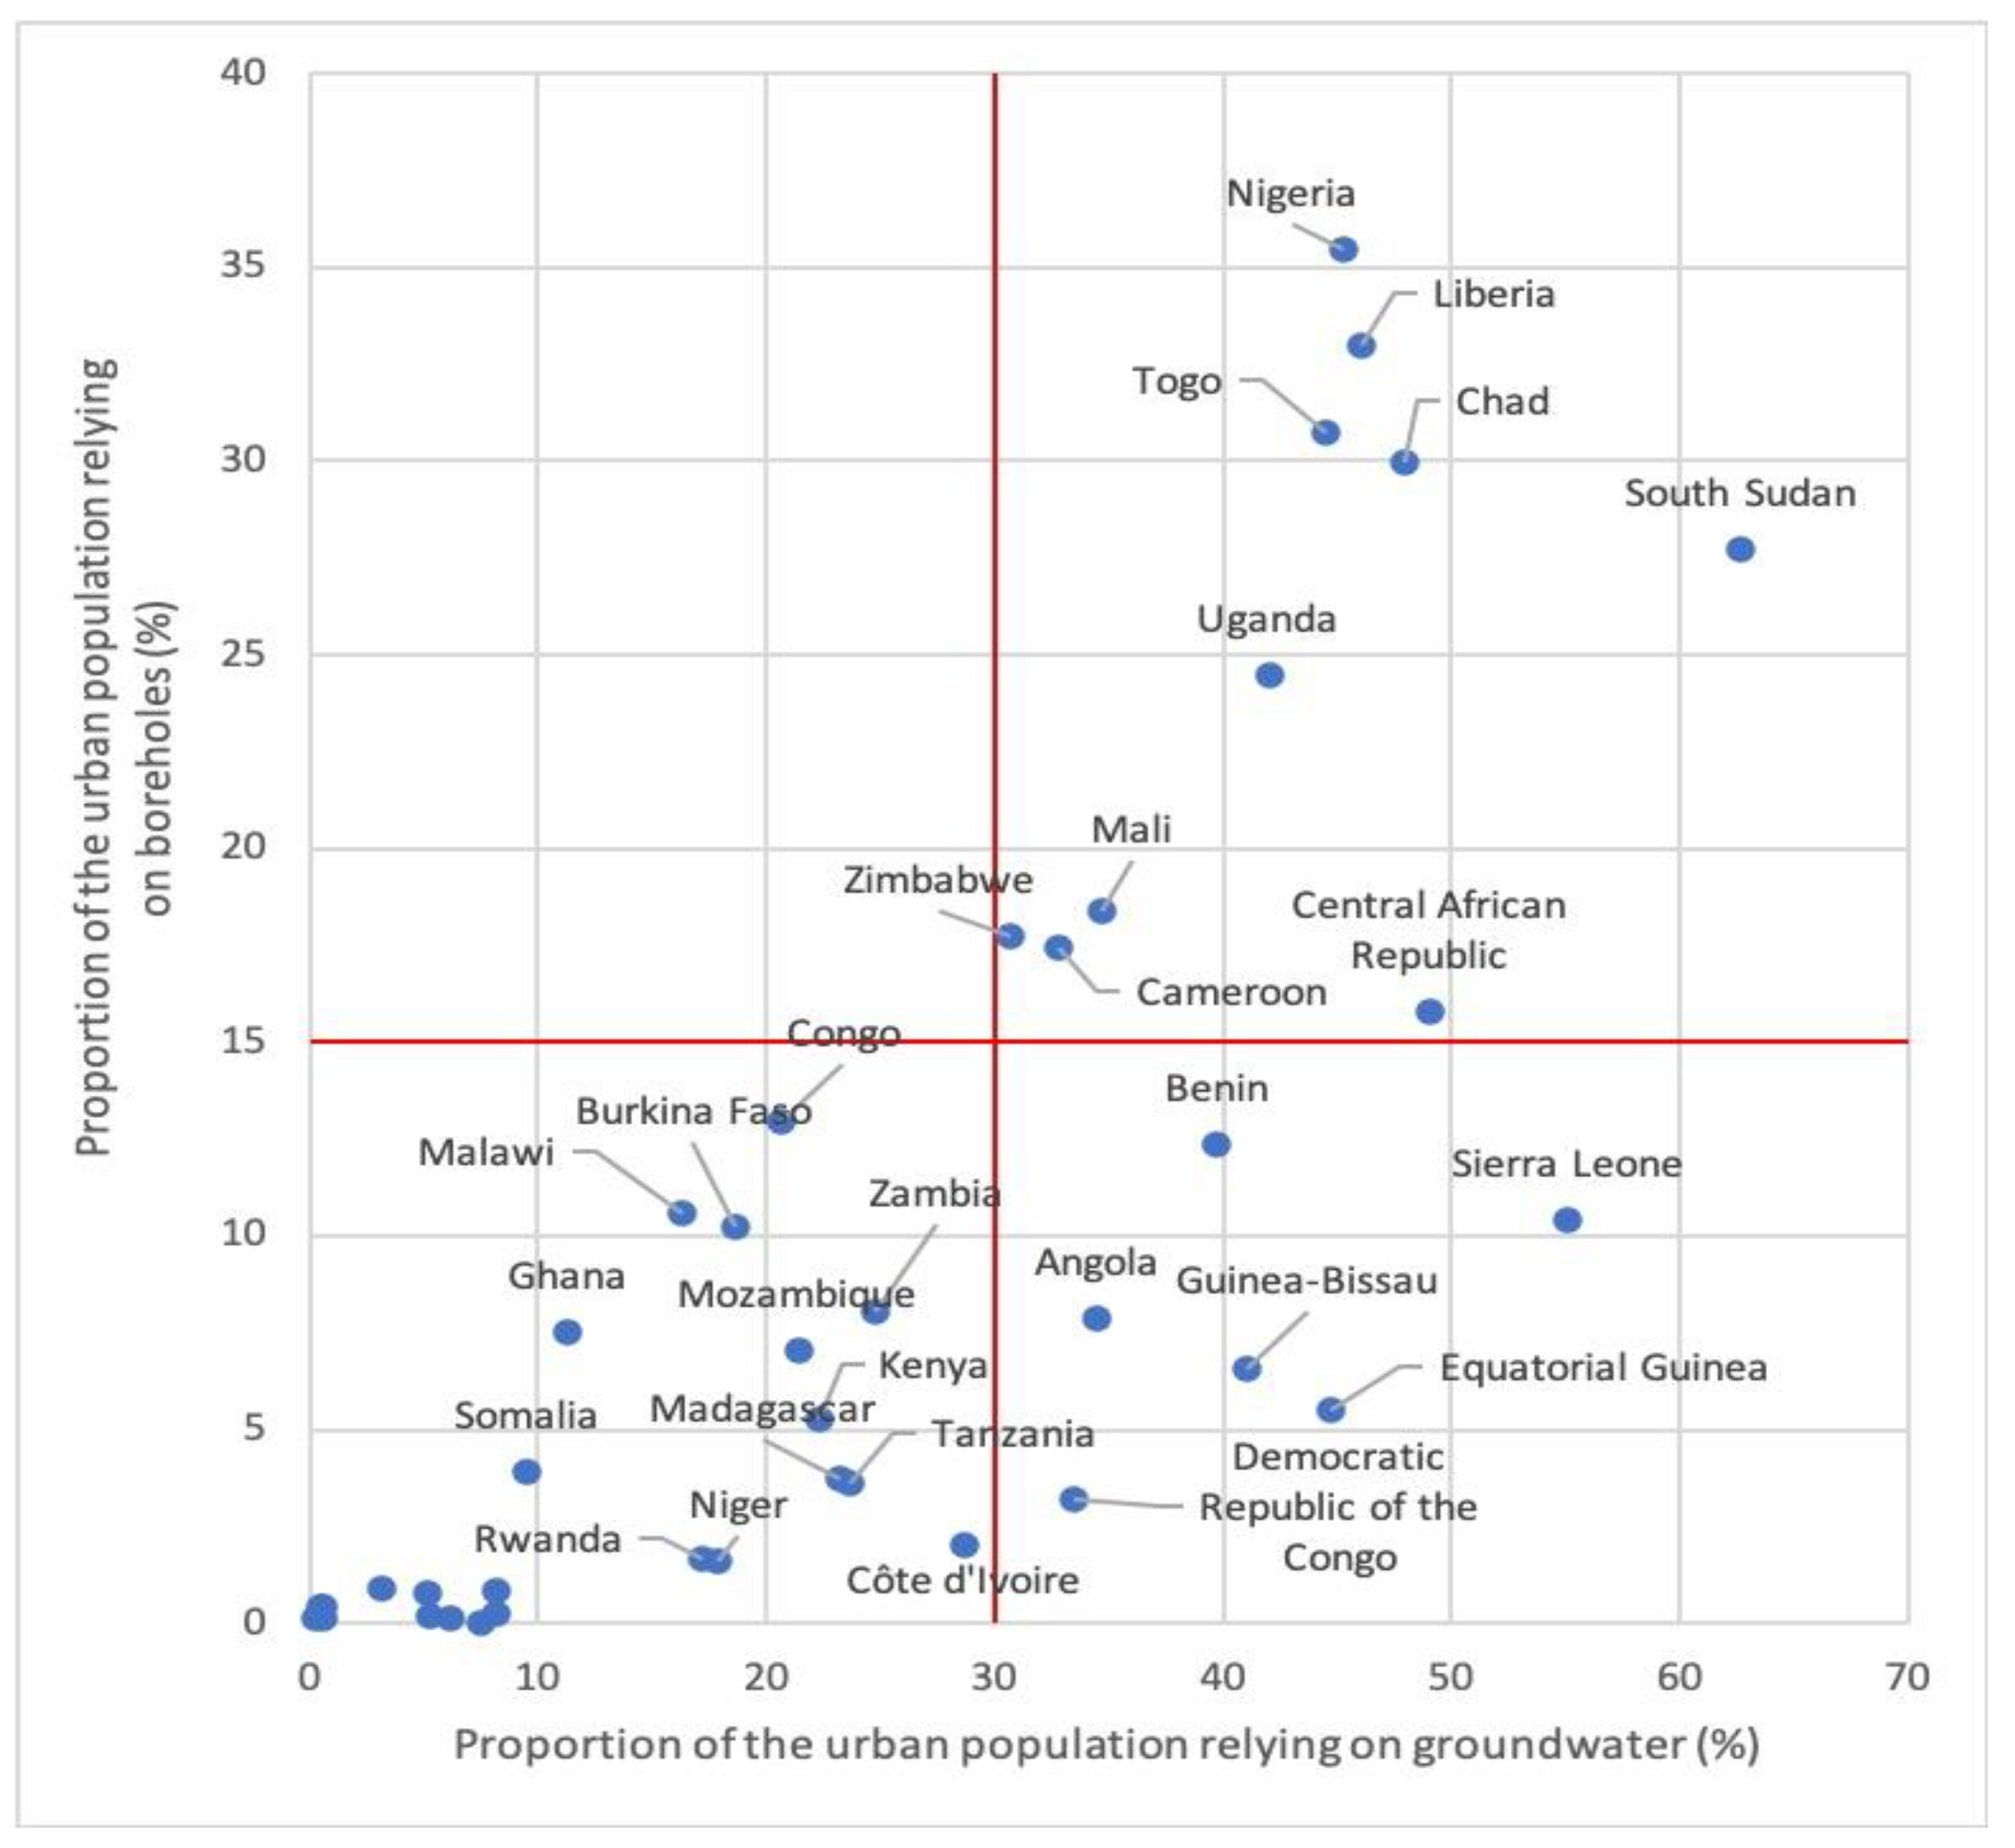
In
Figure 4 we plot the use of boreholes against the use of ‘groundwater point sources’ among urban populations. We have set an indicative frame, proposing that where more than 30% of an urban population in a country relies on groundwater point sources for their drinking water this constitutes a high level of groundwater usage. Similarly, where more than 15% of an urban population uses a borehole as their main source of drinking water this represents a high level of borehole development. Both these figures are slightly above the calculated simple average (Groundwater: 24.6%, Borehole: 9.47%).
In 10 countries, the use of groundwater point sources for drinking water and the use of boreholes as a means to access this groundwater are both high. In contrast, in six countries. the proportion of the population relying on groundwater is high, but there is less reliance on boreholes. In these countries, traditional and protected wells, as well as springs, are important sources of drinking water. In 24 countries, groundwater is reported as the primary source of drinking water by less than 30% of the population and boreholes used by less than 15% of the population to access this groundwater. We suggest, that self-supply groundwater use in in the group of 10 countries with high groundwater use and high borehole use is also likely to be high, and that there is considerable potential for self-supply groundwater use in the group of six with high groundwater use but low borehole use.
6. Discussion
In this paper we have examined the extent to which existing datasets can inform estimates of groundwater dependency for urban populations in sub-Saharan Africa and in particular the significance of self-supply as a contribution to domestic water supply. Our analysis suggests that, despite the known limitations of these data sources, important insights can be derived from the available data. These have implications for the governance of urban water supplies. Our analysis provides insights into water use as well as the reliability of the datasets themselves. Both have implications for policy and practice.
Turning first to the datasets. A high degree of variability has been found between different surveys, even when undertaken in the same geography at similar times. The difference between surveys is particularly noticeable for the proportion of the urban population using groundwater or piped water supplies. This suggests that the sampling methodology, and/or sampling frame are leading to inconsistent returns. In the case of Lagos State, the fact that data on the use of packaged water consistent across the samples, may point to the importance of local geographic variations in the use of groundwater and piped water supplies. This is illustrated by the differences in water sources used between Senatorial Districts in Lagos State. More rigorous sampling methodologies and sampling frames that are spatially-aware, are required if policy-makers are to have access to robust and reliable evidence on which to base policy making for urban water supplies.
Our analysis has also illuminated the incomplete data available on the use of urban groundwater sources, particularly boreholes. In particular, unlike for pipled supplies, there is very limited consideration of the extent to which these are located on or off premises. This information is particularly important in those countries where urban groundwater use is significant. As with piped water supplies, all datasets that feed into the JMP should report whether a groundwater source provides water to the dwelling or to the yard, or is located elsewhere. This would support policy-makers improving their understanding of the extent of self-supplied groundwater, and contribute to an understanding of the contribution groundwater sources make to safely-managed water supplies. It would also be of value to policy-makers seeking to assess the extent to which different water sources act as substitutes in urban water supplies.
Despite the data limitations, analysis demonstrates an increasing prevalence of non-piped water supplies in many parts of sub-Saharan Africa. Our analysis also indicates the importance of self-supplied groundwater sources as a contribution to the heterogeneity of urban water supplies. In Lagos State, up to one-fifth of the population may be drawing their domestic water supplies from a self-supplied borehole, with additional use of the boreholes of neighbours. Evidence from an ad hoc survey supports this finding. In Nigeria, more than half of wells used as the main source of drinking water are reported to be located in the dwelling or yard of the household concerned. Further research is required to overcome the range of uncertainty in existing datasets, but our preliminary analysis suggest that urban self-supply through boreholes may be significant in at least 10 countries in sub-Saharan Africa, and could potentially be significant in a further six. In these locations, the implications of large-scale domestic water abstraction through self-supplied groundwater for the sustainability of urban groundwater, water quality and the affordability of municipal water supplies will be particularly important. Further research is required to confirm these findings.
From the evidence available, the use of packaged water and self-supplied groundwater is making a valuable contribution towards achieving access to safely-managed drinking water services. Limited survey data suggests that boreholes located on domestic premises tend to provide a reliable supply of improved water that is available when needed. Limited data also suggests that, in the case of Lagos State, contamination of this source is less often than is the case for public piped water supplies. This may owe more to household water storage practices than to contamination of the groundwater resource itself (for a wider discussion of this point see Bain et al. [
60]), or the finding may be influenced by the samling frame. However, this does suggest that household are a core actor in the delivery of safely-managed water supplies, and should be the target of policy-efforts to promote good water management practices.
The drivers of groundwater urban self-supply as part of a heterogeneous water mix are difficult to ascertain from the datasets available. In part, this may be due to some datasets focusing on primary drinking water sources, which we have illustrated under-represents overall use of some sources of water supply. Our analysis indicates that self-supplied groundwater, at least in Lagos State, is not solely the preserve of the most wealthy, but wealth may influence whether a source is accessible within a dwelling. Our analysis of the location of non-piped water supplies in Lagos State also finds that education level, home ownership and the number of rooms used for sleeping are associated with the extent to which water supplies are available in the dwelling, but further research is required to examine the strength and significance of this. More detailed analysis of the country surveys that underpin the JMP datasets may provide one means to do so, bearing in mind variations in survey approaches and definitions.
On the basis of the evidence available, we suggest that rising incomes across urban sub-Saharan Africa will lead to an increasing tendency for households to invest in self-supplied water sources on their own premises. In places where groundwater sources are regarded as close substitutes for piped-water supplies, the effects of further investment in household self-supply on groundwater reserves, and the economics of public piped infrastructures, requires monitoring by urban planners and water authorities. In doing so, authorities will need to be cognisant of the wider demands on urban groundwater reserves, particularly through industrial abstraction and for groundwater dependent eco-systems.
The practice of urban self-supply will most likely continue to be unevenly distributed across sub-Saharan Africa. Geography matters both at the intra-urban scale and the national scale. Whilst groundwater and piped water supplies can be close substitutes, our findings suggest that conjunctive use is a subset of practice at the household level. On the ground, the availability of piped water supplies and of groundwater form discrete and distinct geographies. This variegated urban waterscape presents challenges to estimating of groundwater supplies, even of assessments of aquifer capacity were available as demand also varies. There is need for more granular data and analysis, not only nationally, but more locally in order to inform policy. This reinforces our call to adopt spatially-informed sampling methodologies and sampling frames.
7. Conclusions
Non-piped water supplies, including groundwater point sources, play a critical role in contributing towards the highest level of the SDG 6.1 water target of a safely-managed drinking water supply in urban settings. Current evidence suggests that there are no signs of this trend abating. However, existing datasets, most of which focus on the main drinking water supply, do not provide adequate information, with sufficient numbers, to provide a true picture of groundwater dependence. Further, a key groundwater actor, the individual household, is largely overlooked by officially reported data.
One of the novelties of this multi-scalar approach is that it enables a granular understanding of different, large-scale datasets. The marked variation in reported use of water supplies raises questions about credibility of the data being presented for urban settings. As policy-makers press on towards achieving SDG 6.1, it is imperative that there is confidence in the data on which policies are based. A more spatially-informed approach could strengthen the development of appropriate policy measures. Equally, official datasets overlook the contribution being made to urban domestic water supplies through self-supplied water sources that are available on the premises of the householder.
Our analysis has demonstrated the significant role played by groundwater in domestic water supplies, both for drinking purposes and other domestic uses, and the important contribution of domestic boreholes. The importance of packaged water suggests that households are also transferring their water demands to privately-sourced water supplies. The contribution of packaged water to urban groundwater demands is a topic that merits further research.
Does ownership of water supplies matter? In the global effort to promote universal access to safely managed drinking water supplies, neither the mode of delivery nor its ownership is considered. However, households themselves are influenced by a desire to secure both reliable and trusted water supplies and evidence from other studies highlights how conjunctive use of piped and non-piped supplies increases overall water use per capita. Most households in Lagos State report reliable access to water, despite frequent news items of interruptions to domestic water supplies.
Analysis of the data reinforces the perception that households achieve water security through the use of multiple water sources, providing the ability to substitute alternative sources when their primary source is unavailable. By overlooking the crucial role played by non-piped drinking water supplies secured independently by households, both academia and policy-makers risk misjudging the future direction of drinking water supplies in low and middle income regions. Not only might this impact overall water demand and affect the affordability of water supplies, but an important opportunity may be missed to promote safely-managed water supplies through working with households directly.


