
Plant Nutrient Uptake in Full-Scale Floating Treatment Wetlands in a Florida Stormwater Pond: 2016–2020


Department of Plant and Environmental Sciences, Clemson University, E-143 P&AS, Clemson, SC 29634, USA
Water 2021, 13(4), 569; https://doi.org/10.3390/w13040569
Submission received: 26 January 2021
/
Revised: 16 February 2021
/
Accepted: 18 February 2021
/
Published: 23 February 2021
(This article belongs to the Special Issue Constructed Wetlands for Water Pollution Control in Urban and Rural Areas)
Abstract
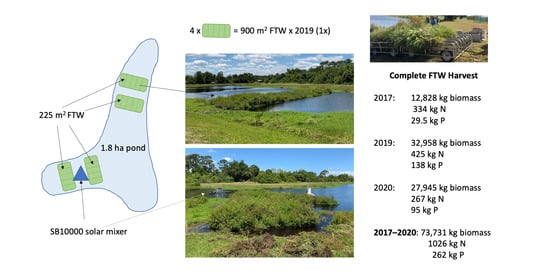
:Nutrient enrichment of surface waters degrades water quality. Municipalities need effective and economical solutions to remove nutrients from surface waters. From July 2016 to May 2020, full-scale (900 m2, 5% cover) floating treatment wetlands (FTWs) were deployed in Wickham Park pond, a eutrophic water body (0.13 mg/L total phosphorus (P), 0.96 mg/L total nitrogen (N)). The plants in FTWs in close proximity to a SB10000 mixer fixed N and P more efficiently. The rate of N (g/m2/year) fixed within tissues was highest for Juncus effusus (13.5), Agrostis alba (13.2), and Sagittaria lancifolia (12.1). The rate of P (g/m2/year) fixed within plant tissues was similar for all species (3.77, Agrostis alba, Canna spp., Iris hexagona, Juncus effusus, and Sagittaria lancifolia) save Pontederia cordata (2.52) volunteer species (1.41). The N and P removed with plant harvest were similar for non-mixed and mixed FTWs. Notably, the N:P ratio in plant tissues in 2017 (pre-mixer installation) was 11:1; after mixer installation (2018–2020), N:P ratios averaged 2.7:1, indicating increased P fixation within plant tissues. In 2017, 12,828 kg of plant tissues was harvested, removing 334 kg of N and 29.5 kg of P. In 2019, 32,958 kg of plant biomass was harvested from the pond, removing 425 kg of N and 138 kg of P. In 2020, 27,945 kg of biomass was harvested from FTWs, removing 267 kg of N and 95 kg of P. From 2016 to 2020, 73,000 kg of biomass was harvested, removing 1026 kg of N and 262 kg of P from Wickham Park pond. Knowing the total fresh biomass of tissues removed from FTWs at harvest is critical for accuracy in reporting nutrient removal aided by FTWs.
1. Introduction
The presence of excess nutrient, metal, organic, and pathogen contaminants often impairs the quality of surface and ground water [1,2,3,4]. Nutrient contaminants are of specific concern to inland and coastal communities due to the persistence, frequency, and consequences of algal blooms [5,6,7]. Algal blooms are an increasing problem in the USA, both inland and in coastal areas. In the USA, the state of Florida administers water resources at the regional level using five water management districts [8]. Among the water management districts’ core mission areas is water quality, specifically addressing water quality issues through various practices, including monitoring and restoration. Within the St. Johns River Water Management District, water quality efforts are coordinated among many partners, including the Florida Department of Environmental Protection. The partners are tasked with mitigating nutrients to ensure compliance with total maximum daily load and basin management action plan programs [9].
Constructed wetlands mitigate contaminants from water, whether of municipal, industrial, agricultural, or storm origin. Traditional constructed wetlands (free water surface and subsurface flow) are highly effective at removing nitrogen and, to some extent, phosphorus from stormwater [10,11,12,13]. The land area required to meet treatment goals and construction costs limits the feasibility of constructed wetlands in some populous regions [14]. Stormwater retention ponds are common across much of the USA. These ponds are sited in developed landscapes to capture and slow stormwater from specific catchment areas [15]. Floating treatment wetlands (FTWs) are constructed wetlands modified to float on the waters’ surface, enabling nutrient treatment without additional land loss to the treatment area.
Many studies report the efficacy of FTWs to remove nutrient contaminants at mesocosm scales at less than 12 months [16,17,18,19,20,21,22]. A few pilot-scale studies report the effectiveness of FTW deployed at larger scales (50 m2 or more of FTW) over 12 to 18 months [23,24,25,26] or 18 months or more [27]. Yet reporting changes in the concentration of nutrients within the water column alone may not sufficiently detail the capacity of FTWs to remove nutrients, as some studies report minimal changes in nutrient concentration in the water column after FTWs are installed [24,25,27].
Debate continues related to active (harvest) vs. passive (no harvest) management strategies for FTWs [28]. Some researchers report minor contributions of plants (Andropogon gerardii, Canna flaccida, Carex stricta, Hibiscus moscheutos, Juncus effusus, and Pontederia cordata) to total nitrogen (N, 13 to 28%) [19,24,25,29] and total phosphorus (P, 9 to 12%) [19,20,24,25] removal, with nutrient removal facilitated mainly by sorption to sediment, mineralization, precipitation, physical entrapment (rhizofiltration), and bacterial transformation processes [25,28]. Other researchers report that partial (typically plant shoots) or whole plant harvest contributes 55 to 74% of the N [20,22] and 42 to 60% of the P [20,22,29] removed from the water column (Canna flaccida, Juncus effusus, Iris pseudacorus, Pontederia cordata, and Typha angustifolia). Studies detailing the partitioning of nutrients within harvested plant shoots and roots report species-dependent differences in biomass allocations to roots and shoots [20,22,23,24,28,30,31]. Some species (Agrostis alba, Baumea juncea, Carex stricta) that preferentially partition biomass to root systems [24,31,32], whole-plant harvest may be critical to short-circuit internal nutrient cycling [22]. Yet, whole-plant harvest is not consistently practiced, even when FTWs are deployed for nutrient remediation purposes. Scaffold design often drives harvest strategies, as intensive FTWs are typically not designed for ease of harvest, whereas extensive FTW scaffolds are designed to be harvested [26].
The goal of this study was to quantify the mass of nutrients removed by plants installed in full-scale (900 m2) FTWs over four consecutive years. The total mass of nutrients removed by partial harvest (shoot clipping events) and complete harvest (shoots and roots removed) are quantified over four years. The intense plant sampling protocols used during the third year of monitoring are the primary focus of this article to better permit the quantification of nutrient uptake and removal from the pond contributed by individual plants, volunteer species, and the FTWs as a whole.
2. Materials and Methods
2.1. Site Details
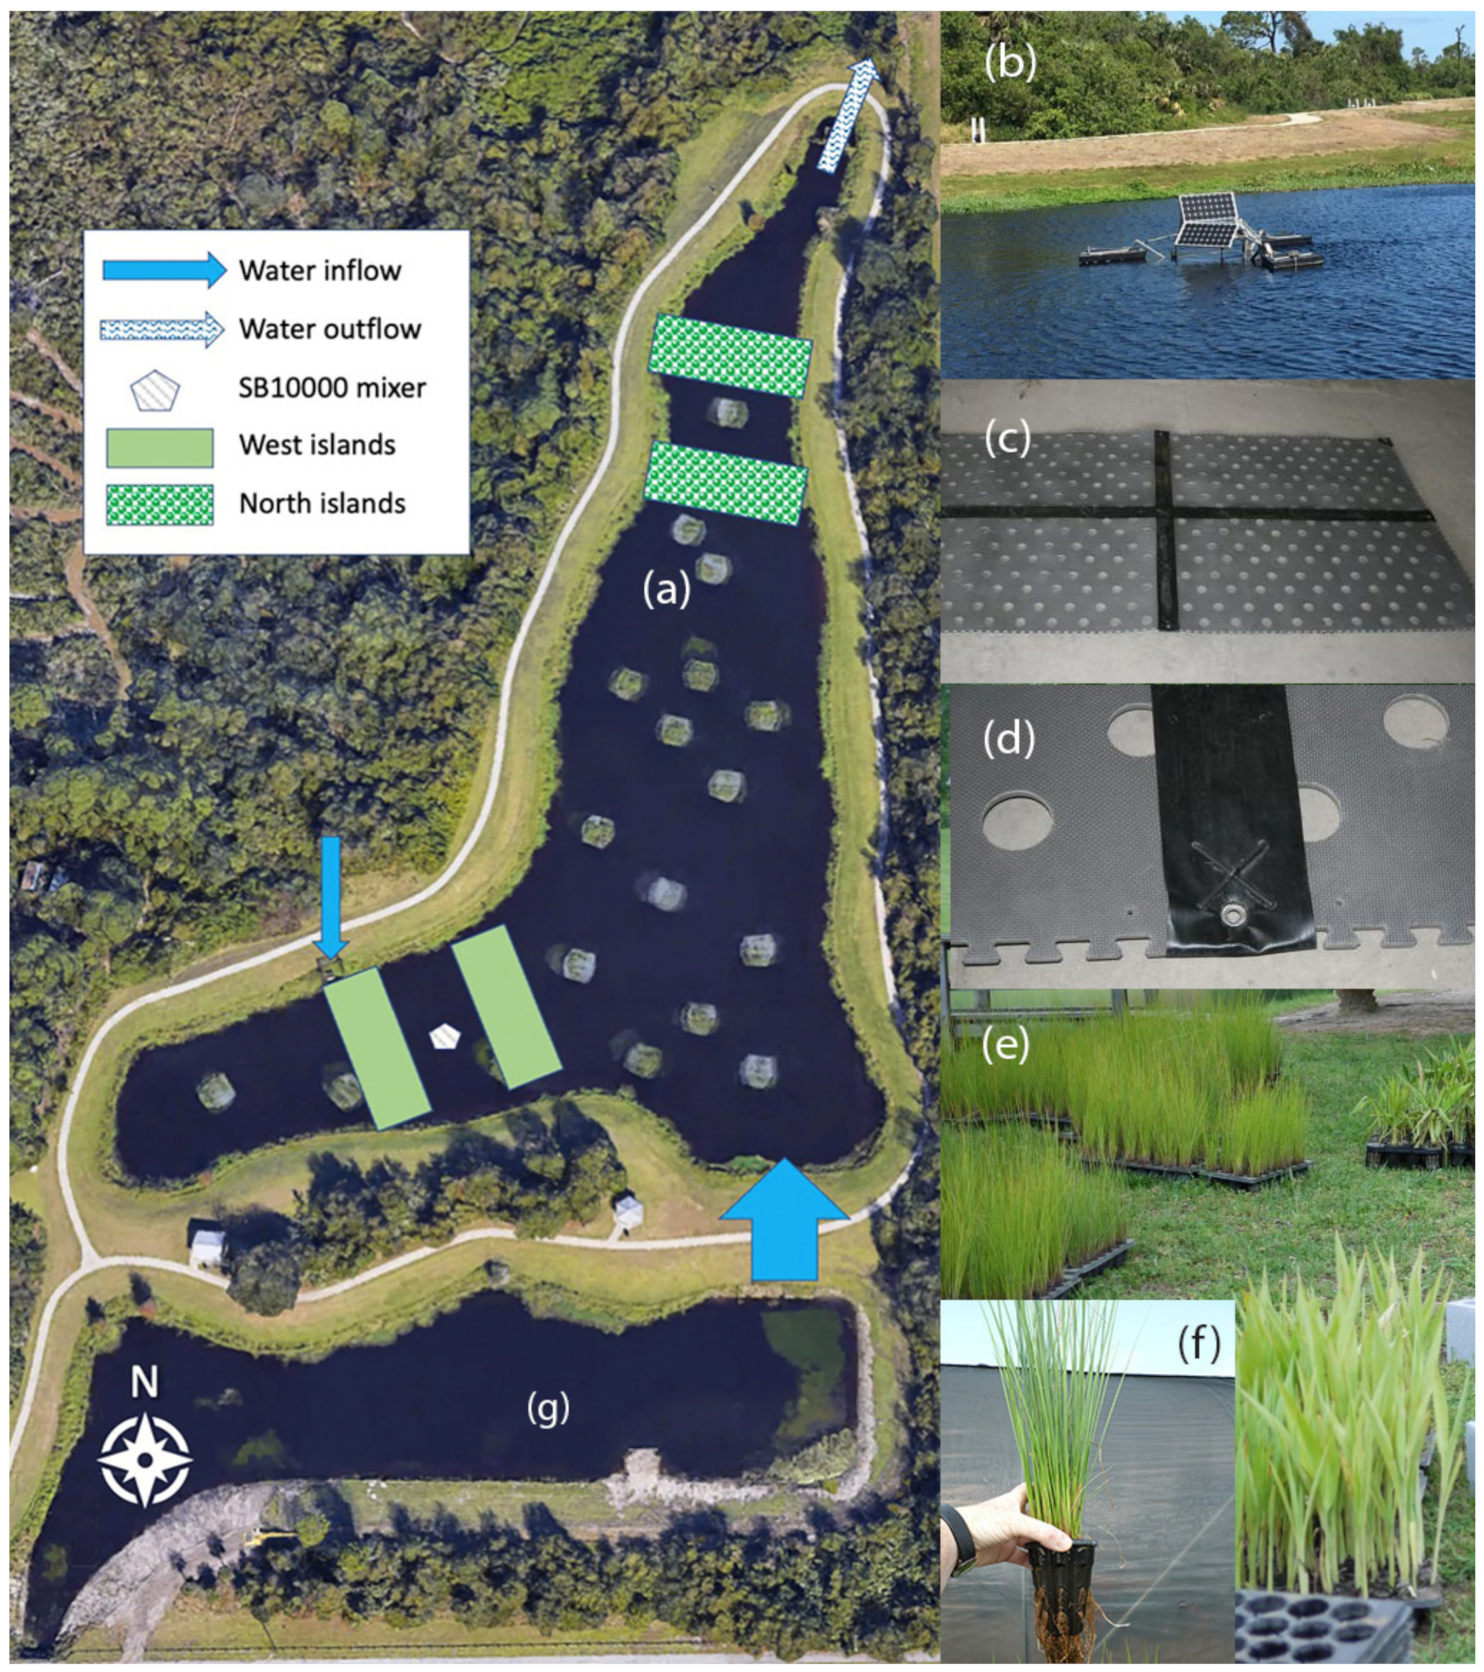
The Wickham Park Pond (1.8 ha, 28°9′32.37″ N, 80°39′22.59″ W) in Brevard County, Florida, USA, receives stormwater runoff from a drainage basin that is 1086 ha (Figure 1a). The pond outflow discharges into Horse Creek that eventually flows into the Indian River Lagoon Estuary, one of the most biologically diverse estuaries in the continental United States with 4300 documented species of flora and fauna. Water quality degradation in the Indian River Lagoon influences ecosystem health and is a key factor driving the economic health of the east–central Florida coast. Water flows into this pond through five 1.2 m reinforced concrete pipes in the southwest corner of the pond (primary inflow point) and one 1.2 m reinforced concrete pipe on the north bank of the westerly arm of the pond (secondary inflow point). This pond was not pre-monitored for inclusion in the 319 (h) grant; only one water quality sample (13 September 2018) was collected from this site between 2016 and 2020. The water sample was submitted to Environmental Conservation Laboratories, Inc. (ENCO Laboratories, Orlando, FL, USA), a NELAC certified laboratory (ISO/IEC 17025:2005 and ISO/IEC 17011:2004). The water sample contained 0.13 mg/L total phosphorus, 0.079 mg/L orthophosphate-P, 0.96 mg/L total nitrogen, 0.052 mg/L nitrate-N, 0.035 mg/L nitrite-N, and 0.0073 mg/L ammonia-N.
2.2. Floating Treatment Wetlands: 2016–2018
From July 2016 to March 2018, 19 FTWs (Beemats Floating Wetlands, New Smyrna Beach, FL, USA) were deployed in the pond, covering 900 m2 (0.09 ha) or 5% of the pond surface area. FTWs were planted at 26.6 plants per m2 (24,000 plants total). These FTWs were harvested and replanted twice during this period. On 6–7 October 2016, Hurricane Matthew passed 20 miles east of the Wickham Park pond, and some of the FTWs were damaged by the high winds. The damaged FTWs were repaired and replanted in October 2016. In early July 2017, whole plants were harvested from the FTWs with total fresh plant biomass removed of 12,828 kg. Composite plant tissue samples, incorporating plant tissues from each FTW, were submitted to ENCO. Sample analyses included percent dry weight (plant dry weight divided by fresh weight = % total solids), total Kjeldahl nitrogen (TKN, hereafter, N), and total phosphorus (P). Based on nutrient analyses, the mass of nitrogen (N) and phosphorus (P) in plant samples was multiplied by the total fresh biomass harvested. By harvesting the plants, 371 g N/m2/year and 32.8 g P/m2/year were removed from the Wickham Park pond. The 19 FTWs were replanted in July 2017 and then harvested in March 2018; nutrient analyses were not conducted after the second harvest.
2.3. Floating Treatment Wetlands: 2018–2019
2.3.1. Experimental Setup
On 19 March 2018, a SolarBee SB10000 floating mixer (Medora Corporation, Dickinson, ND, USA) was installed in the western arm of Wickham Park pond (Figure 1b) to increase mixing within the pond. The western arm of the pond has only one pipe for water entry; thus, it was hypothesized that installing the floating mixer would enhance mixing (and thus nutrient uptake) in that arm of the pond. The mixer was capable of enhancing mixing throughout the pond, despite being located in the less-mixed arm of the pond.
From 14 to 16 April 2018, four FTWs (BeeMats Floating Wetlands, New Smyrna Beach, FL, USA) were placed on the pond, and the plants were installed. Two FTWs (225 m2 each) were installed in the western arm (mixed treatment) and two (225 m2 each) in the northern arm (non-mixed treatment) for a total of 900 m2 of FTW installed or 5% pond cover. Each FTW consisted of 78–1.2 m × 2.4 m solid core foam mats with interlocking, puzzle-cut edges. Connections at the edges of each mat were reinforced using nylon clips and washers, permalon plastic, and bonding glue (Figure 1b). At the anchor points for each mat, a stainless-steel grommet was inserted through the permalon plastic to increase the length of time the FTWs can be deployed with minimal structural damage.
Six species of plants were planted within each FTW: Agrostis alba (red top bentgrass), Canna spp. [Canna flaccida (golden canna) and Canna × generalis (canna lily)], Iris hexagona (blue flag iris), Juncus effusus (soft rush, 2000 total), Pontederia cordata (pickerelweed, 1000 total), and Sagittaria lancifolia (bulltongue arrowhead, 1000 total, Table 1). Each of the four islands was planted with 4000 red top bentgrass plants and 500 plants each of canna, soft rush, and iris, and 250 plants each of pickerelweed and arrowhead. Seven plant samples comprising three plants per species were submitted to ENCO for biomass determination and initial nutrient analysis. These plant samples included: (1) an aggregate sample (all six plant species mixed together), (2) Agrostis, (3) Canna, (4) Pontederia, (5) Sagittaria, (6) Juncus, and (7) Iris. Initial plant biomass and nutrient content of the plants installed in the FTWs were quantified and are reported in Table 1.
2.3.2. Interim Clipping and Full Harvest of Floating Treatment Wetlands
Above-mat portions of plants (shoots) were clipped/harvested from the mixed and non-mixed FTWs in August and November 2018 due to the plant biomass accumulated. Tissue mass removed during both clippings was recorded.
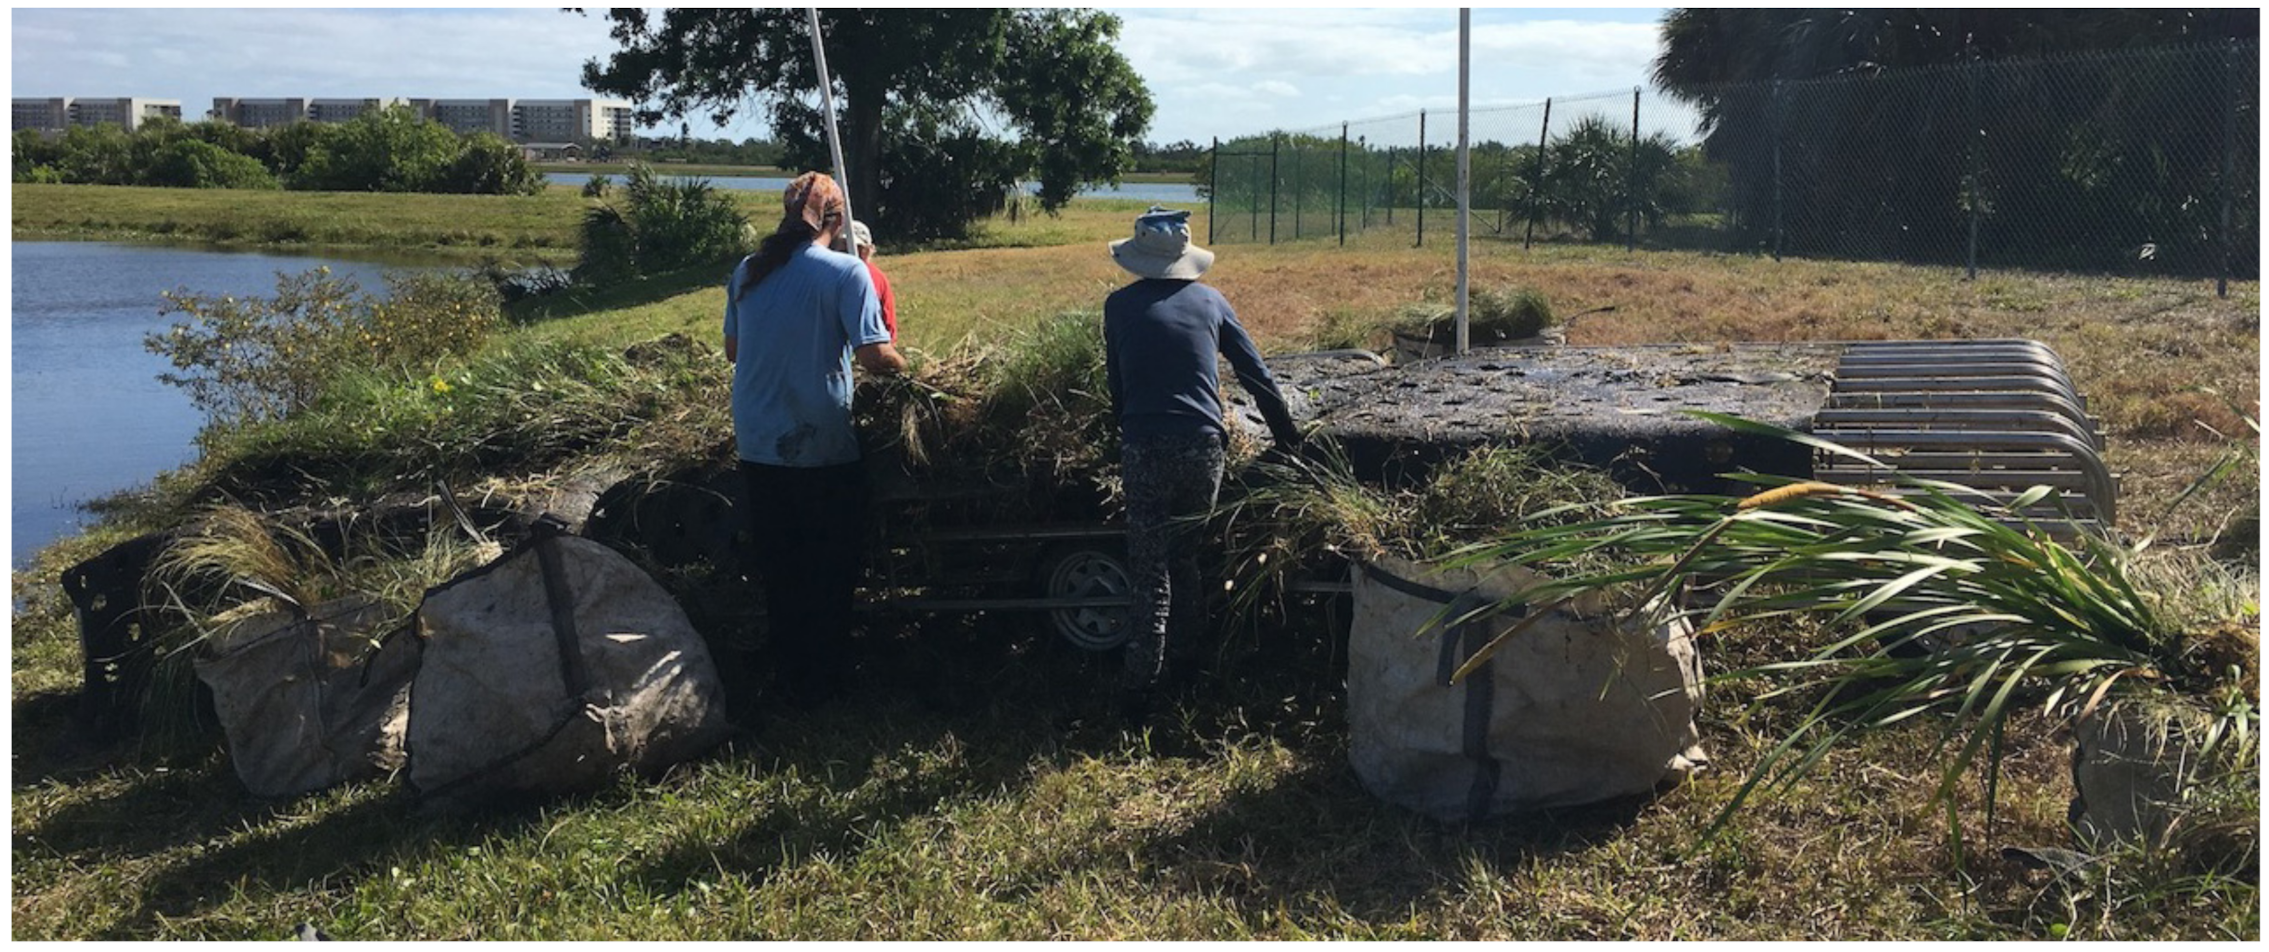
On 23–24 April 2019, above- and below-mat portions of plants were harvested from all FTWs (Figure 2). Triplicate samples of all plant species (shoots and roots, separated) individually, an aggregate of all species present, and a composite sample of volunteer species present were harvested from each island. Volunteer species (Alternanthera philoxeroides, alligatorweed; Bidens laevis, smooth beggartick; Cyperus eragrostis, tall flatsedge; Daucus carota, wild carrot; Eleocharis spp., sedge, Hydrocotyle umbellata, water pennywort; Ludwigia leptocarpa, Anglestem primrose-willow; Ludwigia peruviana, Peruvian primrose-willow; Mikania scandens, climbing hempvine; Myriophyllum aquaticum, parrot-feather; Panicum hemitomon, maidencane; Persicaria hydropiperoides, swamp smartweed; Phyla nodiflora, frogfruit; Pluchea odorata, sweetscent; Salix caroliniana, plain willow; Typha latifolia, broadleaf cattail; and Verbena urticifolia, white vervain) had invaded the FTWs and were estimated as 24.8% of mixed FTW biomass and 25.5% of non-mixed FTW biomass. All plant samples were submitted individually to ENCO (analyses described above).
Fresh weights (g) of the whole plant, shoot tissues, and root tissues were recorded in the field for each submitted sample. Once weighed, fresh plant samples were placed in labeled Ziploc bags and stored on ice until delivery to ENCO, the same day of harvest. Upon arrival at ENCO, the sample chain of custody was transferred, plant samples were dried, dry biomass recorded, and nutrient analyses conducted. The total fresh biomass removed from each island was recorded. All plants not randomly selected for nutrient analysis were placed in carry-bags, the number of carry-bags filled with plants noted, and the carry-bags loaded onto a truck. The truck carrying plants was then weighed, the plants were unloaded, and the empty truck + carry-bags reweighed. The total mass (truck + carry-bags + plant mass) was subtracted from the empty truck + carry-bag mass to determine the total fresh plant biomass removed from Wickham Park pond.
2.4. Floating Treatment Wetlands: 2019–2020
From 1 May 2019 to 4 May 2019, the four rectangular FTWs from the 2018–2019 season were replanted and redeployed in the pond, covering 900 m2 (0.09 ha) or 5% of the pond surface area. Above- and below-mat portions of plants were harvested from all FTWs on 30 October 2019. The FTWs were replanted in early November 2019, and above- and below-mat portions of plants were harvested 4–5 May 2020. In October 2019, the fresh biomass removed from the mixed and non-mixed FTWs was 9294 and 9549 kg, respectively. In May 2020, the fresh plant biomass removed from the mixed and non-mixed FTWs weighed at 4973 and 4129 kg, respectively. A total of 27,945 kg of plant biomass was removed from Wickham Park pond by harvesting all FTWs during the 2019–2020 season. Plant tissue samples were submitted to ENCO for nutrient analysis.
2.5. Aquatic Vegetation Harvest 2020
From 28 January to 26 February 2020, the Brevard County Aquatic Plant Harvesting Section harvested aquatic plants from the forebay pond (0.7 ha, Figure 1g). The aquatic plants extended from the shoreline and completely covered the surface of the forebay pond. From 4–13 May 2020, aquatic plants encroaching from the shoreline in Wickham Park pond were harvested. Aquatic vegetation samples were submitted to ECLI for nutrient analyses.
2.6. Data Analysis
Normality of data was evaluated by using the Studentized residuals of total N and P data. The normality of residuals was confirmed using the Shapiro–Wilk W test and normal quantile plots. Residuals of both total N and P data were normal. Thus, Analysis of Variance (ANOVA) was used to evaluate the effect of the treatment (mixed vs. non-mixed) on nutrient uptake by plant species established within the FTWs. When a treatment influenced nutrient uptake, specific differences within treatments were determined using the LSMeans Student’s t post-hoc comparison. The ANOVA model included the treatment, plant species, and tissue fixed effects. All statistical calculations were conducted using JMP v15.2 (SAS Institute Inc., Cary, NC, USA), and p-values < 0.05 were considered evidence of statistical significance.
3. Results
3.1. Nitrogen Uptake within Plant Tissues
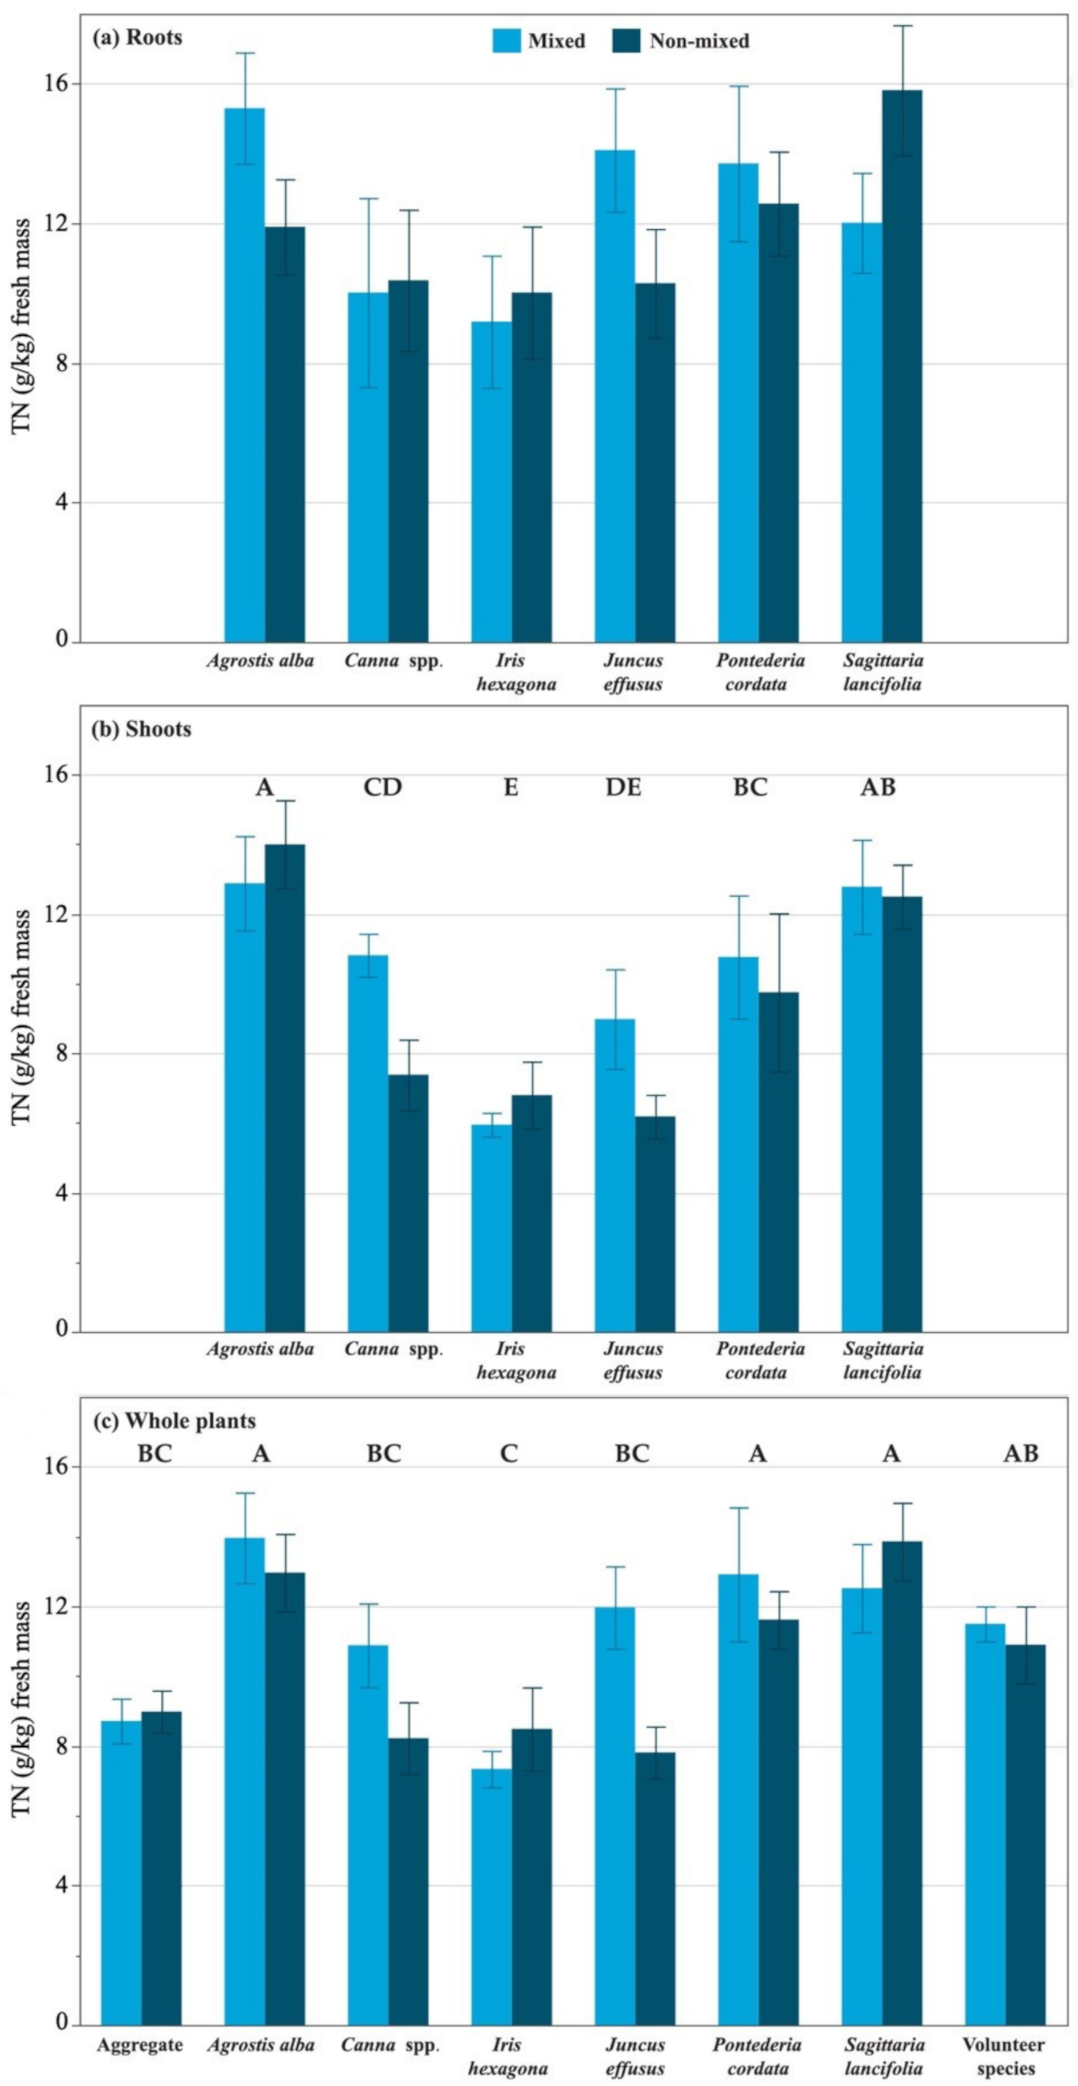
Across all plant species harvested from the FTWs, plant roots (12.1 ± 0.55 g/kg) fixed more N than plant shoots (9.9 ± 0.47 g/kg; p = 0.003; Figure 3). The mass of N fixed within the roots harvested (Figure 3a) did not differ by plant species (p = 0.103) or treatment (mixed or non-mixed; p = 0.600). Enhanced mixing did not increase the mass of N fixed within harvested shoots (p = 0.210; Figure 3b). The mass of N fixed within shoots differed by plant species (p < 0.0001), with Agrostis (13.4 g/kg) and Sagittaria (12.6 g/kg) fixing the most N and Iris species (6.37 g/kg) fixing the least.
When considering N uptake by the whole plant (mean of root and shoot weighted by % contribution to whole plant), samples of volunteer species and aggregate samples (mixture of all species within the FTWs) were also collected. Plant species was the most influential factor (p < 0.0001) governing the g N fixed per kg of fresh tissue harvested (Figure 3c). Mixing did not influence the concentration of N fixed by the plants (p = 0.1576).
3.2. Nitrogen Removed at Harvest
Plant species influenced the N removed by harvest of the FTWs after a year-long deployment (p < 0.001). With Agrostis contributing the greatest mass (kg) of N removed, contributions by other plants were similar (Table 2). When normalized to the unit area (m2) covered by the plant species, plant species exhibited similar rates (p = 0.387). On average, plants grown in the mixed FTWs exhibited higher rates of N uptake (10.6 ± 0.78 g/m2/year and 28.2 ± 1.96 mg/m2/day) than plants grown in non-mixed FTWs (4.79 ± 0.78 g/m2/year and 12.4 ± 1.96 mg/m2/day; p = 0.00001). The N:P ratio within tissues differed by plant (p < 0.000), and the mixing treatment interacted with plant species (p = 0.031). The N:P ratio was either higher in plant species grown in the non-mixed FTWs (Agrostis, Sagittaria) or similar, regardless of exposure conditions (Canna, Iris, Juncus, Pontederia, volunteer species). Plants grown in mixed treatments had a lower percent dry mass (70.4%) than those grown in non-mixed treatments (79.4%; p = 0.020).
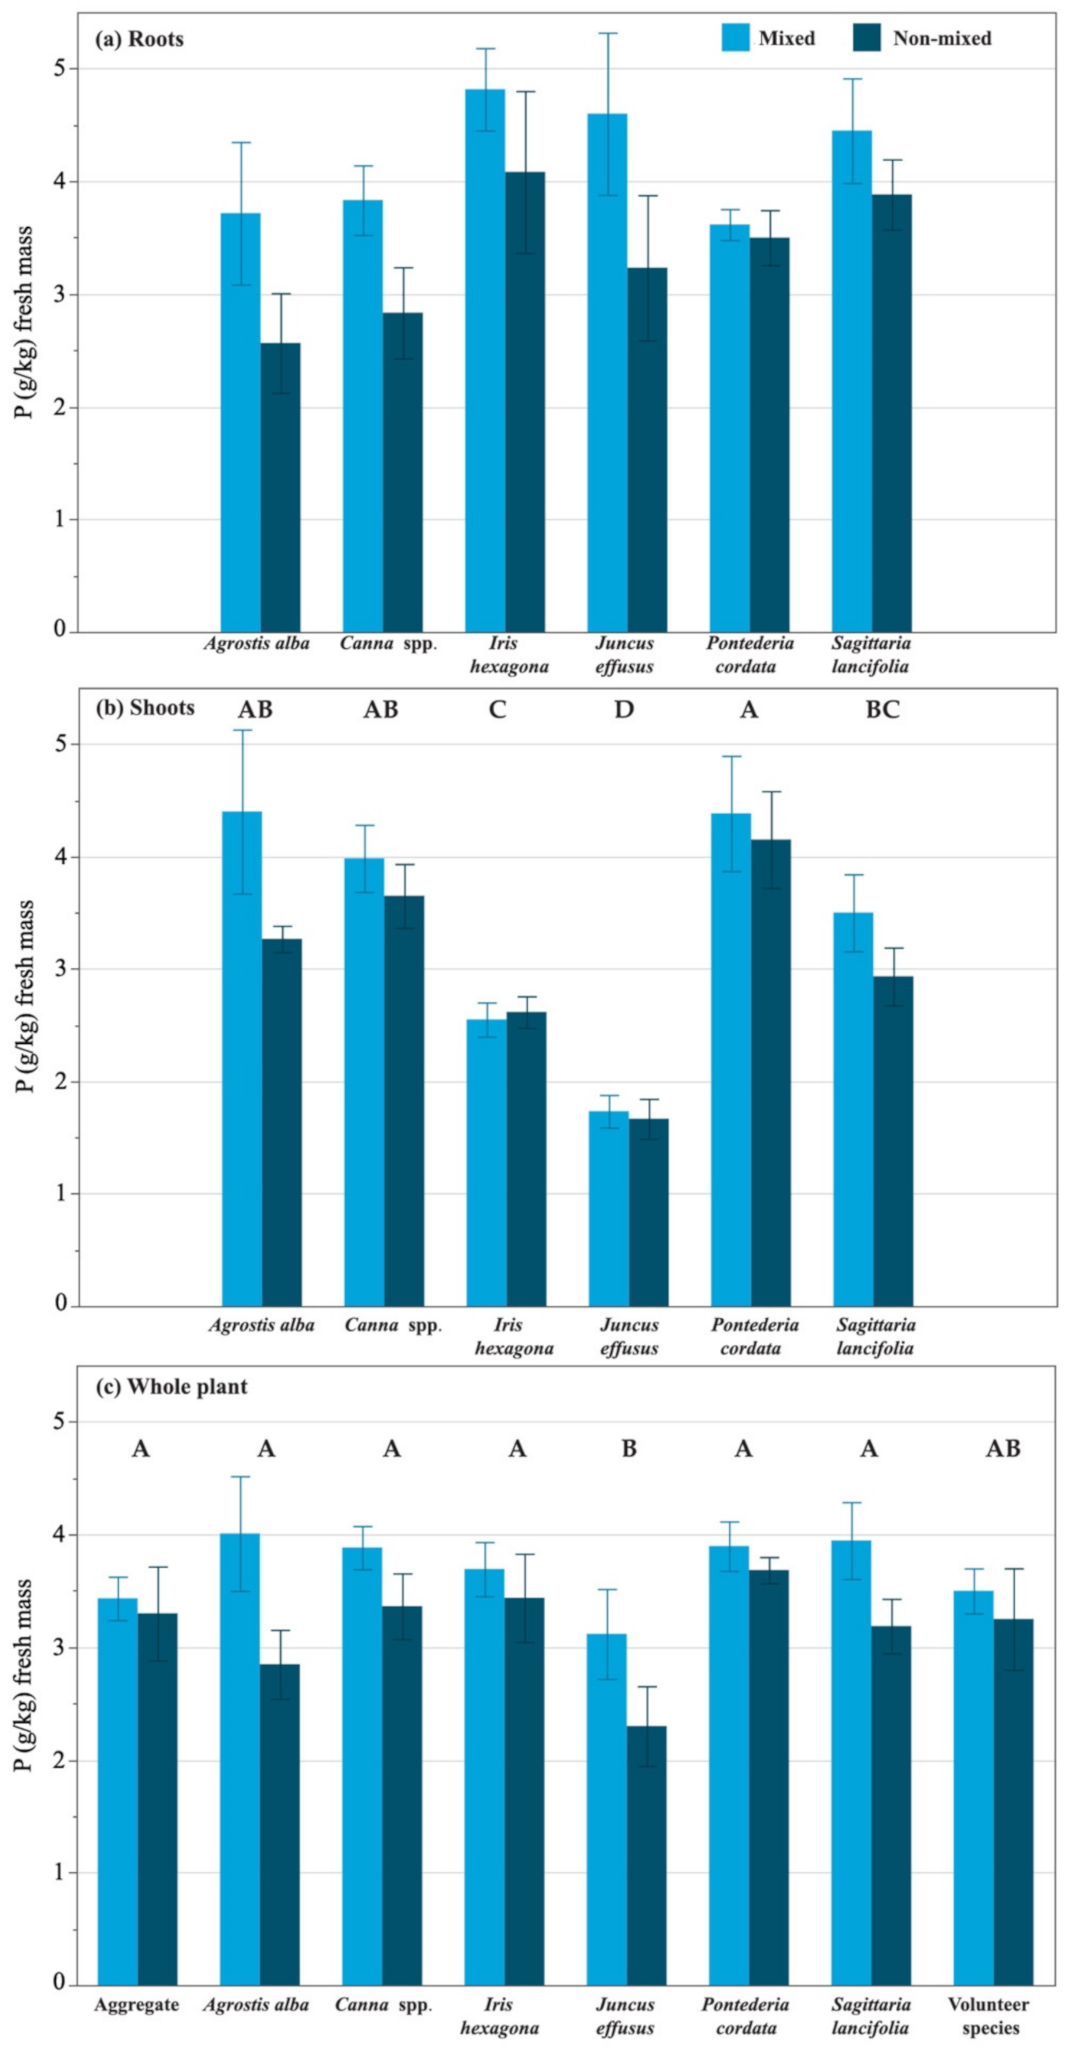
3.3. Phosphorus Uptake within Plant Tissues
Across all plant species harvested from the FTWs, plant roots (3.76 ± 0.15 g/kg) fixed more P than plant shoots (3.24 ± 0.14 g/kg; p = 0.001; Figure 4). The root systems of plants in the mixed FTWs fixed more P (4.17 ± 0.20 g/kg) than plants in non-mixed FTWs (3.34 ± 0.19 g/kg; p = 0.0047 Figure 4a). The mass of P fixed within the roots of harvested plants was similar across all species harvested (p = 0.070). Mixing did not increase the mass of P fixed within harvested shoots in 2019 (p = 0.064; Figure 4b). The mass of P fixed within shoots differed by plant species (p < 0.0001), with Pontederia (4.27 ± 0.32 g/kg) fixing the most P and Juncus species (1.70 ± 0.11 g/kg) fixing the least.
When considering the P uptake by the whole plant, both plant species (p = 0.054) and mixing (p = 0.005) influenced P uptake within plant tissues (Figure 4c). All plants but Juncus fixed similar g of P per kg tissue; Juncus fixed the lowest concentration (2.71 ± 0.22 g/kg) of P within its tissues. Plants grown within the mixed FTWs (3.69 ± 0.12 g/kg) fixed more P than those grown in non-mixed FTWs (3.16 ± 0.12 g/kg).
3.4. Phosphorus Removed at Harvest
Plant species influenced the P removed by harvest of the FTWs after a year-long deployment (p < 0.001), with Agrostis contributing the greatest mass (kg) of P removed (p < 0.000), and more P fixed by plants in mixed FTWs than those planted in non-mixed FTWs (p = 0.006); contribution by other plants was similar (Table 3). When normalized to the unit area (m2) covered, plant species exhibited similar P uptake rates (p = 0.343). On average, plants grown in the mixed FTWs exhibited higher rates of P uptake (3.45 ± 0.24 g/m2/year and 9.17 ± 0.60 mg/m2/day) than plants grown in non-mixed FTWs (1.49 ± 0.24 g/m2/year and 3.86 ± 0.60 mg/m2/day; p < 0.0001).
3.5. Total Nitrogen and Phosphorus Removed 2017–2020
The N and P mass present in the plants when the FTWs were established was subtracted from the final harvest for the 2018–2019 season and the two harvests in the 2019–2020 season. The total mass of nutrients removed from the Wickham Park pond over the 2018–2019 season (two clippings in 2018 and final harvest in April 2019) was 425 kg N and 138 kg P (Table 4). The interim clippings comprised ~31% of the N removed and ~19% of the P removed from 2018 to 2019.
During the 2019–2020 season, two full harvest cycles were completed with 147 kg of N and 54.3 kg of P removed by the non-mixed FTWs and 120 kg of N and 40.3 kg of P removed by the mixed FTWs. From 2017 to 2020, with four full harvest cycles, over 73,000 kg of plant biomass was removed from Wickham Park pond, removing 1026 kg of N and 262 kg of P. After installation of the mixer in 2018, the relative mass of N removed in contrast to P increased from 11:1 (N:P) in 2017, to 2.6:1 in 2019, and 2.8:1 in 2020.
Aquatic vegetation formed floating mats that extended from the shoreline of both the forebay pond (Figure 1g) and Wickham Park pond proper (Figure 1a). Brevard County Florida Aquatic Plant Harvesting Section harvested all vegetation from the forebay pond (0.7 ha or 7000 m2 surface area) and Wickham Park pond. The mass of vegetation harvested was considerable (64,312) and nearly as much as that harvested from the FTWs from 2017 to 2020 (73,731 kg).
4. Discussion
Water column mixing enhanced the rate of nitrogen and phosphorus fixed within plant tissues of those plants initially established within the island, with N removal rates over 2019 ranging from 7.42 (Iris) to 13.5 (Juncus effusus) g/m2/year and P removal rates ranging from 2.52 (Pontederia cordata) to 3.91 (Canna spp.) g/m2/year. These findings concurred with those from Garcia Chance and White [19], who also reported a greater N uptake rate for Juncus effusus and Canna flaccida in aerated (24.1 and 50.7 g/m2/experiment, respectively) vs. non-aerated (20.4 and 40.1 g/m2/experiment, respectively) mesocosm-based experiments. Trends were similar for P data [19]. Perhaps the increased mixing reduced the diffusion gradient at the plant root, increasing mass transport of nutrients into the plant, as roots were exposed to more consistent concentrations of nutrients in the well-mixed water column.
The N and P removed with plant harvest were similar for non-mixed and mixed FTWs. Similar nutrient uptake in mixed and non-mixed treatments could partially be explained by the contributions of volunteer species that fixed more nutrients in non-mixed FTWs than mixed FTWs, offsetting the increased nutrient uptake by the initial plant species installed within the FTWs. Garcia Chance and White [19] reported similar results in mesocosm studies, where volunteer species (Primula spp. and Carex spp.) in non-aerated FTWs fixed more nutrients than volunteer species in mixed treatments. The SB1000 mixer installed in 2018 was powerful enough to enhance mixing in ponds larger than 1.8 ha. Thus, it is possible that the non-mixed treatments benefited from the presence of the additional mixing in the pond as the nutrient removal in the mixed and non-mixed FTWs was ultimately similar. Of note is the change in P uptake by plant tissues, as prior to mixer installation, the ratio of N:P in plant tissues was 11:1 in the 2017 harvest, but after the addition of the mixer in 2018, the ratio averaged 2.7:1 from 2019 to 2020. Mixing may enhance P availability in the water column while limiting the potential for cyanobacteria to float to the pond’s surface due to turbulent flow [33]. If alternative management goals (mixing to increase degradation of organic matter and offset biochemical oxygen demand or chemical oxygen demand) also govern the decision to incorporate artificial mixing.
In the current study, the N and P removal rates were higher in the non-mixed treatment only for the volunteer species (6.17 vs. 4.65 g N/m2/year and 1.86 vs. 1.41 g P/m2/year). More N and P were fixed within plant roots (12.1 g N/kg and 3.76 g P/kg) than plant shoots (9.9 g N/kg and 3.24 g P/kg), concurring with results from Winston [24] and Wang et al. [28]. Tanner and Headley [34] reported more N and P in above mat tissues than below mat tissues. However, Keizer-Vlek et al. [22] reported a plant species-dependent response with more N and P uptake in Typha angustifolia roots than shoots, with more N and P fixed in Iris pseudacorus shoots than roots.
In terms of the active vs. passive management debate, pond water quality goals will drive the management strategy. If nutrient mitigation and removal are the primary goals, which is true within many eutrophic water bodies, harvesting plant tissues is critical. Mixing enhanced nutrient uptake and fixation rates within plant tissues when evaluating plants as monocultures, but the overall mass of N and P removed at harvest was similar, regardless of whether or not mixing occurred, as the N and P removal rates were calculated for the FTWs as a whole system, as seen in both 2019 and 2020 harvest data.
When reporting N and P uptake by plants, researchers report results solely on a dry mass basis, simply because that is standard practice in soil-based systems to normalize data and reduce the measurement error. The percentage of moisture of plants in agronomic cropping systems, where scientists have developed reporting norms, tends to be consistent; thus, normalizing nutrient status by the dry weight of a few representative crop samples accurately represents the whole crop. Plant species within field-scale FTW systems are typically not monocultures. Even if the FTW was initially planted with a single plant species, volunteer species soon colonize the FTWs. The growth habit, maturity stage, biomass allocation pattern, and nutrient partitioning pattern of each plant species differ.
When harvesting field-scale FTWs, fresh biomass is the measurement most likely to be collected. Yet, laboratory-based studies with FTWs report biomass only on a dry weight basis, even if the fresh mass was recorded at harvest. It is unlikely that all the tissues harvested from field-scale FTW installations will be dried and then reweighed. Thus, to translate nutrient numbers to realistic values representing the actual mass of nutrients removed by plants in the FTWs, reporting the nutrient concentration within fresh plant biomass is essential. Quantifying nutrients removed based on fresh mass instead of dry mass is likely more accurate because no conversion, based on a small subsample of harvested tissues, is required. When municipalities and water management districts determine which treatment technologies to use to meet nutrient mitigation goals, knowledge of nutrient accumulation within fresh plant biomass is especially pertinent.
The comparison of total nutrients removed in other studies is difficult, as many studies, even if they are long term or with pilot to field-scale sized FTWs, do not report the total biomass of plants harvested from the FTWs. Instead, many studies report only water quality and the dry weight of representative plant samples harvested from the FTWs [19,20,24,29,30]. Water quality is a critical factor, as the relative availability of nutrients influences plant growth rates; thus, knowledge of the hypereutrophic, eutrophic, mesotrophic, or oligotrophic status of the water body will ground expectations for plant growth and nutrient uptake. Estimations of biomass are possible if one knows the plant density or mass of nutrient removed per unit area per unit of time, but total biomass harvested is critical information needed to more accurately detail nutrient uptake capacity under varied environmental conditions. The nutrient uptake possible by plant species in a hypereutrophic setting (such as this study) varies for those in eutrophic, mesotrophic, and oligotrophic settings.
To the author’s knowledge, this is the first study reporting total biomass harvested from full-scale FTWs over multiple years. In 2017, 12,828 kg of plant tissues was harvested, removing 334 kg of N and 29.5 kg of P. In 2019, over 32,000 kg of plant biomass was harvested from the FTWs deployed on Wickham Park pond, removing 425 kg of N and 138 kg of P. In 2020, 27,945 kg of biomass was harvested from FTWs, removing 267 kg of N and 95 kg of P. From 2016 to 2020, 73,000 kg of biomass was harvested from FTWs, removing 1026 kg of N and 262 kg of P from Wickham Park pond. Aquatic vegetation extending from the shoreline of Wickham Park pond was also harvested in 2020, removing an additional 64,000 kg of biomass and 901 kg of N and 122 kg of P. Overall, via the harvest of FTWs and aquatic shoreline plants, 138,000 kg of plant biomass was removed from Wickham Park pond over four years. In turn, this harvest removed 1927 kg of N and 384 kg of P from the pond that otherwise may have contributed to water quality impairment in Wickham Park pond or offsite. Plant harvest is a critical component of managing nutrients in hypereutrophic and eutrophic ponds and serves to reduce the mass of nutrients that could leave the pond and impair other waterways.
Author Contributions
White designed the experiments, assisted with plant sampling, analyzed the data, and wrote the paper. The author has read and agreed to the published version of the manuscript.
Funding
An EPA 2016 319(h) Nonpoint Source Grant funded the initial purchase of the Beemats floating wetlands. Stormwater tax revenues from Brevard County, Florida residents (USD 0.005 per USD 1.00 self-imposed sales tax, 2016–2026), funded the purchase of the SolarBee SB10000 and continued harvest and replant of the FTWs. Beemats Floating Wetlands funded plant nutrient analyses. This material is based on work supported by the NIFA/USDA, under project number SC-1700584. Technical Contribution No. 6941 of the Clemson University Experiment Station.
Data Availability Statement
All data are contained within the article. Raw data are available upon request from the author.
Acknowledgments
Special thanks to Steve Beeman and the harvest crews from Beemats for assisting with plant sample collection and biomass measurements and Terry Williamson and the Brevard County Natural Resources Department for the shoreline aquatic plant management.
Conflicts of Interest
The author declares no conflict of interest.
References
- Donn, M.; Reed, D.; Vanderzalm, J.; Page, D. Assessment of E. coli Attenuation during Infiltration of Treated Wastewater: A Pathway to Future Managed Aquifer Recharge. Water 2020, 12, 173. [Google Scholar] [CrossRef] [Green Version]
- Shortle, J.; Horan, R.D. Nutrient Pollution: A Wicked Challenge for Economic Instruments. WEP 2017, 03, 1650033. [Google Scholar] [CrossRef]
- White, S.A. Regulating Water Quality: Current Legislation, Future Impacts: Introduction to the Colloquium. HortScience 2013, 48, 1095–1096. [Google Scholar] [CrossRef] [Green Version]
- Bell, N.L.; Garcia, L.M.; White, S.A. Clean WateR3: Evaluation of three treatment technologies to remove contaminants from recycled production runoff. Acta Hortic. 2018, 1191, 199–206. [Google Scholar] [CrossRef]
- Lewitus, A.J.; Brock, L.M.; Burke, M.K.; DeMattio, K.A.; Wilde, S.B. Lagoonal stormwater detention ponds as promoters of harmful algal blooms and eutrophication along the South Carolina coast. Harmful Algae 2008, 8, 60–65. [Google Scholar] [CrossRef]
- Bavithra, G.; Azevedo, J.; Oliveira, F.; Morais, J.; Pinto, E.; Ferreira, I.M.P.L.V.O.; Vasconcelos, V.; Campos, A.; Almeida, C.M.R. Assessment of Constructed Wetlands’ Potential for the Removal of Cyanobacteria and Microcystins (MC-LR). Water 2020, 12, 10. [Google Scholar] [CrossRef] [Green Version]
- Griffiths, L.N.; Mitsch, W.J. Removal of nutrients from urban stormwater runoff by storm-pulsed and seasonally pulsed created wetlands in the subtropics. Ecol. Eng. 2017, 108, 414–424. [Google Scholar] [CrossRef]
- Florida Department of Environmental Protection: Water Management Districts. Available online: https://floridadep.gov/water-policy/water-policy/content/water-management-districts (accessed on 19 November 2020).
- St. Johns Water Management District: Our Core Missions. Available online: https://www.sjrwmd.com/about/core/ (accessed on 19 November 2020).
- White, S. Design and Season Influence Nitrogen Dynamics in Two Surface Flow Constructed Wetlands Treating Nursery Irrigation Runoff. Water 2018, 10, 8. [Google Scholar] [CrossRef] [Green Version]
- Vymazal, J. Horizontal sub-surface flow constructed wetlands Ondrejov and Sp·lenÈ PorÌcÌ in the Czech Republic—15 years of operation. Desalination 2009, 246, 226–237. [Google Scholar] [CrossRef]
- Vymazal, J. Removal of nutrients in various types of constructed wetlands. Sci. Total Environ. 2007, 380, 48–65. [Google Scholar] [CrossRef] [PubMed]
- Vohla, C.; Alas, R.; Nurk, K.; Baatz, S.; Mander, Ü. Dynamics of phosphorus, nitrogen, and carbon removal in a horizontal subsurface flow constructed wetland. Sci. Total Environ. 2007, 380, 66–74. [Google Scholar] [CrossRef]
- Wu, H.; Zhang, J.; Ngo, H.H.; Guo, W.; Hu, Z.; Liang, S.; Fan, J.; Liu, H. A review on the sustainability of constructed wetlands for wastewater treatment: Design and operation. Bioresour. Technol. 2015, 175, 594–601. [Google Scholar] [CrossRef]
- Serrano, L.; DeLorenzo, M.E. Water quality and restoration in a coastal subdivision stormwater pond. J. Environ. Manag. 2008, 88, 43–52. [Google Scholar] [CrossRef] [PubMed]
- Kong, L.; Wang, L.; Wang, Q.; Mei, R.; Yang, Y. Study on new artificial floating island removing pollutants. Environ. Sci. Pollut. Res. Int. 2019, 26, 17751–17761. [Google Scholar] [CrossRef] [PubMed]
- Spangler, J.T.; Sample, D.J.; Fox, L.J.; Owen, J.S.; White, S.A. Floating treatment wetland aided nutrient removal from agricultural runoff using two wetland species. Ecol. Eng. 2019, 127, 468–479. [Google Scholar] [CrossRef]
- Headley, T.R.; Tanner, C.C. Application of Floating Wetlands for Enhanced Stormwater Treatment: A Review; Auckland Regional Council, Ed.; National Institute of Water and Atmospheric Research: Auckland, New Zealand, 2006; Volume ARC06231. [Google Scholar]
- Garcia Chance, L.M.; White, S.A. Aeration and plant coverage influence floating treatment wetland remediation efficacy. Ecol. Eng. 2018, 122, 62–68. [Google Scholar] [CrossRef]
- Garcia Chance, L.M.; Van Brunt, S.C.; Majsztrik, J.C.; White, S.A. Short- and long-term dynamics of nutrient removal in floating treatment wetlands. Water Res. 2019, 159, 153–163. [Google Scholar] [CrossRef]
- Zhao, F.; Yang, W.; Zeng, Z.; Li, H.; Yang, X.; He, Z.; Gu, B.; Rafiq, M.T.; Peng, H. Nutrient removal efficiency and biomass production of different bioenergy plants in hypereutrophic water. Biomass Bioenergy 2012, 42, 212–218. [Google Scholar] [CrossRef]
- Keizer-Vlek, H.E.; Verdonschot, P.F.M.; Verdonschot, R.C.M.; Dekkers, D. The contribution of plant uptake to nutrient removal by floating treatment wetlands. Ecol. Eng. 2014, 73, 684–690. [Google Scholar] [CrossRef]
- Borne, K.E.; Tanner, C.C.; Fassman-Beck, E.A. Stormwater nitrogen removal performance of a floating treatment wetland. Water Sci. Technol. 2013, 68, 1657–1664. [Google Scholar] [CrossRef] [PubMed]
- Winston, R.J.; Hunt, W.F.; Kennedy, S.G.; Merriman, L.S.; Chandler, J.; Brown, D. Evaluation of floating treatment wetlands as retrofits to existing stormwater retention ponds. Ecol. Eng. 2013, 54, 254–265. [Google Scholar] [CrossRef]
- Borne, K.E. Floating treatment wetland influences on the fate and removal performance of phosphorus in stormwater retention ponds. Ecol. Eng. 2014, 69, 76–82. [Google Scholar] [CrossRef]
- Strosnider, W.H.; Schultz, S.E.; Strosnider, K.A.; Nairn, R.W. Effects on the Underlying Water Column by Extensive Floating Treatment Wetlands. J. Environ. Qual. 2017, 46, 201–209. [Google Scholar] [CrossRef]
- Jurczak, T.; Wagner, I.; Wojtal-Frankiewicz, A.; Frankiewicz, P.; Bednarek, A.; Łapińska, M.; Kaczkowski, Z.; Zalewski, M. Comprehensive approach to restoring urban recreational reservoirs. Part 1—Reduction of nutrient loading through low-cost and highly effective ecohydrological measures. Ecol. Eng. 2019, 131, 81–98. [Google Scholar] [CrossRef]
- Wang, C.-Y.; Sample, D.J.; Day, S.D.; Grizzard, T.J. Floating treatment wetland nutrient removal through vegetation harvest and observations from a field study. Ecol. Eng. 2015, 78, 15–26. [Google Scholar] [CrossRef]
- White, S.A.; Cousins, M.M. Floating treatment wetland aided remediation of nitrogen and phosphorus from simulated stormwater runoff. Ecol. Eng. 2013, 61 Pt A, 207–215. [Google Scholar] [CrossRef]
- Garcia Chance, L.M.; Majsztrik, J.C.; Bridges, W.C.; Willis, S.A.; Albano, J.P.; White, S.A. Comparative Nutrient Remediation by Monoculture and Mixed Species Plantings within Floating Treatment Wetlands. Environ. Sci. Technol. 2020, 54, 8710–8718. [Google Scholar] [CrossRef]
- Sanicola, O.; Lucke, T.; Stewart, M.; Tondera, K.; Walker, C. Root and Shoot Biomass Growth of Constructed Floating Wetlands Plants in Saline Environments. Int. J. Environ. Res. Public Health 2019, 16, 275. [Google Scholar] [CrossRef] [Green Version]
- Spangler, J.T.; Sample, D.J.; Fox, L.J.; Albano, J.P.; White, S.A. Assessing nitrogen and phosphorus removal potential of five plant species in floating treatment wetlands receiving simulated nursery runoff. Environ. Sci. Pollut. Res. Int. 2019, 26, 5751–5768. [Google Scholar] [CrossRef] [Green Version]
- Visser, P.M.; Ibelings, B.W.; Bormans, M.; Huisman, J. Artificial mixing to control cyanobacterial blooms: A review. Aquat. Ecol. 2016, 50, 423–441. [Google Scholar] [CrossRef] [Green Version]
- Tanner, C.C.; Headley, T.R. Components of floating emergent macrophyte treatment wetlands influencing removal of stormwater pollutants. Ecol. Eng. 2011, 37, 474–486. [Google Scholar] [CrossRef]
Figure 1.
Graphic detailing (a) the 19 individual Beemats floating wetlands deployed in the Wickham Park pond, near Melbourne, FL, USA from 2017 to 2018 (the small slightly blurred circles on the pond’s surface); also noted are the locations of the four, rectangular floating treatment wetlands (225 m2 each) that were installed in March 2018; (b) SB10000 mixer installed on the pond and powered by solar panels; (c) four 1.2 m × 2.4 m solid core foam mats connected using nylon clips and washers, the seams covered by Permalon®; (d) close-up of Permalon® strips and stainless-steel grommet used as anchor points; (e) Juncus effusus (left rear) and Canna flaccida (right front) plants in trays ready for installation in the floating treatment wetlands; (f) plastic aerator cup with Juncus effusus plant, about two weeks after planting; and (g) the pond forebay.

Figure 2.
Harvest platform for removing plants from floating treatment wetlands (FTWs). Plants removed from the FTW scaffold were placed into carry-bags.
Figure 2.
Harvest platform for removing plants from floating treatment wetlands (FTWs). Plants removed from the FTW scaffold were placed into carry-bags.

Figure 3.
Total nitrogen (TN) concentration fixed within (a) root, (b) shoot, and (c) whole plant tissues harvested from floating treatment wetlands (with enhanced mixing / no-mixing) after a 1 year deployment (April 2018 to April 2019) within the Wickham Park pond in Melbourne, FL, USA from. Different letters between species indicate significant differences according to Student’s t post-hoc comparison (α < 0.05).

Figure 4.
Phosphorus (P) fixed within (a) root, (b) shoot, and (c) whole plant tissues harvested from floating treatment wetlands (with enhanced mixing / no-mixing) after a 1 year deployment (April 2018–April 2019) within the Wickham Park pond in Melbourne, FL, USA. Different letters between species indicate significant differences according to Student’s t post-hoc comparison (α < 0.05).


Table 1.
Initial plant biomass (n = 3, per species) and nutrient composition (based on fresh mass) of plants installed in April 2018 in floating treatment wetlands deployed within the Wickham Park pond in Melbourne, FL, USA.
Table 1.
Initial plant biomass (n = 3, per species) and nutrient composition (based on fresh mass) of plants installed in April 2018 in floating treatment wetlands deployed within the Wickham Park pond in Melbourne, FL, USA.
| Plant Species (Family) | Plant (#) | Fresh Mass Plants (g) | Dry Mass Plants (g) | Total Solids (%) | All Plant Fresh Mass 1 (kg) | Nitrogen Per Plant (g/kg) | Phosphorus Per Plant (g/kg) |
|---|---|---|---|---|---|---|---|
| Agrostis alba (Poaceae) | 16,000 | 19.4 | 17.5 | 90 | 104 | 8.8 | 1.7 |
| Canna spp. (Cannaceae) | 2000 | 11.7 | 10.1 | 86 | 7.82 | 8.5 | 3.2 |
| Iris hexagona (Iridaceae) | 2000 | 19.1 | 16.5 | 87 | 12.7 | 9.4 | 1.3 |
| Juncus effusus (Juncaceae) | 2000 | 15.1 | 13.6 | 90 | 10.0 | 5.1 | 1.6 |
| Pontederia cordata (Pontederiaceae) | 1000 | 22.5 | 21.7 | 97 | 7.51 | 5.2 | 0.65 |
| Sagittaria lancifolia (Alismataceae) | 1000 | 7.78 | 6.81 | 88 | 2.59 | 3.8 | 1.4 |
| All plants 2 | 24,000 | 21.5 | 18.5 | 86 | 1443 | 6.1 | 2.4 |
1 Calculated by multiplying the average mass of a single plant by the number of plants of that species installed in the floating treatment wetlands. 2 The composite sample was collected by combining three plants of each species into a single sample. The lab then dried the sample and collected a subsample (dry mass of three plants per species) from which the nitrogen and phosphorus analyses were performed. 3 Sum of plant mass values above.
Table 2.
Total nitrogen (N) removed at harvest in April 2019, yearly and daily N removal rate per m2 of floating treatment wetland, N:P ratio (by mass), and percent total solids by treatment and plant species.
Table 2.
Total nitrogen (N) removed at harvest in April 2019, yearly and daily N removal rate per m2 of floating treatment wetland, N:P ratio (by mass), and percent total solids by treatment and plant species.
| Treatment | N Removed 1 (kg) | Overall N Removal (g/m2/Year) | Daily N Removal (mg/m2/Day) | N:P Ratio | Total Solids (%) |
|---|---|---|---|---|---|
| Mixed | |||||
| Agrostis alba | 113 ± 7.68 | 13.2 ± 2.65 | 35.0 ± 7.04 | 3.61 ± 0.31 | 72 ± 7.0 |
| Canna spp. | 1.15 ± 0.25 | 10.6 ± 1.31 | 28.3 ± 3.49 | 2.78 ± 0.22 | 62 ± 8.0 |
| Iris hexagona | 1.06 ± 0.11 | 7.42 ± 1.20 | 19.7 ± 3.19 | 2.00 ± 0.13 | 70 ± 6.0 |
| Juncus effusus | 1.62 ± 0.12 | 13.5 ± 3.48 | 35.8 ± 9.26 | 3.98 ± 0.33 | 67 ± 9.0 |
| Pontederia cordata | 0.39 ± 0.04 | 8.93 ± 2.45 | 23.7 ± 6.52 | 3.27 ± 0.45 | 76 ± 7.0 |
| Sagittaria lancifolia | 0.34 ± 0.03 | 12.1 ± 3.30 | 32.1 ± 8.79 | 3.17 ± 0.15 | 66 ± 10 |
| Volunteer species | 7.06 ± 0.29 | 4.65 ± 0.42 | 12.4 ± 1.13 | 3.29 ± 0.05 | 80 ± 2.0 |
| Non-mixed | |||||
| Agrostis alba | 87.4 ± 7.45 | 4.51 ± 0.62 | 12.0 ± 1.64 | 4.72 ± 0.40 | 86 ± 1.0 |
| Canna spp. | 1.18 ± 0.17 | 4.36 ± 0.29 | 11.6 ± 0.76 | 2.47 ± 0.30 | 76 ± 6.0 |
| Iris hexagona | 1.15 ± 0.17 | 4.79 ± 0.65 | 12.7 ± 1.74 | 2.49 ± 0.22 | 81 ± 4.0 |
| Juncus effusus | 1.17 ± 0.13 | 3.68 ± 0.35 | 9.8 ± 0.93 | 3.59 ± 0.36 | 87 ± 1.0 |
| Pontederia cordata | 0.36 ± 0.02 | 3.58 ± 0.85 | 9.5 ± 2.25 | 3.18 ± 0.28 | 86 ± 1.0 |
| Sagittaria lancifolia | 0.45 ± 0.04 | 6.44 ± 0.67 | 17.1 ± 1.77 | 4.37 ± 0.16 | 76 ± 3.0 |
| Volunteer species | 8.03 ± 2.10 | 6.17 ± 2.01 | 16.4 ± 5.35 | 3.37 ± 0.13 | 62 ± 26 |
1 Calculated using fresh mass (kg) × nutrient removed per plant.
Table 3.
Total phosphorus (P) removed at harvest in April 2019, yearly and daily P removal rate per m2 of floating treatment wetland, percent island biomass by treatment and plant species, and root:shoot ratio.
Table 3.
Total phosphorus (P) removed at harvest in April 2019, yearly and daily P removal rate per m2 of floating treatment wetland, percent island biomass by treatment and plant species, and root:shoot ratio.
| Treatment | P Removed 1 (kg) | Overall P Removal (g/m2/year) | Daily P Removal (mg/m2/day) | % of Island | Root:Shoot Ratio |
|---|---|---|---|---|---|
| Mixed | |||||
| Agrostis alba | 27.4 ± 3.17 | 3.84 ± 0.83 | 10.2 ± 2.20 | 50.1 ± 0.03 | 0.61 |
| Canna spp. | 0.44 ± 0.01 | 3.91 ± 0.58 | 10.4 ± 1.54 | 6.3 ± 0.00 | 0.66 |
| Iris hexagona | 0.55 ± 0.02 | 3.87 ± 0.84 | 10.3 ± 2.22 | 6.3 ± 0.00 | 0.66 |
| Juncus effusus | 0.53 ± 0.06 | 3.58 ± 1.02 | 9.53 ± 2.71 | 6.3 ± 0.00 | 0.66 |
| Pontederia cordata | 0.10 ± 0.00 | 2.52 ± 0.41 | 6.71 ± 1.10 | 3.1 ± 0.00 | 1.63 |
| Sagittaria lancifolia | 0.13 ± 0.01 | 3.63 ± 0.84 | 9.65 ± 2.22 | 3.1 ± 0.00 | 0.82 |
| Volunteer species | 2.15 ± 0.10 | 1.41 ± 0.11 | 3.76 ± 0.29 | 24.8 ± 0.07 | – 2 |
| Non-mixed | |||||
| Agrostis alba | 18.7 ± 2.31 | 0.98 ± 0.16 | 2.61 ± 0.42 | 49.7 ± 0.03 | 1.15 |
| Canna spp. | 0.32 ± 0.03 | 1.92 ± 0.32 | 5.09 ± 0.85 | 6.3 ± 0.00 | 0.68 |
| Iris hexagona | 0.47 ± 0.06 | 2.03 ± 0.40 | 5.40 ± 1.07 | 6.3 ± 0.00 | 0.72 |
| Juncus effusus | 0.37 ± 0.05 | 1.09 ± 0.14 | 2.89 ± 0.38 | 6.3 ± 0.00 | 0.74 |
| Pontederia cordata | 0.10 ± 0.00 | 1.09 ± 0.22 | 2.90 ± 0.58 | 3.1 ± 0.00 | 2.34 |
| Sagittaria lancifolia | 0.11 ± 0.01 | 1.49 ± 0.17 | 3.96 ± 0.44 | 3.1 ± 0.00 | 0.91 |
| Volunteer species | 2.40 ± 0.67 | 1.86 ± 0.67 | 4.93 ± 1.78 | 25.5 ± 0.07 | – |
1 Calculated using fresh mass (kg) × nutrient removed per plant. 2 Root:shoot ratio of volunteer species could not be calculated as roots and shoots were mixed together when sampled.
Table 4.
Harvests (July 2017, April 2019, October 2019, May 2020) of whole plants from 900 m2 floating treatment wetlands (FTW) deployed within the Wickham Park pond in Melbourne, FL, USA, and aquatic plants (2020) growing from the shoreline to the center of the forebay and Wickham Park Pond. Data presented include final fresh mass at harvest by treatment (mixed and non-mixed), daily rate of N and P removal per unit area of FTW, total nitrogen (N) and phosphorus (P) removed, and ratio of N:P within harvested biomass.
| Harvest 2017–2020 | Fresh Mass (kg) | N Removal Rate (mg/m2/Day) | P Removal Rate (mg/m2/Day) | N Removed 1 (kg) | P Removed (kg) | N:P Removed 2 |
|---|---|---|---|---|---|---|
| Mixed (450 m2 FTW) | ||||||
| April 2019 | 12,923 | 426 ± 18.3 | 167 ± 7.39 | 144 ± 6.2 | 56.6 ± 2.5 | 2.5:1 |
| October 2019 | 9294 | 440 ± 14.0 | 183 ± 21.3 | 72.5 ± 2.3 | 30.2 ± 3.5 | 2.4:1 |
| May 2020 | 4973 | 290 ± 1.21 | 61.3 ± 1.82 | 47.7 ± 0.2 | 10.1 ± 0.3 | 4.7:1 |
| Non-mixed (450 m2 FTW) | ||||||
| April 2019 | 13,077 | 437 ± 20.7 | 162 ± 10.9 | 148 ± 7.0 | 54.8 ± 3.7 | 2.7:1 |
| October 2019 | 9549 | 520 ± 78.3 | 243 ± 29.1 | 85.7 ± 12.9 | 40.1 ± 4.8 | 2.1:1 |
| May 2020 | 4129 | 373 ± 82.6 | 86.2 ± 18.8 | 61.5 ± 13.6 | 14.2 ± 3.1 | 4.3:1 |
| FTWs (900 m2) | ||||||
| Harvest: July 2017 | 12,828 | 1,384 | 122 | 334 | 29.5 | 11:1 |
| Clippings 3 2018–2019 | 6958 | – | – | 132 ± 7.0 | 26.7 ± 1.5 | 4.9:1 |
| Harvest: April 2019 | 26,000 | 870 ± 19.5 | 330 ± 9.2 | 293 ± 6.6 | 111 ± 3.1 | 2.6:1 |
| Harvest: October 2019 + May 2020 | 27,945 | 818 ± 13.2 | 290 ± 7.8 | 267 ± 4.4 | 94.6 ± 2.6 | 2.8:1 |
| Total: FTW 2017–2020 | 73,731 | – | – | 1026 | 262 | |
| Aquatic Plant Harvest: 2020 | ||||||
| Forebay pond (January–February) | 51,836 | – | – | 726 | 98.5 | 7.4:1 |
| Wickham Park pond (May) | 12,476 | – | – | 175 | 23.7 | 7.4:1 |
| Total: Aquatic plant harvest 2020 | 64,312 | 901 | 122 | |||
| Total: FTW + aquatic plant harvest | 138,043 | – | – | 1927 | 384 |
1 Calculated using fresh mass (kg) × nutrient removed per plant. 2 N:P ratio was calculated using mass. 3 Clippings harvested from islands were placed in carry-bags loaded onto a truck, the truck and plants were weighed (total mass). Truck and carry bags emptied. Carry-bags were placed back into the truck, and the truck reweighed. Fresh mass = total mass − truck − carry-bag mass). The final fresh mass was normalized for the initial fresh mass of plants installed.
Publisher’s Note: MDPI stays neutral with regard to jurisdictional claims in published maps and institutional affiliations. |
© 2021 by the author. Licensee MDPI, Basel, Switzerland. This article is an open access article distributed under the terms and conditions of the Creative Commons Attribution (CC BY) license (http://creativecommons.org/licenses/by/4.0/).
Share and Cite
MDPI and ACS Style
White, S.A. Plant Nutrient Uptake in Full-Scale Floating Treatment Wetlands in a Florida Stormwater Pond: 2016–2020. Water 2021, 13, 569. https://doi.org/10.3390/w13040569
AMA Style
White SA. Plant Nutrient Uptake in Full-Scale Floating Treatment Wetlands in a Florida Stormwater Pond: 2016–2020. Water. 2021; 13(4):569. https://doi.org/10.3390/w13040569
Chicago/Turabian StyleWhite, Sarah A. 2021. "Plant Nutrient Uptake in Full-Scale Floating Treatment Wetlands in a Florida Stormwater Pond: 2016–2020" Water 13, no. 4: 569. https://doi.org/10.3390/w13040569
Note that from the first issue of 2016, this journal uses article numbers instead of page numbers. See further details here.