
Assessment of Renewal Priority of Water Pipeline Network against Earthquake Risk

Graduate School of Engineering, Osaka University, 2-1 Yamadaoka, Suita 565-0871, Osaka, Japan
*
Authors to whom correspondence should be addressed.
Water 2021, 13(4), 572; https://doi.org/10.3390/w13040572
Submission received: 4 January 2021
/
Revised: 6 February 2021
/
Accepted: 17 February 2021
/
Published: 23 February 2021
(This article belongs to the Section Urban Water Management)
Abstract
:Long-term outage of drinking water supply after earthquakes has large adverse impacts on the lives of residents and cities’ water supply systems. Priority assessment is required to determine the effective order of preparing the measures against these hazards. Previous studies have insufficiently focused on the effects of seismic resistance of core pipelines, thereby affecting all the other branched pipelines that supply the water to each residential area. In our research, we aimed to propose the appropriate order of core pipelines derived from the center of the water treatment plants in Osaka, Japan against the Nankai Trough earthquake. Solutions that cause less damage have been needed because natural disaster prediction has had a lot of uncertainty. We proposed indices that can evaluate an appropriate renewal plan that considers the damage of core pipelines of water and the renewal cost for core pipeline networks based on the scenario analysis and the Monte Carlo simulation. The amount of water distribution of core pipelines in each area is the top priority when renewing them in terms of cost-effectiveness and expected rate of water outage under the disaster.
1. Introduction
Concerns related to the occurrence of large-scale earthquakes have highlighted the necessity of strengthening countermeasures against natural disasters. For example, the Nankai Trough earthquake is a large-scale earthquake that reoccurs in Japan approximately every 100–150 years. The epicenter of this earthquake is the plate boundary beneath the southern seas of the Japanese islands [1]. The Headquarters for Earthquake Research Promotion [2] predicted that the probability of the Nankai Trough earthquake occurring within the next 30 years is 70–80%; this earthquake is expected to have a maximum magnitude of 9, which means prompt countermeasures to prevent potential damages must be implemented. The Basic Law for Strengthening the National Land of the Cabinet Secretariat in Japan [3] has evaluated the vulnerability of the country to large-scale natural disasters and proposed a number of priorities to advance countermeasures related to disaster prevention and reduction. Local governments and businesses must quickly determine priorities based on vulnerability assessments and promote efficient countermeasures under budget and time constraints. Constructing an updated plan by disaster simulation is necessary to improve the earthquake resistance of a target area effectively.
Concerns that the water supply and sewage system in Japan may be shut down for a long period of time after the Nankai Trough earthquake have grown under the Basic Law for Strengthening the National Land of the Cabinet Secretariat [3]. Maintaining a steady supply of drinking water is vital to Japan’s residents. Following the Great East Japan Earthquake in 2011 and the Kumamoto earthquake in 2016, water outages occurred over wide areas because of the disconnection of water pipeline joints [4,5]. The water supply was restored only after some time had passed, and many residents suffered from a shortage of domestic water [4,5]. Thus, the National Resilience Promotion Headquarters of Cabinet Secretariat [6] used the earthquake-resistance compliance rate of core pipeline networks as a performance indicator to address future similar instances. In 2018, the Ministry of Health, Labor, and Welfare [7] determined that the earthquake-resistance compliance rate of pipelines in Japan, that is, the percentage of pipelines that meet earthquake-resistance standards, was 40.8%; the ministry thus sought to increase this rate to 50% in 2022 [6]. Evaluating the efficiency of earthquake-resistance measures and determining the priority order of pipelines for renewal is an urgent undertaking. Indeed, planning the renewal of pipelines with high effectivity in terms of time and cost is necessary because such an endeavor requires time.
Several scholars have evaluated the vulnerability of water distribution systems to earthquakes. Tamura and Kawakami [8] evaluated the seismic resistance of an underground pipeline network system from the viewpoint of system engineering and analyzed the water supply system using a model. Adachi and Bruce [9] assessed the vulnerability of infrastructure systems to earthquakes and considered the failure of water and electrical systems. Shi and O’Rourke [10] developed a comprehensive model to simulate the seismic response of water supply systems. This model accurately accounted for vulnerable hydraulic flows and pressures in heavily damaged water supply systems [10]. However, this study did not calculate the effect of earthquake resistance or propose renewal plans based on priority analysis. American Lifelines Alliance [11] proposed methods to describe the potential damage of water transmission system components under various earthquake hazards and plotted the fragility curves of the pipeline according to the type of component in the water transmission system; unfortunately, the vulnerability of the network to earthquakes was not evaluated.
Murata and Miyajima [12] examined the estimated investment of a water distribution network and its vulnerability. Do et al. [13] proposed an economical cost-constrained optimal design of a water distribution system that maximizes seismic reliability while satisfying pressure constraints. These studies focused on a simplified model of the water distribution network and did not present analyses based on a real pipeline network. Mori et al. [14] proposed a method to evaluate the renewal advantage of water pipelines based on asset management. This study evaluated the deterioration of pipelines [14]. However, renewal plans based on earthquake resistance were not considered.
Previous studies neither calculated the effect of earthquake resistance nor proposed renewal plans based on priority analysis. Kunizane et al. [15,16] estimated the amount of water outage and its rate in a small pipeline network model of a distribution area by assuming the aging of a core pipeline network and verified that water outages could be reduced by the earthquake resistance of the pipeline. The group also targeted small-diameter water pipelines and showed that a renewal plan considering regional characteristics, such as pipeline density and demand (water supply population), as indicators are highly advantageous for reducing water outages [17]. However, the group did not present a renewal plan assuming that the core pipeline network is damaged by an earthquake. Although the probability of core pipeline network accidents is low, the water distribution of the network is large, which means damage to the network will have a large impact on the water supply. As such, considering the renewal plans of core pipelines based on the effect of earthquake resistance is important.
The earthquake resistance also has to be considered by the vulnerability of each part of pipelines. Water pipelines consist of components such as pipes, joints, valves, etc. Pipelines made of ductile iron have a strong body such that the force can be concentrated only on the joint parts [18]. Therefore, joints are vulnerable to the force caused by earthquakes [19,20]). In the Great East Japan Earthquake, many pipelines with non-seismic joints (general joints), which did not have a pull-out prevention function, were reported to be easily damaged [20]. On the other hand, the earthquake-resistant joints with this function were less damaged even if they had bodies made of the same material (i.e., ductile iron) [20].
Given the above facts, Osaka City implemented the “Promotion of Earthquake Resistance for Pipelines/Emergency 10-Year Plan” [21]. Under this plan, the old joints of ductile iron pipelines were replaced with earthquake-resistant joints to eliminate pipelines made of fragile material as well as aged pipelines [21]. In 2019, the percentage of ductile iron pipelines with earthquake-resistant joints as main pipelines was 64.4% [21]. Kunizane et al. [16] estimated an increase in the earthquake-resistant rate of up to 62.6% for Tokyo. Constructing earthquake-resistant core pipelines is essential because the water supply of many households may be cut off if these pipelines are broken in even one place by an earthquake; this scenario must be considered until 100% pipeline renewal is achieved. Furthermore, while the probability of core pipeline network accidents is low, this type of damage may have large impacts on the water supply, especially if a city with a large population, such as Osaka City, is involved. Thus, considering the renewal plan of core pipelines based on the effect of earthquake resistance is of great importance.
Osaka City Waterworks Bureau has proposed a renewal plan of water pipelines with seismic resistance. Because natural disasters are challenging to predict, whether a damage solution can successfully control the effects of one such disaster when actualized cannot be accurately known. In this paper, we examine the effects of a massive earthquake on pipeline breakage by scenario analysis.
This research has three objectives. First, we propose a practical method to evaluate the progress of a pipeline renewal plan. Second, we verify the feasibility of the proposed method by applying it to an actual water treatment plant (WTP) and its water distribution network. We focus on the renewal plan for the core pipeline network of the Kunijima WTP under the effect of the Nankai Trough earthquake. We compared different renewal plans in terms of declines in the water outage population. Finally, we examine an appropriate index through which future renewal projects may be evaluated and improved.
2. Materials and Methods
2.1. Model Framework
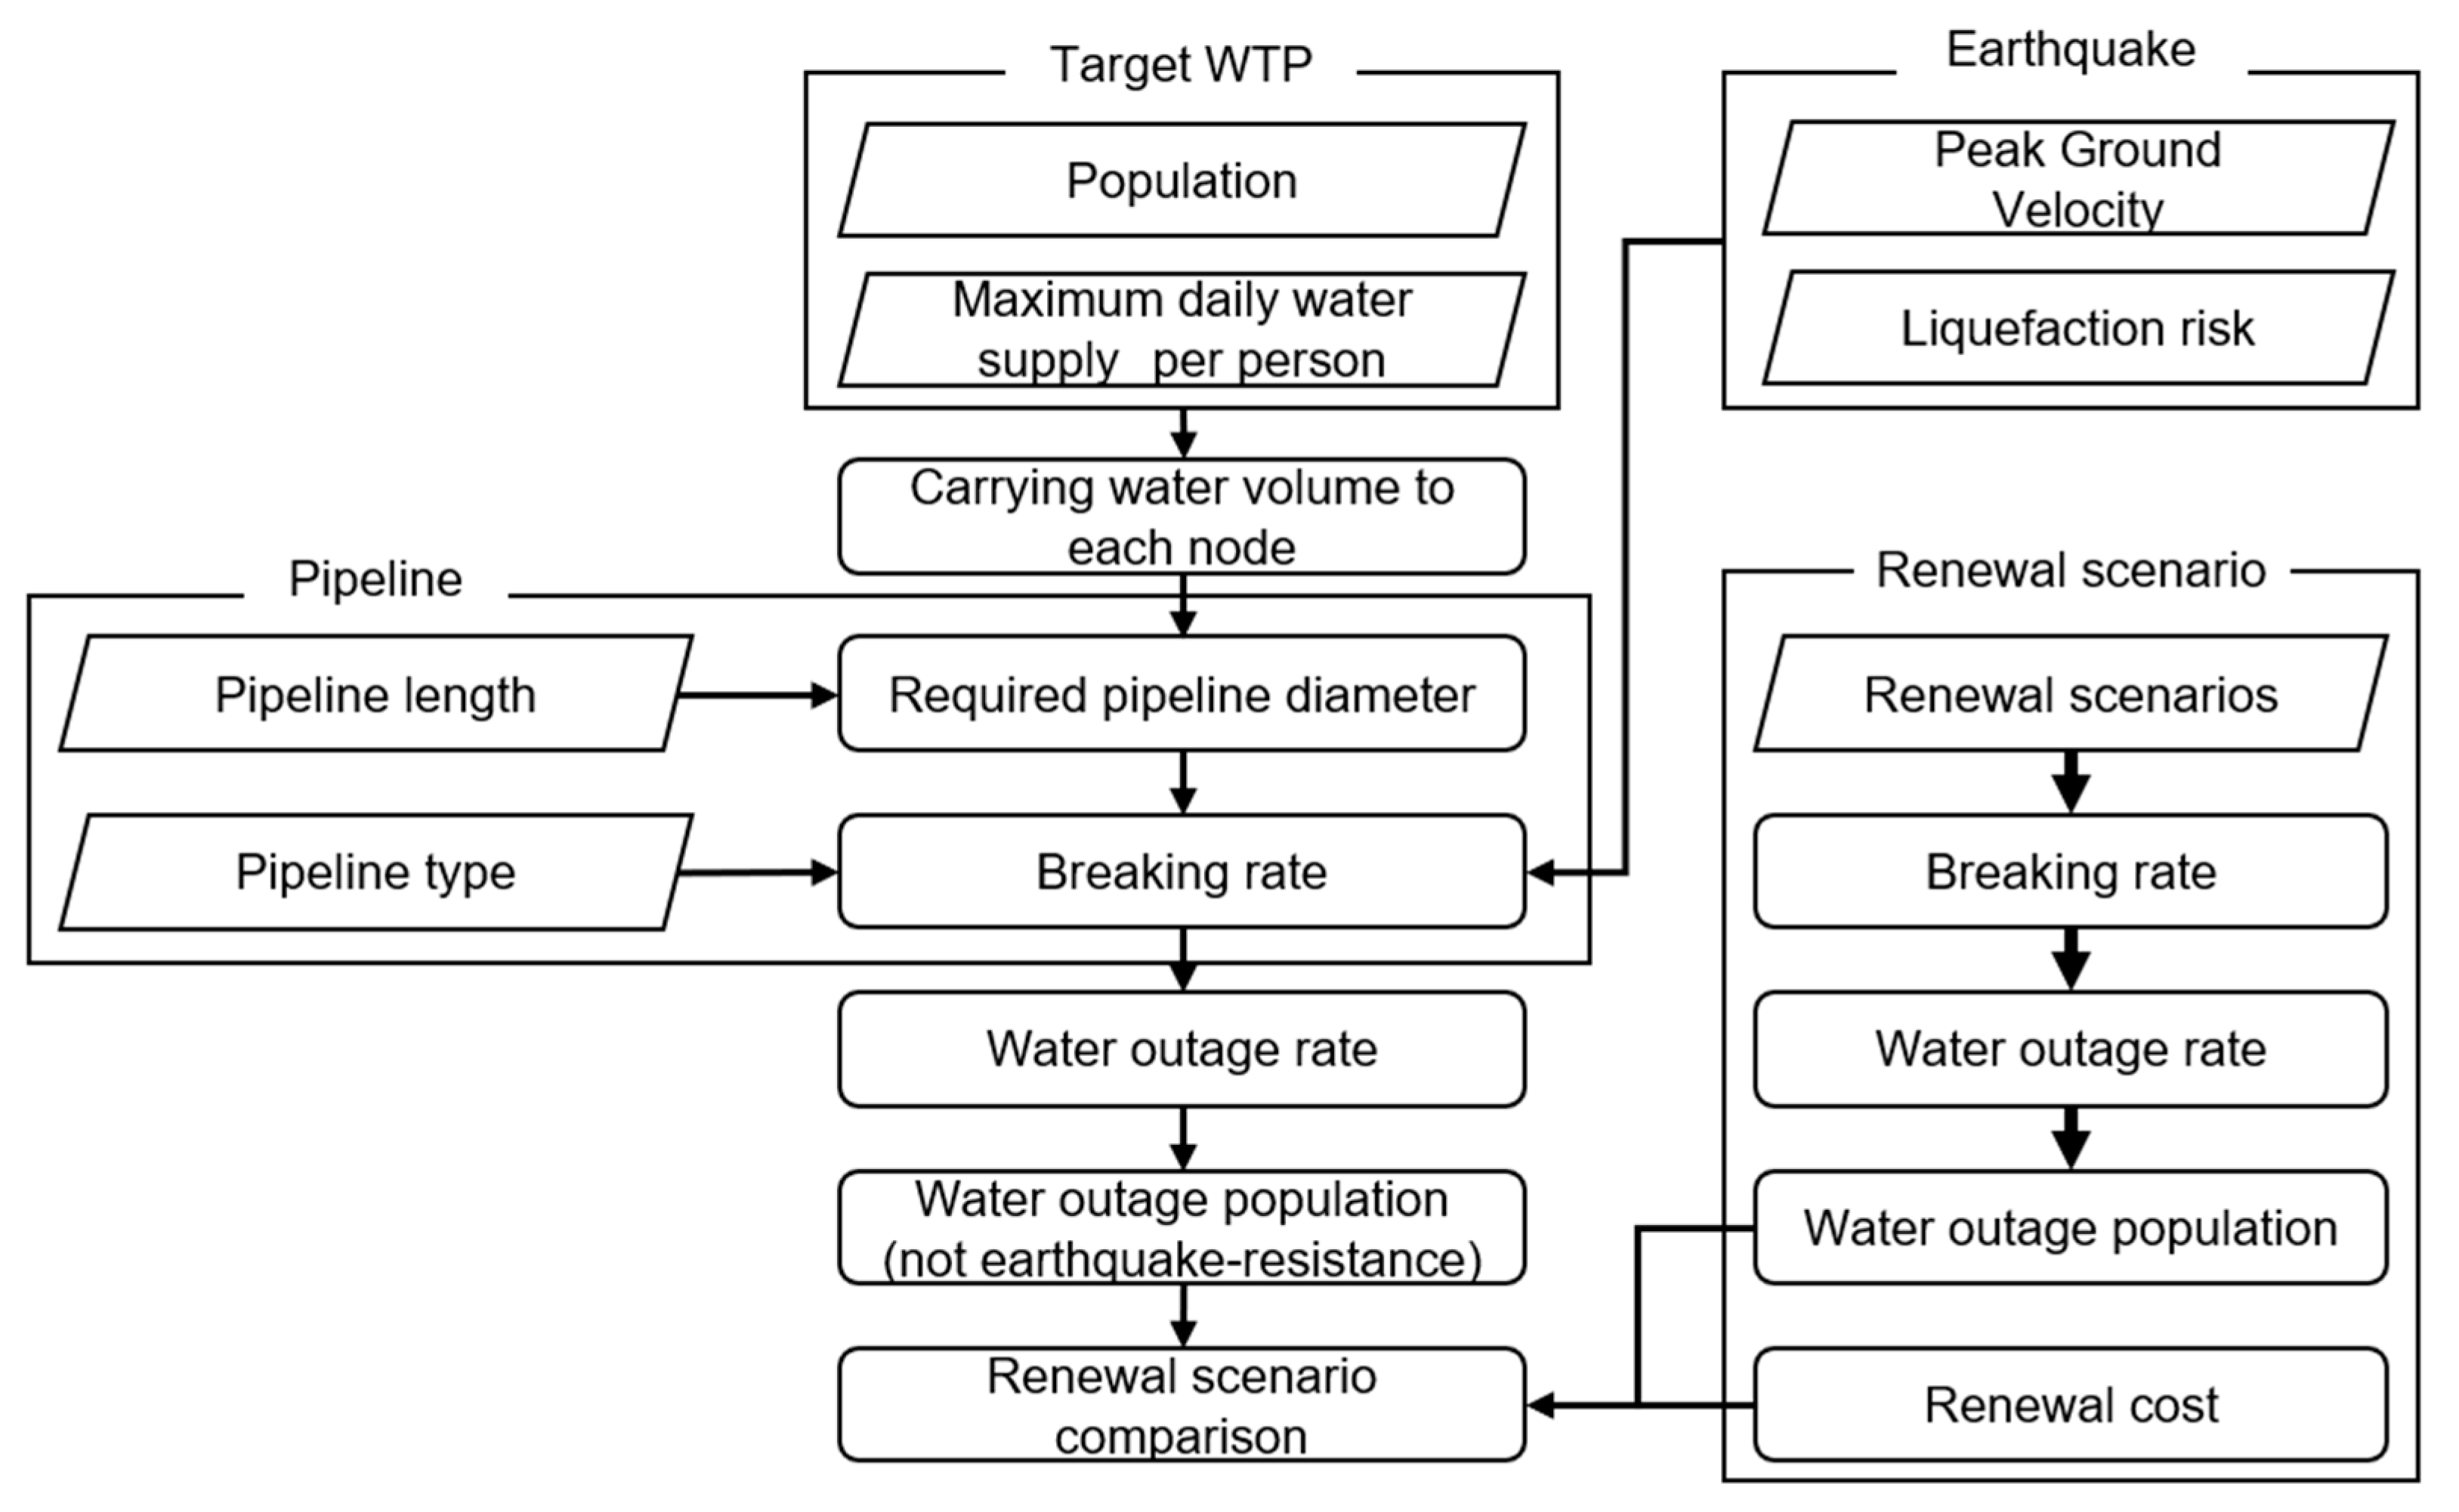
Figure 1 shows the framework of our model to determine the most appropriate plan for water pipeline renewal. The objective of the model is to select the most cost-effective renewal case among the three cases, which are updated in the order of (1) the breaking rate, (2) the amount of water distribution, and (3) the risk score, which is the product of 1 and 2 (see Section 3.1 for more details).
The possible water outage population is set as the endpoint to evaluate these cases. The water outage population is discussed in detail in Section 2.4.5, where it is defined as the product of the water outage rate and the population living in the area. The water outage rate is defined as the frequency at which the amount of water supplied to the area is less than 1/100 of the normal amount (see Section 2.4.4 for more details). A “break” in this study is defined as a break of such magnitude that no water reaches the subsequent nodes. Therefore, in the model, the population of the area downstream of broken pipelines has water outages.
The break of a certain pipeline can cause changes in the amounts of the water distribution network in other branches. In this study, it is assumed that the nodes after the break are supplied with the same amount of water as before the break, which would be different from the real situation under the earthquake to reduce the computational load. However, given that the endpoint of this study is the water outage population, even if the break of a certain pipeline causes a change in the flow rate in other pipelines in the network, the water outage population does not change unless it is smaller than 1/100.
For the following cases, this model has limitations: (1) The amount of water in the upstream pipelines becomes smaller than 1/100 compared with that of normal cases due to the break of downstream pipelines, which expands the water outage area and (2) the direction of water flow in the loop pipeline network is reversed as an emergency response. Subsequently, water is supplied from the pipeline of the downstream area. Under cases 1 and 2, the water outage population can be underestimated and overestimated, respectively.
2.2. Earthquake Risk
2.2.1. Background and Earthquake Type of the Selected Area
Osaka City in Japan is the center of Osaka Prefecture and has a population of approximately 2,751,613 [22]. This city was selected as the target area for this study because it had previously published its estimation of damage from a previous Nankai Trough earthquake [23]. The Nankai Trough, a trench in which plates are in contact with each other, is located south of the Japanese islands. Earthquakes stemming from the Nankai Trough are expected to cause high seismic intensity throughout Osaka Prefecture [24]. The Osaka Prefectural Government (2017) estimated the cost of building damage to be JPY 20.1 trillion; it also estimated that most of the Osaka areas covered in our study were severely liquefied [23]. The , which represents the liquefaction potential factor, exceeds 15 in most areas of Osaka City [24]. When the exceeds 15, the probability of liquefaction is high. The definition of is as follows (Equations (1)–(4)) [25,26]:
where, is the depth in meters, is the in situ resistance (or undrained cyclic strength) of a soil element to dynamic loads, and is the dynamic load induced in the soil element by a seismic motion [25,26].
If a large earthquake occurs in the Nankai Trough, great impacts and severe damage may be expected in terms of infrastructure and people in the city. In particular, widespread water outages may occur.
Osaka City has three WTPs that take water from the Yodo River. Kunijima WTP distributes water to the northern part of Osaka City. The predicted seismic intensity in most areas covered by the water supply of Kunijima WTP is 6 [24].
2.2.2. Peak Ground Velocity and Liquefaction Risk
The peak ground velocity and liquefaction risk value were applied based on the damage assumption published by Osaka City [24] in the simulation. The peak ground velocity was calculated using the following equation, which estimates seismic intensities on the basis of strong-motion records from previous earthquakes [27]:
where is measured seismic intensity and is peak ground velocity (cm/s).
The liquefaction risk value was estimated using the , an index describing the possibility of liquefaction of a formation. We used the in the Nankai Trough earthquake on a 250 m square mesh map constructed by the Osaka Prefectural Government (2020) [24]. The correction coefficient to determine the breaking rate of the pipeline was derived by the [24].
The Osaka Prefectural Government (2020) estimated the map of seismic intensity () due to the Nankai Trough earthquake to be 5.5–6.0 over nearly the entire water supply area of the Kunijima WTP; therefore, we set = 5.75, which is the average of this range. This value represents the largest seismic intensity range of the earthquake in the study area and is the most severe damage condition predicted by the Osaka Prefectural Government (2020) [24].
2.3. Water Pipeline
2.3.1. Required Pipeline Diameter
The pipeline diameter was calculated from the maximum water distribution per hour, which standardizes the minimum dynamic water pressure of water distribution pipelines used in Japan to the range of 0.15–0.20 MPa [28]. In this study, the pipeline diameter () was calculated from the quantity of flow (), frictional loss head (), and length () using Hazen–Williams’ equation (Equation (6)) according to the method for determining pipeline diameters [28]. Because the pipeline diameter is specified every 50 mm, we increased the diameter at intervals of 50 mm from 50 mm for each pipe and then substituted the values obtained into Equation (6). was converted into pressure and considered the hydrodynamic pressure, which was calculated to be 1 MPa per 100 m by setting the water density to 1.00 g/cm3. In Osaka City, the fluctuation of ground height is 5 m or less, except in some areas wherein the Uemachi Plateau is located. Thus, we assumed that pressure fluctuations due to ground height can be ignored. We used the smallest pipeline diameter with hydraulic pressure exceeded 0.15 MPa. We applied this formula to the core pipeline of the Kunijima WTP, which has a diameter of at least 75 mm.
where frictional loss head (m), is flow coefficient, is pipeline diameter (m), is the quantity of flow (m3/s), and is length (m).
In the simulation, the flow coefficient (), which varies depending on the roughness of the inner surface of the pipeline and the number of bends and branches in the pipeline, was set as = 110 [29]. This value was applied to the entire pipeline considering the pressure loss due to the bending of the pipelines. The maximum amount of water flowing through the pipeline per hour (m3/h) () (Equation (15)) was used as a substitute for .
2.3.2. Breaking Rate of Pipelines
The number of breaking points was estimated using the damage estimation formula of the pipeline (Equation (7)) [30], which calculates the number of occurrences of water supply pipeline damage by taking various correction factors, such as pipeline length, into account and the standard damage rate based on the damage analysis of the Southern Hyogo Prefecture Earthquake in 1995 (Equation (8)) [30]. The value of was substituted from Equation (5).
where number of occurrences of water supply pipeline damage, is correction factor of pipeline diameter, is correction factor of liquefaction risk, is correction factor of topographic factor, is pipeline length (km), and is standard damage rate (/km). The correction factors we used in this study are shown in Table S1 in Supplementary Materials. Isoyama et al. [30] tentatively set the correction factor = 0.5 for pipelines with a diameter of 500 mm or more as a reference.
The breaking rate of the pipeline was calculated from the number of occurrences of damage using the Poisson probability [9]. The breaking rate of the pipeline (= ) was calculated by Equation (9). Assuming that a pipe segment cannot deliver water when it has at least one break, the failure probability of the pipe segment can be expressed by an exponential distribution (Equation (10)) [9].
where number of broken pipelines, is the breaking rate of at least one point, and is breaking rate of points.
2.4. Estimation of Water Outage Risk
2.4.1. Population of Each Node
The population distributed by each node was calculated using a 500 m population mesh map [31] on the assumption that water is distributed from that node if a node exists in the mesh; if not, water is distributed from the nearest node. The population supplied by each node is defined as the water supply population of that node.
2.4.2. Pipeline Network
We assumed that ductile iron pipelines are replaced with ductile iron pipelines with earthquake-resistant joints for earthquake resistance and used the adjacency matrix obtained from Osaka City Waterworks Bureau [32] to express the connection of the pipeline network of Kunijima WTP. The adjacency matrix of an -vertex graph (Equation (11)) is an × square matrix. If water flows from node to node , is set to 1; otherwise, is set to 0 (Equation (12)). Water is supposed to flow from the node with the lowest number to that with the higher number.
2.4.3. Water Volume at Each Node
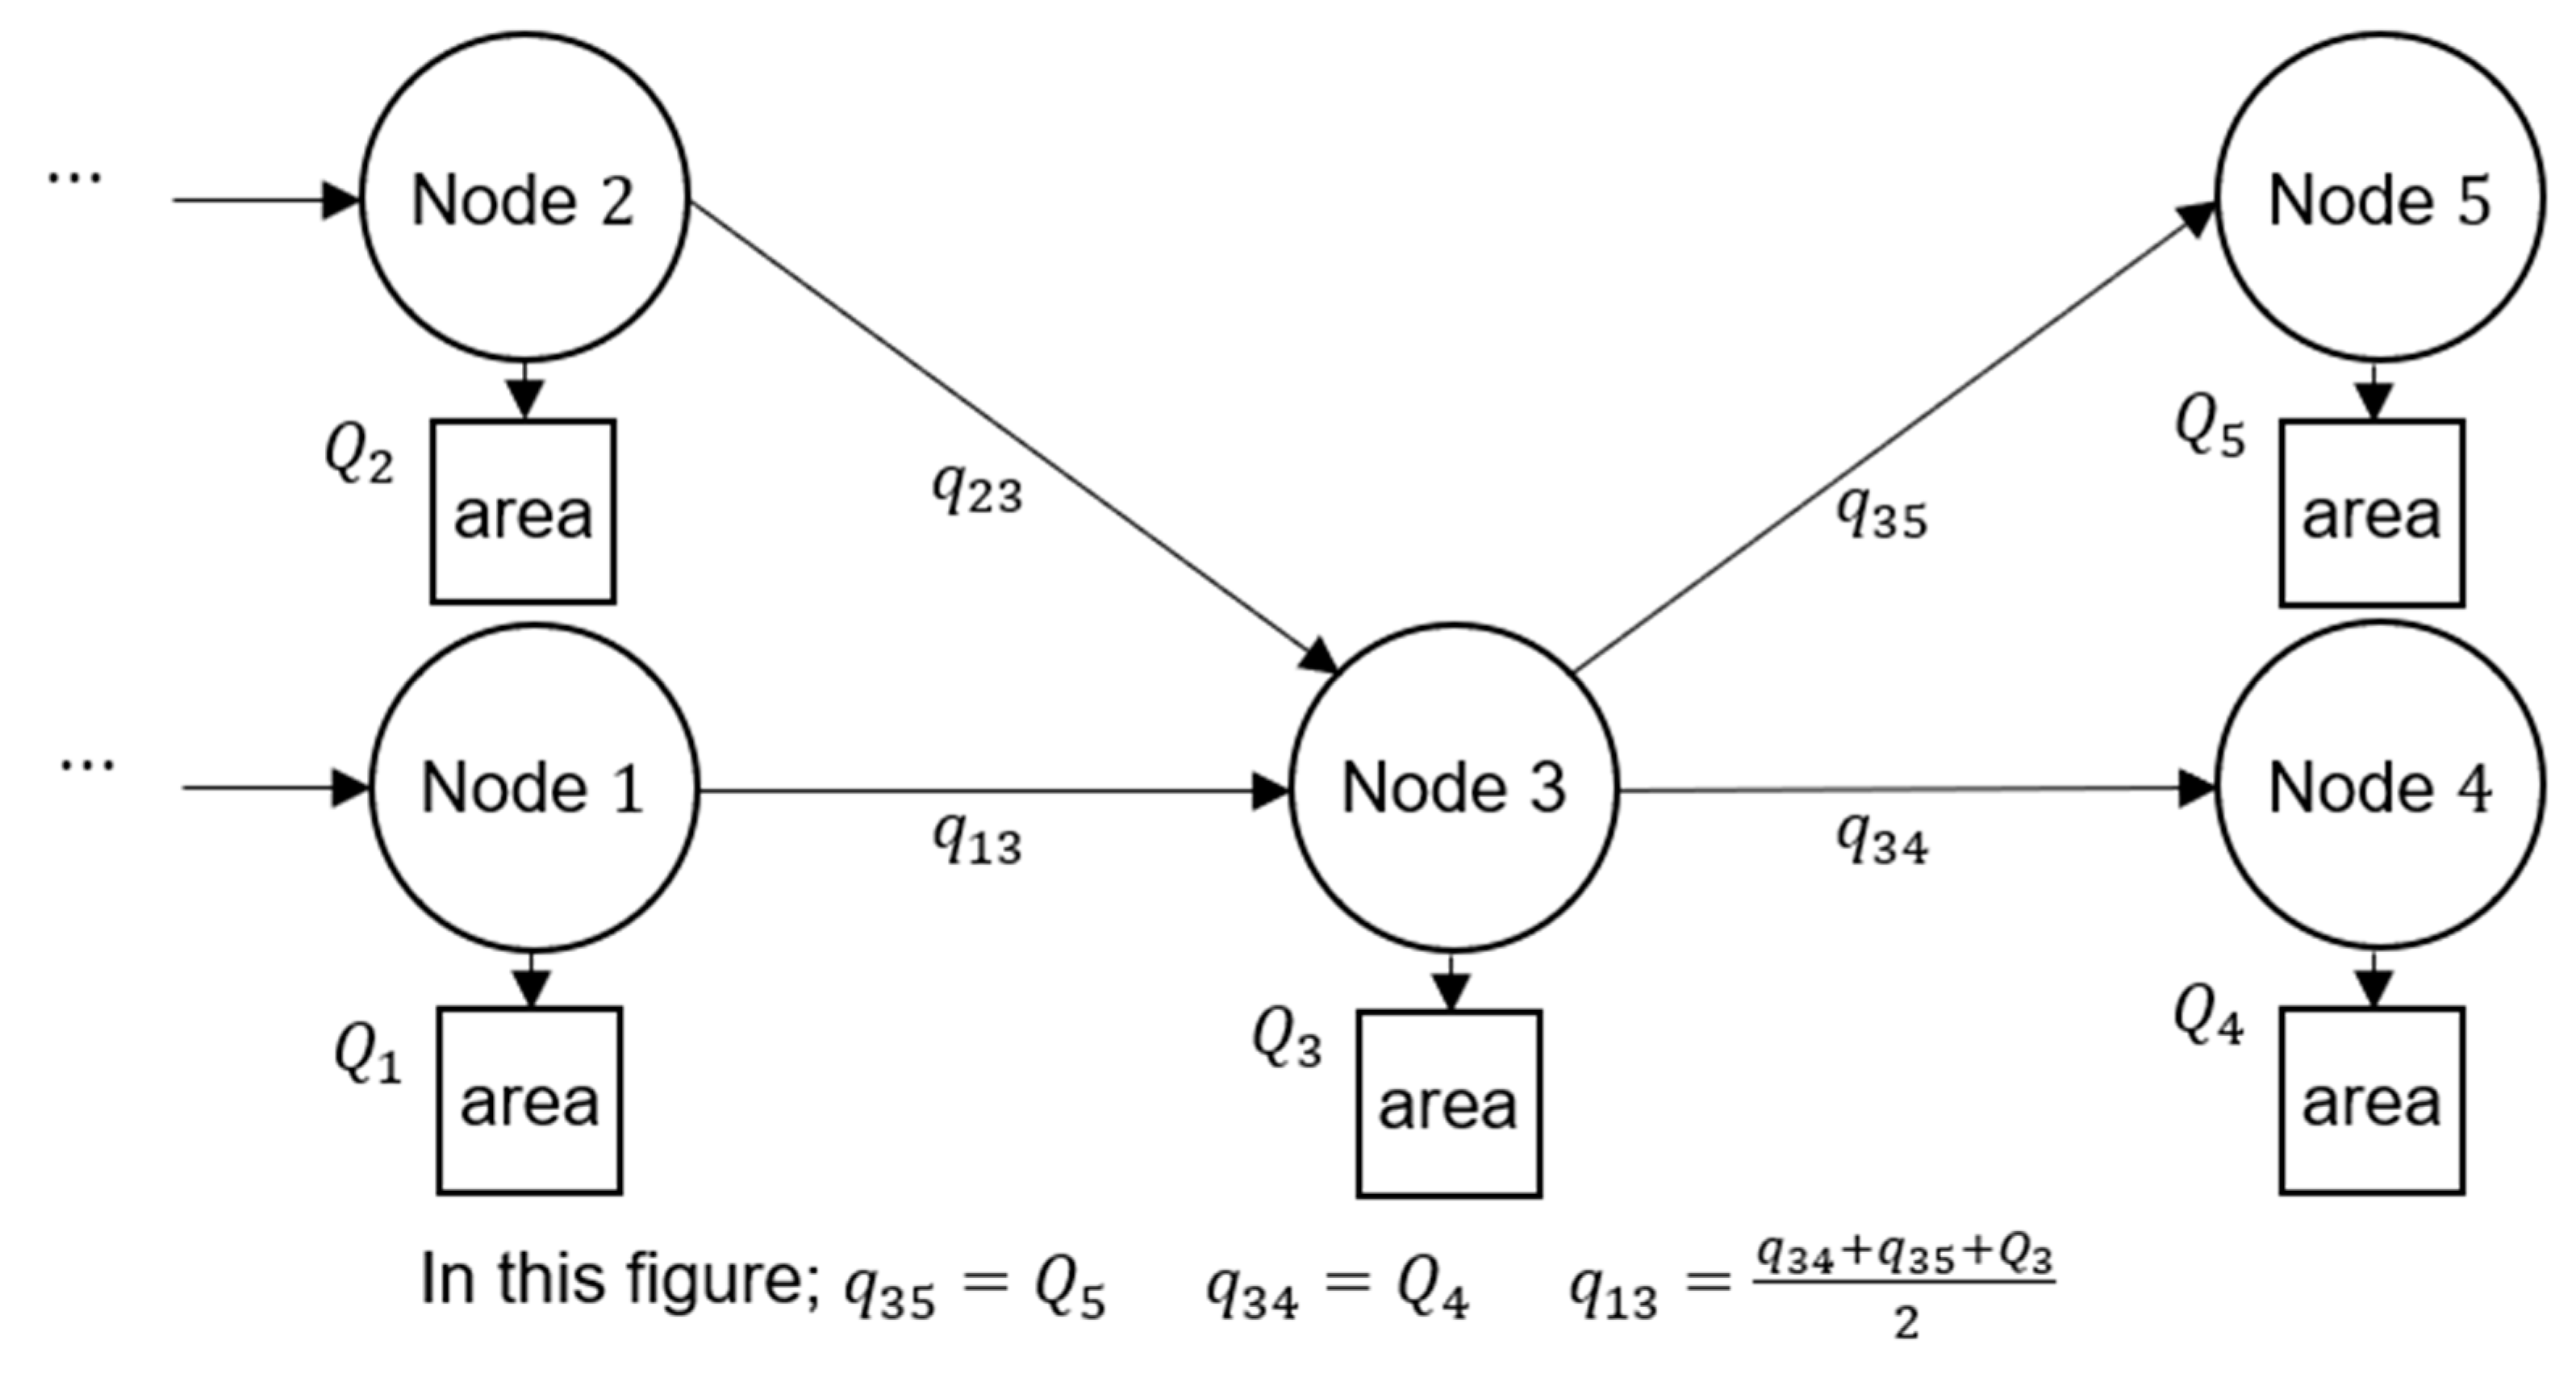
We used the statistical data of the planned maximum water supply per hour, which refers to the maximum amount of water that must be supplied per person per day [26]. In Osaka, the maximum amount of water supplied per person per day is 535 L/person/day [29]. The total amount of water flowing through the pipeline () was calculated from the amount of water carried to the nodes and their connected pipelines (Equations (13) and (14)). The water supply to the area was calculated by multiplying the maximum water supply per day by the planned population. The numerator in Equation (13) represents the sum of the amount of water supplied to the area by node () and the amount of water flowing through the pipeline connected to the downstream portion of node j (). If multiple pipelines distributing water to a node are available, the amount of water distributed to these pipelines is assumed to be equal. Figure 2 shows an example network consisting of Nodes 1–5 and demonstrates how is calculated. Nodes 4 and 5 are terminal nodes. The amount of water flowing to the terminal nodes is equal to the sum of the amounts of water supplied to the area by nodes (, ), even for the broken pipelines, where the water flows out without reaching the next node.
where amount of water flowing through the pipeline (L/day), is the pipeline between node and ( represent the number of the node and are applied to the number of all nodes in the network), is all nodes in the network, is the sum of the amount of water supplied to the area by node (L/day), and is population distributed by node .
The maximum amount of water flowing through the pipeline per hour () was calculated based on the method of the Japan Water Works Association [28] to determine the pipeline diameter using Equation (15). is a correction coefficient that represents the peak time of water distribution, which is derived by regression analysis of the results of 411 water distribution areas in 46 cities in Japan in the summer of 2008 [28]. The coefficient can be obtained using Equation (16) [28].
where the maximum amount of water flowing through the pipeline per hour from node to node (m3/h), and is coefficient related to time fluctuations in water distribution.
2.4.4. Water Outage Rate by Area
The water outage rate was calculated using the Monte Carlo method, which calculates the frequency of not supplying water to each node. Because the core pipeline has a low breaking rate, we set the number of calculations to 10,000. Here, the water outage is defined as the event when the amount of water supplied to a node becomes less than 1/100 of the normal amount. is defined as the number of times the water outage occurs at node out of 10,000 earthquake occurrences, whereas is the water outage rate calculated by dividing by 10,000 (Equation (17)).
In a single trial of the earthquake, whether each pipeline is broken is determined, and the amount of water supplied to each node is calculated using (Equation (18)). Each pipeline was assumed to be broken according to the breaking rate (Equation (10)).
where water outage rate in node , is the number of water outages occurring at node , is the number of earthquakes expected, is distribution rate of water from node to node ( and represent the numbers of the nodes and are applied to all nodes in the network) and is the number of nodes in the pipeline network.
2.4.5. Water Outage Population
The expected water outage population was calculated by multiplying the water outage rate determined from 10,000 trials of earthquakes for each region using the breaking rate (Equation (10)) by the population distributed by node (), whereas is the sum of water outage population in the entire network as shown in Equations (19) and (20), respectively.
where is expected water outage population at node .
2.5. Renewal Cost
The construction cost of changing the pipeline to an earthquake-resistant one by the common open-cut method was calculated using Equation (21). We assumed ductile iron pipelines with earthquake-resistant joints under the condition of daytime construction [33].
In case the pipelines cross rivers, a function for an aqueduct function was applied rather than a function for the constructions of buried pipelines [33]; the cost of this aqueduct was calculated using Equation (22) under the condition that construction is carried out at daytime [33]. For example, in Figure 3, Equation (22) was applied to pipelines crossing the Yodo River.
where is construction cost (JPY 1000) per pipeline length (m) (tax included), and is pipeline diameter (m).
3. Practical Application
3.1. Case Setting
We estimated the expected water outage population and renewal cost when the old water pipeline is updated to an earthquake-resistant one. An overview of the cases investigated in this study is shown in Figure S1 in Supplementary Materials. We also established three cases according to the priorities for replacement, namely, breaking rate, water distribution, and risk score, as follows:
Base Case: Non-Earthquake-Resistant Pipelines
We estimated the expected water outage population in the case where no pipelines are earthquake resistant.
Case 1: Pipeline Replacement by Order of Breaking Rate
Seismic strengthening works aiming to replace the existing pipelines with earthquake-resistant ones are carried out by choosing the pipelines with the largest breaking rates first.
Case 2: Pipeline Replacement by Order of Water Distribution
The water distribution derived from each pipeline reflects the population affected by a water outage. Therefore, in this case, seismic strengthening works are applied by selecting pipelines that distribute water to areas with the largest populations first to reduce the population experiencing the water outage. The amount of water flowing through the pipeline (L/day) was used as an index for this case (see Section 2.4.3).
Case 3: Pipeline Replacement by Order of Risk Score
In Case 3, the highest risk scores at the time of the earthquake () are used to determine the order of pipelines to be replaced with earthquake-resistant ones. This score is calculated by multiplying the estimated number of damaged pipelines in the block by (1) the average amount of supplied water per unit area and (2) the non-seismic rate of the block, as follows (Equation (23)) [17]:
where is risk score of pipeline at block(), is estimated number of breaking points of pipeline at block(), is the amount of water supplied per unit area of block() normalized by the average value of all the target blocks, and is the earthquake-resistance rate at block().
When considering the risk score of core pipelines (Equation (24)), we multiplied the breaking rate of pipelines by of each core pipeline (Equation (10)). Because we focused on the core pipeline network, we applied the direct water demand of each pipeline into the calculations as an indicator. Kunizane et al. [17] (Equation (23)) used a normalized value of water demand per unit area of blocks, which was the average value of the target block area. They also multiplied the number of damaged parts by the actual non-seismic resistance rate. In contrast to this approach, we adopted the concept of damage rate in the simulations to calculate the ideal priority of pipeline renewal.
where is risk score of core pipeline , and is the breaking rate of core pipeline .
3.2. Comparison of the Current Earthquake Resistance Status and Update Scenarios in Osaka City
On the basis of our interview with Osaka City Waterworks Bureau, we estimated the current seismic resistance rate of the core pipeline in the water supply area of the Kunijima WTP to be 75%. We simulated the effects of 10,000 earthquakes in Osaka City and then compared the simulation results of the current status with those of Cases 1–3. Finally, we verified the validity of the current renewal plan of Osaka City by calculating and comparing the cost-effectiveness of all scenarios. Cost-effectiveness refers to the reduction in the expected water outage population divided by the renewal cost. Equation (25) shows the cost-effectiveness of a plan when pipelines are made earthquake resistant.
where cost-effectiveness when pipelines are made earthquake resistant, is expected water outage population when pipelines are made earthquake resistant, and is the cost when pipelines are made earthquake resistant (million yen).
4. Results and Discussion
4.1. Pipeline Network
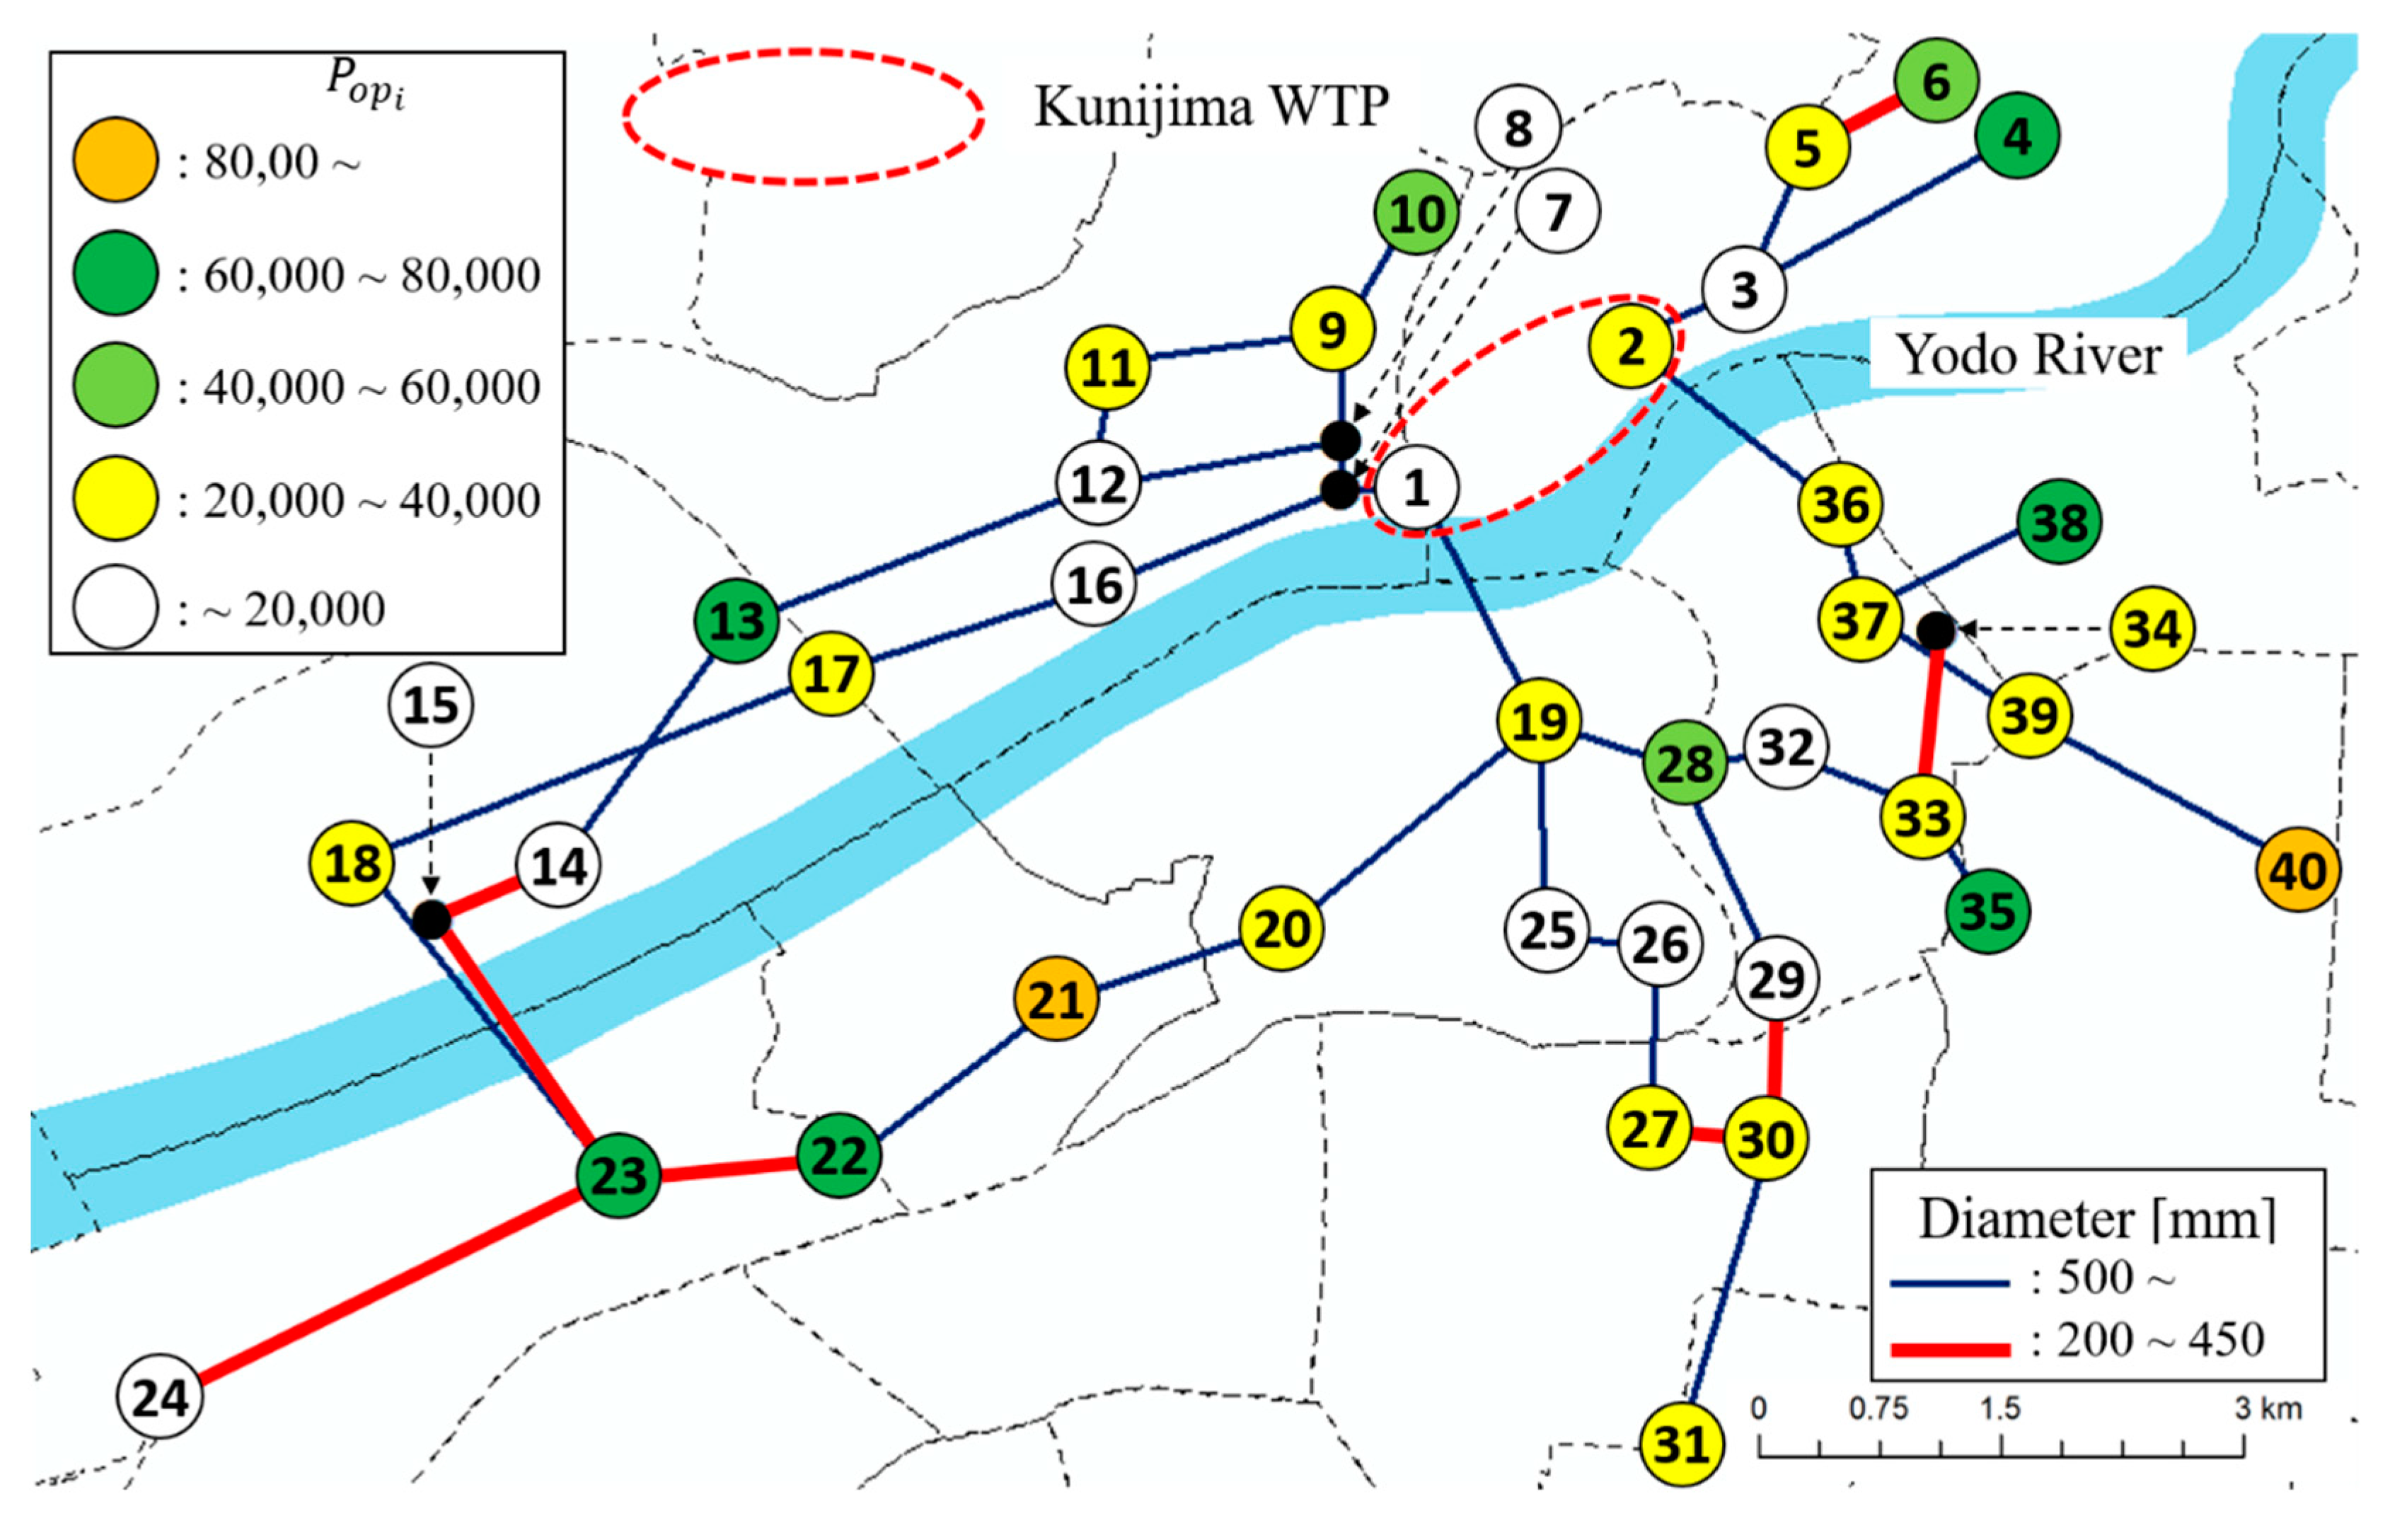
Figure 3 shows the core pipeline network of the Kunijima WTP that we created according to the 100-year history of Osaka City Waterworks Bureau [32]. Nodes 1 and 2 directly connect to the Kunijima WTP. This network distributes water to the northern parts of Osaka City, where the population is concentrated, through multiple routes (Figure 3). The distance between each node represents the total pipeline length used to distribute water from the Kunijima WTP to the nodes.
In the water supply area of the Kunijima WTP, the is greater than 15 when liquefaction is severe [23]; thus, the related to liquefaction is assumed to be constant at 2.4 ([30]; Table S1 in Supplementary Materials). The measurement of seismic intensity ( = 5.75) was calculated from the seismic intensity class indicated in the damage assumption [34]. (=46.5) was calculated using Equation (5).
4.2. Base Case: Water Outage Rate and Expected Water Outage Population
Node 32 is located in a dense area of nodes. Because no meshes and populations in these meshes were assigned to Node 32, we excluded this node from Table S2 in Supplementary Materials. The populations assigned to each node range from 8332 to 99,985. The most populous node, Node 40, is located in a densely populated area with a few nodes nearby. The population belonging to the mesh of each node and the total amount of water supplied to the area Table S2 in Supplementary Materials.
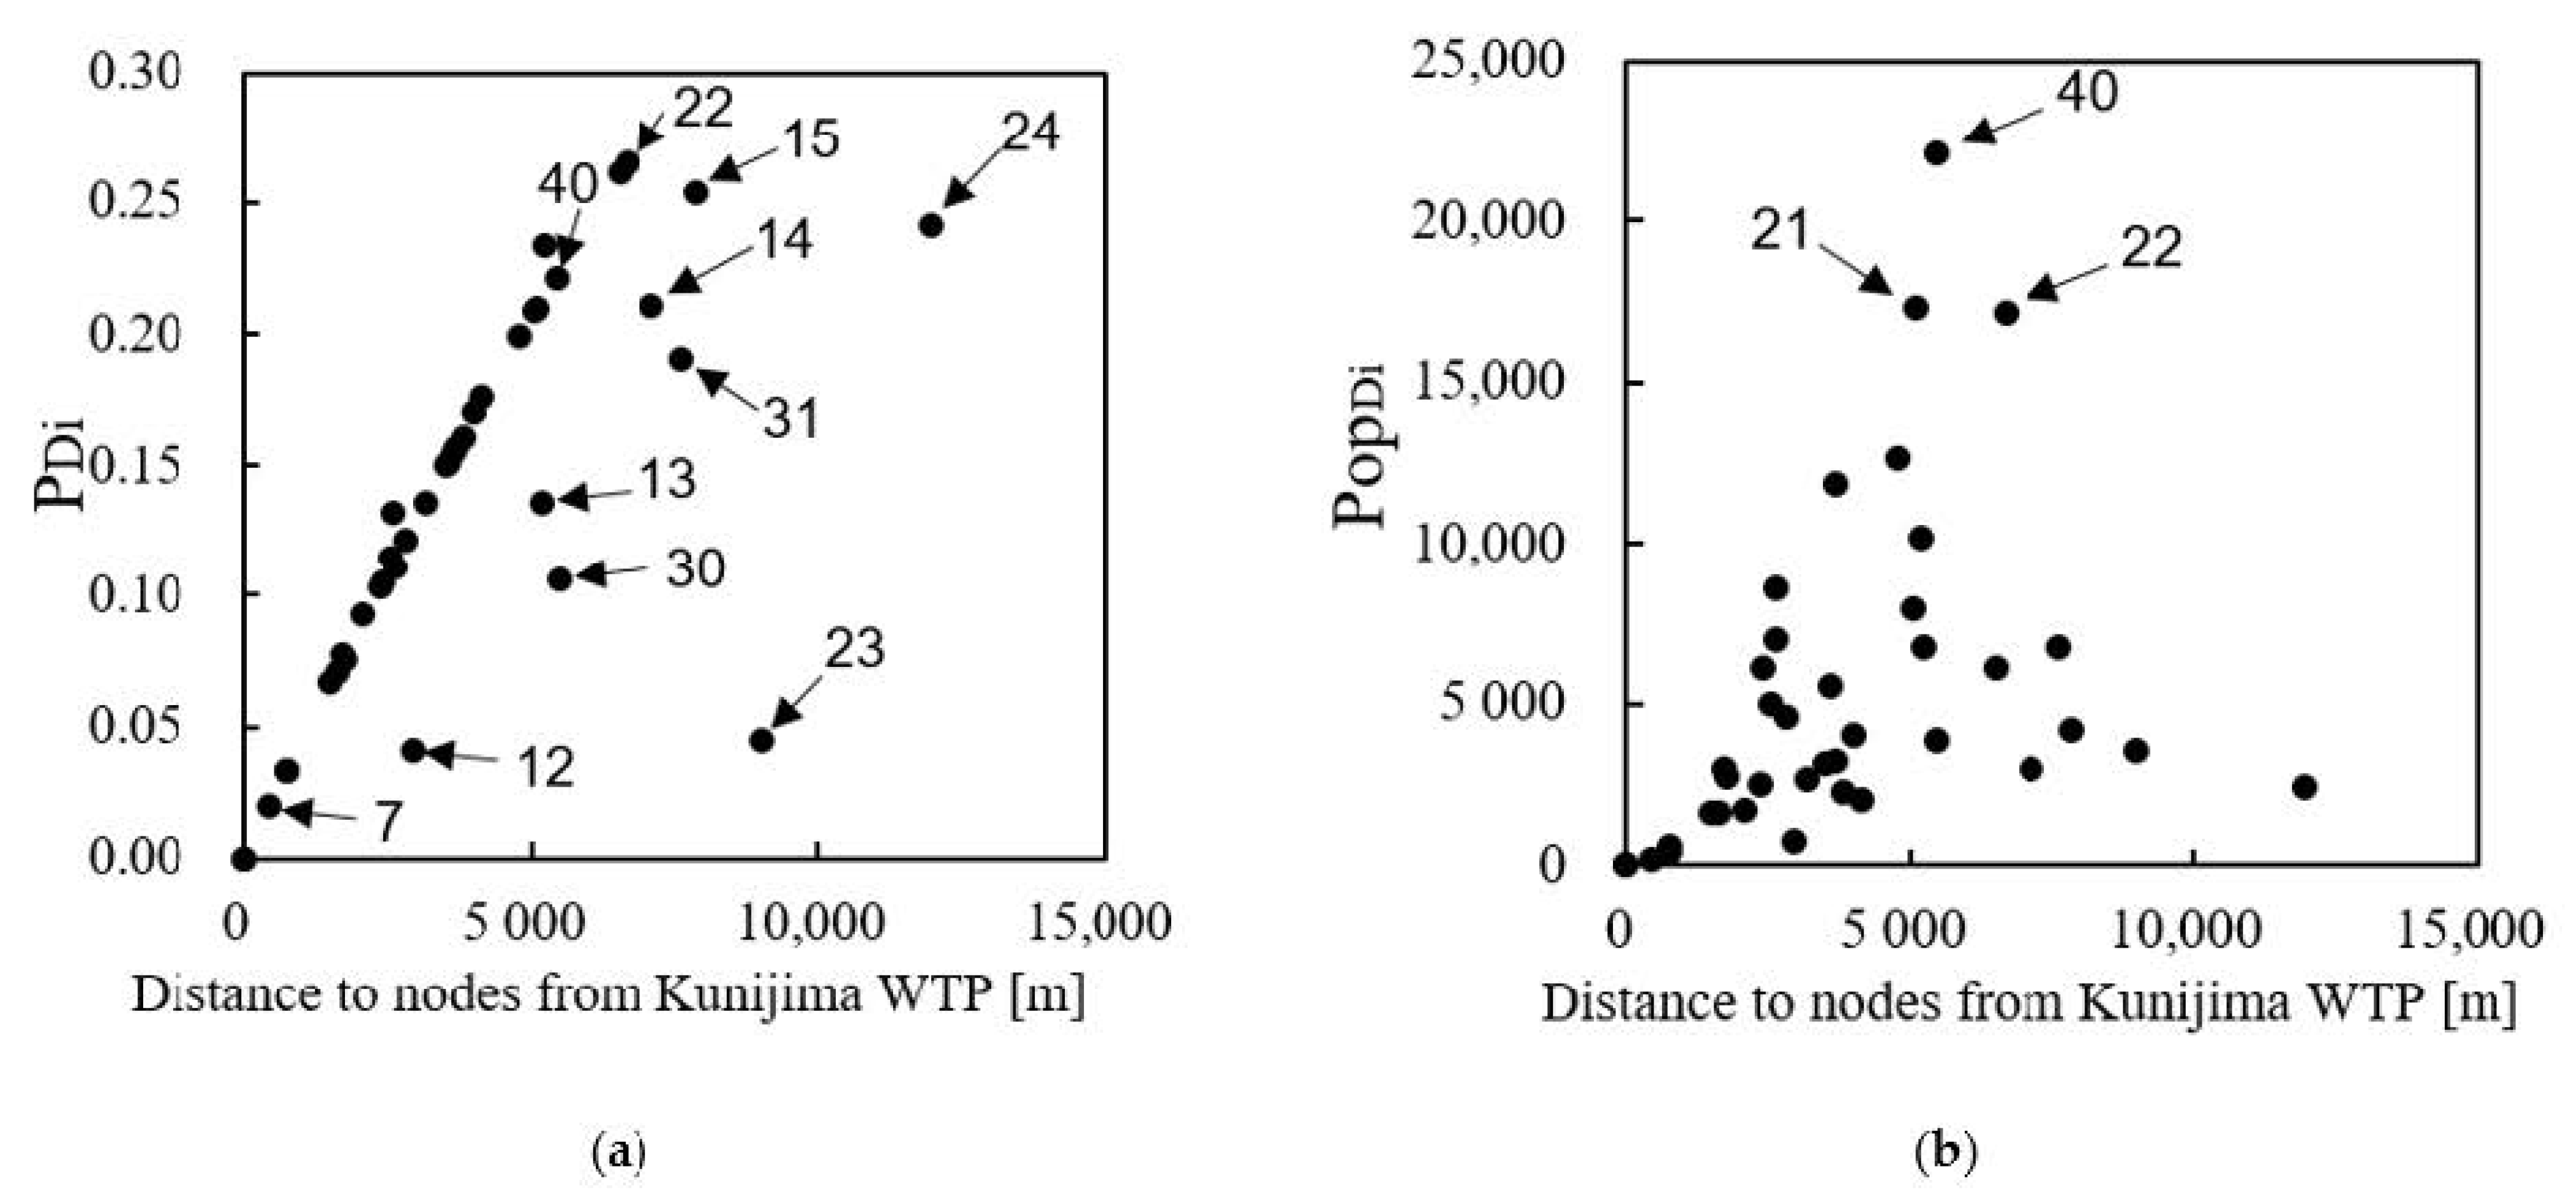
Figure 4a shows the relationship between the probability of a water outage occurring out of 10,000 trials and the distance from the Kunijima WTP. The values for Node 32 were excluded from the calculations, as mentioned above. The distance to each node represents the total pipeline length used to distribute water from the Kunijima WTP to the nodes. If multiple routes to a node are available, we take the average of all distances for each route and consider this value as the distance from the Kunijima WTP. Node 7 had the smallest water outage rate and population and was connected to the Kunijima WTP by a short pipeline. By contrast, Node 22 had the highest water outage rate and was located the farthest from the Kunijima WTP among the nodes distributed by one route. Node 40, which had the largest population, had the largest water outage rate and a high water outage population of 22,157.
Figure 4b shows the relationship between the expected water outage population and the distance from the Kunijima WTP. The origin is Nodes 1 and 2, which are directly connected to the Kunijima WTP. The expected water outage population is calculated from the product of the water outage rate and the population, as shown in Equation (19). Therefore, nodes with a large water outage rate and population, such as Nodes 40,21, and 22, have large water outage populations. The water outage rate increased in proportion to the distance from the Kunijima WTP, but the expected water outage population did not have a clear correlation with the distance from the WTP. The expected water outage population tended to decrease at nodes that were close to the WTP. When the water outage rate was between 0 and 0.3, the population differed by 8000–10,000; thus, the influence of the population is considered to be large. On the other hand, at nodes far from the WTP, there was a large difference between the node where the expected water outage population was high and the node where the expected value was low. This finding may be attributed to the fact that the expected water outage population depends on the population of the water supply area. Thus, even if the distance from the WTP is large and the breakage rate is small, the expected water outage population is small in areas with a small population.
4.3. Case 1: Pipeline Replacement by Order of Breaking Rate
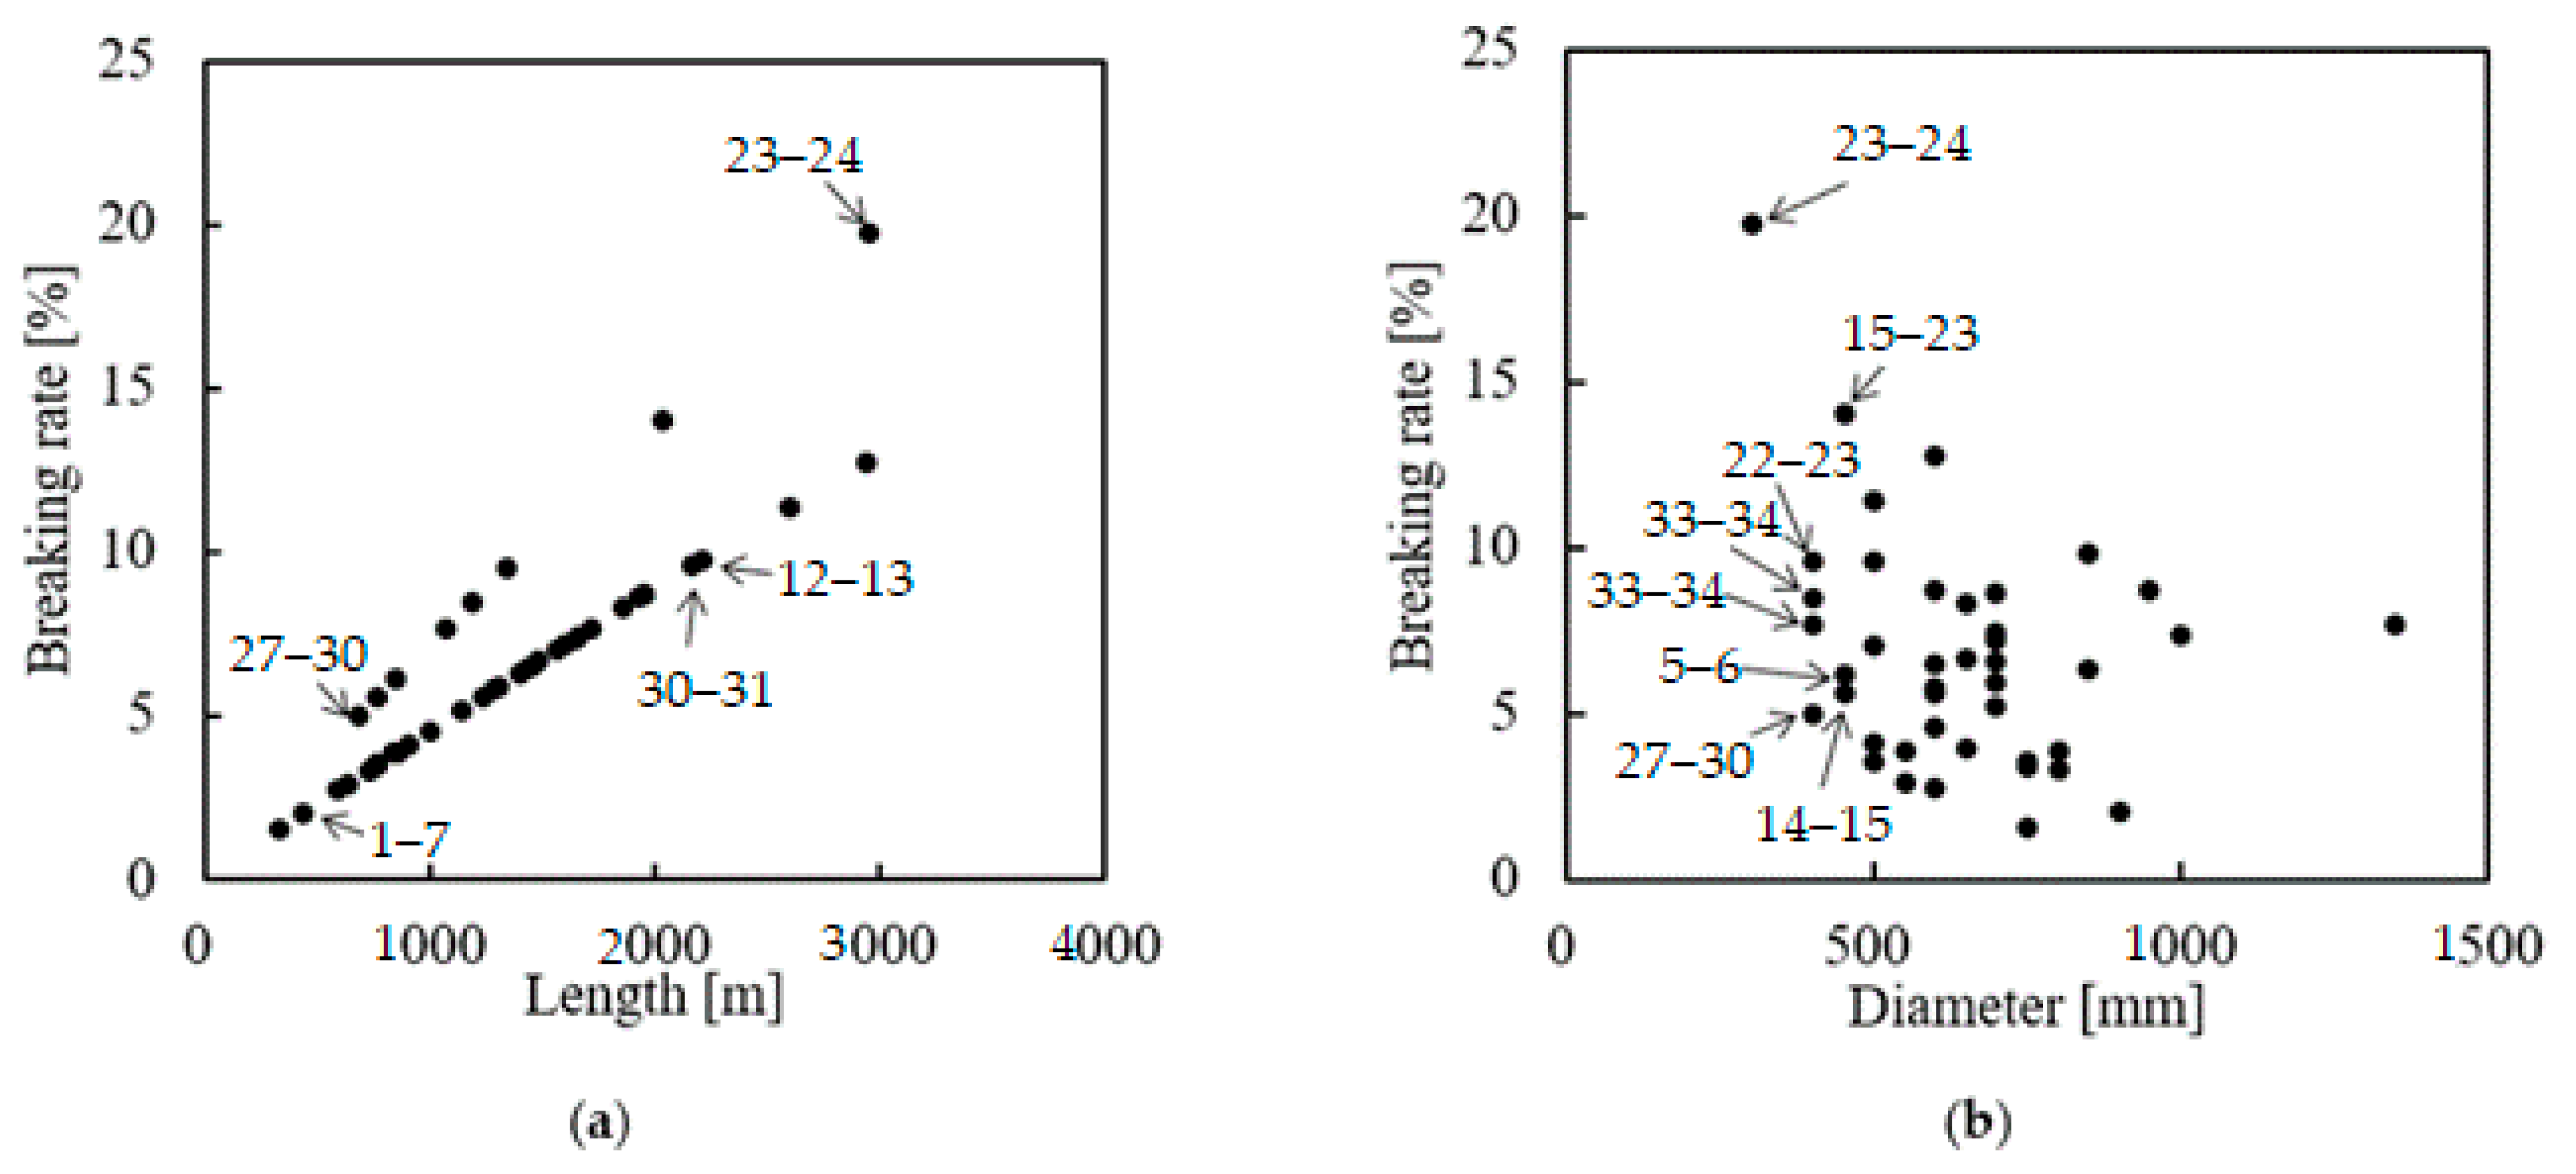
Figure 5a shows the relationship between pipeline length and breaking rate. Figure 5b shows the relationship between pipeline diameter and breaking rate. Pipeline 1–7 is a pipeline that connects Nodes 1 and 7. The length of the pipelines in the water supply area of the Kunijima WTP ranges from 335 m to 2950 m, and the diameter of the pipelines ranges from 300 mm to 1350 mm. Because all of the pipelines have diameters larger than 200 mm, may be 0.8 or 0.5 from Table S1 in Supplementary Materials. Pipelines 5–6, 14–15, 15–23, 22–23, 23–24, 27–30, 29–30, and 33–34 have diameters of 450 mm or less ( = 0.8). In Equation (6), and flow velocity coefficient are constant, which means the pipeline diameter is proportional to the water distribution and length of the pipe. Therefore, the diameters of pipelines at the end of the network tend to be small because the amount of water distributed by these pipelines is small. Because the , liquefaction risk, and topography are identical in each pipeline, the diameter and length of a pipeline affect its breaking rate.
The relationship between breaking rate and pipeline length was divided into two straight lines. Pipelines 5–6, 14–15, 15–23, 22–23, 23–24, 27–30, 29–30, and 33–34 showed a straight line with a large slope. These pipelines had diameters of less than 500 mm and small breaking rates. Compared with the relationship between pipeline diameter and breaking rate, they had no correlation. Pipeline length had a great effect on the breaking rate. The breaking rate was between approximately 2% and 20%. Pipeline 1–7, which had the smallest breaking rate, is connected to the Kunijima WTP; this pipeline is short but wide and carries a large amount of water. Pipeline 23–24 is a terminal pipeline and had a very high breaking rate. The results showed that this pipeline is long but its water volume and diameter are relatively small. The pipeline length had a stronger effect on the breaking rate than the pipeline diameter. This finding may be due to the fact that the number of occurrences of water supply pipeline damage is proportional to the pipeline length (Equation (7)). Interestingly, all of the pipelines with a breaking rate of over 10% had lengths exceeding 2000 m and, thus, large numbers of breaking points. Pipelines 12–13 and 30–31 are over 2000 m long but their breaking rate was less than 0.1 because they have large diameters.
Pipeline 23–24, which has the highest priority of renewal, was at the end of the pipeline network. This pipeline has a small water distribution and diameter and a long length, resulting in a large breaking rate. The breaking rates of pipelines 15–23, 17–18, and 18–23 were over 10%. These pipelines are also relatively long. Because the diameter of pipeline 15–23 is 450 mm or less ( = 0.8), the breaking rate of this pipeline was especially large. Pipelines 25–26, 28–32, 1–7, and 7–8 are short, and their breaking rates, at less than 3%, are small. The ideal order of pipeline renewal in Case 1 is shown in Table S3 in Supplementary Materials.
4.4. Case 2: Pipeline Replacement by Order of Water Distribution
In pipelines 1–19, 1–7, 7–8, and 2–36, the amount of water is the largest in pipelines near the Kunijima WTP and the smallest in pipelines located at the ends of the network. Pipeline 23–24 is the smallest pipeline, Node 24 is the terminal node, and the population of this area is 10,023. The amount of water is small in end pipelines and large in pipelines close to the WTP. The water distribution volume of each pipeline Table S4 in Supplementary Materials. Here, the pipelines at the end of the network are not given a high priority for renewal owing to their small water distribution volume. However, in case these pipelines do not have a loop structure, they should be given high priority (see Section 3.1 for details). For future studies, an evaluation index that reflects the network structure such as loops should be considered.
4.5. Case 3: Pipeline Replacement by Order of Risk Score
Among the risk scores obtained, the risk score of pipeline 1–19, which has the largest water distribution and is the longest among the pipelines studied, was the highest. Pipeline 27–30, which is located near the end of the network, is short and has a small water distribution amount and breaking rate. Therefore, the risk score of pipe 27–30 was low. The risk score of each pipeline is shown in Table S5 in Supplementary Materials.
4.6. Cost-Effectiveness
4.6.1. Renewal Cost
The renewal costs of pipelines 1–19, 2–36, 15–23, and 18–23, which cross the Yodo River, were calculated using Equation (22). These pipelines have higher renewal costs than the other pipelines. In addition to these four pipelines, pipeline 19–20 had the highest renewal costs. The renewal cost of pipelines crossing the Yodo River was over twice that of pipeline 19–20. The high renewal costs for pipelines 19–20 and 12–13 are due to the fact that renewal costs depend on the length of the pipeline. Pipeline 27–30 had the lowest renewal cost. Equation (21) reveals that the construction cost per unit length of a pipeline increases exponentially as the pipeline diameter increases. Because pipeline 27–30 is short and the amount of water flowing through it is relatively low, the diameter of this pipeline is small and its construction cost per unit length is low. The renewal cost of each pipeline is shown in Figure S4 in Supplementary Materials.
4.6.2. Evaluation of Earthquake Resistance Countermeasures
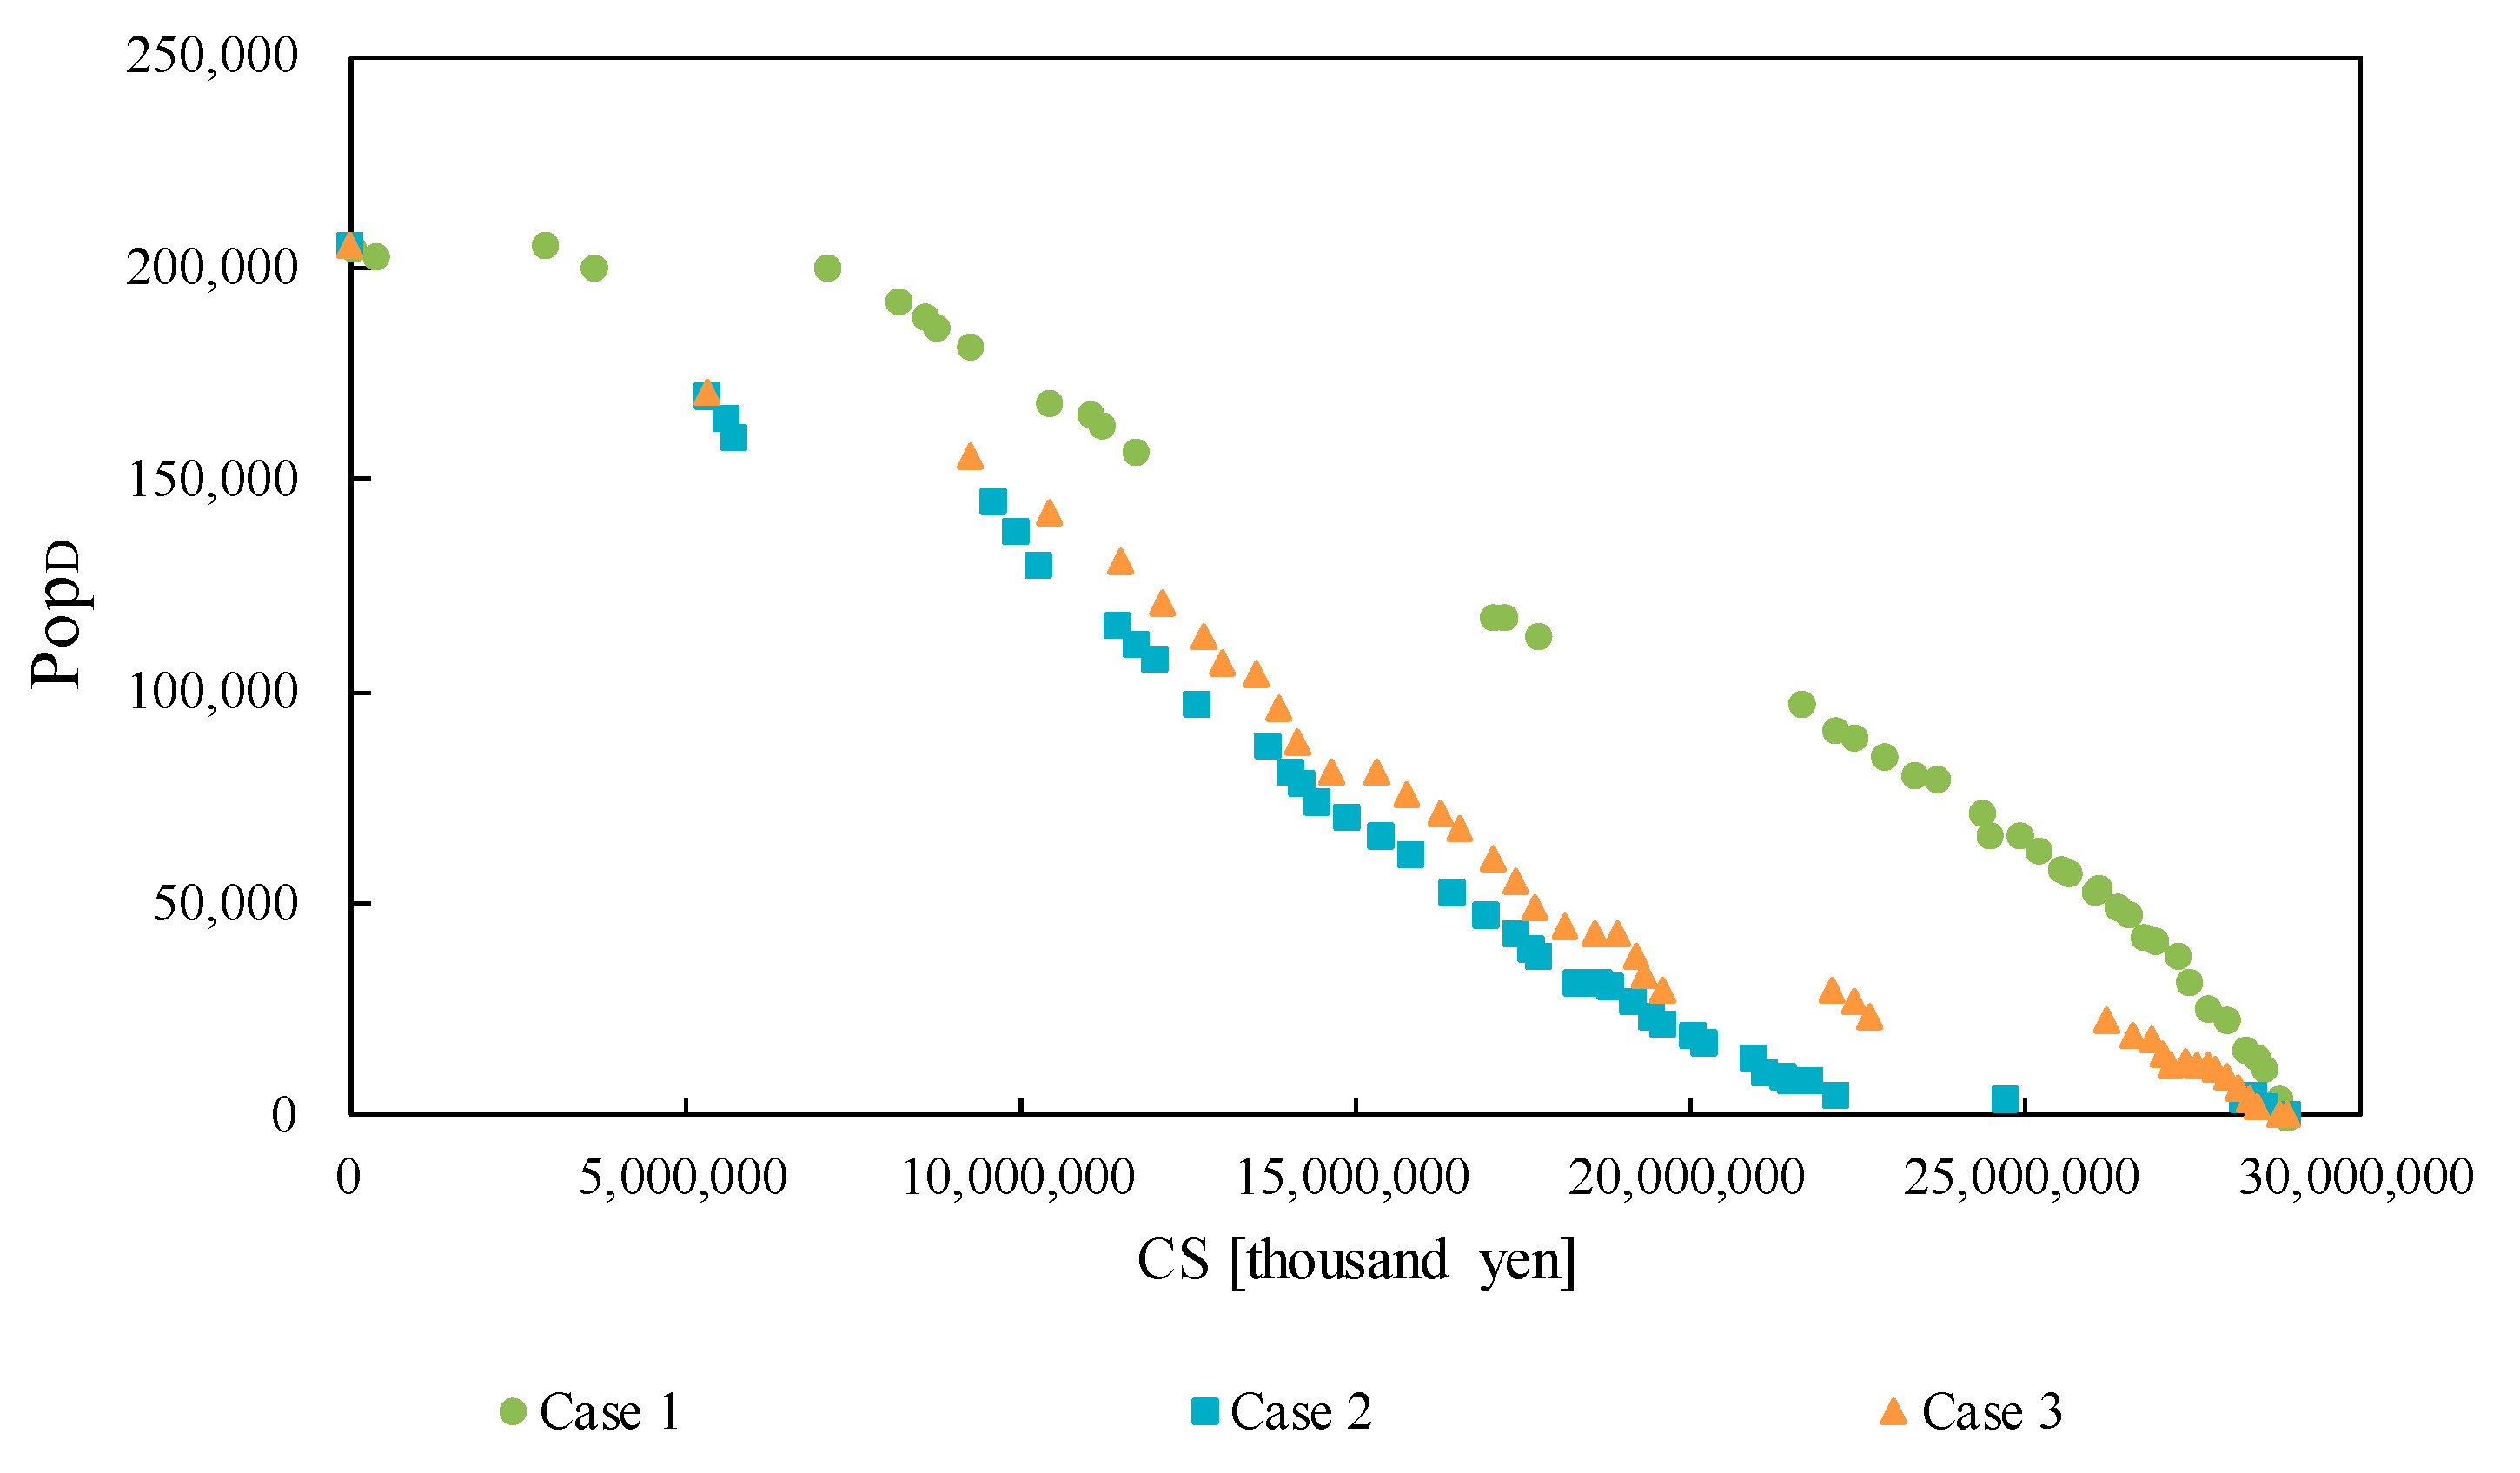
Figure 6 shows the change in renewal cost and expected water outage population in Cases 1–3. In all three cases, the expected water outage population becomes 0 when the renewal rate of all pipelines reaches 100%. Among the cases investigated, Case 2 has the lowest renewal cost and expected water outage population. In other words, renewing the pipelines by selecting those with the largest water distribution first could reduce the water outage population due to future earthquakes at a lower cost. Moreover, the effects of earthquake-resistant construction may be obtained at an earlier stage. In this case, wastewater amount is the most suitable index for judging seismic resistance priority because the pipeline network and population are similarly taken into consideration.
4.6.3. Comparison with the Current Earthquake-Resistance Plan in Osaka City
In this section, we show the results of Section 3.2. We compared the case that reflects the actual seismic resistance of the core pipelines in the water supply area of the Kunijima WTP and Cases 1–3. Table 1 compares the simulation results obtained when 75% of the core pipelines are made seismic-resistant for the different cases in this study.
Among the cases studied, Case 2 has the highest cost-effectiveness. The expected water outage populations to the current earthquake-resistance plan in Osaka City and Case 2 are 29,952 and 8219, respectively. The decreases in expected water outage population from the base case to the current earthquake-resistance plan and Case 2 are 175,012 and 196,745, respectively. If the earthquake-resistance plans are implemented by Case 2, that is, approximately 20,000 people would not be affected by water outage. The renewal costs of the current plan in Osaka City and Case 2 are JPY 25,266 million and JPY 21,511 million, respectively; here, the renewal cost of the latter is approximately JPY 3500 million higher than that of the former. However, even after the pipelines are renewed in Osaka City in the current plan, the population in this city suffering from water outages does not decrease compared with that in Case 2. Thus, the cost-effectiveness of the current pipeline renewal plan in Osaka City is reduced. The cost-effectiveness of the current pipeline renewal plan in Osaka City translates to a reduction of 6.93 people per million Yen; by comparison, the cost-effectiveness of the pipeline renewal plan in Case 2 translates to a reduction of 9.15 people per million Yen, namely, our renewal plan will reduce the water outage population by 24% compared with the present one.
4.7. The Impact of the Pipe Material
For further research, the impact of the pipe materials should also be considered. Table 2 lists the correction factors regarding the pipeline materials that are set from the damage analysis of previous earthquakes based on the cast iron pipeline [30]. These factors are connected to the vulnerability of pipelines, thus suggesting that pipelines made of materials with a larger correction factor are more susceptible to physical damage by earthquakes.
The ratio of core pipelines made of ductile iron was roughly 78% in Osaka City from the data of 2018 [35], whereas that in Japan as a whole was approximately 67% from the data of 2015 [29]. Considering these data, Osaka City is an area with a high ratio of ductile iron pipelines compared with the average of Japan.
Considering ductile iron pipelines have a smaller correction factor than pipelines made of other materials and are less likely to be ruptured [30] (Table 2), the breaking rate of pipelines and subsequent water outage population are larger in the areas where the ratio of pipelines other than ductile iron or steel is high. Promoting the construction to update the pipelines and their joints into earthquake-resistant ones in these areas is advantageous.
Our model also enables us to calculate the breaking rate and water outage population with different pipeline materials in these areas by applying each correction factor.
5. Conclusions
This study evaluated the vulnerability of water supply pipelines breakage due to large-scale earthquakes and determined the priority of earthquake-resistance measures based on this vulnerability. We focused on the water supply area of the Kunijima WTP as an example of an urban area and determined the appropriate priority for renewing pipelines for earthquake resistance. Specifically, we focused on the breaking rate, the water distribution in each area, and the risk score of each pipeline under the effect of the Nankai Trough earthquake. Our conclusions based on our three research objectives are summarized below.
(1) We proposed a practical method to evaluate the progress of a pipeline renewal plan. We compared four cases and performed cost–benefit analysis by employing the scenario approach. The main evaluation indices were expected water outage population and cost-effectiveness. We showed that the expected water outage populations are quite high in densely populated areas located far from WTP. Water distribution is the most important index with which to determine the priority order of pipelines to be renewed. Compared with this index, the use of breaking rate or risk score could realize higher cost-effective renewal. Pipelines with the largest water distributions will cause the greatest damage to the population in the area when they are broken. Renewing pipelines according to their water distribution is the most effective measure to reduce the water outage population after an earthquake.
(2) We verified the feasibility of the proposed method by applying it to an actual WTP and its water distribution network. We evaluated the renewal plan for the core pipeline networks of the Kunijima WTP under the effect of the Nankai Trough earthquake and then compared the current earthquake-resistance plan of Osaka City with three other cases in terms of cost-effectiveness. The expected water outage population in Osaka City in the current plan under the earthquake was approximately three times higher than that in Case 2. Moreover, while the renewal cost for the current plan of Osaka City was as high as JPY 3500 million, the cost-effectiveness of this plan is fairly low. We concluded that the pipelines near the WTP that have not yet been made earthquake resistant in the current plan must be renewed immediately. Although the pipeline near the WTP has a low breaking rate, it distributes a large amount of water, which will lead to great numbers of water outage population. Thus, the renewal priority of the area of these pipelines is high. However, this model can underestimate or overestimate the water outage population in the following cases: (1) The amount of water in the upstream pipelines becomes smaller than 1/100 compared with that of normal cases due to the break of downstream pipelines, which expands the water outage area and (2) the direction of water flow in the loop pipeline network is reversed as an emergency response. Subsequently, water is supplied from the pipeline of the downstream area. In addition, if the pipelines at the end of the network do not have a loop structure, they are more likely to experience water outage because water cannot be supplied from other pipelines. This situation is considered to have a high priority for renewal.
This study deals only with pipelines and does not consider damage to facilities, such as WTPs and water distribution plants. However, when assessing the water outage rate in detail, considering cases in which these facilities are damaged should be necessary. In future research, it is also required to construct a more practical renewal plan considering the aging of pipelines. In this study, water demand was calculated from the maximum daily water supply though, the water demand fluctuates depending on the season and time zone in reality. However, since the water outage rate is calculated by the ratio of water demand and water supply, the water outage rate does not change.
Finally, we concluded that our approach can be applied to areas other than the water supply area of the Kunijima WTP to simulate pipeline renewal.
Supplementary Materials
The following are available online at https://www.mdpi.com/2073-4441/13/4/572/s1, Table S1: Correction factors, Figure S1: Overview of the three established cases and base case, which carries out no earthquake-resistance countermeasures, Table S2: The population and the sum of the amount of water supplied to the area in each node, Figure S2: The relationship between the distance to nodes from Kunijima WTP, water outage rate (), and expected water outage population () in the base case, Table S3: Ideal order of renewal in Case 1 and the breaking rate of each pipeline, Figure S3: The relationship between breaking rates of water pipelines, their lengths, and diameters. The numbers in the graph correspond to those of pipelines in Figure 3, Table S4: Ideal order of renewal in Case 2 and the water distribution volume of each pipeline, Table S5: Ideal order of renewal in Case 3 and the risk score of each pipeline, Figure S4: Renewal cost of the studied pipelines.
Author Contributions
Conceptualization, S.H., L.I. and A.T.; Data curation, S.H.; Formal analysis, S.H.; Funding acquisition, A.T.; Investigation, S.H.; Methodology, S.H., L.I. and A.T.; Resources, A.T.; Supervision, L.I. and A.T.; Validation, S.H., L.I. and A.T.; Visualization, S.H.; Writing—original draft, S.H.; Writing—review & editing, L.I. and A.T. All authors have read and agreed to the published version of the manuscript.
Funding
This research was funded by the Environment Research and Technology Development Fund of the Environmental Restoration and Conservation Agency of Japan, grant number JPMEERF18S11702.
Institutional Review Board Statement
Not applicable.
Informed Consent Statement
Not applicable.
Data Availability Statement
The data presented in this study are available on request from the corresponding author.
Acknowledgments
The authors would like to thank the Osaka City Waterworks Bureau for providing the dataset for this research.
Conflicts of Interest
The authors declare no conflict of interest.
References
- The Headquarters for Earthquake Research Promotion. Nankai Trafu De Hassei Suru Jishin (Earthquake Occurring in Nankai Trough). 2013. Available online: https://www.jishin.go.jp/regional_seismicity/rs_kaiko/k_nankai (accessed on 4 January 2021).
- The Headquarters for Earthquake Research Promotion. Nankai Trafu No Jishin Katsudou No Thouki Hyouka (Dai 2 Han) (Long-Term Evaluation of Nankai Trough Earthquake (Second Edition)). 2013. Available online: https://www.jishin.go.jp/main/chousa/kaikou_pdf/nankai_2.pdf (accessed on 4 January 2021).
- The Cabinet Secretariat in Japan. Tsuyoku Shinayaka Na Kokumin Seikatsu No Jitsugen Wo Hakaru Tame No Bousai Gensai Ni Shisuru Kokudo Kyoujinka Kihonhou (The Basic Law for Strengthening National Land to Contribute to Disaster Prevention and Mitigation to Realize a Strong and Supple National Life). 2013. Available online: https://www.cas.go.jp/jp/seisaku/kokudo_kyoujinka/pdf/kihon_honbun2.pdf (accessed on 4 January 2021).
- The Ministry of Health, Labour, and Welfare. Higashi Nihon Daishinsai Suidou Shisetsu Higai Joukyou Tyousa Saishuu Houkokusho (Final Report on Damage to Water Supply Facilities after the 2011 off the Pacific Coast of Tohoku Earthquake). Available online: https://www.mhlw.go.jp/topics/bukyoku/kenkou/suido/houkoku/suidou/130801-1.html (accessed on 4 January 2021).
- The Ministry of Health, Labour and Welfare. Heisei 28 Nenn (2016 Nenn) Kumamoto Jishin Suidou Shisetsu Higai Tou Genchi Tyousadan (The 2016 Kumamoto Earthquake Water Supply Facility Damage, etc. Field Survey Team Report). Available online: https://www.mhlw.go.jp/topics/bukyoku/kenkou/suido/houkoku/suidou/140421-1.html (accessed on 4 January 2021).
- National Resilience Promotion Headquarters of Cabinet Secretariat. Kokudo Kyoujinka Nenji Keikaku 2020 (National Resilience Annual Plan 2020). Available online: https://www.cas.go.jp/jp/seisaku/kokudo_kyoujinka/pdf/nenjikeikaku2020_02.pdf (accessed on 4 January 2021).
- The Ministry of Health, Labour and Welfare. Water Supply Administration. Available online: https://www.mhlw.go.jp/english/wp/wp-hw5/dl/23010304e.pdf (accessed on 4 January 2021).
- Tamura, S.; Kawakami, E. Monte Carlo Hou Ni Yoru Tityuu Maisetsu Kan System No Taishinsei Hyouka Houhou (Seismic Risk Analysis of Underground Lifeline Systems by Use of Monte Carlo Method). J. Jpn. Soc. Civ. Eng. 1981, 1981, 37–48. [Google Scholar]
- Adachi, T.; Ellingwood, B.R. Serviceability of earthquake-damaged water systems: Effects of electrical power availability and power backup systems on system vulnerability. Reliab. Eng. Syst. Saf. 2008, 93, 78–88. [Google Scholar] [CrossRef]
- Shi, P.; O’Rourke, T.D. Seismic Response Modeling of Water Supply Systems; Technical Report MCEER-08-0061; University at Buffalo: Buffalo, NY, USA, 2008. [Google Scholar]
- American Lifelines Alliance. Seismic Fragility Formulations for Water Systems Part 1 Guideline; American Lifelines Alliance: Washington, DC, USA, 2001. [Google Scholar]
- Murata, K.; Miyajima, M. Suidoukan Mou Tokusei Ni Yoru Taishinsei Hyouka To Sono Toushi Kouka Bunseki Ni Tsuite (The Earthquake Resistance Evaluation According to The Hydraulic Characteristic of Water Pipeline Network). J. Jpn. Soc. Civ. Eng. Ser AI Struct. Eng. Earthq. Eng. 2005, 28, 67. [Google Scholar] [CrossRef]
- Yoo, D.G.; Jung, D.; Kang, D.; Kim, J.H. Seismic-Reliability-Based Optimal Layout of a Water Distribution. Water 2016, 8, 50. [Google Scholar] [CrossRef] [Green Version]
- Mori, M.; Inakazu, T.; Koizumi, A.; Watanabe, H.; Numata, A. Monte Carlo Hou Wo Mochiita Suidou Kanro Koushin Keikaku No Hyouka (Evaluation of water pipeline renewal plan using Monte Carlo method). Environ. Syst. Res. 2009, 37, 1–8. [Google Scholar]
- Kunizane, T.; Inakazu, T.; Arai, Y.; Koizumi, A.; Hashimoto, H.; Yoshizawa, K. Haisui Honkan Nettowa-ku Kouzou Niyoru Jiko Eikyou Wo Kouryo Shita Kanro Koushin No Yuusendo Hyouka (Study on Evaluation of Pipe Leakage Accident Considering the Distribution Network Structure for Pipeline Renewal Plan). J. Jpn. Soc. Civ. Eng. G 2015, 71, 451–458. [Google Scholar]
- Kunizane, T.; Inakazu, T.; Koizumi, A.; Arai, Y.; Satou, K.; Kakinuma, M.; Hasegawa, S.; Yanai, S.; Fukase, K. Monte Carlo Simulation Ni Yoru Haisui Shoukan Network No Shinsai Higai Eikyou No Bunseki (Influence Analysis on Earthquake Damage of Water Distribution Network by Monte Carlo Simulation). J. Jpn. Soc. Civ. Eng. G 2016, 72, 457–465. [Google Scholar]
- Kunizane, T.; Inakazu, T.; Koizumi, A.; Arai, Y.; Satou, K.; Fujikawa, K.; Hasegawa, S.; Fukase, K. Shinsaiji No Dansui Eikyou Wo Kouryo Shita Haisuikammou No Taishinka Koushin Keikaku Ni Kansuru Kenkyuu (Study on the earthquake resistance renewal plan of the water distribution network in consideration of the suspension of water supply influence at the time of the earthquake). J. Jpn. Soc. Civ. Eng. G 2017, 73, 515–524. [Google Scholar]
- Kumaki, Y.; Miyajima, M. Dakutairu Itetsu Kan No Tsugite Keishiki Betsu Higai Ni Kansuru Ichi Kousatsu (A Study of Damage to Ductile Iron Pipelines by Type of Joint). J. Jpn. Soc. Civ. Eng. A1 2012, 68, 195–201. [Google Scholar]
- The Ministry of Health, Labour and Welfare. Niigata Ken Chuuetsu Jishi Suidou Higai Chousa Houkoku Sho 5shou Maisetsu Kannro No Higai Joukyou (Mid Niigata Prefecture Earthquake in 2004 Water Supply Damage Survey Report Chapter 5: Damage to Buried Pipelines). 2005. Available online: https://www.mhlw.go.jp/topics/bukyoku/kenkou/suido/topics/niigata/dl/houkoku5.pdf (accessed on 6 February 2021).
- The Ministry of Health, Labour and Welfare. Higashi Nihon Daishinsai Suidou Shisetsu Higai Joukyou Thousa Saishuu Houkoku Sho (The Great East Japan Earthquake Waterworks Facility Damage Survey Final Report). 2013. Available online: https://www.mhlw.go.jp/topics/bukyoku/kenkou/suido/houkoku/suidou/130801-1.html (accessed on 6 February 2021).
- Osaka City Waterworks Bureau. Suidoukan No Koushin (Taishinka) No Torikumi Ni Tsuite (About Renewal of Water Pipelines (Earthquake Resistant)). Available online: https://www.city.osaka.lg.jp/suido/page/0000091835.html (accessed on 4 January 2021).
- Osaka City. Suikei Jinkou (Estimated Population). Available online: https://www.city.osaka.lg.jp/shisei/category/3055-2-3-1-0-0-0-0-0-0.html (accessed on 4 January 2021).
- Osaka Prefectural Government. Nankai Torafu Jishin Taisaku, Raifurain Nado Shisetsu Higai Keizai Higai Nado Osaka Fu Iki (Countermeasure of Nankai Trough, such as damage of Lifelines and Plants and Economic Damage in Osaka). Available online: http://www.pref.osaka.lg.jp/attach/31241/00267387/03lifeline.ppt%20%20.pdf (accessed on 4 January 2021).
- Osaka Prefectural Government. Thiiki Bousai Keikaku Higai Soutei, Nankai Trafu Jishin Taisaku, Shindo Bumpu Ekijouka Kanousei (Regional Disaster Prevention Plan and Damage Estimation, Nankai Trough earthquake Countermeasures, Seismic intensity distribution, Liquefaction potential). Available online: http://www.pref.osaka.lg.jp/kikikanri/keikaku_higaisoutei/sindobunpu_etc.html (accessed on 4 January 2021).
- Iwasaki, T.; Tokida, K.; Tatsuoka, F. Soil Liquefaction Potential Evaluation with Use of the Simplified Procedure. In Proceedings of the International Conferences on Recent Advances in Geotechnical Earthquake Engineering and Soil Dynamics, St. Louis, MO, USA, 26 April–3 May 1981; Volume session02/12. [Google Scholar]
- Hamamoto, S.; Ito, L.; Yoneyama, N.; Tokai, A. Case Study for the Predictive Environmental Risk Assessment of Hexamethylenetetramine Release to the Yodo River during a Massive Tsunami Attack. Water 2021, 13, 549. [Google Scholar] [CrossRef]
- Fujimoto, K.; Midorigawa, S. Empirical Method for Estimating J.M.A. Instrumental Seismic Intensity from Ground Motion Parameters Using Strong Motion Records during Recent Major Earthquakes. J. Soc. Saf. Sci. 2005, 7, 241–246. [Google Scholar]
- The Japan Water Works Association. Suidou Shisetsu Sekkei Shisin 2012 (Water Supply Facility Design Guidelines 2012); The Japan Water Works Association: Tokyo, Japan, 2012. [Google Scholar]
- The Japan Water Works Association. Suidou Toukei Heisei 27 Nenndi Shisetsu Gyoumu Hen (1 April 2015~31 March 2016 Dai 98-1 Gou) (Water Statistics 2015 Facility/Business Edition (1 April 2015–31 March 2016) No. 98–101); The Japan Water Works Association: Tokyo, Japan, 2016. [Google Scholar]
- Isoyama, R.; Ishida, E.; Yune, S.; Shiramizu, N. Suidou Kanro No Jishin Higai Yosoku Ni Kansuru Kenkyuu (Study on damage prediction of water pipes by earthquake). J. Jpn. Water Work. Assoc. 1998, 67, 25–40. [Google Scholar]
- E-Stat, Portal Site of Official Statistics. Jinkou Nado Kihon Shukei Ni Kansuru Jikou (Data on Basic Aggregation Such as Population). Available online: https://www.e-stat.go.jp/gis/statmap-search?page=1&type=1&toukeiCode=00200521&toukeiYear=2015&aggregateUnit=H&serveyId=H002005112015&statsId=T000847&prefCode=27 (accessed on 4 January 2021).
- Osaka City Waterworks Bureau. Osaka Shi Suidou Hyakunen Shi (100-Year History of Osaka City Water Supply); Osaka City Waterworks Bureau: Osaka, Japan, 1996. [Google Scholar]
- The Ministry of Health, Labour and Welfare Water Supply Division. Suidou Jigyou No Sai Kouchiku Ni Kansuru Shisetsu Koushin Hiyou Santei No Tebiki (Guide for Facility Renewal Cost Calculation Regarding Reconstruction of Water Supply Business). Available online: https://www.mhlw.go.jp/topics/bukyoku/kenkou/suido/houkoku/suidou/dl/tp120313-1.pdf (accessed on 4 January 2021).
- The Japan Meteorological Agency. Keisoku Shindo No Sansyutsu Houhou (Calculation Method of Measured Seismic Intensity). Available online: https://www.data.jma.go.jp/svd/eqev/data/kyoshin/kaisetsu/calc_sindo.htm (accessed on 4 January 2021).
- Osaka Prefectural Government. Osaka Fu No Suidou No Genkyou (Heisei 30 Nendo) (2 Shisetsu·Gyoumu Hen 3) (Suidou Shisetsu No Genkyou 3–4) Kanshu Betsu Enchou (Current Status of Water Supply in Osaka Prefecture (2018) 2 Facilities and Operations 3) (Current Status of Water Supply Facilities 3–4) (Extension by Pipeline Type). Available online: http://www.pref.osaka.lg.jp/attach/4823/00358720/P45-47%203-4)kannsyubetu.pdf (accessed on 6 February 2021).
Figure 1.
The framework of the water outage population calculation model. The parallelogram and square boxes show the input and output data, respectively.
Figure 1.
The framework of the water outage population calculation model. The parallelogram and square boxes show the input and output data, respectively.

Figure 2.
Sample calculation of the amount of water flow. Arrows, circles, and squares indicate the water flow, nodes, and areas where water is supplied, respectively. The lowercase “q” and uppercase “Q” indicate the amount of water that will be carried by each pipeline and that will eventually be supplied to each area, respectively.

Figure 3.
Image of the Kunijima water treatment plant (WTP) network created according to the 100-year history of Osaka City Waterworks Bureau (1996) [32]. The color of each node and pipeline represents the population size and pipeline diameter, respectively.
Figure 3.
Image of the Kunijima water treatment plant (WTP) network created according to the 100-year history of Osaka City Waterworks Bureau (1996) [32]. The color of each node and pipeline represents the population size and pipeline diameter, respectively.

Figure 4.
The relationship between the distance to nodes from Kunijima WTP and (a) water outage rate () and (b) expected water outage population () in the base case. The numbers in each graph correspond to those of nodes in Figure 3. The relationship of these three parameters is shown as a 3D graph in Figure S2 in Supplementary Materials.

Figure 5.
The relationship between breaking rates of water pipelines and their (a) lengths and (b) diameters. The numbers in each graph correspond to those of pipelines in Figure 3. The relationship of these three parameters is shown as a 3D graph in Figure S3 in Supplementary Materials.
Figure 5.
The relationship between breaking rates of water pipelines and their (a) lengths and (b) diameters. The numbers in each graph correspond to those of pipelines in Figure 3. The relationship of these three parameters is shown as a 3D graph in Figure S3 in Supplementary Materials.

Figure 6.
The relationship between water outage population () and renewal costs of water pipelines () that are required for the constructions for the earthquake-resistance countermeasures.
Figure 6.
The relationship between water outage population () and renewal costs of water pipelines () that are required for the constructions for the earthquake-resistance countermeasures.


Table 1.
Comparison of the current earthquake-resistance plan in Osaka City and the renewal cases.
| Evaluation Index | Osaka city | Case 1 (75%) | Case 2 (75%) | Case 3 (75%) |
|---|---|---|---|---|
| Expected water outage population | 29,952 | 66,557 | 8,219 | 22,775 |
| Decrease in expected water outage population | 175,012 | 138,407 | 196,745 | 182,189 |
| Renewal cost (JPY 1000) | 25,265,786 | 24,892,000 | 21,511,202 | 26,201,553 |
| Cost-effectiveness (/JPY 1000) | 0.00693 | 0.00556 | 0.00915 | 0.00695 |
Table 2.
Correction factors of pipeline materials [30].
Table 2.
Correction factors of pipeline materials [30].
| Pipeline Materials | Correction Factor |
|---|---|
| Ductile iron (without earthquake-resistant joints) | 0.3 |
| Ductile iron (with earthquake-resistant joints) | 0 |
| Cast iron | 1.0 |
| Vinyl chloride | 1.0 |
| Steel (with welding joints) | 0.3 |
| Asbestos cement | 1.2 |
Publisher’s Note: MDPI stays neutral with regard to jurisdictional claims in published maps and institutional affiliations. |
© 2021 by the authors. Licensee MDPI, Basel, Switzerland. This article is an open access article distributed under the terms and conditions of the Creative Commons Attribution (CC BY) license (http://creativecommons.org/licenses/by/4.0/).
Share and Cite
MDPI and ACS Style
Hamamoto, S.; Ito, L.; Tokai, A. Assessment of Renewal Priority of Water Pipeline Network against Earthquake Risk. Water 2021, 13, 572. https://doi.org/10.3390/w13040572
AMA Style
Hamamoto S, Ito L, Tokai A. Assessment of Renewal Priority of Water Pipeline Network against Earthquake Risk. Water. 2021; 13(4):572. https://doi.org/10.3390/w13040572
Chicago/Turabian StyleHamamoto, Shogo, Lisa Ito, and Akihiro Tokai. 2021. "Assessment of Renewal Priority of Water Pipeline Network against Earthquake Risk" Water 13, no. 4: 572. https://doi.org/10.3390/w13040572
Note that from the first issue of 2016, this journal uses article numbers instead of page numbers. See further details here.