
Scientific Methods to Understand Fish Population Dynamics and Support Sustainable Fisheries Management
by
 , ,
, ,
Shewit Gebremedhin
1,2,* ,
,
Stijn Bruneel
1,
Abebe Getahun
3,
Wassie Anteneh
4 and
Peter Goethals
1 1
Department of Animal Sciences and Aquatic Ecology, University of Ghent, 9000 Ghent, Belgium
2
Department of Fisheries, Wetlands and Wildlife Management, Bahir Dar University, P.O. Box 5501, 6000 Bahir Dar, Ethiopia
3
Department of Zoological Sciences, Addis Ababa University, P.O. Box 1176, 1000 Addis Ababa, Ethiopia
4
Department of Biology, Bahir Dar University, P.O. Box 79, 6000 Bahir Dar, Ethiopia
*
Author to whom correspondence should be addressed.
Water 2021, 13(4), 574; https://doi.org/10.3390/w13040574
Submission received: 31 December 2020
/
Revised: 14 February 2021
/
Accepted: 19 February 2021
/
Published: 23 February 2021
(This article belongs to the Special Issue Ecology and Conservation of Freshwater Fishes Biodiversity)
Abstract
:Fisheries play a significant role in the livelihoods of the world population, while the dependence on fisheries is acute in developing countries. Fisheries are consequently a critical element for meeting the sustainable development (SDG) and FAO goals to reduce poverty, hunger and improve health and well-being. However, 90% of global marine fish stocks are fully or over-exploited. The amount of biologically unsustainable stocks increased from 10% in 1975 to 33% in 2015. Freshwater ecosystems are the most endangered ecosystems and freshwater fish stocks are worldwide in a state of crisis. The continuous fish stock decline indicates that the world is still far from achieving SDG 14 (Life Below Water), FAO’s Blue Growth Initiative goal and SDG 15 (Life on Land, including freshwater systems). Failure to effectively manage world fish stocks can have disastrous effects on biodiversity and the livelihoods and socio-economic conditions of millions of people. Therefore, management strategies that successfully conserve the stocks and provide optimal sustainable yields are urgently needed. However, successful management is only possible when the necessary data are obtained and decision-makers are well informed. The main problem for the management of fisheries, particularly in developing countries, is the lack of information on the past and current status of the fish stocks. Sound data collection and validation methods are, therefore, important. Stock assessment models, which support sustainable fisheries, require life history traits as input parameters. In order to provide accurate estimates of these life history traits, standardized methods for otolith preparation and validation of the rate of growth zone deposition are essential. This review aims to assist researchers and fisheries managers, working on marine and freshwater fish species, in understanding concepts and processes related to stock assessment and population dynamics. Although most examples and case studies originate from developing countries in the African continent, the review remains of great value to many other countries.
1. Introduction
Human connections to fisheries have developed over thousands of years, underlining the notable contribution of fish and fisheries to human well-being. Globally, millions of people directly or indirectly depend on fisheries for their employment, income and food security [1,2,3]. This dependence is acute in developing countries, particularly for poor and marginalized people [4,5]. The opening up of global markets for fish and fisheries products have created multiple opportunities to increase employment and income from fisheries [6]. Total employment in fisheries grew increasingly from 28 million in 1995 to 39 million in 2010 [3] (Figure 1). In 2016, more than 40 million people were involved in fisheries, with 79% and 13% of these 40 million people living in Asia and Africa, respectively [3]. The involvement of people in fisheries in developing countries has been growing steadily, while it has been declining in most developed countries [7], indicating that fisheries play a significant role in developing countries. Whereas men are primarily involved in fishing, women are heavily involved in fisheries-related activities such as processing and trade [8]. In developing countries, particularly in Asia and Africa, millions of women are involved in fish processing, marketing, making and repairing nets, making baskets, pots, and baiting hooks [7].
Fisheries have an important economic contribution worldwide. Fisheries products are among the most traded food items and play a vital role in the global and local economy. For example, in 2016, approximately 60 million tonnes of fish and fish products (35% of global fish production) entered international trade in various forms [3]. This represents a total increase of 245% compared to 1976, but if we consider the trade in fish for human consumption alone the increase is more than 500% [3]. The value of global fish products also grew significantly from USD 8 billion in 1976 to USD 152 billion in 2017 [3]. This value surpasses the combined value of the net exports of rice, coffee, tea, tobacco and meat of that same year [3]. Fisheries play an important role in the national economies of many developing countries through the generation of foreign exchange derived from international trade. Fish production exports from developing countries account for approximately 60% of the total fish production being traded internationally [7]. Fish trade by developing countries increased from less than USD 4 billion in 1980 to USD 18 billion in 2001 [9]. Thus, fisheries are playing an increasingly important role in the national economy of many developing countries. Additionally, since the majority of the people involved in fisheries are from developing countries, fisheries are essential to keep households and communities out of poverty and improved fisheries management has the potential to further reduce poverty. The rural poor and marginalized people employed in fisheries could use the income earned from the sector to buy basic needs for living and to send their children to school. Fisheries have several valuable socio-cultural aspects. Understanding the socio-cultural values associated with fish and fisheries is, therefore, vital for effective management of the resources [10]. Ignoring these values could reduce the social acceptability of the management options [11].
Of the seven billion people in the world, one billion are officially designated as starving [12] and two billion people suffer from micronutrient deficiency [13]. Although the improvement of agriculture practices has been identified as essential to overcome the looming food security crisis, fisheries can also make a significant contribution [14]. Fish is an important and affordable source of protein, essential micronutrients, and fatty acids, especially for people in developing countries [15,16]. Fish consumption has been associated with various human benefits such as child mortality reduction, and maternal health improvement [7]. The annual global fish production for human consumption has increased from 67% of the total fish production in the 1960s to 88% in 2016 [3]. Fish accounted for 17% of animal protein consumed by the world population [3], the majority of which was consumed in low-income food-deficit countries [1,17,18]. Generally, fisheries are important to address hunger, micronutrient deficiencies and food insecurity [1], underlining its vital role in meeting the sustainable development goals (SDGs 1 = no poverty, 2 = zero hunger, 3 = good health and well-being) and FAO’s goal of a world without hunger and malnutrition.
Despite the significant contribution of fisheries to livelihoods, employment and income, many of the global fish stocks have been declining drastically. Successful management of the fish resources is therefore crucial. Failure to effectively manage world fish stocks can have disastrous effects on biodiversity and the livelihoods and socio-economic conditions of millions of people who are strongly dependent on these resources. Management strategies that successfully conserve the stocks and provide optimal sustainable yields are urgently needed. Successful management is possible when the necessary data such as age, growth, mortality and maximum yield are obtained, processed and interpreted and decision-makers are well informed. Fisheries managers, particularly from developing countries, are faced with many challenges due to lack of information on the past and current status of fisheries and the fish stocks. Although stock assessment modelling is necessary (i) to provide answers to questions about the current status of the stock, (ii) to predict the effect of current and future management measures and (iii) to support sustainable fisheries by providing fisheries managers with necessary advice to make informed decisions (Figure 2), such studies are limited in developing countries. To understand the factors affecting fish population imbalance, a good understanding of the wide range of age determination and validation techniques is required. They provide valuable input parameters for further stock assessment evaluation. However, the majority of young researchers in developing countries have limited skills and knowledge on how to select and prepare ageing hard structures and to validate measurements. Although there have been several well-documented methodological studies in developed countries that can be used as a reference, most of them are not open access. This hinders fish resources managers and young researchers in developing countries from accessing these documents. Therefore, the aim of this study is to provide an accessible review to fisheries managers and young researchers from developing countries. The review focuses on the factors that affect fish population imbalance, the different ageing hard structures, optimal otolith preparation and age validation techniques and their limitations and advantages. The review provides essential information to illustrate the need for reliable methods for life history trait estimation and evidence-based fisheries management. Therefore, this review aims to assist researchers and fisheries managers, working on marine and freshwater fish species, in understanding concepts and processes related to stock assessment and population dynamics. Although most examples and case studies originate from developing countries in the African continent, the review remains of great value to many other countries.
2. Global Fish Stock Status
Global fish stocks have been declining drastically. This decline has been attributed to several pressures, particularly the rapid increase of fishing efforts to feed the rapidly increasing human population [3]. Currently, 90% of global marine fish stocks are fully or over-exploited [3]. The size of biologically sustainable marine fish stocks (i.e., maximally sustainably fished and underfished stocks) decreased from 90% in 1975 to 67% in 2015, while the size of biologically unsustainable stocks (i.e., overfished stocks) increased from 10% in 1975 to 33% in 2015 [3] (Figure 3). Since there are no new fishing grounds to be exploited [3,19] and the current world human population is predicted to exceed nine billion by 2050, there will likely be more pressure on the stocks.
Freshwater ecosystems, one of the most important life-support systems on Earth, are the most endangered ecosystems in the world [20]. Freshwater ecosystems are vulnerable to changes in the basin [21,22] originating from agriculture, mining, urbanization and dam and diversion weirs construction [23]. Anthropogenic pressures cause changes in the physical, chemical and/or biological components of the freshwater ecosystems when the carrying capacity of ecosystems decreases below the ability to absorb stress. Freshwater fish stocks are in a state of crisis worldwide [24]. The perceived increase is caused by changes in the monitoring and measuring rather than actual changes in fisheries production [3]. This is corroborated by the drastic decline in abundance and diversity of the different freshwater fish species due to the increased anthropogenic pressures [20,25,26,27,28,29,30,31,32,33]. Furthermore, ≥65% of the inland water habitats are moderately or highly threatened [27], suggesting that some of the fish species inhabiting these systems are at high risk of extinction. According to World Wide Fund for Nature (WWF [34]), the current rate of fish population decline in freshwater systems is two times the rate for marine systems.
There are many examples of excessive stressors with negative consequences. For example, the catches, diversity and composition of the fish communities, particularly the most commercially valuable species, in many African lakes such as Lake Malawi, Lake Tanganyika, Lake Victoria and Lake Tana have markedly declined due to overexploitation, illegal fishing, the introduction of exotic species and environmental degradation [31,33,35,36,37,38]. A recent assessment by the International Union for Conservation of Nature (IUCN) revealed that 9% of the 458 fish species inhabiting Lake Malawi are at high risk of extinction [39]. Studies indicated that in Lake Malawi, long-living, slow-growing and late-maturing species have been depleted [40,41,42,43,44] while the biomass of the endemic Oreochromis species (chambo), has been declining rapidly [45,46]. There are strong signs of overfishing for chambo, the most valuable component of the lake fishery [47]. The chambo fishery in Lake Malawi has declined from 5000 tonnes per year in 1992 to less than 2000 tonnes per year in 1999 [48]. Similarly, in response to intensified pressures, like eutrophication and overfishing, fish stocks in Lake Victoria have changed both in composition and abundance [49]. Currently, more than 76% of the fish species in Lake Victoria face extinction [50]. The abundance and diversity of fish species in Lake Turkana drastically declined due to degradation of the littoral habitats and flood pulse breeding areas caused by upstream development and climate change [51]. Fisheries in the major river basins such as the Zambezi River system have experienced drastic declines in catch rates, changes in fish communities and loss of valuable species [52]. Most of the fish communities in the inland waters of Ethiopia are showing signs of overfishing [25,53,54,55]. Anthropogenic pressures in and around the inland waters negatively affect the survival of fish species in Ethiopia. For example, the abundance and size of the fish populations in Lake Tana have been declining drastically due to overexploitation, agriculture and dam constructions [31,32,33]. As a result, the catch per unit effort (CPUE) of the endemic Labeobarbus in the lake decreased from 63 kg/trip in 1991–1993 [56] to 2 kg/trip in 2016–17 [55]. Currently, five Labeobarbus species are already reported as IUCN red-listed species [57]. This number will likely increase even more in the near future as the present status of many species have not been evaluated yet. Furthermore, the predominance of small-sized species with little economic importance over large-sized species with high economic importance has been reported [53]. This suggests overfishing of the system. Due to overfishing, the proportion of large and valuable species decreases in favour of small and less valuable species [58]. Therefore, the continuous fish stock decline, particularly in developing countries indicates that the world is far from achieving the SDGs. Especially, SDGs target 14.4 to end illegal, unreported and unregulated (IUU) fishing by 2020 will not be met at all. Additionally, the world human population is rapidly increasing, leading to a higher demand for fish, which poses a hurdle for the FAO’s Blue Growth Initiative goal. This goal aims to maximize the goods and services provided by the different ecosystem types without compromising the social and economic benefits the systems offer [3].
3. Dynamics in Fish Population Size and Life History Traits
3.1. Factors Affecting Fish Population Imbalance
Fish population dynamics are primarily affected by three factors: (1) recruitment, (2) growth and (3) mortality rates [59]. The recruitment is defined as the number of individuals born within a given period. Growth is the increase in length and weight of the individuals of a population in a given period of time, and mortality is the number of individuals removed from the population within a given period of time (Figure 4). Recruitment and growth increase the fish population in number and biomass, while mortality, due to fishing and/or natural causes, decreases the population both in number and biomass. Illegal, unreported and unregulated (IUU) fishing increases fishing mortality and has adverse effects on the abundance and size composition of fish populations. Fishers often target the spawning biomass, causing high mortality rates which in turn leads to drastic reductions in the abundance of recruits and mega-spawners. Furthermore, small mesh sizes, typically used for illegal fishing, are known to have negative effects on the size distribution and maturation of fish [60,61]. For example, the majority of the specimens of Labeobarbus species in Lake Tana caught using ≤8 cm mesh size gillnets had fork length less than the size at first maturation (FL50%) [55]. The dominance of immature individuals (<FL50%) in the catch confirms the expected negative effect of small mesh size gillnets. Additionally, specimens of Labeobarbus with ≥40 cm fork length (FL) were more often recorded in the late 2000s [62,63] than in 2016/17 [55]. The absence of large-sized specimens (mega-spawners) is the result of destructive fishing activities targeting the spawning biomass and causing environmental degradation. Climate change also has the potential to affect freshwater fish resources, especially the mega spawners [64,65,66,67]. The reduction of mega-spawners in a stock is detrimental to the long-term survival of fish populations due to (i) their high fecundity, which creates a greater chance of survival to larvae [68,69], (ii) their ability to serve as reservoirs and distributors of desirable genes [70], and (iii) their ability to act as a natural safeguard against subsequent recruitment failure [71,72]. The presence of enough mega-spawners can be used as a simple estimator of the resilience of stocks against random disturbance events [70]. The presence of 30–40% of mega-spawners in stock indicates a healthy size and age structure of the population, while <20% could be a matter of concern [70]. In general, the fish population decreases if the addition to the population by recruitment and growth is smaller than the removal from the population due to mortality. Thus, the current drastic decrease in the global fish population suggests that mortality (fishing and/or natural) is exceeding recruitment and growth. Understanding the major factors that cause fish population imbalance is therefore vital for a sustainable exploitation of fisheries.
Size structure indices are useful to evaluate the status of the fish population and identify the pressures that affect the population dynamics [73,74,75,76]. For example, analysis of length-weight relationships for a species can provide fundamental insights into the ecology, population dynamics, and management of that species. Understanding how the weight of fish changes as a function of length is useful to predict weight from the length of the fish and determine the growth type and relative condition of the fish population. Use of the size structure indices as potential indicators of fish population imbalance has gained popularity because of their connections with recruitment, growth and mortality [73,75,77]. For example, the proportion of small size individuals in the population might be higher than the proportion of large size individuals due to high recruitment, slow growth and/or high mortality rates of large size classes and vice versa [73,74].
3.2. Life History Traits as a Basis for Stock Assessment and Fisheries Management
The current world human population is rapidly increasing, although the world fish stocks have been declining drastically and there are no new fishing grounds to be exploited [3,19]. The rapid world human population increase will likely cause high fish consumption demand which in turn will increase the pressures on the stocks. Fisheries managers are facing many challenges as fish stocks continue to decline and IUU fishing undermines the sustainability of fisheries. The main problem of fisheries managers, particularly in developing countries, is the lack of appropriate fisheries data for accurate stock assessment modelling. Stock assessment models provide answers to questions about the current condition of the stock and allow for predictions about how the stock will respond to current and future management measures. Additionally, stock assessment supports sustainable fisheries by providing fisheries managers with vital advice to make informed decisions. However, stock assessment models require life history traits such as age, growth and mortality rates as input parameters [78,79,80]. In fisheries science, age is one of the most influential life history traits that is primarily used to estimate life history traits such as age at maturity, growth rate, mortality rate and population analysis [79]. The importance of life history traits for fisheries assessment and management is presented in Table 1 [59].
In fisheries science, the collection, preparation, and interpretation of different hard structures provide a means for age estimation [81]. Otoliths, scales and fin rays are the most commonly used hard structures for age estimation [79,82]. The choice of the most suitable hard structure for estimating age is guided by several factors: (1) the ease of obtaining the hard structure, (2) growth of the structure itself and the formation of growth zones on the structure, (3) difficulties in preparation of the hard structure and growth zones interpretation and (4) accuracy and precision of the age estimates derived from the hard structures [80]. Therefore, understanding the advantages and limitations of each structure (i.e., otoliths, scales and fin rays) is indispensable to make the correct choice. In the next sections these structures are discussed more in depth.
3.3. Advantages and Limitations of the Hard Structures Used for Age Estimation
3.3.1. Otoliths
Otoliths are calcium carbonate structures that aid in balance and hearing of fish [81]. Additionally, otoliths record a remarkable amount of information about the life history traits of the fish and the environments they are living in [83]. To better understand and manage the fish population, this information should be carefully assessed, interpreted and incorporated into fisheries management decision-making. Of the three existing types of otoliths, sagittal otoliths are used for the age estimation of most fish species [84,85,86], but asteriscus otoliths are the most suitable structure for the Cyprinidae family [87,88,89]. The calcium carbonate that is used to form the otoliths originates from the water and from the food of the fish. This process is influenced by fish metabolism. During seasons with adequate average temperatures and sufficient food availability, fish grow at a relatively fast rate causing formed rings to be widely spaced. However, during the colder months where there is limited food supply, particularly for fish species in temperate regions, growth is restricted leading to narrow ring formation. As a result, alternate opaque and translucent growth zones are formed, which are considered to have been formed in one year (i.e., annulus). The age estimates of the fish can be obtained by counting the number of annuli deposited on otoliths. Regardless of its effort and cost, ageing accuracy is much higher for analysis of growth zone deposition on otoliths compared to the length and otolith size-based methods [90].
The use of otoliths for precise and accurate age estimation has several advantages: (1) otoliths grow continuously and form annuli even when the body growth slows down and the asymptotic length has been reached, (2) metabolically they are inert and not subject to resorption, (3) otolith growth varies between seasons leading to the formation of annual increments that can be used for age estimation, and (4) annuli reabsorption does not appear to occur during periods of food limitation or stress [79,88,91]. However, the use of otoliths also has limitations [92]. Age estimation using otolith is laborious, time-consuming, expensive and is dependent on the skills and experience of readers, which limits the sample size and prevents researchers with limited skills and experience to use otolith for age estimation [93,94]. Additionally, otoliths require sacrificing fish, which makes this approach difficult to be applied for threatened species or small populations [95].
3.3.2. Scales
The age of fish can also be determined by scales as the successive rings (circuli) are formed as the fish grow. The ctenoid and cycloid scales are most often used for estimating fish age [84]. Although scales from the whole part of the fish can be used, those that are found on the shoulder between the head and the dorsal fin are generally the best because of their relatively large size and low sensitivity to damage [80,84]. Traditionally, due to their non-lethal nature, scales have long been considered the most efficient and suitable structure for age determination, but more recent studies have revealed them to be inaccurate [96,97,98,99]. The limitations of scales to yield precise and accurate age estimates have been found most severe for slow-growing and older fish [79,98,99]. Scales have various inconsistencies, which make them difficult to read and interpret visually [100]. For example, well-defined marks on one scale might be absent on the neighbouring scales of the same fish [100]. Scales have several additional limitations: The first limitation is the dependency of scale growth and patterns of the circuli formation on fish growth. The variability in fish growth (i.e., between young and old fish) affects the scale growth and the appearance of the circuli. Scale growth is minimal or non-existent after the onset of maturity, particularly when fish growth is very low or ceases [84]. Thus, this causes underestimation of the actual fish age, particularly in older fish. In older fish, the circuli at the edge of the scale can be crowded making the circuli interpretation difficult. The second limitation is resorption causing some reworking or breaking of the circuli, leading to misinterpretation. The third limitation is transparency, which makes the circuli difficult to observe. The fourth limitation is that damaged or removed scales can be regenerated, resulting in growth patterns that do not accurately reflect the age of fish. The fifth limitation is that either some fish have no recognizable pattern on their scales or entirely lack scales. Therefore, when scales are used for age determination, either the age of all groups in the population should be validated, which is difficult if not impossible, or an alternative aging method should be used for older individuals in the population [80,84].
3.3.3. Fin Rays
Compared to otoliths and scales, fin rays are not frequently used for age estimation. However, the suitability of fin rays for some fish species is reported by some researchers [101,102,103,104]. The most commonly used fin rays are the dorsal, pectoral, and, pelvic fins [84]. Age estimates from fin rays have higher precision and accuracy compared to the estimates from scales [96,105,106]. Most importantly, using fin rays does not require the fish to be sacrificed [107,108] and the annuli remain representative for the age of older fish [109,110]. However, the low precision and accuracy of these structures have also been reported [111,112,113]. Fin rays provide inaccurate age estimates due to the following reasons: (1) difficult to read and interpret annular marks, (2) early marks are sometimes obscured by the vascular core of the fin rays, (3) irregular and unexpected spacing of annuli on the fin rays sections, which suggests resorption at different rates in different years, (4) difficult to distinguish between the true and false annulus and to correctly identify the first annulus, and (5) its preparation requires special technical skills [100,112,113].
4. Precision and Accuracy of Otolith Preparation Methods
Although there are several calcified structures available for age estimation [79,82], otoliths often provide the most precise and accurate age estimates [79,114]. However, age estimation based on the analysis of otolith growth zones involves judgment and subjective interpretation [79,81,115]. The subjective interpretation of otoliths contributes to two major sources of errors involving both processing and interpretation [79,116]. The first source of error relates directly to the nature of the otolith structure being interpreted. In this regard, otoliths must satisfy the criteria outlined in [117]: (1) otoliths must display growth increments that can be quantitatively resolved, (2) the formation of growth zones must conform to a regular and determinable time scale, and (3) otoliths must grow continuously throughout the lifespan of the fish. The second source of error can be traced back to the preparation of otoliths, interpretability of growth zones and reader experience [79,116,118,119]. The interpretation error can be minimized by describing a standardized, precise and accurate otolith preparation method and by training the age readers [79,116,118,119]. If the otolith images used for age estimation have the clearest view of the growth zones, core and edge, the bias between age readers should be minimal. It is, therefore, useful to describe the most adequate preparation method for each species. To this end, different otolith preparation methods such as transverse sections, staining, burn-and-breaking, polishing and whole otolith submerging in different substances including water and glycerol have been compared in attempt to describe the best method. Additionally, bias among hard structures such as scales, otoliths and fin rays has been compared to select the most appropriate structure. Such comparisons are especially important to approximate the accuracy of age estimates [84,120]. The precision and bias among different aging methods and age readers are usually done using statistical methods, graphical approaches, precision indices and qualitative expressions. Average percentage error (APE) [121] and coefficient of variation (CV) [122] are widely used and the most suitable and statistically sound measurements of precision [79]. The APE and CV are computed by the following formula:
where N is the number of fish aged, R is the number of times fish are aged, Xij is the ith age determination for the jth fish, and Xj is the average estimated age of the jth fish.
Although there is no rule of thumb, Campana [79] suggested CV ≤ 7.6% and APE ≤ 5.5% as reference values. The method with the smallest APE and CV values is, therefore, the most optimal method. The systematic bias between age readers, aging structures and aging time (i.e., if the reading is made two times by the same reader) can be described using a test of symmetry and it is best described through an examination of an age-agreement table [123]. The age estimates from the most experienced reader or the structure thought to be the most accurate should be used as the column variable in the age-agreement table. If the reading is made two times by the same reader, the first reading should appear as the column variable. Although several statistical methods were capable of detecting systematic aging differences, they were incapable of detecting both linear and non-linear biases in aging [115]. Some statistical methods, for example, were not sensitive enough to detect if the ages of younger fish were systematically over-aged or if the ages of older fish were systematically under-aged. To address this problem, Campana, et al. [115] introduced the age-bias plot to visually assess the differences in paired age estimates from two structures, two readers, or one reader at two times. Later, Ogle [124] modified the original age-bias plot in several ways. For the age-bias plot, one set of age estimates serve as reference age (x-axis). The age estimates that are thought to be most accurate are usually used as reference age. Thus, when the bias between age readers has comparable age estimates, the estimates of the most experienced reader should be used as reference age, whereas if the bias between two preparation methods or structures is compared, age estimates from the method or structure that is thought to be the most accurate should be used as reference age. However, the first reading should be used as reference age, if two readings from the same reader are made. Additionally, other factors such as qualitative expression may be involved as well. A quality control criteria (i.e., Q1 = readable otoliths with minimum bias, Q2 = readable otoliths with moderate bias and Q3 = unreadable otoliths) should be used to analyse readers’ confidence. The method with the highest number of otoliths under Q1 has a higher readers’ confidence than the other methods. The processing time and reading time should also be recorded. If there is no difference in precision and accuracy, the method that has the shortest processing time, the shortest reading time and the highest reader’s confidence should be considered as the most optimal method.
The process of growth zone deposition on otoliths is affected by biological and environmental factors [125]. The rate of growth zone deposition on otoliths is either annual or biannual. Therefore, in age estimation studies, validation of the rate of growth zone deposition is essential. Although several methods to validate age or the rate of growth zone deposition are available, mainly marginal increment analysis and edge analysis are used [79]. For more detailed information, see literature elsewhere [79,81,84,115,124].
In developed countries, significant and extensive work has been done to standardize otolith preparation methods, validate age or the rate of growth zone deposition and estimate life history traits of fish [83,87,118,121,126,127,128,129,130,131,132,133,134,135,136]. Such studies are limited in developing countries such as African countries. Except for the limited efforts in South African and Ethiopian water bodies [85,86,89,137,138,139,140,141,142,143,144,145,146], many fish species in the African water bodies including the Great African Lakes remain poorly studied. Concerning the description of optimal otolith preparation methods, validation of the rate of growth zone deposition and estimation of life history traits. The present lack of information on life history traits of different fish species hinders scientists and fisheries managers from refining optimal strategies for their conservation. Thus, detailed information on the description of the optimal otolith preparation method and validation of the rate of growth zone deposition is crucial. The widely used methods to validate the rate of growth zone deposition are discussed in the next section.
5. Validation of the Rate of Growth Zone Deposition
Validation of the rate of growth zone deposition is indispensable for accurate age estimation. There are several validation methods including advanced methods such as radiochemical and bomb radiocarbon dating. However, since these advanced methods are very expensive and difficult to apply for short-living species, mark-recapture of chemically tagged fish, marginal increment analysis and edge analysis are often used to validate the rate of growth zone deposition [79]. In this section only these widely used methods are discussed, for information about the other validation methods see Campana [79], Green, et al. [81], Andrews, et al. [130] and Piddocke, et al. [147]. A summary of the different methods used to validate age or the rate of growth zone deposition is presented in Table 2.
5.1. Mark-Recapture of Chemically Tagged Fish
At the moment this method is one of the best and most cost-effective methods available to validate the rate of growth zone formation [79]. It can be applied through various methods such as injection, immersion and feeding. Injection is the most common technique for tagging wild fish [148,149,150]. Fish species that are captured from the wild are injected with calcium-binding chemicals such as oxytetracycline (OTC), alizarine, calcein and strontium immediately at the time of tagging [125]. These chemicals are incorporated into otoliths shortly after injection. The permanent mark is visible under fluorescent light in the growth zone being formed at the time of tagging [79]. The rate of growth zone deposition can be determined based on the number of growth zones deposited distally to the mark in the recaptured fish and the time at liberty. If the difference in the time of injection and liberty is one year and one growth zone is deposited during this time, it means that the studied fish species deposited one growth zone per year. However, if two growth zones are deposited, it means the rate of growth zone deposition is biannual. This method has been applied to validate the periodicity of growth zone deposition in several fish species [141,143,144,145,151,152,153,154]. The growth zones being validated are formed while the fish is growing in the natural environment. This method is time-consuming, technically difficult to apply and the recovery rates of the tagged fish are usually low [155]. Additionally, since the numbers of growth zones formed after tagging are low, a wrong conclusion can be made on the rate of growth zone deposition, if one of the growth zones is misinterpreted.
5.2. Marginal Increment Analysis
Marginal increment analysis (MIA, linear-circular model) is the most widely used validation method due to its modest sampling requirements and low cost [79]. The MIA is based on the observed incremental patterns of growth zones throughout the year and assumes that the outermost increment displays a yearly sinusoidal cycle when plotted against months of capture [156,157]. It uses the ratio of the width of the last growing zone and the width of the last fully completed growth zone (MIR) as a dependent variable and months of capture as an independent variable [158,159,160]. The marginal increment ratio (MIR) is, therefore, computed as follows [161].
where R is the distance from the core to the outermost of the edge, rn is the distance from the core to the end of the growing zone and rn-1 is the distance from the core to the end of the last fully formed growth zone.
When the MIR value is equal to one, it indicates the completion of growth zone formation. Although the MIA is a useful method, especially when supported by other validation methods [159], it is also susceptible to bias and misinterpretation if not applied rigorously [79]. The approach has several limitations. The extended time of sample collection (monthly at least for one year), high possibility to collect small sample size per size classes within each month, difficulties to objectively classify the edge types and substantial inter-individual variation in marginal increment appearance [79,147]. These limitations are more pronounced in older fish where growth increments become very thin and packed together [118,162]. Therefore, when MIA is applied as age validation, the following protocols should be applied. (1) samples must be completely randomized when assigned to the examiner, (2) a minimum of two complete cycles need to be examined, in accordance with accepted methods for detecting cycles, and (3) the results must be interpreted objectively [79]. All the described protocols and encountered limitations for this technique here are also applicable for the edge analysis approach described below [79].
5.3. Edge Analysis
Similar to the MIA, edge analysis (EA, binary-circular model) is also based on examination of the marginal increments. Its dependent variable is binary, the otolith edge types either opaque or translucent, while the month of capture is the independent variable. Analysis of the EA can, therefore, verify the hypothesis that growth zone deposition is either annual or biannual. This approach assumes that the density of the outermost margin (i.e., proportion of the translucent zone) exhibits a sinusoidal cycle when plotted against the months of capture [79]. Several researchers found this approach useful for validating the periodicity of growth zone deposition [89,143,161,163]. For example, the Edge analysis revealed an annual growth zone deposition for Labeobarbus platydorsus in Lake Tana [140] (Figure 5). Although the EA approach is cheap and logically simple, it is susceptible to bias and misinterpretation if not applied rigorously [79].
6. Conclusions
Fisheries management strategies must be developed to ensure that stocks are harvested at sustainable levels. Fisheries managers rely on age estimates to develop effective and sustainable management options. Accurate and precise age estimates can be obtained if and only if an appropriate otolith preparation method is described and the rate of growth zone deposition is properly validated. Age estimates combined with data such as fish length, weight and reproductive condition can be used to describe the structure and dynamics of the population considered to comprise the harvested stock. For example, longevity and growth rates are estimated using length and age data, while the combination of sex and reproductive condition with growth data are used to describe the age-fecundity relationship and sex-specific growth. Mortality rates are also computed by combining age estimates with counts of the number of fish per age class in a sample. These analyses provide researchers and fisheries managers with a range of information to derive sustainable harvest strategies through stock assessment evaluations. In order to avoid complete stock collapse, fisheries catch should not exceed the maximum sustainable yield of the stock (MSY). The MSY is an important tool to quantify the goal of a fishery and allows fisheries managers to evaluate the performance of the fishery. The comparison of the assessed state of the fish stock with the values of the fisheries reference points such as MSY supports the managers to make informed decisions. Thus, fisheries reference points should be calculated as correctly as possible. The most popular and widely used model to estimate the MSY is the yield-per-recruitment model, introduced by Beverton and Holt [164]. Understanding the population dynamics, age determination techniques, and the estimation of life history traits allow policymakers and fisheries managers to optimize future conservation strategies (Figure 6). Furthermore, monitoring and evaluating the effects of the major pressures such as pollution, habitat degradation and over utilization of aquatic resources is vital to provide insights into the changes of aquatic ecosystems and indicate their status (Figure 6).
Author Contributions
S.G. conceived the main idea and wrote the manuscript. S.B., A.G., W.A. and P.G. reviewed and edited the manuscript. All authors have read and agreed to the published version of the manuscript.
Funding
This work was supported by the Critical Ecosystem Partnership Fund (CEPF) and special research fund (BOF), Ghent University.
Institutional Review Board Statement
Not applicable.
Informed Consent Statement
Not applicable.
Data Availability Statement
Not applicable.
Conflicts of Interest
The authors declare no conflict of interest.
References
- Welcomme, R.L.; Cowx, I.G.; Coates, D.; Béné, C.; Funge-Smith, S.; Halls, A.; Lorenzen, K. Inland capture fisheries. Philos. Trans. R. Soc. B Biol. Sci. 2010, 365, 2881–2896. [Google Scholar] [CrossRef] [PubMed]
- Lynch, A.J.; Cooke, S.J.; Deines, A.M.; Bower, S.D.; Bunnell, D.B.; Cowx, I.G.; Nguyen, V.M.; Nohner, J.; Phouthavong, K.; Riley, B. The social, economic, and environmental importance of inland fish and fisheries. Environ. Rev. 2016, 24, 115–121. [Google Scholar] [CrossRef] [Green Version]
- FAO. The State of World Fisheriess and Aquaculture 2018-Meeting the Sustainable Development Goals, Room, Italy. Licence: CC BY-NC-SA, 3.0 IGO; FAO: Rome, Italy, 2018. [Google Scholar]
- Béné, C.; Macfadyen, G.; Allison, E.H. Increasing the Contribution of Small-Scale Fisheries to Poverty Alleviation and Food Security; 9251056641; FAO Fisheries Technical Paper, No. 481; FAO: Rome, Italy, 2007; p. 125. [Google Scholar]
- FAO and World Fish Center. Small-Scale Capture Fisheries: A Global Overview with Emphasis on Developing Countries; World Bank: Washington, DC, USA, 2008; p. 64. [Google Scholar]
- Coulthard, S.; Johnson, D.; McGregor, J.A. Poverty, sustainability and human wellbeing: A social wellbeing approach to the global fisheries crisis. Glob. Environ. Chang. 2011, 21, 453–463. [Google Scholar] [CrossRef]
- Finegold, C. Fisheries, Sustainability and Development; The Royal Swedish Academy of Agriculture and Forestry: Stockholm, Sweden, 2009; pp. 353–364. [Google Scholar]
- Monfort, M.C. The Role of Women in the Seafood Industry; The GLOBEFISH Research Programme: Rome, Italy, 2015; p. 119. [Google Scholar]
- Lem, A. The WTO Doha Round and Fisheries: What’s at Stake; FAO Fact Sheet for WTO Ministerial Conference in Cancun: Cancun, Mexico, 2003. [Google Scholar]
- Ignatius, S.; Delaney, A.; Haapasaari, P. Socio-cultural values as a dimension of fisheries governance: The cases of Baltic salmon and herring. Environ. Sci. Policy 2019, 94, 1–8. [Google Scholar] [CrossRef]
- Ives, C.D.; Kendal, D. The role of social values in the management of ecological systems. J. Environ. Manag. 2014, 144, 67–72. [Google Scholar] [CrossRef] [PubMed]
- FAO. FAO The State of World Fisheries and Aquaculture 2010, Rome, Italy; 9251066752; Food and Agriculture Organization of the United Nations: Rome, Italy, 2010. [Google Scholar]
- Barrett, C.B. Measuring food insecurity. Science 2010, 327, 825–828. [Google Scholar] [CrossRef] [PubMed]
- Frid, C.L.J.; Paramor, O.A.L. Feeding the qorld: What role for fisheries? ICES J. Mar. Sci. 2012, 69, 145–150. [Google Scholar] [CrossRef] [Green Version]
- Roos, N.; Wahab, M.A.; Chamnan, C.; Thilsted, S.H. The role of fish in food-based strategies to combat vitamin A and mineral deficiencies in developing countries. J. Nutr. 2007, 137, 1106–1109. [Google Scholar] [CrossRef] [PubMed] [Green Version]
- Youn, S.-J.; Taylor, W.W.; Lynch, A.J.; Cowx, I.G.; Beard Jr, T.D.; Bartley, D.; Wu, F. Inland capture fishery contributions to global food security and threats to their future. Glob. Food Secur. 2014, 3, 142–148. [Google Scholar] [CrossRef]
- Kapetsky, J. Review of the State of World Fishery Resources: Inland Fisheries; No. 942, Rev.1; FAO Fisheries Circular: Rome, Italy, 2003; p. 60. [Google Scholar]
- Bartley, D.; De Graaf, G.; Valbo-Jørgensen, J.; Marmulla, G. Inland capture fisheries: Status and data issues. Fish. Manag. Ecol. 2015, 22, 71–77. [Google Scholar] [CrossRef]
- Godfray, H.C.J.; Beddington, J.R.; Crute, I.R.; Haddad, L.; Lawrence, D.; Muir, J.F.; Pretty, J.; Robinson, S.; Thomas, S.M.; Toulmin, C. Food security: The challenge of feeding 9 billion people. Science 2010, 327, 812–818. [Google Scholar] [CrossRef] [PubMed] [Green Version]
- Dudgeon, D.; Arthington, A.H.; Gessner, M.O.; Kawabata, Z.-I.; Knowler, D.J.; Lévêque, C.; Naiman, R.J.; Prieur-Richard, A.-H.; Soto, D.; Stiassny, M.L. Freshwater biodiversity: Importance, threats, status and conservation challenges. Biol. Rev. 2006, 81, 163–182. [Google Scholar] [CrossRef] [PubMed]
- Baron, J.S.; Poff, N.L.; Angermeier, P.L.; Dahm, C.N.; Gleick, P.H.; Hairston Jr, N.G.; Jackson, R.B.; Johnston, C.A.; Richter, B.D.; Steinman, A.D. Meeting ecological and societal needs for freshwater. Ecol. Appl. 2002, 12, 1247–1260. [Google Scholar] [CrossRef]
- Navarro-Ortega, A.; Acuña, V.; Bellin, A.; Burek, P.; Cassiani, G.; Choukr-Allah, R.; Dolédec, S.; Elosegi, A.; Ferrari, F.; Ginebreda, A. Managing the effects of multiple stressors on aquatic ecosystems under water scarcity. The GLOBAQUA project. Sci. Total Environ. 2015, 503, 3–9. [Google Scholar] [CrossRef] [PubMed] [Green Version]
- Søndergaard, M.; Jeppesen, E. Anthropogenic impacts on lake and stream ecosystems, and approaches to restoration. J. Appl. Ecol. 2007, 44, 1089–1094. [Google Scholar] [CrossRef]
- WEF. The Global Risks Report 2017, 12th ed.; 91–93 Route de la Capite CH-1223 Cologny: Geneva, Switzerland, 2017. [Google Scholar]
- de Graaf, M.; van Zwieten, P.A.M.; Machiels, M.A.M.; Lemma, E.; Wudneh, T.; Dejen, E.; Sibbing, F.A. Vulnerability to a small-scale commercial fishery of Lake Tana’s (Ethiopia) endemic Labeobarbus compared with African catfish and Nile tilapia: An example of recruitment-overfishing? Fish. Res. 2006, 82, 304–318. [Google Scholar] [CrossRef]
- Tanaka, S.K.; Zhu, T.; Lund, J.R.; Howitt, R.E.; Jenkins, M.W.; Pulido, M.A.; Tauber, M.; Ritzema, R.S.; Ferreira, I.C. Climate warming and water management adaptation for California. Clim. Chang. 2006, 76, 361–387. [Google Scholar] [CrossRef]
- Vörösmarty, C.J.; McIntyre, P.B.; Gessner, M.O.; Dudgeon, D.; Prusevich, A.; Green, P.; Glidden, S.; Bunn, S.E.; Sullivan, C.A.; Liermann, C.R. Global threats to human water security and river biodiversity. Nature 2010, 467, 555. [Google Scholar] [CrossRef] [PubMed]
- Beard, J.T.D.; Arlinghaus, R.; Cooke, S.J.; McIntyre, P.B.; De Silva, S.; Bartley, D.; Cowx, I.G. Ecosystem approach to inland fisheries: Research needs and implementation strategies. Biol. Lett. 2011, 7, 481–483. [Google Scholar] [CrossRef] [PubMed]
- Davidson, E.A.; de Araújo, A.C.; Artaxo, P.; Balch, J.K.; Brown, I.F.; Bustamante, M.M.; Coe, M.T.; DeFries, R.S.; Keller, M.; Longo, M. The Amazon basin in transition. Nature 2012, 481, 321. [Google Scholar] [CrossRef]
- Ziv, G.; Baran, E.; Nam, S.; Rodríguez-Iturbe, I.; Levin, S.A. Trading-off fish biodiversity, food security, and hydropower in the Mekong River Basin. Proc. Natl. Acad. Sci. USA 2012, 109, 5609–5614. [Google Scholar] [CrossRef] [PubMed] [Green Version]
- Dejen, E.; Anteneh, W.; Vijverberg, J. The decline of the Lake Tana (Ethiopia) fisheries: Causes and possible solutions. Land Degrad. Dev. 2017, 28, 1842–1851. [Google Scholar] [CrossRef] [Green Version]
- Gebremedhin, S.; Getahun, A.; Anteneh, W.; Gedif, B.; Gashu, B.; Tefera, B.; Berhanie, Z.; Alemaw, D. Effect of large weirs on abundance and diversity of migratory Labeobarbus species in tributaries of Lake Tana, Ethiopia. Afr. J. Aquat. Sci. 2017, 42, 367–373. [Google Scholar]
- Gebremedhin, S.; Getahun, A.; Anteneh, W.; Bruneel, S.; Goethals, P. A drivers-pressure-state-impact-responses framework to support the sustainability of fish and fisheries in Lake Tana, Ethiopia. Sustainability 2018, 10, 2957. [Google Scholar] [CrossRef] [Green Version]
- WWF. Living Planet Report 2016. In Risk and Resilience in a New Era; WWF International: Gland, Switzerland, 2016. [Google Scholar]
- Ogutu-Ohwayo, R. The decline of the native fishes of lakes Victoria and Kyoga (East Africa) and the impact of introduced species, especially the Nile perch, Lates niloticus, and the Nile tilapia, Oreochromis niloticus. Environ. Biol. Fishes 1990, 27, 81–96. [Google Scholar] [CrossRef]
- Lowe-McConnell, R. Recent research in the African Great Lakes: Fisheries, biodiversity and cichlid evolution. In Proceedings of the Freshwater Forum, Freshwater Biological Association, Dushanbe, Tajikistan, 29 August–1 September 2003; Volume 20, pp. 4–64. [Google Scholar]
- Ogutu-Ohwayo, R.; Balirwa, J.S. Management challenges of freshwater fisheries in Africa. Lakes Reserv. Res. Manag. 2006, 11, 215–226. [Google Scholar] [CrossRef]
- de Graaf, M.; Machiels, M.A.M.; Wudneh, T.; Sibbing, F.A. Declining stocks of Lake Tana’s endemic Barbus species flock (Pisces, Cyprinidae): Natural variation or human impact? Biol. Conserv. 2004, 116, 277–287. [Google Scholar] [CrossRef]
- Wey, O.L.F. Lake Malawi is Home to Unique Fish Species. Nearly 10% are Endangered. Available online: https://theconversation.com/lake-malawi-is-home-to-unique-fish-species-nearly-10-are-endangered-110294 (accessed on 10 December 2019).
- Turner, G.F.; Tweddle, D.; Makwinja, R.D. Changes in demersal cichlid communities as a result of trawling in southern Lake Malaŵi. In The Impact of Species Changes in African Lakes; Pitcher, T.J., Hart, P.J.B., Eds.; Springer: Dordrecht, The Netherlands, 1995; pp. 397–412. [Google Scholar]
- Turner, G.F. Management, conservation and species changes of exploited fish stocks in Lake Malaŵi. In The Impact of Species Changes in African Lakes; Pitcher, T.J., Hart, P.J.B., Eds.; Springer: Dordrecht, The Netherlands, 1995; pp. 365–395. [Google Scholar]
- Turner, J. Some effects of demersal trawling in Lake Malawi (Lake Nyasa) from 1968 to 1974. J. Fish Biol. 1977, 10, 261–271. [Google Scholar] [CrossRef]
- Turner, J. Changes in the size structure of cichlid populations of Lake Malaŵi resulting from bottom trawling. J. Fish. Board Can. 1977, 34, 232–238. [Google Scholar] [CrossRef]
- Weyl, O.; Nyasulu, T.; Rusuwa, B. Assessment of catch, effort and species changes in the pair-trawl fishery of southern Lake Malawi, Malawi, Africa. Fish. Manag. Ecol. 2005, 12, 395–402. [Google Scholar] [CrossRef]
- FAO. Fisheries Management in the Southeast Arm of Lake Malawi, the Upper Shire River and Lake Malombe, with Particular Reference to the fisheries on Chambo (Oreochromis spp.); CIFA Technical Paper, No. 21.; FAO: Rome, Italy, 1993. [Google Scholar]
- Banda, M.; Jamu, D.; Njaya, F.; Makuliwa, M.; Maluwa, A. In The chambo restoration strategic plan. In Proceedings of the National Workshop, 71, Boadzulu Lakeshore Resort, Mangochi, Malawi, 13–16 May 2003. WorldFish Center. [Google Scholar]
- Wey, O.L.F.; Steve, D.; Mafaniso; Hara, F.N.; Denis, T. Fish and fisheries in Lake Malawi: An assessment of four decades of management interventions. In Proceedings of the African Great Lakes Conference, Entebbe, Uganda, 2–5 May 2017; 5 May 2017. [Google Scholar]
- Weyl, O.L.; Ribbink, A.J.; Tweddle, D. Lake Malawi: Fishes, fisheries, biodiversity, health and habitat. Aquat. Ecosyst. Health Manag. 2010, 13, 241–254. [Google Scholar] [CrossRef]
- Brad, C. Dynamics of fish stocks and commercial fisheries in Lake Victoria, East Africa: Implications for management. In Proceedings of the African Great Lakes Conference, Entebbe, Uganda, 2–5 May 2017. [Google Scholar]
- Sayer, C.; Máiz-Tomé, L.; Darwall, W. Freshwater Biodiversity in the Lake Victoria Basin: Guidance for Species Conservation, Site Protection, Climate Resilience and Sustainable Livelihoods; IUCN, Gland: Cambridge, UK, 2018; p. 226. [Google Scholar]
- Gownaris, N.J.; Pikitch, E.K.; Ojwang, W.O.; Michener, R.; Kaufman, L. Predicting species’ vulnerability in a massively perturbed system: The fishes of Lake Turkana, Kenya. PLoS ONE 2015, 10, e0127027. [Google Scholar] [CrossRef] [Green Version]
- Tweddle, D.; Cowx, I.; Peel, R.; Weyl, O. Challenges in fisheries management in the Zambezi, one of the great rivers of Africa. Fish. Manag. Ecol. 2015, 22, 99–111. [Google Scholar] [CrossRef]
- Vijverberg, J.; Dejen, E.; Getahun, A.; Nagelkerke, L.A.J. The composition of fish communities of nine Ethiopian lakes along a north-south gradient: Threats and possible solutions. Anim. Biol. 2012, 62, 315–335. [Google Scholar] [CrossRef] [Green Version]
- Tesfaye, G.; Wolff, M. The state of inland fisheries in Ethiopia: A synopsis with updated estimates of potential yield. Ecohydrol. Hydrobiol. 2014, 14, 200–219. [Google Scholar] [CrossRef]
- Gebremedhin, S.; Bruneel, S.; Getahun, A.; Anteneh, W.; Goethals, P. The endemic species flock of Labeobarbus spp. in L. Tana (Ethiopia) threatened by extinction: Implications for conservation management. Water 2019, 11, 2560. [Google Scholar] [CrossRef] [Green Version]
- Nagelkerke, L.A.; Mina, M.V.; Wudneh, T.; Sibbing, F.A.; Osse, J.W. In Lake Tana, a unique fish fauna needs protection. Bioscience 1995, 45, 772–775. [Google Scholar]
- Getahun, A. Labeobarbus species. In The IUCN Red List of Threatened Species 2010; International Union for Conservation of Nature and Natural Resources: Gland, Switzerland, 2010. [Google Scholar]
- Pauly, D.; Christensen, V.; Dalsgaard, J.; Froese, R.; Torres, F. Fishing down marine food webs. Science 1998, 279, 860–863. [Google Scholar] [CrossRef] [PubMed]
- Kilduf, P. Guide to Fisheries Science and Stock Assessments; The Atlantic States Marine Fisheries Commission: Arlington, VA, USA, 2009; p. 74. [Google Scholar]
- Hunter, A.; Speirs, D.C.; Heath, M.R. Fishery-induced changes to age and length dependent maturation schedules of three demersal fish species in the Firth of Clyde. Fish. Res. 2015, 170, 14–23. [Google Scholar] [CrossRef] [Green Version]
- Lappalainen, A.; Saks, L.; Šuštar, M.; Heikinheimo, O.; Jürgens, K.; Kokkonen, E.; Kurkilahti, M.; Verliin, A.; Vetemaa, M. Length at maturity as a potential indicator of fishing pressure effects on coastal pikeperch (Sander lucioperca) stocks in the northern Baltic Sea. Fish. Res. 2016, 174, 47–57. [Google Scholar] [CrossRef]
- Nagelkerke, L.A.J.; Sibbing, F.A. The large barbs (Barbus spp. Cyprinidae, Teleostei) of Lake Tana (Ethiopia), with a description of a new species, Barbus osseensis. Neth. J. Zool. 2000, 50, 179–214. [Google Scholar] [CrossRef]
- Sibbing, F.A.; Nagelkerke, L.A.J. Resource partitioning by Lake Tana barbs predicted from fish morphometrics and prey characteristics. Rev. Fish Biol. Fish. 2001, 10, 393–437. [Google Scholar] [CrossRef]
- Ficke, A.D.; Myrick, C.A.; Hansen, L.J. Potential impacts of global climate change on freshwater fisheries. Rev. Fish Biol. Fish. 2007, 17, 581–613. [Google Scholar] [CrossRef]
- Johnson, J.L. Climate Change and Fishery Sustainability in Lake Victoria. Afr. J. Trop. Hydrobiol. Fish. 2009, 12, 31–36. [Google Scholar] [CrossRef]
- Karmakar, S.; Purkait, S.; Das, A.; Samanta, R.; Kumar, K. Climate change and Inland fisheries: Impact and mitigation strategies. J. Exp. Zool. India 2018, 21, 329–335. [Google Scholar]
- Plisnier, P.-D.; Nshombo, M.; Mgana, H.; Ntakimazi, G. Monitoring climate change and anthropogenic pressure at Lake Tanganyika. J. Great Lakes Res. 2018, 44, 1194–1208. [Google Scholar] [CrossRef]
- Solemdal, P. Maternal effects-a link between the past and the future. J. Sea Res. 1997, 37, 213–227. [Google Scholar] [CrossRef]
- Trippel, E.A. Egg size and viability and seasonal offspring production of young Atlantic cod. Trans. Am. Fish. Soc. 1998, 127, 339–359. [Google Scholar] [CrossRef]
- Froese, R. Keep it simple: Three indicators to deal with overfishing. Fish Fish. 2004, 5, 86–91. [Google Scholar] [CrossRef] [Green Version]
- Craig, J. Aging in fish. Can. J. Zool. 1985, 63, 1–8. [Google Scholar] [CrossRef]
- Beverton, R.J. Longevity in fish: Some ecological and evolutionary considerations. In Evolution of Longevity in Animals; Woodhead, A.D., Thompson, K.H., Eds.; Springer: Boston, MA, USA, 1987; pp. 161–185. [Google Scholar]
- Willis, D.W.; Murphy, B.R.; Guy, C.S. Stock density indices: Development, use, and limitations. Rev. Fish. Sci. 1993, 1, 203–222. [Google Scholar] [CrossRef]
- Neumann, R.; Allen, M. Size structure. In Analysis and Interpretation of Freshwater Fisheries Data; Guy, C.S., Brown, M.L., Eds.; American Fisheries Society: Bethesda, Maryland, 2007; pp. 375–421. [Google Scholar]
- Neumann, R.M.; Guy, C.S.; Willis, D.W. Length, weight, and associated indices. In Fisheries Techniques, 3rd ed.; Zale, A.V., Parrish, D.L., Sutton, T.M., Eds.; American Fisheries Society: Bethesda, Maryland, 2012; pp. 637–676. [Google Scholar]
- Isermann, D.A.; Paukert, C.P. Regulating harvest. In Inland Fisheries Management in North America, 3rd ed.; Wayne, A.H., Michael, C.Q., Eds.; American Fisheries Society: Bethesda, Maryland, 2010; pp. 185–212. [Google Scholar]
- Pope, K.L.; Lochmann, S.E.; Young, M.K. Methods for assessing fish populations. In Inland Fisheries Management in North America, 3rd ed.; Hubert, W.A., Quist, M.C., Eds.; American Fisheries Society: Bethesda, MD, USA, 2010; pp. 325–351. [Google Scholar]
- Ricker, W.E. Computation and Interpretation of Biological Statistics of Fish Populations; Bulletin of the Fisheries Research Board of Canada: Ottawa, ON, Canada, 1975; p. 382. [Google Scholar]
- Campana, S. Accuracy, precision and quality control in age determination, including a review of the use and abuse of age validation methods. J. Fish Biol. 2001, 59, 197–242. [Google Scholar] [CrossRef]
- Moltschaniwskyj, N.; Cappo, M. Alternatives to sectioned otoliths: The use of other structures and chemical techniques to estimate age and growth for marine vertebrates and invertebrates. In Tropical Fish Otoliths: Information for Assessment, Management and Ecology; Green, B.S., Mapstone, B.D., Carlos, G., Begg, G.A., Eds.; Springer: Dordrecht, The Netherlands, 2009; pp. 133–173. [Google Scholar]
- Green, B.; Mapstone, B.; Carlos, G.; Begg, G. Introduction to otoliths and fisheries in the tropics. In Tropical Fish Otoliths: Information for Assessment, Management and Ecology, Reviews: Methods and Technologies in Fish Biology and Fisheries, 11th ed.; Green, B., Mapstone, B., Carlos, G., Begg, G., Eds.; Springer: Dordrecht, The Netherlands, 2009. [Google Scholar]
- Göçer, M.; Ekingen, G. Comparisons of various bony structures for the age determination of Liza ramada (Risso, 1826) population from the Mersin Bay. J. Fish. Aquat. Sci. 2005, 22, 211–213. [Google Scholar]
- Begg, G.A.; Campana, S.E.; Fowler, A.J.; Suthers, I.M. Otolith research and application: Current directions in innovation and implementation. Mar. Freshw. Res. 2005, 56, 477–483. [Google Scholar] [CrossRef] [Green Version]
- Chilton, D.E.; Beamish, R.J. Age determination methods for fishes studied by the groundfish program at the Pacific Biological Station. Can. Spec. Publ. Fish. Aquat. Sci. 1982, 60, 102. [Google Scholar]
- Admassu, D. Age and Growth Determination of Tilapia, Oreochromis Niloticus L. (Pisces: Cichlidae) in Some Lakes in Ethiopia. Ph.D. Thesis, Addis Ababa University, Addis Ababa, Ethiopia, 1998; p. 115. [Google Scholar]
- Admassu, D.; Casselman, J.M. Otolith age determination for adult tilapia, Oreochromis niloticus L. from Lake Awassa (Ethiopian Rift Valley) by interpreting biannuli and differentiating biannual recruitment. Hydrobiologia 2000, 418, 15–24. [Google Scholar] [CrossRef]
- Brown, P.; Green, C.; Sivakumaran, K.; Stoessel, D.; Giles, A. Validating otolith annuli for annual age determination of common carp. Trans. Am. Fish. Soc. 2004, 133, 190–196. [Google Scholar] [CrossRef]
- Phelps, Q.E.; Edwards, K.R.; Willis, D.W. Precision of five structures for estimating age of common carp. N. Am. J. Fish. Manag. 2007, 27, 103–105. [Google Scholar] [CrossRef]
- Weyl, O.L.; Stadtlander, T.; Booth, A.J. Establishment of translocated populations of smallmouth yellowfish, Labeobarbus aeneus (Pisces: Cyprinidae), in lentic and lotic habitats in the Great Fish River system, South Africa. Afr. Zool. 2009, 44, 93–105. [Google Scholar] [CrossRef]
- Butler, J.L.; Folkvord, A. Section 2: Estimation of fish age and growth (Editorial). Fish. Res. 2000, 46, 51–52. [Google Scholar] [CrossRef]
- Casselman, J.M. Growth and relative size of calcified structures of fish. Trans. Am. Fish. Soc. 1990, 119, 673–688. [Google Scholar] [CrossRef]
- Cardinale, M.; Arrhenius, F. Using otolith weight to estimate the age of haddock (Melanogrammus aeglefinus): A tree model application. J. Appl. Ichthyol. 2004, 20, 470–475. [Google Scholar] [CrossRef]
- Worthington, D.; Doherty, P.; Fowler, A. Variation in the relationship between otolith weight and age: Implications for the estimation of age of two tropical damselfish (Pomacentrus moluccensis and P. wardi). Can. J. Fish. Aquat. Sci. 1995, 52, 233–242. [Google Scholar] [CrossRef]
- Pilling, G.; Grandcourt, E.; Kirkwood, G. The utility of otolith weight as a predictor of age in the emperor Lethrinus mahsena and other tropical fish species. Fish. Res. 2003, 60, 493–506. [Google Scholar] [CrossRef]
- Quist, M.C.; Pegg, M.A.; DeVries, D.R. Age and growth. In Fisheries Techniques, 3rd ed.; Zale, A.V., Parrish, D.L., Sutton, T.M., Eds.; American Fisheries Society: Bethesda, Maryland, 2012; pp. 677–731. [Google Scholar]
- Braaten, P.J.; Doeringsfeld, M.R.; Guy, C.S. Comparison of age and growth estimates for river carpsuckers using scales and dorsal fin ray sections. North Am. J. Fish. Manag. 1999, 19, 786–792. [Google Scholar] [CrossRef]
- Maceina, M.; Sammons, S. An evaluation of different structures to age freshwater fish from a northeastern US river. Fish. Manag. Ecol. 2006, 13, 237–242. [Google Scholar] [CrossRef]
- Kanwal, B.; Pathani, S. Age-growth, length-weight and condition factor of a hill stream fish, Gara lamta (Hamilton Buchanan) of Kumaun Himalaya. Nat. Sci. 2011, 9, 199–206. [Google Scholar]
- Khan, S.; Khan, M.A.; Miyan, K. Comparison of age estimates from otoliths, vertebrae, and pectoral spines in African sharptooth catfish, Clarias gariepinus (Burchell). Est. J. Ecol. 2011, 60, 183–193. [Google Scholar] [CrossRef] [Green Version]
- Zhu, X.; Rick, W.; Deanna, L.; Kimberly, H.; Susan, M.; Theresa, J.C.; Ross, F.T. Comparison of Scales, Pectoral Fin Rays, and Otoliths for Estimating Age, Growth, and Mortality of Lake Whitefish, Coregonus Clupeaformis, in Great Slave Lake; Canadian Science Advisory Secretariat: Ottawa, ON, Canada, 2017. [Google Scholar]
- Beamish, R.J. Use of fin-ray sections to age walleye pollock, Pacific cod, and albacore, and the importance of this method. Trans. Am. Fish. Soc. 1981, 110, 287–299. [Google Scholar] [CrossRef]
- Cass, A.J.; Beamish, R.J. First evidence of validity of the fin-ray method of age determination for marine fishes. North Am. J. Fish. Manag. 1983, 3, 182–188. [Google Scholar] [CrossRef]
- Chilton, D.; Bilton, H. New method for ageing Chinook Salmon (Onchorhynchus tshawytscha) using dorsal fin rays, and evidence if its validity. Can. J. Fish. Aquat. Sci. 1986, 43, 1588–1594. [Google Scholar] [CrossRef]
- Michaletz, P.H.; Nicks, D.M.; Buckner Jr, E.W. Accuracy and precision of estimates of back-calculated channel catfish lengths and growth increments using pectoral spines and otoliths. North Am. J. Fish. Manag. 2009, 29, 1664–1675. [Google Scholar] [CrossRef]
- Sikstrom, C. Otolith, pectoral fin ray, and scale age determinations for Arctic grayling. Progress. Fish Cult. 1983, 45, 220–223. [Google Scholar] [CrossRef]
- Williamson, C.; Macdonald, J.S. The Use of Three Ageing Techniques to Estimate the Growth Rates for Rainbow Trout, Oncorhynchus Mykiss, and Bull Trout, Salvelinus Confluentus, from Selected Locations Near Takla Lake, British Columbia; Canadian Technical Report of Fisheries and Aquatic Sciences; Fisheries & Oceans Canada, Pacific Region, Science Branch: West Vancouver, BC, Canada, 1997; p. 20. [Google Scholar]
- Mills, K.H.; Chalanchuk, S.M. The Fin-Ray Method of Aging Lake Whitefish. Ann. Zool. Fennici 2004, 215–223. [Google Scholar]
- Zymonas, N.; McMahon, T. Comparison of pelvic fin rays, scales and otoliths for estimating age and growth of bull trout, Salvelinus confluentus. Fish. Manag. Ecol. 2009, 16, 155–164. [Google Scholar] [CrossRef]
- Beamish, R.; Harvey, H. Age determination in the white sucker. J. Fish. Board Can. 1969, 26, 633–638. [Google Scholar] [CrossRef]
- Mills, K.; Beamish, R. Comparison of fin-ray and scale age determinations for lake whitefish (Coregonus clupeaformis) and their implications for estimates of growth and annual survival. Can. J. Fish. Aquat. Sci. 1980, 37, 534–544. [Google Scholar] [CrossRef]
- Maraldo, D.C.; MacCrimmon, H.R. Comparison of ageing methods and growth rates for largemouth bass, Micropterus salmoides Lacepede, from northern latitudes. Environ. Biol. Fishes 1979, 4, 263–271. [Google Scholar] [CrossRef]
- Barber, W.E.; McFarlane, G.A. Evaluation of three techniques to age Arctic char from Alaskan and Canadian waters. Trans. Am. Fish. Soc. 1987, 116, 874–881. [Google Scholar] [CrossRef]
- Baxter, H.W.A.; Harrington, G.T.M. Comparison of age determinations based on scales, otoliths and fin rays for cutthroat trout from Yellowstone Lake. Northwest Sci. 1987, 61, 32–36. [Google Scholar]
- Steward, C.A.; DeMaria, K.D.; Shenker, J.M. Using otolith morphometrics to quickly and inexpensively predict age in the gray angelfish (Pomacanthus arcuatus). Fish. Res. 2009, 99, 123–129. [Google Scholar] [CrossRef]
- Campana, S.E.; Annand, M.C.; McMillan, J.I. Graphical and statistical methods for determining the consistency of age determinations. Trans. Am. Fish. Soc. 1995, 124, 131–138. [Google Scholar] [CrossRef]
- Marriott, R.J.; Mapstone, B.D. Consequences of inappropriate criteria for accepting age estimates from otoliths, with a case study for a long-lived tropical reef fish. Can. J. Fish. Aquat. Sci. 2006, 63, 2259–2274. [Google Scholar] [CrossRef]
- Fowler, A. Age in years from otoliths of adult tropical fish. In Tropical Fish Otoliths: Information for Assessment, Management and Ecology; Springer: Dordrecht, The Netherland, 2009; pp. 55–92. [Google Scholar]
- Campana, S.E. Comparison of age determination methods for the starry flounder. Trans. Am. Fish. Soc. 1984, 113, 365–369. [Google Scholar] [CrossRef]
- Marriott, R.J.; Mapstone, B.D.; Ballagh, A.C.; Currey, L.M.; Penny, A.; Williams, A.J.; Jackson, G.; Lou, D.; Mapleston, A.J.; Jarvis, N.D. Accepting final counts from repeat readings of otoliths: Should a common criterion apply to the age estimation of fish? Mar. Freshw. Res. 2010, 61, 1171–1184. [Google Scholar] [CrossRef] [Green Version]
- Sylvester, R.M.; Berry, C.R., Jr. Comparison of white sucker age estimates from scales, pectoral fin rays, and otoliths. N. Am. J. Fish. Manag. 2006, 26, 24–31. [Google Scholar] [CrossRef]
- Beamish, R.; Fournier, D. A method for comparing the precision of a set of age determinations. Can. J. Fish. Aquat. Sci. 1981, 38, 982–983. [Google Scholar] [CrossRef]
- Chang, W.Y. A statistical method for evaluating the reproducibility of age determination. Can. J. Fish. Aquat. Sci. 1982, 39, 1208–1210. [Google Scholar] [CrossRef]
- Hoenig, J.; Morgan, M.; Brown, C. Analysing differences between two age determination methods by tests of symmetry. Can. J. Fish. Aquat. Sci. 1995, 52, 364–368. [Google Scholar] [CrossRef]
- Ogle, D.H. Modified AgeBias Plot; FishR: Pittsburgh, WI, USA; Available online: http://derekogle.com/fishR/2017-04-14-ModifiedAgeBiasPlot (accessed on 3 April 2019).
- Campana, S.E. Chemistry and composition of fish otoliths: Pathways, mechanisms and applications. Mar. Ecol. Prog. Ser. 1999, 188, 263–297. [Google Scholar] [CrossRef] [Green Version]
- Secor, D.H.; Dean, J.M. Comparison of otolith-based back-calculation methods to determine individual growth histories of larval striped bass, Morone saxatilis. Can. J. Fish. Aquat. Sci. 1992, 49, 1439–1454. [Google Scholar] [CrossRef]
- Secor, D.; Houde, E.; Monteleone, D. A mark-release experiment on larval striped bass Morone saxatilis in a Chesapeake Bay tributary. ICES J. Mar. Sci. 1995, 52, 87–101. [Google Scholar] [CrossRef]
- Campana, S.E. Photographic Atlas of Fish Otoliths of the Northwest Atlantic Ocean Canadian Special Publication of Fisheries and Aquatic Sciences No. 133; NRC Research Press: Ottawa, ON, USA, 2004. [Google Scholar]
- Panfili, J.; de Pontual, H.; Troadec, H.; Casselman, J.; Moksness, E.; Wright, P. Manual of Fish Sclerochronology; IRD: Brest, France, 2002; p. 464. [Google Scholar]
- Andrews, A.; Ashford, J.; Brooks, C.; Krusic-Golub, K.; Duhamel, G.; Belchier, M.; Lundstrom, C.; Cailliet, G. Lead–radium dating provides a framework for coordinating the age estimation of Patagonian toothfish (Dissostichus eleginoides) between fishing areas. Mar. Freshw. Res. 2011, 62, 781–789. [Google Scholar] [CrossRef]
- Andrews, A.H.; Coale, K.H.; Nowicki, J.L.; Lundstrom, C.; Palacz, Z.; Burton, E.J.; Cailliet, G.M. Application of an ion-exchange separation technique and thermal ionization mass spectrometry to 226Ra determination in otoliths for radiometric age determination of long-lived fishes. Can. J. Fish. Aquat. Sci. 1999, 56, 1329–1338. [Google Scholar] [CrossRef]
- Andrews, A.H.; Kalish, J.M.; Newman, S.J.; Johnston, J.M. Bomb radiocarbon dating of three important reef-fish species using Indo-Pacific Δ14C chronologies. Mar. Freshw. Res. 2011, 62, 1259–1269. [Google Scholar] [CrossRef]
- Andrews, A.H.; Kerr, L.A.; Cailliet, G.M.; Brown, T.A.; Lundstrom, C.C.; Stanley, R.D. Age validation of canary rockfish (Sebastes pinniger) using two independent otolith techniques: Lead-radium and bomb radiocarbon dating. Mar. Freshw. Res. 2007, 58, 531–541. [Google Scholar] [CrossRef] [Green Version]
- Burton, M.L.; Potts, J.C.; Page, J.; Poholek, A. Age, growth, mortality and reproductive seasonality of jolthead porgy, Calamus bajonado, from Florida waters. PeerJ 2017, 5, e3774. [Google Scholar] [CrossRef] [PubMed] [Green Version]
- Cailliet, G.; Andrews, A.; Burton, E.; Watters, D.; Kline, D.; Ferry-Graham, L. Age determination and validation studies of marine fishes: Do deep-dwellers live longer? Exp. Gerontol. 2001, 36, 739–764. [Google Scholar] [CrossRef]
- Cailliet, G.M.; Yudin, K.G.; Tanaka, S.; Taniuchi, T. Growth characteristics of two populations of Mustelus manazo from Japan based upon cross-readings of vertebral bands. Noaa Tech. Rep. Nmfs 1990, 90, 167–176. [Google Scholar]
- Admassu, D. A Study on the Age and Growth of Adult Oreochromis Niloticus (Pisces: Cichlidae) in Lake Awassa, Ethiopia. Master’s Thesis, Addis Ababa University, Addis Ababa, Ethiopia, 1989. [Google Scholar]
- Alemu, K. Age and Growth of Oreochromis Niloticus (Pisces: Cichlidae) in Lake Hayq, Ethiopia. Master’s Thesis, Addis Ababa University, Addis Ababa, Ethiopia, 1995. [Google Scholar]
- Gebremedhin, S.; Bekaert, K.; Getahun, A.; Bruneel, S.; Anteneh, W.; Goethals, P.; Torreele, E. Comparison of otolith readability and reproducibility of counts of translucent zones using different otolith preparation methods for four endemic Labeobarbus species in Lake Tana, Ethiopia. Water 2019, 11, 1336. [Google Scholar] [CrossRef] [Green Version]
- Gebremedhin, S.; Bekaert, K.; Getahun, A.; Bruneel, S.; Anteneh, W.; Torreele, E.; Goethals, P. Validation of the periodicity of growth zone deposition in otolith of two large endemic Labeobarbus species in Lake Tana, Ethiopia. Afr. Zool. 2019, 54, 231–238. [Google Scholar] [CrossRef]
- Taylor, G.C.; Peel, R.A.; Hay, C.J.; Weyl, O.L. Validation of the periodicity of growth zone formation in the otoliths of four fish species from the Upper Zambezi ecoregion, southern Africa. Afr. Zool. 2016, 51, 153–159. [Google Scholar] [CrossRef]
- Tekle-Giorgis, Y. Comparative Age and Growth Assessment of the African Catfish, Clarias gariepinus Burchell (Clariidae) and, Nile Perch, Latesniloticus, Linn (Centropomidae) in the Three Southern Rift Valley Lakes of Ethiopia (Lakes Awassa, Abaya and Chamo). Ph. D. Thesis, Addis Ababa University, Addis Ababa, Ethiopia, 2002; p. 160. [Google Scholar]
- Winker, H.; Ellender, B.R.; Weyl, O.L.; Booth, A.J. Validation of growth zone deposition in otoliths of two large endemic cyprinids in Lake Gariep, South Africa. Afr. Zool. 2010, 45, 133–138. [Google Scholar] [CrossRef]
- Winker, H.; Weyl, O.L.; Booth, A.J.; Ellender, B.R. Validating and corroborating the deposition of two annual growth zones in asteriscus otoliths of common carp Cyprinus carpio from South Africa’s largest impoundment. J. Fish Biol. 2010, 77, 2210–2228. [Google Scholar] [CrossRef] [PubMed]
- Winker, H.; Weyl, O.L.; Booth, A.J.; Ellender, B.R. Life history strategy and population characteristics of an unexploited riverine cyprinid, Labeo capensis, in the largest impoundment in the Orange River Basin. Afr. Zool. 2012, 47, 85–99. [Google Scholar] [CrossRef]
- Yosef, T.; Casselman, J. A procedure for increasing the precision of otolith age determination of tropical fish by differentiating biannual recruitment. Recent Dev. Fish Otolith Res. 1995, 19, 247. [Google Scholar]
- Piddocke, T.P.; Butler, G.L.; Butcher, P.A.; Purcell, S.W.; Bucher, D.J.; Christidis, L. Age validation in the Lutjanidae: A review. Fish. Res. 2015, 167, 48–63. [Google Scholar] [CrossRef]
- Geffen, A. Validation of otolith increment deposition rate. In Otolith Microstructure Examination and Analysis; D.K, S., Campana, S.E., Eds.; Cananadian Special Publication of Fisheries and Aquatic Sciences: Ottawa, ON, Canada, 1992; Volume 117, pp. 101–113. [Google Scholar]
- Foreman, T. A method of simultaneously tagging large oceanic fish and injecting them with tetracycline. Fish. Bull. 1987, 85, 645–647. [Google Scholar]
- Oliveira, K. Field validation of annular growth rings in the American eel, Anguilla rostrate, using tetracycline-marked otoliths. Fish. Bull. 1996, 94, 186–189. [Google Scholar]
- Beamish, R.J.; Chilton, D.E. Preliminary evaluation of a method to determine the age of sablefish (Anoplopoma fimbria). Can. J. Fish. Aquat. Sci. 1982, 39, 277–287. [Google Scholar] [CrossRef]
- Brown, C.A.; Gruber, S.H. Age assessment of the lemon shark, Negaprion brevirostris, using tetracycline validated vertebral centra. Copeia 1988, 747–753. [Google Scholar] [CrossRef]
- Fowler, A.J. Validation of annual growth increments in the otoliths of a small, tropical coral reef fish. Mar. Ecol. Prog. Ser. Oldendorf 1990, 64, 25–38. [Google Scholar] [CrossRef]
- Ellender, B.R.; Weyl, O.L.; Winker, H. Age and growth and maturity of southern Africa’s largest cyprinid fish, the largemouth yellowfish Labeobarbus kimberleyensis. J. Fish Biol. 2012, 81, 1271–1284. [Google Scholar] [CrossRef] [PubMed]
- Beamish, R.; McFarlane, G. Reevaluation of the interpretation of annuli from otoliths of a long-lived fish, Anoplopoma fimbria. Fish. Res. 2000, 46, 105–111. [Google Scholar] [CrossRef]
- Fowler, A.; Short, D. Validation of age determination from otoliths of the King George whiting Sillaginodes punctata (Perciformes). Mar. Biol. 1998, 130, 577–587. [Google Scholar] [CrossRef]
- Carlson, J.K.; Cortés, E.; Johnson, A.G. Age and growth of the blacknose shark, Carcharhinus acronotus, in the eastern Gulf of Mexico. Copeia 1999, 684–691. [Google Scholar] [CrossRef]
- Goldman, K.J. Age and growth of elasmobranch fishes. Fao Fish. Tech. Pap. 2005, 474, 76. [Google Scholar]
- Cailliet, G.M.; Smith, W.D.; Mollet, H.F.; Goldman, K.J. Age and growth studies of chondrichthyan fishes: The need for consistency in terminology, verification, validation, and growth function fitting. Environ. Biol. Fishes 2006, 77, 211–228. [Google Scholar] [CrossRef]
- Lessa, R.; Santana, F.M.; Duarte-Neto, P. A critical appraisal of marginal increment analysis for assessing temporal periodicity in band formation among tropical sharks. Environ. Biol. Fishes 2006, 77, 309–315. [Google Scholar] [CrossRef]
- Okamura, H.; Punt, A.E.; Semba, Y.; Ichinokawa, M. Marginal increment analysis: A new statistical approach of testing for temporal periodicity in fish age verification. J. Fish Biol. 2013, 82, 1239–1249. [Google Scholar] [CrossRef]
- Lowerre-Barbieri, S.K.; Chittenden Jr, M.E.; Jones, C.M. A comparison of a validated otolith method to age weakfish, Cynoscion regalis, with the traditional scale method. Fish. Bull. 1994, 92, 555–568. [Google Scholar]
- Okamura, H.; Semba, Y. A novel statistical method for validating the periodicity of vertebral growth band formation in elasmobranch fishes. Can. J. Fish. Aquat. Sci. 2009, 66, 771–780. [Google Scholar] [CrossRef]
- Beverton, R.J.; Holt, S.J. On the Dynamics of Exploited Fish Populations; Fisheries Investigation Series 2; UK Ministry of Agriculture: London, UK, 1957; Volume 19, p. 540.
Figure 1.
The global role of the fisheries sector for employment (Source: [3]).
Figure 1.
The global role of the fisheries sector for employment (Source: [3]).

Figure 2.
The process of fisheries data collection for age determination methods and stock assessment modelling to provide important advice to develop regulations and policies for sustainable fisheries management.
Figure 2.
The process of fisheries data collection for age determination methods and stock assessment modelling to provide important advice to develop regulations and policies for sustainable fisheries management.

Figure 3.
The trend of the global marine fish stock (source: [3]).
Figure 3.
The trend of the global marine fish stock (source: [3]).

Figure 4.
Illustration of the fish population dynamics. The “+” sign indicates an addition to the population, while the “–” sign indicates removal from the population.
Figure 4.
Illustration of the fish population dynamics. The “+” sign indicates an addition to the population, while the “–” sign indicates removal from the population.

Figure 5.
The proportion of asteriscus otoliths with a translucent growth zone on the edge for Labeobarbus platydorsus based on samples collected between May 2016 and April 2017 in Lake Tana, Ethiopia [140]. The bar graph denotes the proportion of the translucent growth zone and the open dot line represents the predicted model results. The numbers above the bars in the no cycle model are total sample size and the same sample size is used for the other models. The annual cycle mode best fit the data.

Figure 6.
Schematic representation of fish community monitoring, fish stock assessment and environmental modelling to develop science-based fisheries management.
Figure 6.
Schematic representation of fish community monitoring, fish stock assessment and environmental modelling to develop science-based fisheries management.


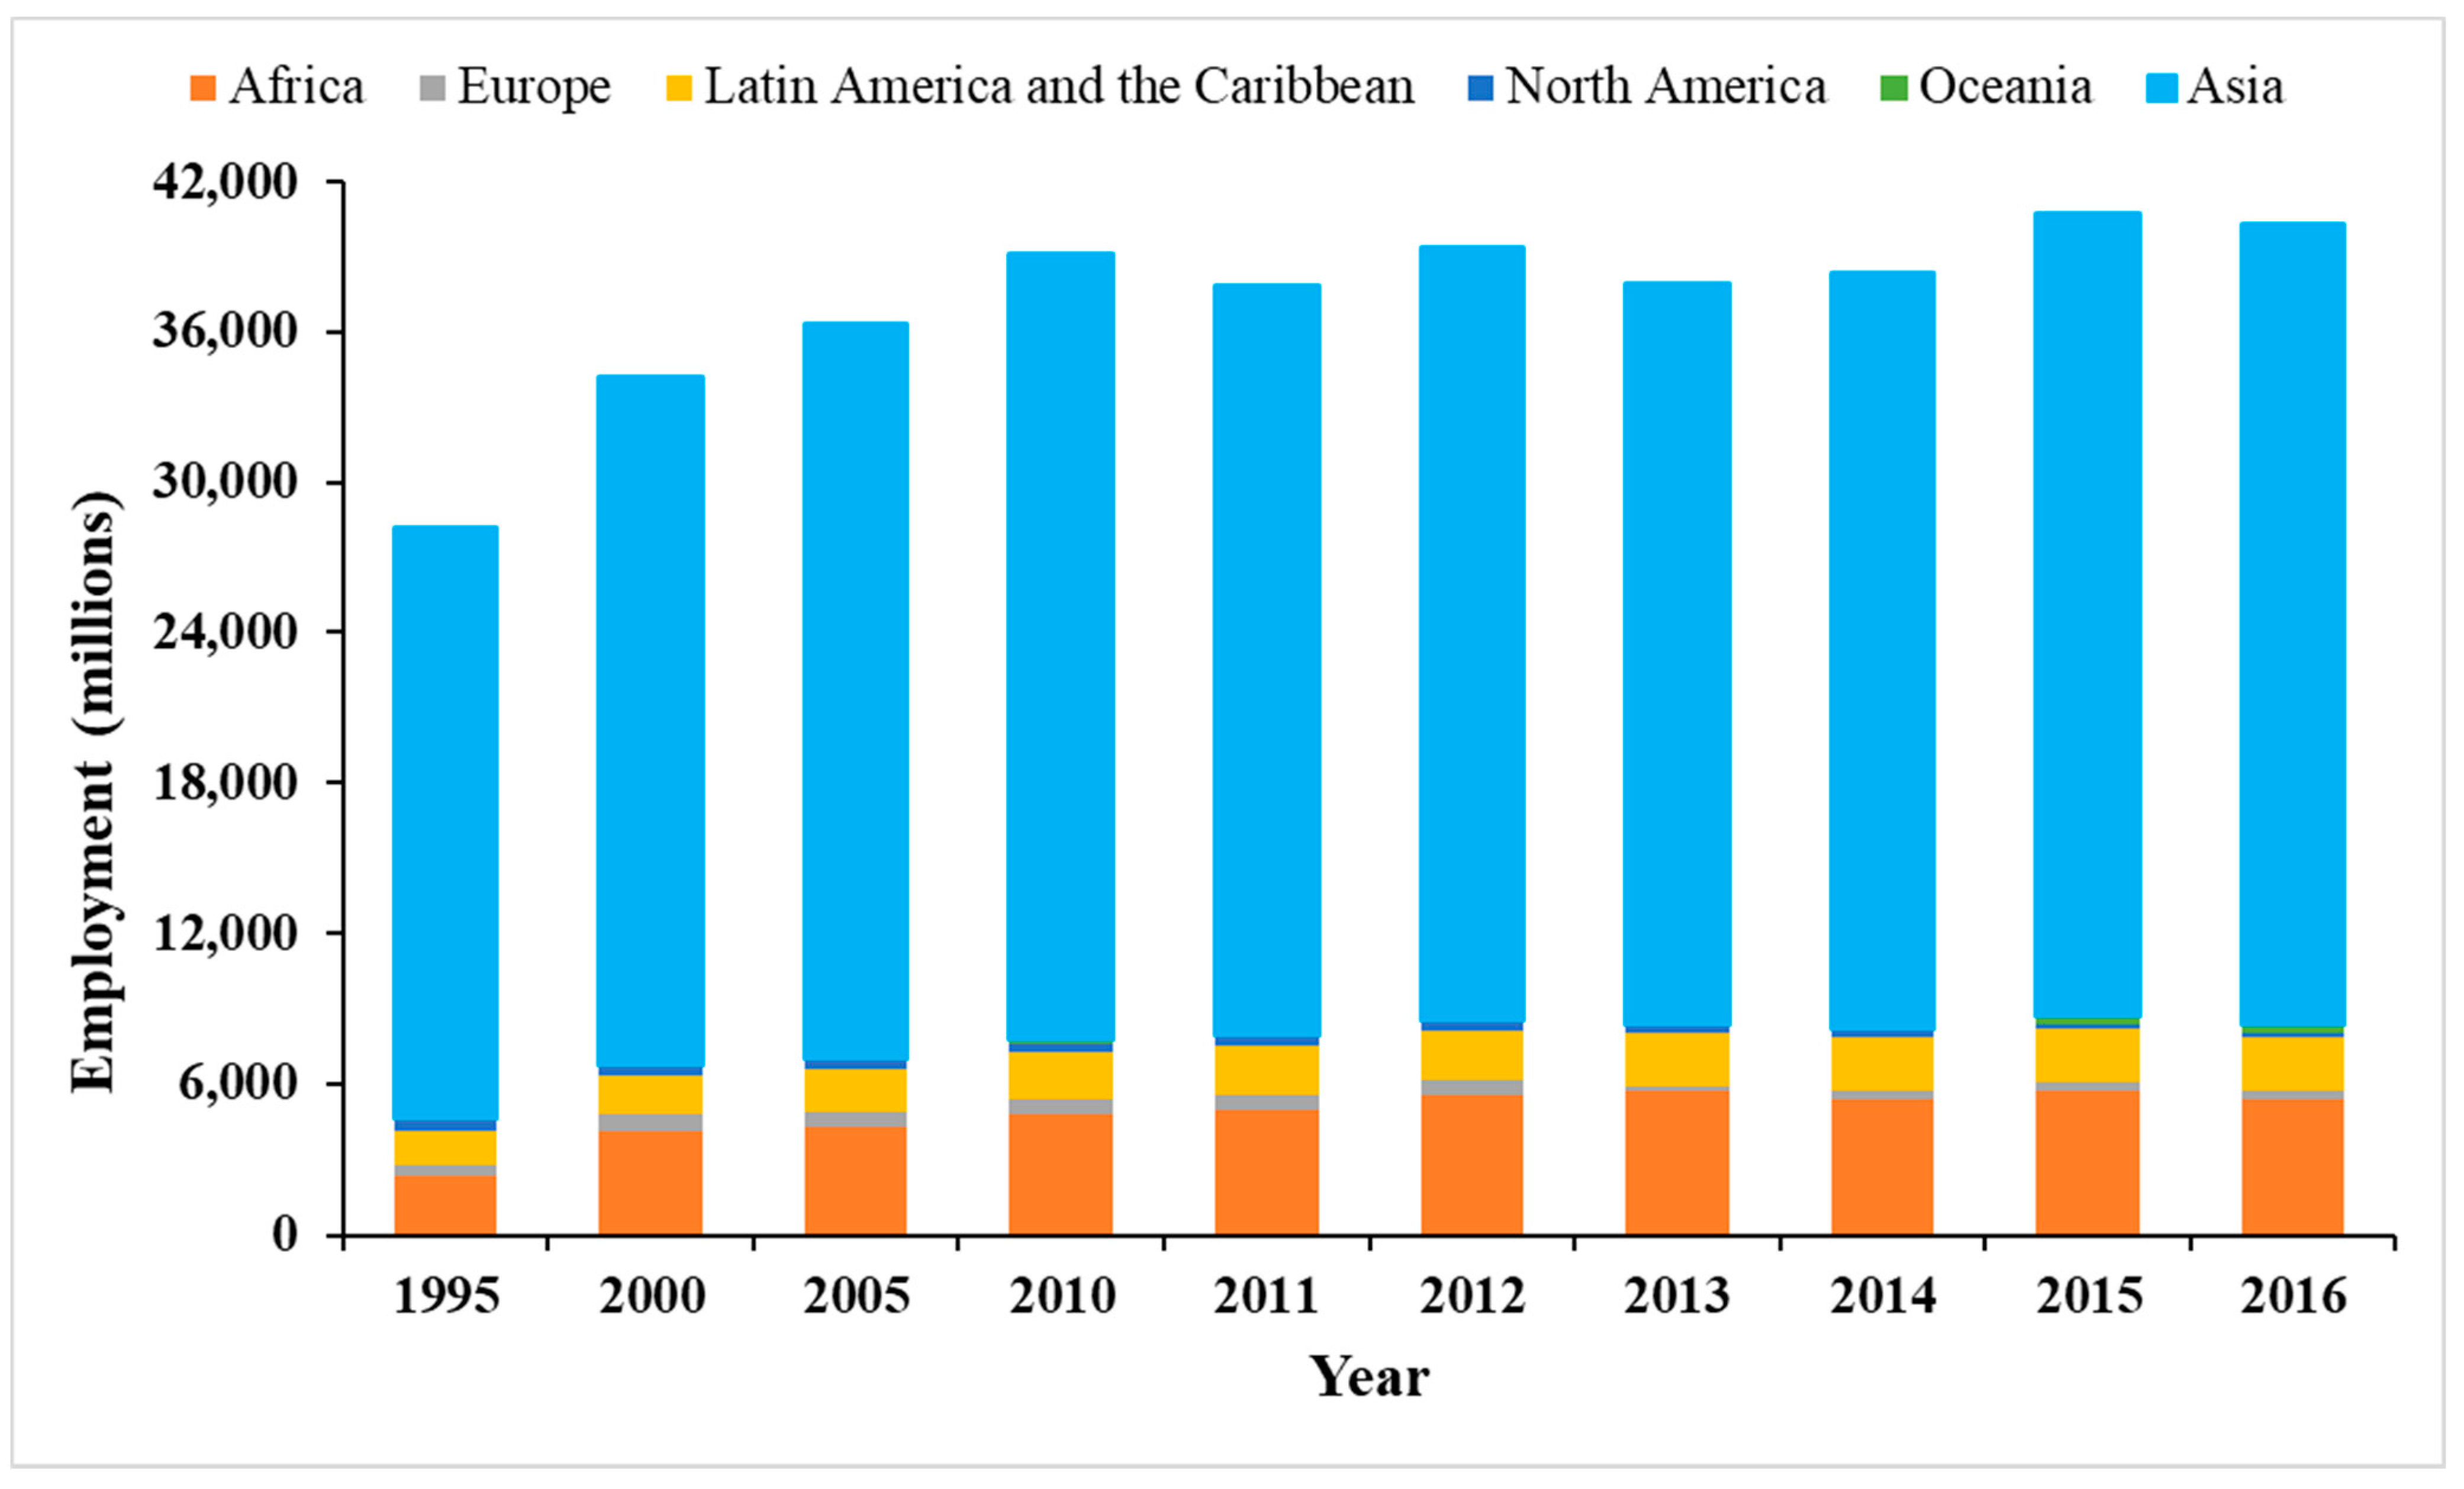
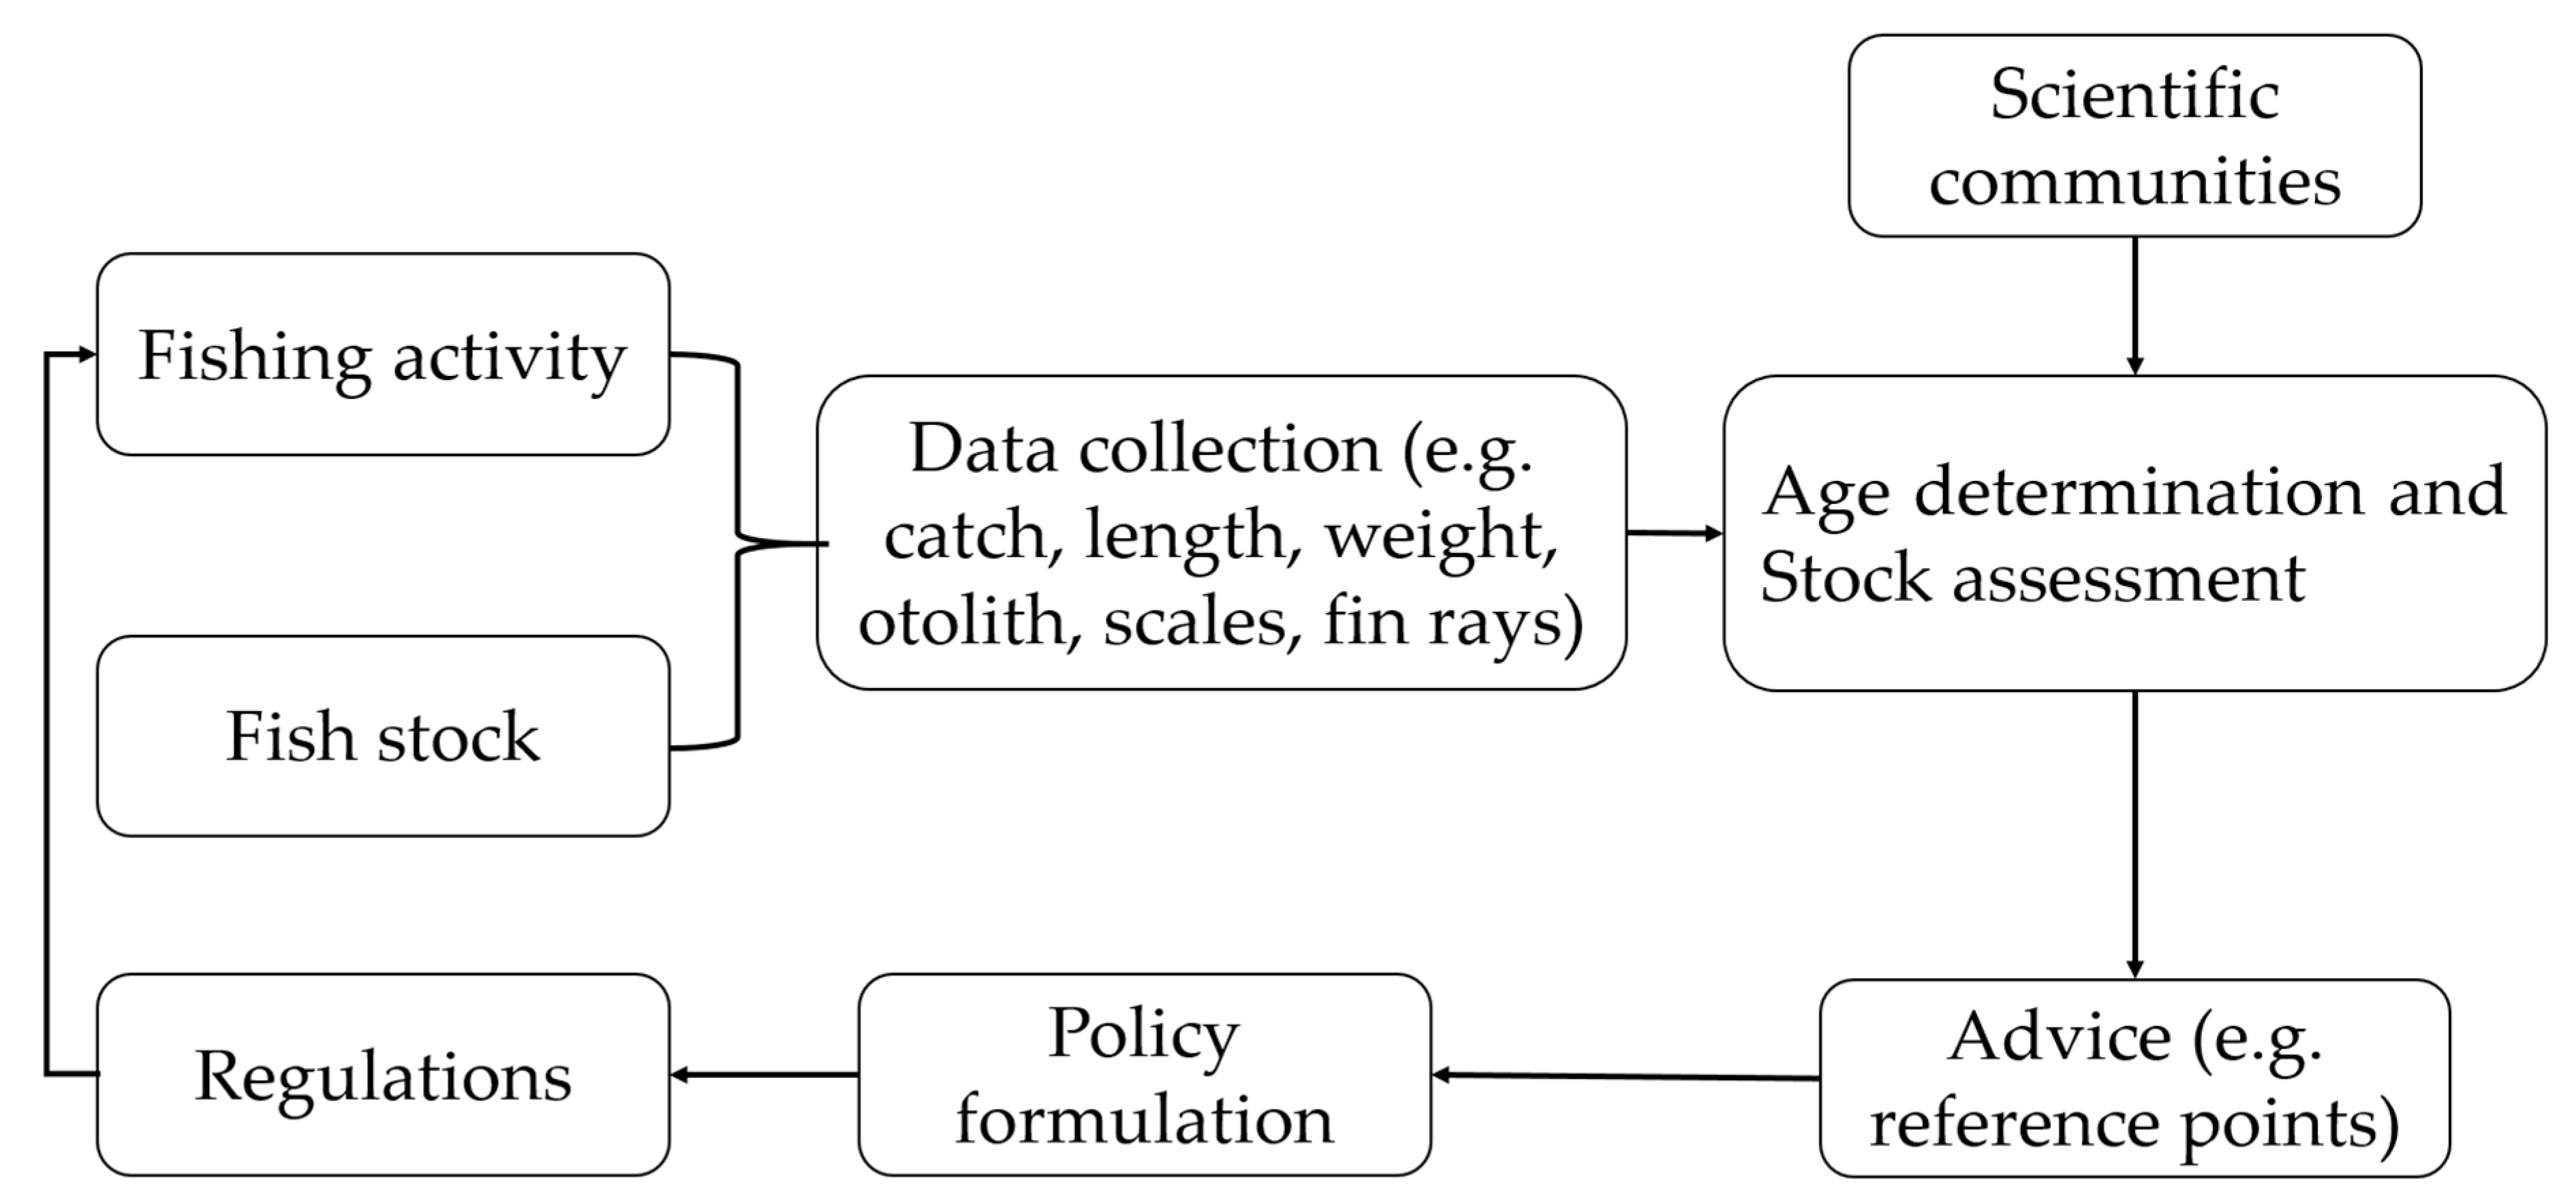
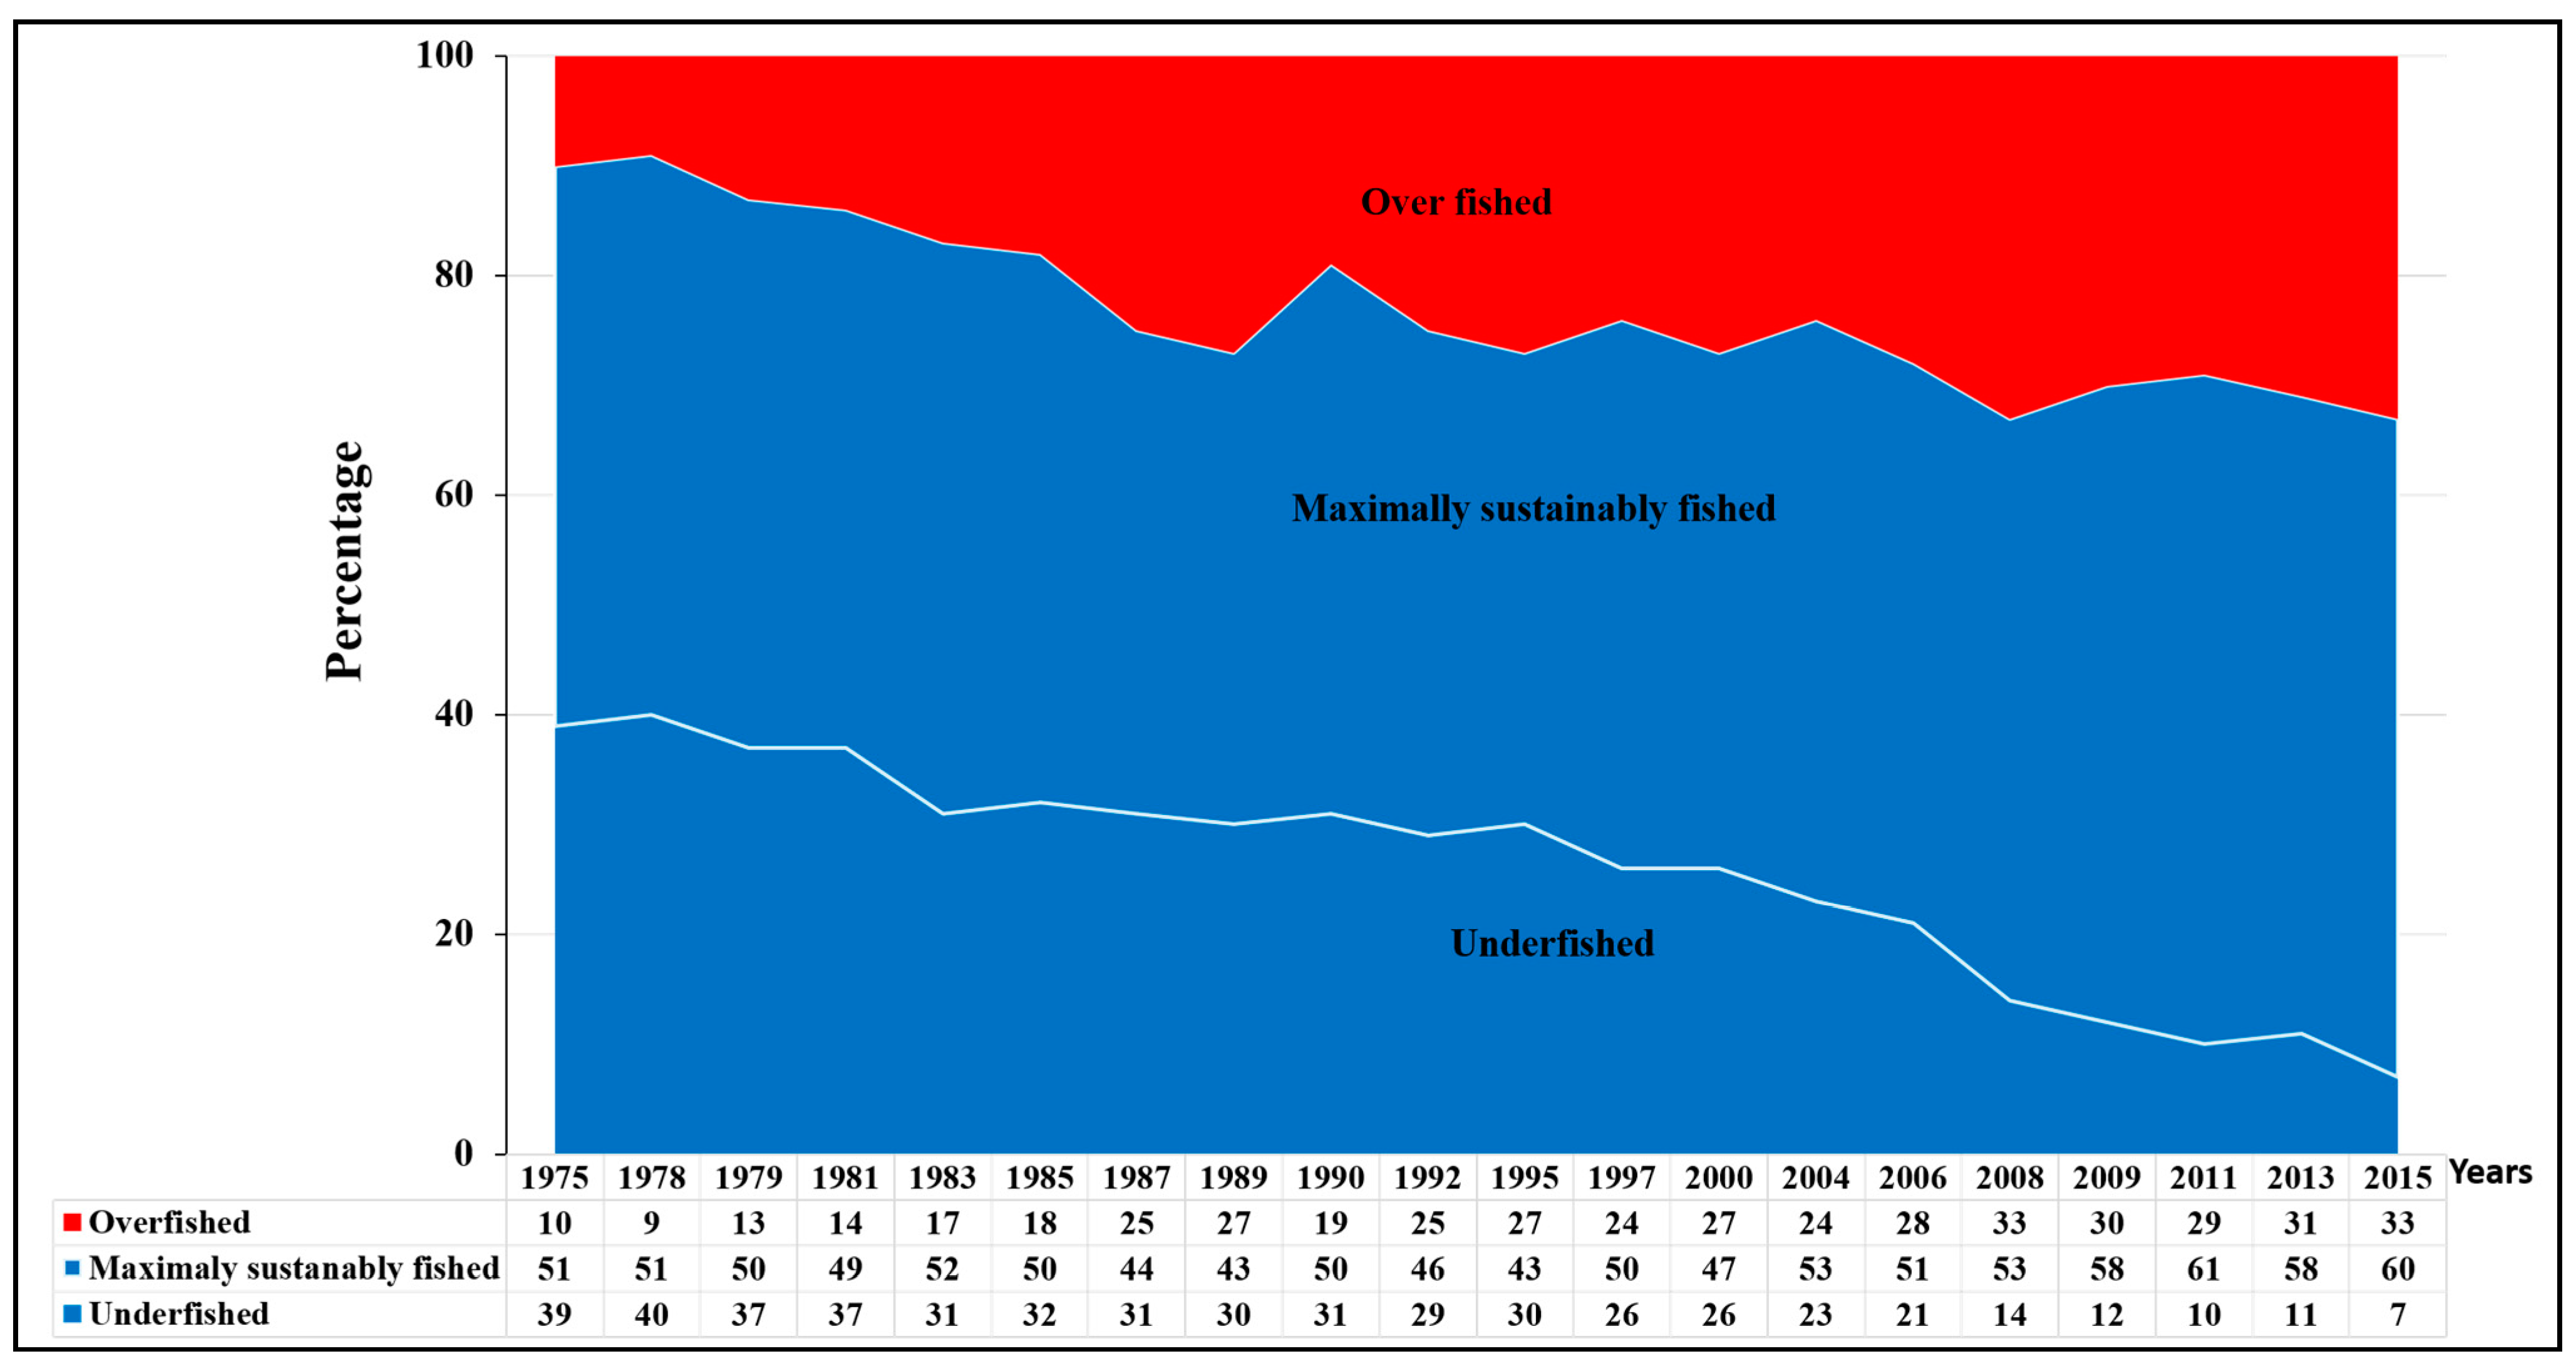
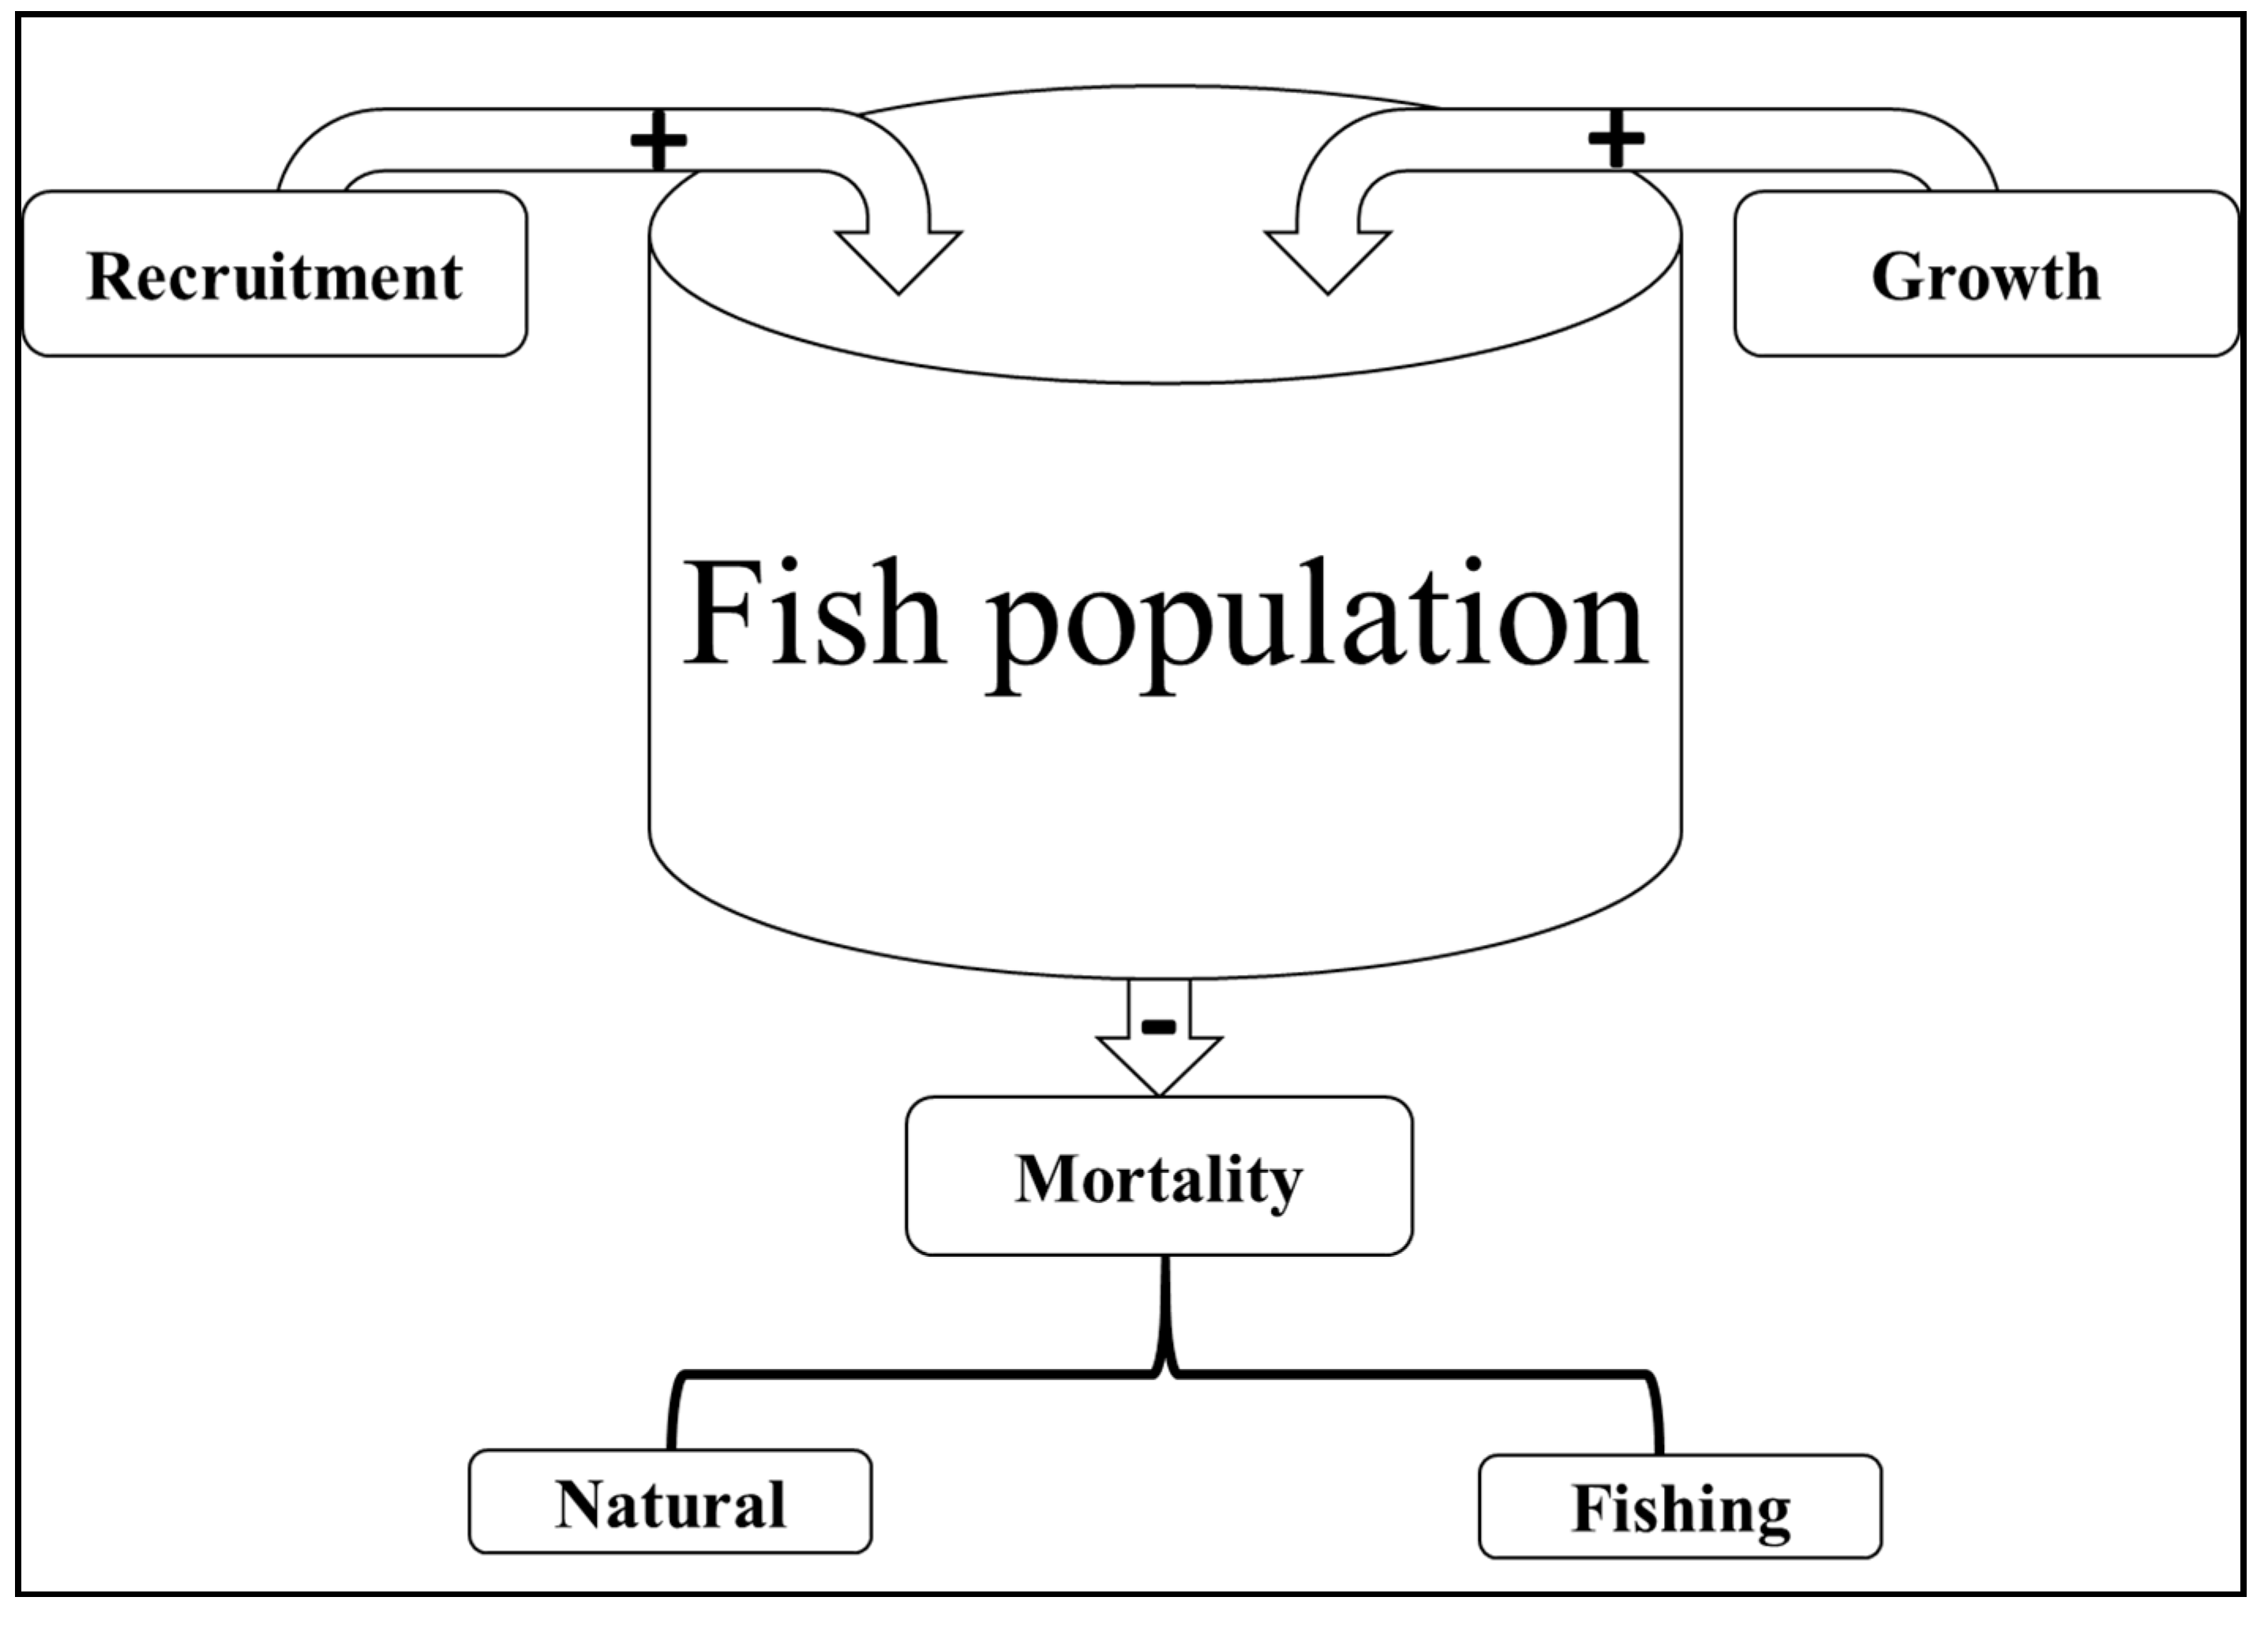
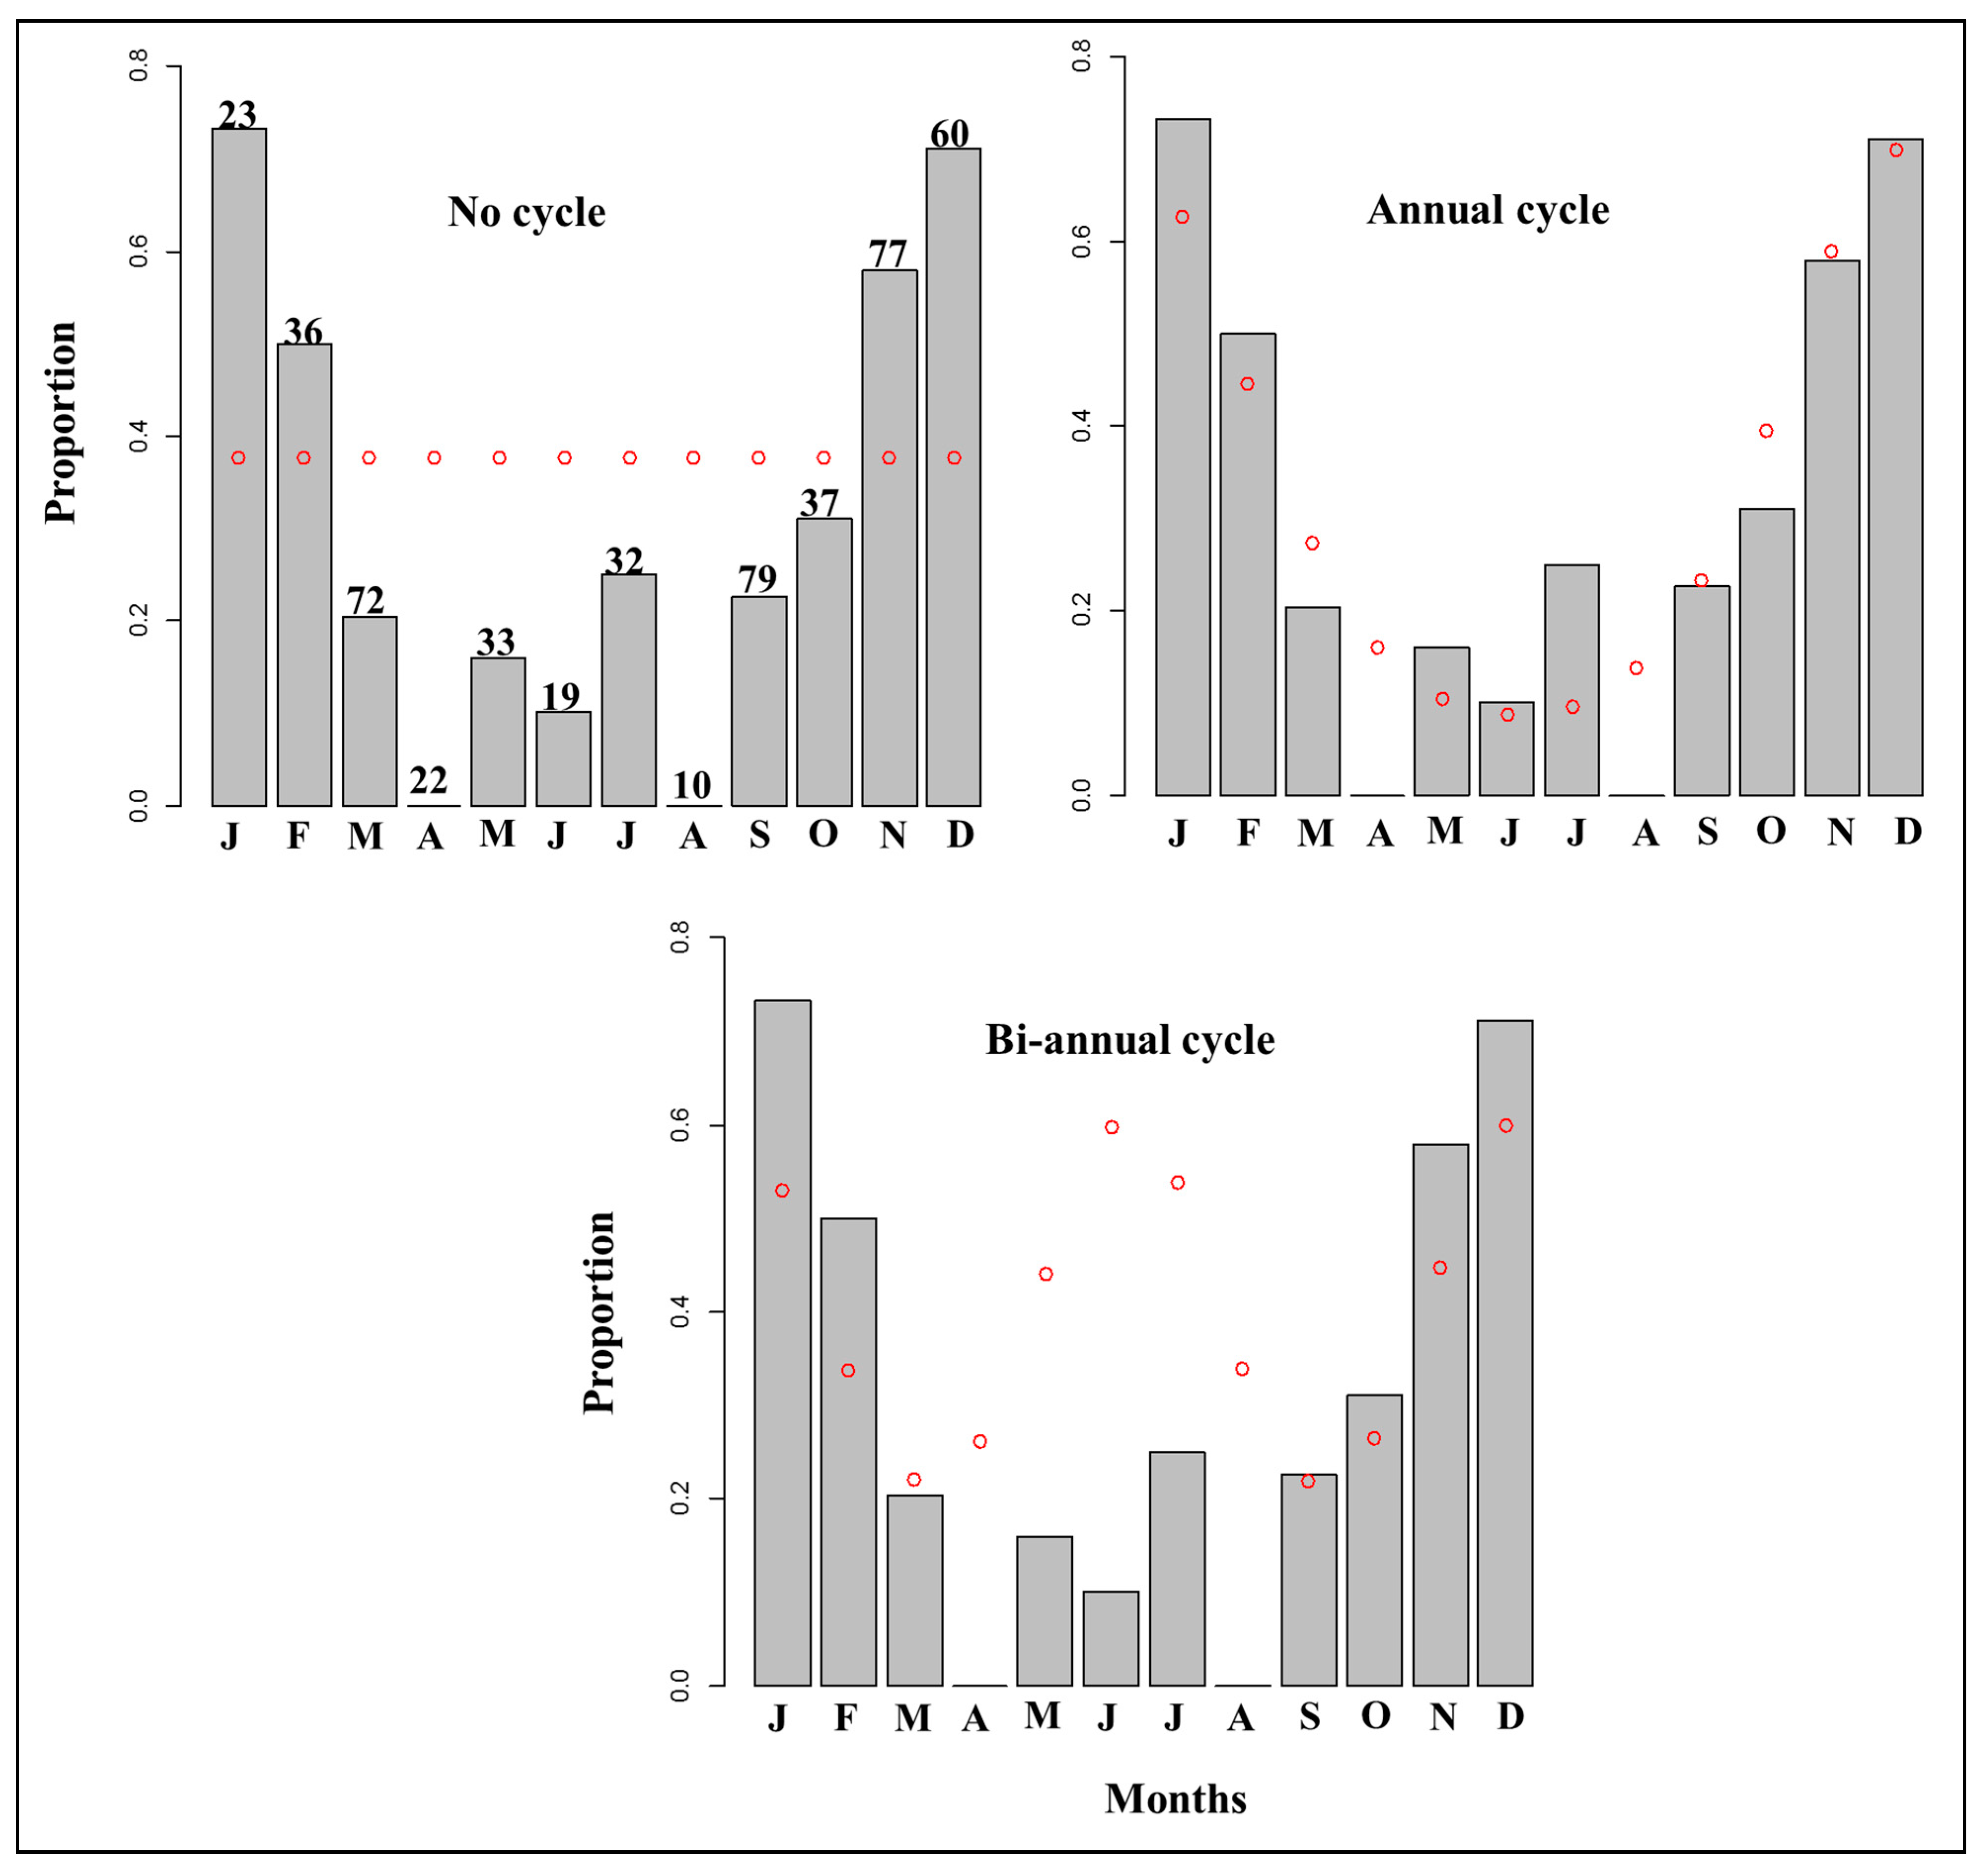
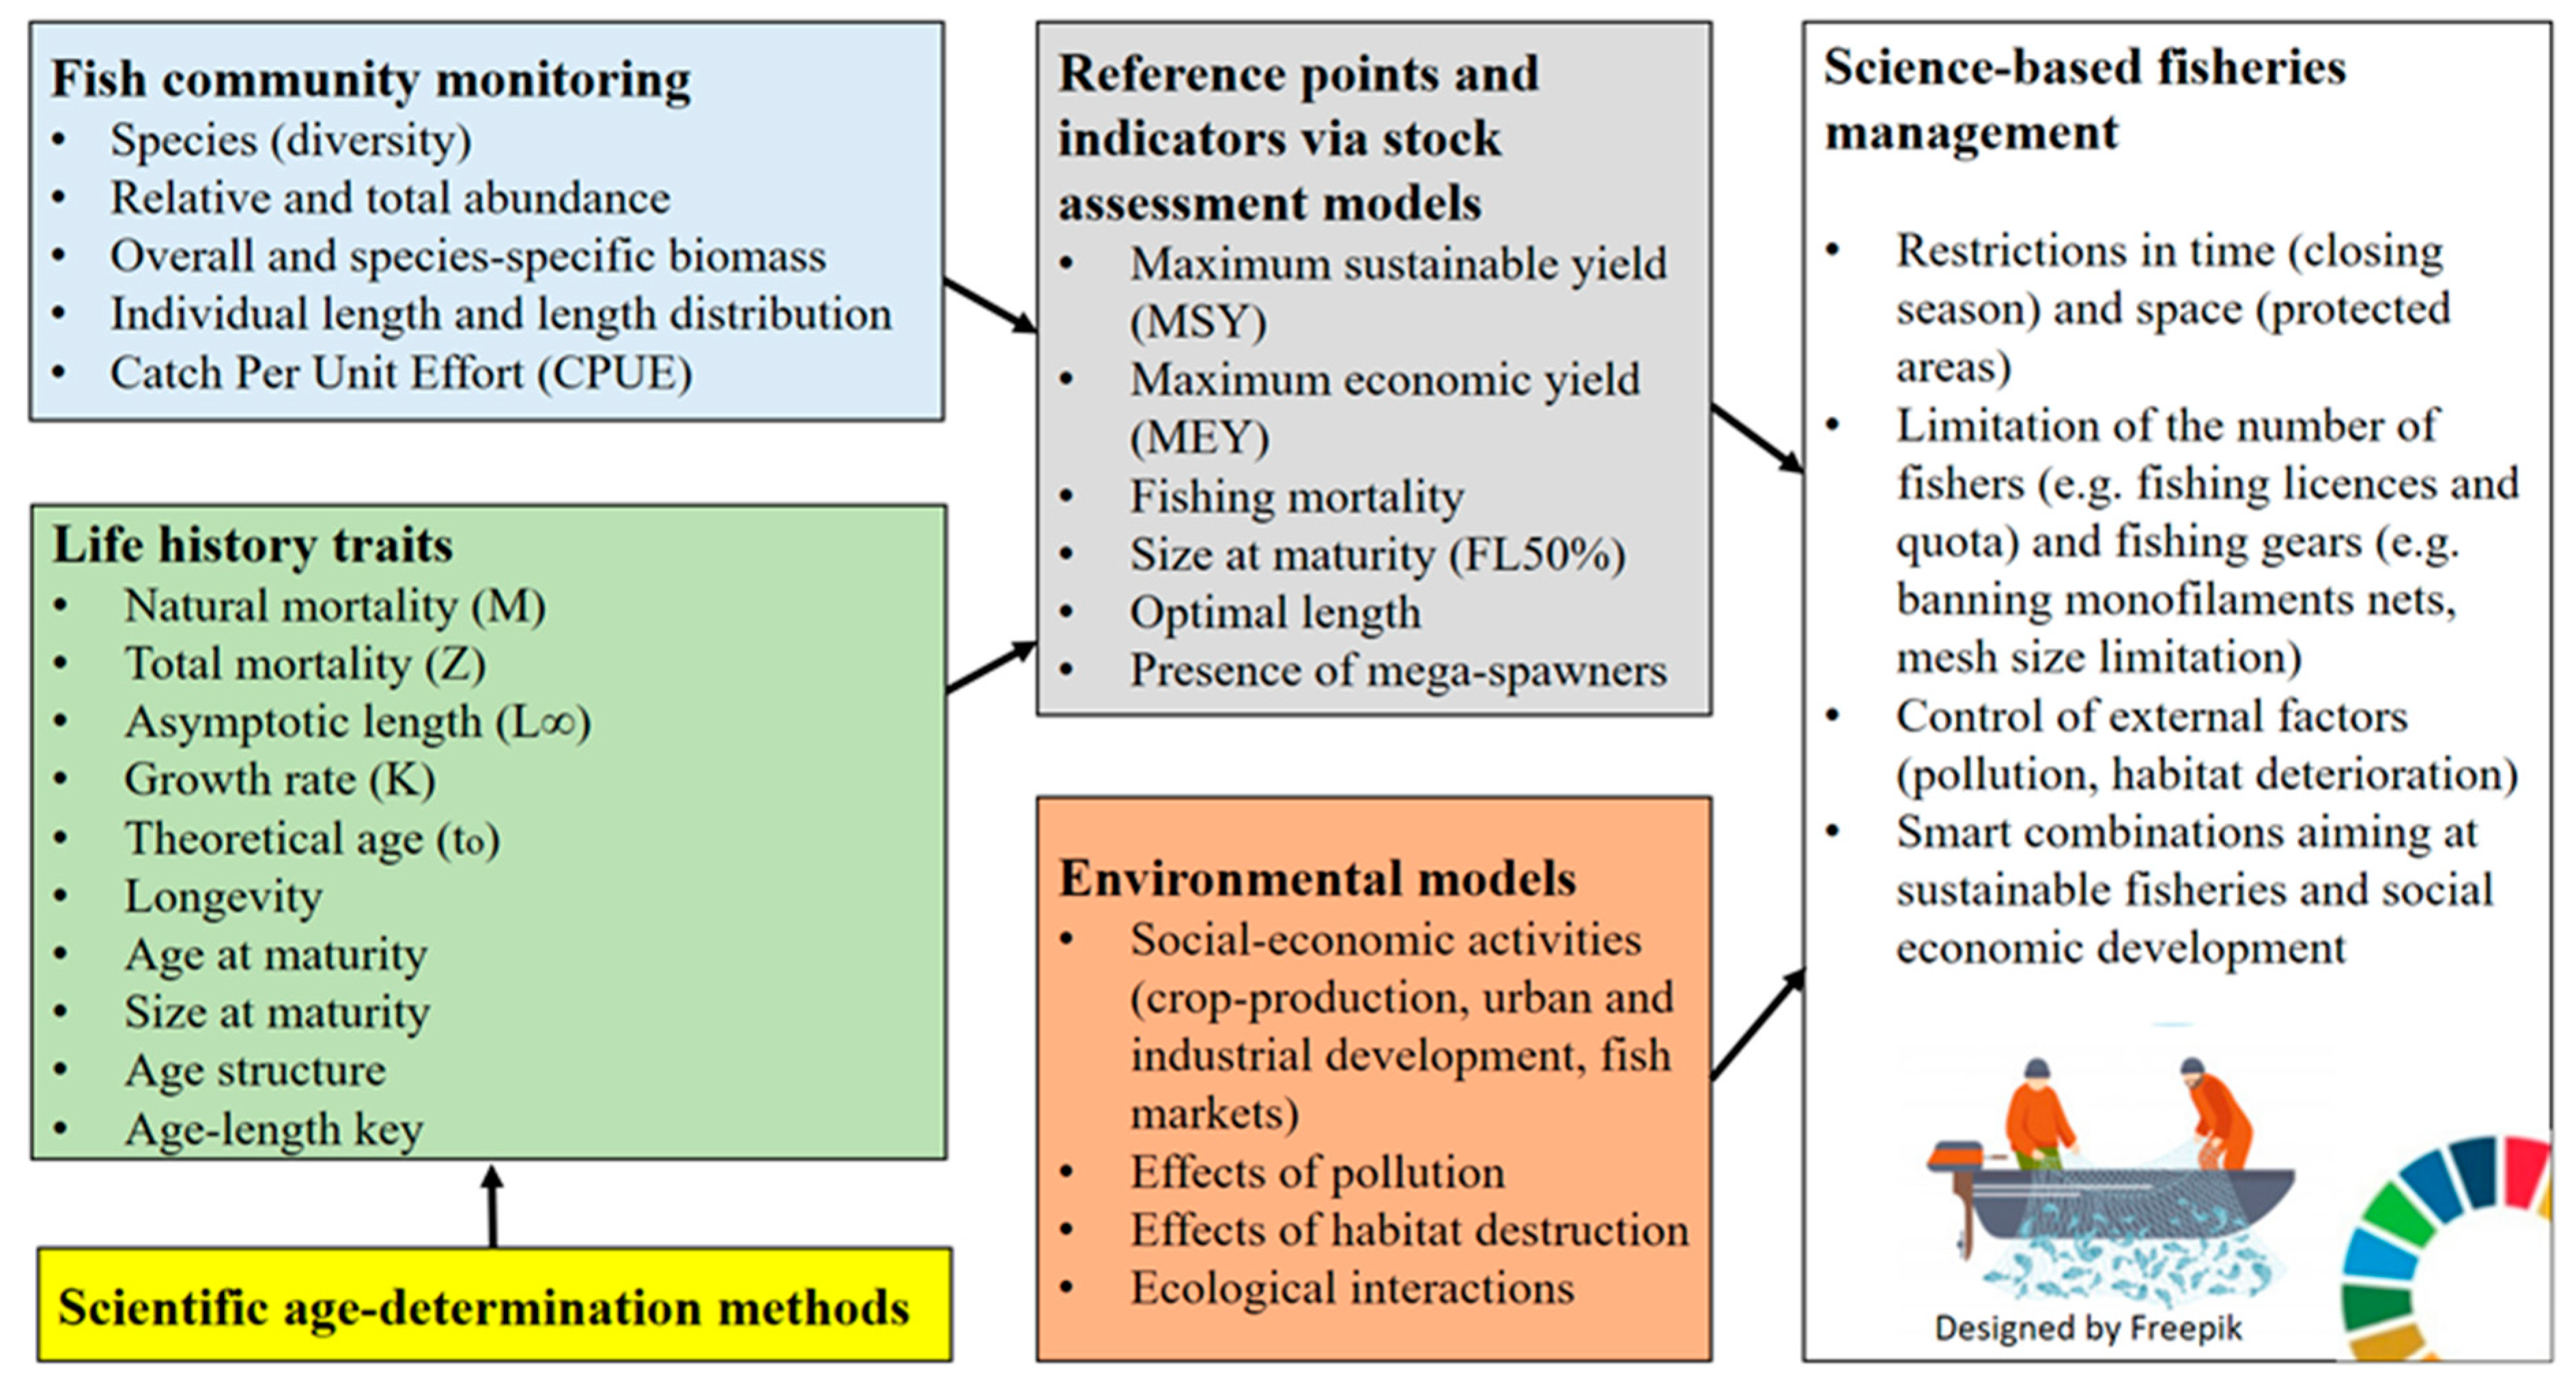
Table 1.
The importance of life history traits for assessment and management use.
| Life History Traits | Assessment and Management Use |
|---|---|
| Age data (i.e., individual age) | Used to determine the age at first maturity and to estimate growth parameters |
| Age and length at first maturity | Used to establish a minimum size limit to ensure that individual fish can reproduce at least once before being harvested |
| Maximum age (i.e., longevity) | Used to estimate the natural mortality rate and set the maximum age in the stock assessment models |
| Asymptotic length (L∞) | Used to set size limits (i.e., restrict mesh sizes and prohibit fishing gears) |
| Growth rate (K) | Indicates how fast the fish will reach the fisher’s minimum size limit |
| Mortality rates (i.e., natural and fishing) and spawning behaviour | Highlights the area and time of increased vulnerability to harvest and can be used for seasonal or area closures to protect the spawning biomass |
| Sex ratio | Used to understand the relationship between individuals, the reproductive potential of the species and the state of the population |
| Habitat preference | Helps to identify areas for protection |
Table 2.
Advantages, limitations, precision, sample size and cost of the different methods used to validate age or the rate of growth zone deposition. Methods are listed regardless of any scientific value. (Source: [79,147]).
| Methods | Advantages | Disadvantages | Precision | Sample Size | Cost |
|---|---|---|---|---|---|
| Mark-recapture | Validates the frequency of post-tagging growth increments. | Low or non-existent of recaptured fish at liberty (>1 year). Difficulty to identify a post-mark annulus | ±1 year | >1 | Minimal excluding cost of tagging cruise |
| Marginal increment analysis and Edge analysis | Validates frequency of growth increments formation. | Applicable to fast-growing or young fish. A year-round sample is required. | ±1 year | >100 | Minimal other than a fish collection |
| Radiometric | Validates absolute age. Applicable to any recently collected data. Suitable to long-lived fish | Can only distinguish between widely divergent age estimates | ±25–50% | 10–50 | ~$1000 per age category |
| Radiocarbon | Validate both absolute age and frequency of growth increments. Suitable for long lived fish. Does not require recently collected sample. | Some of the fish in the sample must be hatched before 1965. | ±1–3 years | 20–30 | $700–$1000 per otolith |
Publisher’s Note: MDPI stays neutral with regard to jurisdictional claims in published maps and institutional affiliations. |
© 2021 by the authors. Licensee MDPI, Basel, Switzerland. This article is an open access article distributed under the terms and conditions of the Creative Commons Attribution (CC BY) license (http://creativecommons.org/licenses/by/4.0/).
Share and Cite
MDPI and ACS Style
Gebremedhin, S.; Bruneel, S.; Getahun, A.; Anteneh, W.; Goethals, P. Scientific Methods to Understand Fish Population Dynamics and Support Sustainable Fisheries Management. Water 2021, 13, 574. https://doi.org/10.3390/w13040574
AMA Style
Gebremedhin S, Bruneel S, Getahun A, Anteneh W, Goethals P. Scientific Methods to Understand Fish Population Dynamics and Support Sustainable Fisheries Management. Water. 2021; 13(4):574. https://doi.org/10.3390/w13040574
Chicago/Turabian StyleGebremedhin, Shewit, Stijn Bruneel, Abebe Getahun, Wassie Anteneh, and Peter Goethals. 2021. "Scientific Methods to Understand Fish Population Dynamics and Support Sustainable Fisheries Management" Water 13, no. 4: 574. https://doi.org/10.3390/w13040574
Note that from the first issue of 2016, this journal uses article numbers instead of page numbers. See further details here.