
Possible Sources of Salinity in the Upper Dibdibba Aquifer, Basrah, Iraq
by
 , and
, and
Ahmed Abdulameer
1,2,3,*, 
Jassim Mohammed Thabit
2 ,
,
Wael Kanoua
4, 
Oliver Wiche
5 and
Broder Merkel
1 1
Geology Institute, TU Bergakademie Freiberg, Gustav-Zeuner-Str. 12, 09599 Freiberg, Germany
2
Department of Geology, College of Science, University of Baghdad, Baghdad 10071, Iraq
3
General Commission for Groundwater, Baghdad 10053, Iraq
4
Chemical and Petroleum Engineering Faculty, Al Baath University, Homs, Syria
5
Institute for Biosciences, TU Bergakademie Freiberg, Leipziger Str. 29, 09599 Freiberg, Germany
*
Author to whom correspondence should be addressed.
Water 2021, 13(4), 578; https://doi.org/10.3390/w13040578
Submission received: 17 January 2021
/
Revised: 12 February 2021
/
Accepted: 19 February 2021
/
Published: 23 February 2021
(This article belongs to the Section Hydrology)
Abstract
:Salinity increase in groundwater was investigated in the area between Al-Zubair and Safwan, and close to the Khor Al-Zubair Channel of southern Iraq. Thirty-nine groundwater samples from the shallow aquifer and one sample from the Khor Al-Zubair Channel were analyzed. The mean total dissolved solids are 7556 mg/L. The δ2H and δ18O plot in two groups are below the global meteoric water line. Group A indicates the evaporation effect of irrigation return-flow, while group B is characterized by depleted δ18O values due to recharge under colder climate. Deuterium excess values plot within the region of modern precipitation and dilution of groundwater by precipitating water. The groundwater residence time is between 1000 and 2000 years and combining 14C -age with SO42− shows a contrasting effect on groundwater on both sides of Khedr Almai Fault and the Zubair anticline, which indicates the role of these geological structures on the hydrochemical evolution in the western part. Jabal Sanam shows no clear effect in this regard. The ratio Cl−/Br− and sulfate in groundwater showed that the measured salinity in groundwater is the result of a mixing process between groundwater, seawater intruding from Khor Al-Zubair Channel, and water from septic tanks in addition to dry and wet sea spray, and irrigation return-flow.
1. Introduction
Groundwater is a valuable source of life and sustainability in arid and semi-arid regions. In the absence of surface water and sparse precipitation, the demand for groundwater increases to keep pace with the steady increase of population and to provide adequate water supply for urbanization, industrialization, and agriculture [1]. The overuse of groundwater, combined with the increase in the annual average of temperatures and a severe drop in the precipitation and recharge, cause evident qualitative and quantitative deterioration in groundwater, which negatively affects economic systems in arid and semi-arid regions [2].
Iraq, in this regard, is not an exception, especially in the southern parts of the country, as groundwater demand has increased in the last decades. In the southern part of the country, several ports, oil fields, oil/gas installations (gas collection and separation stations and oil storage facilities), and industrial plants (iron and steel plants, chemical fertilizer plants, petrochemical plants, desalination plants) are operating. In addition, the main economic activity of the local people is agriculture, making this region the food basket for central and southern Iraq. Local communities rely on groundwater to a great extent as the primary source of their economic activity. Therefore, more than 5000 wells have been drilled in the AOI (area of interest), tapping the upper unconfined aquifer to meet part of the region’s water demand [3].
Because of uncontrolled groundwater abstraction and the lack of quantitative and qualitative monitoring, many qualitative issues have arisen, mainly salinization and environmental pollutants. The salinization of aquifers may lead to severe consequences and jeopardize the environment as well as the economy of the affected region [4]. Besides the effect of low rainfall (about 148 mm per year) and severe climate change [5,6,7], the closeness to the Khor Al-Zubair (KhZ) makes the aquifer system vulnerable to seawater intrusion, especially as groundwater is over-pumped. Thus, salinity is an ongoing issue here [8].
In the salt-affected areas, farmers cultivate only about 30% of their land, and they have achieved only about 50% of their past performance. With the current salinity levels, it is estimated that about 300 million US$ per year is lost due to elevated salinity [9]. Besides, Abdulameer [10] found, by calculating the normalized difference vegetation index (NDVI) from satellite data, that there was a significant decrease in the vegetation area of southern Iraq by about 41% between 2001 and 2017. Thus, there is a need to develop programs for the management and sustainability of aquifers, especially in coastal areas, to investigate the sources of salinity, and to understand the relationship between the sea and these aquifers.
Detailed and comprehensive research on salinity increase in Southern Iraq is still missing. Thus, concerns about influences on the groundwaters prompted an investigation examining the hydrochemical and isotopic situation in relation with the geologic and tectonic settings to uncover the possible sources of salinity and the factors leading to its increase in groundwater in the Safwan-Al-Zubair area in southern Iraq close to the KhZ. A further objective is to provide recommendations to direct the coming research, and to improve the understanding of the salinity problem, which provides the basis for the responsible authorities and decision makers to plan protection strategies for water resources, which are significantly related to the health and economic situation of the local community.
2. Materials and Methods
2.1. Study Area
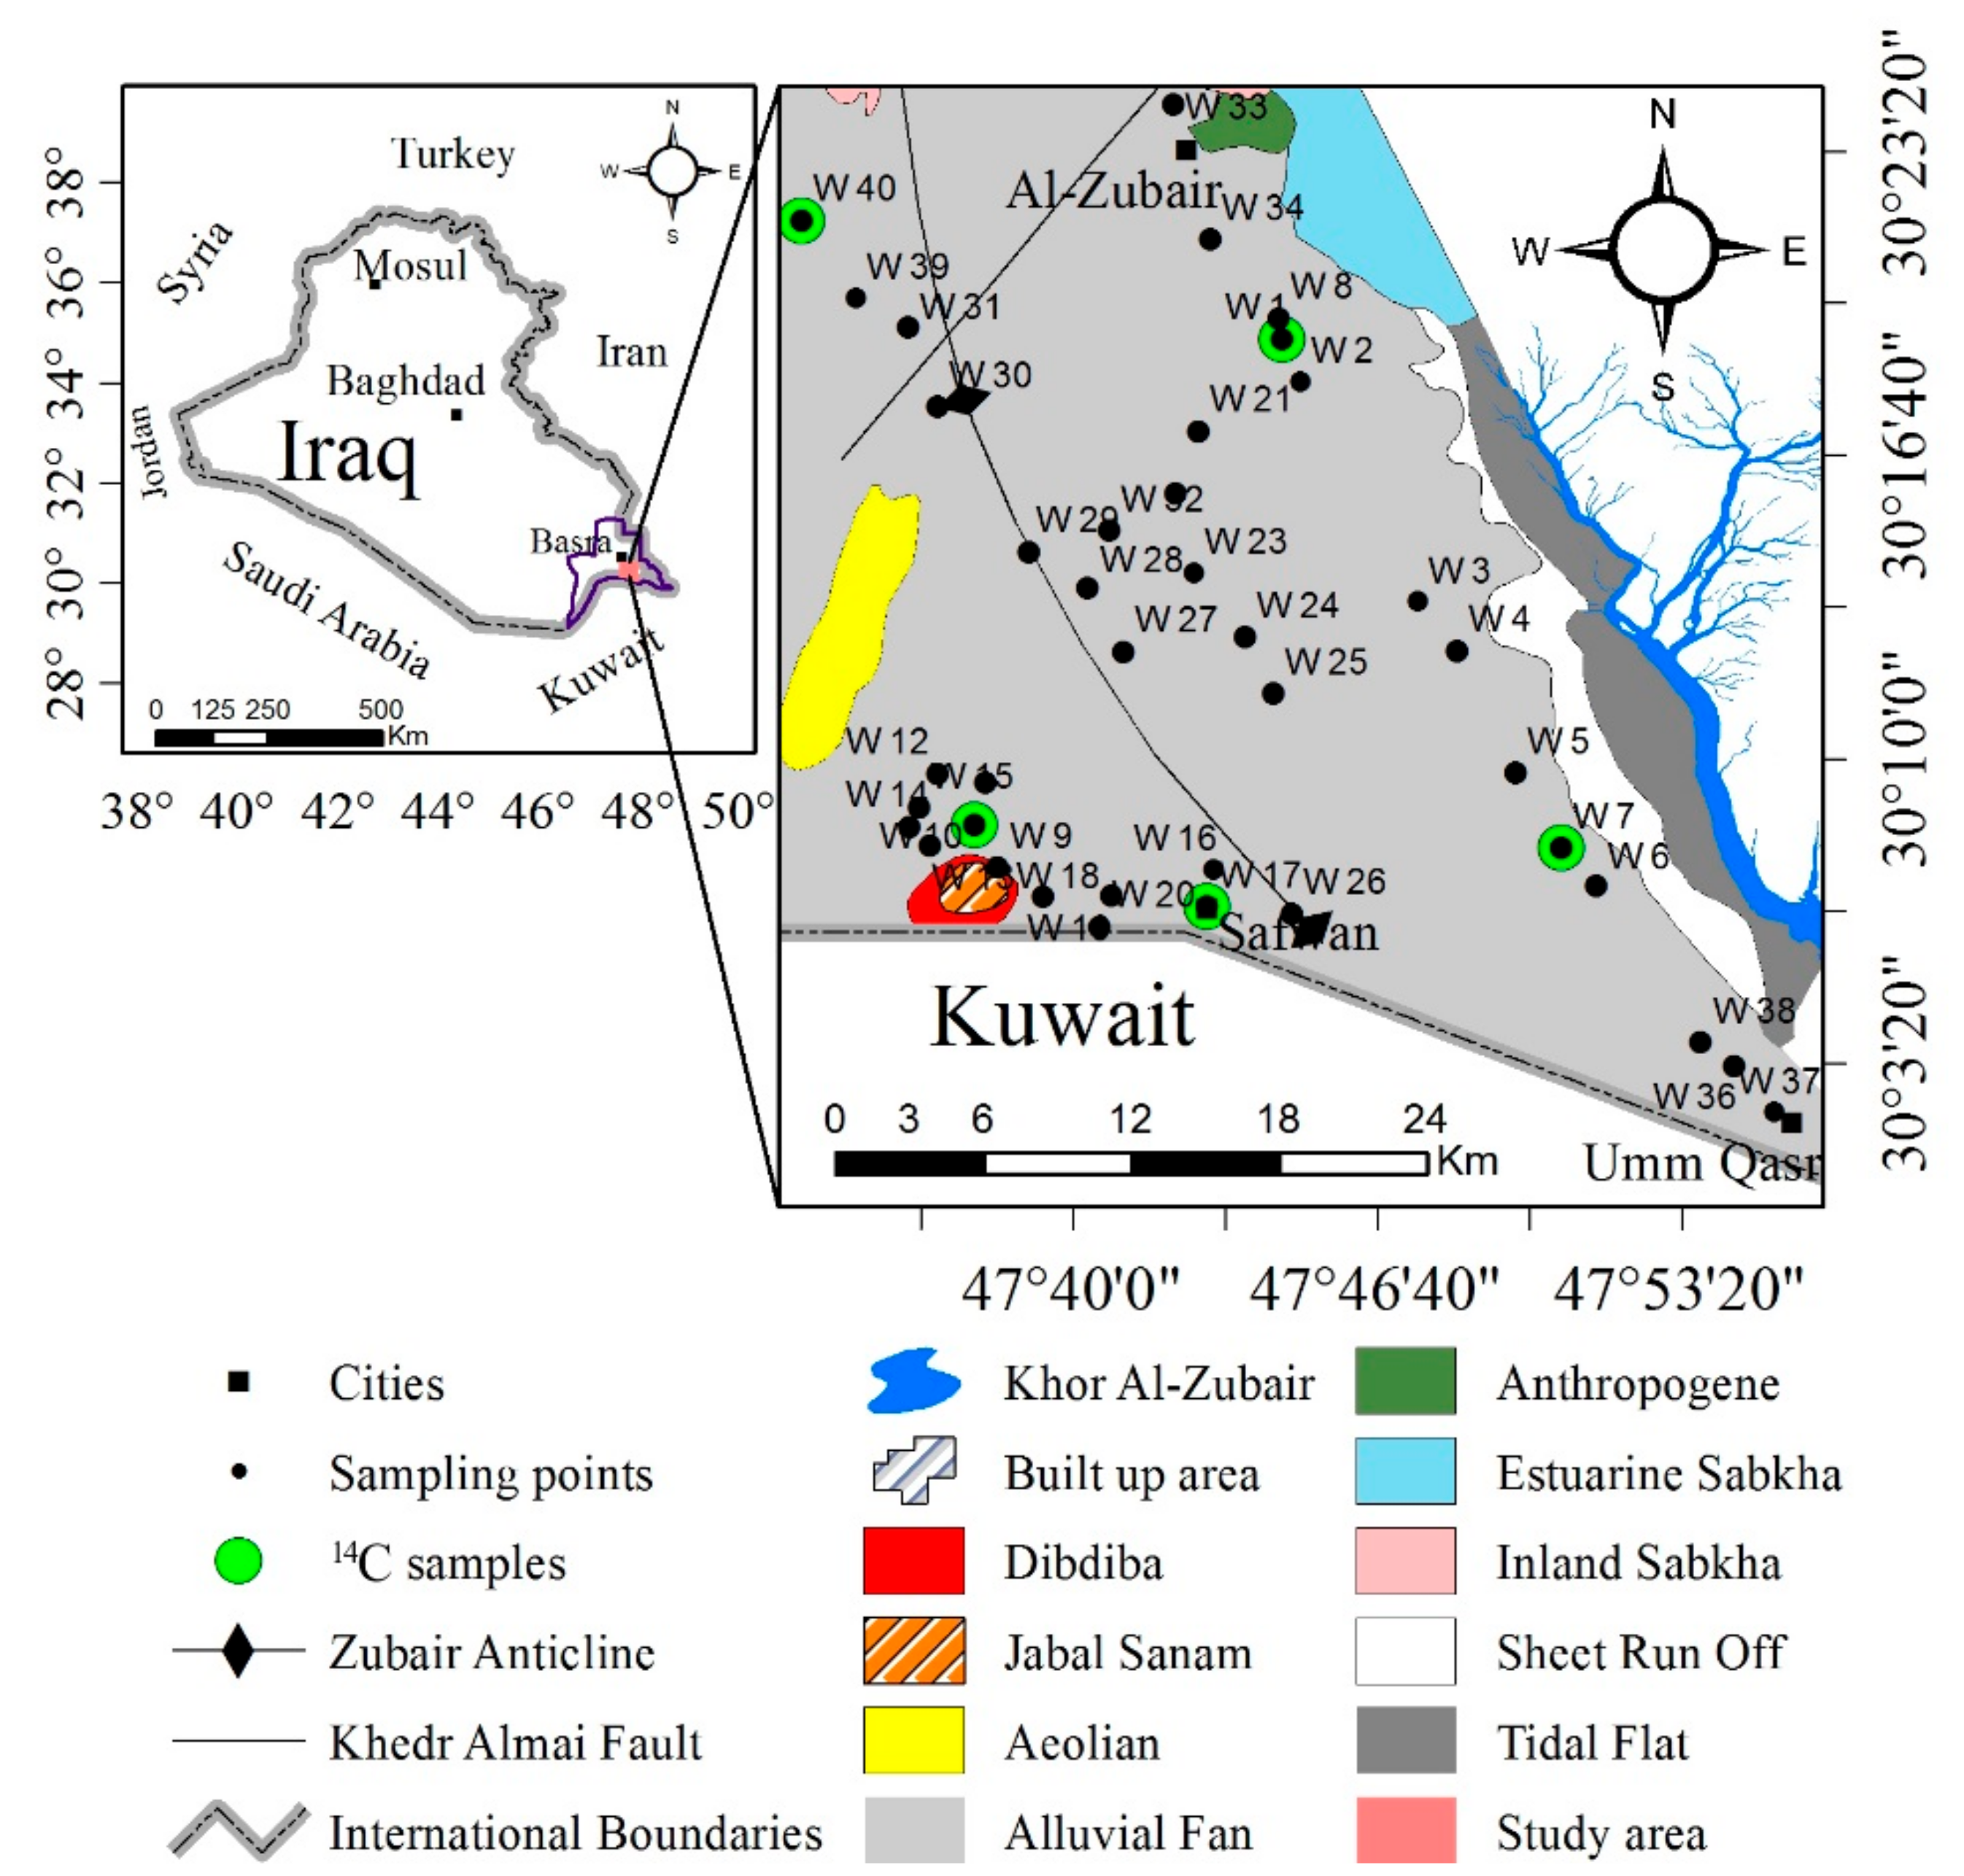
The area of interest (AOI) is in southern Iraq (Figure 1). It represents the southern part of the Southern Iraqi desert, between latitudes 30° 00′ and 30° 25′ N and between longitudes 47° 34′ and 47° 57′ E. Al-Zubair, Umm-Qasr, and Safwan are the main cities in the AOI. Climate data were collected from Al-Basrah meteorological stations. The average annual rainfall is 148 mm, annual potential evaporation (pan evaporation) is 3534 mm, the annual average minimum temperature is 19.6 °C, and the annual average maximum temperature is 33.3 °C. Groundwater is the primary source of water supply within the area. The upper part of the clastic sandy Dibdibba Formation (Pliocene-Pleistocene) was investigated by Jassim et al. and Jassim and Goff [11,12], and it forms an unconfined aquifer containing brackish water with total dissolved solids (TDS) < 10,000 mg/L [13,14,15]. According to the tectonic divisions of Iraq, the AOI is located within the Al-Zubair secondary zone, which exists within the Mesopotamia zone, belonging to the stable shelf characterized by the disappearance of complex geological structures and thick cover of sediments. The Jabal Sanam, the Zubair Anticline [12], and Khedr Almai Fault [16] are the most prevailing geological structures in the area. The AOI is part of the Basrah block according to transversal tectonic divisions of Iraq. This block is characterized by the presence of many subsurface faults that are parallel to each other in the northeast-southwest direction [17].
2.1.1. Geological Setting
The morphology of the AOI (Figure 1) is a plain covered mainly with sand, pebbles, and clay. The Quaternary deposits in the AOI are classified into Pleistocene and Holocene according to their ages [18]. Holocene deposits consist of sand sheets or the alluvial fan sands of Wadi Al-Batin and estuarine Sabkha deposits [12]. Pleistocene deposits are represented by the Al-Batin alluvial fan, which consists mainly of gravelly sand and sandy gravels [19], In the vicinity of Khor Al-Zubair, the deposits consist mainly of silty clay with fine laminations. The tidal flat deposits are characterized by fine-grained sediments, usually silt and clay, and occasionally sand. The sheet run-off deposits consist mainly of alternation of sand and mud. Shallow depression deposits consist of clayey silt or silty clay. The Aeolian deposits generally consist of fine to medium-grained sand with minor fractions of silt and clay [19]. These sediments are underlain by the Dibdibba formation. The typical section of the Dibdibba formation (Pliocene-Pleistocene) was described by Owen and Nasr [20] and Van Bellen et al. [21]. It consists mainly of sand and gravel with pebbles. Sequences of Jabal Sanam are only exposed at one locality and are considered comparable with the Hormuz series (in Iran) of Infra-Cambrian age. The rocks of the Jabal Sanam sequence are subdivided into two units; the first unit is gypsum, and the second unit is limestone [18]. Dibdibba formation is partly exposed on the flanks of Jabal Sanam [18] geochemically, the upper geological strata of the AOI consists mainly of quartz and feldspar [22]. The Dibdibba aquifer is underlain by other aquifers [20,23] (Supplementary Table S1), which are not the object of this investigation.
2.1.2. Hydrological Settings
Based on the hydraulic properties, the aquifer system in the AOI is divided into two hydrogeological units [8]: the upper, unconfined aquifer and the semi-confined Dibdibba aquifer. These two units are separated by a hard clay layer called Jojab, with a thickness of 2–4 m [14]. The thickness of the upper saturated unit is in the range of 15–20 m with an average of 17.5 m, and it contains relatively brackish water with TDS < 10,000 mg/L, partly suitable for agricultural purposes. Both the saturated and the unsaturated zone consist mainly of sand and pebbles [24]. The lower aquifer is confined to semi-confined, and is characterized by salinity with TDS > 10,000 mg/L in most parts of the AOI [15]. In the upper unconfined aquifer, the static water level changes from 1 to 6 m above mean sea level (amsl). The general direction of groundwater flow in the area is from southwest to northeast, following the topography [3]. The studied aquifer is characterized by a transmissivity and well discharge in the range of 14–964 m2/day and 12–1166 m3/day, respectively [25], with a hydraulic conductivity of 0.38 m/day [14].
2.2. Sampling Methods
A total of 40 samples to determine major cations and anions, stable isotopes of water (18O and 2H) were collected during the wet season (March 2016) in the AOI. One sample was from the KhZ, and 39 samples were from different agricultural and domestic wells. An additional five samples were taken for 14C and 13C determination. Information about well location was acquired with a GPS device (eTrex, Garmin International Inc., Olathe, KS, USA). Before sampling, groundwater wells were pumped for an adequate time to flush out residual water. At each point, the samples for stable isotopes of water were collected in 30-mL polyethylene bottles with airtight caps, and the carbon isotope samples were collected in 1-L bottles. The samples for anions were filtered through cellulose acetate filters (0.2 µm pore size) into clean rinsed 50 mL polyethylene bottles.
For cation and trace element analysis, samples were filtered (as above) and acidified with 2–3 drops of semi-concentrated nitric acid, HNO3 (suprapure), to a pH of <2. Glass 100-mL bottles were used to collect samples for inorganic and organic carbon. All the samples were stored in a cool box and later transported to the laboratories of the Technische Universität Bergakademie Freiberg, Germany (TUBAF) to analyze them for major components, radiocarbon 14C, and stable isotopes of water.
2.2.1. On-Site Measurements
A multiparameter device WTW-Multi 3430 (Wissenschaftlich-Technische Werkstätten GmbH, Dr.-Karl-Slevogt-Straße 1, D-82362 Weilheim, Germany) was used to measure temperature, oxygen redox potential (ORP), electrical conductivity (EC), and pH in the field (Supplementary Table S2). The daily pH calibration was conducted before starting the fieldwork using three buffer solutions (4.01, 7.00, and 10.00). Two standards were used to validate the EC readings (a KCl solution of 1413 and 12,880 µS/cm). Readings of ORP from the field were corrected concerning the temperature and the standard hydrogen electrode (SHE).
2.2.2. Laboratory Analyses
Major cations (Na+, Ca2+, Mg2+, Mn2+, K+, and NH4+) and major anions (Cl−, NO3−, SO42−, Br−, and F−) were analyzed using ion chromatography (IC) in the chemistry department of the TUBAF. The samples with high EC values were analyzed after being diluted by a known volume of deionized water for IC and ICP-MS analysis. A liquid TOC analyzer (Elementar Analysensysteme GmbH, Langenselbold, Germany) was utilized to measure the total inorganic carbon (TIC) and the total organic carbon (TOC). The TDS was calculated by the sum of all cations and anions (0.5 × HCO3−) and SiO2 in mg/L. Hydrogen carbonate (HCO3−) was calculated from TIC and pH utilizing PHREEQC (Ver.3.37) and the database PHREEQC.dat [26]. The output PHREEQC delivered, as well as the calculated EC and the percent error of the cation and anion balance were both criteria for the analytical quality. Additionally, species distribution and saturation indices (SI) for minerals delivered further information for the assessment.
The 2H was analyzed by chromium reduction with isotope ratio mass spectrometry (IRMS), and 18O was analyzed with an IRMS with a Gas Bench system; all samples were analyzed in GeoZentrum Nordbayern, Erlangen University. Radiocarbon (14C) contents were analyzed by Hydroisotop GmbH, Germany, according to the EN 1484 method with an acceleration mass-spectrometer (AMS). Carbon stable isotope (13C) values were determined with an IRMS.
3. Results and Discussion
A total of 39 groundwater samples were collected from the Upper Dibdibba aquifer and one sample from the KhZ. Unfortunately, no samples could be collected from the Lower Dibdibba aquifer because this aquifer is not accessible by wells due to its high salinity (information from the local community). A few wells drilled by local farmers to reach the lower confined aquifer are reported, but they have already been abandoned and no pumps have been installed for some years [8].
Some of the chemical parameters of the analyzed groundwater samples are presented in Supplementary Table S3. To give an initial perception of the hydrochemical situation in the AOI, Table 1 displays descriptive statistics of groundwater constituents and chemical relationships in comparison to values in the KhZ. The percent error (cation-anion) calculated by PHREEQC was in the range −12% to 21 %, with 83% of the samples less than 10%.
3.1. Groundwater Salinity
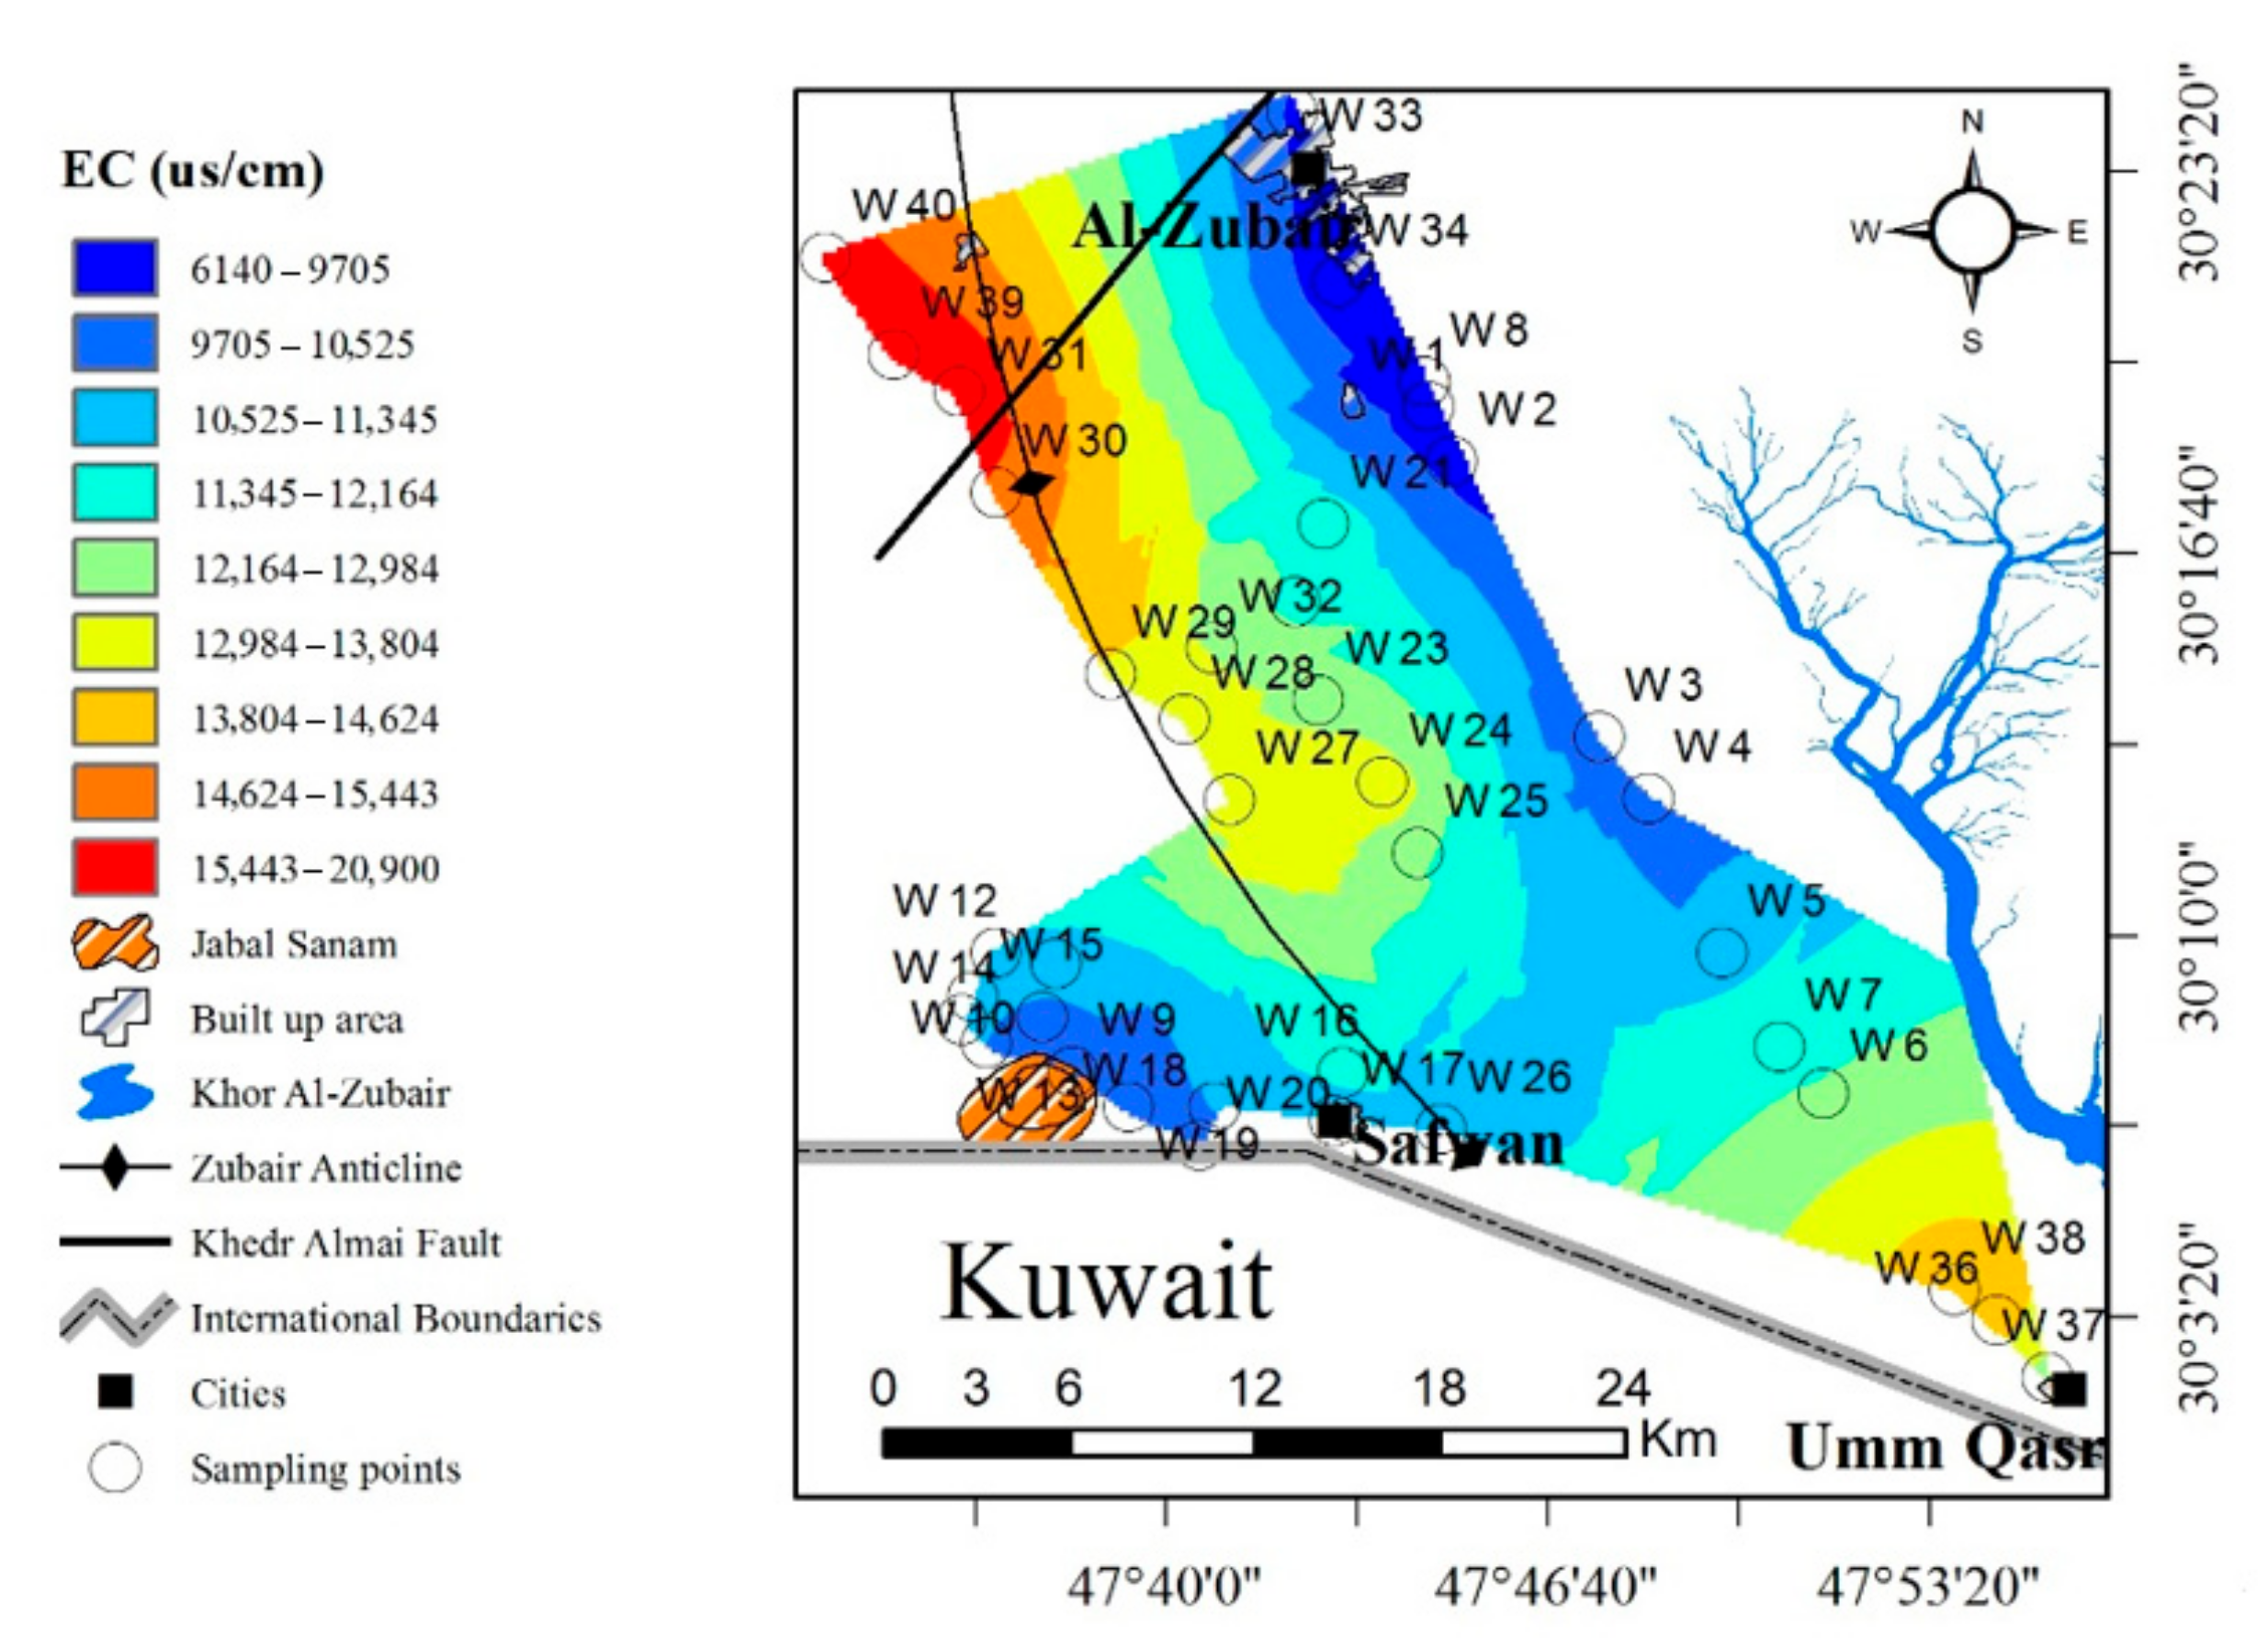
Salinity has long been a constraint for groundwater development for drinking and irrigation purposes in the AOI. The spatial distribution of EC for the shallow aquifers (Figure 2) depicts that the occurrence of higher EC (>1000 µS/cm) is uniform in the upper unconfined aquifer. Unfortunately, the spatial distribution of EC in the underlying Lower Dibdibba aquifer (Supplementary Table S1) could not be plotted because no data points are available.
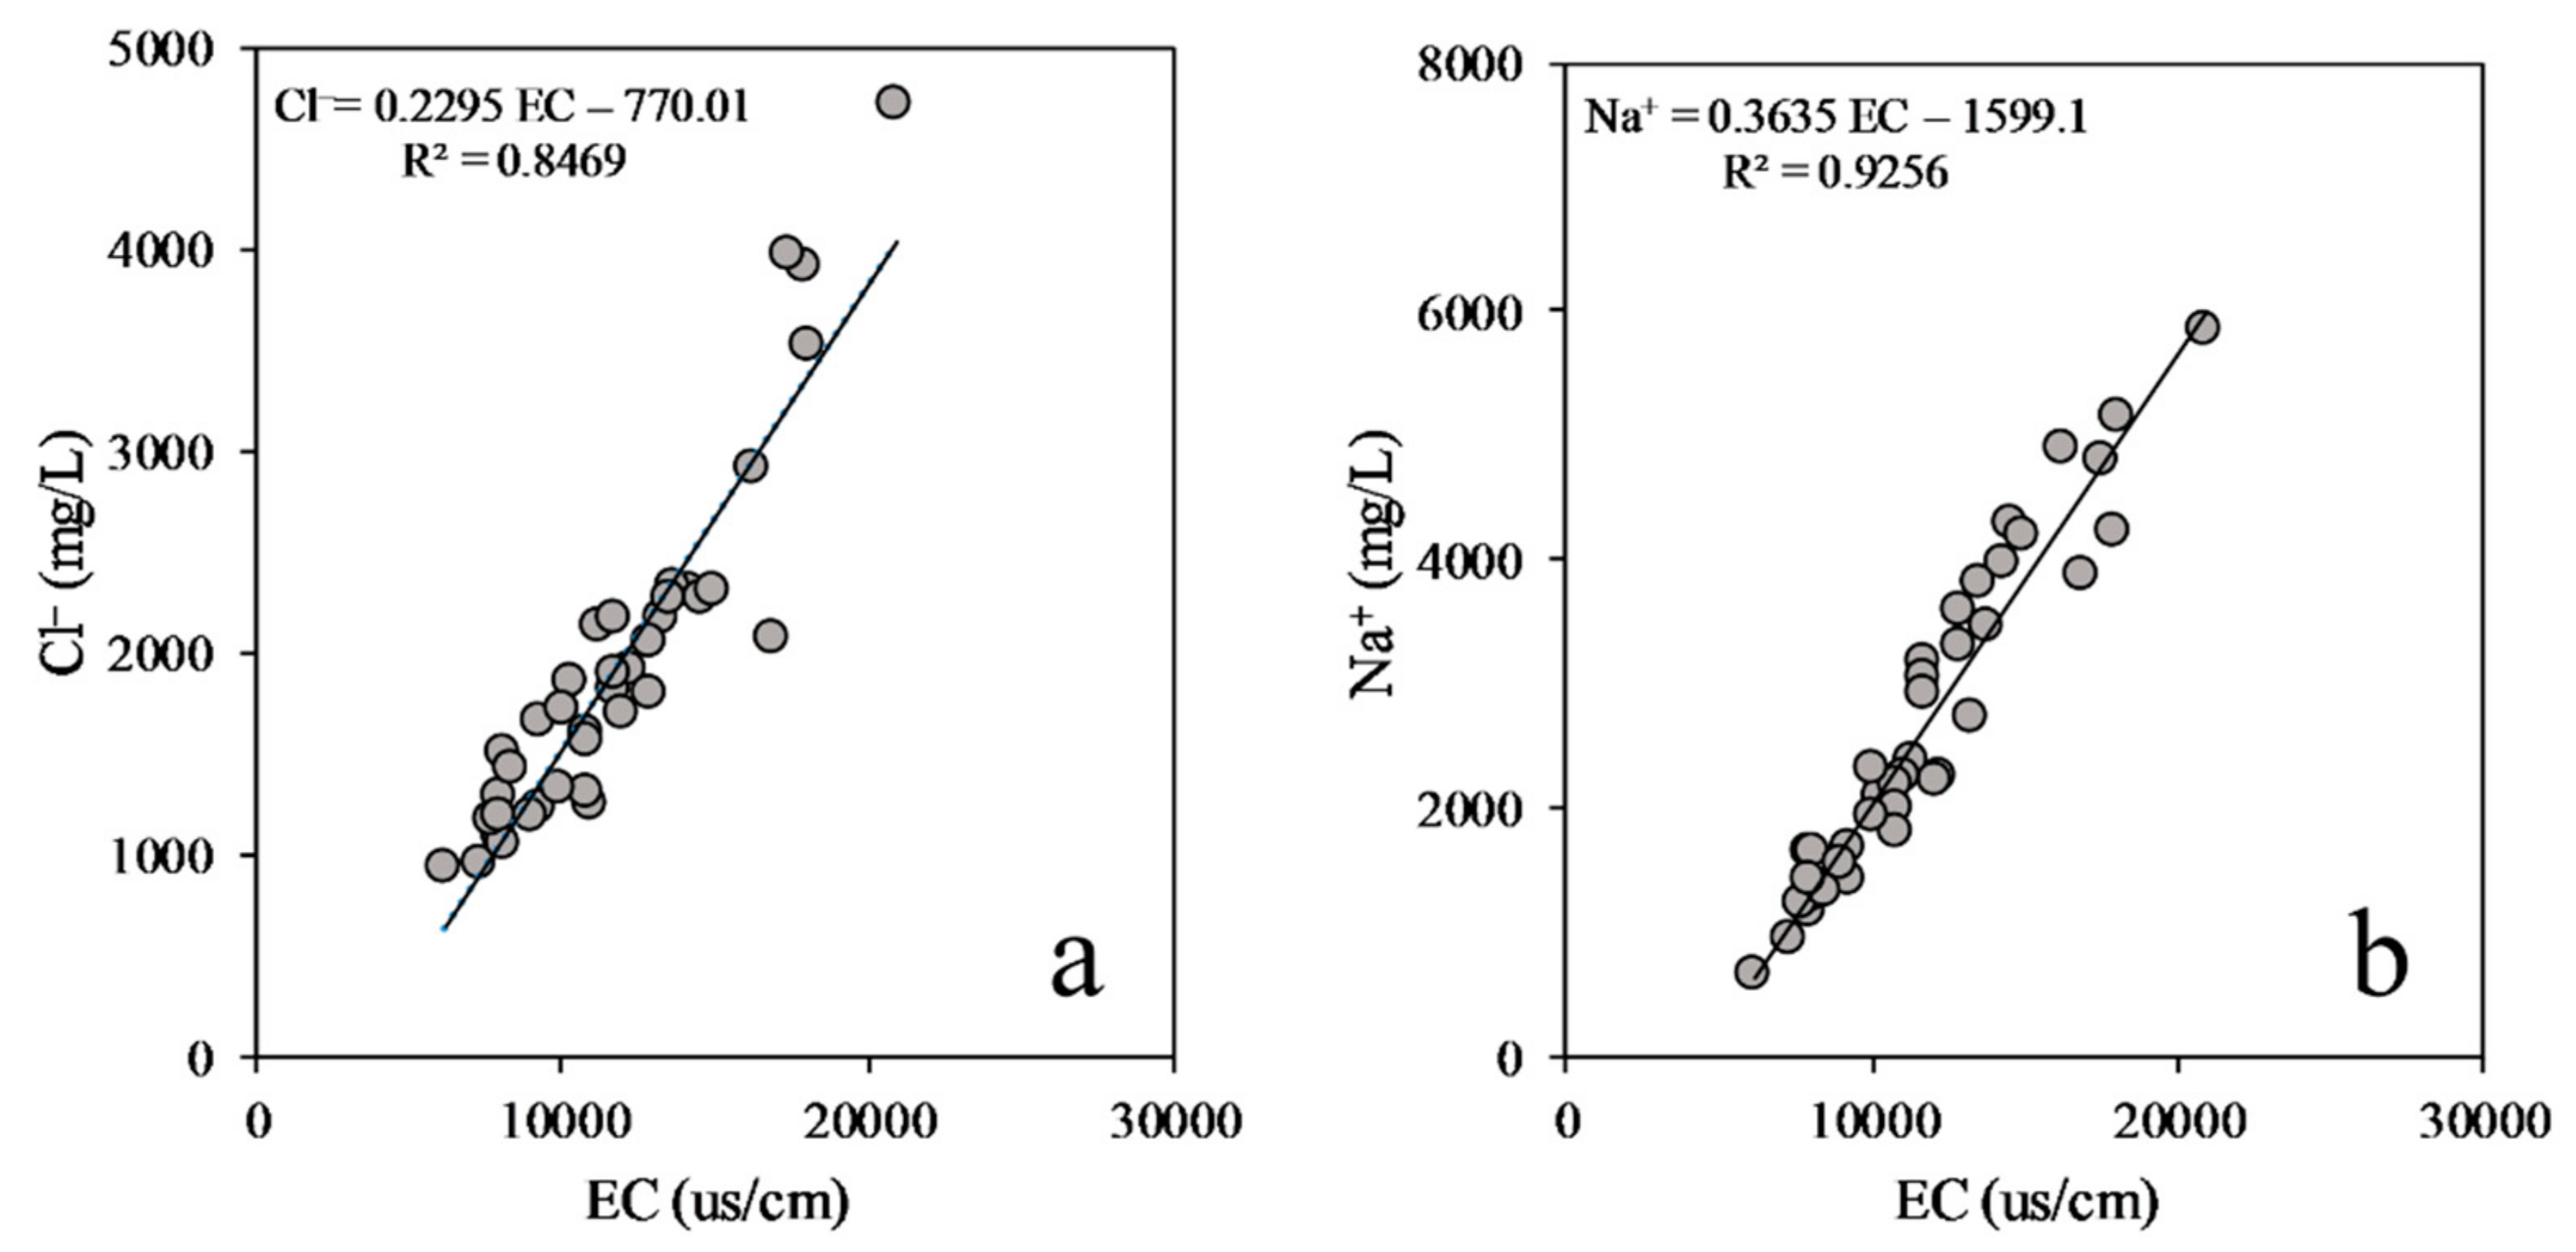
Groundwater in the AOI has a wide range of EC (6,140–20,900 µS/cm). A significant correlation (r = 0.9, p < 0.001) of EC with Cl− and Na+ (Figure 2a,b) implies that the increase in EC is dominated by these two constituents. The relationship between Na+ and Cl− is useful for understanding the origin of salinity.
A molar ratio of Na+/Cl− close to unity usually suggests halite dissolution, and Na+/Cl− > 1 indicates that the source of Na+ is silicate weathering, particularly of Na-plagioclase [27]. However, the mixing of seawater (Na+/Cl− = 0.86) with fresh water (Na+/Cl− > 1) may also give rise to the Na+/Cl− molar ratio close to unity [28]. The ratio of Na+/Cl− in the AOI ranges between 0.81and 2.16 with a mean of 1.19 ± 0.3, and in the area close to Umm-Qasr, there is a decrease in salinity westwards to a distance of 8 km (Figure 3), which indicates seawater intrusion in this area. Based on the molar ratios of Na+/Cl− and Cl−/Br−, halite might be the source of elevated Na+ and Cl− concentrations; however, halite dissolution produces a rapid increase in Cl−/Br−, which is not the case in the flow direction in the AOI. Spatially distributed Sabkha is reported to exist in the Quaternary deposits, yet it is more likely that calcite and gypsum are the most common evaporates (not halite). Another source is sea spray (Na+−Cl− aerosols) as in many coastal areas. Dry sea spray is deposited and washed to the groundwater during winter with rain and in summer through irrigation water. Pumping of groundwater for furrow irrigation by local farmers induces a cycle of enrichment, in particular for Cl−, while Na+ is partly retained in the unsaturated zone through cation exchange. Sulfate is enriched as well but controlled in its concentration by gypsum precipitation.
3.2. Stable Isotopes of Water and Deuterium Excess
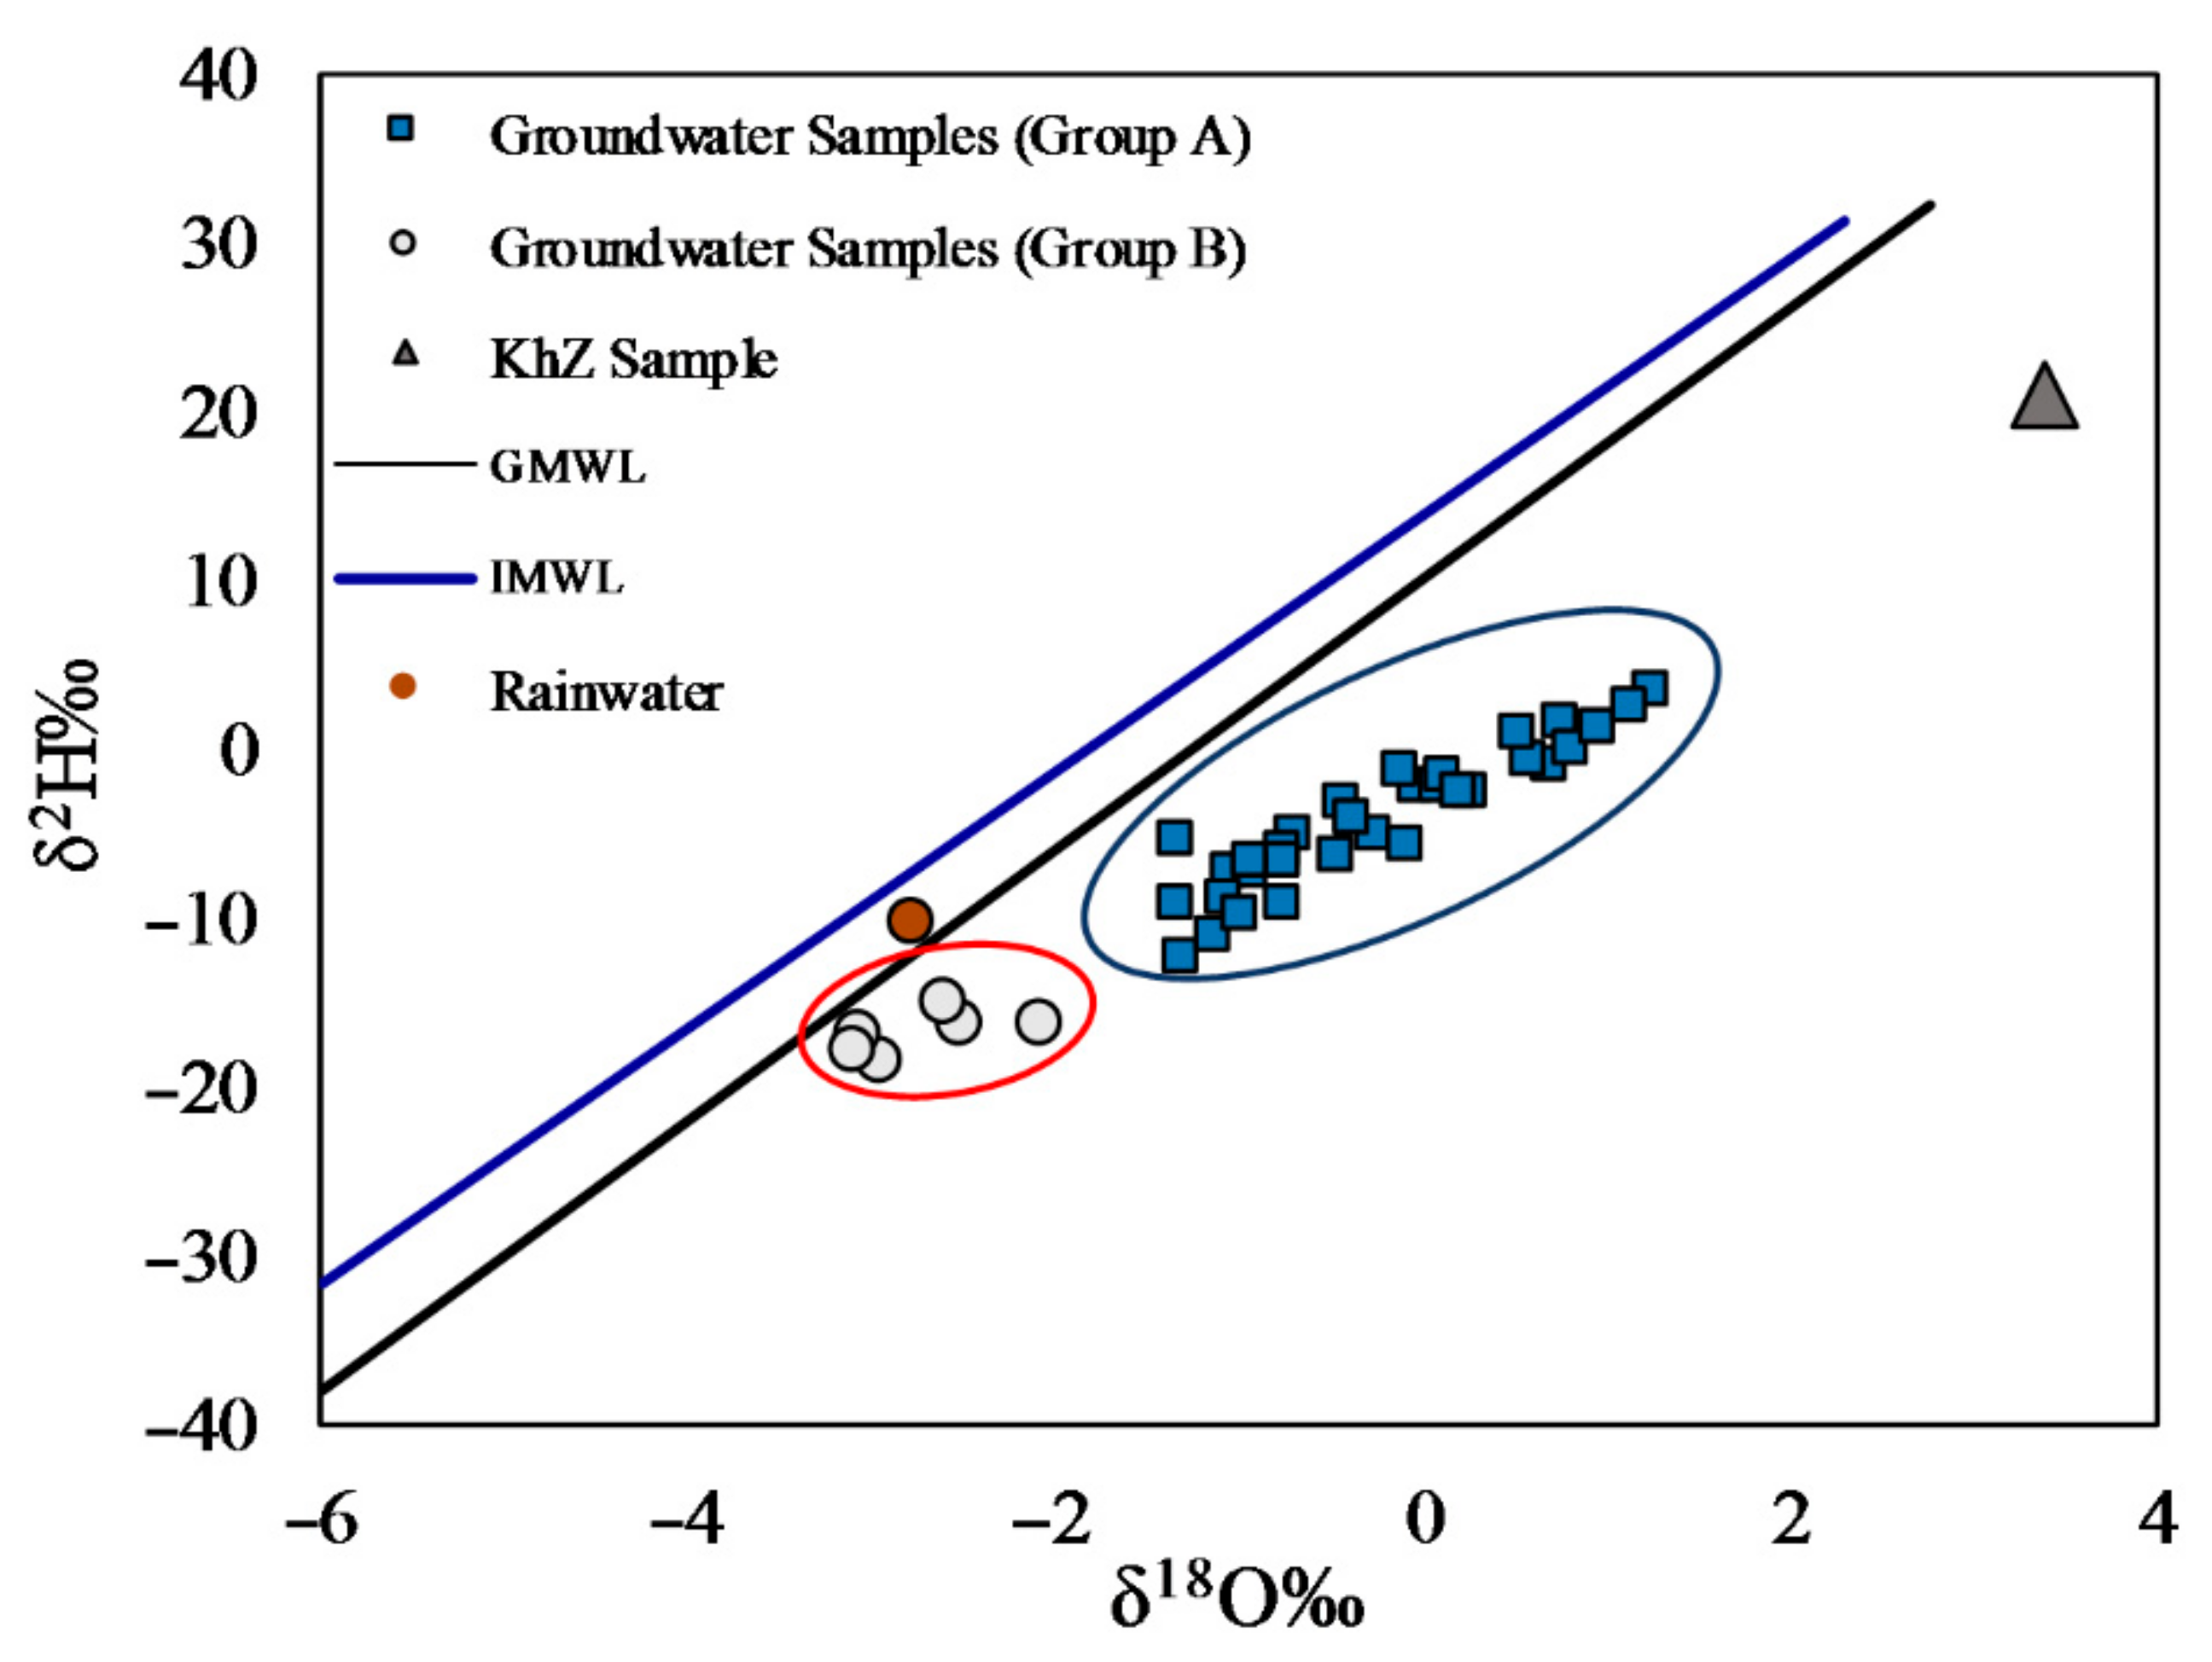
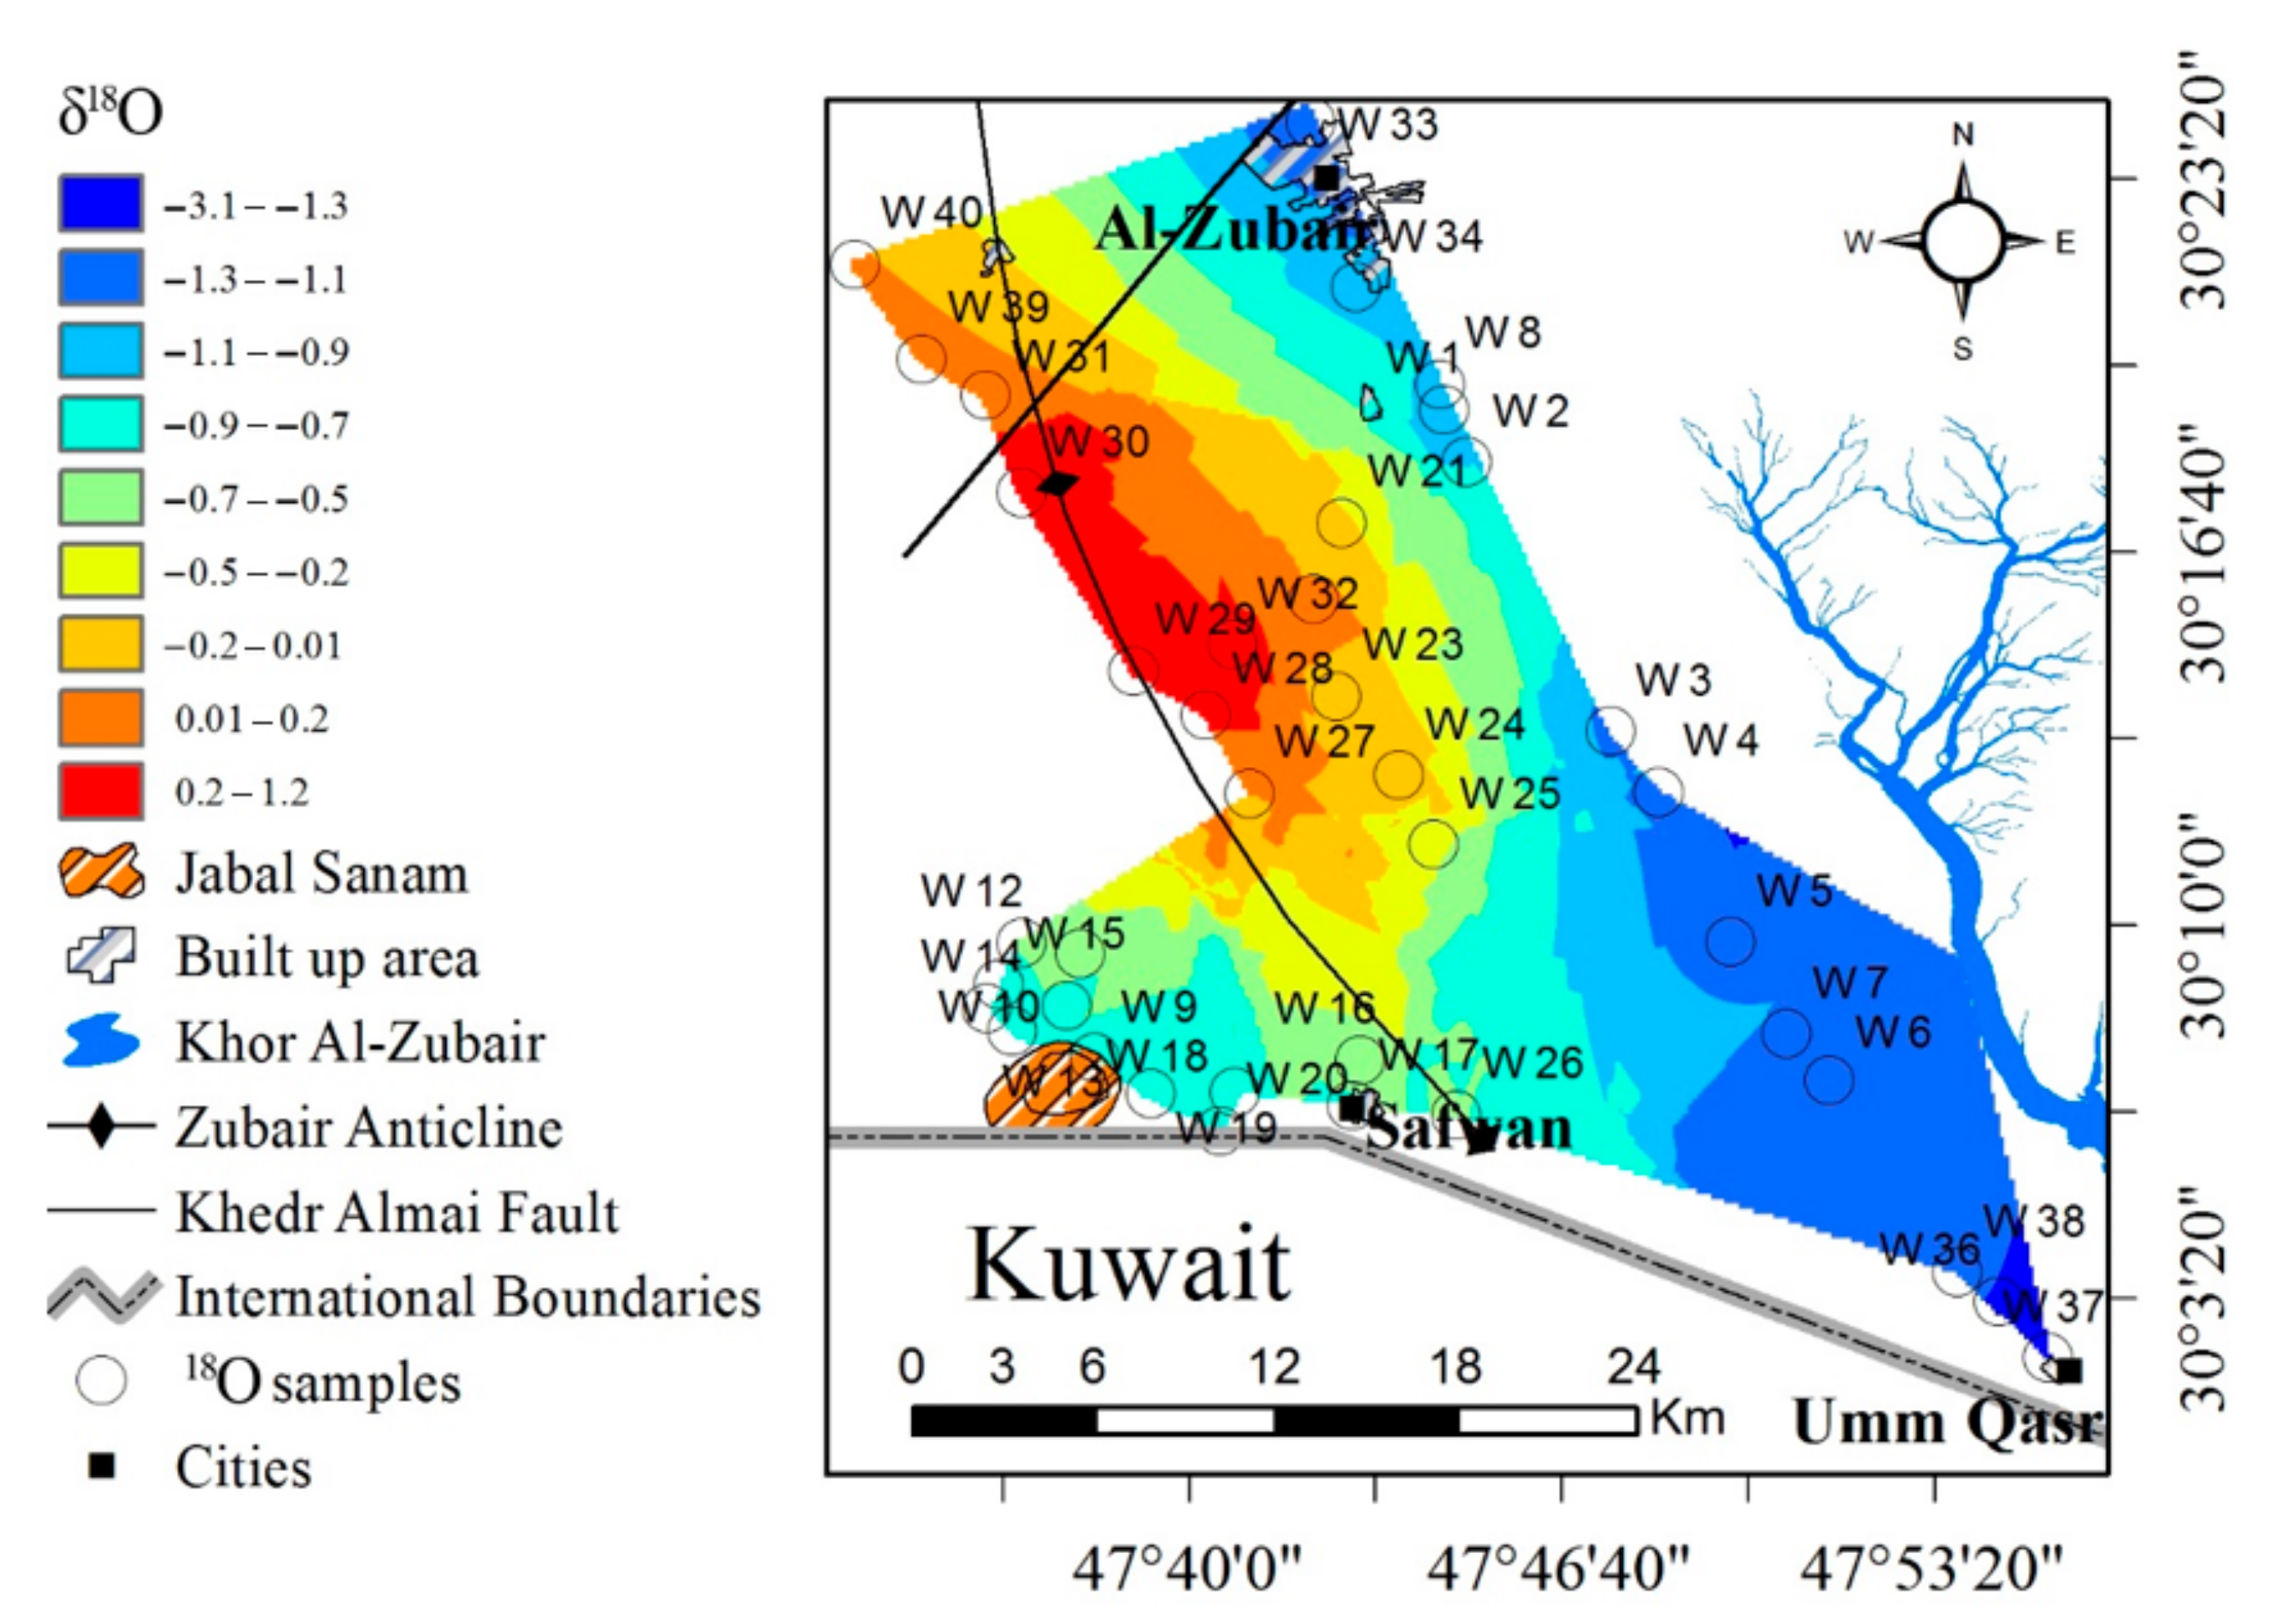
Supplementary Table S4 shows the isotope values of groundwater and the KhZ in the AOI. The values of δ18O range from −3.1 to 1.24‰, with an average of −0.638 ± 1.155‰. The δ2H ranges between −18.63 and 3.49‰, with an average of −6.056 ± 5.976‰. The isotope values of KhZ are 21.09‰ for δ2H and 3.4‰ for δ18O, and the isotope values of rainfall are −10.2‰ for δ2H and −2.79‰ for δ18O, collected between December 2011 and March 2012 [29].
Stable isotope values of water are represented graphically in Figure 4 in comparison with the Global Meteoric Water Line (GMWL), with δ2H = 8 × δ18O + 10 [30] and the Iraqi Meteoric Water Line (IMWL), with δ2H = 7.573 × δ18O + 13.82 [29].
Groundwater samples can be separated into two groups, Group A and Group B. All groundwater samples plot below the two meteoric water lines. There are many reasons for the variabilities in stable isotope composition, e.g., recharge from more than one source of water, evaporation from recharging water before or after infiltration, rainfall from more than one atmospheric moisture mass, vertical and/or horizontal leakage from other water bodies. The isotopic pattern of rainfall in Iraq is affected by two atmospheric moisture sources [29]: the first is the south-east moisture mass from the Arabian Sea and the Persian Gulf, and the second is the west moisture mass from the Mediterranean Sea. Groundwater samples from the AOI plot below the GMWL (Figure 4); this suggests an effect either from the moisture mass that comes mainly from the Arabian Sea and Persian Gulf (GMWL), and/or the evaporation from recharge water, before or after infiltration.
Evaporation from rainwater during infiltration is considerably low in the AOI because rainfall happens exclusively in winter, and the infiltration rate through the unsaturated zone into the upper aquifer is high due to the coarse and loose sediments as well as the very permeable and unconsolidated pebbly sand [31]. On the contrary, evaporation is very high during summer when groundwater is pumped to the surface for furrow irrigation, shifting stable isotopes to heavier values.
Samples of Group B (W2, W3, W5, W17, W33, and W37) plot along and close to the GMWL and are relatively highly depleted (Figure 4). A plausible reason for this depletion in δ18O could be precipitation in a colder climate. Because temperature did not vary significantly in the AOI in the recharge periods during the last decades, upward flow from the underlying Lower Dibdibba confined aquifer is the most probable explanation. The Lower Dibdibba was deposited and recharged during Pliocene-Pleistocene when the climate was much colder than the present and stable isotopes of water show a depleted signature. Unfortunately, no wells were tapping this lower part of the aquifer because of its high salinity. An upward leakage could be the result of natural discontinuities in the Jojab aquitard but could as well be likely due to test drilling in deeper zones without proper sealing of boreholes drilled by farmers searching for more water. It is worth mentioning that Al-Sudani [32] reported that the Jojab aquitard did not appear in the wells in the same study area or appeared at a depth of more than 110 m. This, however, is not the case in at least the eastern part of his study area. Abdulameer et al. [8] conducted a 2D imaging survey in Al-Zubair-Umm Qasr and the Al-Zubair and Safwan areas, and concluded that Jojab depth in all sections did not exceed 30 m. Additionally, the Jojab appeared in all lithological profiles used for lithological correlation at a depth no more than 32 m.
Rainfall in Kuwait comes from two main moisture sources [33]: Mediterranean moisture mainly influences the western and central parts of Kuwait, while moisture from the Persian Gulf predominantly affects the coastal area of Kuwait. Areas under the influence of Mediterranean moisture show d-excess values of around +19.7‰, and +7.9‰ in the area affected by Persian Gulf moisture. The δ2H values for KhZ are 21.1‰ and 3.4‰ for δ18O, and the enrichment in water isotopes is the result of evaporation from the surface of this relatively shallow water body. Therefore, the trend of the stable isotopes between the KhZ sample and the rainfall sample (Figure 4) can be explained by the mixing of groundwater and rainfall with the seawater from KhZ in the vicinity of this channel, while the enrichment in stable isotopes of water in the area far away from the KhZ reflect the evaporation of irrigation water, mainly from groundwater.
The intrusion from KhZ inland of the KhZ vicinity was already discussed in a previous study [8]. Thus, the gradual enrichment in the same area of δ18O from the KhZ inland (until W25) could be explained by mixing between the groundwater (average δ18O = −0.3) and water of the KhZ (δ18O = 3.4) intruding inland (Figure 5). This supports the trend of stable isotopes in Figure 4, which is explained by the mixing of these two sources/endmembers (KhZ and recharging rainfall/groundwater). Sample W37 shows a d-excess of +5.05‰, and this well is located in the city Umm Qasr, about 30 km west of the Persian Gulf. Moreover, the areas under the influence of Persian Gulf moisture mass have a d-excess of +7.9‰ [33]; thus, this area is most likely under the influence of moisture masses originating from the Persian Gulf.
In the western part of the AOI, δ18O and δ2H values are heavier along the Zubair Anticline in comparison to the eastern part. It is worth mentioning that in the area between W25 and W27, sand mining occurs, which has reduced the thickness of the unsaturated zone in this area and enhanced direct evaporation from groundwater and may have induced δ18O enrichment. Another explanation could be that this enriched δ18O over the Anticline is part of a δ18O decreasing trend from the west to the east. However, there is no data available on the western side of the Zubair Anticline to test this possibility; thus, it is difficult to decide whether this high δ18O value over the Anticline is due to direct evaporation from the groundwater table, or the result of a decreasing trend from the west to the east.
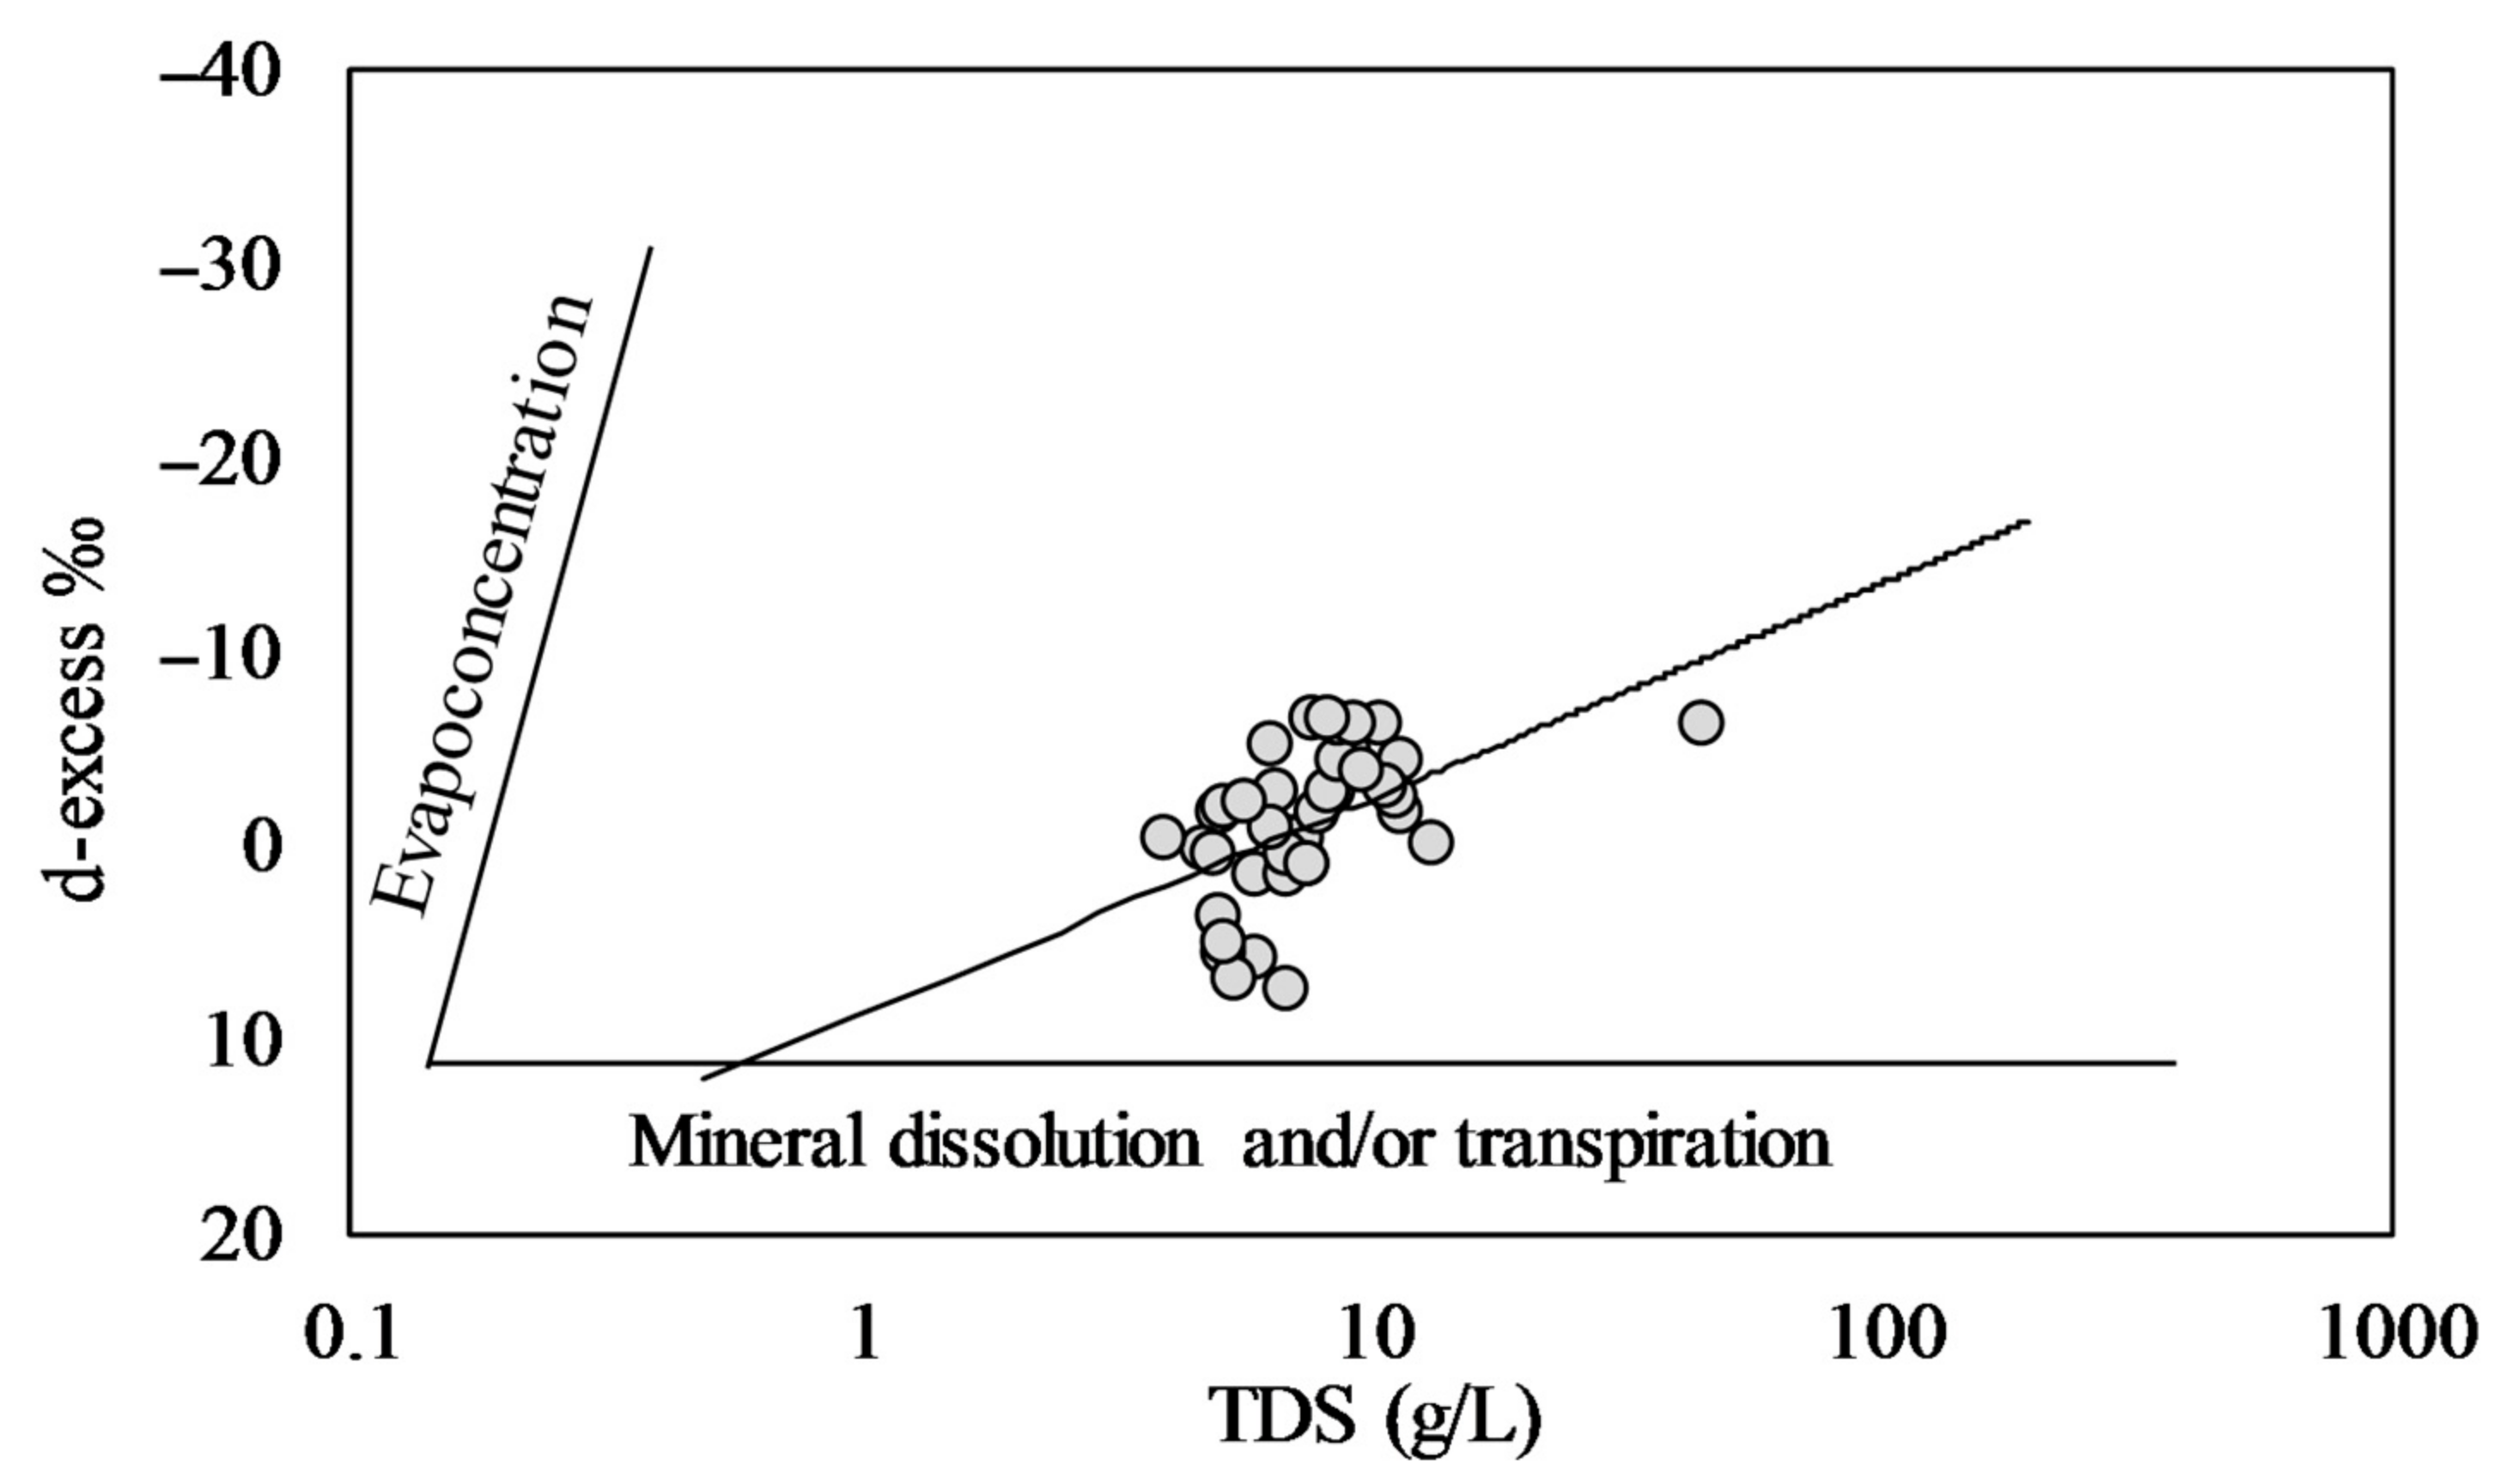
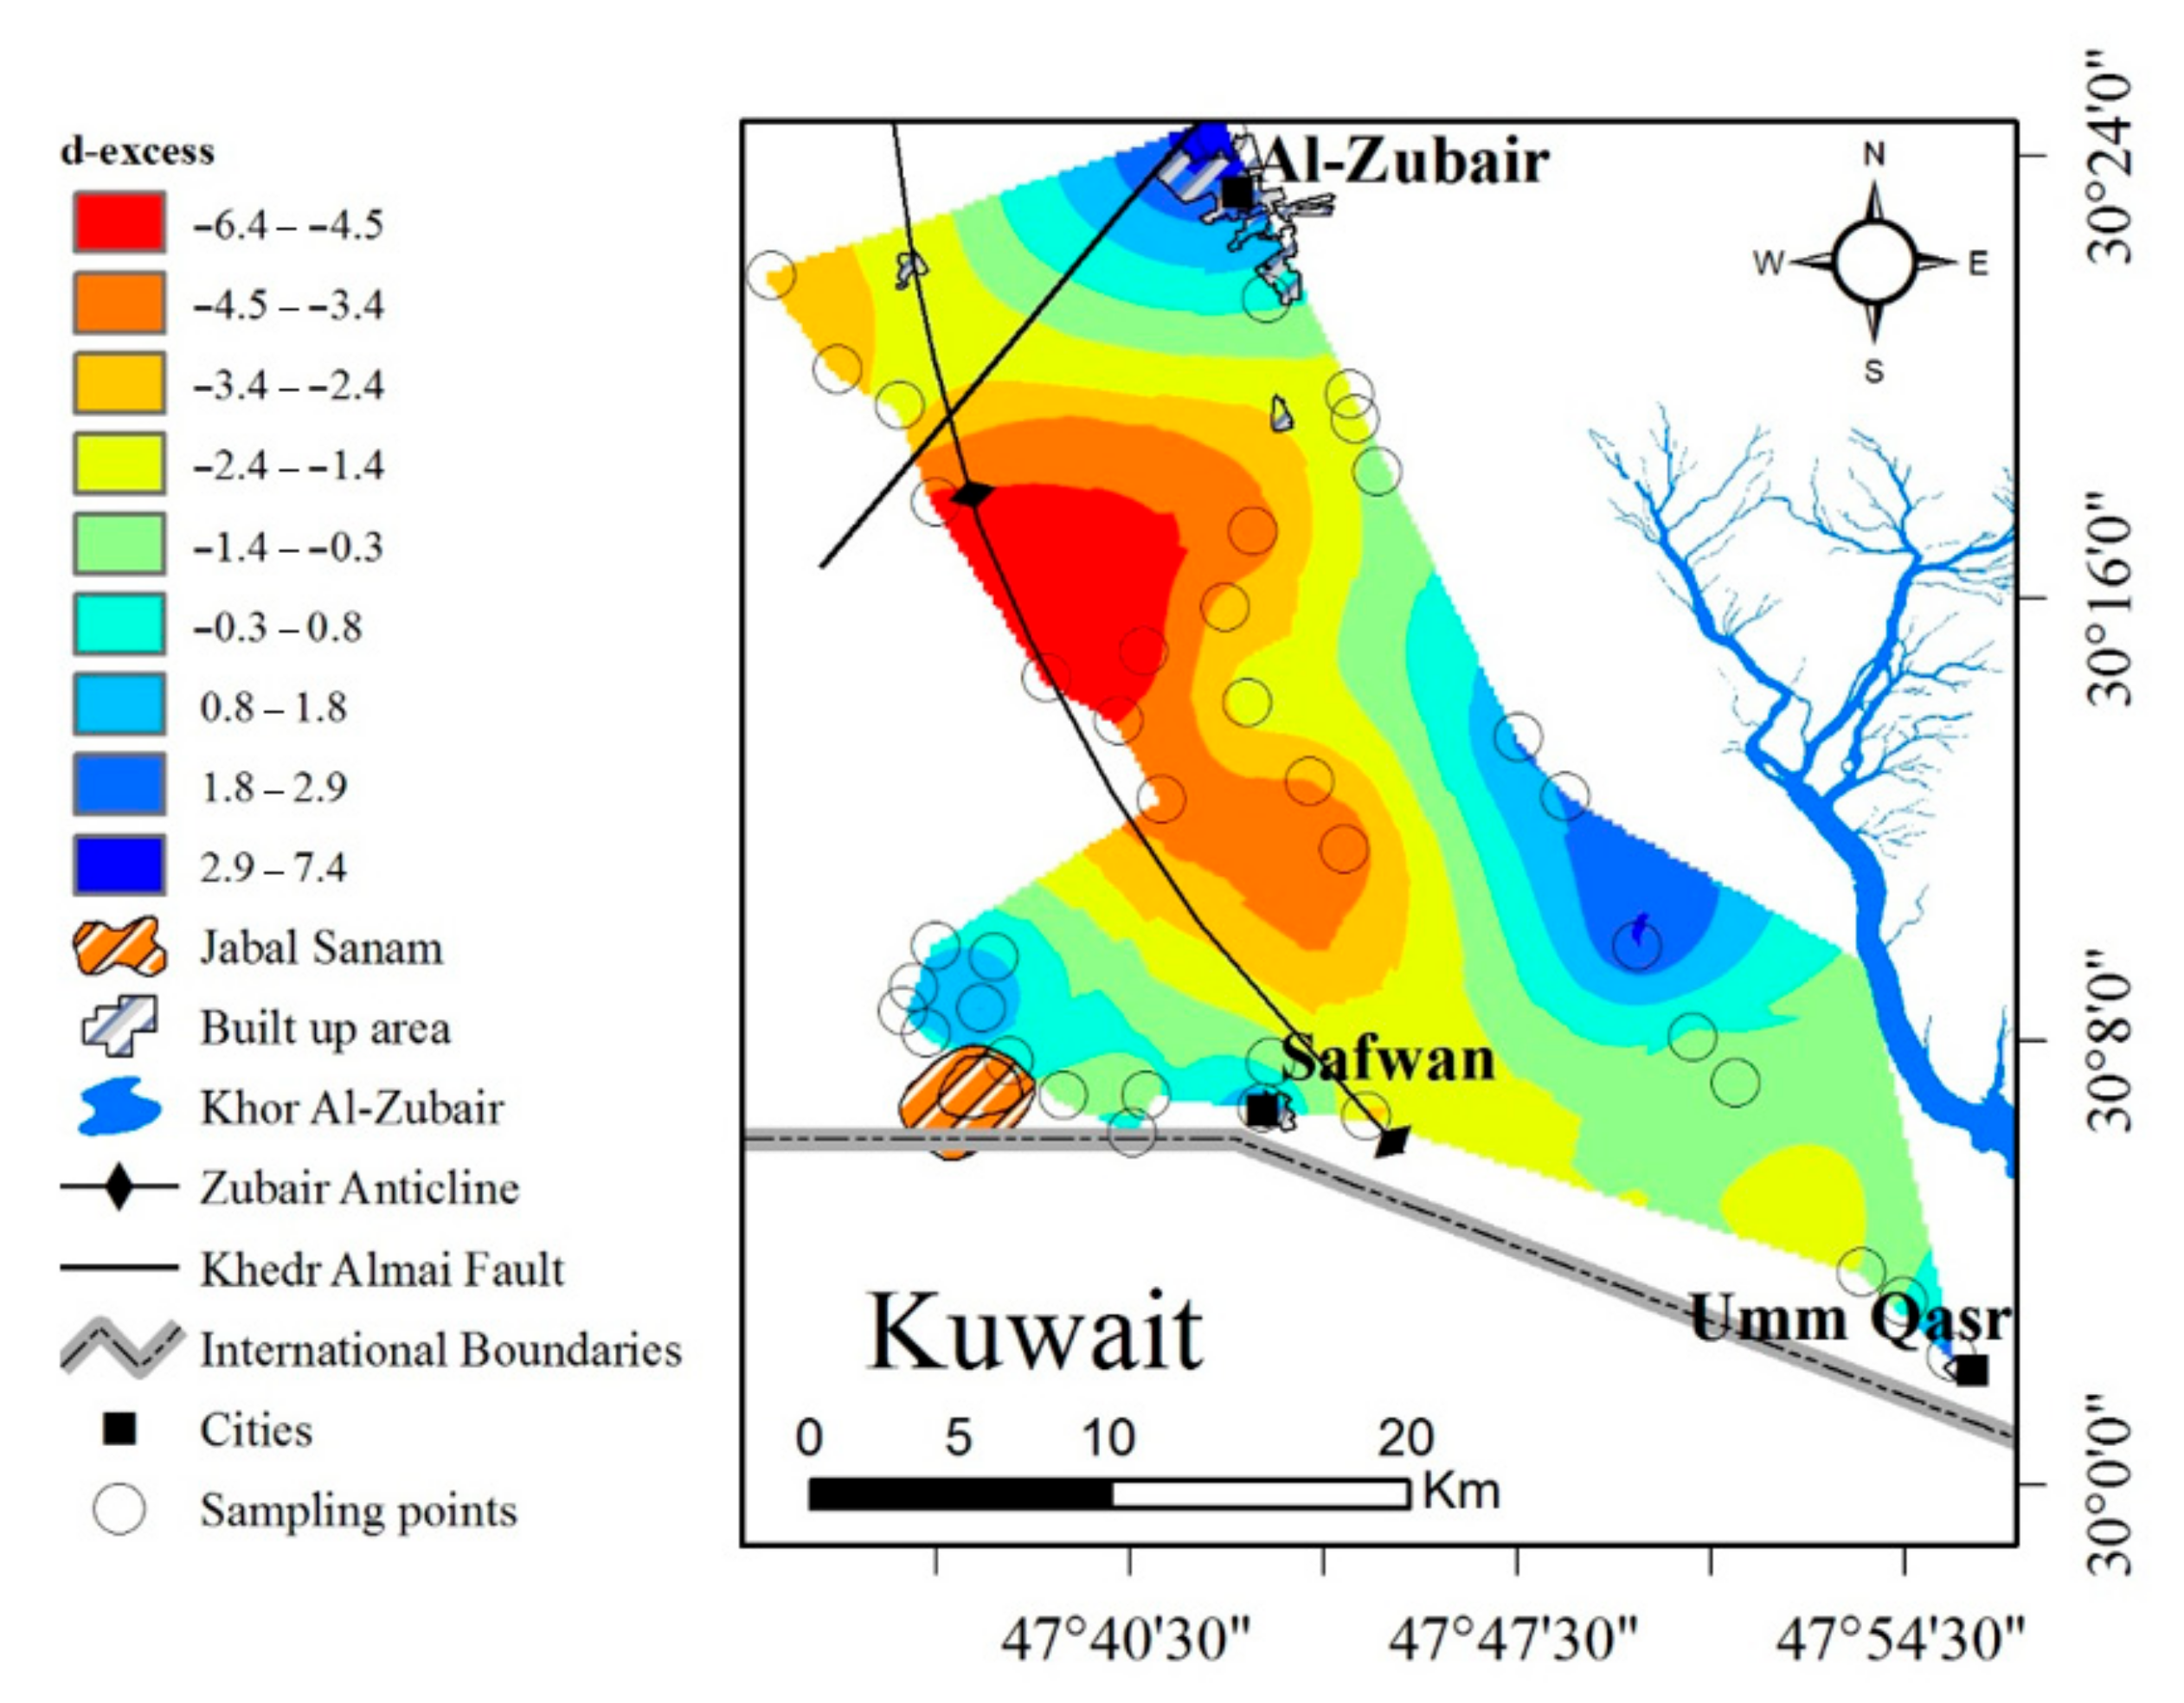
Deuterium excess [d-excess = δ2H − 8 δ18O; the intercept of the GMWL] is an essential indicator of evaporation processes. The d-excess value of 10‰ was estimated by Craig [30] for global meteoric waters. In arid and/or semi-arid regions, evaporation, mineral dissolution, and/or transpiration represent important factors controlling salinity in groundwater. The d-excess of groundwater is a function of isotope fractionation during evaporation [34]. According to Zimmermann et al. [35], isotopic fractionation during salt drainage, mineral dissolution, and/or plant transpiration do not change with increasing salinity. Thus, d-excess can be used to evaluate the effect of evaporation [36]. The d-excess value of groundwater in the AOI ranges from +7.38 to −6.43‰. Figure 6 shows that all groundwater samples in the AOI plot closer to the mineral dissolution and/or transpiration and far from evapo-concentration. This supports the hypothesis that the salts deposited in the unsaturated zone dissolve and reach the groundwater by rainfall and/or by irrigation return-flow. Thus, increasing the salinity happens without increasing the d-excess. The distribution of d-excess (Figure 7) reflects the influence of the KhZ and Persian Gulf moisture masses. The map of d-excess distribution matches with the δ18O values (Figure 5) and likely reflects the same impact from the KhZ and the other factors.
3.3. Carbon Isotopes (13C and 14C) and Groundwater Age
Carbon isotopes (13C and 14C) were measured in five groundwater samples. These samples exhibit 14C activity in the range 102.1–66.03 pMC, and δ13C from −8.4 to −10.6‰. Estimating groundwater age using 14C activity requires two important points to be defined: the initial 14C activity at the time of recharge and the role of CO2 in the soil/vadose zone plus chemical reactions in the aquifer (mainly dilution of 14C through carbonate dissolution).
Regarding initial 14C activity, two values were applied here, 100 and 85 pMC. This is justified because the sediments and soils in the area do not contain any carbonates. For the effect of CO2 in the soil and carbonate dissolution, this could be detected and accounted for using 13C in the Dissolved organic carbon (DIC). Measured δ13C in groundwater samples was in the range of −8.4 to −10.6‰ (average ~ −9‰), which is almost the δ13C of the atmosphere (−8‰). As mentioned earlier, the infiltration rate into the upper aquifer is high due to the coarse and loose sediments as well as the very permeable and unconsolidated pebbly sand. Thus, recharging water will not suffer considerable changes, if any, during this passage to groundwater.
Moreover, carbonate minerals are in general enriched in 13C (e.g., carbonate has δ13C close to 0‰) and dead concerning 14C. Thus, if carbonate had an effect, this would have been reflected in the δ13C (less negative), which is not the case in the AOI. This is also supported by the absence of any correspondence of less negative δ13C values with high HCO3− concentrations, and there is no enrichment in 13C in the direction of groundwater flow. Besides, Ca2+ does not show an increasing trend with flow direction, which is expected in the case of carbonate dissolution in the aquifer. Therefore, correcting the groundwater age for carbonate dissolution was not taken into consideration.
Thus, two groundwater ages were calculated, wherein the first case (age C1), initial 14C activity was assumed as 100 pMC with no dilution other than decay, while in the second case (age C2), the initial 14C activity of 85 pMC was applied [37], with no dilution other than decay.
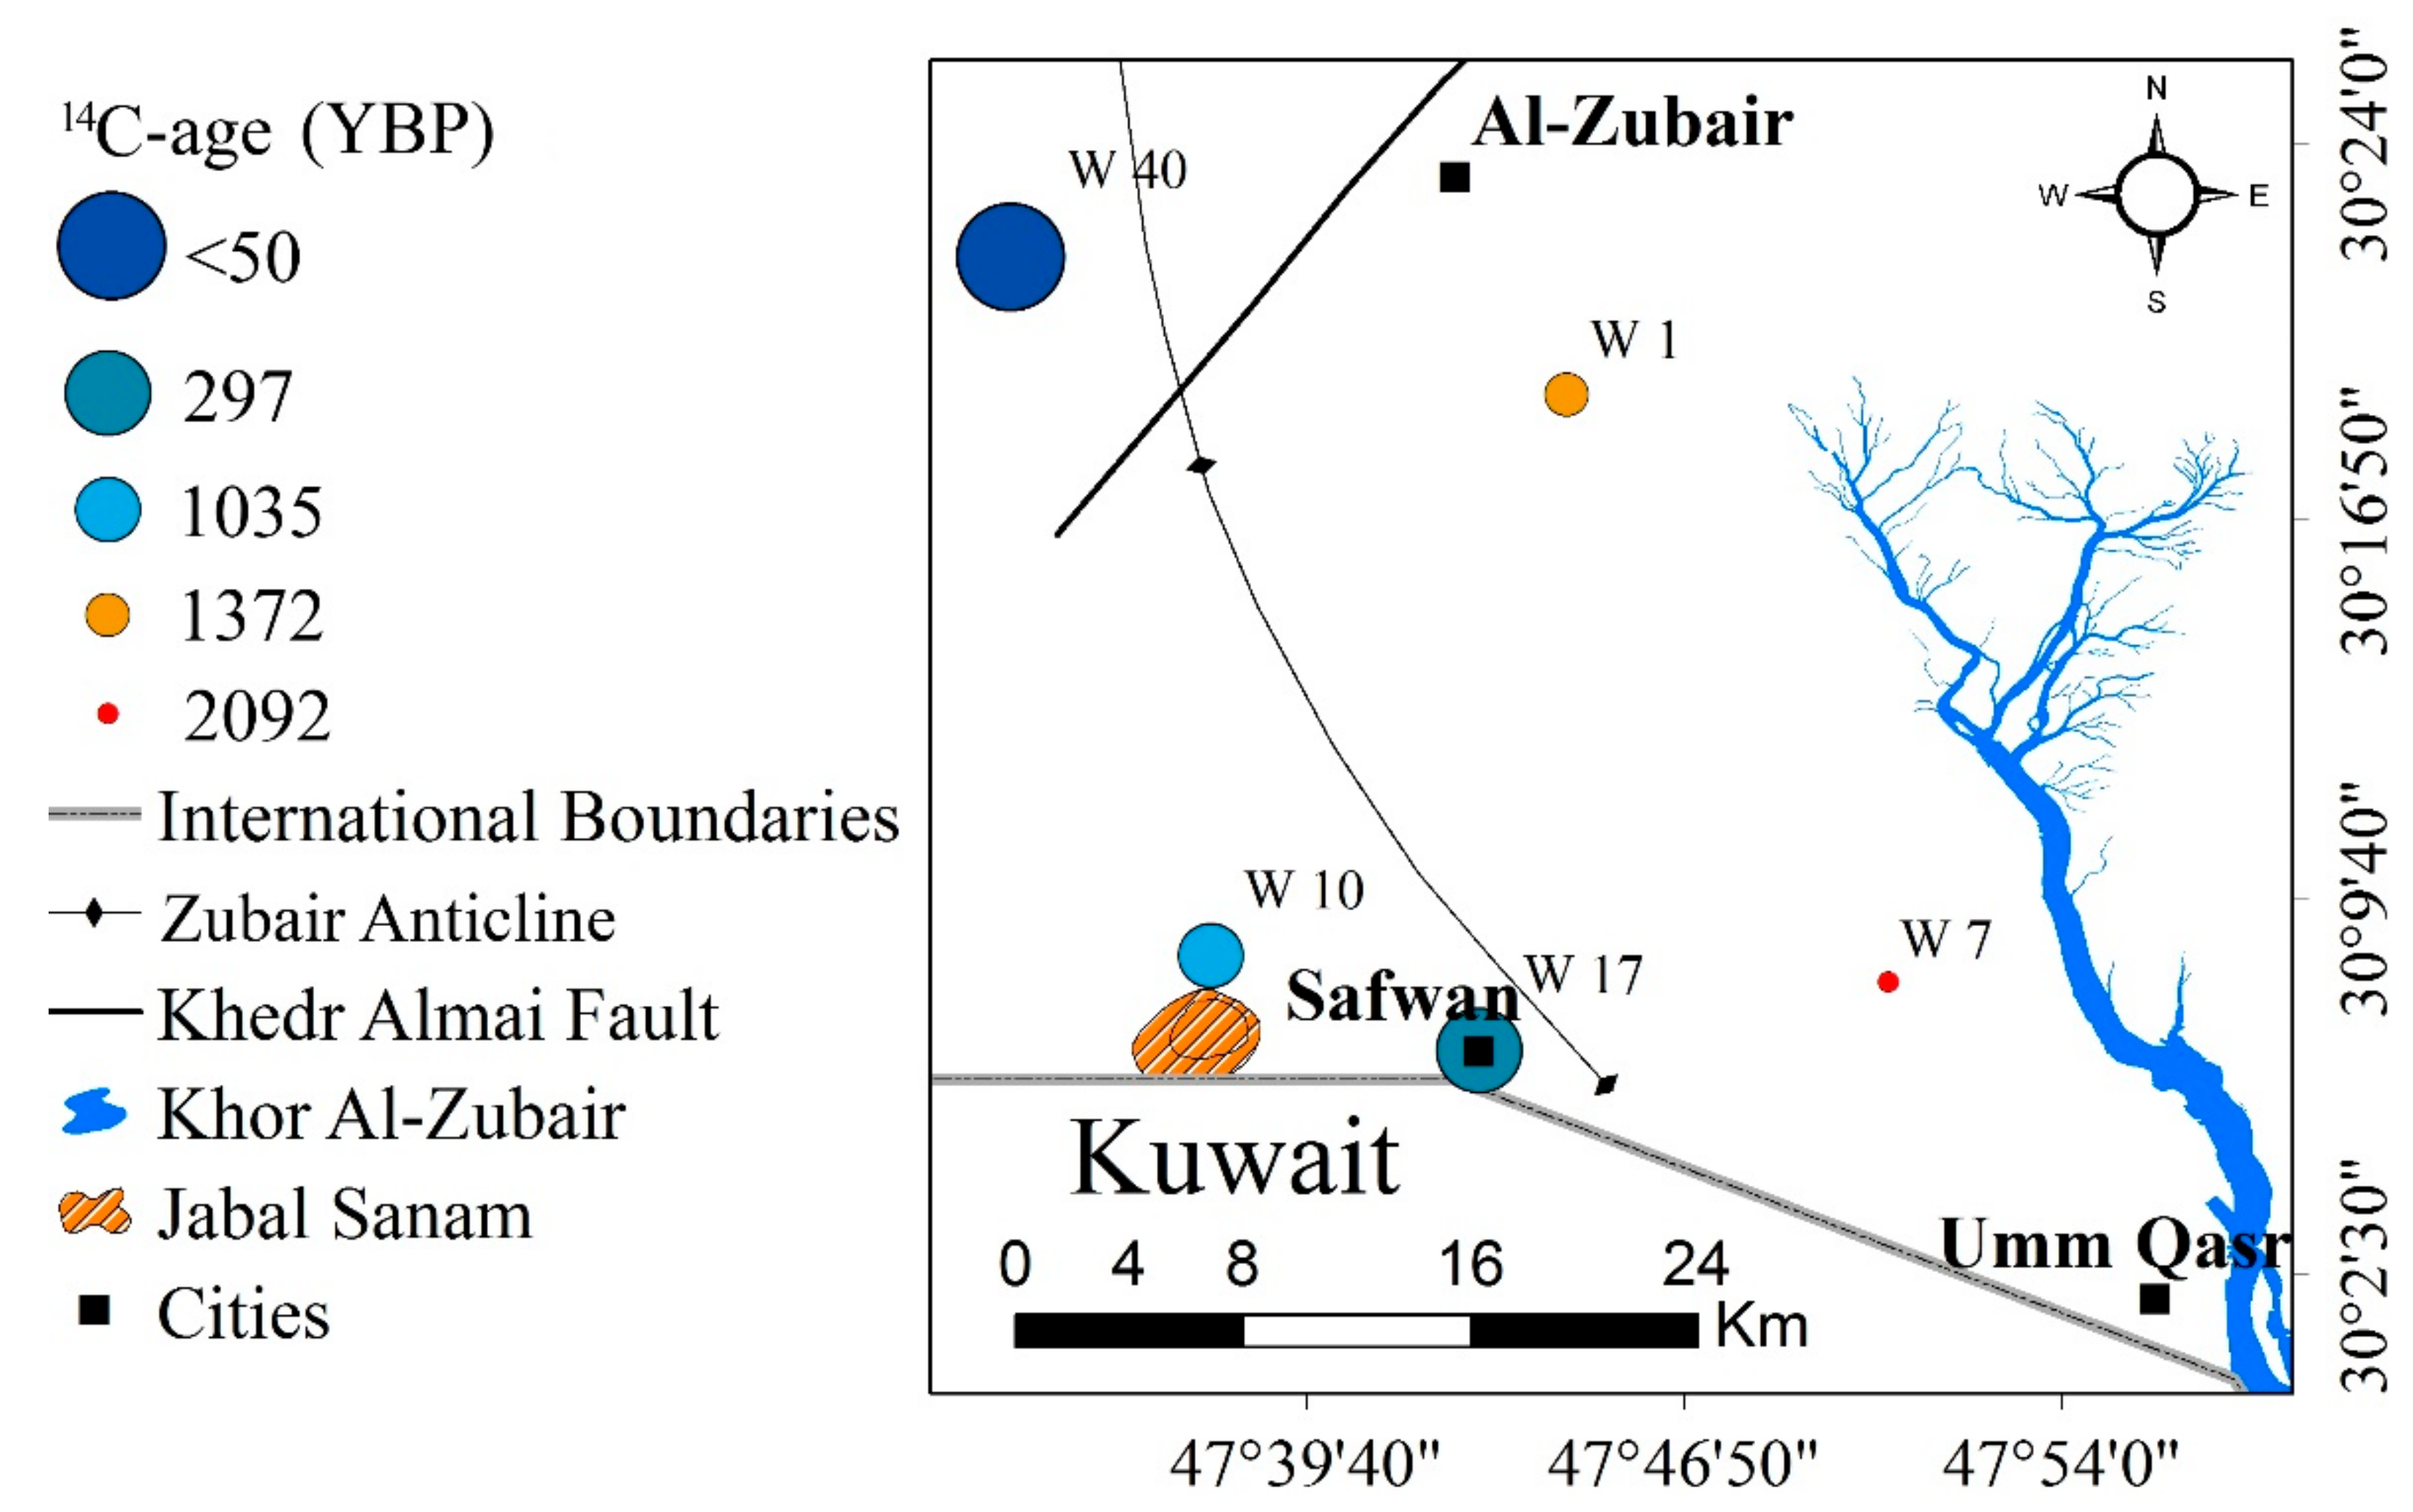
The results of groundwater 14C-age are presented in Table 2. The calculated groundwater age (C2) showed that groundwater is younger than 2 ka BP (before present). The mean age is 1.2 Ka, with an increasing trend eastward with the general flow direction towards the KhZ (Figure 8).
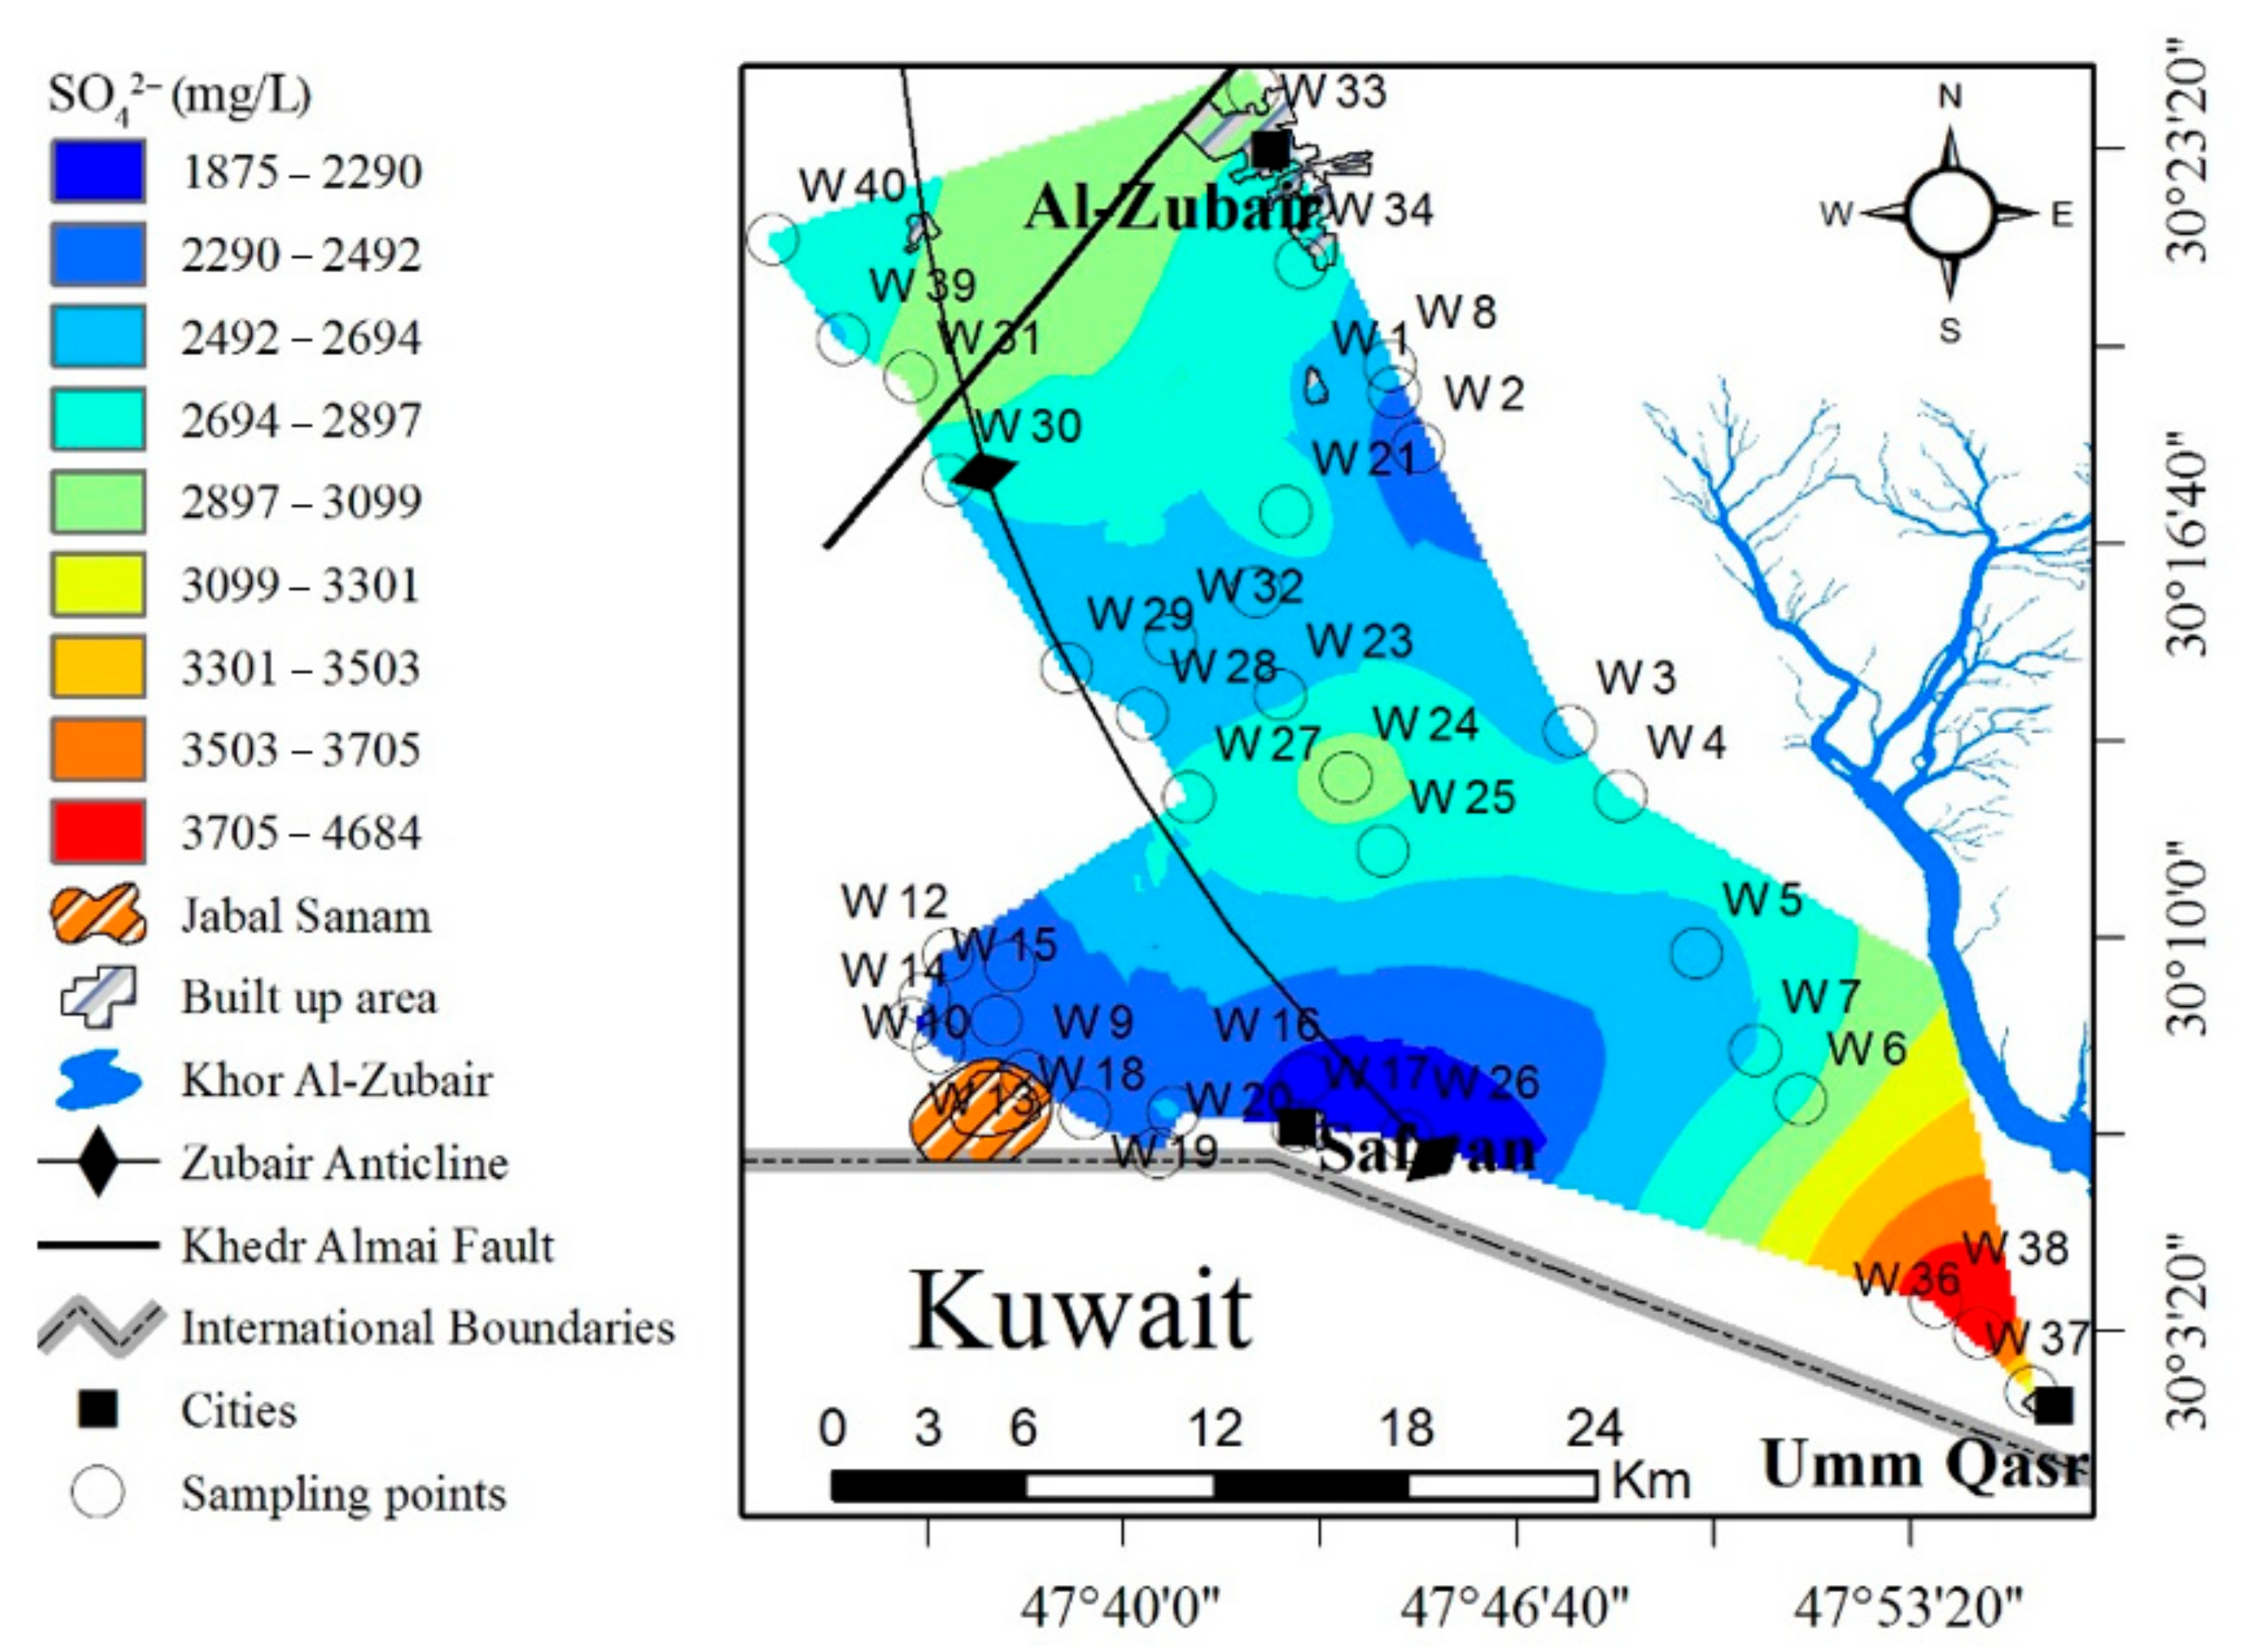
The mean SO42− concentration in groundwater in the AOI is 2699 mg/L, and the groundwater is in equilibrium with gypsum. Figure 9 shows that SO42− decreases from the KhZ westwards. An anthropogenic effect as a source of SO42− (water leaking from pit latrines/sewers) is unlikely because SO42− and NO3− are not significantly correlated. Thus, the source of SO42− is likely leaching from sea-spray, interbedded Sabkha, and deeper artesian aquifers (Lower Dibdibba and Lower Fars). On the contrary, no evidence has been given that SO42− leached from Jabal Sanam.
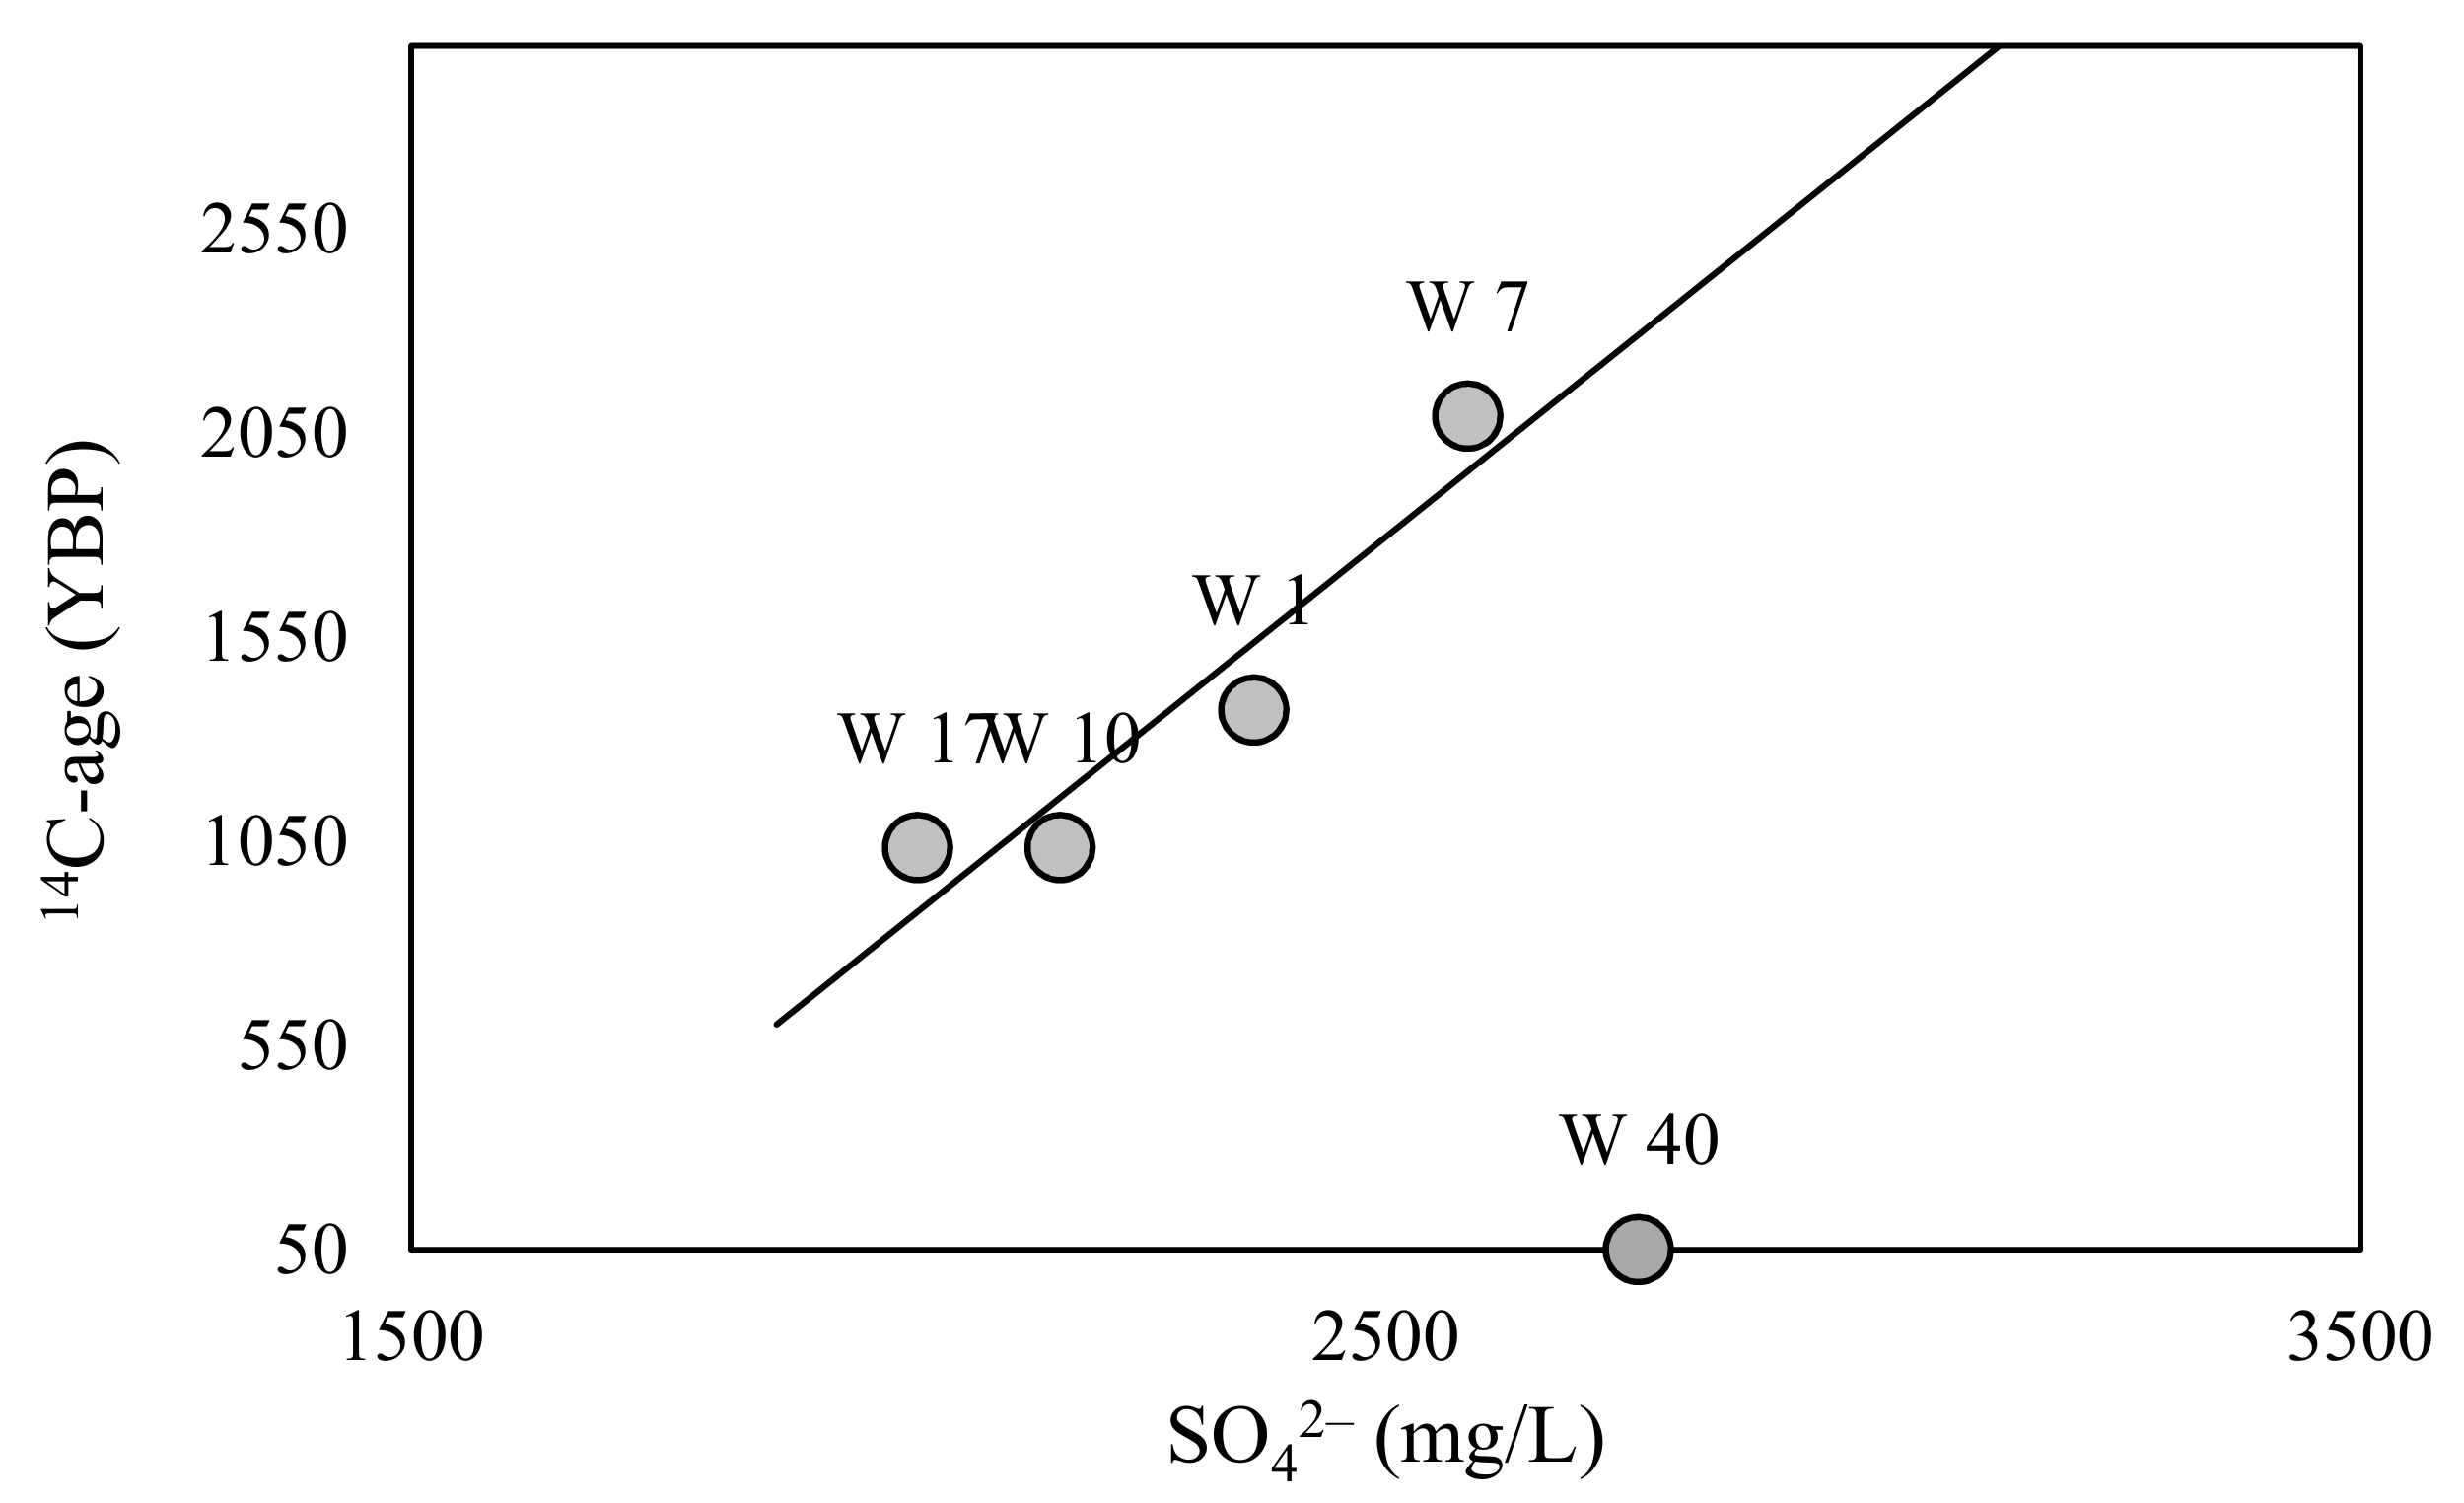
The correlation between the 14C -age of groundwater and SO42− shown in Figure 10 indicates that the samples W1, W7, W10, and W17 are significantly correlated, while sample W40 shows high SO42− concentration (2759 mg/L) and is the most modern groundwater. It is worth mentioning that W40 is near a fish farming (aquaculture) area, which adds modern carbon directly to groundwater. Although the number of groundwater samples here is limited (five samples), this separation can give an indicator about the existence of different processes controlling the hydrochemistry on both sides of the Khedr Almai fault in the AOI, and an important role of geological structures (Zubair Anticline and Khedr Almai Fault) in this regard.
3.4. Chloride and Bromide in Groundwater
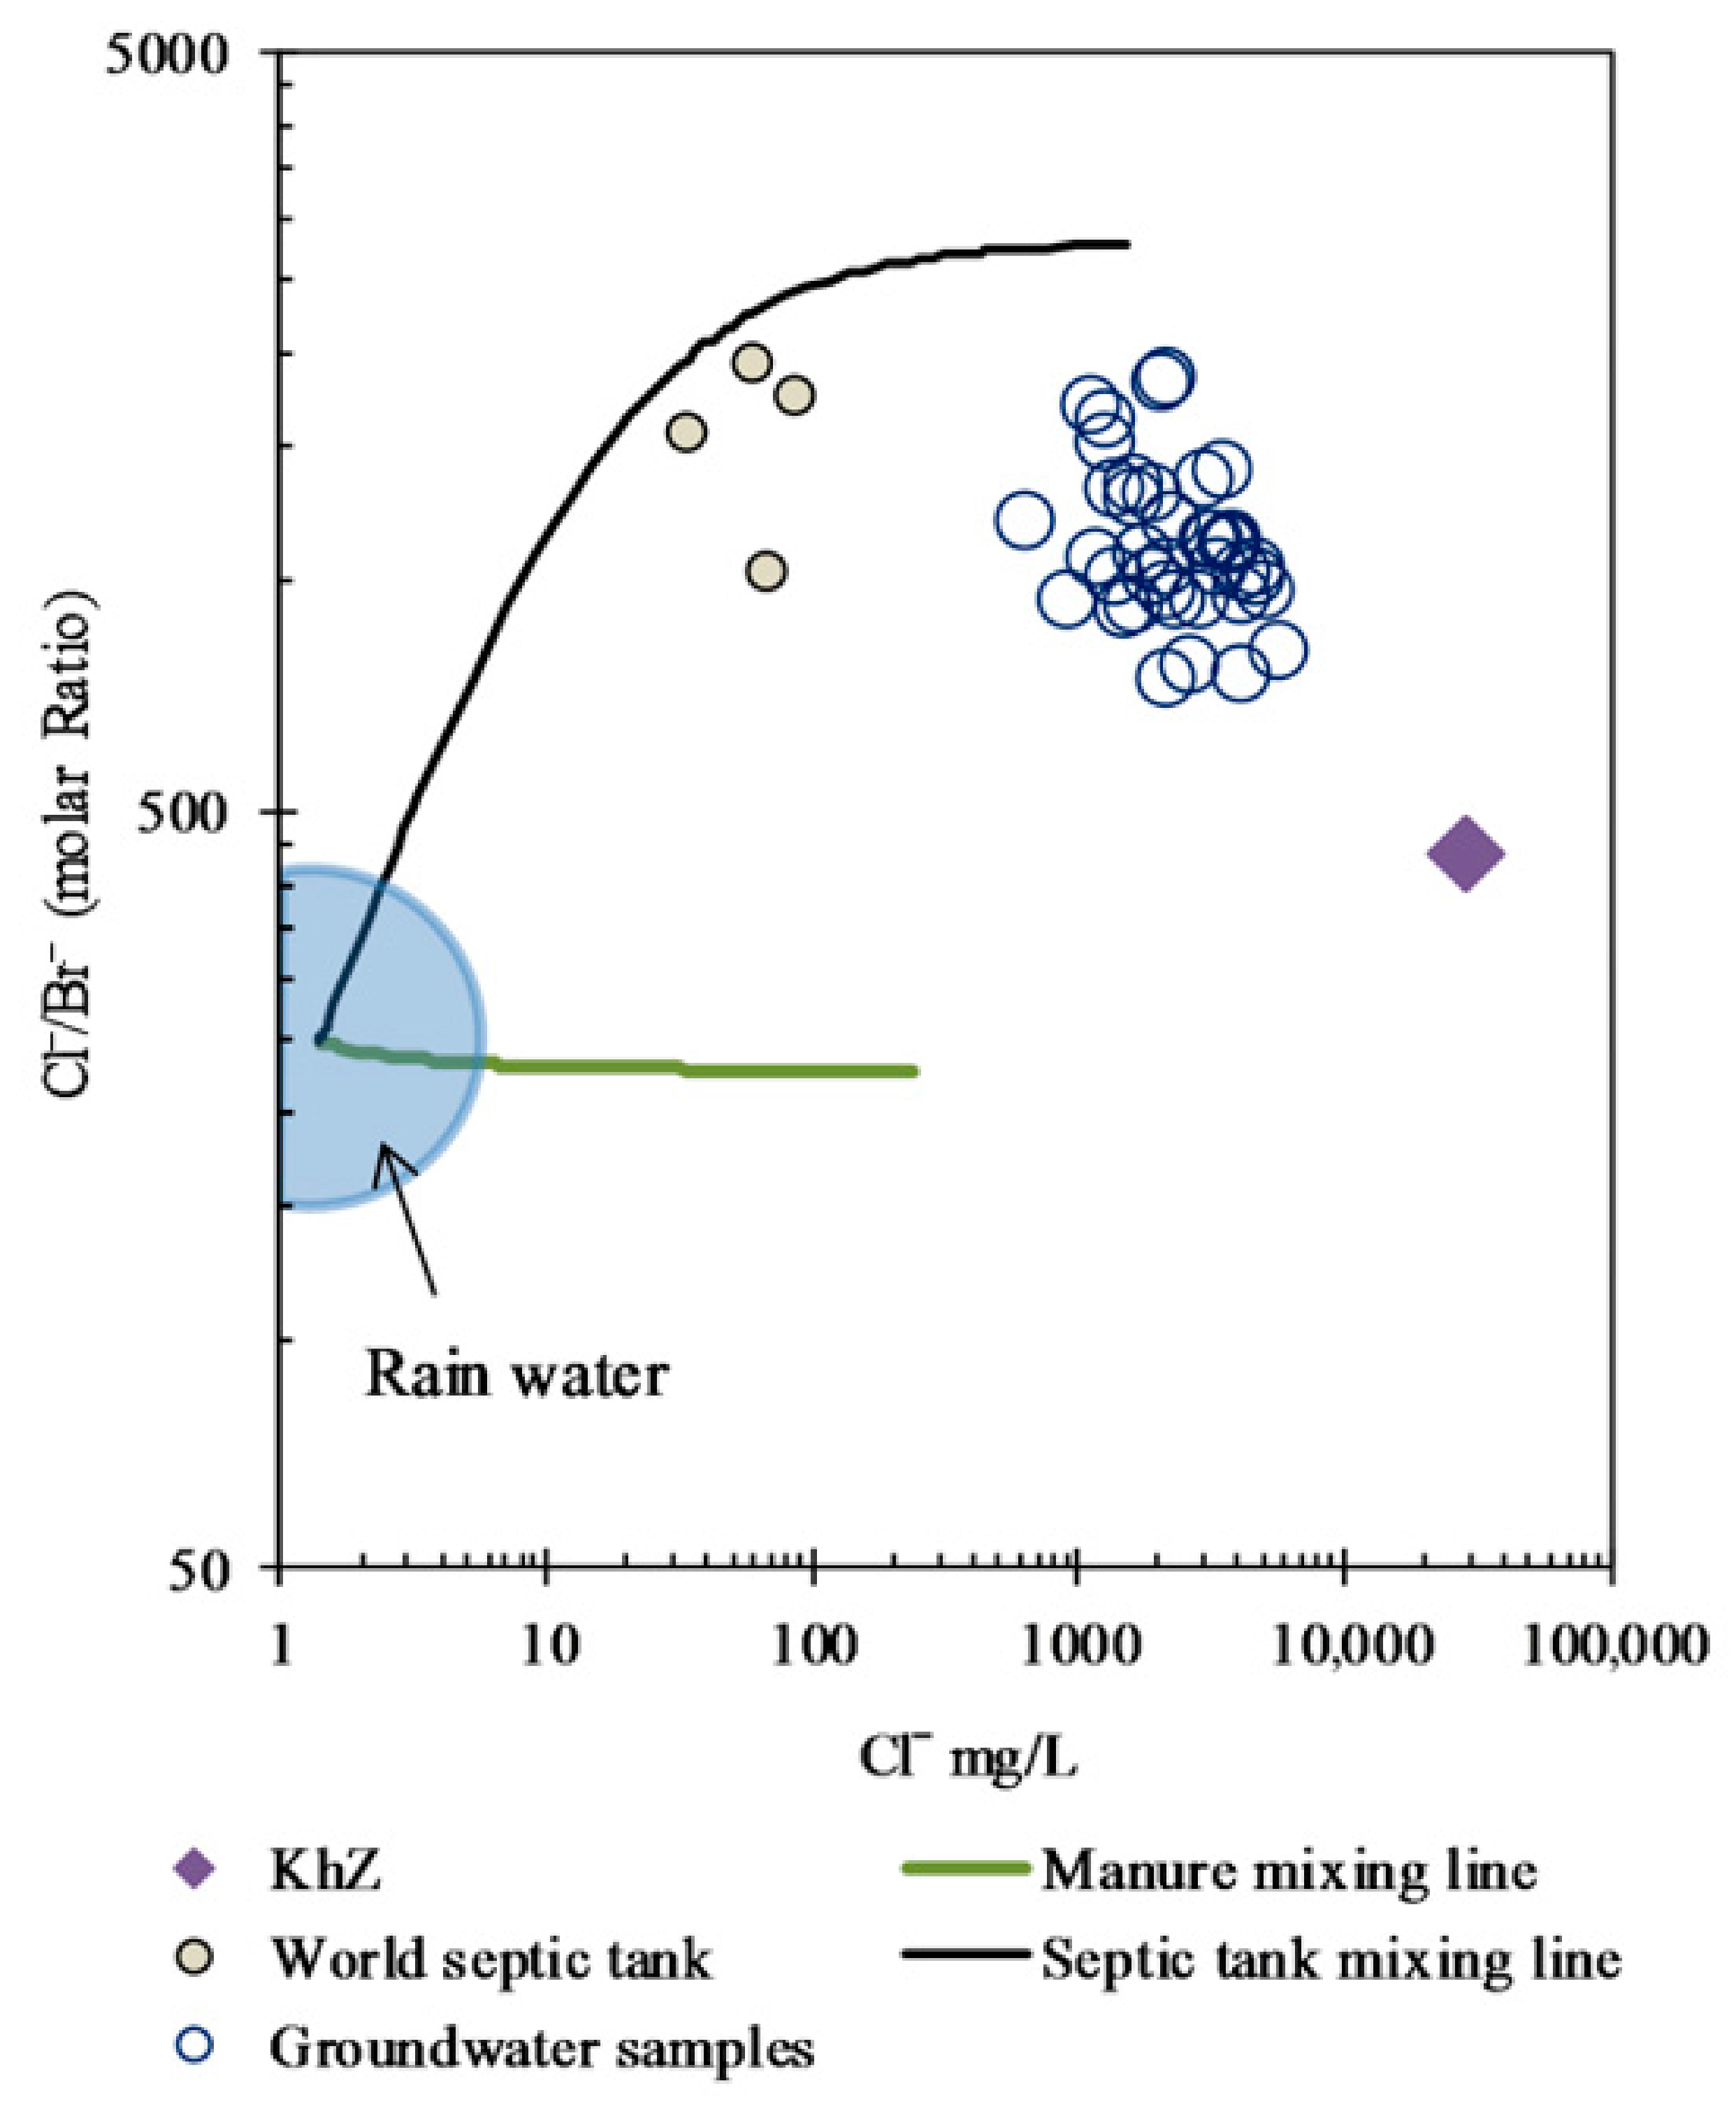
The chloride Cl− and Cl−/Br− molar ratios are plotted in Figure 11 to identify a possible source of salinity to groundwater, depending on the idea that salinity is a direct result of mixing between different endmembers [38]. To identify which possible endmembers might contribute to this process, available sources must be defined. In general, salinity in groundwater has many potential sources, e.g., sea spray, seawater, recharge, effluents from septic tanks and pit latrines, fertilizers, and pesticides, as well as connate water, industrial effluents, lithology, leaching from other adjacent aquifers, and road salting.
The contribution of connate water to salinity is not available, as the aquifer has already been flushed since deposition, and if available, then it would have a minor effect. Despite the presence of several plants, e.g., petrochemical plants and iron and steel plants, the effect of these sources would be patchy. However, this is not the case as can be seen from Figure 2. Moreover, these factories have been out of work for a long time in the last decade due to the political and economic conditions in the country.
Lithology and water/rock interaction is an important contributor to salinity, and other studies in the AOI point to Jabal Sanam (salt dome, mainly composed of gypsum) as the effective source of salinity [32,39]. However, KhZ is the point with maximum concentration concerning Cl− and SO42− (except well W36). Thus, the effect of the lithology of Jabal Sanam seems to be minimal.
Leaching from other adjacent aquifers as a source of salinity increase might take place in the AOI. Hydraulic connection between the Lower Dibdibba, which contains saline groundwater, and the upper unconfined aquifer cannot be excluded as the Jojab aquitard might be leaking at some locations. There might be also a hydraulic connection between the Lower Dibdibba and Fatha (Lower Fars) formations (Supplementary Table S1). However, upward leakage from the Lower Dibdibba and Fatha is only possible along with a tectonic structure and if the deeper aquifer is artesian with a higher hydraulic head in comparison to the shallow Dibdibba aquifer. Some pesticides may release Br-rich volatile compounds, yet this kind of pesticide was not applied in the AOI [40,41].
Farmers in the AOI resort to old methods of agriculture, as they use the system of rotation in agriculture where they divide the farm into several sections, planting one part and leaving the rest to regain the activity and effectiveness. Farmers also use animal dung (especially sheep dung) as a fertilizer. Leachate from animal dung has a Cl−/Br− molar ratio between 79 and 376 [42].
Effluents of septic tanks and pit latrines contribute to salinity in urban and rural areas. The contribution of wastewater from domestic food preparation and cattle feeding increases Cl−/Br− ratio up to 1000 [43]. In general, the AOI lacks a central sewage system and sewage water treatment. Therefore, local people use septic tanks and pit latrines in their homes, and much of the waste reaches the aquifers in the region and contributes to pollution and salinity. Even though organic matter concentrates Br− over Cl−, leachate from human sewage has high Cl−/Br− because of the addition of common salt (table salt). Yet, where this addition is absent, organic leachates typically have Cl−/Br− < 450 [43].
Coastal aquifers are likely vulnerable to water quality degradation, especially salinity increases, because of possible seawater intrusion driven by the reversal of the hydraulic gradient in the aquifer. The AOI witnessed a severe drought in the last two decades, which affected groundwater levels. Therefore, seawater from the nearby KhZ channel most likely intruded inland.
Some possible salinity endmembers in the AOI (septic tank effluents, rainfall, and fertilizer [38,44]) and KhZ seawater, are plotted on Figure 11, with the mixing lines between rainfall and different endmembers. Presenting endmember and mixing lines for irrigation return-flow was not possible since this process is complex, and it consists of many consequent cycles of evapo-concentration of irrigation return-flow along the path of groundwater flow [45]. For dry and wet deposition (aerosol), values of Cl− = 0.2 mg/l and Cl−/Br− (molar) = 100 have been reported in the world [46], while higher Cl−/Br− (up to 710) have been reported in coastal areas in Spain and Portugal with no Cl− data [44]. The effect of dry and wet deposition resamples a longtime process and has a dynamic accumulative effect that could not be evaluated graphically here.
Groundwater samples fall between the mixing line of septic tank effluent and the KhZ, indicating that the source of salinity in AOI is most likely from these sources, without ignoring the other aforementioned sources that were not evaluated graphically. Thus, the salinity issue in the AOI is a very complex one, with many factors deteriorating the situation. For investigating the problem further, it is recommended to study the area close to the KhZ within a range of 8 km separately, as seawater intrusion seems to happen in this area and plays a major role. In the area far from the KhZ, other processes, e.g., aerosols, irrigation return-flows, upward leakage, and septic tanks besides the effect of tectonic features, are playing the dominant role.
4. Conclusions
Hydrochemical evolution was investigated in the Al-Zubair-Safwan area in southern Iraq to identify the sources of high salinity in groundwater. Stable isotopes of water (18O and 2H) showed that the main source of groundwater in the shallow aquifer is rainfall from the Persian Gulf and the Arabian Sea. Evaporation from rainfall before and after infiltration is assumed to be low, at least closer to Khor Al-Zubair. However, evaporation from furrow irrigation water pumped from local wells is assumed to be significant and thus affects both the stable isotope pattern and the salinity of groundwater. Therefore, recent irrigation plans require further reduction in irrigation amount and salt build-up in the soil by using water-saving technologies.
Sea spray could also be a dominant source of Na+ and Cl−. Upward leakage from underlying aquifers (Lower Dibdibba and Fatha) is possible, yet it is spatially limited and indicated in depleted δ18O in some groundwater samples. The mean residence time of the groundwater is between 1000 and 2000 years based on carbon-14 analysis.
Geological structures, i.e., the Zubair Anticline and the Khedr Almai Fault in the western side of the area of interest may play a role in the hydrochemical evolution in the western part by offering interconnection between the overlying layers. On the contrary, the Jabal Sanam (salt dome) close to the southern borders with Kuwait has a minimal contribution to the salinity evolution in the groundwater. Thus, future work should focus on the role of geological structures by conducting intensive groundwater sampling in areas close to these features in the western part of the area of interest. Besides, sampling the confined/semi-confined Lower Dibdibba aquifer is important to track any interaction between the Upper and Lower Dibdibba aquifers.
Chloride, bromide, and sulfate in groundwater samples show that salinity in the shallow unconfined aquifer in the area of interest is derived from four sources: dry and wet sea spray, irrigation return-flow, the leaching of interbedded Sabkha, and effluents of poorly managed septic tanks and pit latrines distributed in the area of interest. Seawater intrusion from Khor Al-Zubair Channel only occurs in a rather short distance of about 8 km from the channel.
The Cl−/Br− ratio was used for the first time in Iraq in this research, and it is highly recommended to measure the end members in Iraq in some other areas as a promising tool for detecting groundwater contamination. Dense groundwater sampling in the area close to Khor Al-Zubair Channel is recommended to define the extent of seawater intrusion inland, and to monitor how this responds to any applied management strategy.
Supplementary Materials
The following are available online at https://www.mdpi.com/2073-4441/13/4/578/s1, Table S1: Geological sequence showing Formations names, age, and depth from the surface, inferred from well Ru-441 in Rumaila oilfield [20,23], Table S2: Field parameters (Temp. pH, Eh, EC), elevation and the coordinate of groundwater samples and KhZ in the AOI, Table S3: Chemical analysis and Na+/Cl−, Cl−/HCO3− and Cl−/Br− ratios of groundwater samples in the AOI, and mean and standard deviation (SD), Table S4: Stable isotopes δ18O, δ2H, d-excess and EC in the AOI at different sampling points, with the mean and standard deviation (SD).
Author Contributions
Conceptualization, A.A., W.K. and B.M.; Data curation, A.A.; Formal analysis, A.A. and O.W.; Funding acquisition, A.A.; Methodology, A.A. and B.M.; Resources, A.A. and W.K.; Supervision, J.M.T. and B.M.; Writing—original draft, A.A., W.K. and B.M.; Writing—review & editing, A.A., W.K. and B.M. All authors have read and agreed to the published version of the manuscript.
Funding
This work was funded by the General Commission for Groundwater/Iraq.
Acknowledgments
The first author would like to express his thanks to Dhafir Abdullah, Ahmed Nadhum, and Abdul Jabbar Hanoon and to the staff of the investigation department for providing all the requirements needed to accomplish this work. Many thanks for Majid Alkinani, and Hussein A. Jassas for all hints and suggestions. I am also grateful to Robert van Geldern and Christian Hanke, GeoZentrum Nordbayern Friedrich-Alexander-Universität, Erlangen-Nürnberg.
Conflicts of Interest
The authors declare no conflict of interest.
References
- Su, C.; Wang, Y.; Pan, Y. Hydrogeochemical and isotopic evidences of the groundwater regime in Datong Basin, Northern China. Environ. Earth Sci. 2013, 70, 877–885. [Google Scholar] [CrossRef]
- Al-Basrawi, N. Hydrogeology and Hydrochemistry of Al-Basrah Governorate; Internal Report; Iraq-GEOSURV: Baghdad, Iraq, 2009. [Google Scholar]
- Alkinani, M.; Merkel, B. Hydrochemical and isotopic investigation of groundwater of Al-Batin alluvial fan aquifer, Southern Iraq. Environ. Earth Sci. 2017, 76, 4. [Google Scholar] [CrossRef]
- Alkinani, M.; Kanoua, W.; Merkel, B. Uranium in groundwater of the Al-Batin Alluvial Fan aquifer, south Iraq. Environ. Earth Sci. 2016, 75, 869. [Google Scholar] [CrossRef]
- Chenoweth, J.; Hadjinicolaou, P.; Bruggeman, A.; Lelieveld, J.; Levin, Z.; Lange, M.A.; Xoplaki, E.; Hadjikakou, M. Impact of climate change on the water resources of the eastern Mediterranean and Middle East region: Modeled 21st century changes and implications. Water Resour. Res. 2011, 47, 47. [Google Scholar] [CrossRef]
- de Pauw, E.; Saba, M.; Ali, S. Mapping Climate Change in Iraq and Jordan; International Agricultural Research Center in the Dry Areas (ICARDA): Beirut, Lebanon, 2015; Volume 27, ISBN 92-91274739. [Google Scholar]
- Azooz, A.A.; Talal, S.K. Evidence of climate change in Iraq. J. Environ. Prot. Sustainable Dev. 2015, 1, 66–73. [Google Scholar]
- Abdulameer, A.; Thabit, J.M.; Al-Menshed, F.H.; Merkel, B. Investigation of seawater intrusion in the Dibdibba Aquifer using 2D resistivity imaging in the area between Al-Zubair and Umm Qasr, southern Iraq. Environ. Earth Sci. 2018, 77, 619. [Google Scholar] [CrossRef]
- Evans, R.; Soppe, R.; Barrett-Lennard, E.; Saliem, K.A. Salinity in Iraq-Potential Solutions. 2013. Available online: https://www.researchgate.net/publication/320857624_Salinity_in_Iraq-Potential_Solutions (accessed on 1 May 2020).
- Abdulameer, M.H. Hydrogeochemical and Environmental Evaluation of Dibdibba Aquifer in Basrah Province, Southern Iraq. Master’s Thesis, University of Basrah, Basrah, Iraq, February 2019. [Google Scholar]
- Jassim, S.Z.; Karim, S.A.; Basi, M.A.; Al-Mubarak, M.; Munir, J. Stratigraphy—Final Report on the Regional Geological Survey of Iraq; Iraq-GEOSURV: Baghdad, Iraq, 1984; Volume 3. [Google Scholar]
- Jassim, S.Z.; Goff, J.C. Geology of Iraq; Dolin: Brno/Prague, Czech Republic, 2006; p. 486. ISBN 8070282878. [Google Scholar]
- Haddad, R.H.; Hawa, A.J. Hydrogeology of the Safwan-Zubair Area, South of Iraq; Bulletin No. 122; Scientific Research Foundations: Baghdad, Iraq, 1979; 232p. [Google Scholar]
- Al-Kubaisi, Q.Y. Quaternary-Tertiary hydrogeologic boundary condition at Safwan-Zubair area. South of Iraq. Iraqi J. Sci. 1999, 40, 21–28. [Google Scholar]
- Al-Kubaisi, Q.Y. Hydrogeology of Dibdiba Aquifer in Safwan–Zubair Area, South Iraq. Ph.D. Thesis, University of Baghdad, Baghdad, Iraq, 1996. [Google Scholar]
- Al-Kadhimi, J.A.; Sissakian, V.K.; Fattah, A.S.; Deikran, D.B. Tectonic Map of Iraq, Scale 1:1,000,000, 2nd ed.; Iraq-GEOSURV: Baghdad, Iraq, 1996; pp. 1–38. [Google Scholar]
- Buday, T.; Jassim, S. The Regional Geology of Iraq: Tectonism Magmatism, and Metamorphism; Iraq-GEOSURV: Baghdad, Iraq, 1987; p. 445. [Google Scholar]
- Al-Sharbati, F.; Ma’ala, K. Report on the Regional Geological Mapping of West of Zubair Area; Iraq-GEOSURV: Baghdad, Iraq, 1983. [Google Scholar]
- Yacoub, S.; Roufa, S.; Rasool, M.; Al-Ali, N. The Geology of Al-Basrah, Abadan and Bubyian Quadrangle Sheets NH-38-8; Geological Map of Iraq GM 38, 39 and 40; Iraq-GEOSURV: Baghdad, Iraq, 1992. [Google Scholar]
- Owen, R.M.; Nasr, S.N. Stratigraphy of the Kuwait-Basra Area, Middle East. 1958. Available online: www.archives.datapages.com (accessed on 21 June 2020).
- Van Bellen, R.C.; Dunnington, H.V.; Wetzel, R.; Morton, D. Lexique Stratigraphic International; Centre National de la Recherche Scientifique: Paris, France, 1959; 333p. [Google Scholar]
- AL-Najar, N.A.; AL-Shmmary, T.A.; AL-Khafaji, S.J. Mineralogy and geochemistry of Dibdibba Sandstone Formation bearing feldspar in Zubair and Safwan areas, Southern Iraq. Iraqi J. Sci. 2011, 52, 54–63. [Google Scholar]
- Jaffar, H.M.; Abdulnaby, W. Stress Regime of Rumania Oilfield in Southern Iraq from Borehole Breakouts. IOSR J. Appl. Geol. Geophys. 2018, 6, 25–35. [Google Scholar]
- Manhi, H. Groundwater Contamination Study of the Upper Part of the Dibdibba Aquifer in Safwan Area, Southern Iraq. Ph.D. Thesis, University of Baghdad, Baghdad, Iraq, 2012. [Google Scholar]
- Al-Jiburi, H.; Al-Basrawi, N. Hydrogeology of Al-Jazira Area; Iraqi Bulletin of Geology and Mining; Iraq-GEOSURV: Baghdad, Iraq, 2009; Volume 3, pp. 71–84. [Google Scholar]
- Parkhurst, D.L.; Appelo, C. User’s Guide to PHREEQC (Version 2): A Computer Program for Speciation, Batch-Reaction, One-Dimensional Transport, and Inverse Geochemical Calculations; U.S. Geological Survey: Denver, CO, USA, 1999; Volume 99, p. 312. [CrossRef] [Green Version]
- Hounslow, A. Water Quality Data: Analysis and Interpretation; Lewis Publishers: Boca Raton, FL, USA, 1995; ISBN 9780873716765. [Google Scholar]
- Vengosh, A.; Rosenthal, E. Saline groundwater in Israel: Its bearing on the water crisis in the country. J. Hydrol. 1994, 156, 389–430. [Google Scholar] [CrossRef]
- Ali, K.K.; Al-Kubaisi, Q.Y.; Al-Paruany, K.B. Isotopic study of water resources in a semi-arid region, western Iraq. Environ. Earth Sci. 2015, 74, 1671–1686. [Google Scholar] [CrossRef]
- Craig, H. Isotopic Variations in Meteoric Waters. Science 1961, 133, 1702–1703. [Google Scholar] [CrossRef] [PubMed]
- Al-Jiburi, H.K.; Al-Basrawi, N.H. Hydrogeology of Southern Desert; Iraqi Bulletin of Geology and Mining; Iraq-GEOSURV: Baghdad, Iraq, 2009; Volume 2, pp. 77–91. [Google Scholar]
- Al-Sudani, H.I.Z. Groundwater system of Dibdibba sandstone aquifer in south of Iraq. Appl. Water Sci. 2019, 9, 72. [Google Scholar] [CrossRef] [Green Version]
- Hadi, K.; Kumar, U.S.; Al-Senafy, M.; Bhandary, H. Environmental isotope systematics of the groundwater system of southern Kuwait. Environ. Earth Sci. 2016, 75, 1096. [Google Scholar] [CrossRef]
- Vengosh, A.; Hening, S.; Ganor, J.; Mayer, B.; Weyhenmeyer, C.E.; Bullen, T.D.; Paytan, A. New isotopic evidence for the origin of groundwater from the Nubian Sandstone Aquifer in the Negev, Israel. Appl. Geochem. 2007, 22, 1052–1073. [Google Scholar] [CrossRef]
- Zimmermann, U.; Münnich, K.O.; Roether, W. Downward Movement of Soil Moisture Traced by Means of Hydrogen Isotopes. Geophys. Monogr. Ser. 2013, 11, 28–36. [Google Scholar] [CrossRef]
- Huang, T.; Pang, Z. The role of deuterium excess in determining the water salinisation mechanism: A case study of the arid Tarim River Basin, NW China. Appl. Geochem. 2012, 27, 2382–2388. [Google Scholar] [CrossRef]
- Vogel, J.C.; Ehhalt, D. The Use of the Carbon Isotopes in Groundwater Studies; International Atomic Energy Agency (IAEA): Vienna, Austria, 1963; ISBN 0074-1884. [Google Scholar]
- McArthur, J.; Sikdar, P.; Hoque, M.; Ghosal, U. Waste-water impacts on groundwater: Cl/Br ratios and implications for arsenic pollution of groundwater in the Bengal Basin and Red River Basin, Vietnam. Sci. Total Environ. 2012, 437, 390–402. [Google Scholar] [CrossRef] [PubMed] [Green Version]
- Khwedim, K.; Schneider, M.; Ameen, N.; Abdulameer, A.; Winkler, A. The Dibdibba aquifer system at Safwan–Zubair area, southern Iraq, hydrogeology and environmental situation. Environ. Earth Sci. 2017, 76, 155. [Google Scholar] [CrossRef]
- Abdulhadi, Y.B. Database of Registered Pesticides and Public Health Pesticides, Registered and Approved; Ministry of Agriculture; National Committee for Pesticide Registration and Approval: Baghdad, Iraq, 2019. Available online: http://zeraa.gov.iq/index.php?name=Pages&op=page&pid=201 (accessed on 2 June 2020).
- Ministry of Agriculture. Banned, Severely Restricted and Restricted Pesticides, 2nd ed.; Ministry of Agriculture: Baghdad, Iraq, 2020. Available online: http://zeraa.gov.iq/index.php?name=Pages&op=page&pid=201 (accessed on 2 June 2020).
- Hudak, P.F. Chloride/bromide ratios in leachate derived from farm-animal waste. Environ. Pollut. 2003, 121, 23–25. [Google Scholar] [CrossRef]
- Alcalá, F.J.; Custodio, E. Using the Cl/Br ratio as a tracer to identify the origin of salinity in aquifers in Spain and Portugal. J. Hydrol. 2008, 359, 189–207. [Google Scholar] [CrossRef]
- Katz, B.G.; Eberts, S.M.; Kauffman, L.J. Using Cl/Br ratios and other indicators to assess potential impacts on groundwater quality from septic systems: A review and examples from principal aquifers in the United States. J. Hydrol. 2011, 397, 151–166. [Google Scholar] [CrossRef]
- Tarki, M.; Dassi, L.; Jedoui, Y. Groundwater composition and recharge origin in the shallow aquifer of the Djerid oases, southern Tunisia: Implications of return flow. Hydrol. Sci. J. 2012, 57, 790–804. [Google Scholar] [CrossRef] [Green Version]
- Panno, S.V.; Hackley, K.C.; Hwang, H.H.; Greenberg, S.E.; Krapac, I.G.; Landsberger, S.; O’Kelly, D.J. Characterization and Identification of Na-Cl Sources in Ground Water. Ground Water 2006, 44, 176–187. [Google Scholar] [CrossRef] [PubMed]
Figure 1.
Map of the study area. Upper left: map of Iraq showing borders with neighboring countries (Jordan, Syria, Turkey, Iran, Kuwait, and Saudi Arabia) and the study area (red spot). Right: Geological map of the AOI with hydrochemistry points (black dots), main cities (black squares), Khor Al-Zubair channel, 14C sampling points (green dots), the Zubair anticline, and Khedr Almai Fault after [19].

Figure 2.
Relationship of (a) EC vs. Cl−; (b) EC vs. Na+ in the upper Dibdibba unconfined aquifer.

Figure 3.
Spatial distribution of groundwater EC in the upper Dibdibba unconfined aquifer.

Figure 4.
Relationship of δ18O and δ2H values of groundwater samples in the area of interest (AOI) compared with the Iraq meteoric water line (IMWL) and global meteoric water line (GMWL).
Figure 4.
Relationship of δ18O and δ2H values of groundwater samples in the area of interest (AOI) compared with the Iraq meteoric water line (IMWL) and global meteoric water line (GMWL).

Figure 5.
Distribution of δ18O for the groundwaters from the AOI.

Figure 6.
Relationship between total dissolved solids (TDS) and d-excess of groundwater samples according to Huang and Pang [36].
Figure 6.
Relationship between total dissolved solids (TDS) and d-excess of groundwater samples according to Huang and Pang [36].

Figure 7.
Distribution of d-excess for the groundwaters from the AOI.

Figure 8.
Groundwater 14C -age (C2) in the AOI according to assuming an initial 14C activity of 85 pMC.
Figure 8.
Groundwater 14C -age (C2) in the AOI according to assuming an initial 14C activity of 85 pMC.

Figure 9.
Distribution of SO42− in groundwater in the AOI.

Figure 10.
Relationship between 14C -age of groundwater and SO42– in the AOI.

Figure 11.
Relation of Cl−/Br− (molar ration) and Cl− (mg/L) concentration of groundwater samples in the AOI. Mixing lines according to data from McArthur et al. and Katz et al. [38,44].


Table 1.
Statistical summary of some groundwater constituents and chemical relationships of 39 groundwater samples, and the relevant values in Khor Al-Zubair (KhZ).
Table 1.
Statistical summary of some groundwater constituents and chemical relationships of 39 groundwater samples, and the relevant values in Khor Al-Zubair (KhZ).
| Parameter | Min. | Max. | Mean | Standard Deviation | KhZ |
|---|---|---|---|---|---|
| Na+ (mg/L) | 940 | 4720 | 1940 | 864 | 16,540 |
| Cl− (mg/L) | 670 | 5850 | 2700 | 1310 | 28,360 |
| SO42− (mg/L) | 1870 | 4680 | 2655 | 609 | 4420 |
| Br− (mg/L) | 1.2 | 16.4 | 5.8 | 3.5 | 145 |
| Ca2+ (mg/L) | 587 | 1481 | 928 | 189.5 | 902 |
| Mg2+ (mg/L) | 59 | 383 | 169 | 61.7 | 1798 |
| K+ (mg/L) | 9 | 269.8 | 45.1 | 41.7 | 622.8 |
| NO3– (mg/L) | 18.3 | 499.3 | 119 | 87.2 | − |
| HCO3− (mg/L | 20 | 350 | 96 | 86 | 103 |
| Na+/Cl− [molar ratio] | 0.8 | 2.16 | 1.2 | 0.30 | 0.89 |
| Cl−/HCO3− [molar ratio] | 8.9 | 231.1 | 61.7 | 45.6 | 474.9 |
| Cl−/Br− [molar ratio] | 740 | 1851.4 | 1138.5 | 274.7 | 441 |
Table 2.
The calculated 14C -age of groundwater with initial 14C activity of 100 pMC for C1 and 85 pMC for C2 (YBP: years before present).
Table 2.
The calculated 14C -age of groundwater with initial 14C activity of 100 pMC for C1 and 85 pMC for C2 (YBP: years before present).
| ID | 14C pMC | δ13C ‰ | C1 (YBP) | C2 (YBP) |
|---|---|---|---|---|
| W40 | 102.1 | −10.56 | <50 | <50 |
| W17 | 81.92 | −9.6 | 1641 | 297 |
| W10 | 75.38 | −8.4 | 2378 | 1035 |
| W1 | 71.68 | −9.1 | 2716 | 1372 |
| W7 | 66.03 | −8.7 | 3435 | 2092 |
Publisher’s Note: MDPI stays neutral with regard to jurisdictional claims in published maps and institutional affiliations. |
© 2021 by the authors. Licensee MDPI, Basel, Switzerland. This article is an open access article distributed under the terms and conditions of the Creative Commons Attribution (CC BY) license (http://creativecommons.org/licenses/by/4.0/).
Share and Cite
MDPI and ACS Style
Abdulameer, A.; Thabit, J.M.; Kanoua, W.; Wiche, O.; Merkel, B. Possible Sources of Salinity in the Upper Dibdibba Aquifer, Basrah, Iraq. Water 2021, 13, 578. https://doi.org/10.3390/w13040578
AMA Style
Abdulameer A, Thabit JM, Kanoua W, Wiche O, Merkel B. Possible Sources of Salinity in the Upper Dibdibba Aquifer, Basrah, Iraq. Water. 2021; 13(4):578. https://doi.org/10.3390/w13040578
Chicago/Turabian StyleAbdulameer, Ahmed, Jassim Mohammed Thabit, Wael Kanoua, Oliver Wiche, and Broder Merkel. 2021. "Possible Sources of Salinity in the Upper Dibdibba Aquifer, Basrah, Iraq" Water 13, no. 4: 578. https://doi.org/10.3390/w13040578
Note that from the first issue of 2016, this journal uses article numbers instead of page numbers. See further details here.