
Sponge City: Using the “One Water” Concept to Improve Understanding of Flood Management Effectiveness


School of Engineering, University of Guelph, Guelph, ON N1G 2W1, Canada
*
Author to whom correspondence should be addressed.
Water 2021, 13(5), 583; https://doi.org/10.3390/w13050583
Submission received: 18 January 2021
/
Revised: 14 February 2021
/
Accepted: 19 February 2021
/
Published: 24 February 2021
(This article belongs to the Section Urban Water Management)
Abstract
:Urban flood-related issues are substantial in China, arising from rapid construction of megacities over decades with insufficient flood control, all being made worse by climate change. Since Sponge City (SC) options are primarily effective at maintaining the water balance at the surface, flooding continues. In response, the One Water concept is used to demonstrate the need to respond to dimensions beyond SC and shown herein to have potential to reduce the impacts of major storms (e.g., suppress 100-year flooding to a 25-year flooding equivalent). However, climate change causes more intense storms, indicating the intensity of the 100-year storm will increase by ~0.23% annually over the next 70 years. Hence, given sufficient SC options, the 100-year storms may only be effectively reduced to a 50-year storm, at best by SC options. “One Water” is utilized as a concept to demonstrate structured thinking about how each dimension of the hydrologic cycle can be employed to consider the degree of interconnection, allowing improved assessment of various components of the hydrologic cycle and SC options. Examples are used to demonstrate how the concept of One Water links the array of components of the hydrologic cycle together, generating a holistic view of urban water resource security.
1. Introduction
Issues of water security and safety are widespread throughout the world and are intensifying as a result of population growth, rapid urbanization and the continuation of climate change. In many respects, an obvious outcome is the increased frequency and magnitude of flooding, raising substantial issues throughout China as well as at a world scale. Unfortunately, it is relatively easy to report numerous specific recent examples of major flood-related damages in Chinese cities:
- -
- From 2008 to 2018, the impacts of flooding in China in 2010 were most impactful. In that year, over RMB 350 billion (approximately USD 52.5 billion) damage in total occurred from over 250 cities [1].
- -
- A single storm event occurred in Beijing on 21 July 2012 that resulted in 79 deaths and led to RMB 11.6 billion (approximately USD 1.74 billion) economic loss [2].
- -
- Between 2011 and 2014, a survey shows that 62% of cities were impacted by flood events and the associated financial losses totaling RMB 100 billion (approximately USD 15 billion) [3].
- -
- In 2015, flooding caused direct damage to more than 150 cities, which incurred approximately RMB 160 billion (approximately USD 24 billion) financial costs [1].
- -
- In 2016, monsoon season-related flooding resulted in major flooding in 28 provinces in China in hundreds of cities from south to north over the entire country [4]. The associated cost was estimated to be at least USD 44.7 billion [5]. In the same year, 641 out of a total of 654 cities (98%) had experienced frequent flooding events [1].
In addition to the examples briefly introduced above, there are countless additional examples showing that flooding issues are severe and widespread throughout mainland China: Shenzhen—2007, Shanghai—2015, Wuhan—2016, Tianjin—2016, and Ningbo—2016 [4].
In response to these types of massive flooding events, many Chinese municipalities have undertaken action, adopting elements of Sponge City (SC) initiatives. The concepts behind SC include dimensions of sustainable urban drainage (SUD), green infrastructure (GI), and Low Impact Development (LID), all of which have elements intended to decrease flooding. According to a guideline issued by the Ministry of Housing and Urban-Rural Development (China) in 2014, SC does indeed follow the same concept as LID [6]. Various examples and case studies related to SC initiatives can be found in [6,7,8]. The challenge, however, is that while many municipalities in China have adopted SC options and made massive expenditures, frequent urban flooding is continuing.
On the other hand, there are many additional dimensions of concerns with water security but have much lesser noticeability. These include:
- -
- Massive groundwater withdrawals are frequently employed to meet the water demands of the growing urban populations, but these initiatives may be causing land subsidence;
- -
- With elevated water use in the urban areas, there are more wastewater quantities to contend with, resulting in deteriorated water quality in receiving waterbodies;
- -
- Urban areas are increasing in size. With larger city dimensions, a localized, heavy storm which historically would have caused damage to a rural area now hits an urbanized area with large economic impacts and fatalities.
All of the above are important. Decisions made regarding one dimension of the need for water management for an urban region, also influences other dimensions of water management. A full appreciation for making real inroads requires the development of an understanding of the crucial interrelationships of water resources and the municipality, to resolve the issues of urban water security. Water movement in urban areas arises in interrelated dimensions, including water supply, groundwater withdrawal, urban flooding, and water quality. As a watershed shifts from rural to urban land use, massive changes in water movements occur, influencing the ability to effectively continue to manage water in response to massive adjustments that occur as a result of growth of megacities.
To better understand how urban water issues are interrelated, a systematic approach is needed that provides a holistic view of linkages between current practices and future directional needs. A holistic view of water in the urban environment is embodied within the “One Water” concept (at regional levels within a city, not at city-wide level). The One Water concept provides critical insights as an organizing tool, providing insights on how to guide water management for regions/areas within large cities by identifying strategies and opportunities to improve urban water security, including reducing impacts from flooding, decreasing the rate of city subsidence, improving groundwater recharge, etc. Taking steps back and considering the implications to water budgets in an urban context are needed; One Water is an important tool to form the basis of the issues of water security to the urban region.
2. Water Flow Components: Indications of Changes
2.1. The ‘One Water’ Concept
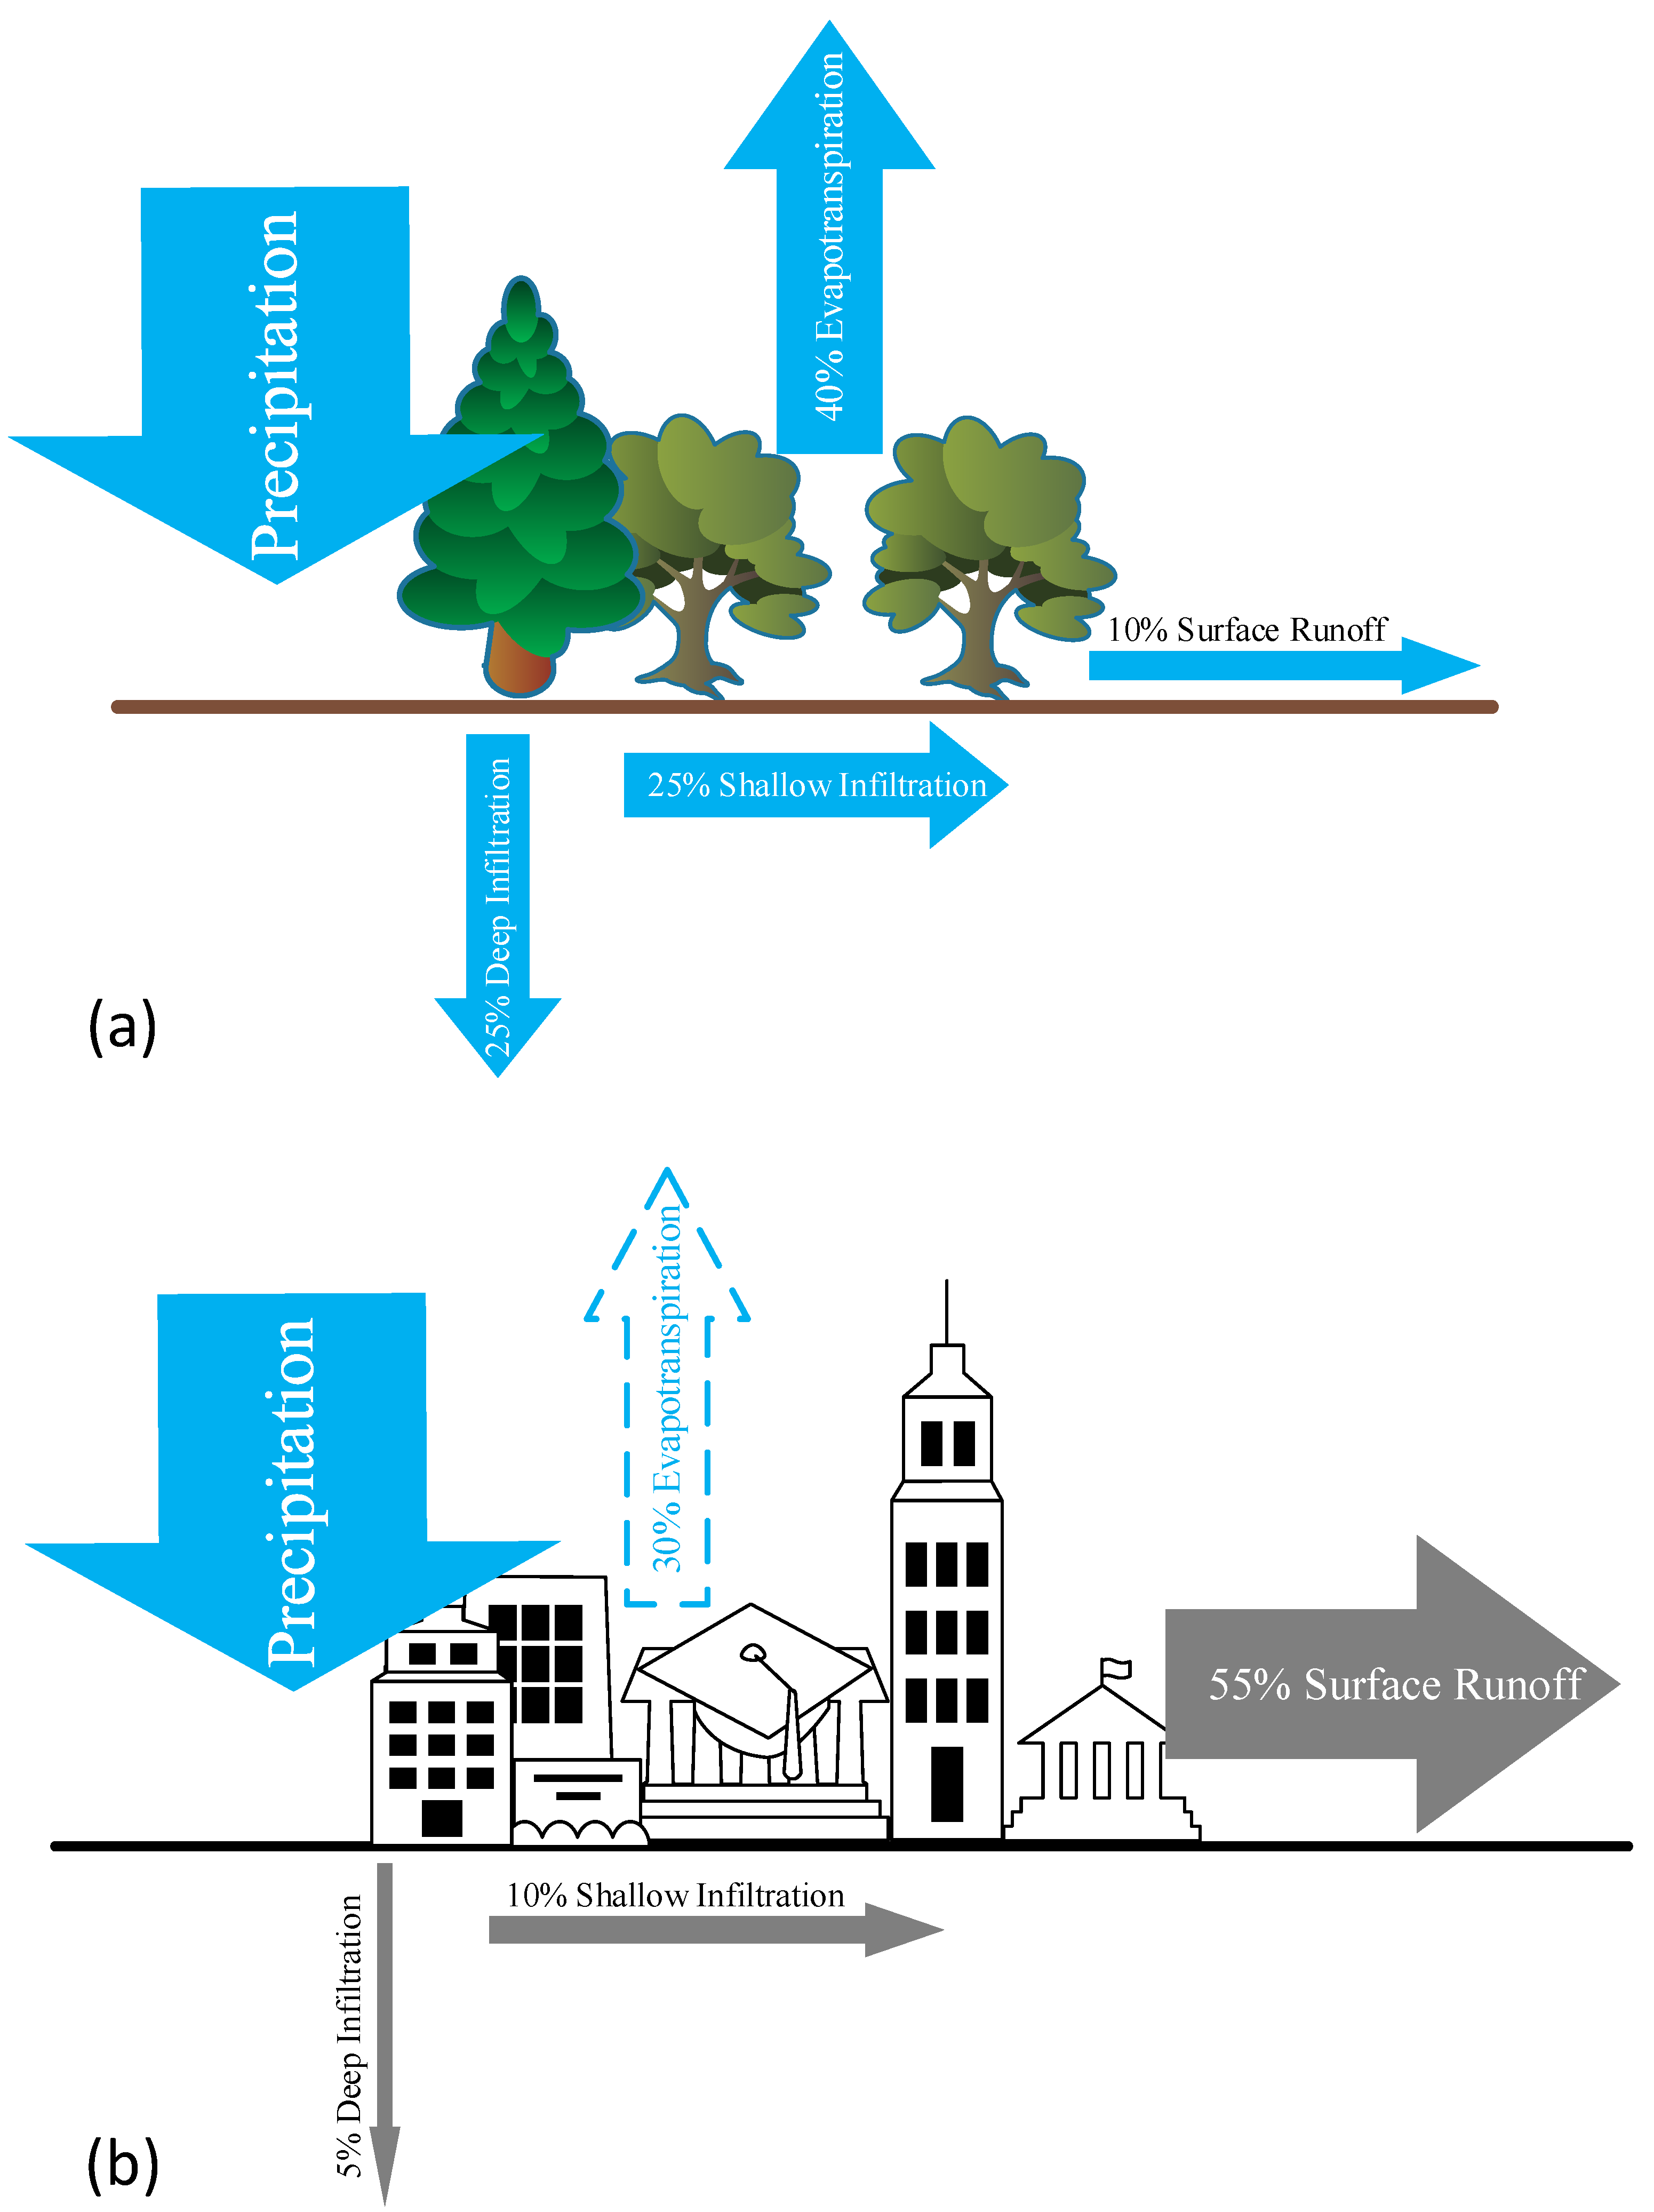
The One Water concept characterizes water in all its forms [9], and allows a demonstration of the impact of urbanization as illustrated in Figure 1, where Figure 1a schematically depicts the directions of water flow in a predevelopment, natural area, and Figure 1b shows the results of urbanization. Comparing Figure 1a,b, infiltration decreases due to more paved surfaces, and more water being needed to meet water demands and, hence, frequent reliance on groundwater as water source, as well as the importing of additional surface waters. With little water reuse occurring, substantial wastewater needs to be treated. Further, a subtle but very important dimension is related to evaporation/evapotranspiration (E/E): in pre-development, the E/E is a relatively constant return to the atmosphere via the water cycle, but E/E following urbanization results in the rate being discrete and substantial; namely, high only for limited periods of time immediately following precipitation events. For this reason, in Figure 1b, the lines demarking the E/E rate have been depicted using dashed lines in Figure 1b, to reflect the large variations over time in the post-E/E timeframe. More explanations will be described in the following sections.
An important element depicted in Figure 1b is that with urbanization, increased impervious surfaces result in less natural water infiltration to the groundwater aquifer. Meanwhile, urban areas attract more citizens, which positively reinforces the likelihood of increases in impervious surfaces, diminishing groundwater recharge, and ultimately, lowering groundwater levels. Urbanization processes intensify the challenges: more flooding, increased demand for drinking water, and water quality impacts on waterbodies.
Note that in Figure 1a,b, the approximate magnitudes of percentages of water and importation of water (later in this paper), runoff, infiltration, wastewater production, etc., pertinent to the region being assessed, are presented proportionally in terms of the “arrow” sizes. Figure 1a shows typical water percentages under natural ground cover conditions (pre-development), and Figure 1b shows the modified percentages under conditions of 75–100% impervious cover or full urbanization (post-development). The intent in the schematic is to demonstrate that the surface runoff volumes immediately following rainfall are dramatically higher with urbanization, and evaporation from impervious surfaces change greatly. Evaporation is high immediately after rainfall for the urban area but minimal otherwise so, while percentagewise there is a tendency to consider evaporation in post-development situations as if it is continuous and constant, evaporation is not continuous; relative to the magnitudes during heavy rainstorms, evaporation is relatively small. As an indication of context, Toronto’s Wet Weather Flow Master Plan (2003) indicates that 50% of the total average volume of rainfall events in Toronto occur during just a few events within the year (Toronto, 2020), indicating the time-sequence of the two types of pre-development E/E, relative to post-development E/E, are very different.
Various colors used in Figure 1 indicate conditions that imply good water quality (blue) to poor (dark grey) indicating the potential for the quality of the water to be deteriorated. Particularly noteworthy are the significantly lower percentages of water migrating to both deep and shallow groundwater infiltration, as well as the color change, comparing Figure 1a,b. It follows that there is much more water to be managed at the surface during a sizable rainfall event as a result of urbanization, and less going to groundwater [11].
Historically (i.e., prior to the 1970s), typical responses following urbanization were to manage storm water by moving the water as quickly as possible to the nearest watercourse, ultimately discharging to the ocean. Since this approach puts enormous pressures on downstream cities and rivers/streams, alternative options were essential. The growth of cities with large populations and associated demands for water supply creates the need to meet the demand. Meanwhile, however, climate change is complicating the issues; hence, the future challenges are ominous, as urbanization continues and climate change intensifies.
2.2. Implications of Sponge City
One Water is the provision of a focused strategy to improve the understanding of water movement rates. The One Water concept demonstrates that there continue to be major issues of infiltration to both deep and shallow groundwater needing to be addressed to avoid city subsidence. This issue worsens as population flux continues into cities (e.g., 65% of the world’s population is expected to be in urban areas by 2050 [12]), creating spikes in water demand as a result.
The Chinese government has identified multiple strategies to address the urban flooding issue, particularly after many massive urban flooding events observed in the early 2010s. Approaches to reduce the hazard from flooding events in China include 30 designated cities that adopted Sponge City (SC) initiatives starting in 2015 [2]. Starting in December 2013, there have been many policies and guidelines developed for building “Sponge City” scenarios. The main goal of those policies and guidelines is to “alleviate the adverse effects of urban construction and recycle 70–90% of stormwater in-situ, and with the hope this can be achieved through combining retention, storage, purification, and reuse before discharge by applying the green infrastructure concept” [3].
As briefly mentioned previously, SC has very similar concepts in comparison with its North American counterpart: Low Impact Development (LID). In North America, LID plus stormwater management ponds have been widely implemented. The intent of all these various applications has been to decrease urban flooding, encourage infiltration, and minimize discharge (e.g., to maintain quantities to historical/pre-development levels) to nearby waterways. With the success of LID in North America, SC was seen as having the potential to increase infiltration, thus decreasing flow toward rivers, and instead, toward groundwater. However, since infiltration is a slow process, whether the SC initiatives will create sufficient infiltration to both shallow and deep groundwater recharge remains very challenging [13].
Another important goal of SC is to reduce the magnitude of damage due to flooding, but the range of options are highly influenced by location. Constraints on SC installation arise due to land availability and economics: in China, with high land values, there are limitations due to spatial requirements. A list of some SC initiatives is provided in Table 1, with the assigned numbers indicating the suitability of different parameters, clearly indicating SC are primarily functional for surface water balance, not for flood control.
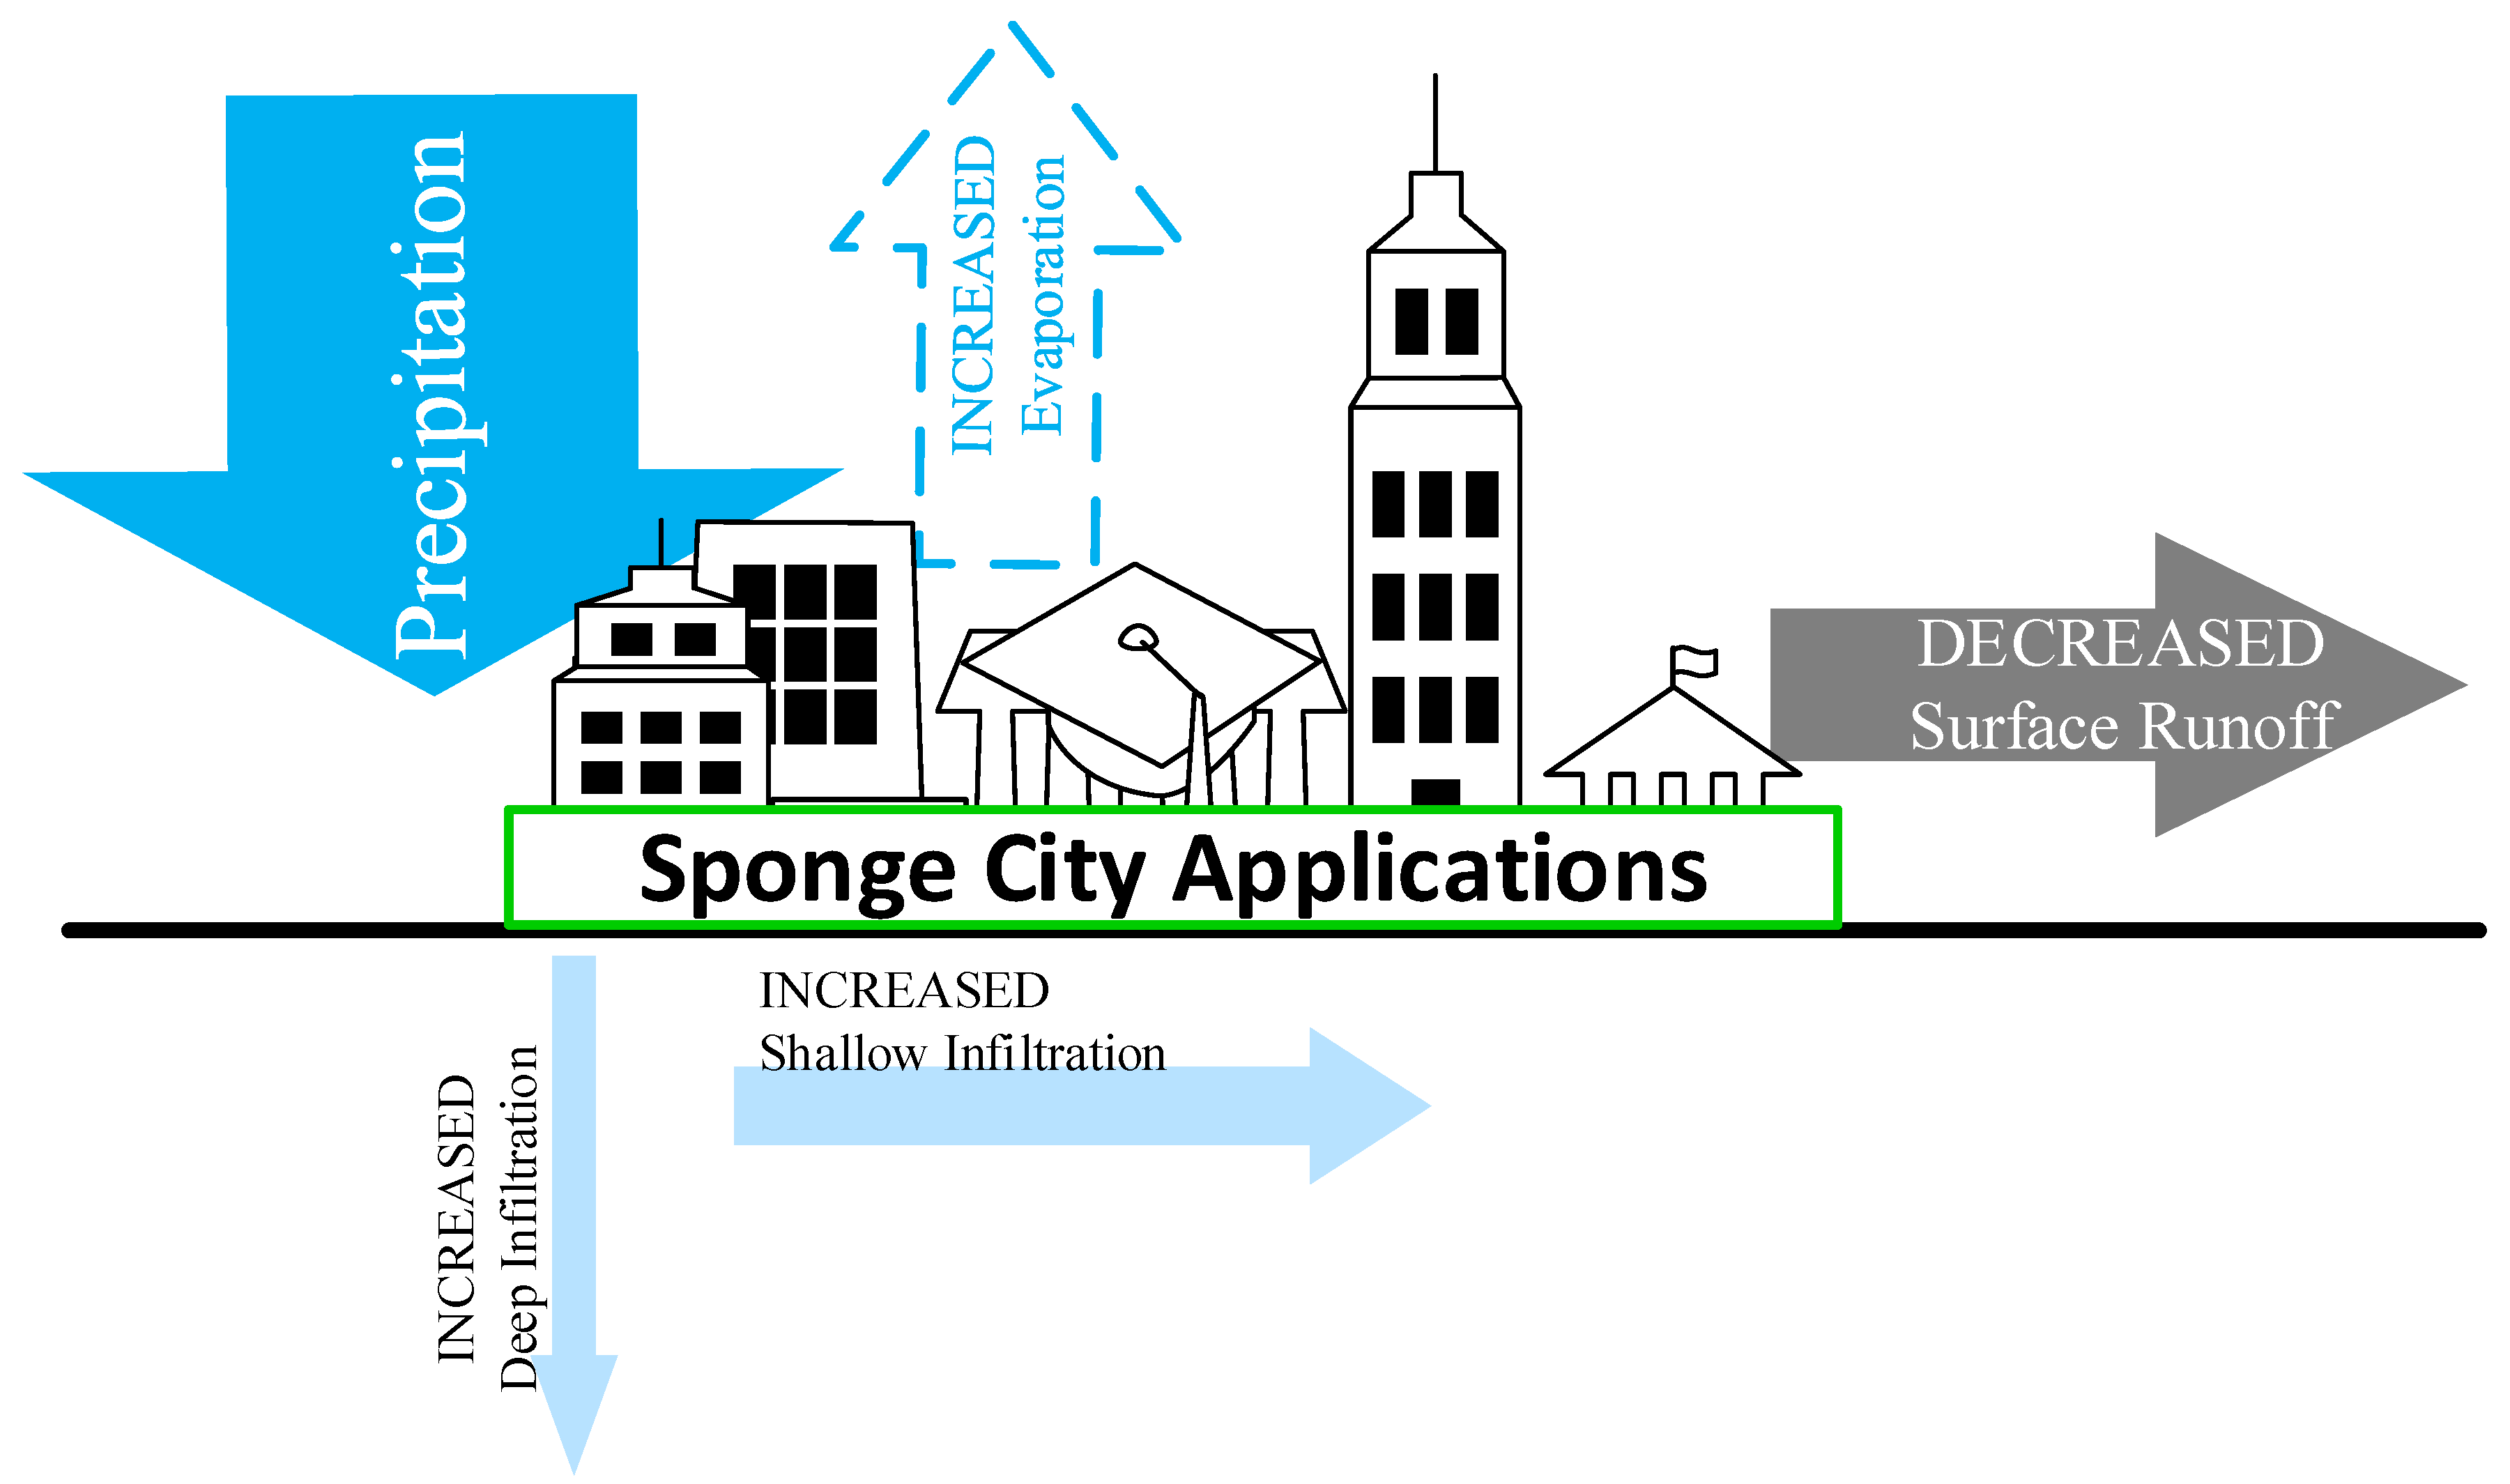
SC applications can change where water travels (see Figure 2) as well as changing impacts on the water quality, as indicated in Table 1 but since infiltration is a slow process, SC enables only modest influences to decrease flooding events in the absence of large volumes of retention storage (e.g., stormwater management ponds), which are not available in post-development China. A limitation of SC is also implied from Figure 2, where the thickness of the arrow indicates that surface runoff is reduced, but still large. This indicates SC may be sufficient to treat frequent storms (relatively small surface runoff volumes) but not major storm events. Jiang et al. [13] examined a case study area in London, Ontario, Canada for the feasibility of applying lot-level SC applications to reduce the damage from street and basement flooding [13]. The results of Jiang et al. [13] show that SC has the potential to eliminate flooding for a 2-year return period storm, by implementing a substantial array of various SC applications, using one each, for each single-detached house lot [13]. If many lot-level SC applications are implementable, major storms such as the 25-year return event, flooding issues will still occur, but with the help of SC applications, the quantity of surface runoff can be reduced.
Thus, One Water indicates that possibilities may exist to restore pre-development conditions for the 2-year recurrence storm and/or less, with installation of a full array of SC options installed at lot level. One Water recognizes the limited opportunity to attenuate flooding caused by major storm events as being a key aspect; namely, to rethink how issues of urban flooding and city subsidence can be more fully addressed in China.
The utility of the color scheme throughout Figure 1, presented earlier, and Figure 2 and Figure 3, are to identify needed guidelines; the quality of the water needs to be maintained. For example, water departing from an industrial area or from heavy traffic roadways may have greases and oils, heavy metals, PAHs, etc., whereas water sourced after passing through vegetated swales will be much cleaner as a result of the slow passage time and filtration/sorption by the vegetation. Similarly, planting trees en masse can help to lower flooding by enhancing the soil’s ability to absorb rainwater and provide a multitude of additional benefits including greater carbon sequestration and surface soils which absorb water effectively (as trees grow, they create new cavities in soil, slowing the speed at which rainwater leaches out of the soil and enhancing infiltration) [15].
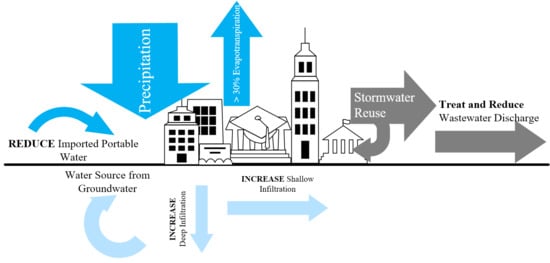
In Figure 3a, the addition of arrows (in comparison with Figure 1b) reflects the quantities of water imported and sourced from groundwater to respond to the water demands from the megacity. Wastewater discharges implied by releases to the environment are also shown in Figure 3a with minimal groundwater recharge. Figure 3b is a schematic view characterizing desirable water management in an urbanized scenario with a more balanced approach. This approach is accomplished by:
- i.
- intentional increases of acceptable quality (i.e., light grey) water being infiltrated to ensure that the integrity of the groundwater sustainability is preserved, while also increasing both shallow and deep groundwater infiltration [16];
- ii.
- reduced water importation as the result of success at reducing water demands from the megacity;
- iii.
- enhanced evapotranspiration occurs due to sponge city components such as bioretention cells;
- iv.
- stormwater reuse arises from efforts to successfully reuse some of the stormwater by, for example, water capture to facilitate vegetative watering and/or for rainwater being used for toilet flushing.
In essence, SC illustrates the need to be concerned with the transformation embodied to approach Figure 3b. However, while helpful as a guiding principle, limits exist to which SC can manage the water, as per the One Water concept. At present, the key points are:
- i.
- One Water is useful to portray the principles of decision-making in relation to water movement and organize the thinking and the potential effectiveness of specific initiatives;
- ii.
- One Water does not easily reflect the implications of different return periods of flooding, e.g., the 2-year impact versus the 100-year impact;
- iii.
- One Water can portray the need to be highly cautious about the water quality impacts of infiltration.
One of the bases for SC is to restore the surface water balance to pre-development conditions. End-of-pipe treatment works but SC initiatives do not have the storage magnitudes as needed, since storage is expensive. Knowing and understanding that infiltration is a slow process is essential, because without storage, “restore” cannot be accomplished.
Evaporation/Evapotranspiration (E/E)
Although little research has been conducted on urban evaporation, Ramamurthy and Bou-Zeid (2014) found that impervious surfaces can promote significant evaporation and are able to evaporate at higher rates than vegetated surfaces when wet, especially just after raining and when combined with intensive solar radiation, due to the heat storage capabilities prior to a rain event [17]. They reported that evaporation from concrete pavements, building rooftops and asphalt surfaces is discontinuous and intermittent, accounting for ~18% of total latent heat fluxes during a relatively wet 10-day period, with a significant impact on the urban surface energy balance during the 48 h following a rain event when evaporation from impervious surfaces is the highest. Thus, understanding the temporal variability of water flux in urban models is critical. Alternatively, during dry periods, there is limited water availability to evaporate [18]. Hence, when flooding is high, evaporation is high from impervious surfaces, hence demonstrating the rationale for the dashed lines in Figure 1, Figure 2 and Figure 3.
2.3. The Groundwater Perspective
Due to the profound reduction of groundwater recharge schematically shown in Figure 1 but continued withdrawals of water for water supply for urban areas, groundwater levels will continue to lower, and concomitant subsidence will occur. As a result of the growth of megacities, issues of flooding and city subsidence result from groundwater withdrawal to meet water supply demands, have been exacerbated. Numerous examples throughout the world are already evident, as demonstrated for select cities around the world, as presented in Table 2. To put in context, subsidence rate in many coastal cities have now exceeded the absolute sea-level rise by a factor of 10 [19].
In Beijing, the subsidence rate increased up to 52 mm per year from 2003 to 2010 [21]. The root cause of such damage is that water demands substantially increased due to the rapid growth in Beijing’s population [22].
City subsidence levels indicate massive groundwater withdrawals are evident and substantial. Singh et al. [23] reported that in Beijing, the annual groundwater extraction reached 2.6 × 10⁹ m3/year, which included roughly 1 × 10⁶ m3/year for exploitation. Gao et al. [24] also suggested that the South-to-North canals now provide nearly two-thirds of urban water supplies for Beijing, where these amounts were previously supplied by groundwater withdrawal. Due to such large amounts of historical withdrawal and long-term groundwater exploitation, both groundwater level declines and land subsidence were the result. Cao et al. [25] reported that 66% of the Beijing plain has been affected by more than 50 mm land subsidence, covering an area of 4.2 × 10³ km2. Ye et al. [26] have also provided evidence showing the overall land-subsidence affected areas in China have exceeded 90,000 km2 by 2015. On all accounts, overexploitation of groundwater causing land subsidence is life-threatening to citizens [27] and large groundwater withdrawals are leading to land subsidence [28].
3. Results and Discussions: Sponge City in China—Now and the Future
3.1. Challenges and Limitations
As previously mentioned, SC are able to provide benefits by mimicking the natural hydrological cycle for surface water balance [29] but have large challenges to eliminate flooding for major events. An example of a technology that does provide a degree of flood reduction involves encouraging more water infiltration to groundwater and reducing surface runoff (this technology typically referred to as the Etobicoke Exfiltration System [30,31,32]. McBean et al. [28] indicated that use of this type of exfiltration system in an example application has the ability to reduce urban flooding by 53% (quantitatively, for a 5-year storm event, for a particular design scenario). For a larger storm event, such as a 50-year event, urban surface flood quantities could decrease by 36.1%, as an example for a particular design scenario. In comparison to SC, the Etobicoke system has the potential to be more effective in reducing surface runoff and flooding, as well as improving infiltration magnitudes. Additionally, replenishing groundwater aquifers may alleviate some degree of subsidence. Other options where surface water impoundments can be implemented could also be very effective, for circumstances where there is available land space. Many examples in the technical literature exist for this statement, including Guo [33] and Lafleur and McBean [34]. The concern is that current SC options have limited ability to reduce urban flooding.
3.2. Urban Growth and Storm Sizes
Urbanization has increased the apparent occurrence of more heavy rainfall events, both directly and indirectly. Compared to the 1980s, when over 60% of the population lived in rural areas [12], the dramatic growth in urban areas is causing increased water security issues from catastrophic flooding events.
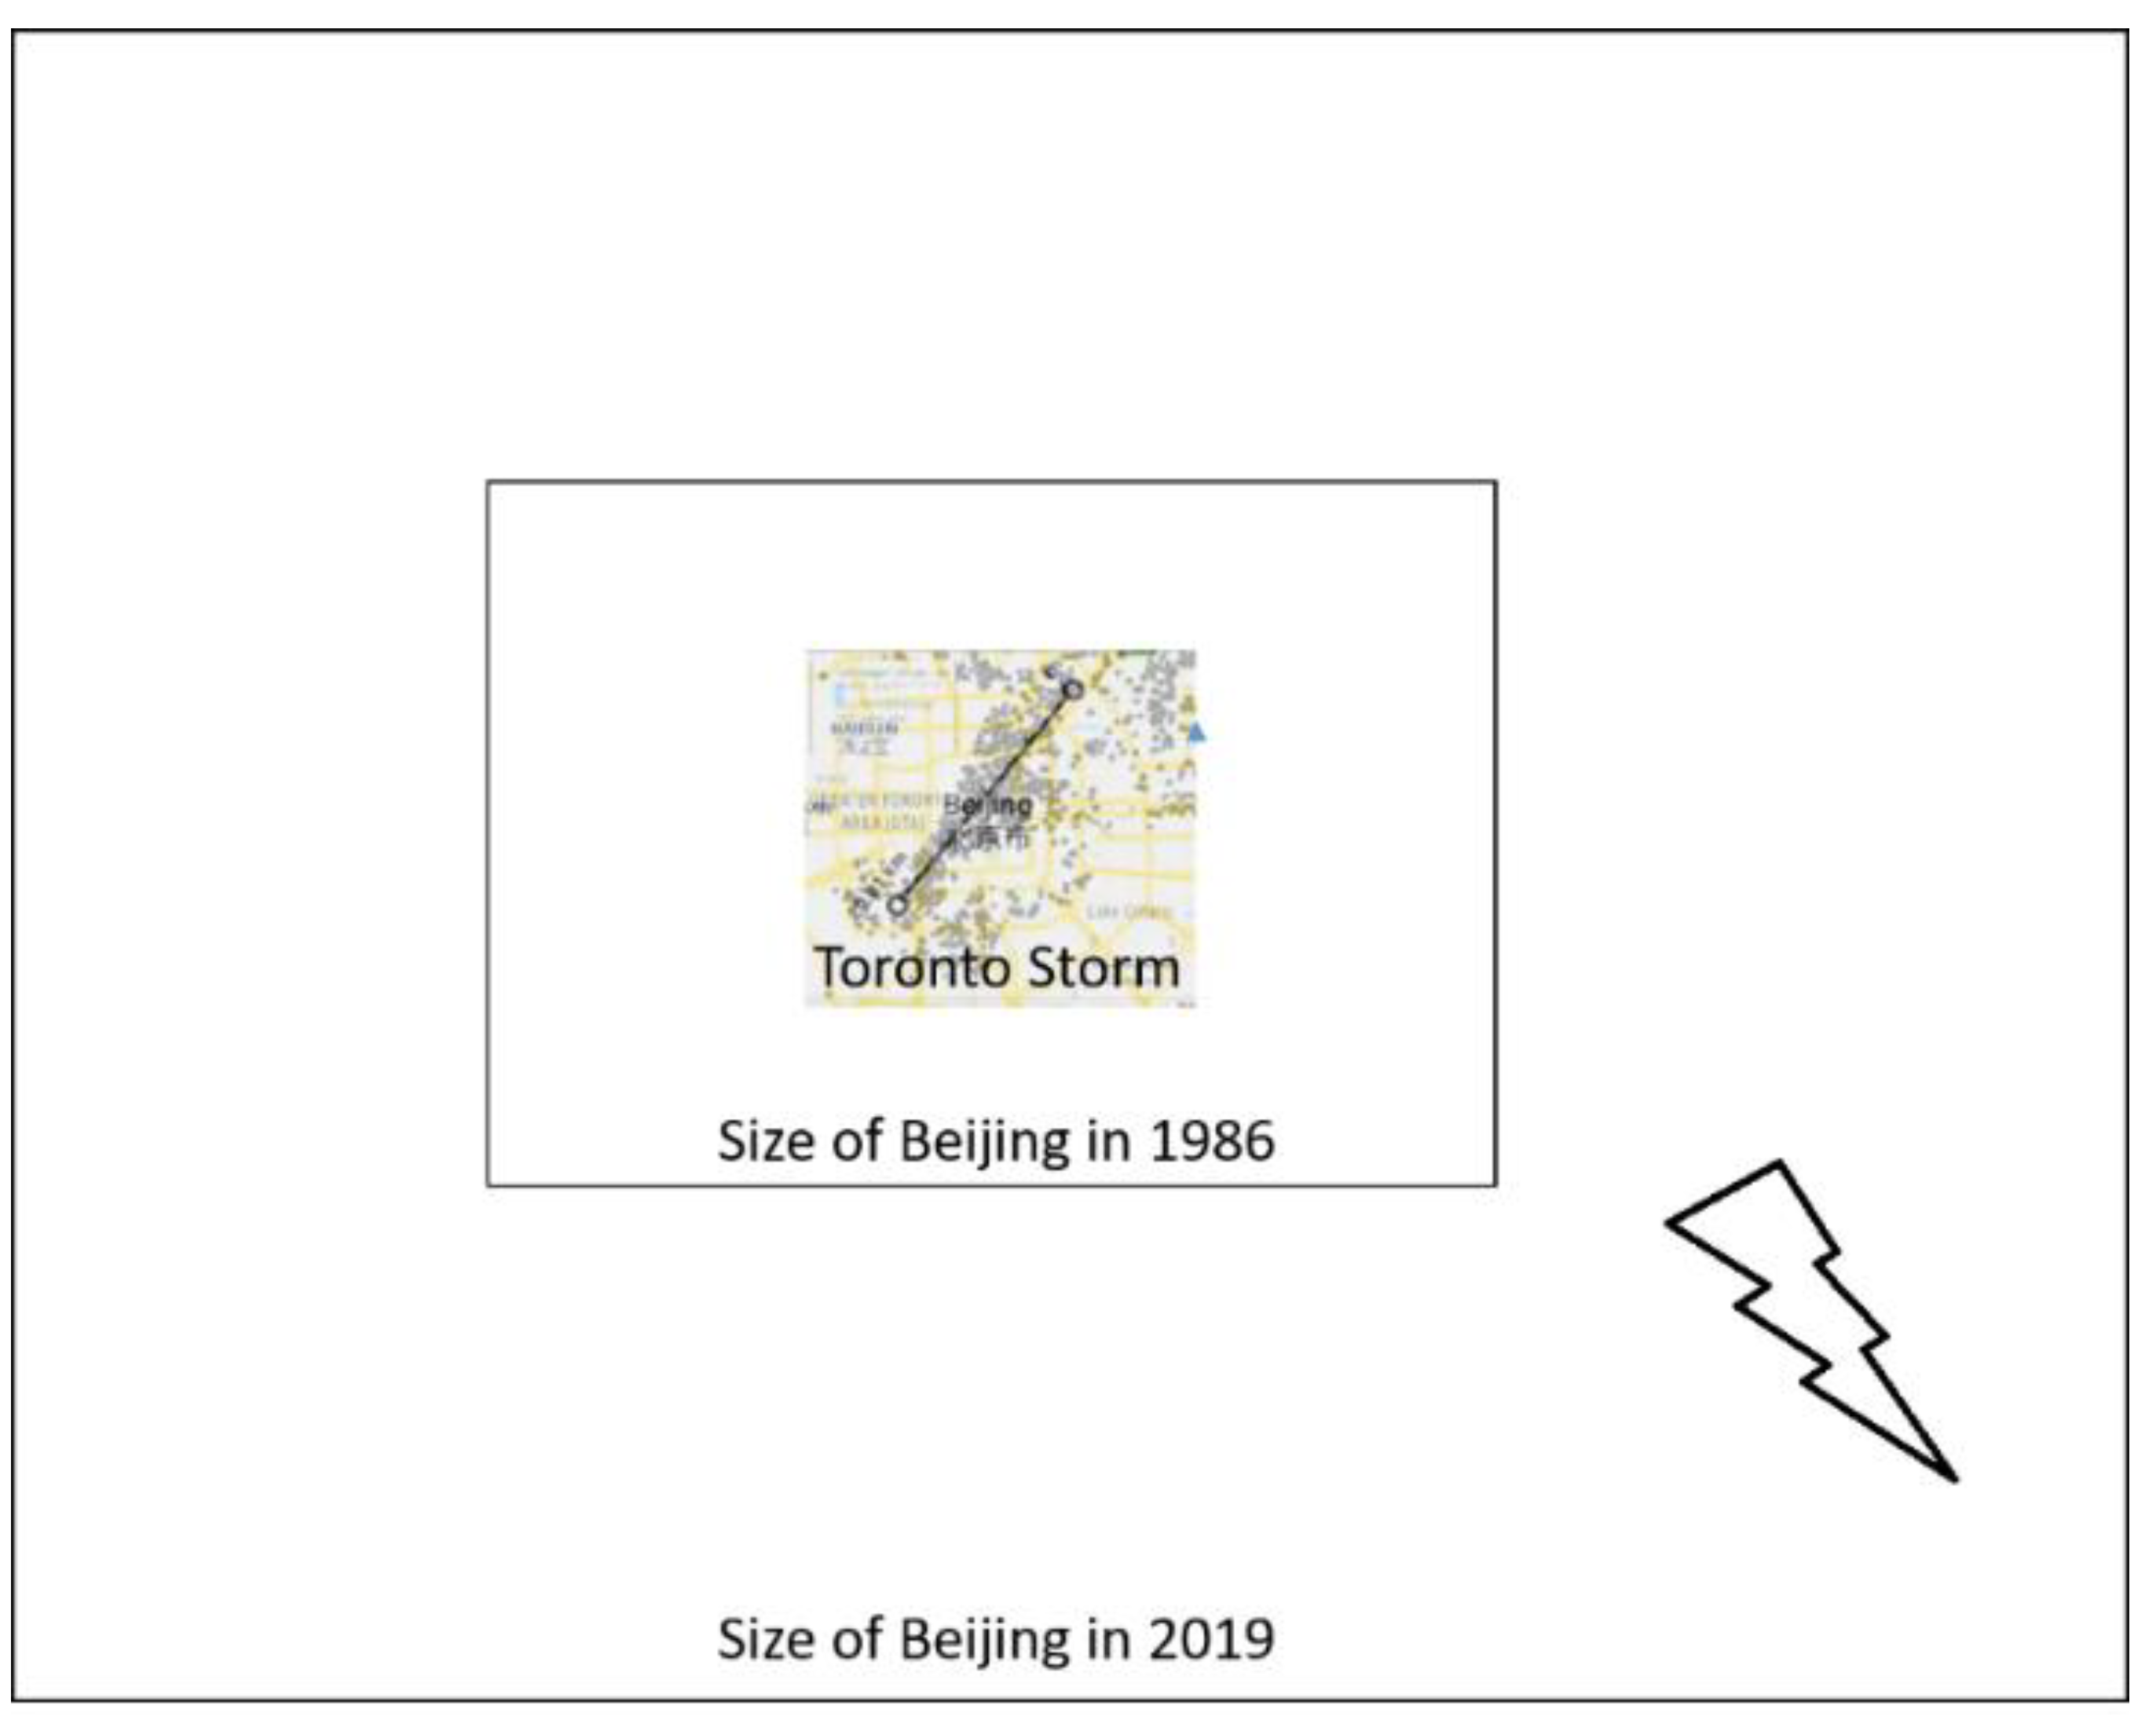
Table 3 presents data listing population and city size, for selected Chinese cities. With the growth in the spatial sizes of cities, storms that would not even be considered as affecting a ‘city’ decades ago have now become substantial events that are causing enormous damage. Using Beijing as an example, as shown in Figure 4, where the most damaging storm in the history of Ontario hit Toronto, Canada in 2013, is overlain on the map of Beijing, China (where the figure also shows the spatial size of Toronto). Figure 4 shows that, as areas urbanize, transforming from rural to urban, the city size increases. If a hypothetical storm hit Beijing area as shown in Figure 4 by the thunderbolt symbol in 1986 as an example, damage only to rural areas would have been registered as a result of this storm. If this same hypothetical storm hit Beijing again in 2019 at the same location, damages caused would have been huge, due to the dense population now occupying the area. Thus, urban growth may have a direct connection to the increased number of storms, and cities are more likely to have more storms because the developed/registered land areas are larger.
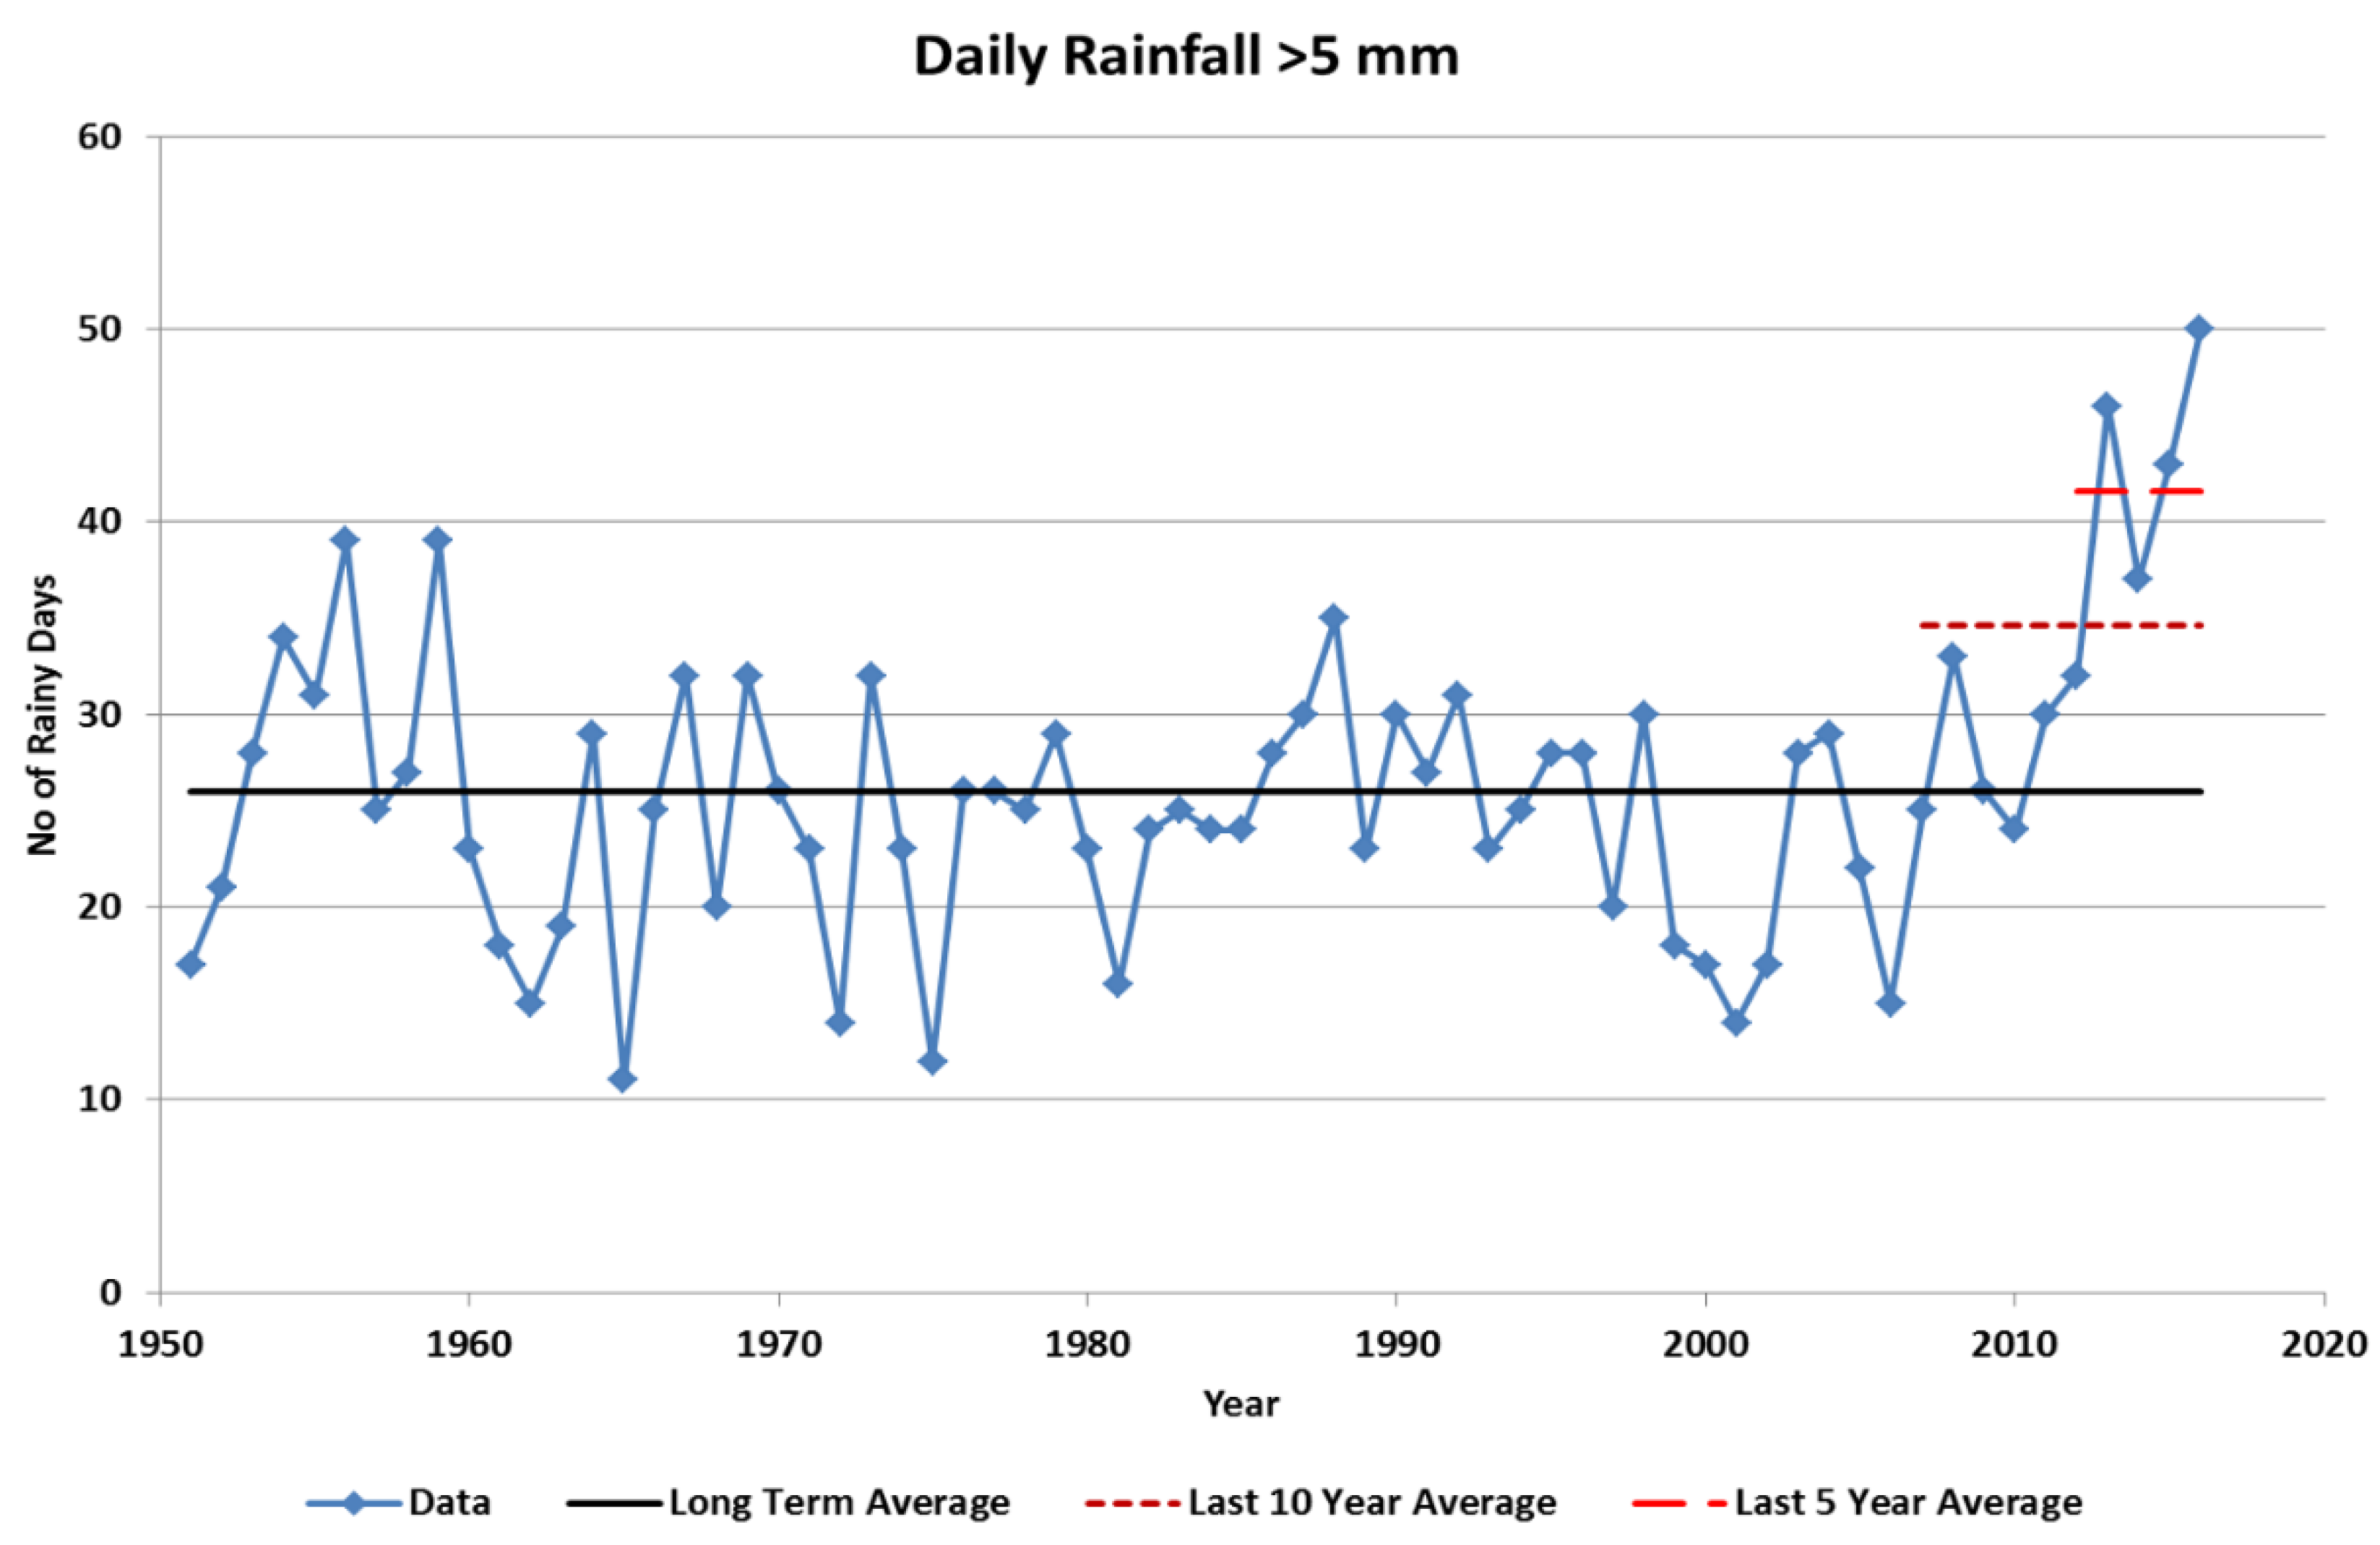
Nonetheless, adding climate change into this already challenging context, the issue is being further escalated because the daily rainfall patterns in Figure 5 demonstrate that the number of rainfall events in Beijing are increasing (the number of rainy days) in the last five years (2011–2016).
Increasing urban spatial dimensions and the number of storms is forcing consideration of urban drainage systems to transition to the future. City engineers have to expand the spectrum from “too little water” (shortage of water supply) to “too much water” (flooding). When adding in the complications associated with megacities as a result of both their enormous water demands and the anthropogenic water quality impacts, the challenges of urban water security in the modern context are more severe and more complicated.
3.3. Climate Change and Sponge City
The impacts of anthropogenic climate change are already being felt globally through shifting seasonal patterns as well as changes in temperature, precipitation and frequency of extreme weather events (according to Intergovernmental Panel on Climate Change 2014 and 2018 reports). There is no doubt that climate change is ongoing and not equal. Canada, as an example, has already demonstrated a warming climate at roughly twice the global rate [37]. The effects are exacerbated during winter, and in northern regions of Canada, in particular. Gao et al. (2013) [38] used different climate change models to demonstrate the precipitation change in Beijing under RCP4.5 and RCP8.5. Their results show the precipitation for Beijing can be expected to increase by 6.3% to 8.6% with RCP4.5, and 8% to 13.4% with RCP8.5. Similar to any other non-tropical weather pattern, most precipitation events in Beijing occur during the summer season, which could be as much as 72% of the annual total precipitation [38]. Zhan et al. [39] predicted Beijing will have to be prepared for more summer rainy weather events during 2030 and 2040. Further, as demonstrated in the previous section, urban expansion can have an inevitable impact on the weather pattern. Zhan et al. [39] pointed this out from a different perspective: buildings that vary in height create mechanical turbulence, affecting the precipitation system. Coinciding with the conclusion made in the previous section, massive urban development is making undeniable interferences with precipitation, from both anthropological and physical perspectives. The essence is that the concept of climate change has to be incorporated into guidelines for future stormwater management.
Engineers and scientists are preparing for such change by using computational models to analyze the shifting pattern and predicting potential future directions. However, the application of computer models to represent changes in global climate is limited by a combination of natural climate variability, incomplete knowledge of natural processes, and lack of observational data [40]. Meanwhile, water management activities are primarily planned using assumptions of a stationary climate. Such practices lead to under-designed stormwater infrastructure that do not have sufficient capacity under future climate conditions. If the current infrastructure can eliminate flooding from a 2-year return period storm, this same infrastructure has the capability to reduce, but not eliminate, the impact of a 100-year storm. However, when there is climate change with increasing storm intensities and frequency over time, the current infrastructure may quickly become increasingly inadequate [41].
Characterizing the hydrologic impacts of global climate change requires consideration of multiple sources of uncertainty. General Circulation Models (GCMs) use the method of Representative Concentration Pathways (RCP) to represent large scale GCM projected changes to on-ground systems through downscaling techniques and utilizing hydrologic models. The uncertainty chain for hydrologic studies include the following:
- Emission scenarios;
- GCM structure and parameters;
- GCM initialization conditions;
- Downscaling techniques;
- Hydrologic model structure.
There are different GCMs available globally through a variety of agencies and institutions (more than 50 models within 20 modelling groups) [42]. The majority of studies with the explicit purpose of studying uncertainty have concluded that GCM selection contributes to the high level of uncertainty for hydrologic climate change impact studies [42]. Due to the described factors influencing the uncertainty of GCMs, the results from different GCMs also vary, although all GCMs are modelling the same scenario of climate change. Given this finding, evaluating current infrastructure design standards, undertaking conservative designs is a possible but very difficult/expensive approach. Therefore, understanding the variation in GCMs is a prerequisite for making climate change projections.
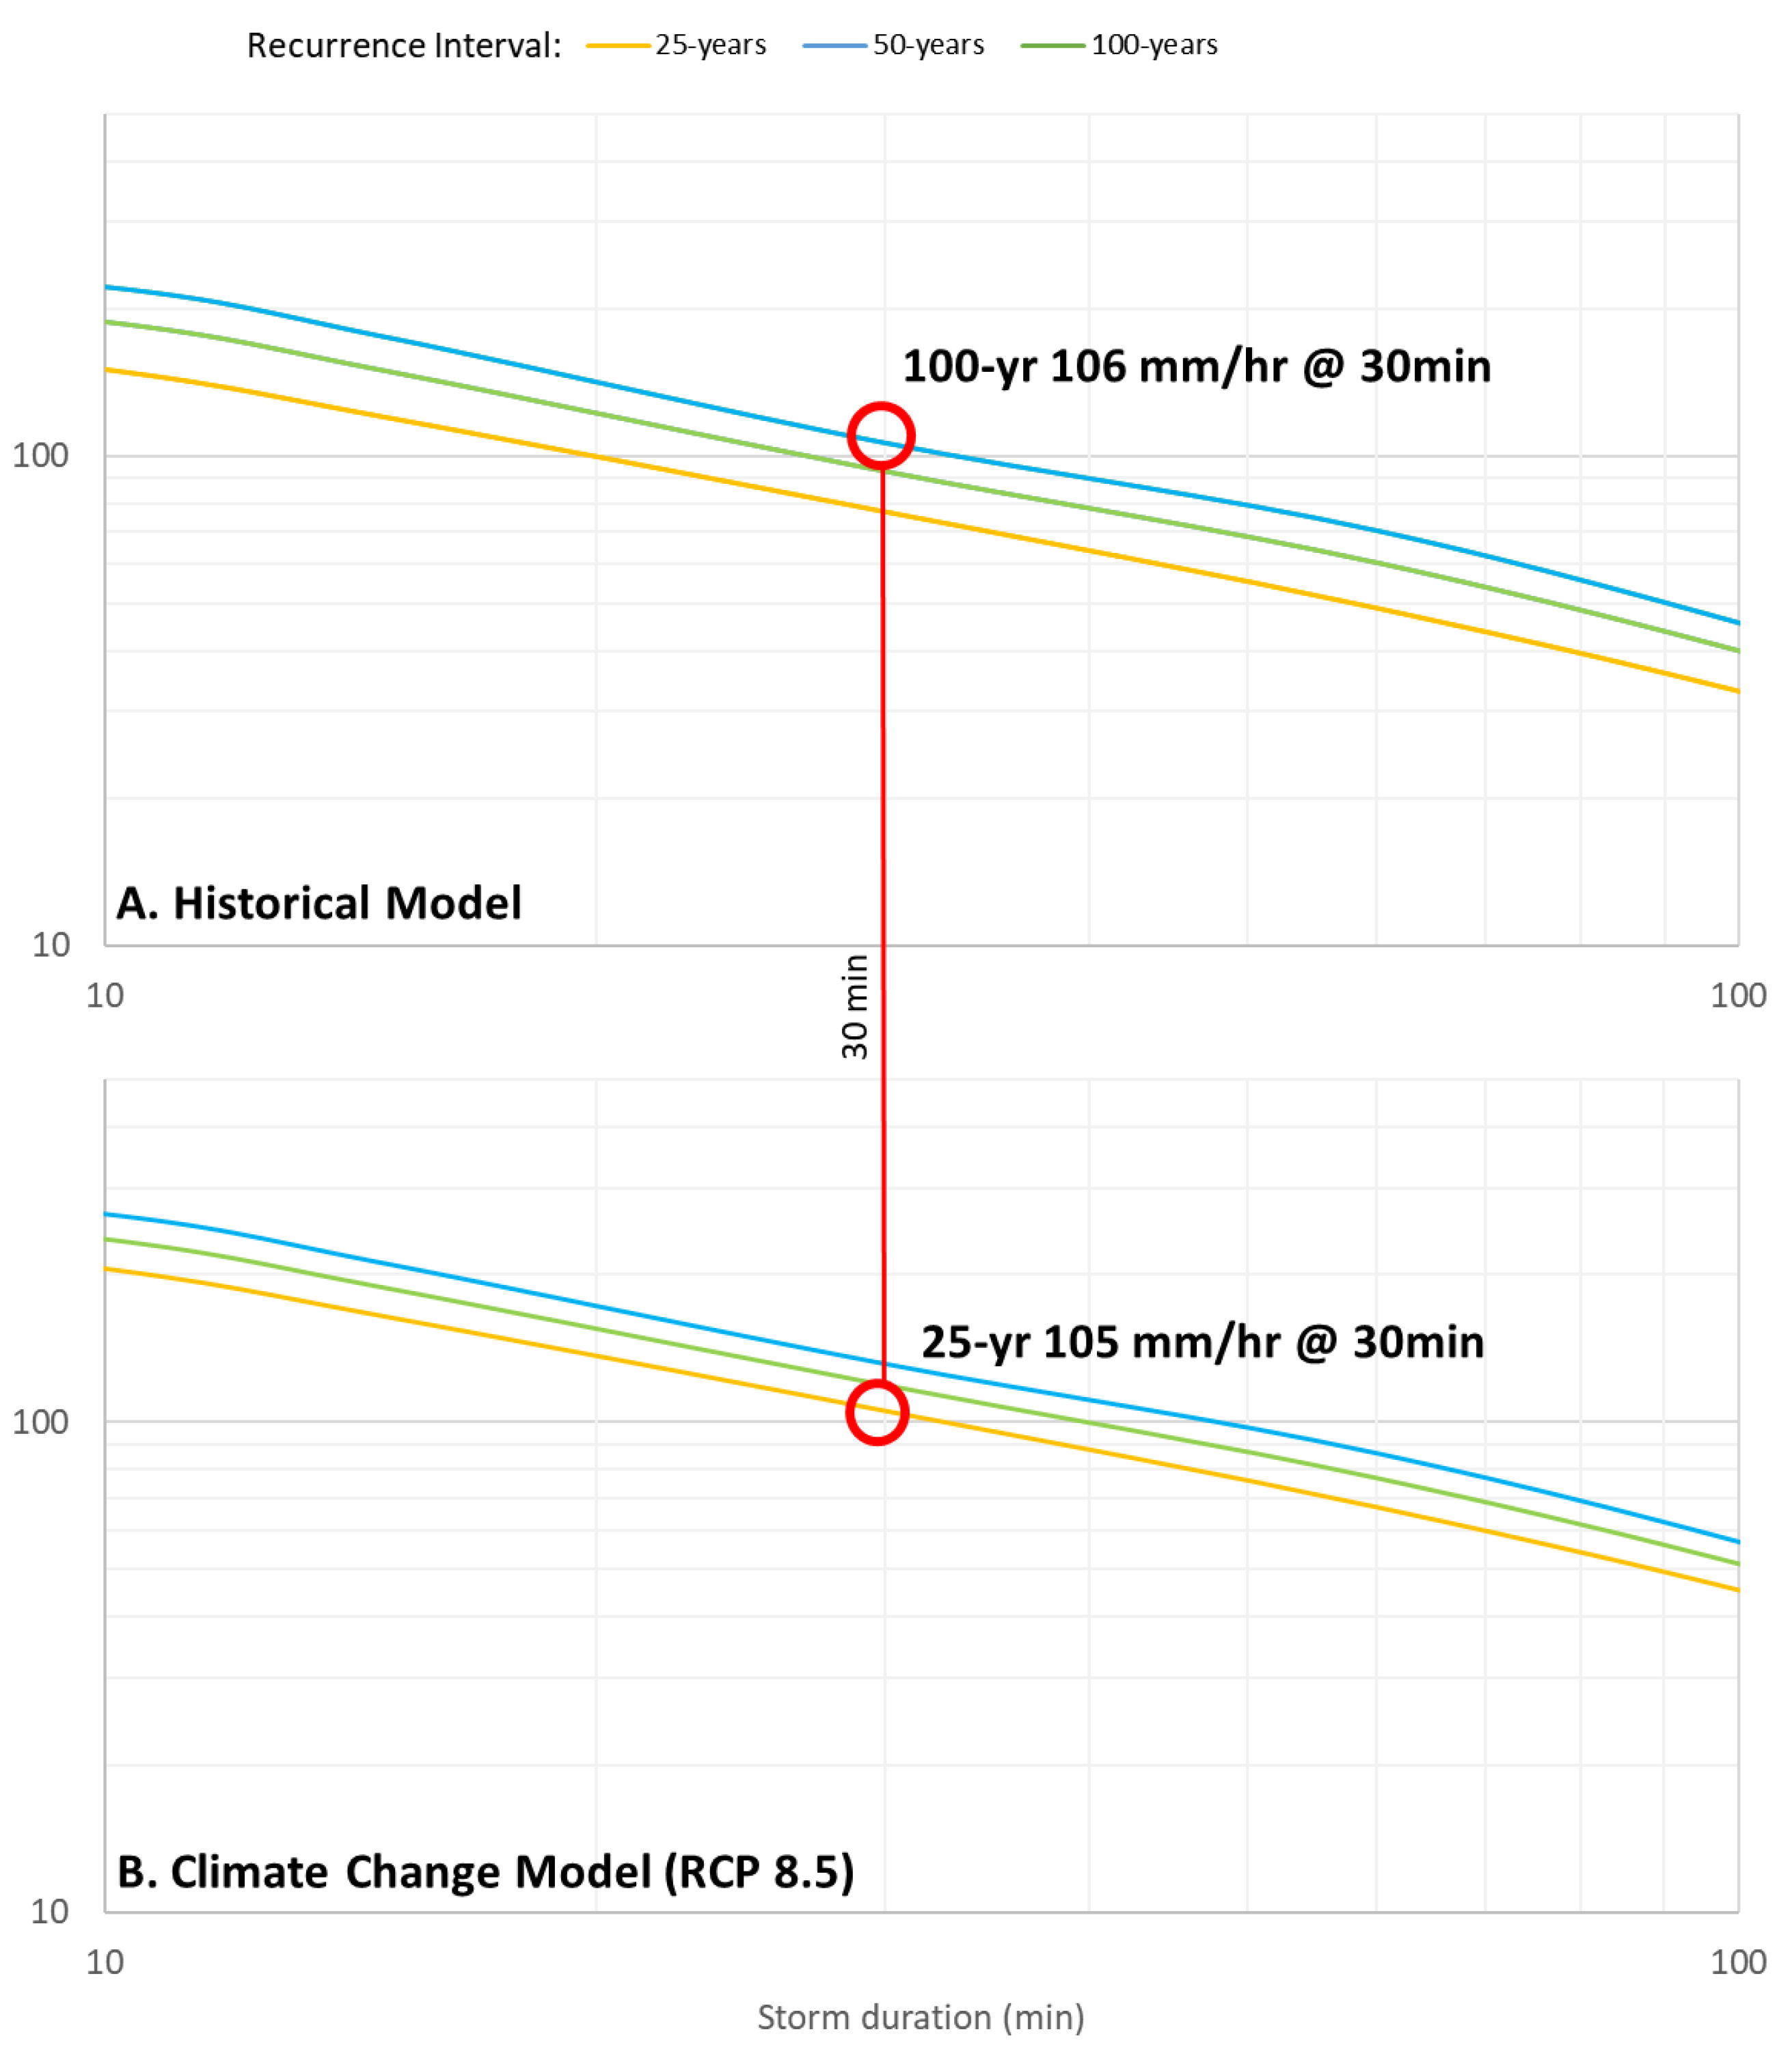
As an example, using the IDF CC Tool 3.5 developed by the University of Western Ontario, Canada, to demonstrate climate change trends [43] for London, Ontario, Canada with the GCM prediction, the IDF (Intensity–Duration–Frequency) partial results for major storm events (25-, 50-, and 100-year) are shown in Figure 6. Projecting from years 2020 to 2070 (based on historical data), the intensities of a 100-year storm are expected to increase by 0.23%/year. In Figure 6, a line connecting and referencing points in both historical model (Part A) and climate change model (Part B), is presented for comparison purposes. The most important information gains from Figure 6 are: in the future (year 2070), the current 100-year storm (30 min duration, 106 mm/h) will become a 50-year storm (i.e., a more frequent event, with 30 min duration, 105 mm/h), indicating the magnitude of the events will intensify under climate change conditions. In words, more extreme storm events are expected in the future. Hence, in the future, events with greater magnitude and frequency are to be expected.
Thus, climate change also increases the challenges using SC options. Without substantial storage retention systems being made available in China, urban flooding issues are destined to become even more frequent.
4. Conclusions
Flood damages are large and increasing; however, understanding the underlying reasons is not easily accomplished without a context. While urban stormwater management is essential to improve the management of flooding in municipalities in urban areas, considering the magnitude of flooding that Chinese cities are experiencing, current Sponge City options cannot be the exclusive source of protective measures. Given this, the One Water concept represents an important opportunity to focus on where Sponge City can be significantly beneficial and provide indications of possibilities, including where environmental issues exist. Without incorporating the principles of One Water, city subsidence and water quality-related issues may not be appropriately incorporated into the overall planning.
As a city grows, in terms of both spatial size and population, more floods will occur on the basis of spatial expansion alone. If a major storm event happened prior to the burgeoning spatial area of urbanization, the damage and impact attributable to this storm would be at a much lesser scale as some of these events would fall on rural areas and, hence, not impact the urban region.
Regarding climate change, in many areas throughout the world, rainfall/storm events are expected to have greater magnitudes and frequencies. An array of climate change models is available, each of which generate different answers. There is uncertainty as to the magnitude of climate change; however, representative results show that a 100-year event will potentially become a more frequent event: e.g., a 50-year recurrence event. Since urban flooding is real, inevitable, pervasive, and intensifying under the impact of both urban growth and climate change, this leads to large and intensifying urban security issues. Additionally, the trade-offs between flooding and the ability to utilize groundwater as a water supply source are complicated. Through the concept of One Water, water security issues are now better recognized as integrated, where actions completed in one aspect will influence other dimensions of water security. Applying One Water on those complicated issues, there are a number of critical concepts identified:
- Sponge City initiatives are helpful in terms of reducing floods and encouraging more infiltration, but these options also have limitations. The limit of Sponge City can be observed primarily in reducing the impacts of severe storm events, but not eliminating urban flooding;
- Infiltration rates introduced by Sponge City initiatives are limited in capability and likely are not sufficient sources to induce groundwater recharge to prevent subsidence unless there is a reduction of groundwater withdrawal;
- Sponge City can help to decrease the spatial extent of flooding (e.g., possibly for events such as 2-year storms), but cannot prevent flooding for major events such as the 100-year storm.
Author Contributions
Conceptualization, E.A.M. and A.Z.J.; methodology, A.Z.J. and E.A.M.; software, A.Z.J.; validation, A.Z.J. and E.A.M.; formal analysis, A.Z.J. and E.A.M.; investigation, A.Z.J. and E.A.M.; resources, E.A.M. and A.Z.J.; data curation, A.Z.J.; writing—original draft preparation, A.Z.J.; writing—review and editing, A.Z.J. and E.A.M.; visualization, A.Z.J.; supervision, E.A.M.; project administration, E.A.M.; funding acquisition, E.A.M. and A.Z.J. All authors have read and agreed to the published version of the manuscript.
Funding
This research was funded by Natural Sciences and Engineering Research Council (NSERC) of Canada under the Postgraduate Scholarship-Doctoral (PGS-D) program and NSERC Discovery Project (#400677) and the University of Guelph Research Leadership Chair funds.
Institutional Review Board Statement
Not applicable.
Informed Consent Statement
Not applicable.
Conflicts of Interest
The authors declare no conflict of interest.
References
- Zevenbergen, C.; Fu, D.; Pathirana, A. Transitioning to Sponge Cities: Challenges and Opportunities to Address Urban Water Problems in China. Water 2018, 10, 1230. [Google Scholar] [CrossRef] [Green Version]
- Xia, J.; Zhang, Y.; Xiong, L.; He, S.; Wang, L.; Yu, Z. Opportunities and challenges of the Sponge City construction related to urban water issues in China. Sci. China Earth Sci. 2017, 60, 652–658. [Google Scholar] [CrossRef]
- Li, H.; Ding, L.; Ren, M.; Li, C.; Wang, H. Sponge city construction in China: A survey of the challenges and opportunities. Water 2017, 9, 594. [Google Scholar] [CrossRef] [Green Version]
- Jiang, Y.; Zevenbergen, C.; Ma, Y. Urban pluvial flooding and stormwater management: A contemporary review of China’s challenges and “sponge cities” strategy. Environ. Sci. Policy 2018, 80, 132–143. [Google Scholar] [CrossRef]
- Steinbock, D. China Daily, China Daily Group, 27 July 2016. Available online: http://africa.chinadaily.com.cn/opinion/2016-07/27/content_26235521.htm (accessed on 10 January 2020).
- Wang, Y.; Sun, M.; Song, B. Public perceptions of and willingness to pay for sponge city initiatives in China. Resour. Conserv. Recycl. 2017, 122, 11–20. [Google Scholar] [CrossRef]
- Zevenbergen, C.; Fu, D.; Pathirana, A. Sponge Cities Emerging Approaches, Challenges and Opportunities; MDPI: Basel, Switzerland, 2018. [Google Scholar]
- Li, X.; Li, J.; Fang, X.; Gong, Y.; Wang, W. Case Studies of the Sponge City Program in China. World Environ. Water Resour. Congr. 2016, 2016, 295–308. [Google Scholar]
- City of Vancouver, One Water. Available online: https://vancouver.ca/home-property-development/one-water.aspx (accessed on 26 February 2020).
- United States Environmental Protection Agency. Reducing Stormwater Scosts through Low Impact Development (LID) Strategies and Practices; United States Environmental Protection Agency: Washington, DC, USA, 2007. [Google Scholar]
- Vrban, S.; Binns, A.; Gharabaghi, B.; McBean, E. Investigation of Potential for Low Impact Development Technologies to Increase Residential Basement Flood Risk in the Greater Toronto Area. J. Hydrol. Sci. 2020. under review. [Google Scholar]
- Food and Agriculture Organization of the United Nations. The Future of Food and Agriculture Trends and Challenges; Food and Agriculture Organization of the United Nations: Rome, Italy, 2017. [Google Scholar]
- Jiang, A.Z.; McBean, E.A. Performance of Lot-Level Impact Development Technologies under Historical and Climate Change Scenarios. J. Hydro-Environ. Res. 2020. under review. [Google Scholar]
- Credit Valley Conservation and Toronto and Region Conservation. In Stormwater Management Planning and Design Guide; Credit Valley Conservation and Toronto and Region Conservation: Toronto, ON, Canada, 2010.
- Jacques, J. Study: New Trees Bring Stormwater Benefits Even Before Full Maturity, Water Environment Federation, 23 November 2020. Available online: https://stormwater.wef.org/2020/11/study-new-trees-bring-stormwater-benefits-even-before-full-maturity/ (accessed on 28 December 2020).
- Bhatti, M.; McBean, E.; Yang, A.L.; Cheng, H.; Wu, Y.C.; Liu, Z.; Dai, Z.N.; Fu, H. Evaluation of a Double Pipe Technology- Performance for Sponge City. Adv. Civ. Eng. Technol. 2018, 1, 1–5. [Google Scholar] [CrossRef]
- Ramamurthy, P.; Bou-Zeid, E. Contribution of impervious surfaces to urban evaporation. Water Resour. Res. 2014, 50, 2889–2902. [Google Scholar] [CrossRef]
- Chen, H.; Huang, J.J.; McBean, E.; Singh, V.P. Evaluation of alternative two-source remote sensing models in partitioning of land evapotranspiration. J. Hydrol. 2021, 126029, ISSN 0022-1694. [Google Scholar] [CrossRef]
- Chaussard, E.; Amelung, F.; Abidin, H.; Hong, S.-H. Sinking cities in Indonesia: ALOS PALSAR detects rapid subsidence due to groundwater and gas extraction. Remote. Sens. Environ. 2013, 128, 150–161. [Google Scholar] [CrossRef]
- Erkens, G.; Bucx, T.; Dam, R.; de Lange, G.; Lambert, J. Sinking coastal cities. In Proceedings of the IAHS, Vienna, Austria, 12 November 2015; Volume 372, pp. 189–198. [Google Scholar] [CrossRef]
- Zhu, L.; Gong, H.; Li, X.; Wang, R.; Chen, B.; Dai, Z.; Teatini, P. Land subsidence due to groundwater withdrawal in the northern Beijing plain, China. Eng. Geol. 2015, 193, 243–255. [Google Scholar] [CrossRef]
- Wang, H.; Mei, C.; Liu, J.; Shao, W. A new strategy for integrated urban water management in China: Sponge city. Sci. China Technol. Sci. 2018, 61, 317–329. [Google Scholar] [CrossRef]
- Singh, R.P.; Wu, J.; Kumar, A.J.; Fu, D. Study on mercury distribution and speciation in urban road runoff in Nanjing City, China. Water 2017, 9, 779. [Google Scholar] [CrossRef] [Green Version]
- Gao, M.; Gong, H.; Chen, B.; Zhou, C.; Chen, W.; Liang, Y.; Shi, M.; Si, Y. InSAR time-series investigation of long-term ground displacement at Beijing Capital International Airport, China. Tectonophysics 2016, 691, 271–281. [Google Scholar] [CrossRef]
- Cao, G.; Han, D.; Moser, J. Groundwater exploitation management under land subsidence constraint: Empirical evidence from the Hangzhou–Jiaxing–Huzhou Plain, China. Environ. Manag. 2013, 51, 1109–1125. [Google Scholar] [CrossRef] [PubMed]
- Ye, S.; Xue, Y.; Wu, J.; Yan, X.; Yu, J. Progression and mitigation of land subsidence in China. Hydrogeol. J. 2015, 24, 685–693. [Google Scholar] [CrossRef]
- Shi, J.; Wang, Z.; Zhang, Z.; Fei, Y.; Li, Y.; Zhang, F.; Chen, J.; Qian, Y. Assessment of deep groundwater over-exploitation in the North China Plain. Geosci. Front. 2011, 2, 593–598. [Google Scholar] [CrossRef]
- McBean, E.; Huang, G.; Yang, A.; Cheng, H.; Wu, Y.; Liu, Z.; Dai, Z.; Fu, H.; Bhatti, M. The Effectiveness of Exfiltration Technology to Support Sponge City Objectives. Water 2019, 11, 723. [Google Scholar] [CrossRef] [Green Version]
- C. V. C. Authority. Credit Valley Conservaion, Low Impact Development. Available online: https://cvc.ca/low-impact-development/low-impact-development-support/lid-faqs-and-resources/ (accessed on 13 February 2020).
- Li, J. A Stormwater Exfiltration System for an Urban Residential Development. In Proceedings of the Novatech 2016 International Conference on Planning and Technologies for Sustainable Urban Water Management, Lyon, France, 28 June 2016. [Google Scholar]
- Liu, H. Long-Term Performance Modelling of Etobicoke Exfiltration System. Master’s Thesis, Ryerson University, Toronto, ON, Canada, 2016. [Google Scholar]
- Sabrina, T. Review of Stormwater Management in Ontario and a Case Study on the Etobicoke Exfiltration System. Master’s Thesis, Ryerson University, Toronto, ON, Canada, 2012. [Google Scholar]
- Guo, Y. Hydrologic Design of Urban Flood Control Detention Ponds. J. Hydrol. Eng. 2001, 6, 472–479. [Google Scholar] [CrossRef]
- LaFleur, D.W.; McBean, E.A. Multi-Stage Outlet Design of Stormwater Retention Facilities. Can. Water Resour. J. Rev. Can. Ressour. Hydr. 1981, 6, 25–50. [Google Scholar] [CrossRef] [Green Version]
- Lo, C.P.; Welch, R. Chinese Urban Population Estimates. Ann. Assoc. Am. Geogr. 1977, 67, 246–253. [Google Scholar] [CrossRef]
- Global Historical Climatology Network (GHCN). NOAA National Centers for Nevironmental Information. Available online: https://www.ncdc.noaa.gov/data-access/land-based-station-data/land-based-datasets/global-historical-climatology-network-ghcn (accessed on 17 August 2018).
- Bush, E.; Gillett, N.; Bonsal, B.; Cohen, S.; Derksen, C.; Flato, G.; Greenan, B.; Shepherd, M.; Zhang, X. Canada’s Changing Climate Report; Government of Canada: Ottawa, ON, Canada, 2019. [Google Scholar]
- Xue-Jie, G.; Mei-Li, W.; Giorgi, F. Climate change over China in the 21st century as simulated by BCC_CSM1. 1-RegCM4. 0. Atmos. Ocean. Sci. Lett. 2013, 6, 381–386. [Google Scholar] [CrossRef]
- Zhan, J.; Huang, J.; Zhao, T.; Geng, X.; Xiong, Y. Modeling the Impacts of Urbanization on Regional Climate Change: A Case Study in the Beijing-Tianjin-Tangshan Metropolitan Area. Adv. Meteorol. 2013, 2013. [Google Scholar] [CrossRef] [Green Version]
- Hennemuth, B.; Bender, S.; Bülow, K.; Dreier, N.; Keup-Thiel, E.; Krüger, O.; Mudersbach, C.; Radermacher, C.; Schoetter, R. Statistical Methods for the Analysis of Simulated and Observed Climate Data Applied in Projects and Institutions Dealing with Climate Change Impact and Adaptation; Climate Service Center (CSC): Hamburg, Germany, 2013. [Google Scholar]
- Vasiljevic, B.; McBean, E.; Gharabaghi, B. Trends in rainfall intensity for stormwater designs in Ontario. J. Water Clim. Chang. 2012, 3, 1–10. [Google Scholar] [CrossRef]
- Livingston, T.; McBean, E.; Marchildon, M. Assessment of the Contribution of General Circulation Model Selection for Hydrologic Impact Study Uncertainty. Clim. Chang. 2020. under review. [Google Scholar]
- Schardong, A.; Gaur, A.; Simonovic, S.P.; Sandink, D. Computerized Tool for the Development of Intensity-Duration-Frequency Curves under a Changing Climate; The University of Western Ontario: London, UK, 2018. [Google Scholar]
Figure 1.
Water flow directions and percentages in (a) predevelopment, natural area; (b) urbanized area. (adapted from US EPA Report No. EPA 841-F-07-006) [10].
Figure 1.
Water flow directions and percentages in (a) predevelopment, natural area; (b) urbanized area. (adapted from US EPA Report No. EPA 841-F-07-006) [10].

Figure 2.
Water flow direction and percentage in an urbanized area with the addition of many SC applications.
Figure 2.
Water flow direction and percentage in an urbanized area with the addition of many SC applications.

Figure 3.
Water flow direction and percentage in (a) urbanized area with large water demand; (b) urbanized area with reduced water demands on a neighborhood basis.
Figure 3.
Water flow direction and percentage in (a) urbanized area with large water demand; (b) urbanized area with reduced water demands on a neighborhood basis.

Figure 4.
Toronto (Canada) storm of 2013 overlain on Beijing, China.

Figure 5.
Annual number of rainy days in Beijing (1951–2016) GHCND: CHM00054511 [36].
Figure 5.
Annual number of rainy days in Beijing (1951–2016) GHCND: CHM00054511 [36].

Figure 6.
Selected IDF curves comparing historical model and climate change model (vertical axis is the rainfall intensity with unit mm/h).
Figure 6.
Selected IDF curves comparing historical model and climate change model (vertical axis is the rainfall intensity with unit mm/h).


Table 1.
Selected stormwater management practices (1: low suitability, 2: medium suitability, 3: high suitability); adapted from CVC and TRC, 2010 [14].
Table 1.
Selected stormwater management practices (1: low suitability, 2: medium suitability, 3: high suitability); adapted from CVC and TRC, 2010 [14].
| Stormwater Management Practices (SC/LID Applications) | Surface Water Balance | Water Quality | Erosion | Water Quantity (Flood Management) |
|---|---|---|---|---|
| Rooftop storage | 1 | 1 | 1 | 3 |
| Parking lot storage | 1 | 1 | 1 | 3 |
| Roof leader to ponding area | 3 | 2 | 2 | 1 |
| Roof leader to soakaway pit | 3 | 2 | 2 | 1 |
| Infiltration trench | 3 | 3 | 2 | 1 |
| Grassed Swales | 3 | 2 | 2 | 2 |
| Pervious pipes | 3 | 3 | 2 | 1 |
| Vegetated filter strips | 3 | 2 | 2 | 1 |
| Rooftop gardens | 1 | 2 | 2 | 1 |
| Wet pond | 1 | 3 | 3 | 3 |
| Artificial wetland | 1 | 3 | 3 | 3 |
| Dry pond | 1 | 2 | 3 | 3 |
| Infiltration basin | 2 | 3 | 2 | 1 |
Table 2.
Cumulative subsidence and maximum subsidence rate for selected cities from 1900–2013 (adapted from Erkens et al. [20]).
Table 2.
Cumulative subsidence and maximum subsidence rate for selected cities from 1900–2013 (adapted from Erkens et al. [20]).
| City | Mean Cumulative Subsidence (mm) during 1900–2013 | Maximum Subsidence Rate (mm/Year) |
|---|---|---|
| Jakarta | 2000 | 179 |
| Ho Chi Minh City | 300 | 80 |
| Bangkok | 1250 | 120 |
| New Orleans | 1130 | 26 |
| Tokyo | 4250 | 239 |
Table 3.
Population and urban area for selected Chinese cities (adapted primarily from Lo et al. [35]).
Table 3.
Population and urban area for selected Chinese cities (adapted primarily from Lo et al. [35]).
| City | Population (1970) | Population (2016–2018) | Population Increase Factor | Old Urban Area (km2) | New Urban Area (km2) |
|---|---|---|---|---|---|
| Guangzhou | 2,500,000 | 11,550,000 | 4.62 | 35 | 3800 |
| Changsha | 825,000 | 4,020,000 | 4.87 | 28 | 738 |
| Hangzhou | 960,000 | 7,970,000 | 8.30 | 21 | 8000 |
| Suzhou | 730,000 | 4,330,000 | 5.93 | 18 | 2743 |
| Wuhan | 2,560,000 | 7,980,000 | 3.12 | 43 | 1528 |
| Shenyang | 2,800,000 | 8,095,000 | 2.89 | 106 | 1502 |
| Hefei | 630,000 | 3,870,000 | 6.14 | 24 | 725 |
Publisher’s Note: MDPI stays neutral with regard to jurisdictional claims in published maps and institutional affiliations. |
© 2021 by the authors. Licensee MDPI, Basel, Switzerland. This article is an open access article distributed under the terms and conditions of the Creative Commons Attribution (CC BY) license (http://creativecommons.org/licenses/by/4.0/).
Share and Cite
MDPI and ACS Style
Jiang, A.Z.; McBean, E.A. Sponge City: Using the “One Water” Concept to Improve Understanding of Flood Management Effectiveness. Water 2021, 13, 583. https://doi.org/10.3390/w13050583
AMA Style
Jiang AZ, McBean EA. Sponge City: Using the “One Water” Concept to Improve Understanding of Flood Management Effectiveness. Water. 2021; 13(5):583. https://doi.org/10.3390/w13050583
Chicago/Turabian StyleJiang, Albert Z., and Edward A. McBean. 2021. "Sponge City: Using the “One Water” Concept to Improve Understanding of Flood Management Effectiveness" Water 13, no. 5: 583. https://doi.org/10.3390/w13050583
Note that from the first issue of 2016, this journal uses article numbers instead of page numbers. See further details here.