Article

Selection of Optimum Pollution Load Reduction and Water Quality Improvement Approaches Using Scenario Based Water Quality Modeling in Little Akaki River, Ethiopia

by
Zelalem Abera Angello
1,*,
Beshah M. Behailu
2 and
Jens Tränckner
1
1
Faculty of Agriculture and Environmental Sciences, University of Rostock, 18051 Rostock, Germany
2
Water Development Commission, Ministry of Water, Irrigation and Electricity (MoWIE), P.O. Box 1076/13 Addis Ababa, Ethiopia
*
Author to whom correspondence should be addressed.
Water 2021, 13(5), 584; https://doi.org/10.3390/w13050584
Submission received: 3 February 2021 / Revised: 18 February 2021 / Accepted: 19 February 2021 / Published: 24 February 2021
(This article belongs to the Special Issue Water Quality Changes of Lakes and Rivers)

Abstract

:
The collective impacts of rapid urbanization, poor pollution management practices and insufficient sanitation infrastructure have driven the water quality deterioration in Little Akaki River (LAR), Ethiopia. Water quality modeling using QUAL2Kw was conducted in the LAR aimed at selecting the optimal water quality improvement and pollution load reduction approaches based on the evaluation of five scenarios: modification of point sources (PS) load (S1), modification of nonpoint sources (NPS) load (S2), simultaneous modification of PS and NPS load (S3), application of local oxygenators and fish passages using cascaded rock ramps (S4), and an integrated scenario (S5). Despite the evaluation of S1 resulting in an average load reduction of Biochemical Oxygen Demand (BOD) (17.72%), PO4-P (37.47%), NO3-N (19.63%), the water quality objective (WQO) in LAR could not be attained. Similarly, though significant improvement of pollution load was found by S2 and S3 evaluation, it did not secure the permissible BOD and PO4-P pollution load in the LAR. Besides, as part of an instream measure, a scenario evaluated using the application of rock ramps (S4) resulted in significant reduction of BOD load. All the individual scenarios were not successful and hence an integration of scenarios (S5) was evaluated in LAR that gave a relatively higher pollutant load reduction rate and ultimately was found a better approach to improve pollution loads in the river. In conclusion, pollution load management and control strategy integrally incorporating the use of source-based wastewater treatment, control of diffuse pollution sources through the application of best management practices and the application of instream measures such as the use of cascaded rock ramps could be a feasible approach for better river water quality management, pollution reduction, aquatic life protection and secure sustainable development in the LAR catchment.

1. Introduction

Urbanization is greatly impacting the river water quality of developing countries driven by factors such as lack of proper sanitation infrastructure and urban drainage networks, poor land use management, the knowledge gap in environmental systems, and managerial incapability [1,2,3]. Nowadays, the beginnings can be seen, though slowly, of urban river pollution becoming a core focus area due to the threats it poses for the water environment through a wide range of physical, chemical, and biological processes [4]. Primarily, the wastewater released from various sources such as industry, household, agricultural and urban land use has augmented the pollution load in the rivers which heavily degrades the aquatic environment [5]. Moreover, the release of nutrients from agricultural land to the surface water resources promotes eutrophication which ultimately depletes the dissolved oxygen concentration [6,7]. Despite the high impact of pollution originating from the point and nonpoint sources on urban rivers of developing countries, pollution management and control has remained unsuccessful mainly due to the direct adaptation of management policies from developed worlds without customization to the local conditions [8].
Owing to a lack of better mitigation and remediation steps as part of the management strategy, most of the river water quality management and pollution control policies in developing countries remain unsustainable. Researchers recommend that sustainable urban river pollution management should incorporate practical remediation approaches. In line with this, water quality models are gaining the advantage in predicting surface water quality pollution management and hence are used in the decision-making process and implementation of the mitigation measures [9]. The conventional way of using these water quality models in pollution management is to link the upstream pollution source with the downstream consequences. The water quality management strategies hence involve a complex set of interdisciplinary decisions based on the changing water quality characteristics where the determination of the complex relationship between the surface water pollution sources and associated water qualities can best be represented by water quality models [10]. The water quality models are also used in wider water quality management applications such as determination of the impact of point and nonpoint source loads on surface water quality [11,12], the determination of the fate and transport of agricultural waste on river water quality [13], and the development of pollutant load reduction strategies and allocation techniques [14].
To date, several water quality models have been developed to solve complex water environmental and pollution management problems. Various researchers used different water quality models and the integration of models to solve such water environmental problems. Yuceer and Coscun [15] used a continuous stirred tank reactor approach to model the water quality constituent dynamics where a good agreement was found between the model predicted and measured values recommending the use of the approach for further pollution management. An integrated model between water quality, hydrological and watershed models such as River Water Quality Model No. 1 (RWQM1), SWAT, and SWMM were evaluated on the Zenne river, Belgium where the modeling output showed that the integrated models can effectively simulate the water quality constituents very well [16]. Despite the development of various water quality models that have wider applications in water environmental management, most of them remain complex, requiring a large set of data which is the bottle-neck, particularly in developing countries with a high hydro-meteorological and water quality data scarcity [17]. Hence, the use of a less complex but relatively accurate water quality model would be a feasible technique for pollution management in urban rivers. In this regard, the QUAL2Kw model is often used for water environmental management and is suggested by many water quality modelers not only due to its simplicity but also its adaptability to various type of catchments, affordable data demand, and effective simulation of constituent dynamics, fate, and transport [18,19,20,21].
In Ethiopia, urbanization has largely triggered the expansion of medium and large-scale industries. In particular, most surface water resources in the capital Addis Ababa are polluted by waste water released from different sources. Industrial waste, which directly discharges waste water with little to no treatment, is one of the major pollution sources. Today, there are over 2000 industries in the city, most of them founded near rivers [22]. Wastewater from households [23] and human excreta and feces wash-outs from open fields [24] contribute a large quantity of waste load to the Little Akaki River (LAR). Runoff through urban drainage is discharging a significant quantity of pollutants at different locations along the length of the river [25,26]. Urban small-scale agricultural activities within the vicinity of the river banks contribute a significant quantity of pollutants washed off from agricultural fields to the LAR [27]. Despite the ratification of the wastewater management plan of Addis Ababa city in 2017 [28] and the development of the charge-per-pollution (CPP) program in 2018 [29] which serves as an economic instrument that provides an incentive to reduce discharges of polluting effluents from point sources, the river’s water quality is deteriorating and hence needs a clear, working and scientifically sound management strategy. The objectives of this research, therefore, were to simulate pollutant transport and dynamics using a modified stream water quality model (QUAL2Kw) in the LAR, to develop a scenario-based water quality management strategy and ultimately select the optimal water quality improvement and pollutant load reduction approaches in the study area.

2. Materials and Methods
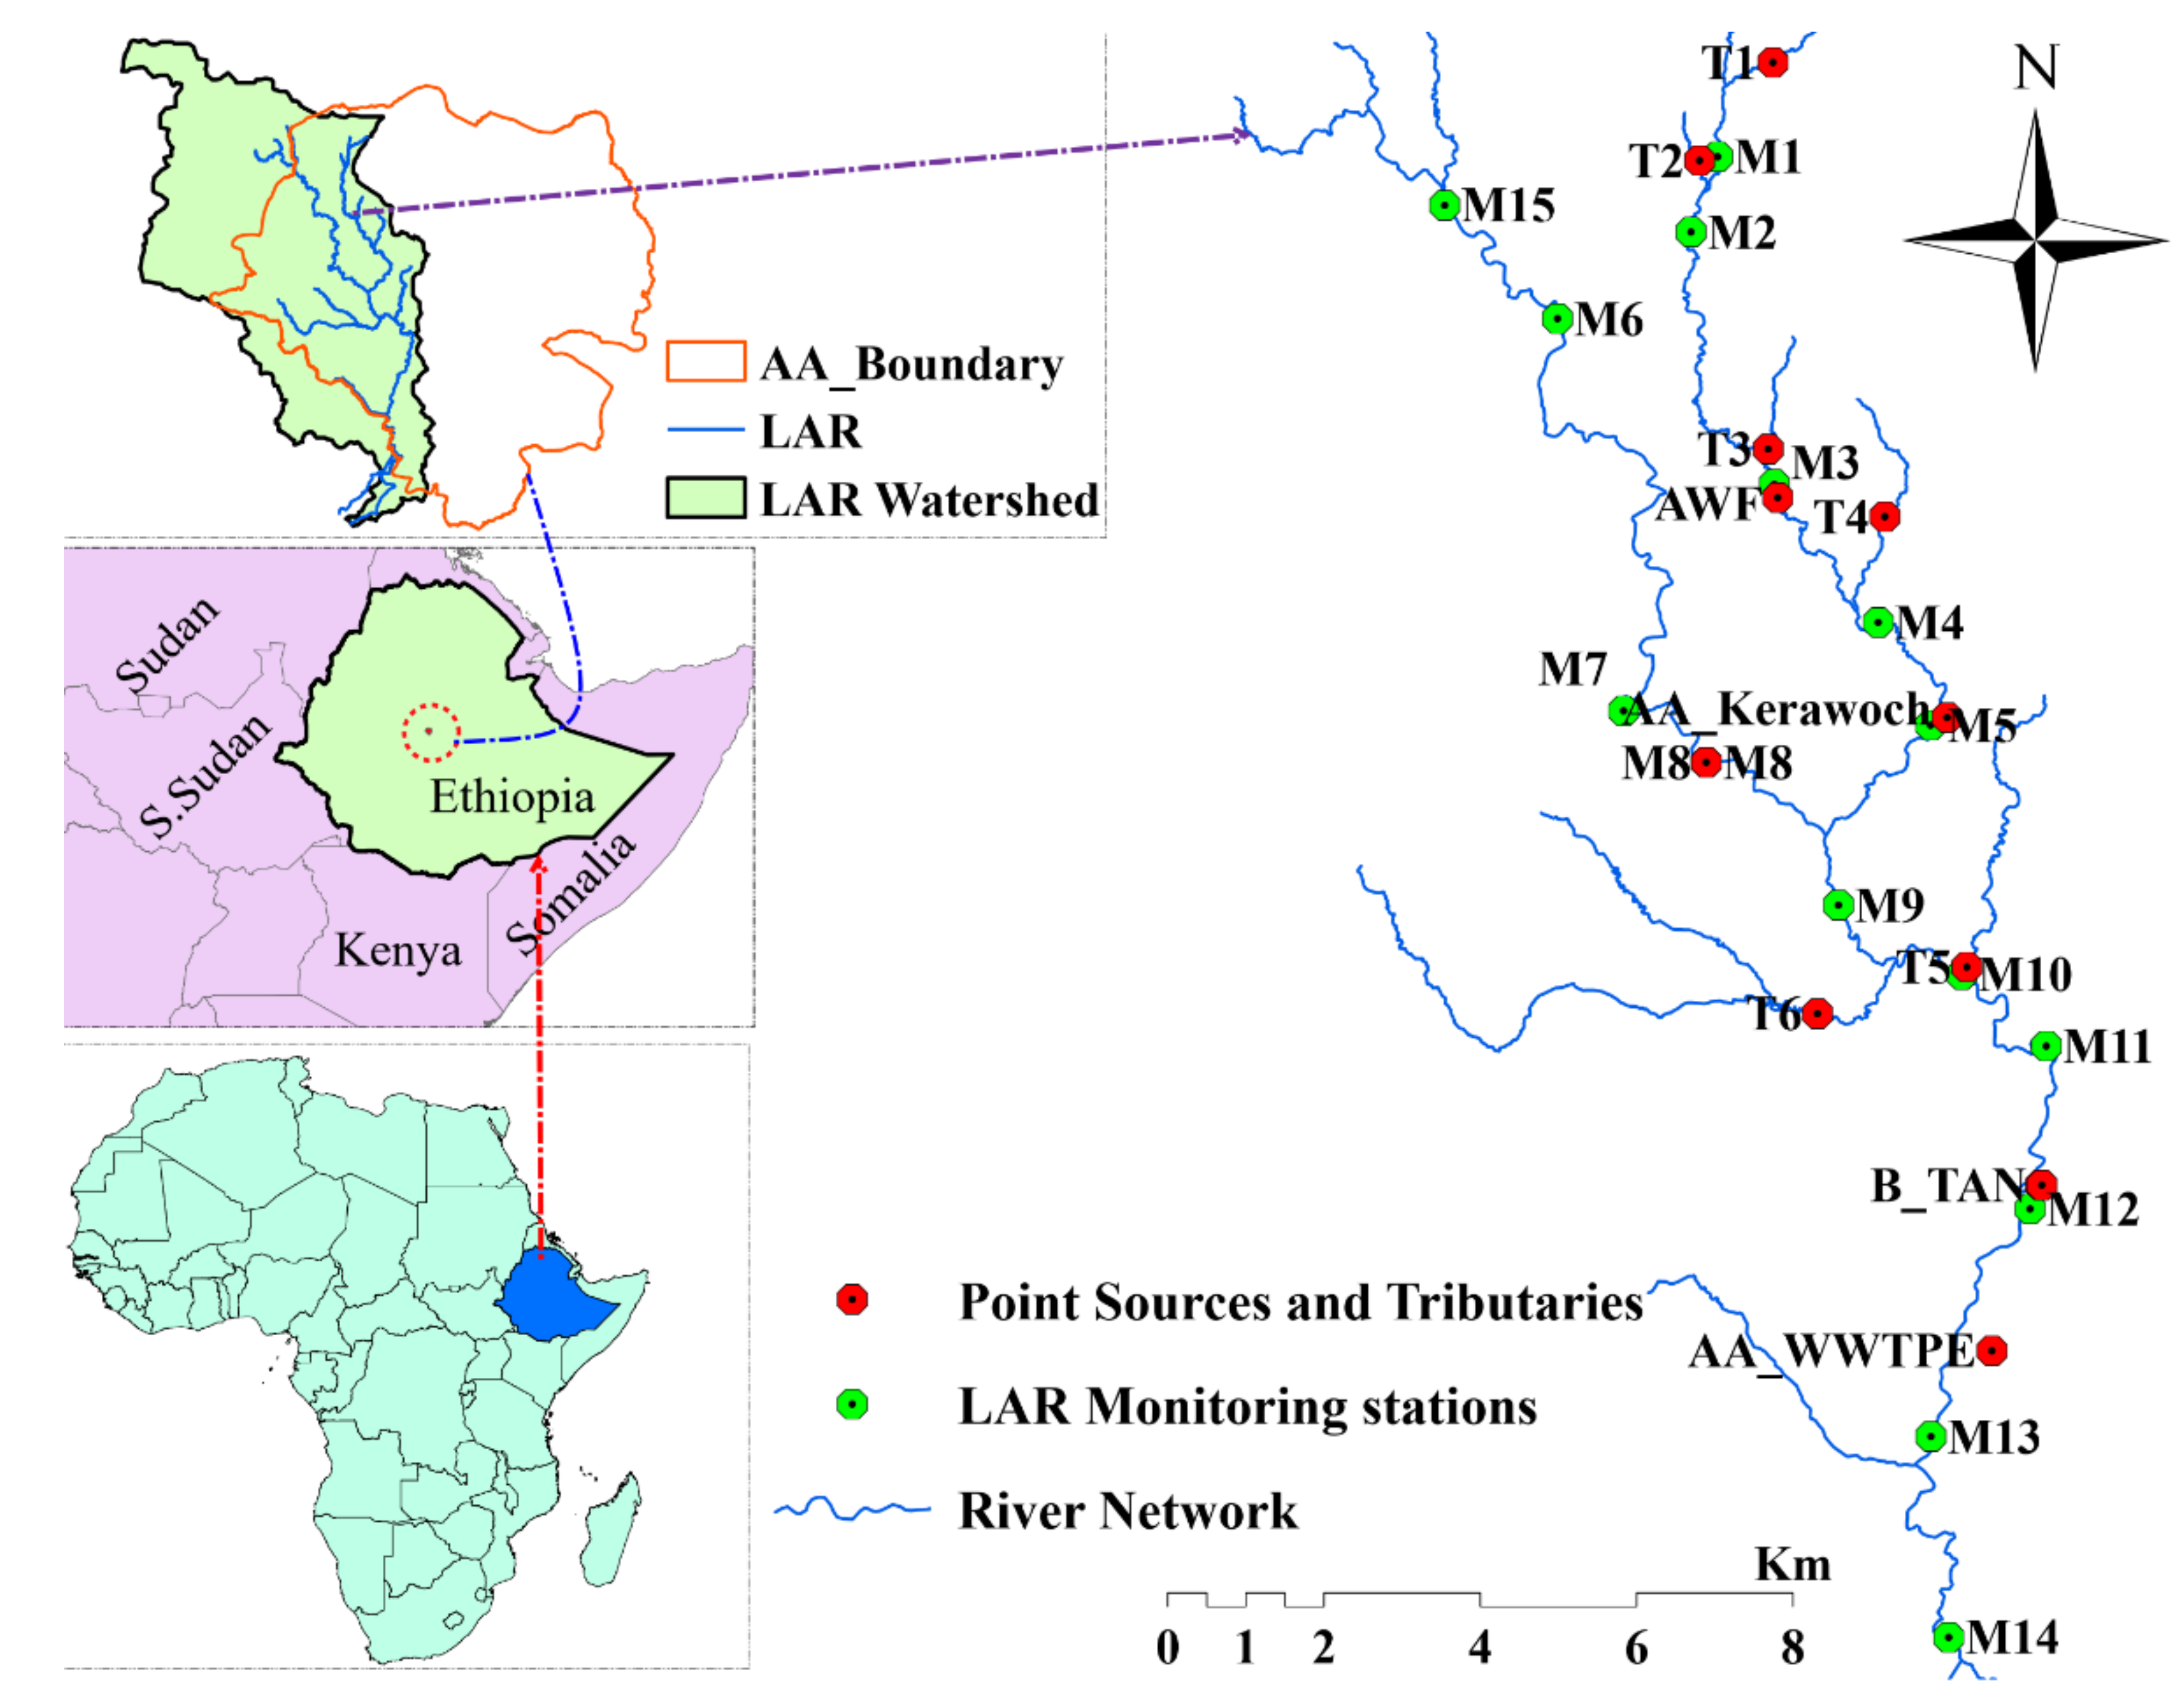
2.1. The Study Area

Addis Ababa, located in the central highlands of Ethiopia, is the country’s capital and largest city. Due to the high rate of urbanization, the city’s solid and liquid waste generation rate is increasing alarmingly where the rivers are serving as an “open sewer”. The city has three major rivers: Kebena River, Big Akaki River (BAR), and LAR, all originating at the foothills of the Entoto mountain and draining down to Aba Samuel Lake. The LAR, one of the Awash River tributaries, flows from the northwest of the city to southernmost Addis Ababa before joining the BAR at Aba Samuel Lake. The LAR consists of several tributaries, heavily polluted mainly by untreated household waste including raw sewage and industrial waste that increase the pollution load in the river. The location of large-scale industries within the vicinity of the river that are discharging their wastewater directly to the river with or without minimum treatment have also augmented the pollution load in the river. Details of all the monitoring stations are presented in Figure 1.

2.2. Sampling and Analysis

A bimonthly water sample collection from April 2018 to March 2019 was conducted at 22 monitoring stations on LAR. All the analytical methods are shown in Table 1 and the analysis was conducted according to [30].

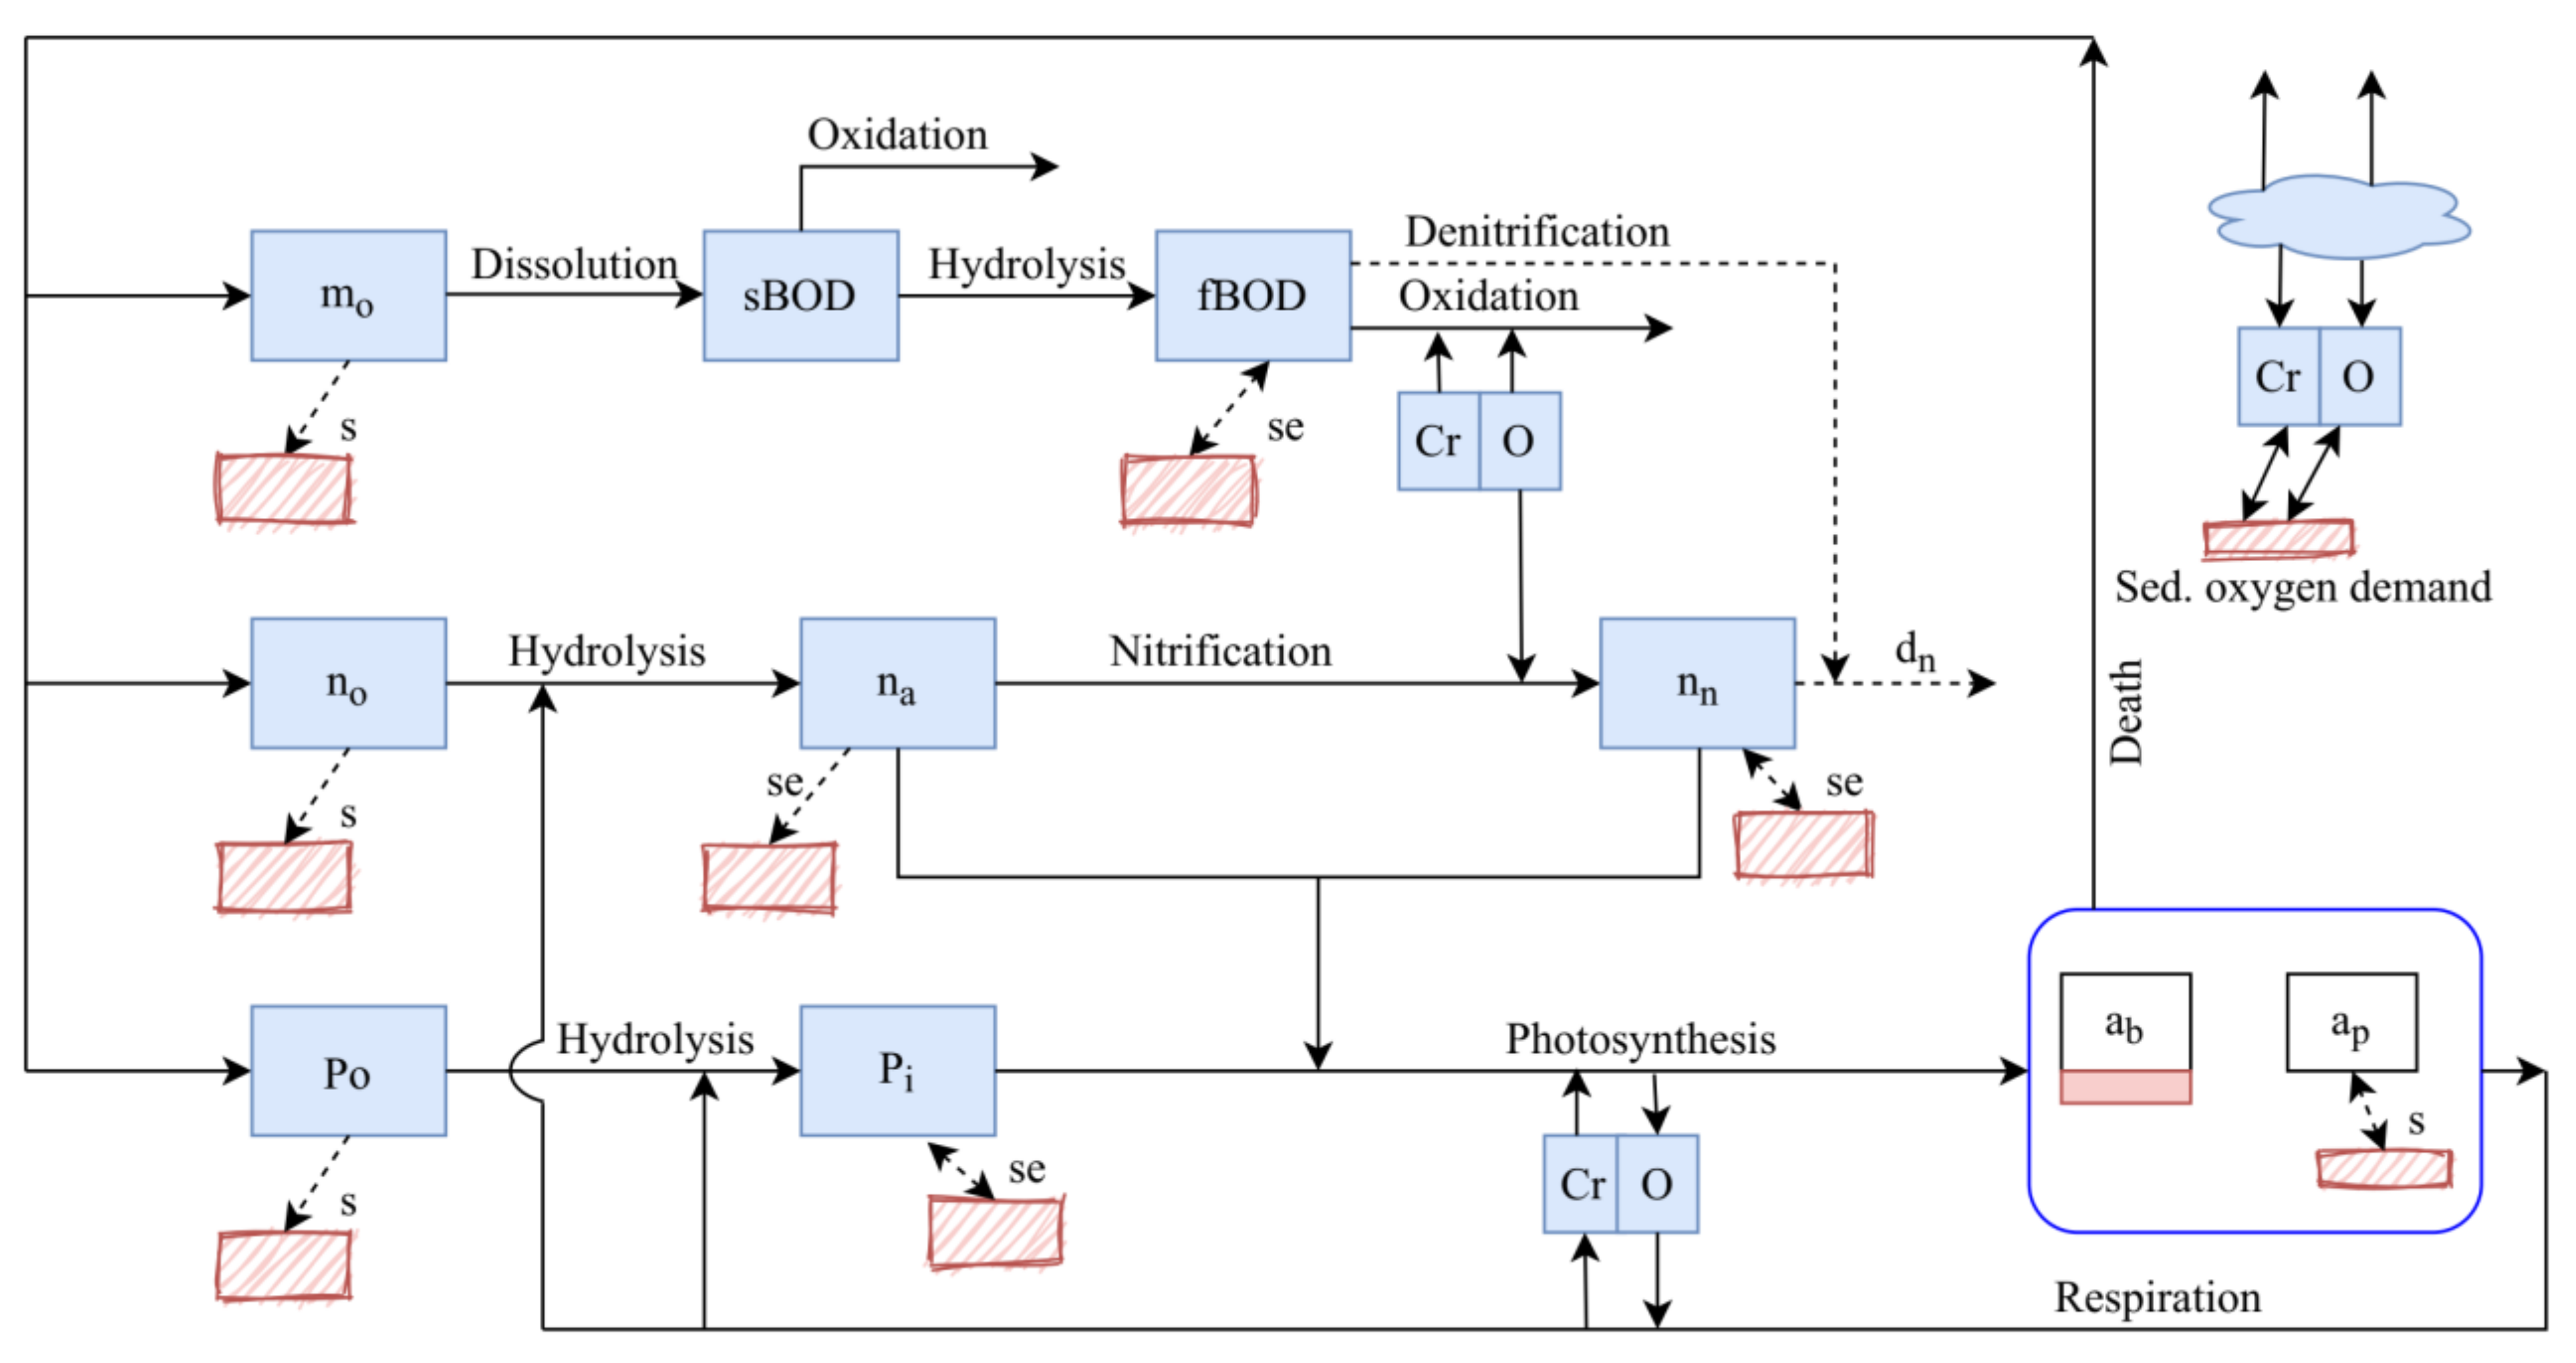
2.3. The QUAL2Kw Model

Water quality models are nowadays becoming efficient in water environmental management, primarily developed to predict the fate and transport of contaminants in water bodies [17]. They are used in many water resource applications such as environmental impact assessment, pollution management and remediation [31], determination of nutrient load, transport and dynamics [32], nutrient control and eutrophication [33], and waste load allocations [34]. The QUAL2Kw is one of such models, a one dimensional, steady-state model for water quality modeling of rivers, estuaries, and well-mixed lakes [35]. The model simulates constituents in surface water using the advective−dispersive approach through a mass balance approach. The model can simulate up to 16 water quality constituents in any combination [36] including DO, BOD (fast and slow), T, pH, EC, suspended solids, alkalinity, total inorganic carbon, TN, ammonia/ammonium, NO3-N, NO2-N, organic and inorganic phosphorus, chlorophyll a, coliform bacteria, one nonconservative constituent (arbitrary), and three conservative constituents [37]. In QUAL2Kw, the dissolved organic nitrogen increases due to detritus dissolution whereas the ammonium nitrogen is gained due to dissolved organic nitrogen hydrolysis and plant respiration and lost due to nitrification and plant photosynthesis. Similarly, organic phosphorus increases due to plant death and is lost via hydrolysis and settling whereas inorganic phosphorus increases due to organic phosphorus hydrolysis and phytoplankton respiration. The QUAL2Kw uses two forms of carbonaceous BOD; slowly oxidizing BOD (sBOD) and fast oxidizing BOD (fBOD) where denitrification is modeled as a first-order reaction when low oxygen concentrations are limiting aerobic BOD degradation [38]. The sBOD is gained due to the detritus dissolution which on the one hand is lost due to oxidation and hydrolysis. On the other hand, fBOD increases hydrolysis of sBOD and is lost due to oxidation and denitrification. Nitrification of ammonia causes an increase in nitrate nitrogen that on the other hand is lost through denitrification and photosynthesis. The detailed water quality state variables interaction is shown in Figure 2. The model simulates the transport of conventional water quality constituents assuming the river as a one-dimensional channel having steady and nonuniform flow. Whereas the flow in QUAL2Kw is assumed as steady, the water quality constituents are calculated by diel water quality kinetics and heat budget dynamically in which the impacts of both point and nonpoint source loads are simulated [39]. The model has the ability to simulate the fate and transport of constituents except the conversion of algal death to BOD [38]. The model calculation is based on a general mass balance equation (Equation (1) that governs the simulation process [10].
d C i d t = Q i 1 V i C i 1 Q i V i C i Q ab , i V i C i + E i 1 V i C i 1 C i + E i V i C i + 1 C i + W i V i + S i
where Qi is the flow at reach i, Qab,i is the abstraction from reach i, Vi is the volume of reach i, Wi is the external load of the constituent to reach i, Si is the source and sink of the constituent due to reaction and transfer, Ei is bulk dispersion coefficient.

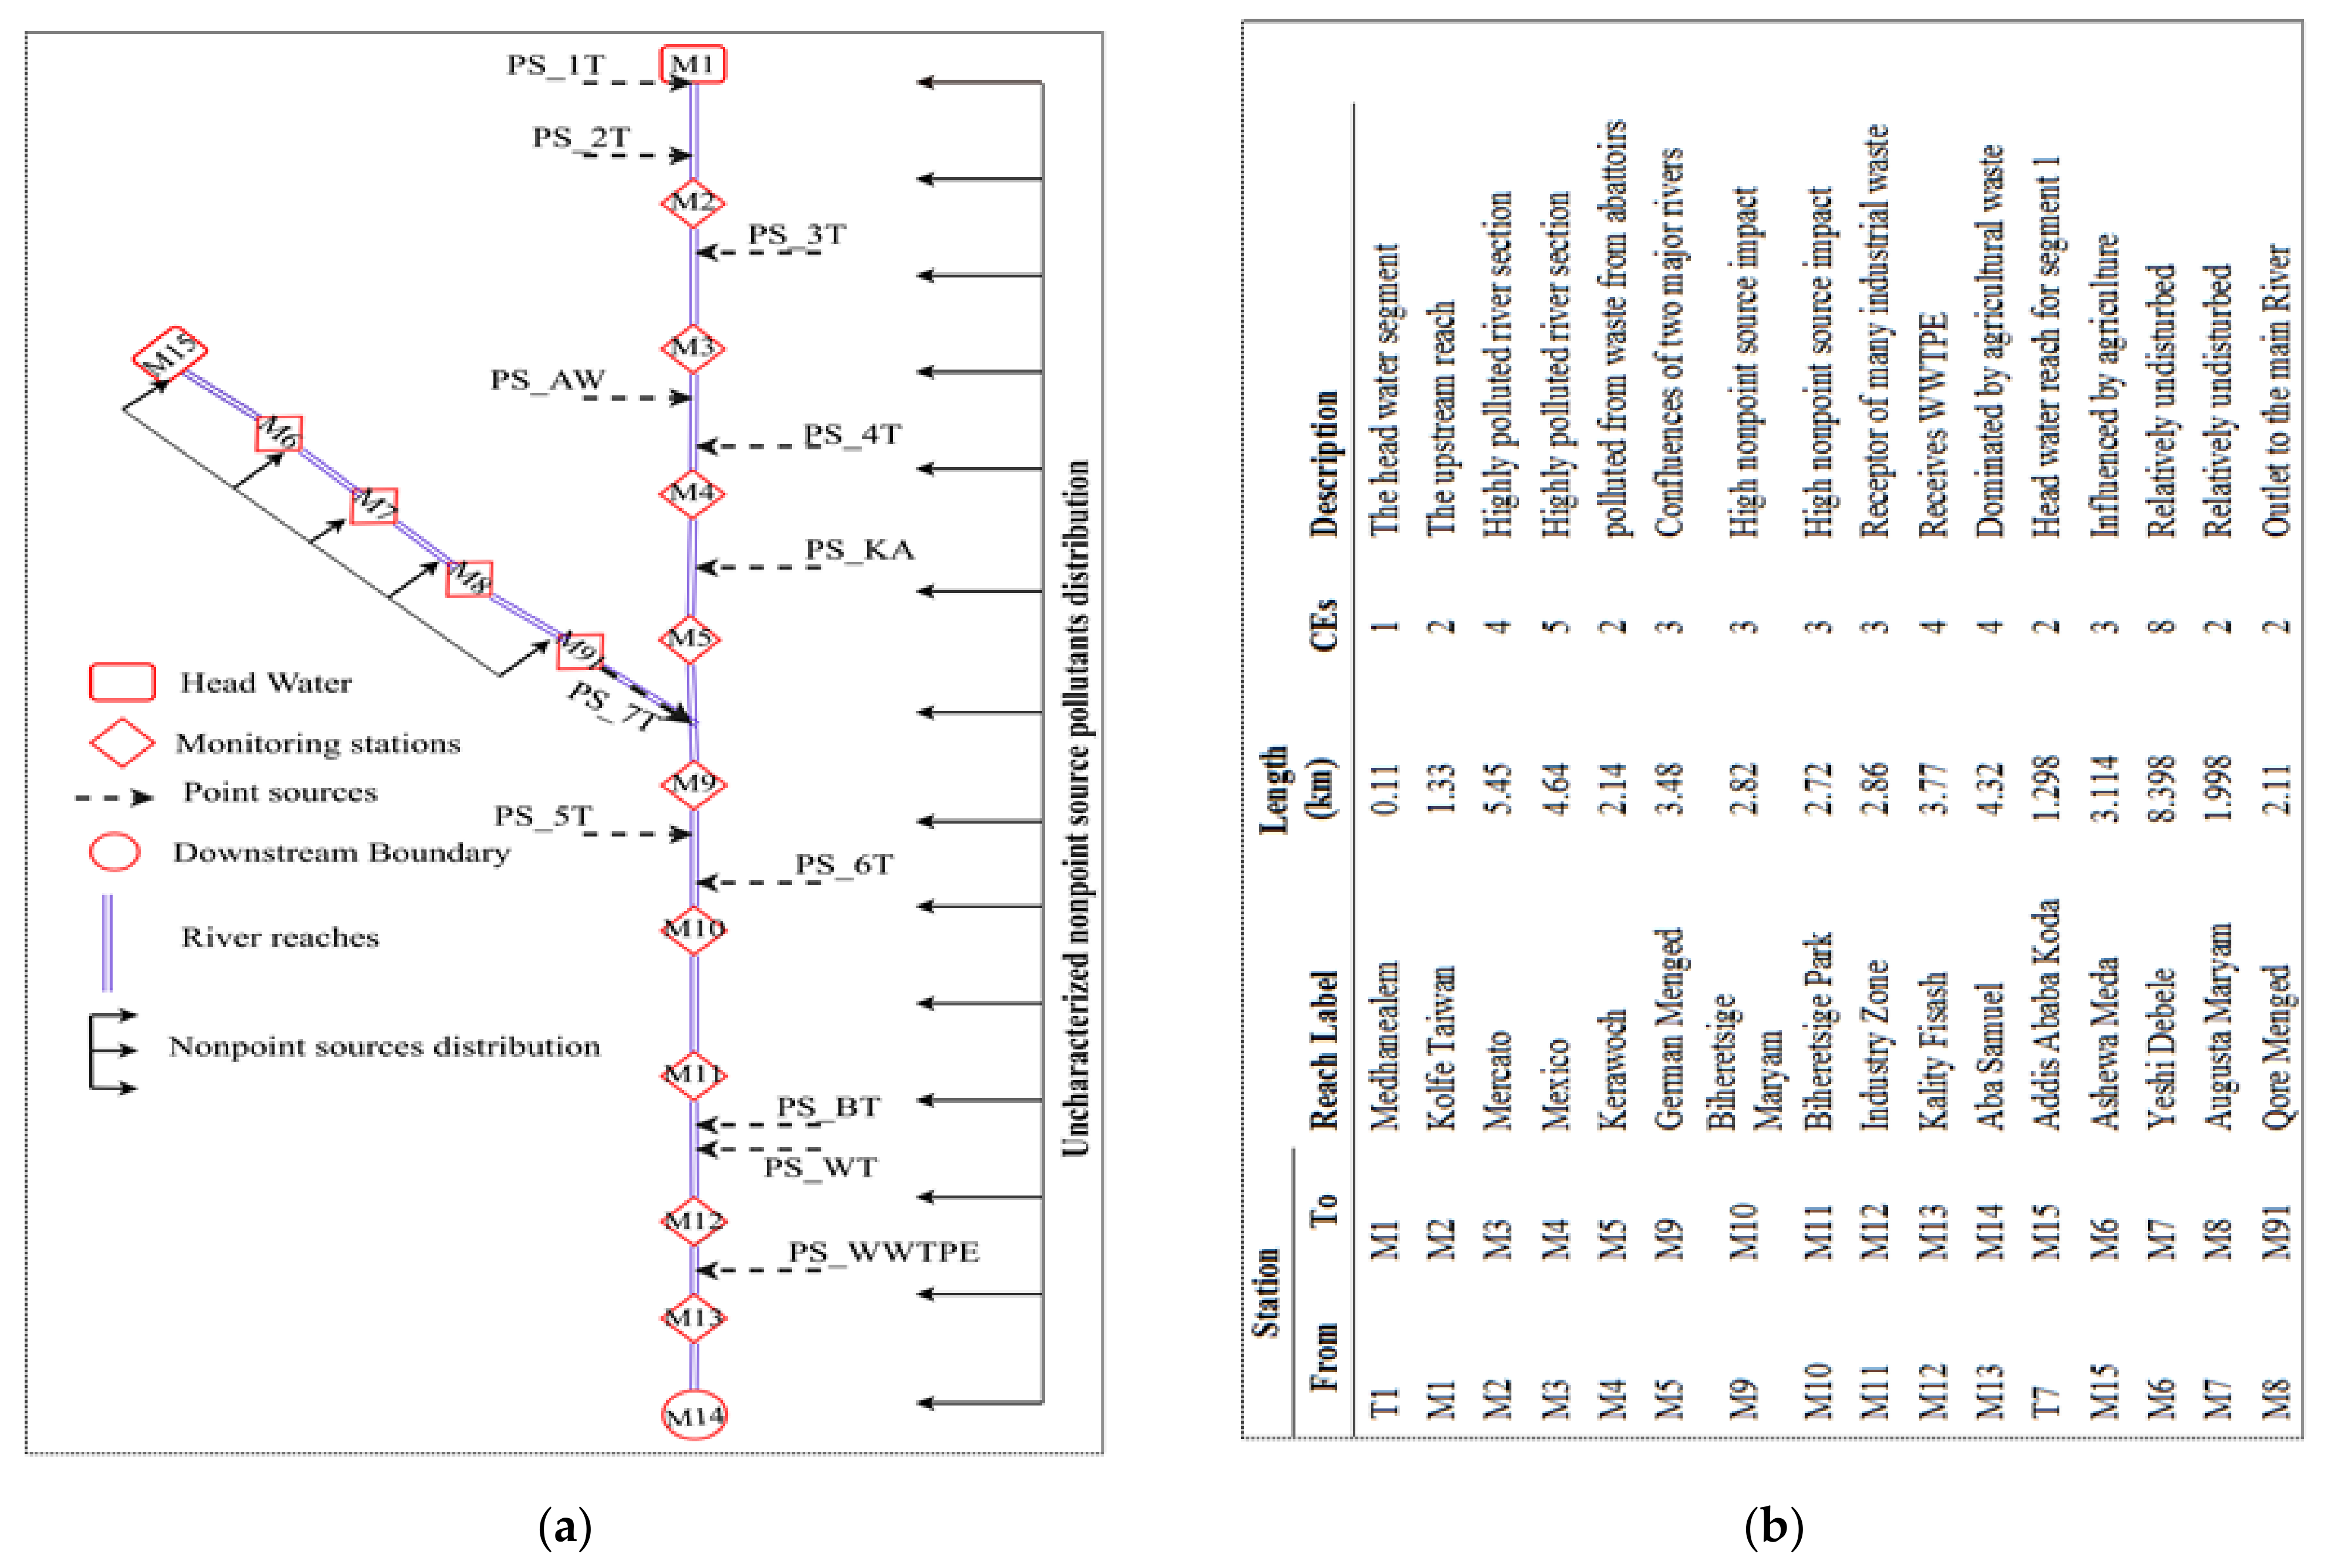
2.4. LAR Segmentation, Labeling, and Discretization in QUAL2Kw

The QUAL2Kw is suitable for both straight and dendritic rivers where it considers a river without tributaries as a series of reaches [40]. The reaches are hence grouped according to their hydraulic and hydro-geometric properties which should hold the same characteristics [41]. In QUAL2Kw, the river reaches play an important role that in turn are classified into several computational elements (CEs) [37]. The reach numbering in QUAL2Kw starts with a 1 beginning from the headwater reach until it reaches the junction with a tributary where another numbering starting with 1 from the tributary headwater. Accordingly, the LAR was divided into 16 reaches (5 in segment 1 and 11 in segment 2) which then were divided into 48 computational elements (15 in segment 1 and 33 in segment 2) based on their hydro-geometric similarity. The nonpoint source was assumed to be uniformly distributed across the river stretch (Figure 3) [42].

2.5. Calibration, Validation, Sensitivity Analysis, and Performance Evaluation of QUAL2Kw

The QUAL2Kw model in LAR was run until the system parameters were properly adjusted and a reasonable agreement between model predicted and actual measurements was achieved. For the constituent simulation in LAR, the calculation time step was chosen 5.625 min so that the model could be simulated with the assumption that the steady-state was maintained and instability was controlled [43]. The integral solution used in QUAL2Kw calibration for LAR was based on Euler’s method. In LAR, the QUAL2Kw was calibrated by adjusting and minimizing the error between the observed and model-predicted value [44] using a monitored water quality constituent and flow by adjusting the parameters that controlled the pollutants and nutrient dynamics. The detritus, inorganic suspended solids, phytoplankton, and pathogens were not simulated due to data limitations and a default value of 100 mg/L was used as alkalinity as calcium carbonate. The reaction rates, heat constants, and hydraulic parameters were used for calibration where the rate and constants were estimated from the literature [45]. In order to assess the ability of the calibrated model to predict water quality constituents, the model was rerun using different data without changing the calibrated parameters. Manual and autocalibration were performed to closely observe the changes in the model parameters through the embedded autocalibration genetic algorithm (GA) by setting the goodness of fit formula (Equation (2). Accordingly, the weighted mean inverse Root Mean Square Error (RMSE) method was chosen as a method of fitness criteria. The individual parameters in the modeling were given weight according to the impact of the parameter on the LAR. The GA control for autocalibration recommended by the QUAL2Kw, PIKAIA, was used by adjusting to the local condition. The autocalibration uses GA to find the best fit between a set of paired parameters by comparing the model predicted and measured water quality constituents.
f x = i = 1 q W i i = 1 q 1 W i [ j = 1 m O i , j m j = 1 m P i , j O i , j 2 m 1 / 2 ]
where: Oi,j = observed value, Pi,j = predicted value, m = number of pairs of predicted and observed values, Wi = weighting factor, q = the number of variables used in the reciprocal of weighted normalized RMSE
The sensitivity analysis was performed in the LAR by applying a ±50% variation on calibrated parameters and analyzing the disturbance and ultimately selecting the most influential parameters. The most influential parameters hence were used as a means to develop a pollution reduction scenario. During the calibration of water quality models, although there are many statistical measures to evaluate the model performance, the performance indicators such as percentage bias or error (PBIAS), coefficient of determination (R2), and Nash−Sutcliff (NSE) are often used. According to Bui et al. (2019), if |PBAIS| < 25% the model simulation is considered “very good”, “good” if 25% ≤ |PBAIS| < 40%, “satisfactory” if 40% ≤ |PBAIS| < 70%, and “unsatisfactory” if |PBAIS| ≥ 70%. Different water quality modelers use different performance evaluation approaches but the recommended methods are |PBIAS| < 25% [46], R2 > 0.5 [11], and NSE > 0.5 [47]. However, it is often challenging to find all three criteria satisfying at the same time. Bui et al. [48] recommended the use of PBIAS over any other evaluation methods in water quality modeling. In the LAR, however, PBAIS (Equation (3) and R2 (Equation (4) were used interchangeably to evaluate the QUAL2Kw model performance and the acceptable ranges are shown in Table 2.
PBIAS = i = 1 n O i P i i = 1 n O i * 100
R 2 = i = 1 n ( O i   O ¯   ) ( P i P ¯ ) i = 1 n ( O i O ¯ ) 2 i = 1 n ( Pi P ¯ ) 2 2
where O and P are observed and predicted values, respectively.

2.6. Input Data and Parameter Estimation for QUAL2Kw in LAR

Data play a key role in the accurate determination of pollutant fate and transport in surface water quality simulation [36]. In the LAR, however, certain parameters were not available and hence the determination depends on the estimation of the values from the literature and other secondary data sources. Accordingly, meteorological data were derived from five weather stations located near the study area and analyzed as per the requirement of the QUAL2Kw model. Hourly wind speed and air temperature data from Bole Observatory station were used for modeling since finer data for other stations nearby were missing. The dew temperature for the study area was calculated using the tool dew01 that uses daily maximum and minimum temperatures and daily average humidity and was calculated by a monthly time step whereas other parameters such as shade and cloud cover were assumed based on the local conditions. In the absence of available data, the sediment oxygen demand (SOD) was estimated from the literature. Previous studies in the study area by Natnael T. Hamda [49] showed that the SOD in the LAR ranged from 5–10 g/m2/d, varying with the depth of the river, and hence in the LAR, SOD was assumed to range from 2–10 g/m2/d during calibration. The sediment thermal conductivity and diffusivity were assumed as 1.82 W/m/°C and 0.048 cm2/s, respectively. All other parameters were defaults taken from Chapra and Pelletier [50] and rates and constants were adopted from USEPA [45]. Due to the scarcity of monitored data, the value of Manning’s roughness coefficient was based on the SWAT calibration result which also agreed with the previous literature in the study area ranging from 0.02−0.045 that varied from upstream to downstream. The oxygen reaeration model selected was internal where the result highly depended on the hydraulic parameters. All other rate parameters and constants such as the reaction rate, decay rate, reaeration rate, death rate, settling velocity, nitrification and denitrification rate, oxidation rate, hydrolysis rate, and temperature correction were all calibrated based on the literature and user manual [37].

2.7. Development and Evaluation of Pollution Reduction Scenarios in QUAL2Kw

Different studies reveal that the use of pollution reduction scenarios integrated with water quality models could help in the development of better water quality management programs and assist the decision-making process [21,40,43,51]. The conventional approach of using this mathematical model in pollution management is usually based on the principle of linking the upstream pollution sources with the downstream responses (consequences). However, most water pollution management programs in developing countries fail due to lack of clear policy and strategy where widespread evidence of water environment destruction associated with the uncontrolled human and industrial waste discharge prevails [52]. In this regard, it is often imperative that reduction of pollution load emitted from the point and diffuse sources to the rivers are prioritized during water quality management. However, despite the availability of environmental laws, waste release control, mainly from industry and urban land use is increasing in many developing countries hindering the implementation of sustainable river water quality management and pollution control. Strong environmental law that limits the discharge of industrial wastewater, such as through the use of advanced wastewater treatment plants could greatly reduce the pollution load released to the rivers. Equally important but neglected is the role of the diffuse source load where a significant pollution load is contributed by various land uses and remains the major pollution source in developing countries [53,54]. Reduction of the pollution load from diffuse sources by implementing best management practices and catchment protection such as the creation of a riverside buffer zone would be a better option for ecological restoration [55]. In-stream measures such as the use of cascaded rock ramps or, if integrated with a weir, often named ramped weirs [56], can support the self-cleaning efficiency and improve the ambient water quality by creating water head that initiates the supply of oxygen. Besides, the structures can also restore natural ecology and create a safe environment for aquatic organisms such as fish by allowing free passage between upstream and downstream even during critical times [57]. The instream measures would not be sufficient, however, without reducing the incoming loads from pollution sources and sustainable water quality management and pollution control could not be maintained. Ecological restoration of a polluted water environment therefore needs integrated management of all the pollution sources and instream measures. A successful river water ecological restoration program hence is based on the mitigation and remediation approaches incorporating all the source-based pollution management options and instream measures. However, most water quality management programs in developing countries are not successful due to inappropriate, poorly articulated, and narrowly focused mitigation measures. The water quality remediation techniques need to be incorporated as part of the pollution management programs which involve assessing the relative significance of available point and nonpoint sources, determining the specific remediation objectives, and assessing various management options in cost-benefit terms for pollution source reduction [58].
In the LAR, five hypothetical scenarios were evaluated for the development of pollution control and management strategy and to ultimately select the optimal pollution reduction scenario or a combination of scenarios. The scenarios were evaluated on selected and most common pollutants identified by the respective government office of Ethiopia, based on factors such as the pollutant’s toxicity, the threats they pose to water bodies and most importantly the cost of measuring the concentrations and volumes accurately [29]. Hence, the scenarios were evaluated based on the modification of organic pollutant (BOD), and nutrient (NO3-N and PO4-P) load from the point and nonpoint sources. Besides, instream measures, such as a cascaded rock ramp making a head difference of 2 m were evaluated as part of the pollution reduction and ecological restoration approach. Once all the scenarios were evaluated individually and integrally, an optimum scenario that best satisfied the water quality objective (WQO) for the parameters was selected and the best combination of the individual constituent reduction rates was determined based on an iterative and trial and error calibration on QUAL2Kw. Since it is difficult to fully meet the standard limits for the constituents in developing countries like Ethiopia, a value close to the permissible limits was used as a WQO. Accordingly, the WQOs for the parameters BOD (10 mg/L), PO4-P (1 mg/L), and NO3-N (50 mg/L) were determined in QUAL2Kw until the simulated constituents load fell under the standard guideline (WQO).

2.7.1. Scenario 1: Modification of Point Sources Load

The first scenario (S1) was developed in consideration that nearly all of the point sources in the study area have no treatment plants [26,59]. Accordingly, the scenario evaluation was based on the average removal rate of pollutants in a wastewater treatment plant that put the LAR water quality within the WQO. Hence, the scenario applied for the three selected parameters (BOD, PO4-P, NO3-N) was based on the average wastewater treatment plant removal efficiency. Different kinds of literature found different pollutant removal efficiencies in wastewater treatment plants. For example, a horizontal surface flow constructed wetland efficiency tested in a brewery factory in Addis Ababa, Ethiopia, has resulted in more than 87% BOD removal rate [60]. Similarly, BOD removal using an activated sludge plant in South Africa was found to have an efficiency of 90–95% [61] whereas the BOD removal rate using activated carbon on palm waste was found to have more than 92%. On the other hand, the study performed on the dairy industry in Ethiopia using horizontal subsurface flow constructed wetland had a BOD removal efficiency of 65.2 to 84.2% [62] whereas a slaughterhouse BOD removal showed 91.6% efficiency [63]. Similarly, the removal efficiency of treatment plants for NO3-N using chemical treatment may range from 10% to 98% based on the type of chemical used [64], whereas the integrated biological-chemical treatment of PO4-P was found to have an efficiency of 60–70% [65]. Studies in Ethiopia showed that the nutrient removal rate was lower than the organic pollutant removal rate [63]. In general, the studies revealed the BOD removal rate ranged from 65% to 95% and the nutrient removal rate ranged from 10% to 98%. Hence scenario 1 was evaluated using an assumed average removal rate of BOD (70%), NO3-N (50%), and PO4-P (50%) and was assigned as S1 (0.7BOD + 0.5NO3-N + 0.5PO4-P) to represent their respective removal rates in a treatment plant.

2.7.2. Scenario 2: Modification of Nonpoint Source Load

The nonpoint source loads are the dominant loads in the LAR catchment that contribute the highest pollution load to the river [66] and the proportion is seen even more than 69% in Korea [67]. For effective management of water quality and pollution control in the river, the determination of nonpoint source load is necessary [68]. Hence, the second scenario (S2) evaluation was based on the modification of nonpoint source load. Many studies suggest varying removal efficiencies for BOD, PO4-P, and NO3-N using best management practices. Wang et. al. [55] studied the nitrogen and phosphorus removal efficiency of buffer strips and found a reduction rate of 12.12% to 70.54% and 14.38% to 73.3%, respectively. Similarly, the integration of constructed wetlands, retention ponds, grassed waterways, and buffer strips applied on Wuliangsuhai watershed, China, for the same parameters showed the reduction rates of nitrogen and phosphorus were found to be 40–80% and 50–90%, respectively [69]. On the other hand, the use of an infiltration trench was found to have a removal efficiency of BOD (91.1%), nitrogen (87.1%), and phosphorus (91.2%) [67]. Hence in consideration of the best management practices’ adaptability to the local conditions, the S2 was evaluated using an assumed average nonpoint sources load reduction of BOD (80%), NO3-N (60%), and PO4-P (60%). The scenario was designated as S2 (0.8BOD + 0.6NO3-N + 0.6PO4-P).

2.7.3. Scenario 3: Simultaneous Modification of Point Source and Nonpoint Sources Load (S1 + S2)

In a country where both point and nonpoint sources, individually and collectively, significantly affect the water environment, a sufficient change in the water quality and the development of a better management system due to the modification of one of the pollution sources is highly unlikely. For that reason, S3 combines the measures of S1 and S2 simultaneously.

2.7.4. Scenario 4: Application of Local Oxygenators—Instream Measures

For effective water quality management and ecological restoration, source-based pollution control should be supported by instream measures providing ecological niches, improved physical aeration, ecological passability, etc. For example, the application of local oxygenation techniques through the use of structures such as cascaded rock ramps at critical pollution locations could significantly reduce the pollution load in a river and allow free movement of aquatic organisms such as fish [70]. In principle, the flow of polluted water over such structures creates head and initiates oxygenation and hence reduces the pollutant load in a river and the amount of oxygen to be added to the river depends on the height and type of the structure to be applied [50]. Even though priority should better be given to the reduction of emissions from the point and nonpoint sources, instream measures, such as the application of cascaded rock ramps create not only a smooth transition of aquatic life between upstream and downstream but also bring substantial benefits to the ecology of the catchment [71]. It is also one of the widely used approaches for ecological restoration nowadays. Scenario 4 (S4) was hence based on the application of cascaded rock ramps creating a total head difference of 2 m and width varying with the width of the LAR with a gentle slope for the free passage of fish and other aquatic organisms at selected critical pollution locations which could also enhance oxygenation in the river. In contrast to S5 (see below) S4 is applied solely, i.e., without source-based pollution control.

2.7.5. Scenario 5: Integrated Scenario

Scenario 5 (S5) is the combination of all scenarios (integrated scenarios). All hypothetical scenarios were individually and integrally evaluated and the optimum combination was selected for the LAR. The S5 was hence based on the simultaneous evaluation of the source-based modifications and the instream measures. Finally, the selection of the optimum pollution reduction approach and the reduction rate was based on the iterative simulation in the QUAL2Kw.

3. Results and Discussion

3.1. Point and Nonpoint Source Loads in LAR

The point and nonpoint source pollutant load is one of the major inputs of the QUAL2Kw. In the LAR, eleven point sources were used including highly polluted tributaries. The Kality wastewater treatment plant effluent is one that contributes a significant quantity of pollution load into the LAR. Similarly, highly polluted tributaries of the river also carry a large quantity of pollutant load to the LAR, most of them carrying high domestic and industrial wastewater. On the other hand, the nonpoint source load used in QUAL2Kw was estimated by integrating chemical mass balance (CMB) and watershed model, PLOAD, based on the export coefficient of pollutants, and the detailed approach was summarized in the previous work of the authors [66]. The summary of point and nonpoint source load in the study area is shown in Table 3.

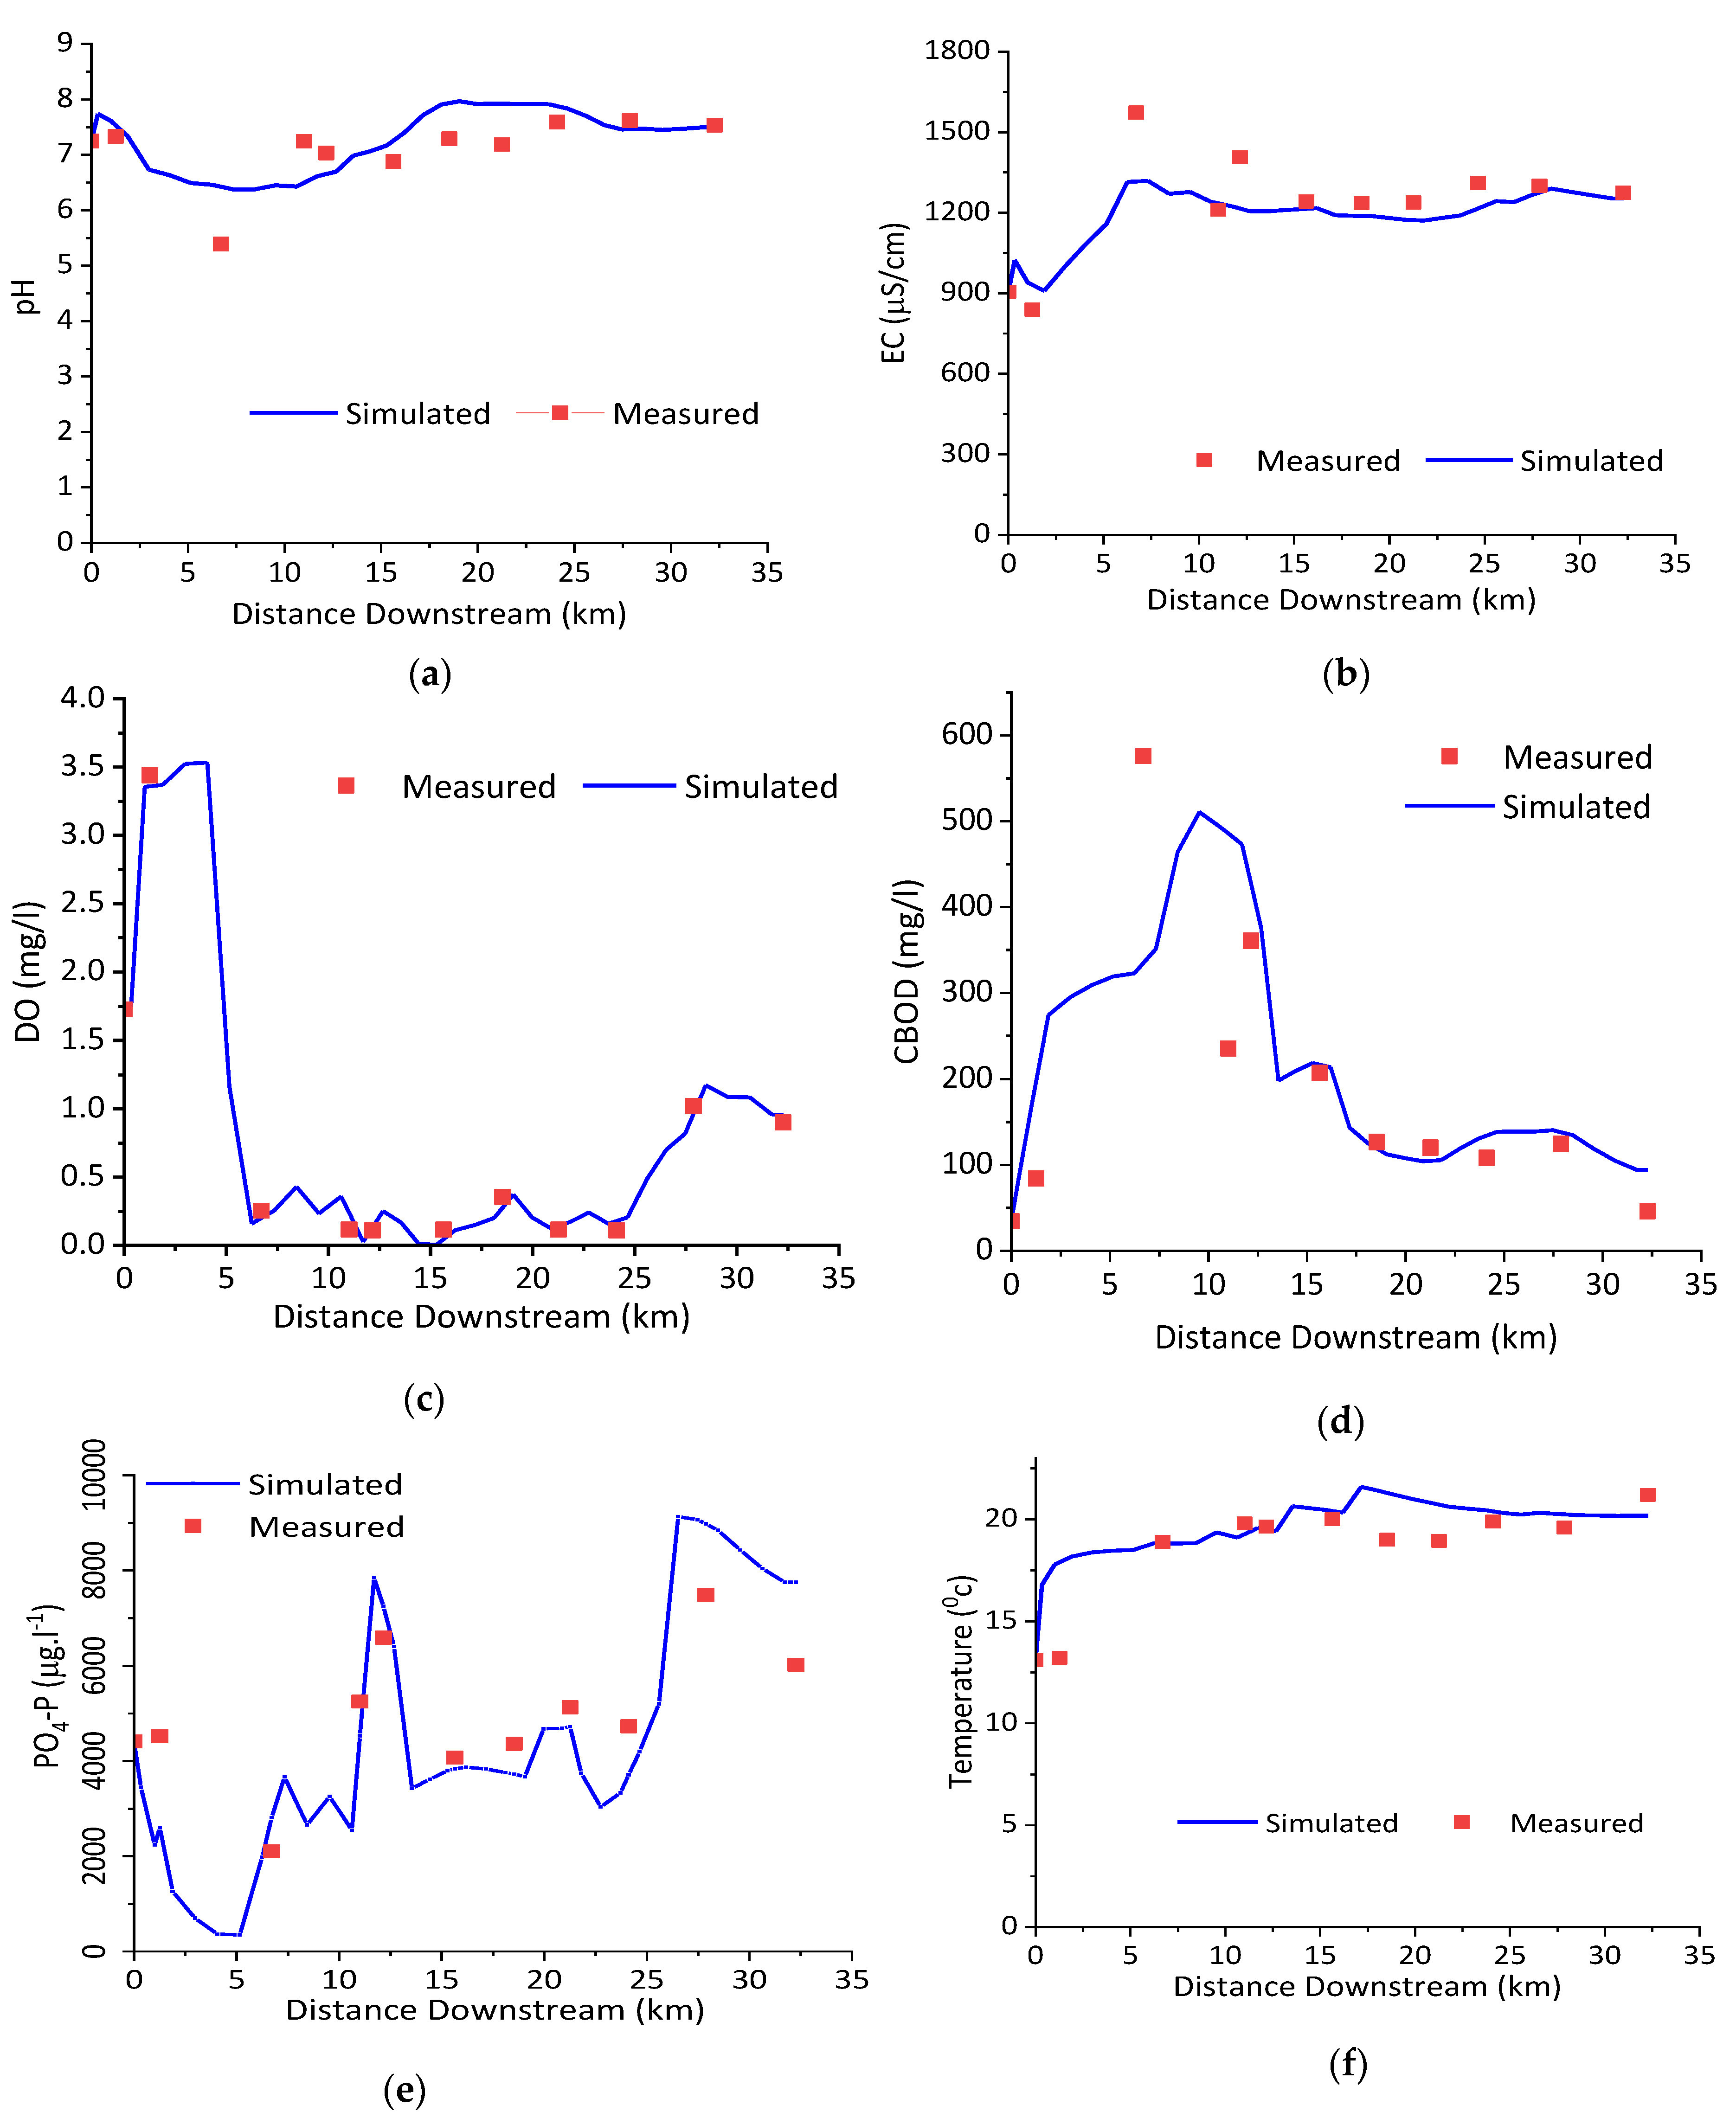
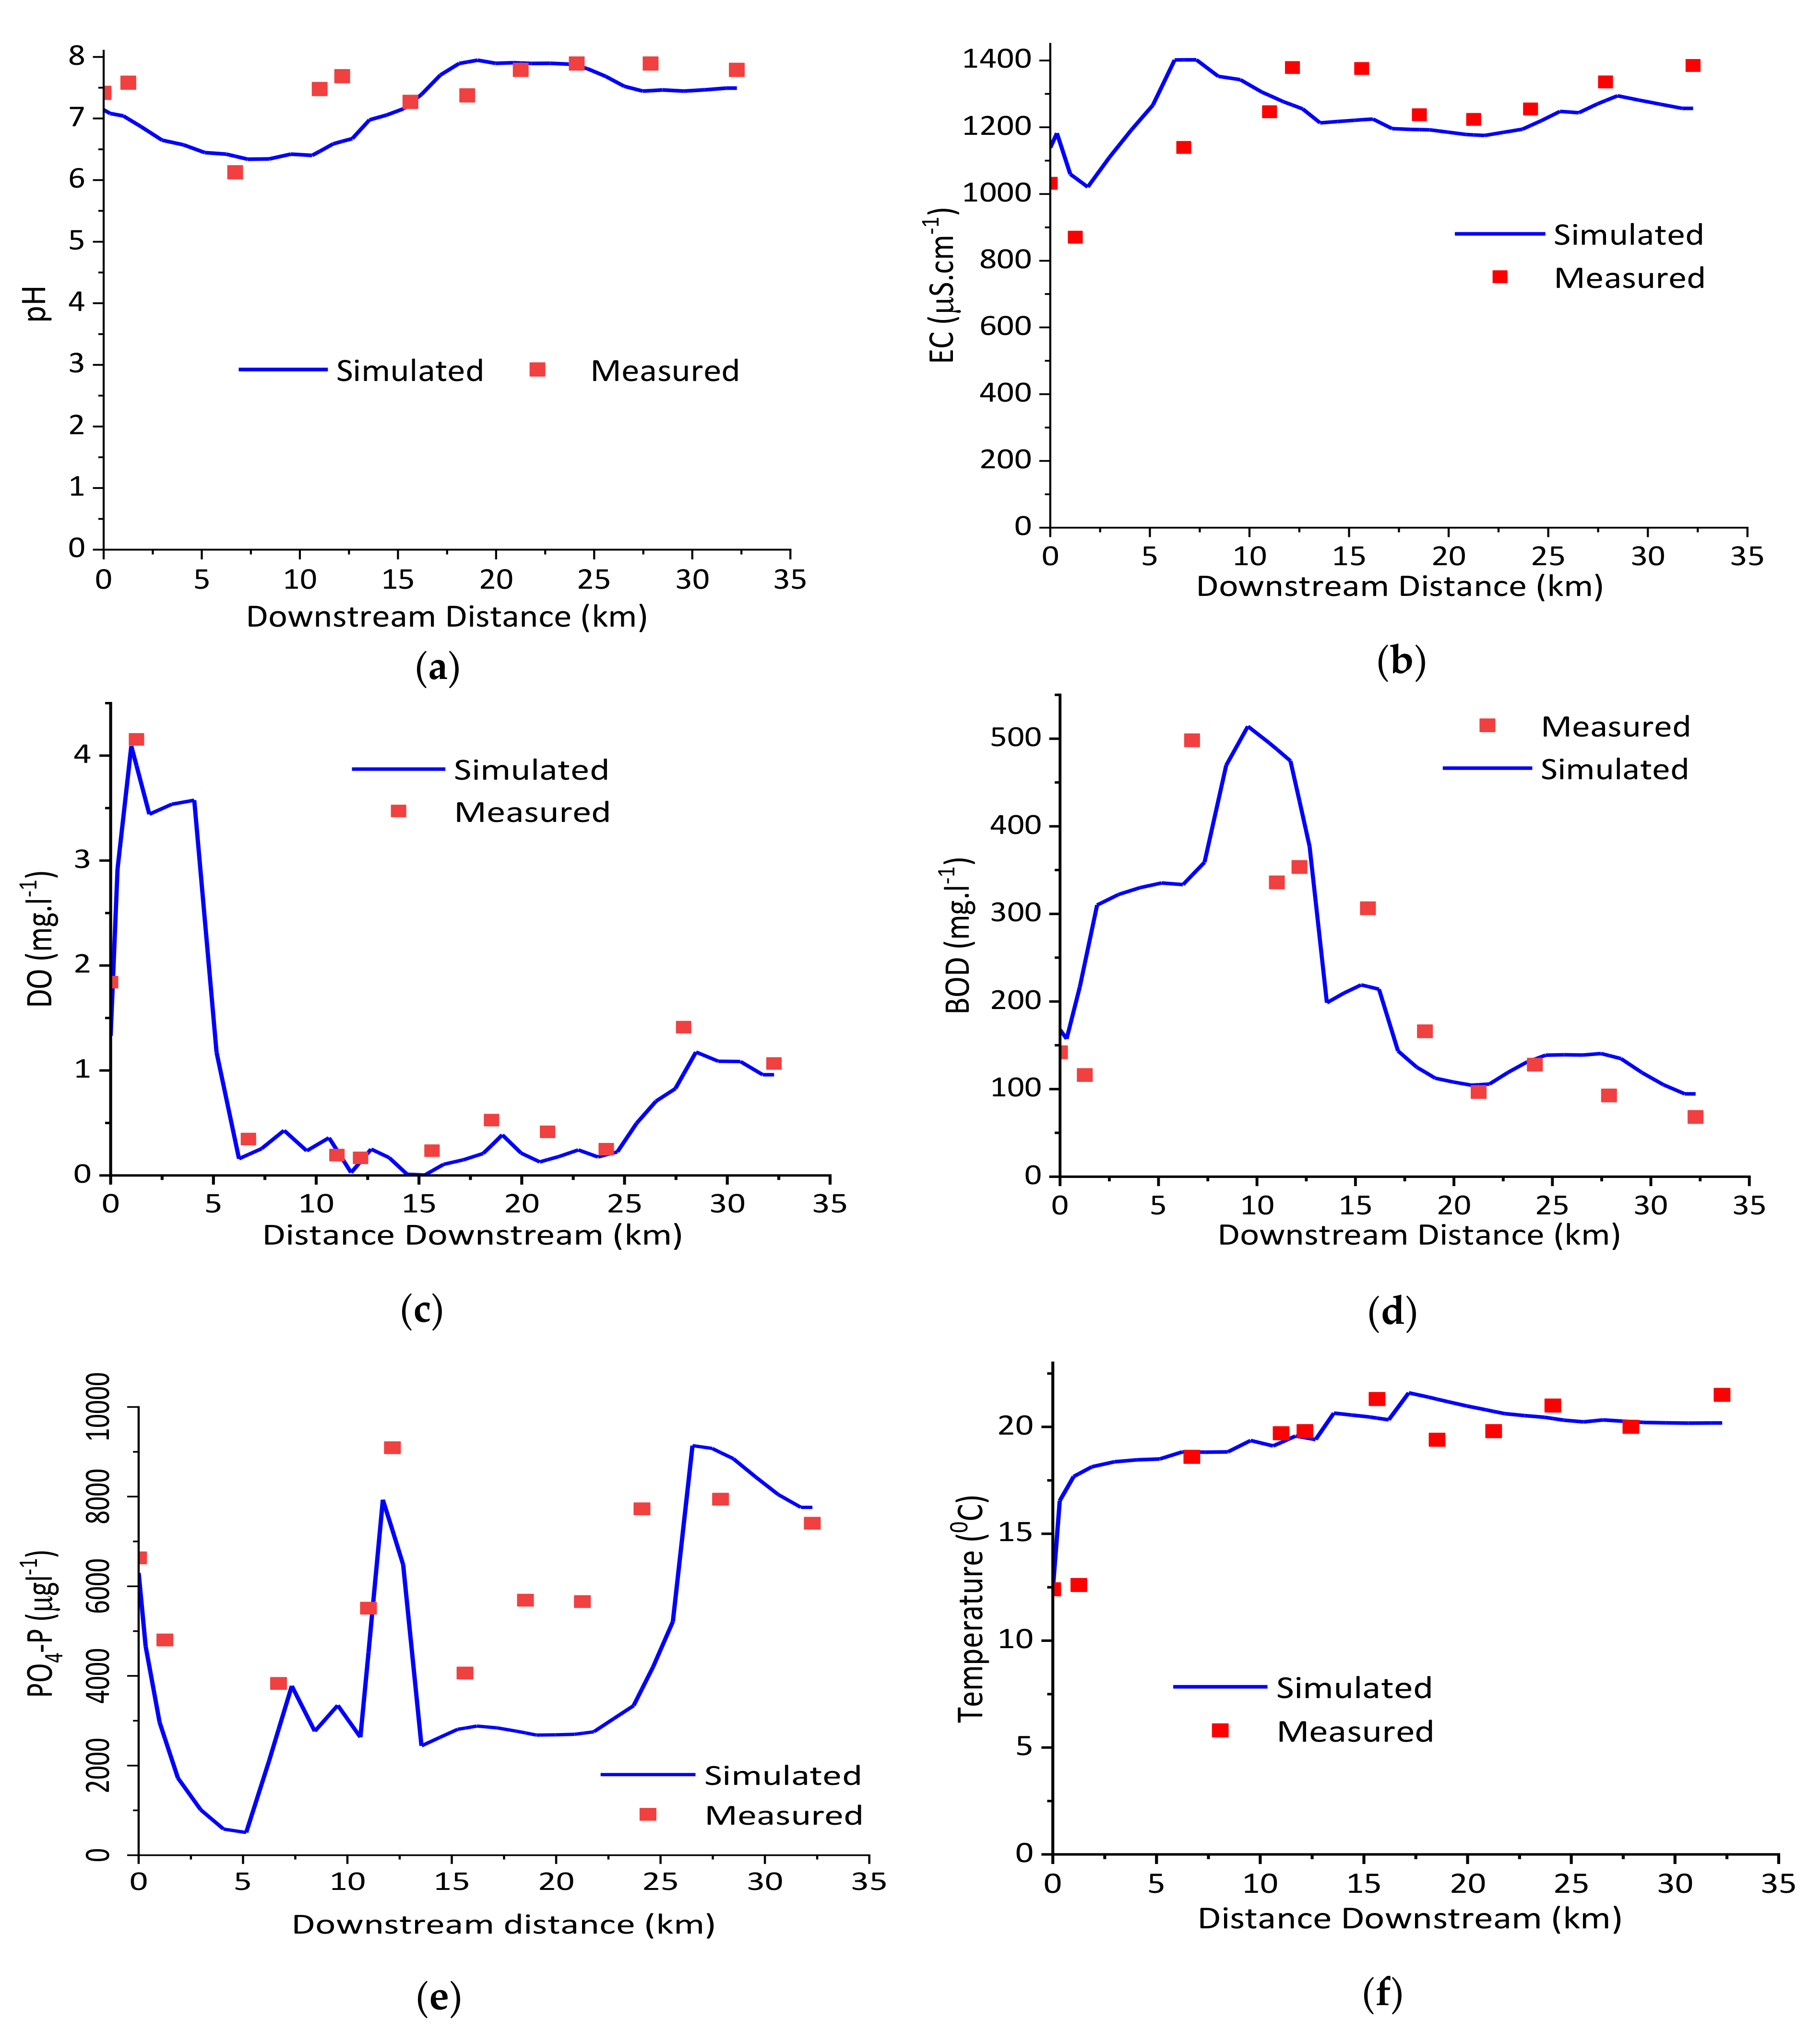
3.2. Calibration and Validation of QUAL2Kw in LAR

The QUAL2Kw model performance during simulation of water quality in LAR varies with constituents. The spatial assessment of DO in the LAR has revealed deterioration from upstream to downstream as reported by Angello et.al. [23] and was better simulated by QUAL2Kw (Figure 4c). The calibration result in the river showed that the water quality did not meet the minimum requirement of DO concentration of 4 mg/L in the river. During calibration, the DO dropped sharply after monitoring station M2 (after 4.98 km) due to the release of highly polluted tributary waste near Mesalemya that collects domestic waste, including raw sewage from Mercato area, the largest market place and densely populated urban center in the country with no wastewater collection and treatment facility. Besides, the middle segment of the river has shown high DO deterioration during calibration mainly attributed to a high presence of point and nonpoint source loads predominantly from urban land uses. The DO sag was noticeable in this segment of the LAR and had concentrations <1 mg/L due to the release of industrial waste from an abattoir, soft drinks, wine, and tannery factories. The DO started to recover near 25.5 km, though insignificantly, due to the reduced impact of point sources and less human interference due to dispersed settlement. Moreover, the consumption of easily degradable organic waste contributed to less consumption of oxygen and hence leads to the DO recovery. The coefficient of determination (R2) between model-simulated and measured DO in LAR of 0.99 and |PBAIS| of 0.57% during calibration and 0.98 and 11.8% during validation has revealed that the model is good enough to interpret the DO dynamics in the river.
The QUAL2Kw simulation for BOD during calibration (Figure 4d) showed that the model could not sufficiently simulate the constituent dynamics near monitoring station M3 (7.35 km) where the station was characterized by frequent constituent chemical variabilities observed during field monitoring and analysis. This deviation was partly due to the noninclusion of a small but highly polluted tributary upstream of the station. Moreover, underestimation of the pollution load of the Mesalemya stream that contributes high pollution load to the LAR could also be a contributing factor for the deviation of the BOD at the monitoring station. This deviation of BOD simulation was more pronounced at the upstream part of the middle segment of the LAR (near Lideta) and can be explained by the presence of multisource pollutants, including an unrecognized pollution source in the area which is dominated by informal settlements with no sanitation infrastructure. BOD often undergoes a complex chemical process in the river and attaining a good simulation result can be challenging. The |PBAIS| of BOD during the model calibration was 13.2% and 9.4% during validation which is acceptable for developing countries with high hydrometeorological and water quality data limitations [34]. Beyond the M3 monitoring station, the model simulation for BOD was quite good due to the correct inclusion and assignment of the available pollution sources. Mainly due to the improved self-purification efficiency of the LAR, the BOD showed significant reduction far downstream, which was associated with oxygen recovery. Despite many limitations, the model gave quite a good result to interpret the water quality for further decision making in the study area.
Other parameters such as water temperature, EC and pH were all well simulated by QUAL2Kw in LAR both during calibration and validation with a |PBIAS| (R2) of 3.2% (0.51), 5.1% (0.90) and 0.33% (0.62) during calibration and 1.3% (0.63), 10.31% (0.54) and 0.32% (0.56) during validation, respectively. Monitoring station M2 to M3 has shown an observable deviation between the measured and simulated for some water quality constituents indicating the presence of unrecognized or missed pollution sources in the area. The QUAL2Kw did not sufficiently simulate the water temperature near station M2 (1.33 km), upstream of which the tributary carrying wastewater from the Ethio-marble factory joins the river and the segment between 18.3 km (M10) and 24.1 km (M11). These middle segment areas are characterized by the presence of large-scale industry, such as a tannery factory, from which the release of wastewater at the unrecognized place could be contributing. The model simulated the water temperature quite well on most of the monitoring stations with an overall |PBAIS| of 3.2% and 1.3% during calibration and validation, respectively. Similarly, the model simulation for EC showed deviation near monitoring stations M3 and M5 where the QUAL2Kw underestimated EC at both stations. The pH at monitoring station M3 had deviated from the measured value upstream which was the release point of wastewater treatment plant effluent from a Coca Cola soft drinks factory and the highly polluted Mesalemya tributary joins the river upstream of the monitoring station. The spatial PO4-P variation in the study area showed some irregularity across the monitoring stations and was relatively better represented by the model. Far upstream and downstream of the river segment showed high PO4-P deviation where the areas were characterized by small scale urban agriculture. In general, the QUAL2Kw model simulated the water quality constituents with an R2 ranging from 0.51 to 0.99 (Figure 4a–f) which could be enough to interpret the model output for the development of water quality management programs and pollution control in LAR.
In spite of the marked difference between the measured and model-predicted data at some monitoring stations, the model calibration (Figure 4) and validation (Figure 5) results are acceptable for developing countries with high hydrometeorological and water quality data limitations. The model result can be further interpreted for preliminary water quality management and pollution control program development.

3.3. Sensitivity Analysis

The sensitivity analysis conducted on QUAL2Kw in LAR (Table 4) was performed varying the parameters by ±50%. The sensitivity analysis result revealed that five parameters were identified as highly influential. Among the selected parameters and rates, the point source flow and Manning’s roughness coefficient highly influence the DO and BOD concentration. A 50% reduction in point source flow has resulted in nearly 47% disturbance in DO concentration whereas augmentation of the same amount in the flow of the point source has improved the DO concentration by 18.9% (Table 4). The high sensitivity of point source flow on the DO concentration was also reported by Raj et.al. [10] on Bagmati River, Nepal. Similarly, the Manning’s roughness coefficient has a vital contribution that plays a significant role which can disturb nearly 50% of the DO concentration in LAR, where a similar finding was reported by Oliveira et.al. [9] on Cértima River, Portugal. On the other hand, slow BOD hydrolysis rate, sediment denitrification transfer coefficient, and inorganic phosphorus settling velocity also play critical roles that impact the BOD, nitrate, and phosphate concentration in the LAR, respectively.

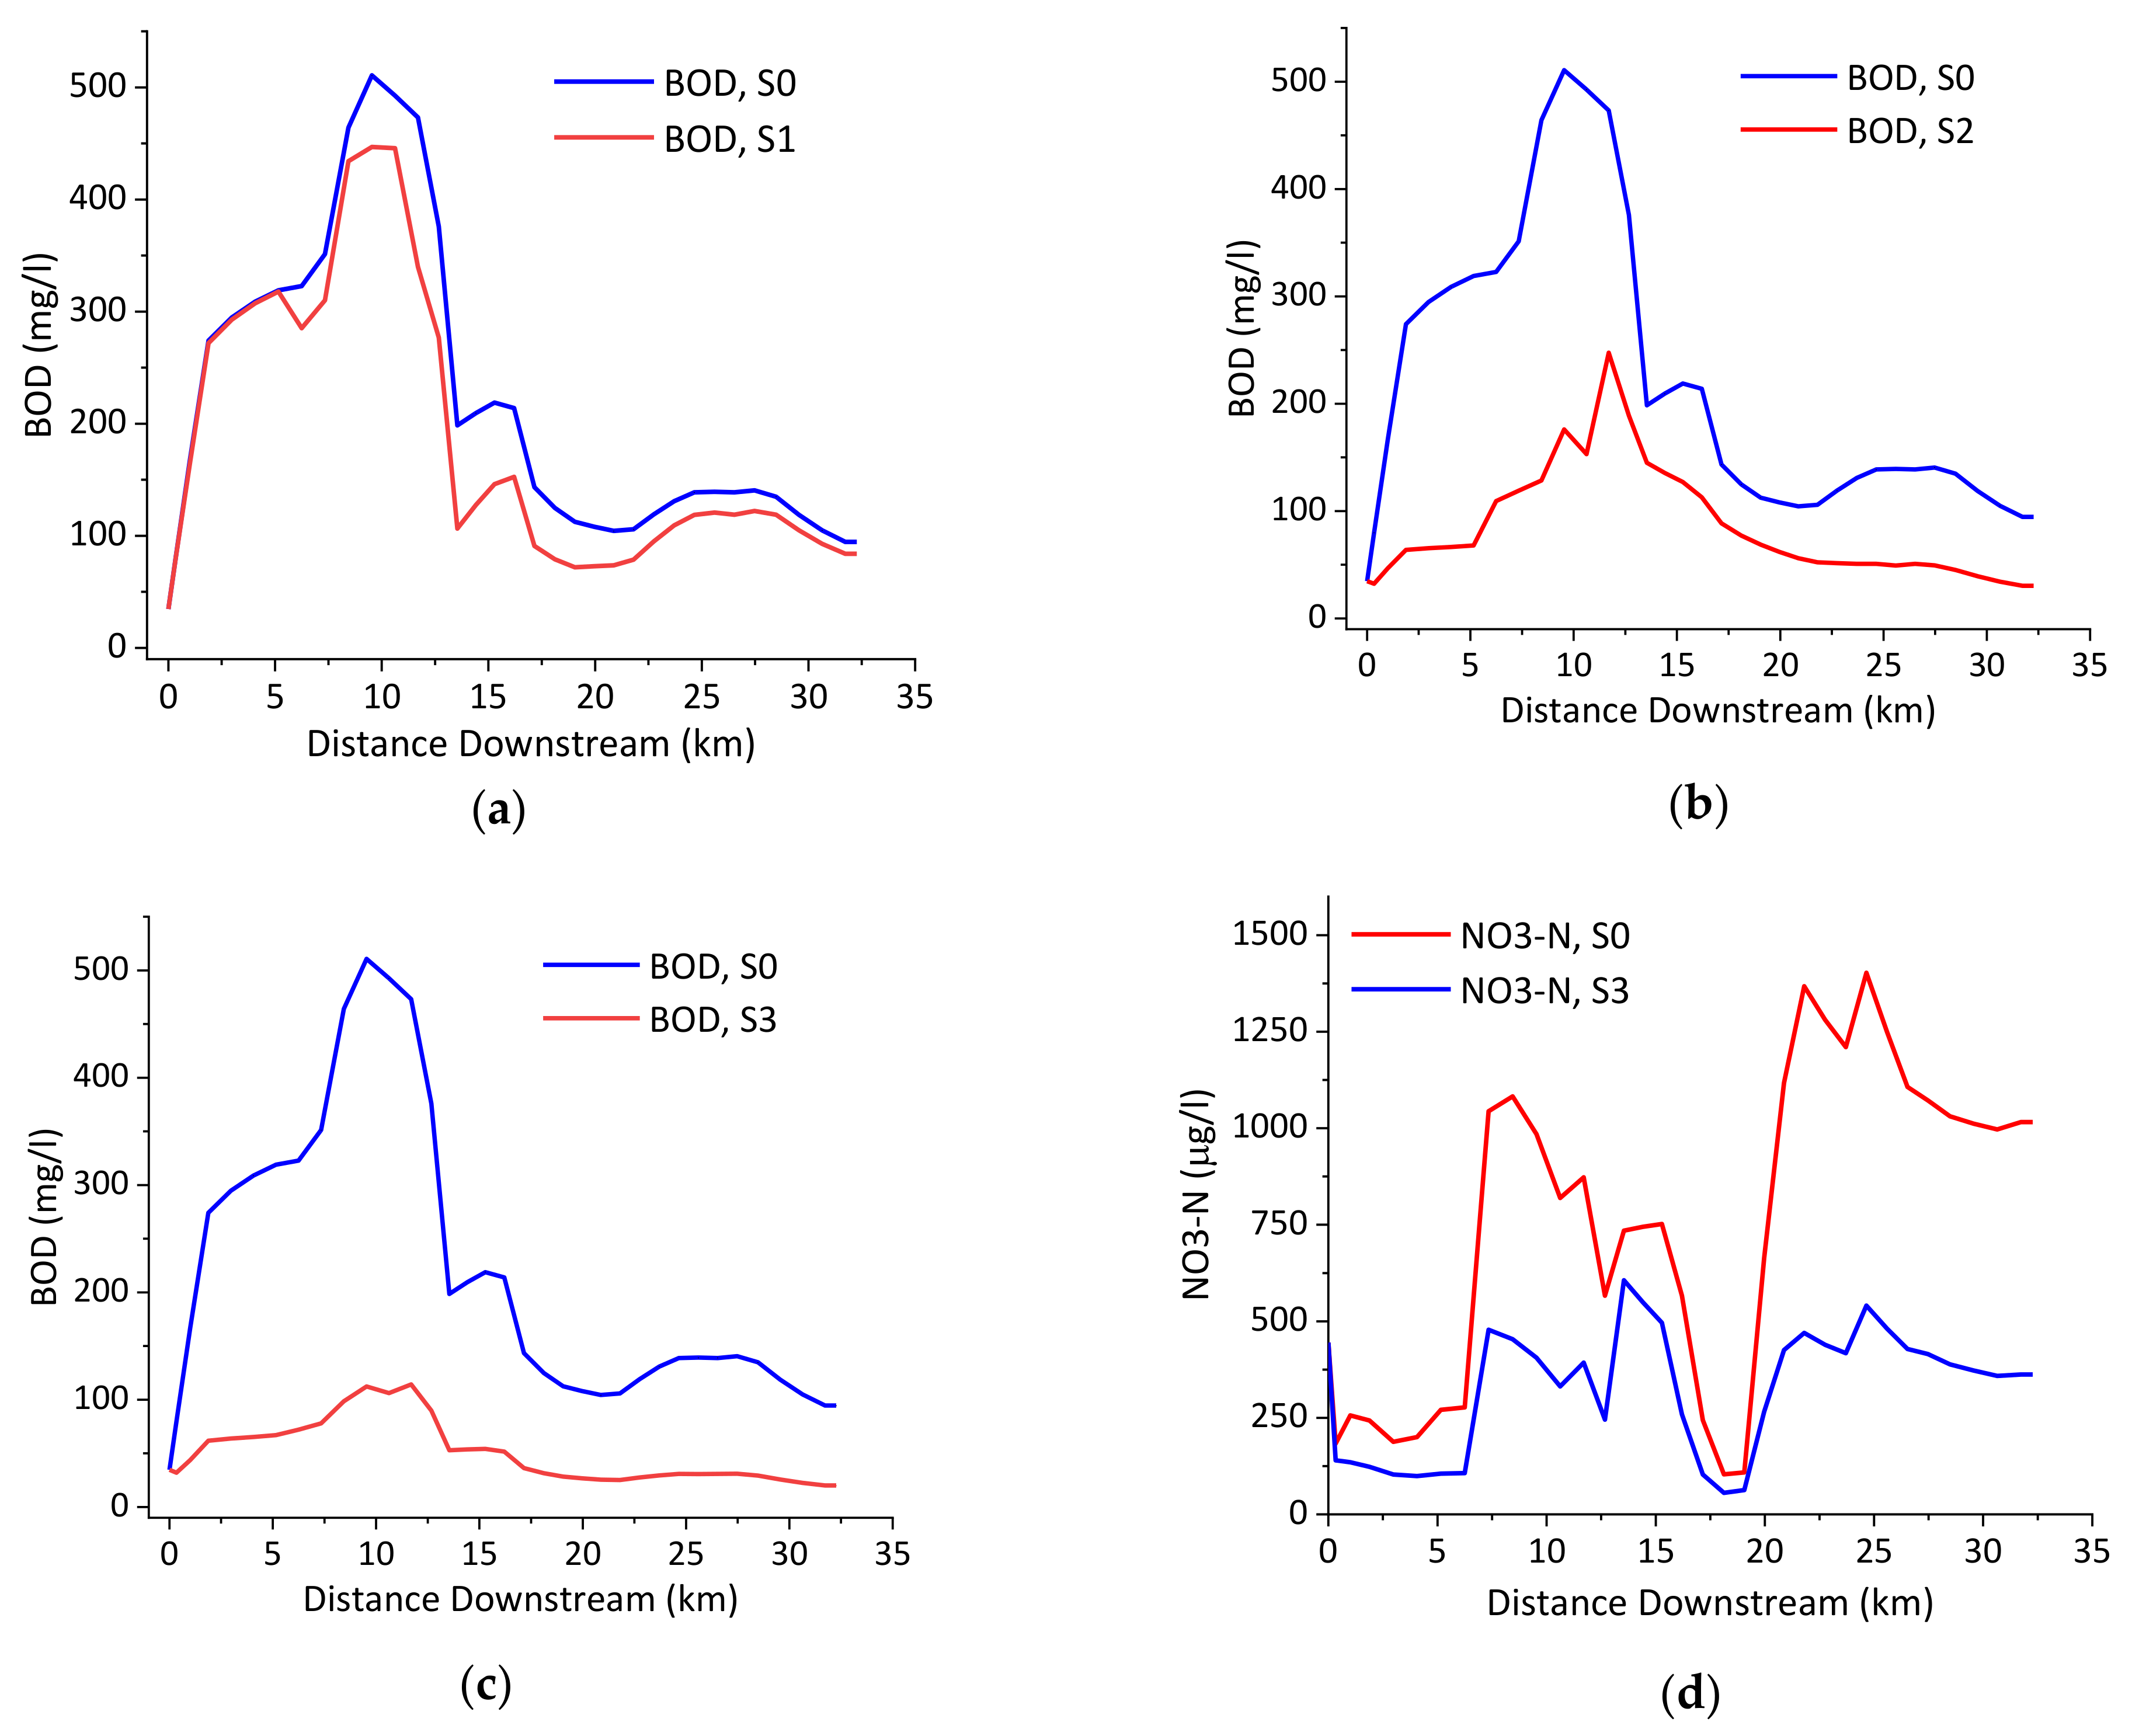
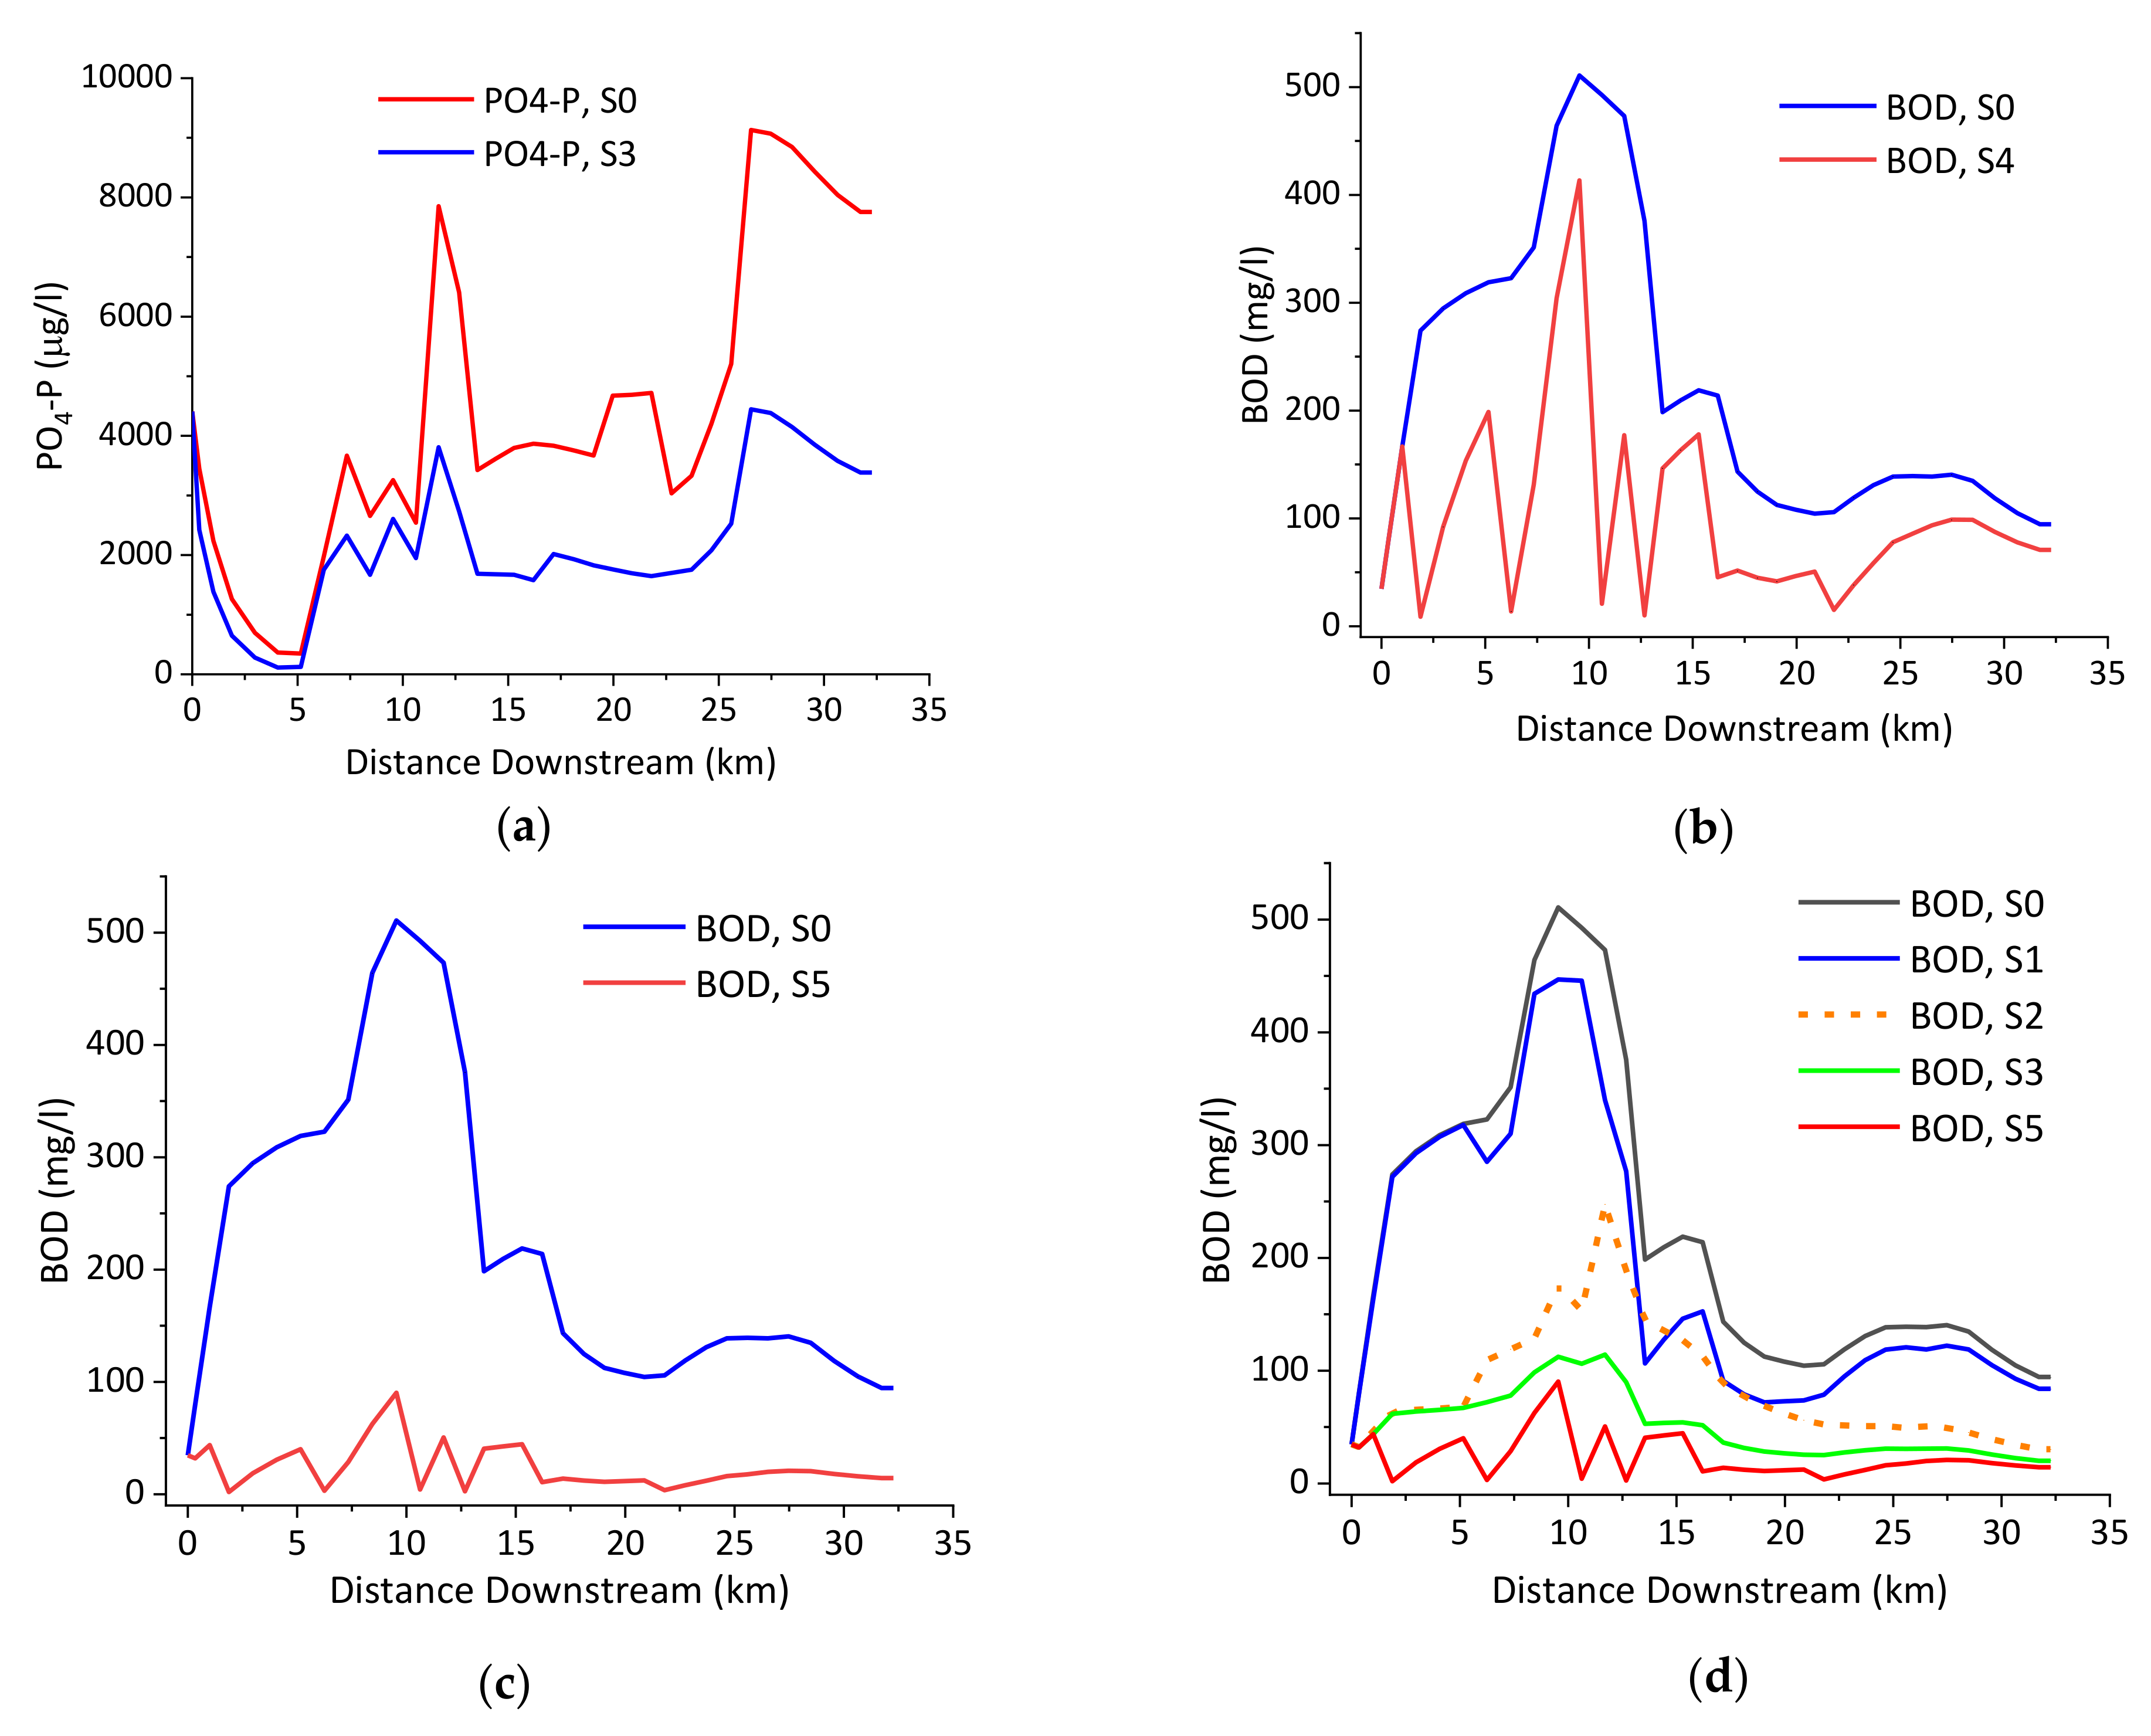
3.4. Scenario Evaluation and Selection of Optimum Pollution load Reduction Approach

In the first scenario (S1), despite the reduction of point source loads of BOD, phosphate, and nitrate, by a factor of 0.7, 0.5, and 0.5, respectively, it did not meet the required BOD and PO4-P concentration, but the NO3-N concentration was in the recommended range in LAR set by Ethiopian environmental standards for aquatic life [72]. Although the reduction of BOD load was observed in the downstream segment of the LAR, no noticeable change was seen between monitoring stations M1 to M3 (downstream distance 0.00 km to 4.06 km) and an overall average improvement of 17.7% was found in the river (Figure 6a). Although the modification of the point source constituent load (S1) has brought an average reduction of 17.7% in the overall BOD load in LAR, the minimum requirement of WQO was not met at all monitoring stations. On the other hand, the PO4-P load showed an average reduction of 37.5% where the change was pronounced in the middle and downstream segments (after 5 km) relative to the upstream segments of the river. The modification of the point source load has significantly changed the PO4-P load in the river but slightly deviated from the maximum permissible value in the river. In general, despite a visible change in the overall reduction of the pollution load in the LAR, the scenario could not satisfy the permissible WQO in the river.
Though it is difficult to achieve the WQO due to the heavy pollution in the LAR, the S2 was evaluated based on the modification of BOD, PO4-P, and NO3-N loads from diffuse sources. Accordingly, the response of the LAR for the S2 revealed that though the BOD load was significantly reduced, the minimum requirement in the river was not satisfied (Figure 6b). Relative to the S1, the S2 was found effective in reducing the BOD, PO4-P, and NO3-N load in the LAR. This is strong indication that the nonpoint source in the study area is the dominant pollution source for the LAR water quality deterioration. It also signals intensive land use management and best management practices should be prioritized for effective water quality management by controlling the diffuse source loads [73]. The average reduction rate of each constituent due to the modification of the nonpoint source load was found to be 58.7%, 51.06%, and 30.9%, for BOD, NO3-N, and PO4-P, respectively. From the reduction rate of constituents, it can easily be seen that the role of nonpoint sources for water quality management and pollution control is significant. Despite a significant reduction of the pollution load, the S2 evaluation showed a reduction rate of the nonpoint sources BOD, PO4-P, and NO3-N load by factors of 0.8, 0.6, and 0.6, it was not enough to meet the WQO in LAR.
The simultaneous modifications of point and nonpoint source load (S3) have highly reduced the organic waste load (BOD) by 76.4% where significant change was seen across the whole stretch of the LAR (Figure 6c). Though the minimum requirement of BOD load in the river was not met, the reduction was significantly high. Moreover, the NO3-N and PO4-P (Figure 7a) pollution load were more highly improved than the previous individual scenarios (S1 and S2), which ultimately dropped the PO4-P slightly near to the WQO. Significant PO4-P (49.3%) and NO3-N (54.1%) loads were reduced at the middle and downstream segments of the river where the area is characterized by urban land use and small-scale urban agricultural setup. Moreover, a high nonpoint source load was observed in the area and hence modification on the diffuse source load could be contributing to the high change in the pollutant load. The S3 evaluation results also reveal that source-based pollution management is vital for better water quality management and pollution control in the river.
Hydraulic structures such as cascaded rock ramps and weirs are used as local oxygen suppliers and used to manage the pollution load in a stream when placed at critical pollution locations [74]. However, weirs do not allow the free passage of aquatic organisms like fish. In the LAR, a cascaded rock ramp which can create a total head of 2 m and gentle slope was evaluated at five critical pollution locations (6.78, 11.43, 13.57, 17.05, 22.59 km). The BOD reduction due to the rock ramp application showed that there was a high improvement with an average 51.51% reduction relative to the baseload, despite some deviation from the standard values. From Figure 7b, it can be seen that the BOD load upstream of the structures had a surge, though reduced relative to the base value, due to the head created upstream of the structures that increased the water depth and reduced aeration, hence raising BOD. The implementation of rock ramps on the LAR has revealed that there are still other critical pollution locations that need further improvement. Such instream measures are often applied for initiating the self-cleansing efficiency of the river thereby allowing the supply of atmospheric oxygen.
From the previous scenario evaluations on LAR, it is evident that none of the individual scenarios have fully met the required environmental quality standards (with respect to organic and nutrient pollutants) though they were quite effective in overall pollution load reduction. To satisfy the basic aquatic life water quality requirements, there was a need for the integration of scenarios and hence the scenarios integrally made up relatively good pollution reduction approaches in LAR with an overall reduction rate of BOD (87.8%), NO3-N (55.6%), and PO4-P (53.7%). However, even the integrated scenarios applied to the LAR could not satisfy the minimum requirements of the WQOs with the specified reduction rates from the point and nonpoint sources (Figure 7d). The S5 evaluation also showed that the scenario was relatively more effective in improving the organic waste pollution load (such as BOD) than the nutrient (such as PO4-P and NO3-N) load. Relative to other evaluated scenarios, the integrated approach was found very effective in reducing the organic pollutant and nutrient loads in the river. Table 5 summarizes all scenarios and the average improvement rate in percent.

3.5. Optimum Pollution Load Reduction Approach and Rate

River pollution load is highly affected by the emission rate from the point and nonpoint sources and hence the determination of the optimum load (water environmental capacity) in the river was based relative to the standard guidelines. Based on the evaluation of the individual scenarios, the source-based (point and nonpoint) scenarios could not bring all the constituents to the intended guideline standards in the LAR. However, it is often difficult to meet these guidelines specifically in developing countries due to the financial constraints, poor pollution management system, and lack of sanitation infrastructure. The optimum pollution reduction rate in the LAR was evaluated iteratively with trial and error using QUAL2Kw until the load in the river came under the WQO. Accordingly, none of the iterations conducted based on the modification of point source load (up to 100%) was found to be effective in meeting the intended WQO in LAR for BOD and PO4-P on the entire river section. On the other hand, the NO3-N load was within the WQO with minimum modification of the point source pollution load. Similarly, the iterative modification on the nonpoint source load on QUAL2Kw revealed that a reduction rate of nonpoint source load of BOD (0.8), PO4-P (0.6), and NO3-N (0.6) brought the NO3-N load to the WQO but could not guarantee the PO4-P and BOD load in LAR. From the evaluation of the scenarios, we can see that the point and the nonpoint sources could not individually satisfy the permissible pollution load in the LAR for BOD and PO4-P and it requires an integrated point and nonpoint sources pollution modification along with the application of cascaded rock ramps which ultimately have an economic implication. Accordingly, to meet the WQO in the LAR, at least an average removal rate of 85%, 80%, and 76% from each considered point source and 92%, 83%, and 83% from all contributing nonpoint source loads for BOD, PO4-P, and NO3-N, respectively, and cascaded rock ramps creating head differences of 2 m with a gentle slope at critical pollution zones are necessary.

4. Conclusions

Urban river water quality management in countries like Ethiopia with a high scarcity of monitored water quality and hydrologic data is very challenging and needs an integrated and coordinated approach. In this study, a modified water quality model, QUAL2Kw, was evaluated in LAR to select the optimum pollution load reduction approach and rate using five hypothetical scenarios. The simulation of the QUAL2Kw for flow and constituents has shown that the model is sufficient for the interpretation of water quality in the river. The QUAL2Kw simulated the water quality constituents with relatively good accuracy having an R2 ranging from 0.51 to 0.99 and |PBAIS| from 0.33% to 13.2%. Hence, the model is applicable to assess the effect of various pollution controls and supporting instream measures on key water quality parameters. The hypothetical scenarios were evaluated relative to the base scenario (S0). None of the individual source-based scenarios and instream measures fully satisfied the minimum requirement for the pollution load-carrying capacity of the LAR, though a significant reduction of pollution load was found in the river. We generally believe that this study has laid the foundations for the future development of a water quality management strategy and initiation of best management practices in the study area. Besides, addressing the water quality problems in LAR is deemed crucial to safeguard the existence of aquatic life and protection of the ecosystem of the basin. However, achieving well-defined pollution control and water quality management requires collecting multispatial and temporal data at a higher resolution. The following conclusions are drawn from the finding.
  • The water quality model, QUAL2Kw, is a quite effective tool for pollution management of urban rivers of specifically developing countries with high hydro-meteorological and water quality data scarcity. The output can be effectively interpreted for preliminary water quality management and pollution control programs. Moreover, the model is capable of providing decision-making support to design, execute and manage projects for river improvement in the study area.
  • The QUAL2Kw model-based scenario evaluation revealed that the impact of nonpoint sources pollution load on the LAR was much higher than the point source pollution load. An integrated approach on point and nonpoint source pollution control is highly recommended for sustainable water quality management in the study area.
  • Despite the rather ambitious source-based pollution load reduction scenarios applied in this study, the intended goal of reducing the pollutants load in the LAR was still not achieved. Hence additional pollution control mechanisms are required for better water quality and pollution management in the catchment.
  • Combining pollution reduction with instream measures to improve reaeration can have clear synergistic effects. Since a fast dramatic pollution reduction is hardly achievable in developing and emerging countries, those integrative approaches are cost-efficient mitigation options.
In conclusion, the scenarios evaluated on LAR were hypothetical and can be applied for the development of a river pollution management program and decision-making process. For a targeted improvement of the ambient water quality, the model can be used to iteratively develop and allocate a set of cost-efficient measures.

Author Contributions

Z.A.A. and J.T. formulated the overall research idea, developed the work methodology, follow up the whole manuscript writing and review procedure. Z.A.A. collected data and resources, conducted detailed data analysis, performed modeling, compiled the results, and presented the conclusion. J.T. and B.M.B. supervised the study, edited, reviewed, and modified the manuscript. All authors have read and agreed to the published version of the manuscript.

Funding

This research is part of the DAAD-EECBP Home Grown PhD Scholarship Programme under (EECBP Homegrown PhD Program-2017). The APC was funded by the Open Access Department, University of Rostock.

Data Availability Statement

The data used in this study can be available from the authors on reasonable request.

Acknowledgments

German Academic Exchange Service (DAAD) is acknowledged for providing a scholarship to the first author during the study. The authors are very grateful to the Open Access Department, University of Rostock, for the willingness to pay the article processing charge. The authors would like to thank Demise Dawana, Dagmawi Matewos and Mekuanent Muluneh from Arba Minch University, for their valuable assistance.

Conflicts of Interest

The authors declare no conflict of interest.

References

  1. Qin, H.P.; Su, Q.; Khu, S.T.; Tang, N. Water quality changes during rapid urbanization in the Shenzhen river catchment: An integrated view of socio-economic and infrastructure development. Sustainability 2014, 6, 7433–7451. [Google Scholar] [CrossRef] [Green Version]
  2. Ouyang, T.; Zhu, Z.; Kuang, Y. Assessing impact of urbanization on river water quality in the Pearl River Delta Economic Zone, China. Environ. Monit. Assess 2006, 120, 313–325. [Google Scholar] [CrossRef] [PubMed]
  3. McGrane, S.J. Impacts of urbanisation on hydrological and water quality dynamics, and urban water management: A review. Hydrol. Sci. J. 2016, 61, 2295–2311. [Google Scholar] [CrossRef]
  4. Wang, J.; Zhao, J.; Lei, X.; Wang, H. New approach for point pollution source identification in rivers based on the backward probability method. Environ. Pollut. 2018, 241, 759–774. [Google Scholar] [CrossRef] [PubMed]
  5. Wang, J.; Liu, X.D.; Lu, J. Urban River Pollution Control and Remediation. Procedia Environ. Sci. 2012, 13, 1856–1862. [Google Scholar] [CrossRef] [Green Version]
  6. Mekonnen, D.T.; Alemayehu, E.; Lennartz, B. Removal of phosphate ions from aqueous solutions by adsorption onto leftover coal. Water 2020, 12, 1381. [Google Scholar] [CrossRef]
  7. Waseem, M.; Koegst, T.; Tränckner, J. Groundwater Contribution to Surface Water Contamination in a North German Low Land Catchment with Intensive Agricultural Land Use. J. Water Resour. Prot. 2018, 10, 231–250. [Google Scholar] [CrossRef] [Green Version]
  8. Awoke, A.; Beyene, A.; Kloos, H.; Goethals, P.L.M.; Triest, L. River Water Pollution Status and Water Policy Scenario in Ethiopia: Raising Awareness for Better Implementation in Developing Countries. Environ. Manage. 2016, 58, 694–706. [Google Scholar] [CrossRef] [PubMed]
  9. Oliveira, B.; Bola, J.; Quinteiro, P.; Nadais, H.; Arroja, L. Application of Qual2Kw model as a tool for water quality management: Cértima River as a case study. Environ. Monit. Assess. 2012, 184, 6197–6210. [Google Scholar] [CrossRef]
  10. Raj, P.; Lee, S.; Lee, Y.; Kanel, S.R.; Pelletier, G.J. Application of automated QUAL2Kw for water quality modeling and management in the Bagmati River, Nepal. Ecol. Modell. 2007, 202, 503–517. [Google Scholar] [CrossRef]
  11. Xue, C.H.; Yin, H.L.; Ming, X.I.E. Development of integrated catchment and water quality model for urban rivers. J. Hydrodyn. 2015, 27, 593–603. [Google Scholar] [CrossRef]
  12. León, L.F.; Soulis, E.D.; Kouwen, N.; Farquhar, G.J. Nonpoint source pollution: A distributed water quality modeling approach. Water Res. 2001, 35, 997–1007. [Google Scholar] [CrossRef]
  13. Luo, Y.; Zhang, M. Management-oriented sensitivity analysis for pesticide transport in watershed-scale water quality modeling using SWAT. Environ. Pollut. 2009, 157, 3370–3378. [Google Scholar] [CrossRef] [PubMed]
  14. Desai, A.; Rifai, H.S.; Petersen, T.M.; Stein, R. Mass balance and water quality modeling for load allocation of Escherichia coli in an urban watershed. J. Water Resour. Plan. Manag. 2011, 137, 412–427. [Google Scholar] [CrossRef]
  15. Yuceer, M.; Coskun, M.A.A.; Yuceer, M.; Coskun, M.A.; Yuceer, M.; Coskun, M.A.A. Modeling water quality in rivers: A case study of Beylerderesi river in Turkey. Appl. Ecol. Environ. Res. 2016, 14, 383–395. [Google Scholar] [CrossRef]
  16. Shrestha, N.K.; Leta, O.T.; Bauwens, W. Development of RWQM1-based integrated water quality model in OpenMI with application to the River Zenne, Belgium. Hydrol. Sci. J. 2016, 62, 774–799. [Google Scholar] [CrossRef]
  17. Gao, L.; Li, D. A review of hydrological/water-quality models. Front. Agric. Sci. Eng. 2014, 1, 267–276. [Google Scholar] [CrossRef] [Green Version]
  18. Holguin-Gonzalez, J.E.; Boets, P.; Alvarado, A.; Cisneros, F.; Carrasco, M.C.; Wyseure, G.; Nopens, I.; Goethals, P.L.M. Integrating hydraulic, physicochemical and ecological models to assess the effectiveness of water quality management strategies for the River Cuenca in Ecuador. Ecol. Modell. 2013, 254, 1–14. [Google Scholar] [CrossRef] [Green Version]
  19. Reza, M.; Farahmand, Z.; Mehrasbi, M.R.; Farahmand Kia, Z. Water Quality Modeling and Evaluation of Nutrient Control Strategies Using QUAL2K in the Small Rivers. J. Human Environ. Heal. Promot. 2015, 1, 1–11. [Google Scholar] [CrossRef] [Green Version]
  20. Vieira, J.; Fonseca, A.; Vilar, V.J.P.; Boaventura, R.A.R.; Botelho, C.M.S. Water quality modelling of Lis River, Portugal. Environ. Sci. Pollut. Res. 2013, 20, 508–524. [Google Scholar] [CrossRef] [PubMed]
  21. Zhang, R.; Qian, X.; Yuan, X.; Ye, R.; Xia, B.; Wang, Y. Simulation of water environmental capacity and pollution load reduction using QUAL2K for water environmental management. Int. J. Environ. Res. Public Health 2012, 9, 4504–4521. [Google Scholar] [CrossRef] [PubMed] [Green Version]
  22. Gebre, G.; Rooijen, D. Urban water pollution and irrigated vegetable farming in Addis Ababa. In Proceedings of the 34th WEDC International Conference on Water, Sanitation and Hygiene: Sustainable Development and Multisectoral Approaches, Addis Ababa, Ethiopia, 18–22 May 2009; p. 6. [Google Scholar]
  23. Angello, Z.; Tränckner, J.; Behailu, B. Spatio-Temporal Evaluation and Quantification of Pollutant Source Contribution in Little Akaki River, Ethiopia: Conjunctive Application of Factor Analysis and Multivariate Receptor Model. Polish J. Environ. Stud. 2020, 30, 23–34. [Google Scholar] [CrossRef]
  24. Abebe, T.A.; Tucho, G.T. Open defecation-free slippage and its associated factors in Ethiopia: A systematic review. Syst. Rev. 2020, 9, 1–16. [Google Scholar] [CrossRef] [PubMed]
  25. Abegaz, S.M. Investigation of Input and Distribution of Polluting Elements in Tinishu Akaki River, Ethiopia, Based on the Determination by ICP-MS. Ph.D. Dissertation, Institute for Nuclear Sciences, Universiteit Gent, Ghent, Belgium, 2005. [Google Scholar]
  26. Aschale, M.; Sileshi, Y.; Kelly-Quinn, M.; Hailu, D. Evaluation of potentially toxic element pollution in the benthic sediments of the water bodies of the city of Addis Ababa, Ethiopia. J. Environ. Chem. Eng. 2016, 4, 4173–4183. [Google Scholar] [CrossRef]
  27. Mekonnen, A. Suitability Assessment of the Little Akaki River for Irrigation. M.Sc. Thesis, Addis Ababa University Technology Faculty, Department of Chemical Engineering, Addis Ababa, Ethiopia, 2007. (Unpublished). [Google Scholar]
  28. Ministry of Water Irrigation and Electricity. Urban Wastewater Management Strategy; Federal Democratic Republic of Ethiopia Ministry of Water Irrigation and Electricity: Addis Ababa, Ethiopia, 2017.
  29. Sahilu, G.; Abate, E.; Tadesse, D. The Study of Water Use and Treated Wastewater Discharge Charge; Federal Democratic Republic of Ethiopia Awash Basin Authority: Addis Ababa, Ethiopia, 2018. [Google Scholar]
  30. American Public Health Association. Standard Methods for the Examination of Water and Wastewater, 20th ed.; Clesceri, L.S., Greenberg, A.E., Eaton, A.D., Eds.; American Public Health Association: Washington, DC, USA, 1999; Volume 51, ISBN 0875532357. [Google Scholar]
  31. Wang, Q.; Li, S.; Jia, P.; Qi, C.; Ding, F. A review of surface water quality models. Sci. World J. 2013, 2013. [Google Scholar] [CrossRef] [Green Version]
  32. Brito, D.; Neves, R.; Branco, M.A.; Prazeres, Â.; Rodrigues, S.; Gonçalves, M.C.; Ramos, T.B. Assessing water and nutrient long-term dynamics and loads in the Enxoé temporary river basin (southeast Portugal). Water 2019, 11, 354. [Google Scholar] [CrossRef] [Green Version]
  33. Mamani Larico, A.J.; Zúñiga Medina, S.A. Application of WASP model for assessment of water quality for eutrophication control for a reservoir in the Peruvian Andes. Lakes Reserv. Res. Manag. 2019, 24, 37–47. [Google Scholar] [CrossRef] [Green Version]
  34. Tsegaye, M.Y. Water Quality Assessment Using Optimal Multi- Objective Waste-Load Allocation Approach: The Case of Little Akaki River. Ph.D. Dissertation, Addis Ababa University, Addis Ababa Institute of Technology, School of Chemical and Bio Engineering, Addis Ababa, Ethiopia, April 2019. [Google Scholar]
  35. Mateus, M.; Vieira RD, S.; Almeida, C.; Silva, M.; Reis, F. ScoRE-A simple approach to select a water quality model. Water 2018, 10, 1811. [Google Scholar] [CrossRef] [Green Version]
  36. Benedini, M.; Tsakiris, G. Water Quality Modelling for Rivers and Streams [Online]; Springer Science+Business Media Dordrecht: Berlin, Germany, 2013; Volume 41, ISBN 978-94-007-5508-6. Available online: https://link.springer.com/book/10.1007%2F978-94-007-5509-3#toc (accessed on 23 February 2021).
  37. Pelletier, G.; Chapra, S.; Tao, H. QUAL2K: A Modeling Framework for Simulating River and Stream Water Quality. Version 5.1: Documentation and Users Manual; Civil and Environmental Engineering Department, Tufts University: Medford, MA, USA, 2008. [Google Scholar]
  38. Kannel, P.R.; Kanel, S.R.; Lee, S.; Lee, Y.; Gan, T.Y. A Review of Public Domain Water Quality Models for Simulating Dissolved Oxygen in Rivers and Streams. Environ. Model. Assess. 2011, 16, 183–204. [Google Scholar] [CrossRef]
  39. Pelletier, G.J.; Chapra, S.C.; Tao, H. QUAL2Kw-A framework for modeling water quality in streams and rivers using a genetic algorithm for calibration. Environ. Model. Softw. 2005, 21, 419–425. [Google Scholar] [CrossRef]
  40. Zhang, R.; Qian, X.; Zhu, W.; Gao, H.; Hu, W.; Wang, J. Simulation and Evaluation of Pollution Load Reduction Scenarios for Water Environmental Management: A Case Study of Inflow River of Taihu Lake, China. Int. J. Environ. Res. Public Health 2014, 11, 9306–9324. [Google Scholar] [CrossRef] [Green Version]
  41. Goktas, R.K.; Aksoy, A. Calibration and Verification of QUAL2E Using Genetic Algorithm Optimization. J. Water Resour. Plan. Manag. 2007, 133, 126–136. [Google Scholar] [CrossRef]
  42. Xin, Z.; Ye, L.; Zhang, C. Application of export coefficient model and QUAL2K for water environmental management in a rural watershed. Sustainability 2019, 11, 6022. [Google Scholar] [CrossRef] [Green Version]
  43. Kannel, P.R.; Lee, S.; Kanel, S.R.; Lee, Y.S.; Ahn, K.H. Application of QUAL2Kw for water quality modeling and dissolved oxygen control in the river Bagmati. Environ. Monit. Assess. 2007, 125, 201–217. [Google Scholar] [CrossRef]
  44. Turner, D.F.; Pelletier, G.; Kasper, B. Dissolved Oxygen and pH Modeling of a Periphyton Dominated, Nutrient Enriched River. J. Environ. Eng. 2009, 135. [Google Scholar] [CrossRef]
  45. Bowie, G.; Mills, W.B.; Porcella, D.B.; Campbell, C.L.; Pagenkopf, J.R.; Rupp, G.L.; Johnson, K.M.; Chan, P.W.H.; Gherini, S.A.; Chamberlain, C.E. Rates, Constants, and Kinetics Formulations in Surface Water Quality Modeling, 2nd ed.; US Environmental Protection Agency, Environmental Research Laboratory: Athens, GA, USA, 1985. [Google Scholar]
  46. Keraga, A.S. Assessment and Modeling of Surface Water Quality Dynamics in Awash River Basin, Ethiopia. Ph.D. Dissertation, Addis Ababa Institute of Technology, School of Chemical and Bio Engineering, Addis Ababa University, Addis Ababa, Ethiopia, 2019. [Google Scholar]
  47. Moriasi, D.N.; Gitau, M.W.; Pai, N.; Daggupati, P. Hydrologic and water quality models: Performance measures and evaluation criteria. Am. Soc. Agric. Biol. Eng. 2015, 58, 1763–1785. [Google Scholar] [CrossRef] [Green Version]
  48. Bui, H.H.; Ha, N.H.; Nguyen, T.N.D.; Nguyen, A.T.; Pham, T.T.H.; Kandasamy, J.; Nguyen, T.V. Integration of SWAT and QUAL2K for water quality modeling in a data scarce basin of Cau River basin in Vietnam. Ecohydrol. Hydrobiol. 2019, 19, 210–223. [Google Scholar] [CrossRef]
  49. Hamda, N.T. Mathematical Modeling of Point Source Pollutants Transport in the Akaki River. M.Sc. Thesis, Addis Ababa University, Addis Ababa, Ethiopia, 2007. [Google Scholar]
  50. Chapra, S.C.; Pelletier, G.J. QUAL2K: A Modeling Framework for Simulating River and Stream Water Quality: Documentation and Users Manual; Civil and Environmental Engineering Department, Tufts University: Medford, MA, USA, 2003. [Google Scholar]
  51. Zhu, W.; Leng, X.; Li, H.; Zhang, R.; Ye, R.; Qian, X. Application of the QUAL2K model to design an ecological purification scheme for treated effluent of a wastewater treatment plant. Water Sci. Technol. 2015, 72, 2194–2200. [Google Scholar] [CrossRef] [PubMed] [Green Version]
  52. Food and Agricultural Organization of the United Nations. Water Quality Management and Control of Water Pollution, Proceedings of the Regional Workshop, Bangkok Thailand, 26–30 October 1999; Food and Agricultural Organization of the United Nations: Rome, Italy, 2000; ISBN 92-5-104503-8. [Google Scholar]
  53. Jabbar, F.K.; Grote, K. Statistical assessment of nonpoint source pollution in agricultural watersheds in the Lower Grand River watershed, MO, USA. Environ. Sci. Pollut. Res. 2019, 26, 1487–1506. [Google Scholar] [CrossRef] [PubMed] [Green Version]
  54. Cho, J.H.; Lee, J.H. Automatic calibration and selection of optimal performance criterion of a water quality model for a river controlled by total maximum daily load (TMDL). Water Sci. Technol. 2019, 79, 2260–2270. [Google Scholar] [CrossRef]
  55. Wang, Y.; Bian, J.; Lao, W.; Zhao, Y.; Hou, Z.; Sun, X. Assessing the impacts of best management practices on nonpoint source pollution considering cost-effectiveness in the source area of the Liao River, China. Water 2019, 11, 1241. [Google Scholar] [CrossRef] [Green Version]
  56. Amaral, S.D.; Quaresma, A.L.; Branco, P.; Romão, F.; Katopodis, C.; Ferreira, M.T.; Pinheiro, A.N.; Santos, J.M. Assessment of retrofitted ramped weirs to improve passage of potamodromous fish. Water 2019, 11, 2441. [Google Scholar] [CrossRef] [Green Version]
  57. Mooney, D.D.M.; Holmquist-Johnson, C.L.; Broderick, S. Rock Ramp Design Guidelines; U.S. Department of the Interior, Bureau of Reclamation, Technical Service Center: Denver, CO, USA, 2007. [Google Scholar]
  58. Ongley, E.D.; Booty, W.G. Pollution remediation planning in developing countries: Conventional modelling versus knowledge-based prediction. Water Int. 1999, 24, 31–38. [Google Scholar] [CrossRef]
  59. Teklehaimanot, R.R. Program on Sustainable Consumption and Production in the Akaki River Basin: A Situation Analysis of the Akaki River, Final Report; The Ethiopian Science and Technology Commission (ESTC), United Nations Environment Programme (UNEP) and The Ethiopian Cleaner Production Center (ECPC): Addis Ababa, Ethiopia, 2005. [Google Scholar]
  60. Worku, A.; Tefera, N.; Kloos, H.; Benor, S. Constructed wetlands for phytoremediation of industrial wastewater in Addis Ababa, Ethiopia. Nanotechnol. Environ. Eng. 2018, 3, 1–11. [Google Scholar] [CrossRef]
  61. Iloms, E.; Ololade, O.O.; Ogola, H.J.O.; Selvarajan, R. Investigating industrial effluent impact on municipal wastewater treatment plant in vaal, South Africa. Int. J. Environ. Res. Public Health 2020, 17, 1096. [Google Scholar] [CrossRef] [PubMed] [Green Version]
  62. Ali, S. Dairy Wastewater Treatment Using Horizontal Subsurface Flow Constructed Wetland Planted with Tyhpa Latifolia and Scirpus Lacustris. M.Sc. Thesis, Addis Ababa Institute of Technology (AAiT), School of Graduate Studies, Department of Chemical Engineering, Addis Ababa University, Addis Ababa, Ethiopia, 2013. (Unpublished). [Google Scholar]
  63. Alayu, E.; Yirgu, Z. Advanced technologies for the treatment of wastewaters from agro-processing industries and cogeneration of by-products: A case of slaughterhouse, dairy and beverage industries. Int. J. Environ. Sci. Technol. 2018, 15, 1581–1596. [Google Scholar] [CrossRef]
  64. Aghapour, A.A.; Nemati, S.; Mohammadi, A.; Nourmoradi, H.; Karimzadeh, S. Nitrate removal from water using alum and ferric chloride: A comparative study of alum and ferric chloride efficiency. Environ. Heal. Eng. Manag. 2016, 3, 69–73. [Google Scholar] [CrossRef]
  65. Ruzhitskaya, O.; Gogina, E. Methods for Removing of Phosphates from Wastewater. In Proceedings of the MATEC Web of Conferences, St. Petersburg, Russia, 15–17 November 2016; Volume 106, pp. 1–7. [Google Scholar]
  66. Angello, Z.A.; Behailu, B.M.; Tränckner, J. Integral application of chemical mass balance and watershed model to estimate point and nonpoint source pollutant loads in data-scarce little akaki river, Ethiopia. Sustainability 2020, 12, 7084. [Google Scholar] [CrossRef]
  67. Lee, S.; Maniquiz, M.C.; Kim, L.H. Appropriate determination method of removal efficiency for nonpoint source best management practices. Desalin. Water Treat. 2012, 48, 138–147. [Google Scholar] [CrossRef]
  68. Yohannes, H.; Elias, E. Contamination of Rivers and Water Reservoirs in and Around Addis Ababa City and Actions to Combat It. Environ. Pollut. Clim. Chang. 2017, 1, 1–12. [Google Scholar] [CrossRef]
  69. Shi, Q.; Deng, X.; Wu, F.; Zhan, J.; Xu, L. Best management practices for agricultural non-point source pollution control using PLOAD in Wuliangsuhai watershed. J. Food, Agric. Environ. 2012, 10, 1389–1393. [Google Scholar]
  70. Armstrong, G.; Apahamian, M.; Fewings, G.; Gough, P.; Reader, N.; Varallo, P. Environment Agency Fish Pass Manual: Guidance Notes on The Legislation, Selection and Approval of Fish Passes in England and Wales; Environmental Agency: Bristol, UK, 2010.
  71. NSW Department of Primary Industries. Reducing the Impact of Weirs on Aquatic Habitat- New South Wales Detailed Weir Review. Southern Rivers CMA Region. Report to the New South Wales Environmental Trust; NSW Department of Primary Industries: Flemington, NSW, Australia, 2006.
  72. Federal Democratic Republic of Ethiopia Environmental Protection Authority. Guideline Ambient Environment Standards for Ethiopia; Federal Democratic Republic of Ethiopia Environmental Protection Authority: Addis Ababa, Ethiopia, 2003.
  73. Pegram, G.C.; Bath, A.J. Role of non-point sources in the development of a water quality management plan for the Mgeni River catchment. Water Sci. Technol. 1995, 32, 175–182. [Google Scholar] [CrossRef]
  74. Campolo, M.; Andreussi, P.; Soldati, A. Water quality control in the river Arno. Water Res. 2002, 36, 2673–2680. [Google Scholar] [CrossRef]
Figure 1. The LAR water quality monitoring stations and point source locations (AA = Addis Ababa).
Water 13 00584 g001
Figure 2. Schematic diagram of interacting water quality state variables in QUAL2Kw (ab: bottom algae, ap: phytoplankton, mo: detritus, sBOD: slow CBOD, fBOD: fast CBOD, se: sediment exchange, dn: denitrification, Cr: inorganic carbon, DO: dissolved oxygen, no: organic nitrogen, na: ammonia nitrogen, nn: nitrate nitrogen, po: organic phosphorus and pi: inorganic phosphorus).
Water 13 00584 g002
Figure 3. Segmentation (a) and labeling (b) of LAR for QUAL2Kw modeling (WWTPE = wastewater treatment plant effluent).
Water 13 00584 g003
Figure 4. Simulation of QUAL2kw for selected water-quality constituents in LAR (calibration): (a) pH, (b) Electrical Conductivity (EC) (µs/cm), (c) Dissolved Oxygen (DO) (mg/l), (d) Carbonaceous Biochemical Oxygen Demand (CBOD) (mg/L), (e) Phosphate (PO4-P), (f) Temperature (°C).
Water 13 00584 g004
Figure 5. Simulation of QUAL2kw for selected water quality constituents in LAR (validation): (a) pH, (b) Electrical Conductivity (EC) (µs/cm), (c) Dissolved Oxygen (DO) (mg/L), (d) Carbonaceous Biochemical Oxygen Demand (CBOD) (mg/L), (e) Phosphate (PO4-P), (f) Temperature (°C).
Water 13 00584 g005
Figure 6. Evaluation of S1, S2 and S3 for BOD (ac) and NO3-N (d) relative to the base scenario (S0).
Water 13 00584 g006
Figure 7. Evaluation of S3, S4, and S5 for BOD (ac) and PO4-P (d) relative to the base scenario (S0).
Water 13 00584 g007
Table 1. Analytical methods used for the analysis of water quality constituents.
ParameterAnalytical MethodApparatus/Equipment
BODModified Winkler’s MethodBOD Incubator
TDSTDS ProbeHQ40d
CODTitrimetricCOD Digester, heating block
NO2-NSpectrophotometricHACH DR-2800
PO4-PSpectrophotometricHACH DR-2800
NO3-NSpectrophotometricUV−VIS Spectrophotometer
TKNKjeldahl MethodKjeldahl Distillation
TPStannous Chloride MethodUV−VIS Spectrophotometer
NH3-NTitrimetricKjeldahl Distillation
Table 2. General performance ratings of the recommended statistics for a monthly time step.
MeasureOutput ResponsePerformance Rating
Very GoodGoodSatisfactoryUnsatisfactoryReference
R2Nutrient>0.700.60 < R2 ≤ 0.700.30 < R2 ≤ 0.60≤0.30[46]
Flow>0.800.70 ≤ R2 ≤ 0.800.50 < R2 < 0.70≤0.50
PBIASNutrient≤±15±15 < PBIAS < ±20±20 ≤ PBIAS < ±30≥±30[47]
Flow≤±5±5 < PBIAS < ±10±10 ≤ PBIAS ≤ ±15>±15
Table 3. Summary of annual point and nonpoint source load for selected constituents in LAR *.
Point ⁿ and Nonpoint Source Load for Selected Constituents in LAR, t/yr
P R TDSBODCODPO4-PTNNO3-N
T2M180.76 (26.52)27.82 (8.32)189.96 (37.73)0.72 (0.31)1.77 (2.48)0.102 (0.02)
T3M26.56 (89.75)132.09 (59.89)62.43 (185.74)0.15 (1.39)5.39 (14.74)0.57 (0.013)
AM3162.2 (33.76)269.68 (6.39)482.88 (13.69)0.43 (0.45)10.22 (0.58)1.35 (0.122)
T4M454.05 (178.36)644.27 (98.28)14.31 (189.45)0.24 (1.18)11.23 (10.18)4.06 (0.056)
KM536.8 (306.68)51.9 (105.96)585.63 (821.2)1.99 (3.34)15.91 (5.3)0.083 (0.74)
T6M9581.9 (3185.59)1540.12 (1005.59)5319.12 (2867.5)12.43 (26.2)157.24 (342.6)67.17 (1.39)
T5M10910.12 (358.87)792.22 (98.13)1119.37 (341.95)13.92 (4)674.79 (22.07)33.3 (0.115)
WM11558.85 (49.42)581.5 (3.48)1367.92 (60.74)7.46 (0.62)97.02 (7.076)34.82 (0.74)
BM12730.78 (103.46)1504.8 (14.53)2170.24 (27.32)23.63 (1.77)30.46 (7.617)6.53 (1.912)
MM131916.16 (440.96)1511.68 (217.12)308.91 (622.17)23.63 (8.14)35.45 (147.26)6.79 (1.005)
M8M14389.71 (5874.3)2664.75 (1052.19)2551.43 (11,661.7)7.72 (15.5)76.82 (223.04)13.45 (16.33)
T1 (42.69)(19.99)(82.62)(0.58)(5.27)(0.023)
Point source monitoring stations where A represents (AWF), K represents (AA_Kerawoch), W represents (W_TAN), B is for (B_TAN) and M is for (AA_WWTPE) on Figure 1; Catchment outlet which represents the river segment (reach) between two nearby monitoring stations for nonpoint source load estimation; ⁿ Point source loads (values in the bracket, italics); * Summarized from previous work of the authors, Angello et al. [66].
Table 4. Sensitivity analysis results for selected parameters in LAR.
ParameterVariation (%)Disturbance on the Parameter (%)
DOBODPO4-PNO3-N
Point source flow +5018.876.3110.005.86
−5046.9314.8411.803.84
Headwater Flow +503.853.780.371.34
−503.565.220.011.92
Manning’s Roughness Coefficient +5041.5919.501.254.33
−5049.9619.082.7211.14
Slow BOD hydrolysis +501.1220.010.090.037
−500.9035.260.140.32
Slow BOD oxidation rate+500.681.120.360.27
−505.901.200.420.28
Organic nitrogen hydrolysis rate+501.170.020.166.74
−504.820.050.005.95
Organic nitrogen settling velocity+501.090.010.056.41
−506.790.060.065.71
Ammonium nitrification rate+502.150.010.120.19
−501.120.010.070.41
Sediment denitrification transfer coefficient +500.320.010.1719.73
−501.450.010.1135.95
Organic phosphorus hydrolysis+500.010.000.030.019
−500.000.000.040.008
Inorganic phosphorus settling velocity +501.260.0111.780.22
−500.260.0017.360.37
Most influential parameters; percentage disturbance is in the absolute value of the number.
Table 5. Average percentage constituent improvement for various hypothetical pollution reduction scenarios in LAR.
ScenarioDescriptionAverage Percentage Improvement
BODPO4-PNO3-N
S1Modification of point source load17.7237.4719.63
S2Modification of diffuse source load58.6930.9651.07
S3Simultaneous modification of point and diffuse load76.4149.2854.15
S4Application of local oxygenation techniques (cascaded rock ramp)51.515.8010.90
S5Integrated scenarios (S1 + S2 + S3 + S4)87.7853.7255.6
Publisher’s Note: MDPI stays neutral with regard to jurisdictional claims in published maps and institutional affiliations.

