Article

Living and Prototyping Digital Twins for Urban Water Systems: Towards Multi-Purpose Value Creation Using Models and Sensors

by
Agnethe N. Pedersen
1,2,*,
Morten Borup
2,
Annette Brink-Kjær
1,
Lasse E. Christiansen
3 and
Peter S. Mikkelsen
2
1
VandCenter Syd (VCS Denmark), 5000 Odense C, Denmark
2
Department of Environmental Engineering (DTU Environment), Technical University of Denmark, 2800 Kgs. Lyngby, Denmark
3
Department of Applied Mathematics and Computer Science (DTU Compute), Technical University of Denmark, 2800 Kgs. Lyngby, Denmark
*
Author to whom correspondence should be addressed.
Water 2021, 13(5), 592; https://doi.org/10.3390/w13050592
Submission received: 11 December 2020 / Revised: 12 February 2021 / Accepted: 22 February 2021 / Published: 25 February 2021
(This article belongs to the Section Urban Water Management)

Abstract

:
In this paper, we review the emerging concept of digital twins (DTs) for urban water systems (UWS) based on the literature, stakeholder interviews and analyzing the current DT implementation process in the utility company VCS Denmark (VCS). Here, DTs for UWS are placed in the context of DTs at the component, unit process/operation or hydraulic structure, treatment plant, system, city, and societal levels. A UWS DT is characterized as a systematic virtual representation of the elements and dynamics of the physical system, organized in a star-structure with a set of features connected by data links that are based on standards for open data. This allows the overall functionality to be broken down into smaller, tangible units (features), enabling microservices that communicate via data links to emerge (the most central feature), facilitated by application programing interfaces (APIs). Coupled to the physical system, simulation models and advanced analytics are among the most important features. We propose distinguishing between living and prototyping DTs, where the term “living” refers to coupling observations from an ever-changing physical twin (which may change with, e.g., urban growth) with a simulation model, through a data link connecting the two. A living DT is thus a near real-time representation of an UWS and can be used for operational and control purposes. A prototyping DT represents a scenario for the system without direct coupling to real-time observations, which can be used for design or planning. By acknowledging that different DTs exist, it is possible to identify the value-creation from DTs achieved by different end-users inside and outside a utility organization. Analyzing the DT workflow in VCS shows that a DT must be multifunctional, updateable, and adjustable to support potential value creation across the utility company. This study helps clarify key DT terminology for UWS and identifies steps to create a DT by building upon digital ecosystems (DEs) and open standards for data.

1. Introduction

Digital twins (DTs) are currently receiving growing interest across many research and industrial application areas, as there is an increasing focus on digitizing production lines and processes and gaining information from data using advanced methods such as machine-learning and improved visualisation of the results. DTs provide a method to support and connect many of these elements, and, according to the Gartner hype cycle, DTs represent a novel technology with very high expectations in terms of productivity increases over the next 5–10 years [1].
The DT concept was originally developed in the manufacturing industry with, among other things, the intent to prolong the lifetime of products by not only looking at the design of products, but also exploring how the products work in reality by transmitting information from each product back to the manufacturer during the use phase [2]. The DT concept is currently being explored in several application areas, such as health, meteorology, education, and cities [3], as well as the area of urban water systems [4,5], where investments are high, and incorrect investments can be detrimental to public health and the environment. For example, utilities in Denmark spend 1 billion euros annually for the expansion and rehabilitation of urban drainage systems [6]. Investments are largely based on hydrodynamic models that can simulate the behavior of the systems in different operational, planning, and design situations. These models must be accurate to give trustworthy results, which can be achieved using calibration and validation techniques. However, calibration is considered cumbersome, time-consuming, and thus expensive compared to many other duties of a utility company, and many sensors and staff resources are needed to obtain system-wide measurements of water levels and flows for extended periods of time. In practice, calibration is thus often carried out for only short periods of time, with few measuring points. Similar challenges exist for water distribution systems, where, e.g., water leakages are one of the main drivers behind an increased focus on monitoring and modeling. In this paper, we mainly explore DTs with a focus on urban drainage systems, but our findings will be of general interest within the broader field of urban water systems engineering.
A utility company, VCS Denmark (in Danish, VandCenter Syd—hereafter called VCS), started its journey in 2008 towards documenting the performance of its urban drainage system using sensor data and automated daily model runs. Initially this was done by visually comparing the model results with measurements from a gradually growing number of monitoring locations (+300 in 2021, mostly water level sensors, for an urban drainage system of 2650 km pipes covering 11,500 ha). Although there was a great deal of confidence in these models, reality did not always agree with the simulations. It was realized that increased awareness of the performance of the models was needed, and VCS thus set out to find a method capable of quantifying the performance of the models in a structured and consistent manner, aimed at ensuring transparency in the quality of the models. VCS sees the tools used in the modeling process as puzzle pieces that do not yet fit entirely together and where the overall puzzle currently does not sufficiently match reality (Figure 1). The puzzle currently includes (i) attributes that describe the assets where information is semi-automatically updated to the models, (ii) a set of different models describing the surface runoff, infiltration-inflow, and dynamic flow in the pipes, (iii) observations of rainfall that drive the simulations, as well as level and flow observations that can be used to validate the model results, and (iv) primarily manual procedures for analyzing the results and updating the knowledge of system attributes that are then fed back into the attribute database. The various pieces of the puzzle have been improved and updated over the years using tools and methods provided by a range of suppliers. Nevertheless, the puzzle pieces do not always fit well, and some pieces may be missing, indicating that the value of these models for planning and design still lag behind expectations and that the process for their continuous improvement needs streamlining. Many years of observations and fairly acceptable models have been achieved, but it is recognized that there is unexploited potential to obtain greater value from these data and models [7,8]. To address these challenges, VCS has decided to embark on a journey exploring the concept of DTs, which is outlined in this paper.
By applying the DT concept to the urban water system context, we explore relatively unknown territory. We propose the term “living DT” specifically for the urban water system context because of the long-lived nature and fundamental temporal and spatial changes of the underground infrastructure connected to urban transformations, which make this context very different from other application areas.
Building a DT for an urban water system may seem incomprehensible to some, as many utility companies have not yet installed sensors extensively in their systems, and such sensors are required for making a living DT. Some utility companies employ hydraulic models of their systems that somewhat represent the underground infrastructure, but as explained above for VCS, these models need improvements to fully realize their potential. When building and maintaining expensive models and sensor systems, it is important to optimize the output and value generated [7]. The next step towards developing a DT may thus seem challenging, but we aim with this paper to provide increased insight into the multi-purpose value creation that a DT can add to water utility organizations and authorities. The overall aims of this paper are the following:
  • To propose the concept and a terminology relevant to DTs in urban water systems;
  • To identify the value creation for multi-purpose needs from the perspectives of a utility company and authority;
  • To analyze and illustrate the workflow and dataflow for building and maintaining a living DT in VCS and thereby inspiring a greater exchange of ideas and experiences internationally.
The paper is structured by first presenting the research methodology and the utility company investigated (Section 2), followed by Section 3, which provides a general and structured overview that defines DTs as an open-feature-based concept in a hierarchy from the component to the city scale. Section 4 reviews DTs for water and wastewater systems and provides more specific definitions relevant to DTs for urban water systems, with a specific view towards using both low-fidelity (Lo-Fi) and high-fidelity (Hi-Fi) models in living and prototyping DTs for different specific purposes. The multi-purpose living DT of VCS’ urban drainage system is presented and discussed in Section 5, with a focus on the value-creation across the entire VCS organization, as well as the currently implemented workflows and data flows of this DT and the planned future developments. Finally, the overall conclusions are summarized in Section 6.

2. Materials and Methods

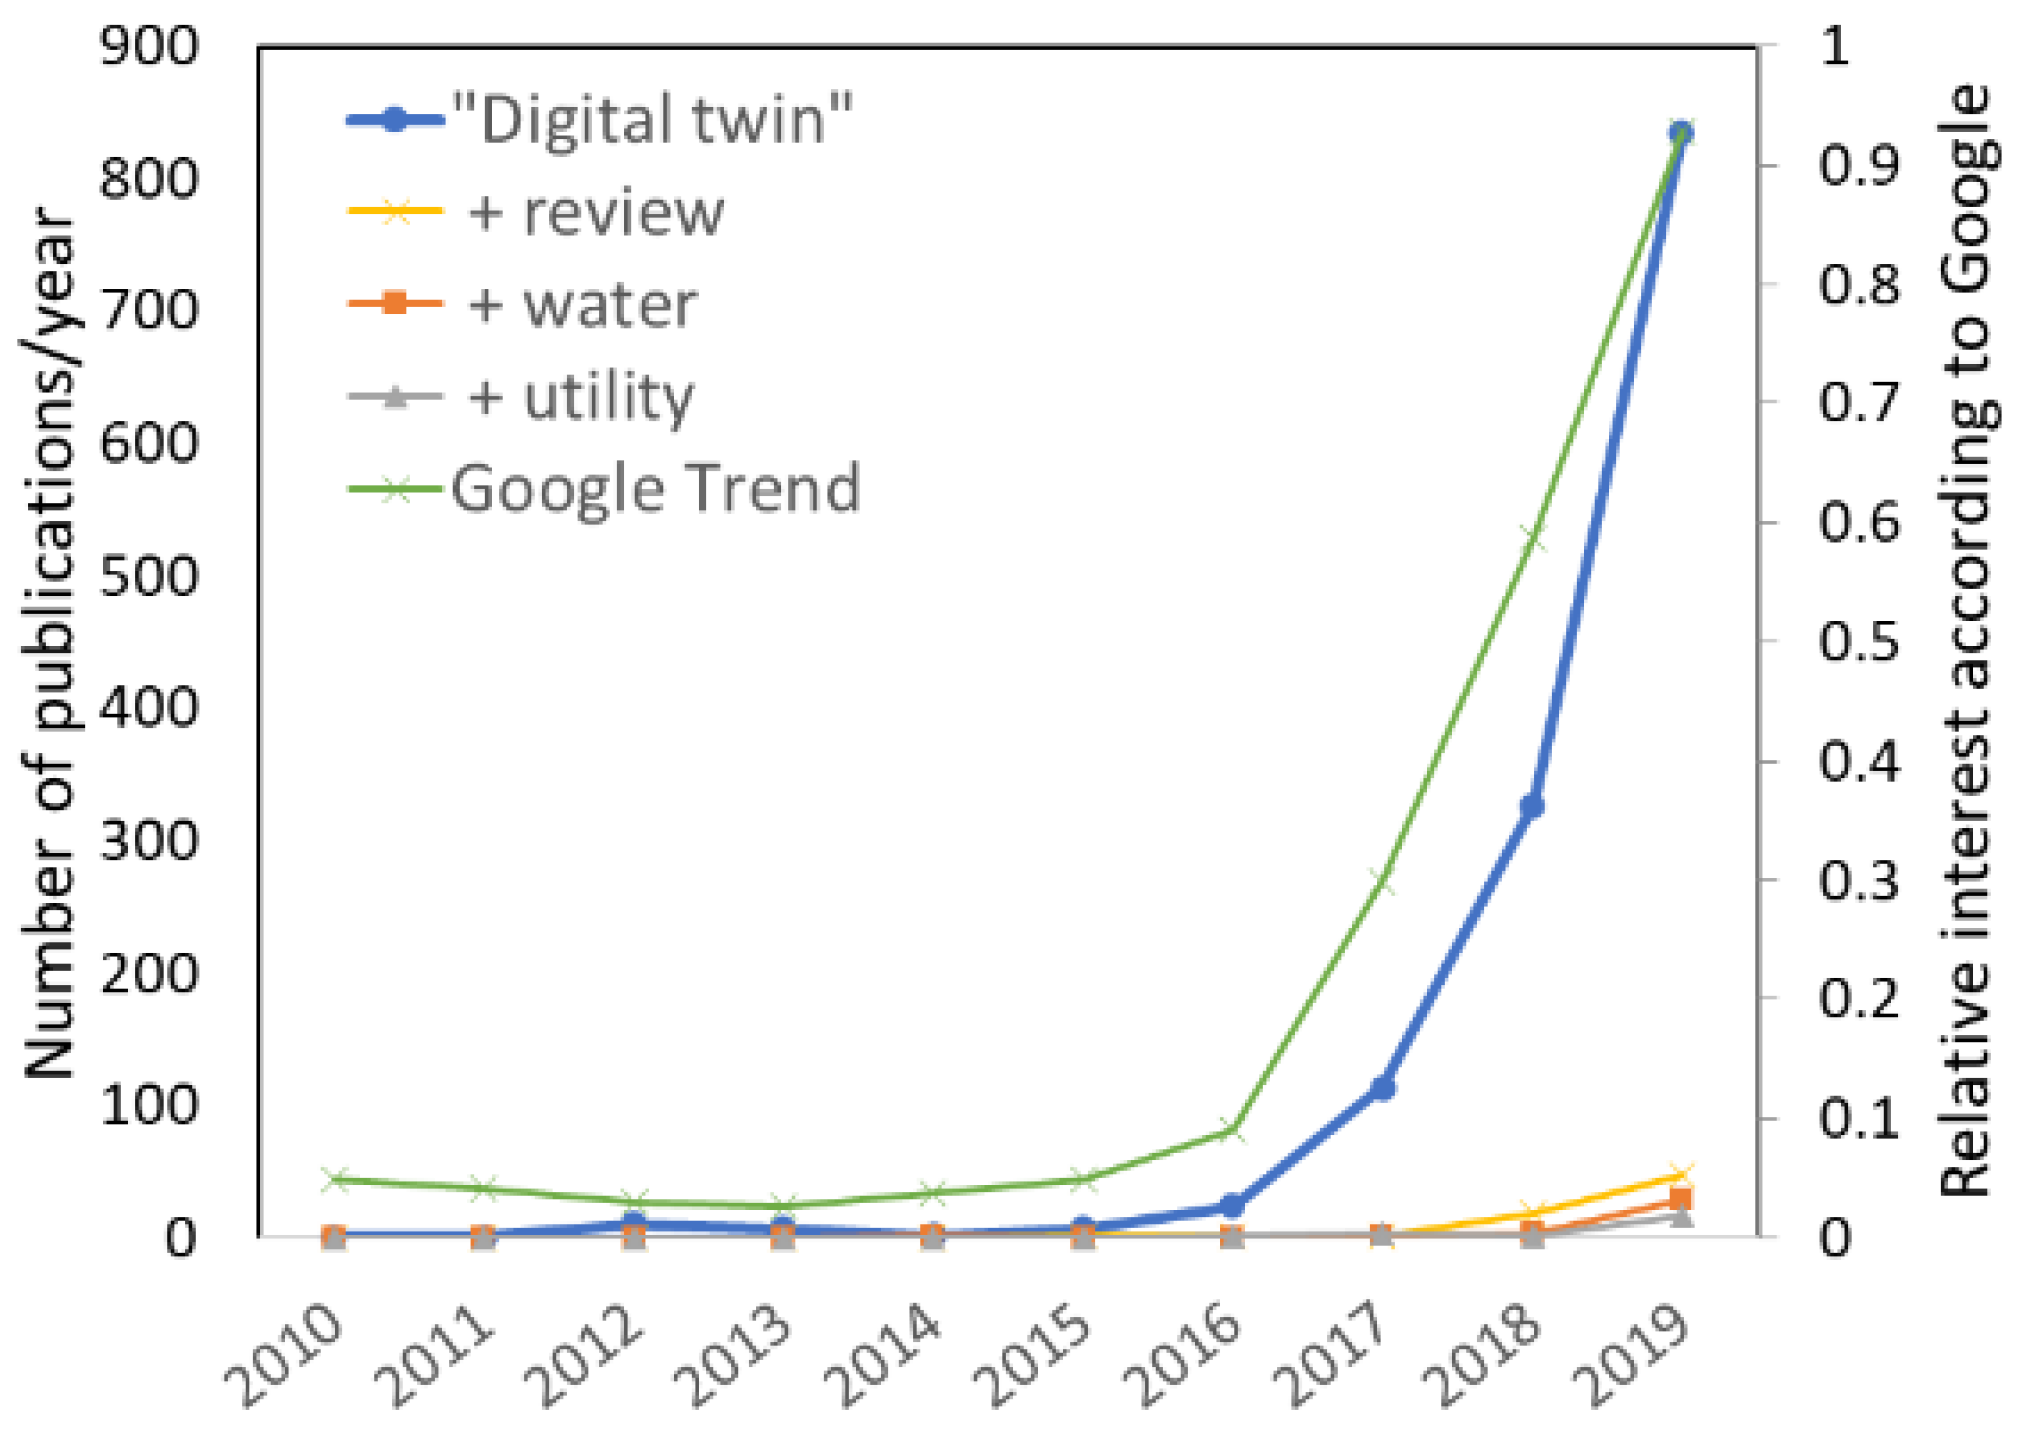
2.1. Literature Study

Scientific literature, professional magazines, and marketing materials were analyzed to understand how the concept of DTs is used in different fields and for different purposes. Academic materials were found using the Scopus search engine, and Google was used to find non-academic literature. Search terms were related to “digital twin” with the addition of water-related keywords (Figure 2).
Along with the vision of Industry 4.0 [9] and due to the emergence of cheaper sensors and faster data processing [8], the DT concept has evolved rapidly over the past decade. Our literature search showed that the interest in DTs has exploded over the past few years, with an ever increasing number of papers (Figure 2). DTs are particularly researched in the field of manufacturing; only a limited number of scientific papers were found in water-related research fields, with even fewer focusing on defining DTs in a structured way [4]. Many industries and consulting companies, however, praise the virtues of digital twins in professional magazines [10,11,12,13] and on their websites [14,15,16]. Some utility companies appear to take a structured approach to working with DTs, but, for the most part, they do not publish their findings in scientific journals, so they are not present in the Scopus statistics. To indicate that DT is not a concept used only in academia, a relative trend analysis of Google searches was conducted (Figure 2, green line), showing a large increase in the overall interest in DTs over the past five years.

2.2. Professional Network Interactions and Interviews

We also participated in discussions, workshops, and webinars held in professional water fora, such as the Smart Water Network (SWAN), which has a dedicated DT working group [19], as well as the International Water Association, which launched a whitepaper on digital water [20] in 2019 and currently hosts a series of webinars on related issues, including DTs [21]. Interviews with employees with various functions in the utility company, VCS, were ultimately conducted to learn how the utility company’s staff members anticipate daily life with DTs in the coming years and what value creation they anticipate from implementing DTs in the VCS organization.

2.3. The VCS Service Area and Utility Organization

VCS is a water and wastewater utility company located in Funen, Denmark. The 757 km2 service area is in the lowlands (below 80 m.a.s.l., with the main part of the service area below 40 m.a.s.l.), with an average annual rainfall of 700 mm. VCS’ water production and distribution totals 10 million m3 annually. However, VCS is not the only distributor of drinking water in the service area. A number of private water firms deliver water to settlements outside the major urban conglomerations [22]. VCS manages stormwater and wastewater for around 230,000 citizens and for industry in the municipalities of Odense and Nordfyn, which are also the owners of VCS. The municipalities also act as authorities for approving the environmental impacts of the utility company in the area and for the recipients. Here, eight water resource recovery facilities (WRRFs) treat 28 million m3 of wastewater annually.
The VCS organization has three overall departments relating to DTs: Operation and maintenance, Investments and business development (planning, design, construction, and documentation) and Customers and communications. An external department, Authorities, in the municipality also has an interest in the DT and focuses on documentation of the utility company’s footprint on the environment and acts as authorities for VCS. All four departments have responsibilities concerning water production, water distribution, wastewater and stormwater collection, and wastewater treatment.

3. Overview of the Digital Twin Concept

There is currently no clear consensus in the scientific literature on the meaning of the term DT, which results in a very broad and fuzzy application of the DT concept and a dilution of the terminology related to the DT concept [5,23]. Models play important roles in DTs, but as explained below, a DT has many features, including simulation models. A DT can cover many professional areas and different purposes. Since this term is relatively new in urban water systems engineering, it will be valuable to examine how other industries define DTs.

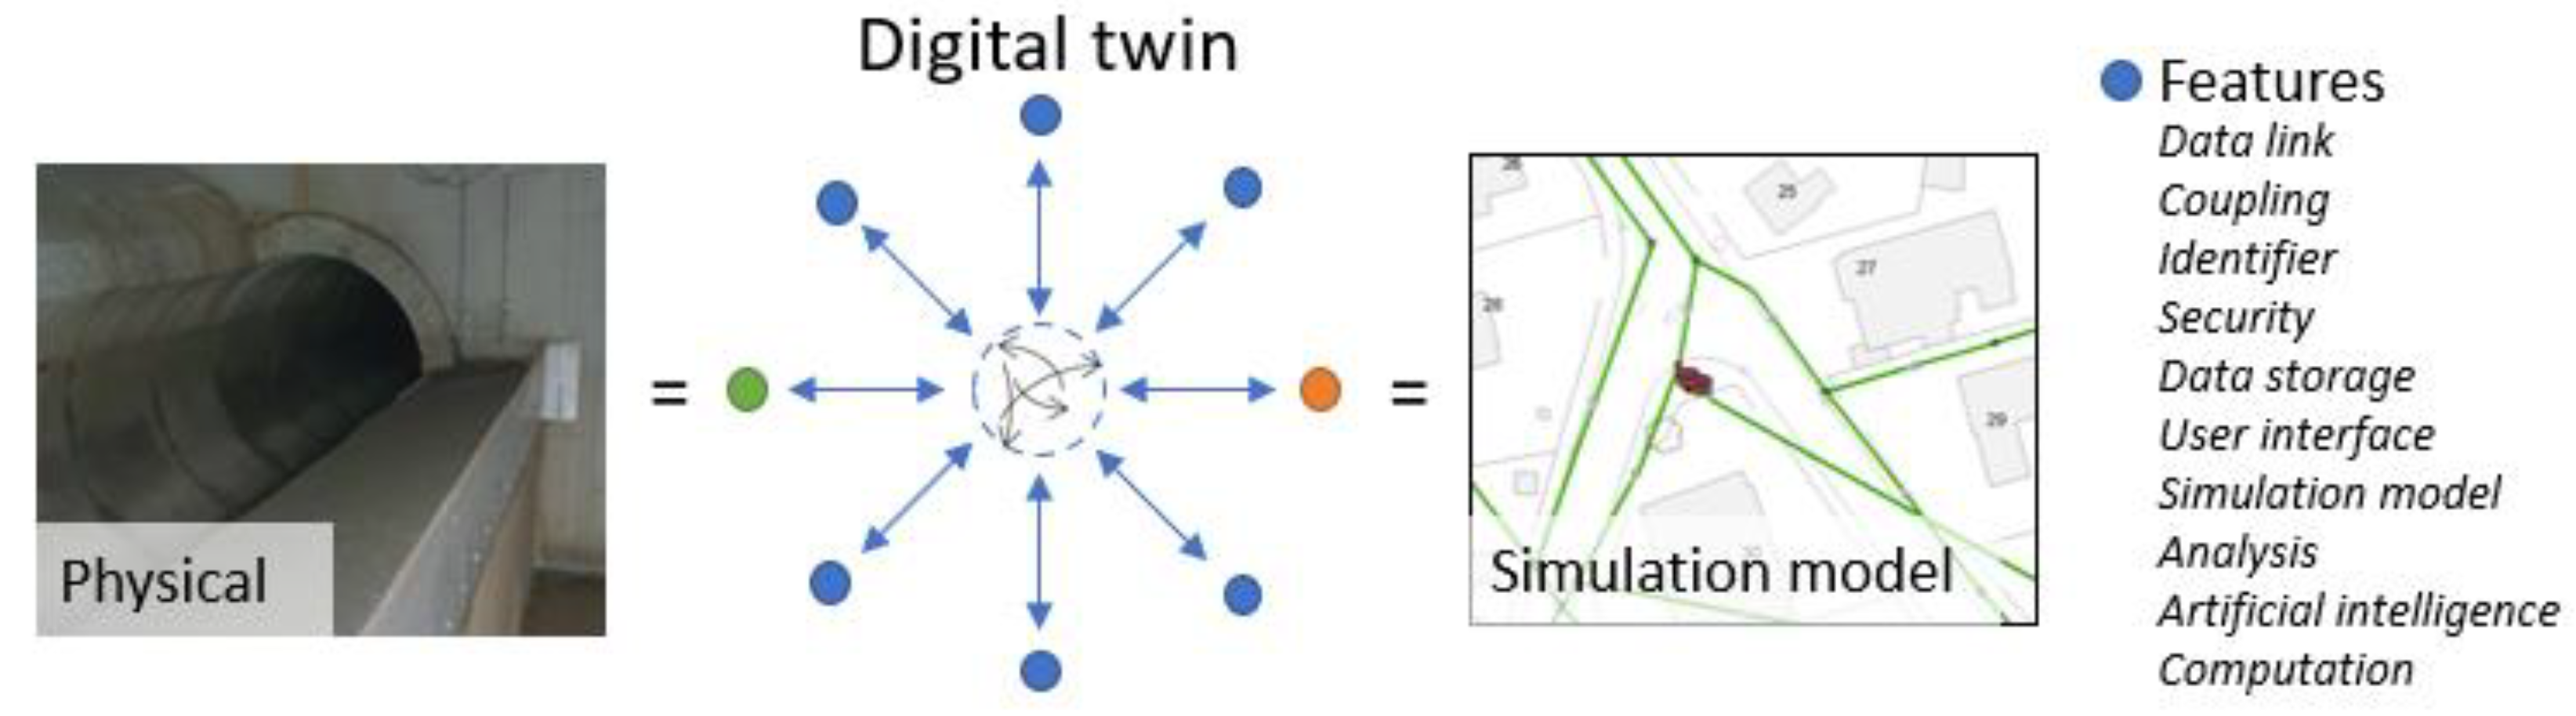
3.1. Definitions—Digital Twins as an Open Feature-Based Concept

The foundation of the DT concept emerged around the turn of the millennium, focusing on Product Lifecycle Management, where performance data were sent from a real space to a virtual space, and control or maintenance information was sent in the other direction [2]. Several review papers have been published without a uniform definition of DTs [3,24,25]. In this paper, we explain the concept of DTs using the definition cited in the Introduction, primarily by examining work done by Grieves and Vickers (2017), Autiosalo et al. (2020), and Wright and Davidson (2020) [2,23,24].
Grieves and Vickers (2017) [2] argue that there are two different types of DTs: Prototypes and Instances. A prototype is a DT that can be used to optimize a final design, which is particularly relevant for very expensive and complex products that cannot be constructed by doing physical experiments. A DT instance can be understood as a DT of a product that has left the factory and returns information on how that product acts outside production lines. DTs can also be either predictive or interrogative according to the aim of the DT. A prototype DT is predictive but not interrogative, whereas a DT instance can have predictive behavior (for example, analytics to predict wear and tear) and still be interrogative (reacting to information about the physical twin’s current state). Different DTs can also be managed in a digital twin environment (DTE).
Autiosalo et al. (2020) [24] performed a thorough literature analysis and built upon the work of Grieves and Vickers (2017) [2]. The authors argued that a DT consist of several “features” that describe the DTs technical functionalities, listing the following types of features: data link, coupling, identifier, security, data storage, user interface, simulation model, analysis, artificial intelligence, and computation. All these features do not need to be present in a DT, but some are more important than others, depending on the application area.
Wright and Davidson (2020) [23] used a modeling approach to discuss DTs, claiming that the ever-changing behavior of physical objects greatly justifies the need for DTs, emphasizing that updating and adjusting DTs according to data about/from each physical twin is essential. This highlights the importance of the “coupling” between the DT and the physical twin.
Here, we propose to define a DT in the context of urban water systems as a “systematic virtual representation of the elements and dynamics of the system” composed of a set of features organized in a star-structure, similar to that outlined by Autiosalo et al. (2020) [24] (Figure 3). We emphasize the importance of including an ever-changing physical twin, which, linked by the coupling feature, makes the DT a “living DT”. The terminology “living” is used here to characterize DTs representing the system as it is right now in real-time and seeking to replicate reality in the most accurate possible way. The puzzle pieces in Figure 1 can be translated into features, e.g., attribute and observation data are stored in features of the type “data storage”, which is populated by data flowing from the physical twin through the ‘coupling’ feature and the “data link” feature. Models also play a large role in the DTs of urban water systems, receiving information from the data storage through the data link. We also argue that the DT must be updateable and adjustable either manually or automatically, in which case, a range of tools may be useful and are classified here as belonging to the “analysis” feature type.
Organizing DT features in a star-structure, as illustrated in Figure 3, has many advantages [24]. Apart from the obvious benefit of breaking the overall DT functionality down into smaller, more tangible units, the star-structure is well-known in computer science, where it is key to the success of the Internet of Things (IoT), allowing the emergence of “microservices” that communicate via data links enabled by application programing interfaces (APIs) based on standards for open data, making them easier to maintain and scale-up. The star-structure, furthermore, allows one to use features from (and the development of features by) different suppliers, rather than relying on proprietary “all in one” stand-alone software solutions that are difficult to combine and further develop as the needs of the utility organization evolve over time.
In urban water systems, the following features are particularly important to discuss and develop: The data link and coupling features (together responsible for data acquisition, a field that is experiencing rapid growth in the water sector), the data storage feature (making full use of cloud and fog data storage possibilities, with proper consideration of the “4Vs in Big Data”—volume, velocity, variety, and veracity [26]), the “user interface” feature (crucially important for the DT idea to be accepted across a utility organization), and the “simulation model” and analysis features (examples of these will be elaborated later in the paper). We refer to Autiosalo et al. (2020) [24] for further explanations of the features including those not mentioned here and additional arguments behind the star-structure provided in Figure 3.

3.2. Value Creation in Digital Ecosystems through Digital Twins

The concept of digital ecosystems (DEs) can be defined broadly as “distributed, adaptive, open socio-technical systems with the properties of self-organization, scalability, and sustainability inspired from natural ecosystems” [27]. This concept has recently been pushed by the World Economic Forum (WEF) [28]. DEs have different modular parts that jointly act as a unit with an overall effort to add value to end-users, which is consistent with the above definition of a DT as a star-structure (Figure 3). Flexibility, collaboration, and open standards make the DE very efficient, where multiple third parties can easily become partners in delivering a DT for the benefit of all. This may challenge traditional corporate structures that normally favour the provision of proprietary products and services that cover all functions of end-users, while DEs instead require openness and governance toward the orchestration of collaboration among different users and companies [28]. Water utility companies are end-users of many such products and services, and their role in stimulating the future development of DT products and services in a manner compliant with DE thinking cannot be underestimated. DEs support the interactions between different disciplines in computer science, data science, and the domain knowledge of water, which have all historically been required to create sustainable solutions in hydroinformatics [7].

3.3. Examples of Digital Twins Applied at Different Scales

NASA (the US National Aeronautics and Space Administration) is one of the DT frontrunners and has applied the concept for several years [29,30]. DTs are important to NASA because of the organization’s complex and unique products, for which NASA cannot optimize a physical prototype before producing the final product to be sent into space.
For many production companies, such as car manufacturers, DTs assist in providing knowledge of the product in real life after the product has left the factory, continuously sending information back to the DT to monitor and predict the performance of the product [31]. Each car has its own living DT instance that reports back to the manufacturer. With a DT, manufacturers not only design and deliver the product (prototype DT) but also change their perspectives to deliver a service that enhances the product’s performance throughout its entire lifetime (a living DT). For a production plant to run optimally, a DT can give an overview, indicate optimization potential, and support predictive maintenance, thereby making the plant more efficient [32]. The application of DTs has also evolved in non-manufacturing areas such as urban space methodologies, where discussions of DT terminology also occur [33,34,35], and national DT strategies are emerging [36].
DTs in different application areas operate at different levels, such as component, unit process/operation or hydraulic structure, plant, system, and city and society, as outlined in Table 1. In the manufacturing industry, the physical units focused upon are typically components produced to become part of more advanced physical products. The DT concept can be scaled to increasingly complex DTs with diverse inputs and boundary conditions (even multiple DTs incorporated into one DT). A product is often ‘one-to-many’ when it has a prototype and many instances reporting back to the manufacturer. A plant may be ‘one-to-many’ if a standardized process design is used (some industries seem to be based on this concept; for example, cement production plants and water resource recovery facilities (WRRFs, also referred to as wastewater treatment plants)). An urban water system is, however, “one-to-one”, as such a system is rarely designed from scratch at the system-level but tends to grow and evolve over the decades and centuries along with urban growth and as the technology at the component, product, process, and plant levels evolves. An urban water system DT will, therefore, be unique in its content—DTs for different urban water systems may use the same features but in their own unique ways. With the hierarchical organization of DTs in different application areas as outlined in Table 1, the terminology and understanding of the diversity of DTs can become more precise.

4. Digital Twins for Water and Wastewater Systems

DTs for urban water systems are, as seen in Figure 2, a relatively new concept in academia. A recent report on digital water from the International Water association, IWA [20], highlighted the concept of DTs as a tool to help digitize utility companies but provided no uniform definition. The DT group in the SWAN industry network [19] proposed a graphical illustration to define the DT concept for water and wastewater systems, where data integration, analytics (both data-driven and physics-based models), and visualization are emphasized as key elements in a DT. These have been identified as key elements for water treatment and distribution systems, but the importance of being “hydraulically accurate” and using “short time steps” has also been highlighted [12]. Therrien et al. (2020) [5] discussed the DT concept from a WRRF perspective and suggested that the key components of a DT are a virtual system capable of simulating a physical system, measurements, the real-time exchange of data, predictions, and intelligent actions. The authors concluded that a consensus on what components are required to call a digital system a DT is strongly needed to avoid misusing this powerful concept and added that this consensus-building has already begun in the field of water and wastewater networks.

4.1. Living Digital Twins for Water Distribution and Urban Drainage Systems

Urban water systems are unique in their composition and characterized by constant change and renewal. One cannot clearly define the lifetime of an urban water system because such a system never truly dies (except in the case of natural disasters, war, or political decisions to move an entire city). The attribute data and structure of the DT must be continuously adjusted to reflect reality because reality changes in both time and space. Urban water systems are, furthermore, typically unique and complex infrastructural systems whose components are interlinked and, to a large extent, placed underground. These systems are, therefore, complicated to repair or renovate in the event of a failure and are also difficult to monitor. This makes DTs for urban water systems fundamentally different from DTs at the plant, process, product, and component levels (cf. Table 1).
For DTs at the component level in the water sector, several pump manufacturers have begun to use DTs to optimize their products’ value propositions for customers [40]. However, for an urban water system, we must consider a whole system and not just a component, which changes how the DT is perceived. Not all features that are interesting from a component perspective are necessary from a system perspective, and vice versa.
In the water distribution industry, DTs have been known for several years, with some utility companies either already running a DT or having started their journey towards one, e.g., Global Omnium in Valencia, Spain [4], Consorci d’Aigües de Tarragona in Spain, Portsmouth Water and Anglian Water in the UK, and Halifax in Canada [41]. The goal of these DTs is primarily to reduce water leakage by analyzing data through models and to predict the risk of pipe breaks occurring to ultimately provide better service to their customers. The purpose may also involve diagnosis of the pumps in the system, as done in Gwinnett County, Georgia, USA [42]. By diagnosing pumps at the system level, the purpose is the same as that of a pump manufacturer investigating its product but with added opportunities to extract other information at the system-level that is not known to the component manufacturers. Water distribution systems are characterized as closed systems with repetitive daily demand patterns and typically with more sensors installed compared to urban drainage systems (e.g., flow meters in the system installed to find leakages). They are, however, more difficult to inspect due to the smaller diameter of the pipes, and therefore errors in the pipe system have to be identified indirectly by interpreting model and sensor data, which is a strong motivation for acquiring a DT.
For urban drainage systems, the complexity may increase because the input of rain is stochastic and temporally and spatially varying by nature and because run-off depends on past weather events, as well as many other time-varying phenomena. These present challenges to urban hydrology and rainfall-runoff modeling, which are still subject to intensive research [43,44,45]. Underground pipes are also sometimes in poor condition, resulting in increased infiltration or exfiltration. Urban drainage systems are typically not monitored with as many sensors as distribution networks, so the current simulation models cannot simulate all processes accurately, increasing the need to learn from observations and establish a DT. Complex systems that change over time can greatly benefit from a DT, according to Wright and Davidson (2020) [23].
A SCADA (supervisory control and data acquisition) system in which data from measurements are stored and visualized and actions are taken through control rules could in principle act as a living DT, but the features of simulation models and advanced analytics are often lacking. Moreover, since SCADA systems are usually closed for non-experts, such systems cannot generally be interpreted as DTs.

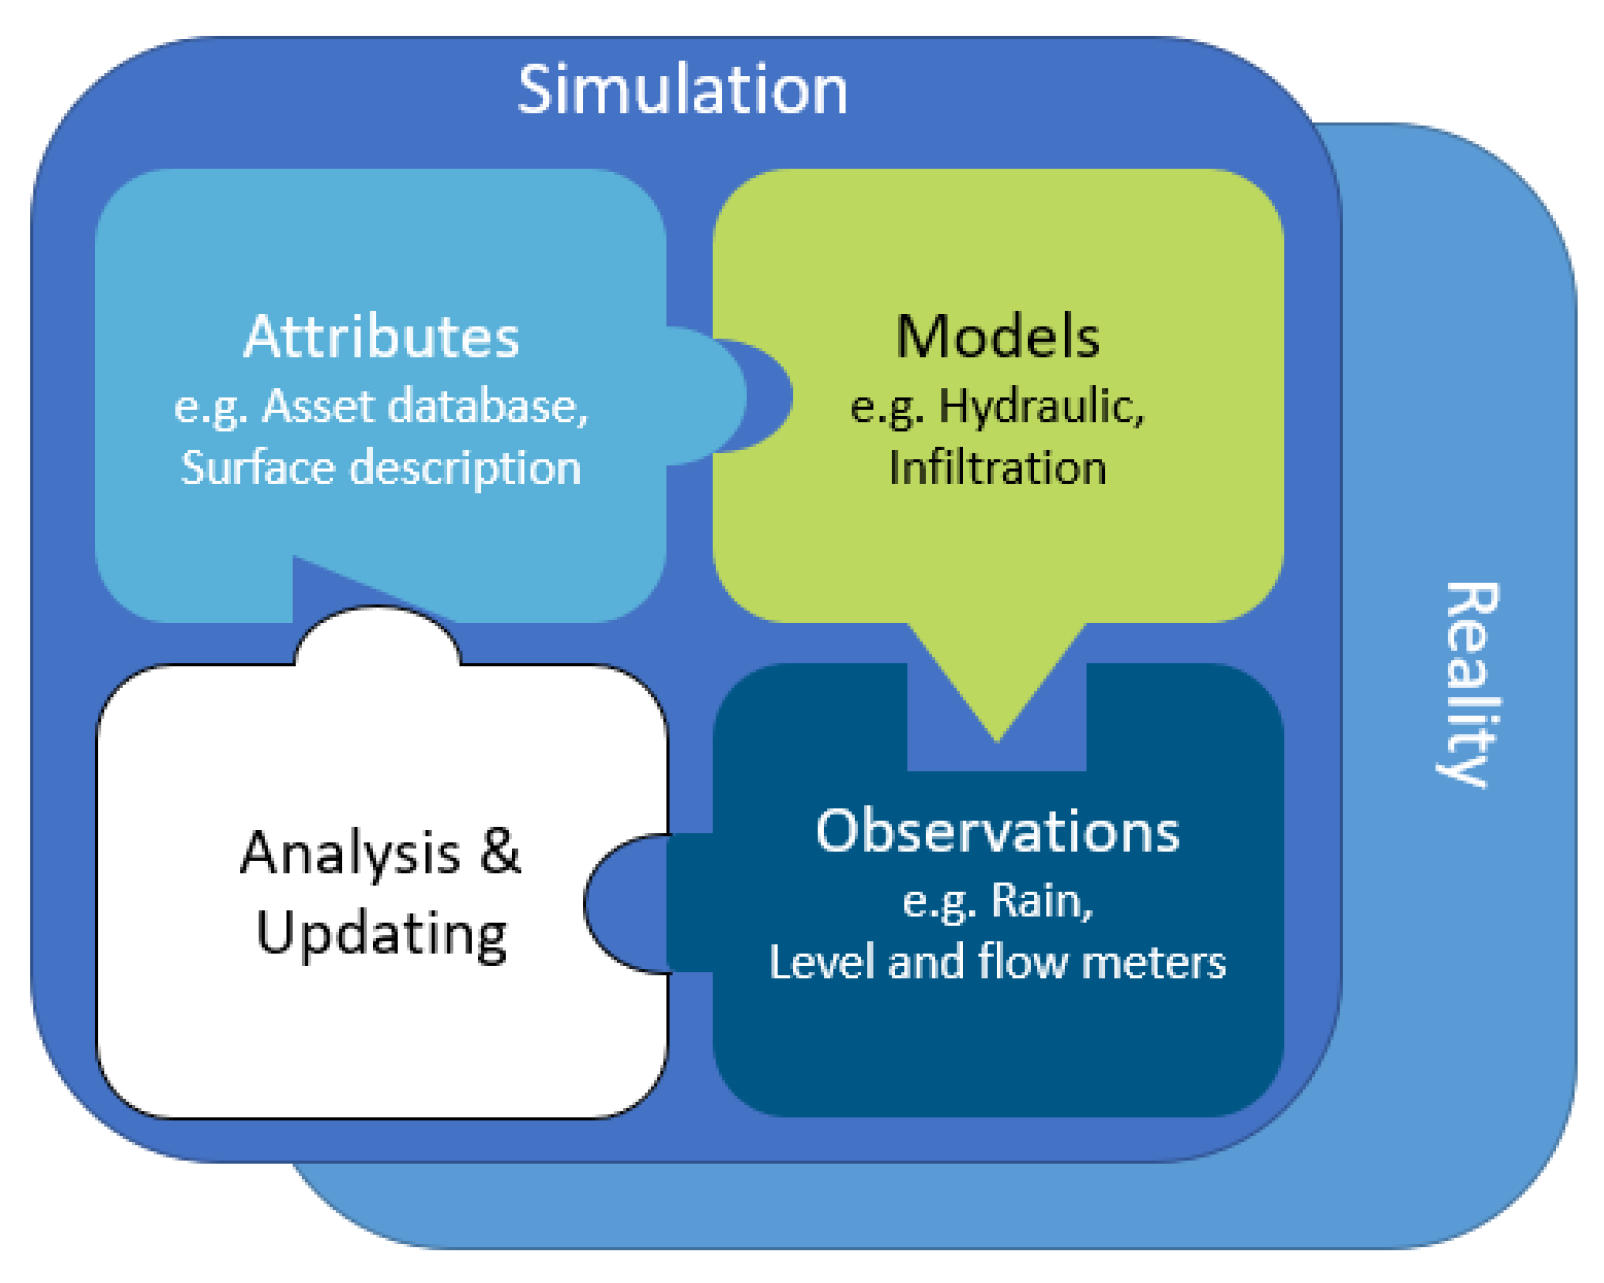
4.2. Simulation Models in Living and Prototyping Digital Twins for Urban Drainage Systems

An important feature of DTs is simulation modeling, and different simulation models can be used depending on the purpose. In the following section, we will explore more deeply the simulation models for urban drainage systems; however, these conceptualisations can also be applied to other urban water systems. A model is defined by its representation of the system. A well-defined model can simulate a change in the system and provide a realistic output of the consequences of that change. The level of granularity of the different elements in the model determines the resolution required to provide a sufficient solution to a defined problem [46]. This granularity is of high importance when choosing or developing a model. The simplified dynamic representation in a coarse-grained Lo-Fi planning model cannot be used, for example, to simulate detailed dynamics of urban water systems or design a hydraulic construction, unlike some Hi-Fi models, including distributed hydrodynamic pipe network models and computational fluid dynamics (CFD) models. A comparison of the results from the simulation model with observations from the physical system must also be possible in a living DT [23]. This comparison must handle changing conditions, as the dynamics of the urban drainage systems change greatly depending on the weather, ranging from the calm flow of wastewater during dry weather to cloudbursts that provide high peaks, overflows, and flooding in the system. To compare different states, it is necessary to define statistical objective functions that can indicate when and where the models are sufficiently accurate and when and where they are not.
Models can be classified as living and prototyping, which can both be further divided into Lo-Fi and Hi-Fi models (Figure 4). Models in living, operation DTs need to replicate reality with a high level of accuracy and use near real-time input. These models should be Hi-Fi models, wherein reality is reproduced, featuring all manholes, structures, etc., and there is an opportunity to extract information about locations in the system where no measurements are made. Simplified (Lo-Fi) models (also referred to as surrogate models when derived from Hi-Fi models) are often used in control optimization algorithms because they offer faster computation but also because the level of their granularity may not need to be very high [47]. This interpretation is aligned with that of Sarni et al. (2019) [20], who discussed operational and control models as inputs to real-time DTs. Input are often real-time, e.g., from multiple rain gauges or from rainfall-radar systems. Prototyping DTs are used in integrated or strategic planning (e.g., [48,49]) and for designing future solutions. These DTs are mostly focused on system expansion, e.g., because of new urban developments that will be connected to the existing urban drainage system, or system retrofits, where existing hydraulic structures are being redesigned to improve performance. Lo-Fi surrogate models are often used for planning but not for design purposes, for which Hi-Fi CFD models are increasingly being used. Input is seldom done in real-time. Instead, historical observations are used alongside conceptual models of the inputs, and parameters (e.g., synthetic storm events, estimated roughness coefficients, etc.) are used to extract the desired characteristics from the attributes and observations.
Both living DTs and prototyping DTs rely on the attributes and observations obtained in the system. These models are different, but the knowledge obtained in one model can be transferred to the other model. By, e.g., reducing the uncertainty of the known processes in the (living) operational model, it may become possible to explore various unknowns (for example, a poor fit may force us to consider revising the model’s description of the pipe system). This knowledge can be added to other (prototyping) models used for planning future investments in the pipe system. Therefore, VCS attaches great importance to learning from the operational model incorporated in a living DT.

5. Dreaming of a Multi-Purpose Living Digital Twin for the Urban Drainage System in VCS Denmark

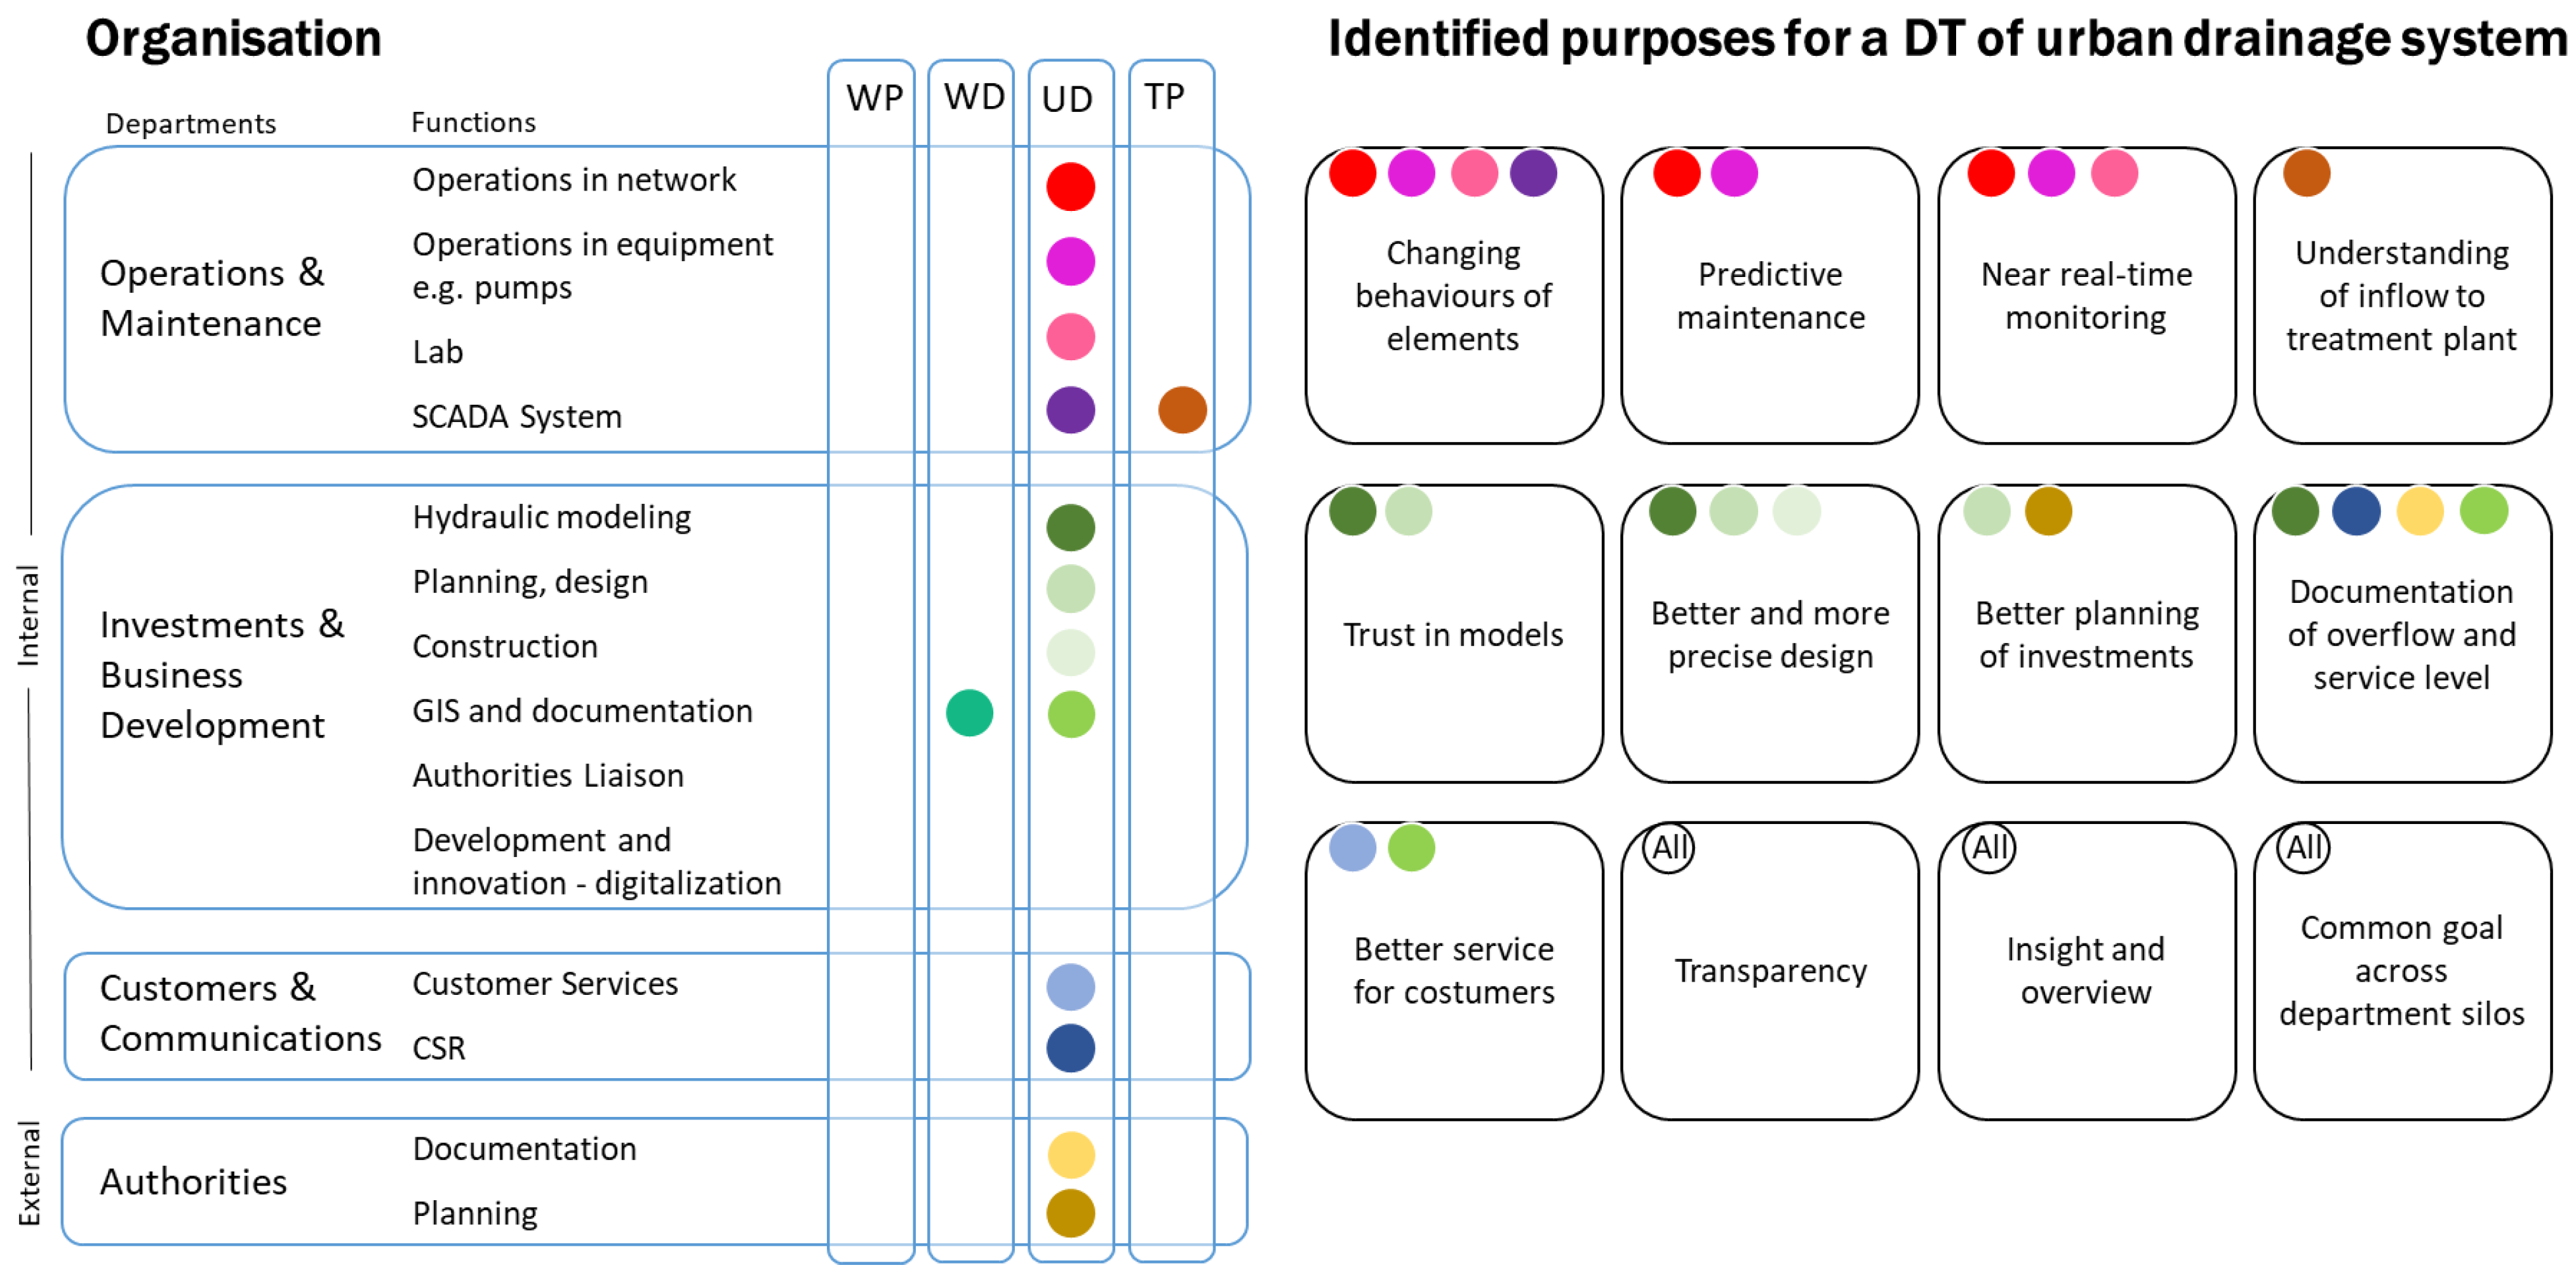
5.1. Multi-Purpose Value Creation across Departmental Silos

The anticipated value creation of DTs was studied in VCS based on interviews with employees with various functions who contribute to, and may potentially benefit from, DTs. Figure 5 (left) shows an organizational chart of VCS, indicating its main departments, each of which has different units (functions) with responsibilities across the company related to water production (WP), water distribution (WD), wastewater and stormwater collection, i.e., urban drainage (UD), and wastewater treatment plants (TP). The last department that could benefit from a DT is the authorities as an external partner. Figure 5 (right) outlines the 12 main overall DT purposes identified through the interviews, and the colour codes (left and right) indicate the extent to which the different purposes are identified by one or several organizational units (functions).
It became clear during the interviews that different ideas about how they could potentially benefit from a DT was highlighted by individuals with different roles. Some workers provide eyes in the field and report any errors or misunderstandings according to their perceived knowledge, while others maintain sensors, and some work with hydraulic models (Figure 5). The employees who work with operations already use some observations from sensors in the system, but they do not have much confidence in the models. The employees engaged in planning and construction functions rely to a large extent on models, and they see a great opportunity to obtain better planning tools with a DT. Both groups perceived the yet-unrealized potential in uniting their needs with a DT, where real cross-organizational value creation can be accomplished. A commonly used DT will ensure transparency, as well as an overview and increased insight into how the urban drainage system responds to, e.g., different rainfall or operational conditions. Thus, the possible barriers can be demolished as a common understanding of the multiple purposes of a DT emerges in between the company’s various functions and staff members. By discussing the level of confidence in the DT in an open and transparent manner, the trust in the DT could increase for all partners.
Maintaining a DT is not something that simply happens behind a desk, so we must acknowledge every contribution. This can be done by adapting the DT to serve multiple purposes through minor adjustments, thereby serving more functions in the utility company. The function ‘operations in equipment’ would benefit from a DT in terms of predictive maintenance, thereby reducing the overtime spent by employees when, e.g., a pump breaks down during non-working hours. If that pump must be fixed, knowing where the water could temporarily be stored would represent a benefit. In another example, a pipe could crack due to a very dry summer, causing infiltration in the autumn to rise dramatically; this could be detected as anomalous conditions in the pump signal. All are examples of tasks that take time to investigate, but a DT may be able to more quickly detect and diagnose the cause of the problem.
All these highly technical purposes will provide better services for staff, as well as for customers and the environment. These identified purposes (Figure 5, right) are somewhat comparable with industrial purposes [3]; they are aligned with the purposes in the water sector [20] and are consistent with the predictive and interrogative purposes of DTs suggested by Grieves and Vickers (2017) [2].

5.2. The Urban Drainage Living Digital Twin in VCS—Past and Present Implementation

In VCS, the journey towards a DT of the urban drainage system started in 2008 with a concept referred to as the “day model” (corresponding to an operational model, cf. Figure 4).
The purpose of the “day model” is to observe, understand, and document the performance of the urban drainage system through a Hi-Fi hydraulic model with input from multiple rain gauges. The model is run once per day for comparison retrospectively for the past 24 h with data from the water level and flow sensors in the system at several locations. The model currently consists of +31,000 nodes in combined sewer and stormwater systems and is implemented in the hydraulic modeling software Mike Urban [50]. The computational time for a model run is approximately 2 h. Several updates have been made to the living DT over the years, e.g., attempts to model infiltration inflow in various ways and the introduction of automatic model-updating tools.
Figure 6 illustrates the current configuration of the living DT in VCS and how it is updated, maintained, and relates also to prototyping DTs. The main aim of the living DT is to replicate the physical system as closely as possible by reducing uncertainty about known processes to diagnose the remaining unknowns. In this way, VCS is striving towards conceptualizing its knowledge acquired from running a living DT into improved insights for the physical system and using these insights to improve the tools for predictive maintenance, as well as the knowledge base for (prototyping) design and planning DTs.
In VCS, the feature ‘asset database’ stores attribute information about the physical elements of the urban drainage system. Observational data from, e.g., the water level and flow sensors, binary sensors (indicating whether there is an overflow or not), and rain gauges and weather radars are also stored in databases. Currently VCS uses several databases for different purposes, but this will change in the coming years to only a few databases, where data are stored and distributed for different applications. With cheaper IoT equipment, it is expected that more observations with varying accuracy levels will be available in the future. Several functions in VCS (Figure 5) contribute to improving the quality of the attribute and observational data. Handling these data requires a transparent and uniform structure in the registration, whereby the information can be transformed into knowledge. Therefore VCS (together with other Danish utilities) sees the need to unify the process of data storage [51]. Pedersen et al. (submitted) [52] describe how the various attributes and observations are outlined and structured in VCS.
An essential part of VCS’ living DT is the analysis feature ‘model building/updating tool’, MOPS [53], which enables one to convert an asset database into a model, e.g., ‘operational model’ in a semi-automatic way along with the incorporation of analyses relevant to the modeling. Observational data and model results are stored via cloud data storage, and the results are visualized on a platform together with measurements. Analyses of the model results and measurements and a comparison of the two will soon provide results for the platform. The error diagnosis between the DT and physical reality can show whether adjustments are necessary for either the model input or reality. This is currently done manually. The update procedures from the visualisation platform to, e.g., MOPS highlight that the information learned from the visualisation is returned to the models.
Different update frequencies (triangles) and different resolution of data (circles) in the current workflow (Figure 6) are highlighted. An example of this could be the model of water loads giving data of hourly resolution to the Model Building/updating tool, but this is used only on a yearly basis.
VCS currently uses three types of simulation models: operational, design, and planning models (Figure 6). Design and planning models learn from the experiences obtained by running the operational model, which can also learn about the detailed attributes such as a hydraulic structure from the implementation in a design model. Future work may incorporate design and planning models further in the DT environment and display results or even run simulations directly from the DT user interface.
To ensure a high quality DT, it is extremely important to involve multiple functions in the utility company and to consider how most people could potentially benefit from the DT without compromising the original idea. It is very important to VCS that it can learn from the DT to improve the rest of its portfolio of models and tools applied. Therefore, VCS does not prefer analyses and tools that do not transparently indicate what is happening. What VCS aims for are open-standard plug-and-play solutions with a logical and efficient workflow, supported by the idea of DTs and DTEs. Two important features emerged from the current workflow (Figure 6): the model building/updating tool and the data storage, as well as the data links that are placed around them to ensure a smooth flow of data. This is somewhat different from the star structure conceptualized in Figure 3, which is currently being discussed and highlights the last and perhaps most important piece of information learned from embarking on the DT journey: Developing a DT takes time and many iterations and requires the open accommodation of curiosity and a desire for further improvements.

5.3. Future Planned DT Developments in VCS

Although VCS has simple analysis tools for everything shown in Figure 6, improvements are still needed in the coming years to gradually converge towards the overall DT and DTE concept, including features specialising in:
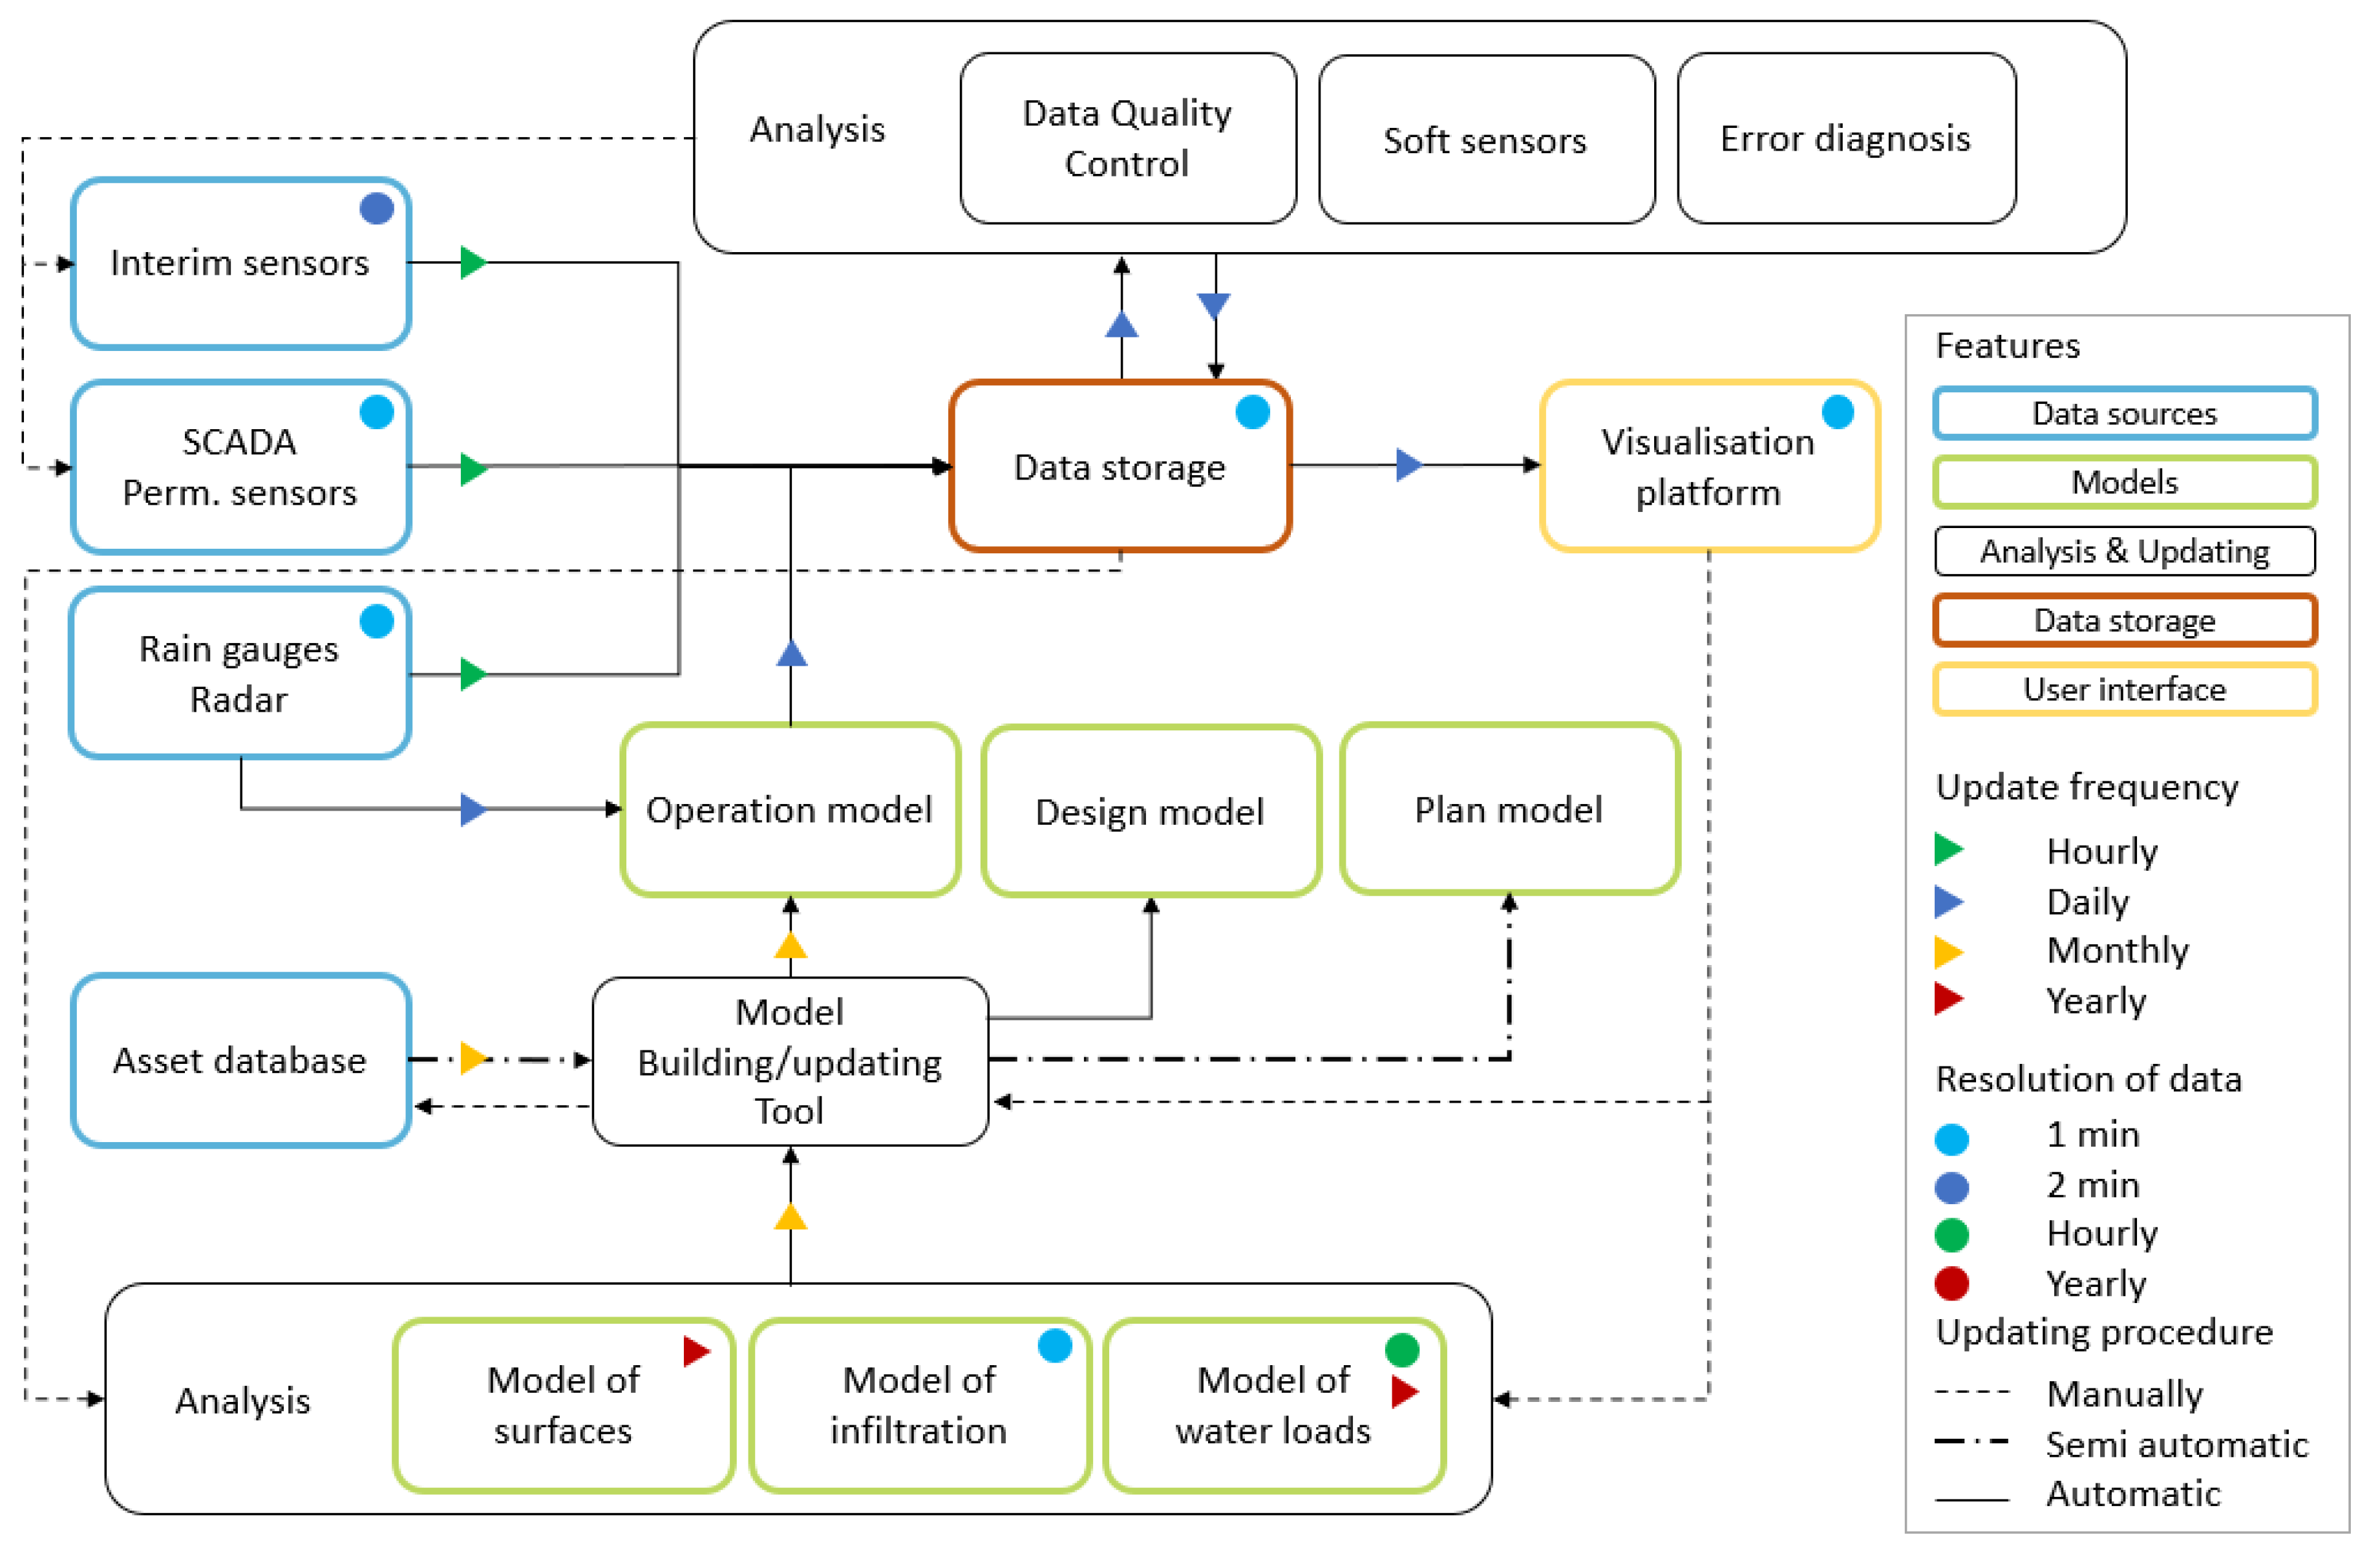
  • Data quality control. Therrien et al. (2020) [5] outline a guide to perform data quality control for single sensors, but we also require features that can cross-check data from multiple closely located sensors to understand where sensors can be most optimally placed and to automatically control data from hundreds of levels and flow gauges across the urban drainage system.
  • Continuous state-dependent error diagnosis. A living DT capable of describing the physical system with acceptable uncertainty for all locations and with all objectives in mind could seem utopian. This is due to the lack of detailed information about assets and dynamics as the system ages but also because of stochastic inputs, such as rain and the constant exchange of water with the surrounding environment, which are difficult to quantify. Hydrologic signatures [54] may help overcome the state-dependent nature of the observed differences between models and observations.
  • Visualization and learning. DTs allow us to develop better planning and design models by learning from the living DT and converting unknown processes to known ones. It is expected that this aim will give rise to many questions and hypotheses to be tested in the coming years.
  • Adding more detail, e.g., improved run-off models and a better representation of hydraulic structures and pump characteristics, examining unstructured information that may provide new information for the DTs, and creating a balanced alarm system that triggers the rights alarms distinguishing, e.g., between critical service jobs and non-critical maintenance jobs.
  • Improving the overall DT system architecture with a DE based on open standards for data and standard API solutions.
As a risk, the DT may promise too much and thus not add the expected value for end-users in different departments and functions in a utility company. This will undermine confidence in the digital transformation of VCS. Therefore, close interactions with the end-users should be preserved throughout the process of maintaining and further developing the DT.
Ideally, DTs should have clear metadata and open standards orchestrated by the DE. This will lower the barriers to enter the water sector for entrepreneurs, thereby securing ongoing innovation in the sector along with also lowering the financial burden of building a DT. DTs are not only limited to large utility companies, but can also be attractive for smaller utility companies facing the same challenges as large companies, and the goal must be to build a DE that complies with that.

6. Conclusions

A digital twin (DT) for an urban water system is defined as a systematic virtual representation of a system’s elements and dynamics with features connected by data links. Possible features include: data link, coupling, identifier, security, data storage, user interface, simulation model, analysis, artificial intelligence, and computation. Some, but not all, features are needed for a system to be called a DT—a simulation model or a SCADA system alone are, e.g., not DTs without additional features. Urban water system DTs can be further classified as living or prototyping. A living DT places a strong emphasis on the features of coupling and the simulation model, indicating that there must be a physical system whose behavior the model can simulate. The DT is considered living when trying to replicate the physical system’s long-term evolution over time with as much accuracy as needed for the purpose of the DT. The simulation model in a living DT may be either an operational model or a control model. A prototyping DT does not replicate the physical reality in every detail but must be able to accurately simulate the trends of the system; the simulation model can be either a design model or a planning model. DTs are supported by DT environments (DTEs) based on standards for open data, which can help ensure innovative solutions and active participation from users, thereby securing trust and ownership of the DT. This is aligned with the proposed star structure of a DT, where the overall functionality of the DT is broken down into smaller, tangible units (features), allowing the emergence microservices that communicate via data links (the most central feature) enabled by application programing interfaces (APIs).
The definition of the DT concept for urban water systems presented here will help researchers, industry, and utilities define what they aim to achieve by developing/using DTs and avoid the confusion caused by imprecise terminology, which is a problem in the literature. The proposed terminology for DT provided herein adds nuance to the discussion of which features are needed for a DT and underlines the importance of the interactions between different features along with openness and transparency in the system architecture.
Different departments and functions in utility and authority organizations have different needs, and by making the DT multi-purpose, its value creation will be larger. Analyzing the current DT of the urban drainage system in the utility company VCS showed that staff members with the planning and the operation functions viewed the urban drainage system differently. However, with a multi-purpose DT, these end-users can benefit from the other end-users’ perspectives. A DT can act as a link between the functions in the utility company, providing a common tool helping to gain knowledge about the urban drainage system for various purposes. This will ensure transparency and trust in the performance of the DT and the physical system for all end-users.
The workflow of the current DT in the utility company VCS Denmark was illustrated, and the features and their connections through data links were identified. With a better living DT, the maintenance procedure can be optimized based on the knowledge obtained about the state of the system. The utility company began with a set of puzzle pieces that did not fit, but the vision of creating a DT helped set the direction for how these pieces could eventually be brought to fit together. The features of a data link, data storage, simple user interface, simulation model, coupling, and analysis are already in place, but the journey towards efficiently organizing these features and their information exchanges is not complete. The near future will improve three features in the DT: data quality control, error diagnostics (for ensuring trust in the models), and a user interface for visualising the results. Furthermore, work will be done to improve the overall DT system architecture by supporting open standards for data in a digital ecosystem (DE). Insights into the engine room of a utility company as presented here are unique, as such insights could allow others to evaluate their own procedures or even start building their own DTs or DEs.
This paper covers selected aspects within the field of DT, but the concept of DT is broad, and there is a huge perspective to incorporate additional features, e.g., interactive DTs, coupling of different DTs within a utility across traditional silos, etc. To make a flexible, robust, and long-lasting solution requires good orchestration and also a showdown with traditional ways of thinking about business and consulting. Utility companies also need to rethink their data infrastructure, which traditionally has been closed and hidden-away from non-experts, and in this process the approach to open data should be considered. The collaboration between utility companies, partners, consultants, researchers, etc. must be trustful and transparent, and the journey in this direction has just begun.

Author Contributions

Conceptualization and planning of the design of the study, A.N.P., M.B., A.B.-K., L.E.C., and P.S.M.; literature study, surveys, and analysis, A.N.P., M.B., A.B.-K., and P.S.M.; writing—original draft preparation, A.N.P. and P.S.M.; writing—review and editing, A.N.P., M.B., A.B.-K., L.E.C., and P.S.M.; visualization, A.N.P. and P.S.M.; supervision, M.B., A.B.-K., and P.S.M. All authors have read and agreed to the published version of the manuscript.

Funding

This work is part of an Industrial PhD project funded by VCS Denmark and Innovation Fund Denmark (grant no. 8118-00018B).

Institutional Review Board Statement

Not applicable.

Informed Consent Statement

Not applicable.

Data Availability Statement

No new data were created or analyzed in this study. Data sharing is not applicable to this article.

Acknowledgments

The authors would wish to thank their colleagues at VCS Denmark for their valuable contributions during the interviews and discussions, as well as members of the project reference group from other Danish utility companies. We also thank the members of the international non-profit Smart Water Network (SWAN) for their numerous discussions on Digital Twins.

Conflicts of Interest

The authors declare no conflict of interest.

References

  1. Gartner Inc. 5 Trends Emerge in the Gartner Hype Cycle for Emerging Technologies. 2018. Available online: https://www.gartner.com/smarterwithgartner/5-trends-emerge-in-gartner-hype-cycle-for-emerging-technologies-2018/ (accessed on 18 March 2020).
  2. Grieves, M.; Vickers, J. Digital Twin: Mitigating Unpredictable, Undesirable Emergent Behavior in Complex Systems. In Transdisciplinary Perspectives on Complex Systems New Findings and Approaches; Kahlen, F.-J., Flumerfelt, S., Alves, A., Eds.; Springer: Cham, Schwitzerland, 2017; pp. 85–113. ISBN 978-3-319-38754-3. [Google Scholar]
  3. Rasheed, A.; San, O.; Kvamsdal, T. Digital twin: Values, challenges and enablers from a modeling perspective. IEEE Access 2020, 8, 21980–22012. [Google Scholar] [CrossRef]
  4. Conejos Fuertes, P.; Martínez Alzamora, F.; Hervás Carot, M.; Alonso Campos, J.C. Building and exploiting a Digital Twin for the management of drinking water distribution networks. Urban. Water J. 2020, 17, 704–713. [Google Scholar] [CrossRef]
  5. Therrien, J.-D.; Nicolaï, N.; Vanrolleghem, P.A. A critical review of the data pipeline: How wastewater system operation flows from data to intelligence. Water Sci. Technol. 2020. [Google Scholar] [CrossRef]
  6. DANVA. Water in Figures 2019; DANVA: Skanderborg, Denmark, 2019. [Google Scholar]
  7. Makropoulos, C.; Savíc, D.A. Urban hydroinformatics: Past, present and future. Water 2019, 11, 1959. [Google Scholar] [CrossRef] [Green Version]
  8. Eggimann, S.; Mutzner, L.; Wani, O.; Schneider, M.Y.; Spuhler, D.; Moy De Vitry, M.; Beutler, P.; Maurer, M. The Potential of Knowing More: A Review of Data-Driven Urban Water Management. Environ. Sci. Technol. 2017, 51, 2538–2553. [Google Scholar] [CrossRef] [PubMed] [Green Version]
  9. Schwab, K. The Fourth Industrial Revolution: What It Means and How to Respond. Available online: https://www.weforum.org/agenda/2016/01/the-fourth-industrial-revolution-what-it-means-and-how-to-respond/ (accessed on 11 November 2020).
  10. Verma, S. How Digital Twins Conceptualize The Water Industry. Available online: https://www.wateronline.com/doc/how-digital-twins-conceptualize-the-water-industry-0002 (accessed on 10 November 2020).
  11. Bentley Digital Twins for Managing Water Infrastructure. Available online: https://www.waterworld.com/water-utility-management/smart-water-utility/article/14173219/digital-twins-for-managing-water-infrastructure (accessed on 11 October 2020).
  12. Curl, J.M.; Nading, T.; Hegger, K.; Barhoumi, A.; Smoczynski, M. Digital Twins: The Next Generation of Water Treatment Technology. J. Am. Water Works Assoc. 2019, 111, 44–50. [Google Scholar] [CrossRef]
  13. Klatzkin, A. How Bentley is Developing Digital Twin Technologies. Available online: https://www.process-worldwide.com/how-bentley-is-developing-digital-twin-technologies-a-827697/ (accessed on 22 November 2020).
  14. Parrott, A.; Warshaw, L. Industry 4.0 and the Digital Twin; Deloitte University Press: New York, NY, USA, 2017; pp. 1–17. [Google Scholar]
  15. GE Digital Digital Twins are Mission Critical. Available online: https://www.ge.com/digital/applications/digital-twin (accessed on 11 November 2020).
  16. Siemens Digital Twin and Embedded Software. Available online: https://blogs.sw.siemens.com/simcenter/digital-twin-and-embedded-software/ (accessed on 11 November 2020).
  17. Elsevier Scopus. Available online: www.scopus.com (accessed on 25 March 2020).
  18. Google Google Trend. Available online: https://trends.google.com/ (accessed on 25 March 2020).
  19. SWAN SWAN Digital Twin H2O Work Group. Available online: https://www.swan-forum.com/digital-twin-h2o-work-group/ (accessed on 18 March 2020).
  20. Sarni, W.; White, C.; Webb, R.; Cross, K.; Glotzbach, R. Digital Water—Industry Leaders Chart the Transformation Journey; IWA Publishing: London, UK, 2019. [Google Scholar]
  21. IWA. Webinars organized by the International Water Association. Available online: https://iwa-network.org/ (accessed on 20 March 2020).
  22. VCS Denmark. VCS Denmark Homepage. Available online: www.vandcenter.dk (accessed on 20 March 2020).
  23. Wright, L.; Davidson, S. How to tell the difference between a model and a digital twin. Adv. Model. Simul. Eng. Sci. 2020, 7. [Google Scholar] [CrossRef]
  24. Autiosalo, J.; Vepsalainen, J.; Viitala, R.; Tammi, K. A Feature-Based Framework for Structuring Industrial Digital Twins. IEEE Access 2020, 8, 1193–1208. [Google Scholar] [CrossRef]
  25. Tao, F.; Zhang, H.; Liu, A.; Nee, A.Y.C. Digital Twin in Industry: State-of-the-Art. IEEE Trans. Ind. Inform. 2019, 15, 2405–2415. [Google Scholar] [CrossRef]
  26. Kitchin, R.; McArdle, G. What makes Big Data, Big Data? Exploring the ontological characteristics of 26 datasets. Big Data Soc. 2016, 3, 1–10. [Google Scholar] [CrossRef]
  27. Wikipedia Digital Ecosystem. Available online: https://en.wikipedia.org/wiki/Digital_ecosystem (accessed on 11 November 2020).
  28. Jacobides, M.G.; Sundararajan, A.; Van Alstyne, M.W. Platforms and Ecosystems: Enabling the Digital Economy; World Economic Forum: Cologny, Switzerland, 2019. [Google Scholar]
  29. Greengard, S. Digital Twins Grow Up. Available online: https://cacm.acm.org/news/238642-digital-twins-grow-up/fulltext (accessed on 11 March 2020).
  30. Glaessgen, E.H.; Stargel, D.S. The digital twin paradigm for future NASA and U.S. Air force vehicles. In Proceedings of the 53rd Structures, Structural Dynamics and Materials Conference: Special Session on the Digital Twin, Honolulu, HI, USA, 23–26 April 2012. [Google Scholar]
  31. Raghunathan, V. Digital Twins vs. Simulation: Three Key Differences. Available online: https://www.entrepreneur.com/article/333645 (accessed on 24 March 2020).
  32. Siemens From Vehicle Design to Multi-Physical Simulations. Available online: https://new.siemens.com/global/en/markets/automotive-manufacturing/digital-twin-product.html (accessed on 11 November 2020).
  33. Batty, M. Digital twins. Environ. Plan. B Urban Anal. City Sci. 2018, 45, 817–820. [Google Scholar] [CrossRef]
  34. Tomko, M.; Winter, S. Commentary Beyond digital twins-A commentary. Urban Anal. City Sci. 2019, 46, 395–399. [Google Scholar] [CrossRef]
  35. Wildfire, C. How Can We Spearhead City-Scale Digital Twins? Available online: http://www.infrastructure-intelligence.com/article/may-2018/how-can-we-spearhead-city-scale-digital-twins (accessed on 12 March 2020).
  36. Bolton, A.; Butler, L.; Dabson, I.; Enzer, M.; Evans, M.; Fenemore, T.; Harradence, F. The Gemini Principles; Centre for Digital Built Britain: Cambridge, UK, 2018. [Google Scholar]
  37. Fryer, T. Millbrook takes the virtual track. Eng. Technol. 2019, 14, 40–41. [Google Scholar] [CrossRef]
  38. Wanasinghe, T.R.; Wroblewski, L.; Petersen, B.K.; Gosine, R.G.; James, L.A.; De Silva, O.; Mann, G.K.I.; Warrian, P.J. Digital Twin for the Oil and Gas Industry: Overview, Research Trends, Opportunities, and Challenges. IEEE Access 2020, 8, 104175–104197. [Google Scholar] [CrossRef]
  39. Udugama, I.A.; Gargalo, C.L.; Yamashita, Y.; Taube, M.A.; Palazoglu, A.; Young, B.R.; Gernaey, K.V.; Kulahci, M.; Bayer, C. The Role of Big Data in Industrial (Bio)chemical Process Operations. Ind. Eng. Chem. Res. 2020, 59, 15283–15297. [Google Scholar] [CrossRef]
  40. Grundfos Leading Pump Manufacturer Uses Digital Twin Technology To Improve Customer Experience. Available online: https://www.processindustryinformer.com/pump-manufacturer-digital-twin-technology-improve-customer-experience (accessed on 12 March 2020).
  41. SWAN. Available online: www.swan-forum.com (accessed on 27 May 2020).
  42. AVEVA. Using Digital Twins to Maximise Returns on Existing Infrastructure. Available online: https://thewaternetwork.com/article-FfV/using-digital-twins-to-maximise-returns-on-existing-infrastructure-EhxgRwRS-IXpNc3GHzY4_w (accessed on 6 April 2020).
  43. Thomassen, E.D.; Sørup, H.J.D.; Scheibel, M.; Einfalt, T.; Arnbjerg-Nielsen, K. Data-driven distinction between convective, frontal and mixed extreme rainfall events in radar data. Hydrol. Earth Syst. Sci. Discuss. 2020, 1–26. [Google Scholar] [CrossRef]
  44. Bertrand-Krajewski, J.L.; Bardin, J.P.; Mourad, M.; Béranger, Y. Accounting for sensor calibration, data validation, measurement and sampling uncertainties in monitoring urban drainage systems. Water Sci. Technol. 2003, 47, 95–102. [Google Scholar] [CrossRef]
  45. Nielsen, K.T.; Moldrup, P.; Thorndahl, S.; Nielsen, J.E.; Uggerby, M.; Rasmussen, M.R. Field-Scale Monitoring of Urban Green Area Rainfall-Runoff Processes. J. Hydrol. Eng. 2019, 24. [Google Scholar] [CrossRef] [Green Version]
  46. Lund, N.S.V.; Pedersen, J.W. “Fit-for-indikator” Modellering. Available online: http://www.evanet.dk/wp-content/uploads/2019/05/Modelovervejelser.pdf (accessed on 11 December 2019).
  47. Lund, N.S.V.; Falk, A.K.V.; Borup, M.; Madsen, H.; Mikkelsen, P.S. Model predictive control of urban drainage systems: A review and perspective towards smart real-time water management. Crit. Rev. Environ. Sci. Technol. 2018, 48, 279–339. [Google Scholar] [CrossRef]
  48. Benedetti, L.; Hénonin, J.; Gill, E.J.; Brink-Kjær, A.; Nielsen, P.H.; Pedersen, A.N.; Hallager, P. Using an integrated model to support long term strategies in wastewater collection and treatment. In Proceedings of the NOVATECH, Lyon, France, 23–27 July 2016. [Google Scholar]
  49. Löwe, R.; Mair, M.; Pedersen, A.N.; Kleidorfer, M.; Rauch, W.; Arnbjerg-Nielsen, K. Impacts of urban development on urban water management—Limits of predictability. Comput. Environ. Urban Syst. 2020, 84, 101546. [Google Scholar] [CrossRef]
  50. DHI Mike Urban. Available online: www.mikepoweredbydhi.com (accessed on 24 February 2020).
  51. Aarhus Vand; VandCenter Syd. Systematic Vandselskaber Udvikler Fælles Dataplatform. Available online: https://www.vandcenter.dk/nyheder/2020/04-faelles-dataplatform (accessed on 22 November 2020).
  52. Pedersen, A.N.; Pedersen, J.W.; Vigueras-Rodriguez, A.; Brink-Kjær, A.; Borup, M.; Mikkelsen, P.S. The Bellinge Data Set: Open Data and Models for Community-Wide Urban Drainage Systems Research. (submitted).
  53. LNHwater MOPS—Model OPbygnings System. Available online: www.lnhwater.tech (accessed on 24 February 2020).
  54. Gupta, H.V.; Wagener, T.; Liu, Y. Reconciling theory with observations: Elements of a diagnostic approach to model evaluation. Hydrol. Process. 2008, 22, 3802–3813. [Google Scholar] [CrossRef]
Figure 1. Pieces in a puzzle that illustrates how different elements play together in the simulation process to reproduce reality. Sometimes the pieces do not properly fit.
Water 13 00592 g001
Figure 2. Number of scientific articles on “digital twins” (combined with further added key words) in Scopus covering the past 10 years [17]. The search for words examined only the title, abstract, and keywords. The relative Internet search interest on the topic “digital twin” during the past 10 years according to Google Trends is also provided [18].
Water 13 00592 g002
Figure 3. Illustration of the concept of digital twin (DT) for urban water systems. The DT consists of a virtual part linked to a list of features and a physical counterpart. The continuous coupling to the physical twin is important to make it a “living” DT, and simulation models play an important role in urban water systems (here exemplified by a distributed urban drainage system model). refers to the feature data link, which is the center of a star structure surrounded by other features. refers to the feature coupling, and refers to the feature simulation model. Inspired by [24].
Water 13 00592 g003
Figure 4. Models (grey boxes) applied in urban drainage engineering that can be included as features in a DT depending on the purpose. All models in living DTs are based on data from attributes and observations via coupling to a physical system. Models in prototyping DTs can learn from living DT models but can also be based on presumptive data about the future. Living and prototyping DTs can include both hi-fidelity (Hi-Fi) models and simplified low-fidelity (Lo-Fi) models.
Water 13 00592 g004
Figure 5. Identified purposes for a DT of the urban drainage system (UDS) from the perspective of different functions in VCS, both internally and externally. The left figure shows the internal functions classified in departments in VCS, and the external authorities that are contributing to and/or benefitting from a DT of UDS. The right figure illustrates different purposes of a DT of the UDS, as determined by interviewing employees of VCS. The colours indicate which function from the left figure would benefit from a multi-purpose DT of the UDS. WP = water production, WD = water distribution, UD = urban drainage, TP = treatment plant/ water resource recovery facility (WRRF).
Water 13 00592 g005
Figure 6. Workflow of the DT environment in VCS with the different features highlighted, including the operational, design, and planning models.
Water 13 00592 g006
Table 1. Hierarchical organization of DT application areas, from the component to societal scale, indicating typical references.
Application AreaExamples in Literature
SocietyNational DT system with many different DTs in different sectors where value can be created [36]
CityConnection of several DTs, where relevant, to give value to citizens in a connected city across sectors [33,34,35]
SystemAutonomous cars [37], water distribution systems [4], oil and gas industry [38], or urban drainage systems (as discussed in this paper).
PlantWRRF [5] or drinking water facilities [12]
Unit Process/Operation, Hydraulic StructureDTs of overflow structures, other complicated hydraulic constructions, or biochemical processes in the WRRF treatment step [39]
Componente.g., pumping devices [40] guided by the DT for maintenance of the product.
Publisher’s Note: MDPI stays neutral with regard to jurisdictional claims in published maps and institutional affiliations.

