
Climate Change Patterns of Wild Blueberry Fields in Downeast, Maine over the Past 40 Years


1
School of Biology & Ecology, University of Maine, Orono, ME 04469, USA
2
School of Biology and Ecology, University of Maine Cooperative Extension, Orono, ME 04469, USA
*
Authors to whom correspondence should be addressed.
Water 2021, 13(5), 594; https://doi.org/10.3390/w13050594
Submission received: 2 January 2021
/
Revised: 4 February 2021
/
Accepted: 9 February 2021
/
Published: 25 February 2021
(This article belongs to the Special Issue Impacts of Climate Change on Plant Water Use, Carbon Balance, Nutrient Economy, and Their Interactions)
Abstract
:Maine, USA is the largest producer of wild blueberries (Vaccinium angustifolium Aiton), an important native North American fruit crop. Blueberry fields are mainly distributed in coastal glacial outwash plains which might not experience the same climate change patterns as the whole region. It is important to analyze the climate change patterns of wild blueberry fields and determine how they affect crop health so fields can be managed more efficiently under climate change. Trends in the maximum (Tmax), minimum (Tmin) and average (Tavg) temperatures, total precipitation (Ptotal), and potential evapotranspiration (PET) were evaluated for 26 wild blueberry fields in Downeast Maine during the growing season (May–September) over the past 40 years. The effects of these climate variables on the Maximum Enhanced Vegetation Index (EVImax) were evaluated using Remote Sensing products and Geographic Information System (GIS) tools. We found differences in the increase in growing season Tmax, Tmin, Tavg, and Ptotal between those fields and the overall spatial average for the region (state of Maine), as well as among the blueberry fields. The maximum, minimum, and average temperatures of the studied 26 wild blueberry fields in Downeast, Maine showed higher rates of increase than those of the entire region during the last 40 years. Fields closer to the coast showed higher rates of warming compared with the fields more distant from the coast. Consequently, PET has been also increasing in wild blueberry fields, with those at higher elevations showing lower increasing rates. Optimum climatic conditions (threshold values) during the growing season were explored based on observed significant quadratic relationships between the climate variables (Tmax and Ptotal), PET, and EVImax for those fields. An optimum Tmax and PET for EVImax at 22.4 °C and 145 mm/month suggest potential negative effects of further warming and increasing PET on crop health and productivity. These climate change patterns and associated physiological relationships, as well as threshold values, could provide important information for the planning and development of optimal management techniques for wild blueberry fields experiencing climate change.
1. Introduction
Dramatically changing temperature and precipitation patterns due to global climate change are threatening crops all over the world [1,2,3]. The average annual global temperature has increased up to ~0.7 °C within the last century (1906 to 2005) [4]. The average annual air temperature in Maine, USA has increased ~1.8 °C within the last 124 years (1895 to 2018) [5]. While air temperatures have been increasing throughout Maine, the Coastal zone of Maine has experienced the highest rate of increase. Maine has three climate zones: Northern, Interior and Coastal, where long-term annual average temperatures from 1895 to 2018 are 3.4, 5.8 and 6.6 °C, respectively [5,6]. Such temperature variation across Maine might not affect different plant and crop species located at different climate zones in similar ways. This is because plant species often have different optimal and threshold values for atmospheric temperature or precipitation, beyond which their physiological performance and growth deteriorate. For instance, the threshold air temperature for maximum photosynthesis of wheat (Triticum spp.) is 33 °C [7,8] whereas a recent study on wild blueberry (Vaccinium angustifolium Aiton) physiology showed that photosynthesis declined from the maximum when air temperature increased above 25 °C [9].
The wild blueberry crop is one of the most important fruit crops native to North America. It has a vital role in Maine’s economy. This crop is commercially grown on almost 18,000 ha in Maine [10]. Maine has the highest production of wild blueberry in the world, with Washington County, Maine producing the most [10]. Recent research has shown that changing climate patterns (i.e., increasing temperature) could significantly alter its physiology, morphology, and growth patterns which would further affect the nutrient economy of wild blueberry [9]. These changes will bring new challenges to this traditional agricultural system. To sustain wild blueberry production under the influence of a changing climate, management techniques (i.e., irrigation, fertilization) will need to be adjusted. In order to fine-tune management techniques for a specific field, vital information will be required such as air temperature, humidity or precipitation rates, and potential evapotranspiration rate (evaporation from soil and transpiration from plants), which affects the physiological and growth performance of the crop. In addition to the effects of a changing climate pattern, estimating and understanding the potential evapotranspiration has proven to be of major importance for developing new or improved agricultural management techniques [11]. In fact, this would be especially important for wild blueberry fields due to the soils in which they are managed. These soils are characterized by low water-holding capacity and under increasing temperatures due to climate change, evapotranspiration stress is likely to occur. This is especially significant due to the fact that wild blueberry fields are not planted [10]. Existing plant populations in the landscape are nurtured and managed, thus growers are constrained in their responses to climate change.
Wild blueberry barrens are mostly distributed along the Coastal zone of Maine where the annual average temperature has been increasing the most. While historical climate change information and climate change predictions are readily available for Maine, the local weather at different locations in Maine varies significantly as is evident from Maine’s three climate zones [5]. Hence, wild blueberry fields at different locations in the Coastal area of Maine might not be experiencing the same atmospheric temperature and precipitation changes and might not have the same potential evapotranspiration rates. Under such circumstances, it would be ineffective to develop general management recommendations (e.g., irrigation, fertilizers) for all fields based solely on regional edaphic factors. Therefore, it is necessary to explore both historical climate change as well as potential evapotranspiration rates of specific wild blueberry fields to determine if these changes have significant physiological and growth performance effects. “Leaf-greenness”, a proxy of crop health and productivity, representing chlorophyll and nitrogen concentrations in plants, could be a useful parameter to explore wild blueberry plant responses to climate change. One such measure, Enhanced Vegetation Index (EVI), has become a popular standard remote sensing tool adopted by scientists [12,13] because of its ability to eliminate canopy background and atmospheric noise, as well as its property of non-saturation, which are major issues of the commonly used measure, the Normalized Difference Vegetation Index (NDVI) [14]. Therefore, we used EVI to indicate plant productivity for specific field sites in Downeast, Maine, and evaluated its relationship with changing climate using archived historical climate data over the past 40 years. We used Remote Sensing products and Geographic Information System (GIS) techniques and tools in Arc GIS Pro (Version 2.4.2) Software (Esri, Redlands, CA, USA) [15] to quantify the climate change patterns of wild blueberry fields.
The specific objectives of our study were:
- To characterize the historical climate change patterns (maximum temperature, minimum temperature, average temperature, and precipitation) of different wild blueberry fields in Downeast, Maine over the last 40 years (1980 to 2019), and test whether wild blueberry fields show different climate change patterns compare to that of the region (state of Maine);
- To quantify the historical changes in potential evapotranspiration (PET) of those wild blueberry fields by comparing between 1970–2000 and 2001–2014, as well as to determine the relationship between PET and temperatures for wild blueberry fields;
- To establish relationships between climate variables (maximum temperature, minimum temperature, average temperature, and precipitation) during the growing season (May to September) and the Maximum Enhanced Vegetation Index (EVImax) for the wild blueberry fields.
2. Materials and Methods
2.1. Study Area
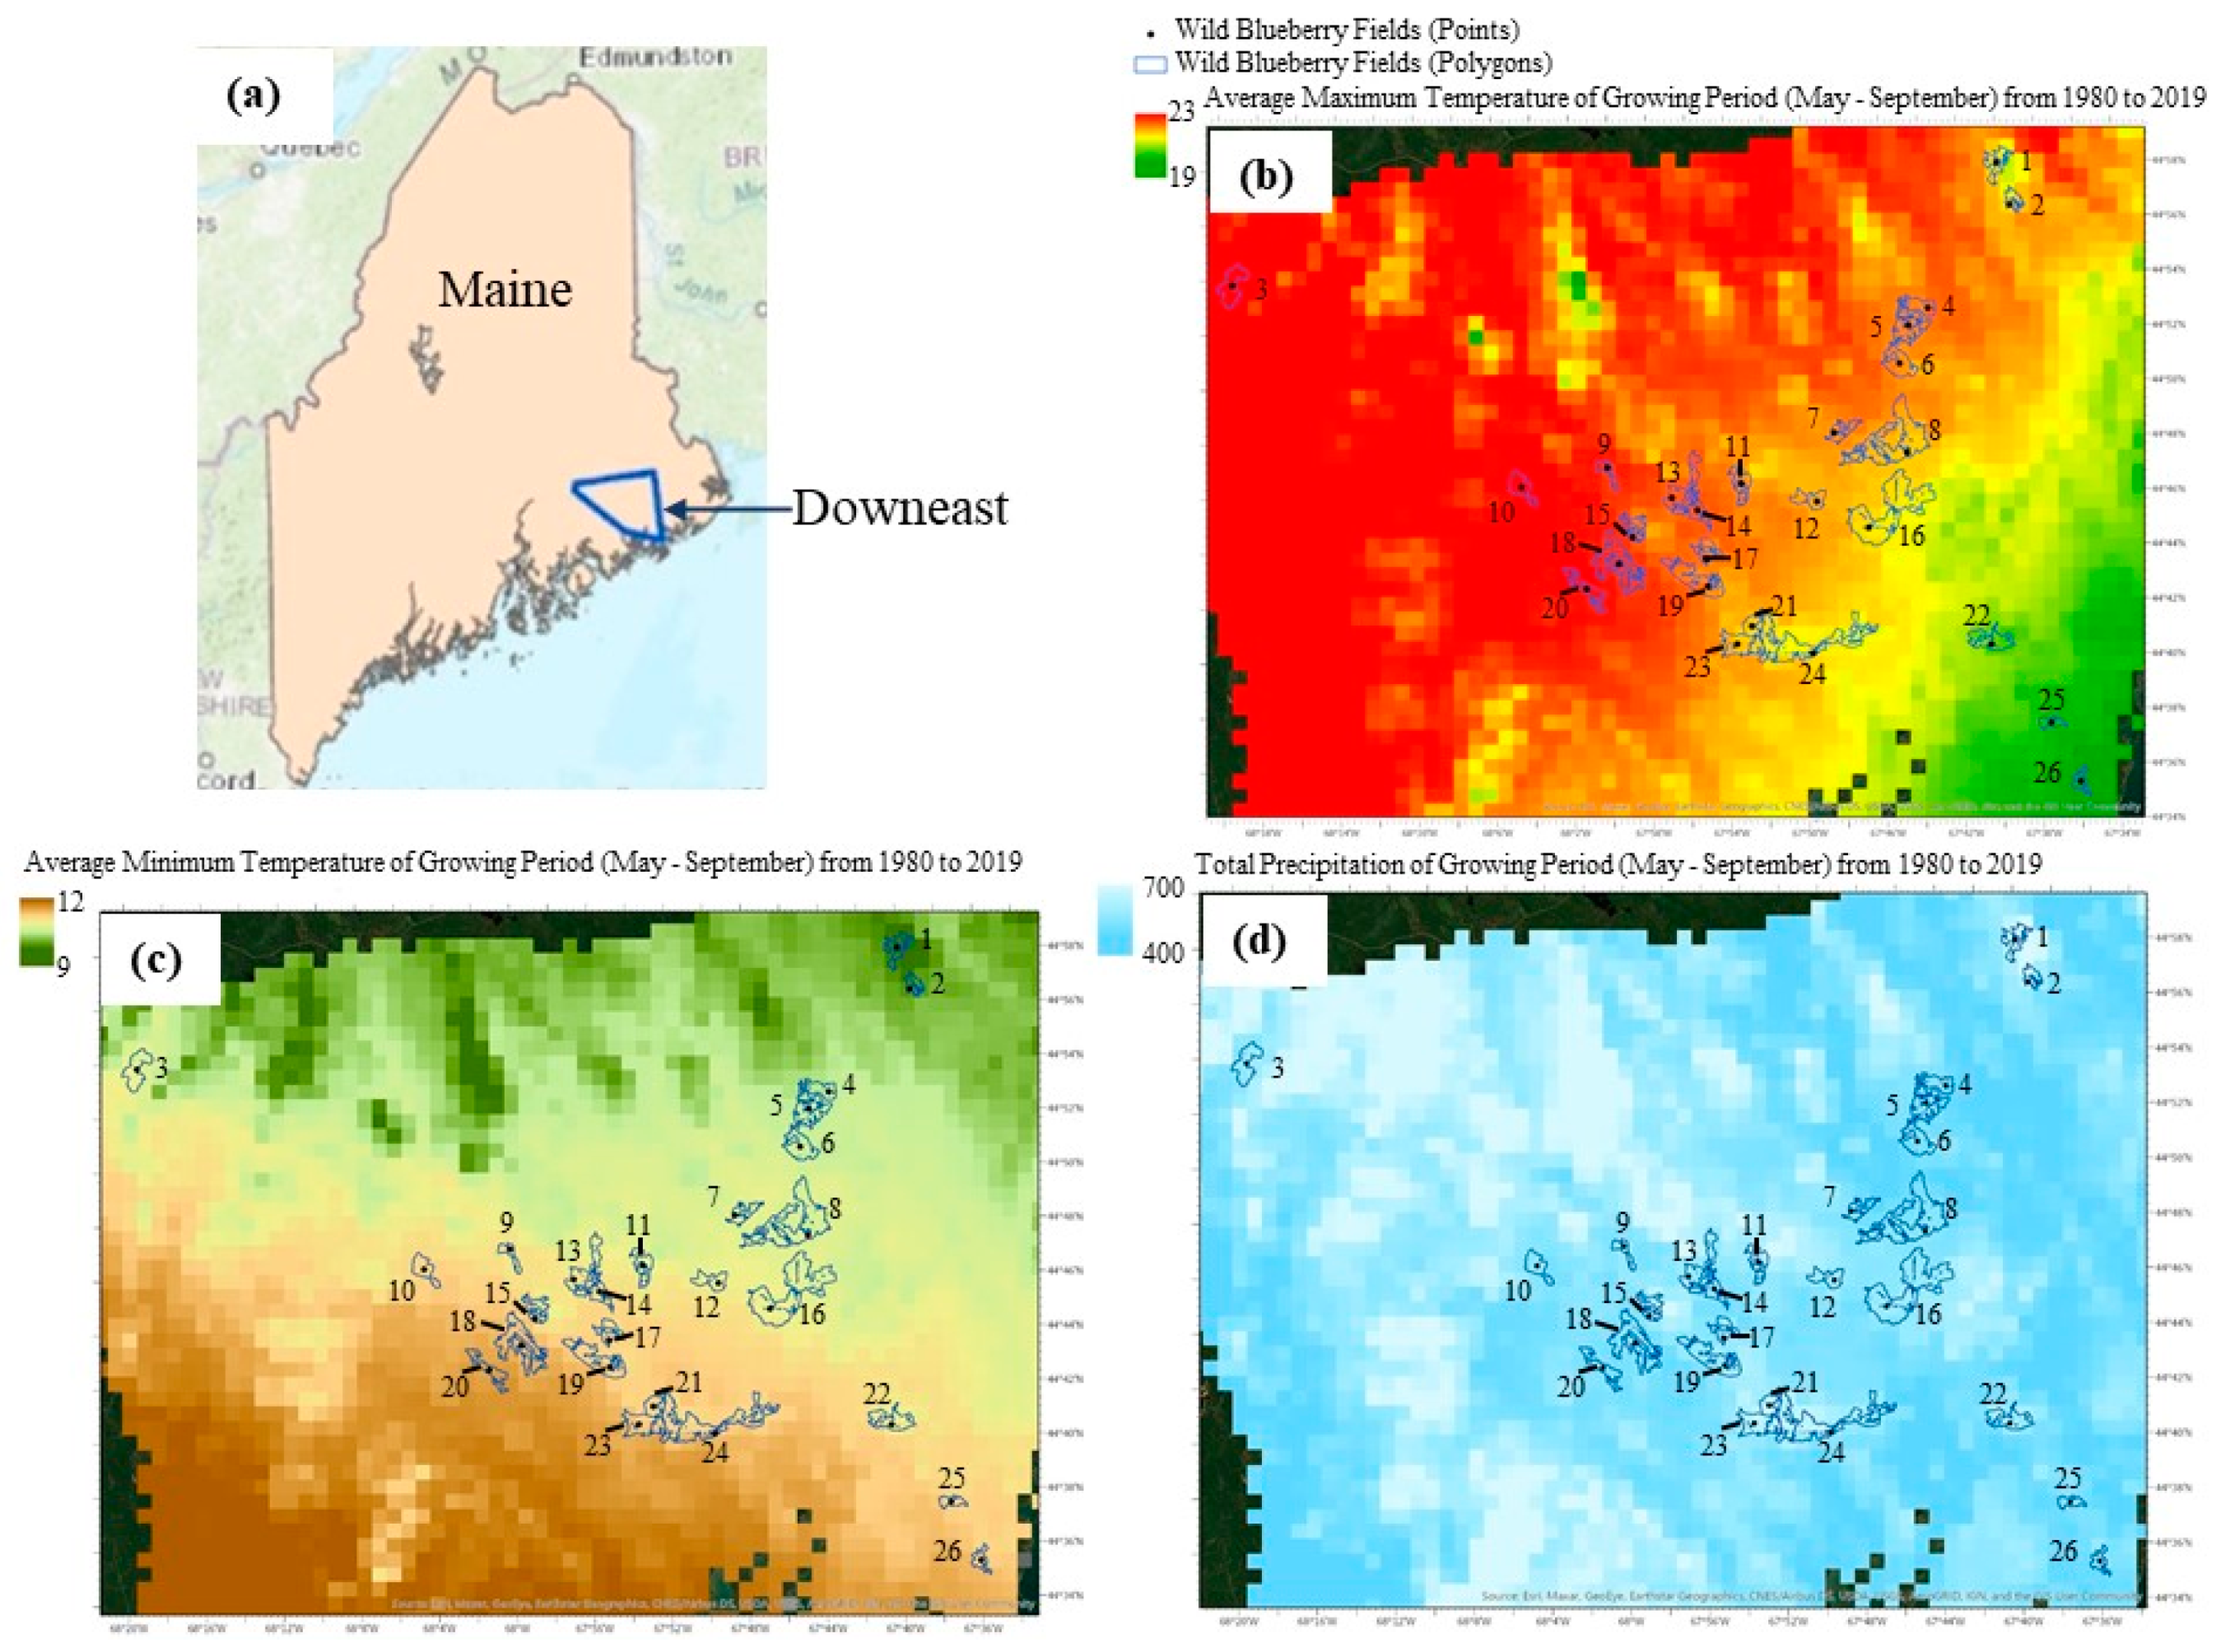
The study area involved 26 wild blueberry fields in Downeast, Maine, USA. Two fields (fields no. 3 and 10) are in Hancock County and 24 fields are in Washington County, Maine, USA (Figure 1). Among all the wild blueberry fields in the Downeast region of Maine, 26 fields with 1 km2 or larger areas were selected for the study. The land area threshold (1 km2) was used because the remote sensing data products that we used had a spatial resolution of 1 km. The selected wild blueberry fields are marked with blue boundary and black mid-points and are labeled with numbers 1 to 26 in Figure 1b–d.
2.2. Data Acquisition and Methodology
The polygons of all 26 wild blueberry fields in Maine (Figure 1) were acquired from a Google Earth Pro (https://www.google.com/earth/versions/#earth-pro; accessed on 01 April 2020) KMZ file based on a field survey carried out by David Yarborough, Professor Emeritus of Horticulture and Wild Blueberry Specialist, University of Maine. The dataset of climate variables (maximum temperature, minimum temperature, average temperature, and total precipitation) during the growing season (May to September) over 40 years from 1980 to 2019 averaged across Maine were acquired from the software Climate Reanalyzer (https://ClimateReanalyzer.org, Climate Change Institute, University of Maine, USA, accessed on 17 May 2020). The original data sources for the climate variables were obtained from the website NOAA Climate at a Glance (https://www.ncdc.noaa.gov/cag/statewide/time-series/, accessed on 17 May 2020).
The measures for monthly climate variables (maximum temperature, minimum temperature, and total precipitation) over 40 years from 1980 to 2019 were acquired for our study area from Daymet (https://daymet.ornl.gov/getdata, accessed on 17 May 2020) [16,17]. These data were provided on a per-pixel basis at 1 km spatial resolution. Annual Maximum Enhanced Vegetation Index (EVImax) data for 17 years (2001 to 2017) from the Downeast region of Maine were acquired from Google Earth. These data were originally obtained by the Moderate Resolution Imaging Spectroradiometer (MODIS) (https://lpdaac.usgs.gov/products/mod13a1v006/, accessed on 17 May 2020) [18]. The MODIS data (MOD13A1 Version 6) provides Maximum Enhanced Vegetation Index (EVImax) values at a per-pixel basis at 500 m spatial resolution. The EVI corrects for some atmospheric conditions, minimizes canopy background noise, and maintains sensitivity over dense vegetation and high biomass conditions. The best available pixel values from all the acquisitions for the 16-day-period were selected based upon the criteria of low clouds, low view angle, and highest EVImax value.
Remote sensing measures for Monthly Global Potential Evapotranspiration, averaged over the 31 year period (1970–2000) were acquired from the Consortium for Spatial Information (CGIAR-CSI) GeoPortal (https://cgiarcsi.community, accessed on 17 May 2020) [19]. These data were provided at a per-pixel basis at 1 km spatial resolution. The Remote sensing (MODIS data) measures for the Monthly Global Potential Evapotranspiration over the 15-year-period from 2000 to 2014 were acquired from the Numerical Terradynamic Simulation Group (NTSG) website from the University of Montana (http://www.ntsg.umt.edu/project/mod16#data-product, accessed on 17 May 2020). The spatial resolution of these MODIS data products (MOD16A2) was 1 km.
After acquiring the above-mentioned remote sensing measures, they were further analyzed using different tools in Arc GIS Pro 2.4.2 Software [15]. The detailed methodology adopted in Arc GIS Pro 2.4.2 Software is described in the “Supplementary Methods” section as supporting information. The measures of the climate variables, maximum enhanced vegetation index (EVImax), and potential evapotranspiration (PET) were extracted for the studied 26 wild blueberry fields and then transferred from Arc GIS Pro to an Excel spreadsheet (Microsoft, Redmond, WA, USA). Then, the comparisons and trendlines of historical climate change for the entire state of Maine and the 26 wild blueberry fields as well as relationships of the climate variables with the EVImax were analyzed. Furthermore, the comparisons of the PET (potential evapotranspiration) among the two different time periods for the wild blueberry fields as well as the relationship between PET and EVImax were tested.
2.3. Statistical Analysis
Statistical analyses were conducted using SPSS V23 (IBM Corp., Armonk, NY, USA) [20], XRealStats (Addinsoft, New York, NY, USA) [21], and RStudio software (RStudio, PBC, Vienna, Austria). Changes (increasing or decreasing) in climate variables (Tmax, Tmin, Tavg, Ptotal,) over the last 40 years from 1980 to 2019 at the studied 26 wild blueberry fields in Downeast, Maine as well as at the overall state of Maine were determined from linear regression trendlines (Supplementary Table S1). Trend analyses of these climate variables (Tmax, Tmin, Tavg, Ptotal,) were conducted using the Mann–Kendall trend test, Sen’s slope estimator, and sequential Mann–Kendall test. Mann–Kendall trend test results and the Sen’s slope Q (Table 1) were computed using XRealStats [21] where continuity correction was applied, and the autocorrelation was taken into account using the Hamed and Rao method [22]. The forward (UF) and backward (UB) curves of the sequential Mann–Kendall test statistics were computed in RStudio software. A Pearson correlation analysis was conducted between the climate variables (Tmax, Tmin, Tavg, Ptotal, PET, and increase in Tmax, increase in Tmin, increase in Tavg, increase in Ptotal) and geographic factors (Latitude, Longitude, Elevation, Distance from the coast) (Table 2). Here, in order to adopt multiple analysis significance protection, the p-values were adjusted using the Benjamini and Hochberg method at a false discovery rate (FDR) of 0.05 [23]. Generalized linear model (GLM) analysis using the Gaussian error distribution was also conducted between the climate variables (Tmax, Tmin, Tavg, Ptotal) and geographic factors (Latitude, Longitude, Elevation, Distance from coast) considering the geographic locations as fixed factors (Table 3). Furthermore, univariate and multiple linear regression analyses were conducted to test the relationship between climate variables (Tmax averaged over May to September and Ptotal of May to September) and PET (average of May–September) for the 26 wild blueberry fields for 15 years (2000–2014). Univariate and multiple linear regression analyses in the form of a + bx (linear line), and a + bx + cx2 (quadratic curve) models, respectively, were also conducted to explore the relationship between EVImax and climate variables including Tmax averaged over May to September, Ptotal of May to September, and PET averaged over May to September. We determined the model which best approximated the structure of the relationship using the coefficient of determination and its significance at p < 0.001. Similar regression analyses were also conducted for each of the studied 26 fields separately (Table S2). The significant differences in PET between the 1970–2000 period and 2001–2014 period were tested by one-way analysis of variance (ANOVA) for each month (January–December). Levene’s test was conducted to meet the assumption of homogeneity of variances. Whenever the assumption was violated (when p < 0.05 in Levene’s test) for any case, the significance was further tested using the Brown–Forsythe test [24] at significance levels of p 0.05 *, p 0.01 ** and p0.001 ***. Furthermore, we conducted a two-way ANOVA test without replication (Randomized Complete Block design) considering the 12 months as a block variable, and the time periods of 1970–2000 and 2001–2014 as a categorical variable to determine if there was a significant difference between the two time periods over the overall 12 months.
3. Results
3.1. Comparison of Historical Climate Change between Maine and the Wild Blueberry Fields of Downeast Maine
Based upon the increasing linear trends in the maximum, minimum, and average temperatures (Figure 2 and Table S1) over the last 40 years (1980–2019), the temperature increase during the growing season was higher in the studied wild blueberry fields compared to the spatial average of the state of Maine. The maximum temperature during the growing season increased by 1.2 ± 0.05 °C over the last 40 years in the wild blueberry fields compared to 0.9 ± 0.06 °C in Maine (Figure 2a). Interestingly, while there was a very slight difference in maximum temperatures (Figure 2a) between the wild blueberry fields and Maine over the last 40 years, the difference in minimum temperatures between the wild blueberry fields and Maine was quite apparent (Figure 2b). The minimum temperature increased by 1.6 ± 0.03 °C in the fields while it increased by 1.3 ± 0.03 °C in Maine (Figure 2b). Consequently, the average temperature had a marked difference between the wild blueberry fields and Maine over the last 40 years. The average temperature increased by 1.3 ± 0.04 °C in wild blueberry fields while it increased by 1.1 ± 0.05 °C in Maine (Figure 2c).
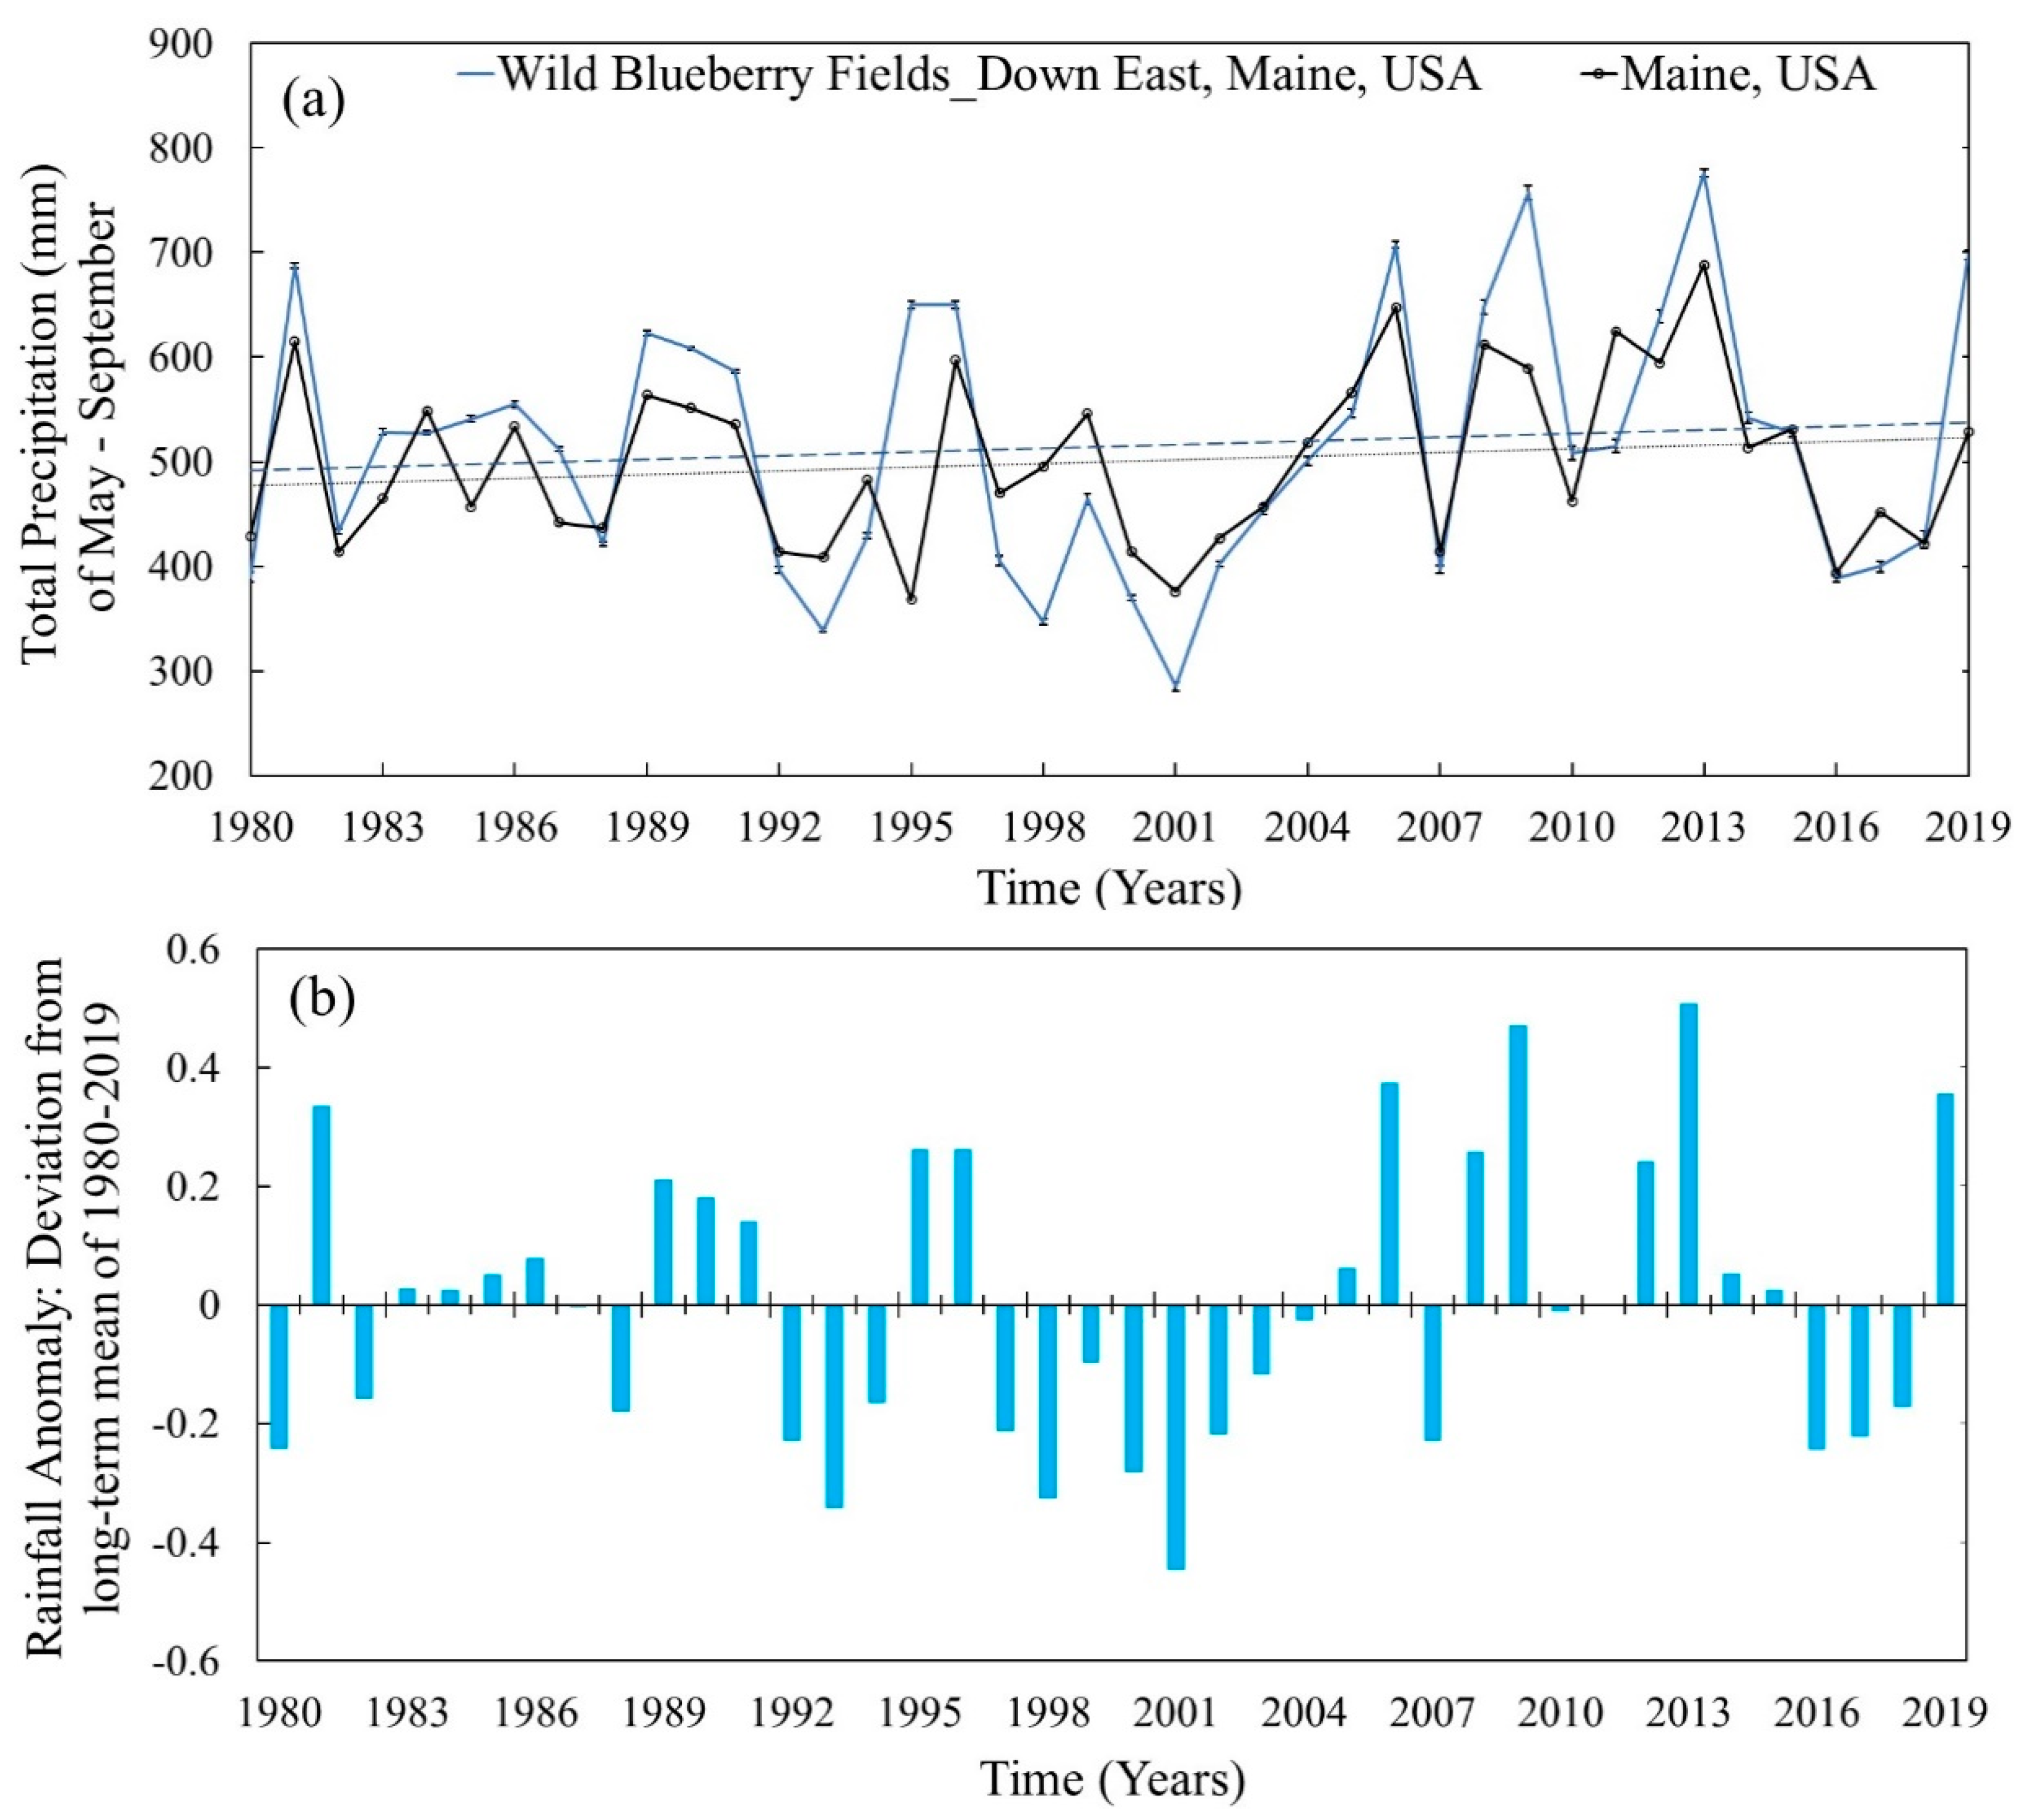
In contrast to the temperature changes, total precipitation during the growing season showed no overall changes over the last 40 years for both wild blueberry fields and Maine (Figure 3a and Table S1). However, for most of the years (36 out of 40 years) there were marked differences in total precipitation between the entire state of Maine and the wild blueberry fields (Figure 3a). For instance, the total precipitation was higher in the wild blueberry fields compared to the state of Maine for 19 out of the last 40 years while for 17 years the total precipitation was lower in the fields compared to the state of Maine. Moreover, the total precipitation of the studied wild blueberry fields was higher than the long-term mean of 1980 to 2019 during 19 out of the 40 years while it was much lower during 21 out of 40 years (Figure 3b).
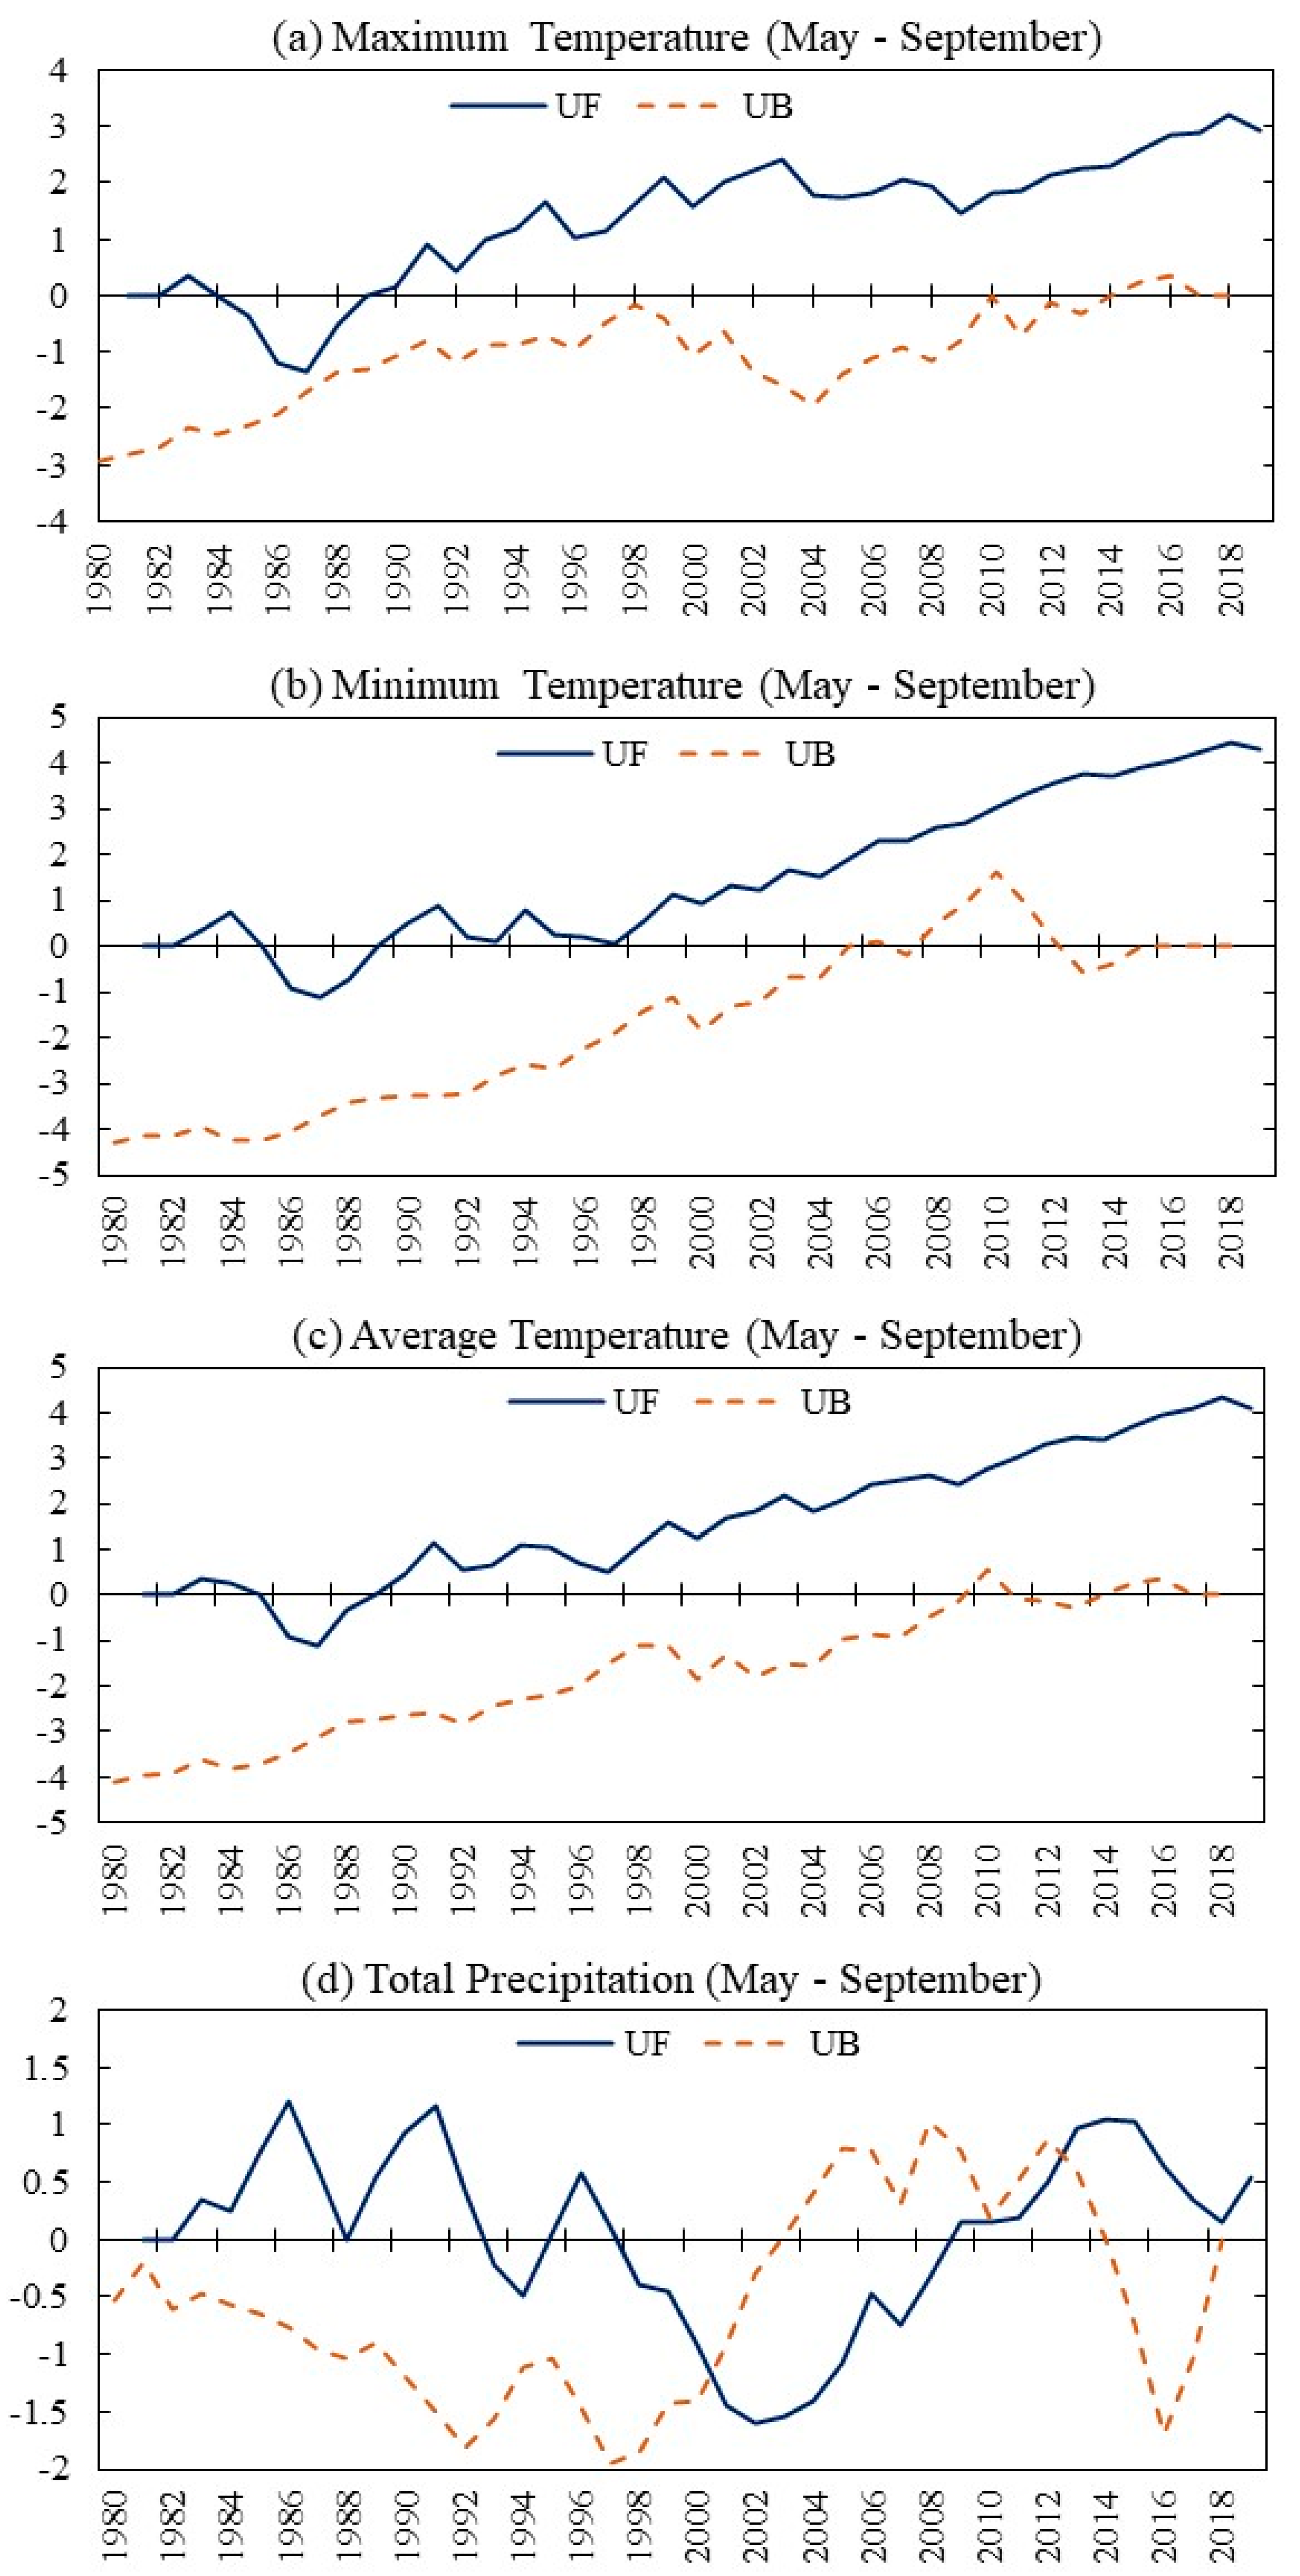
Furthermore, significant increasing trends in historical temperature changes (maximum, minimum, and average temperatures, from 1980 to 2019) at the wild blueberry fields in Downeast, Maine were supported graphically by the upward UF curve (forward trend) mostly being > 0.0 and UB (backward trend) curve mostly being < 0.0 (Figure 4a–c) and supported statistically by the Mann–Kendall test statistics (Table 1). In contrast, no significant trend was found in historical precipitation changes in the wild blueberry fields (Figure 4d and Table 1).
3.2. Comparison of Historical Climate Change among the Wild Blueberry Fields in Downeast, Maine
Marked differences in the growing season maximum, minimum, and average temperatures (Figure 1b,c, Figure S1a–c and S2) averaged over the last 40 years (1980–2019) were detected among the wild blueberry fields. In fact, these climate variables, water flux (PET) and their historical changes at the studied wild blueberry fields have significant relationships with their geographic factors (i.e., Latitude, Longitude, Elevation, and Distance from the coast) (Table 2 and Table 3).
During the growing season, the maximum temperature difference among all fields was ~2 °C (Figure 1b and Figure S1a). The maximum temperature was the lowest (~20 °C to 21 °C) in fields near the coast (field #s 22, 25, and 26, Figure 1b). The more distant the fields from the coast (Figure 1b), the higher the maximum temperatures were in those fields. Wild blueberry field #3, which is the farthest from the coast, located in Hancock Co., Maine (in the upper-left corner of the study area boundary in Figure 1b) experienced the highest temperature (~22.5 °C) among all fields. Maximum temperatures in the remaining fields (middle of the study area, Figure 1b) ranged from ~21.5 °C to ~22.5 °C. The maximum temperature at those studied wild blueberry fields had a significant positive relationship with their latitude, elevation, and distance from the coast (Table 2 and Table 3).
In contrast, the minimum temperature at those fields had a significant negative relationship with their latitude, longitude, elevation, and distance from the coast (Table 2 and Table 3). Minimum temperatures were higher in fields near the coast (Figure 1c). Fields farther from the coast (field #s 26 to 1 sequentially, 26 being the closest to coast and 1 to 3 being the farthest, Figure 1c) also had lower minimum temperatures. The overall difference in minimum temperatures during the growing season among all fields was ~1.0 °C.
Interestingly, a contradictory trend in average temperatures was observed among fields compared to the maximum and minimum temperature differences (Figure S1c). For instance, three fields closest to the coast (field #s 22, 25, and 26, Figure 1) and two fields farthest from the coast (field #s 1 and 2 in Figure 1) had similar atmospheric average temperatures (~15.5 °C to 15.8 °C) during the growing season (Figure S1c and Table S1). However, field #3, although farthest from the coast, had the highest average temperature (~16.3 °C) compared to all other fields because of its highest recorded maximum temperature (Figure S1c and Table S1). The overall difference in average temperatures during the growing season among all those fields was 0.9 °C.
In contrast to temperature changes, total precipitation during the growing season was similar among all fields (Figure 1d and Figure S1d). No significant relationship was observed between the total precipitation and the geographic characteristics of those fields when analyzed with a generalized linear model (Table 3). However, a significant positive linear correlation was observed between total precipitation and elevation of the wild blueberry fields, but the increasing trends of total precipitation in the fields had a significant negative correlation with latitude, elevation, and distance from the coast (Table 2 and Table S1). Therefore, based upon both correlation analysis and use of generalized linear models, the relationship between geographic field characteristics and precipitation was not consistent.
3.3. Relationship of Climate Variables with the Vegetation Index of Wild Blueberry Fields
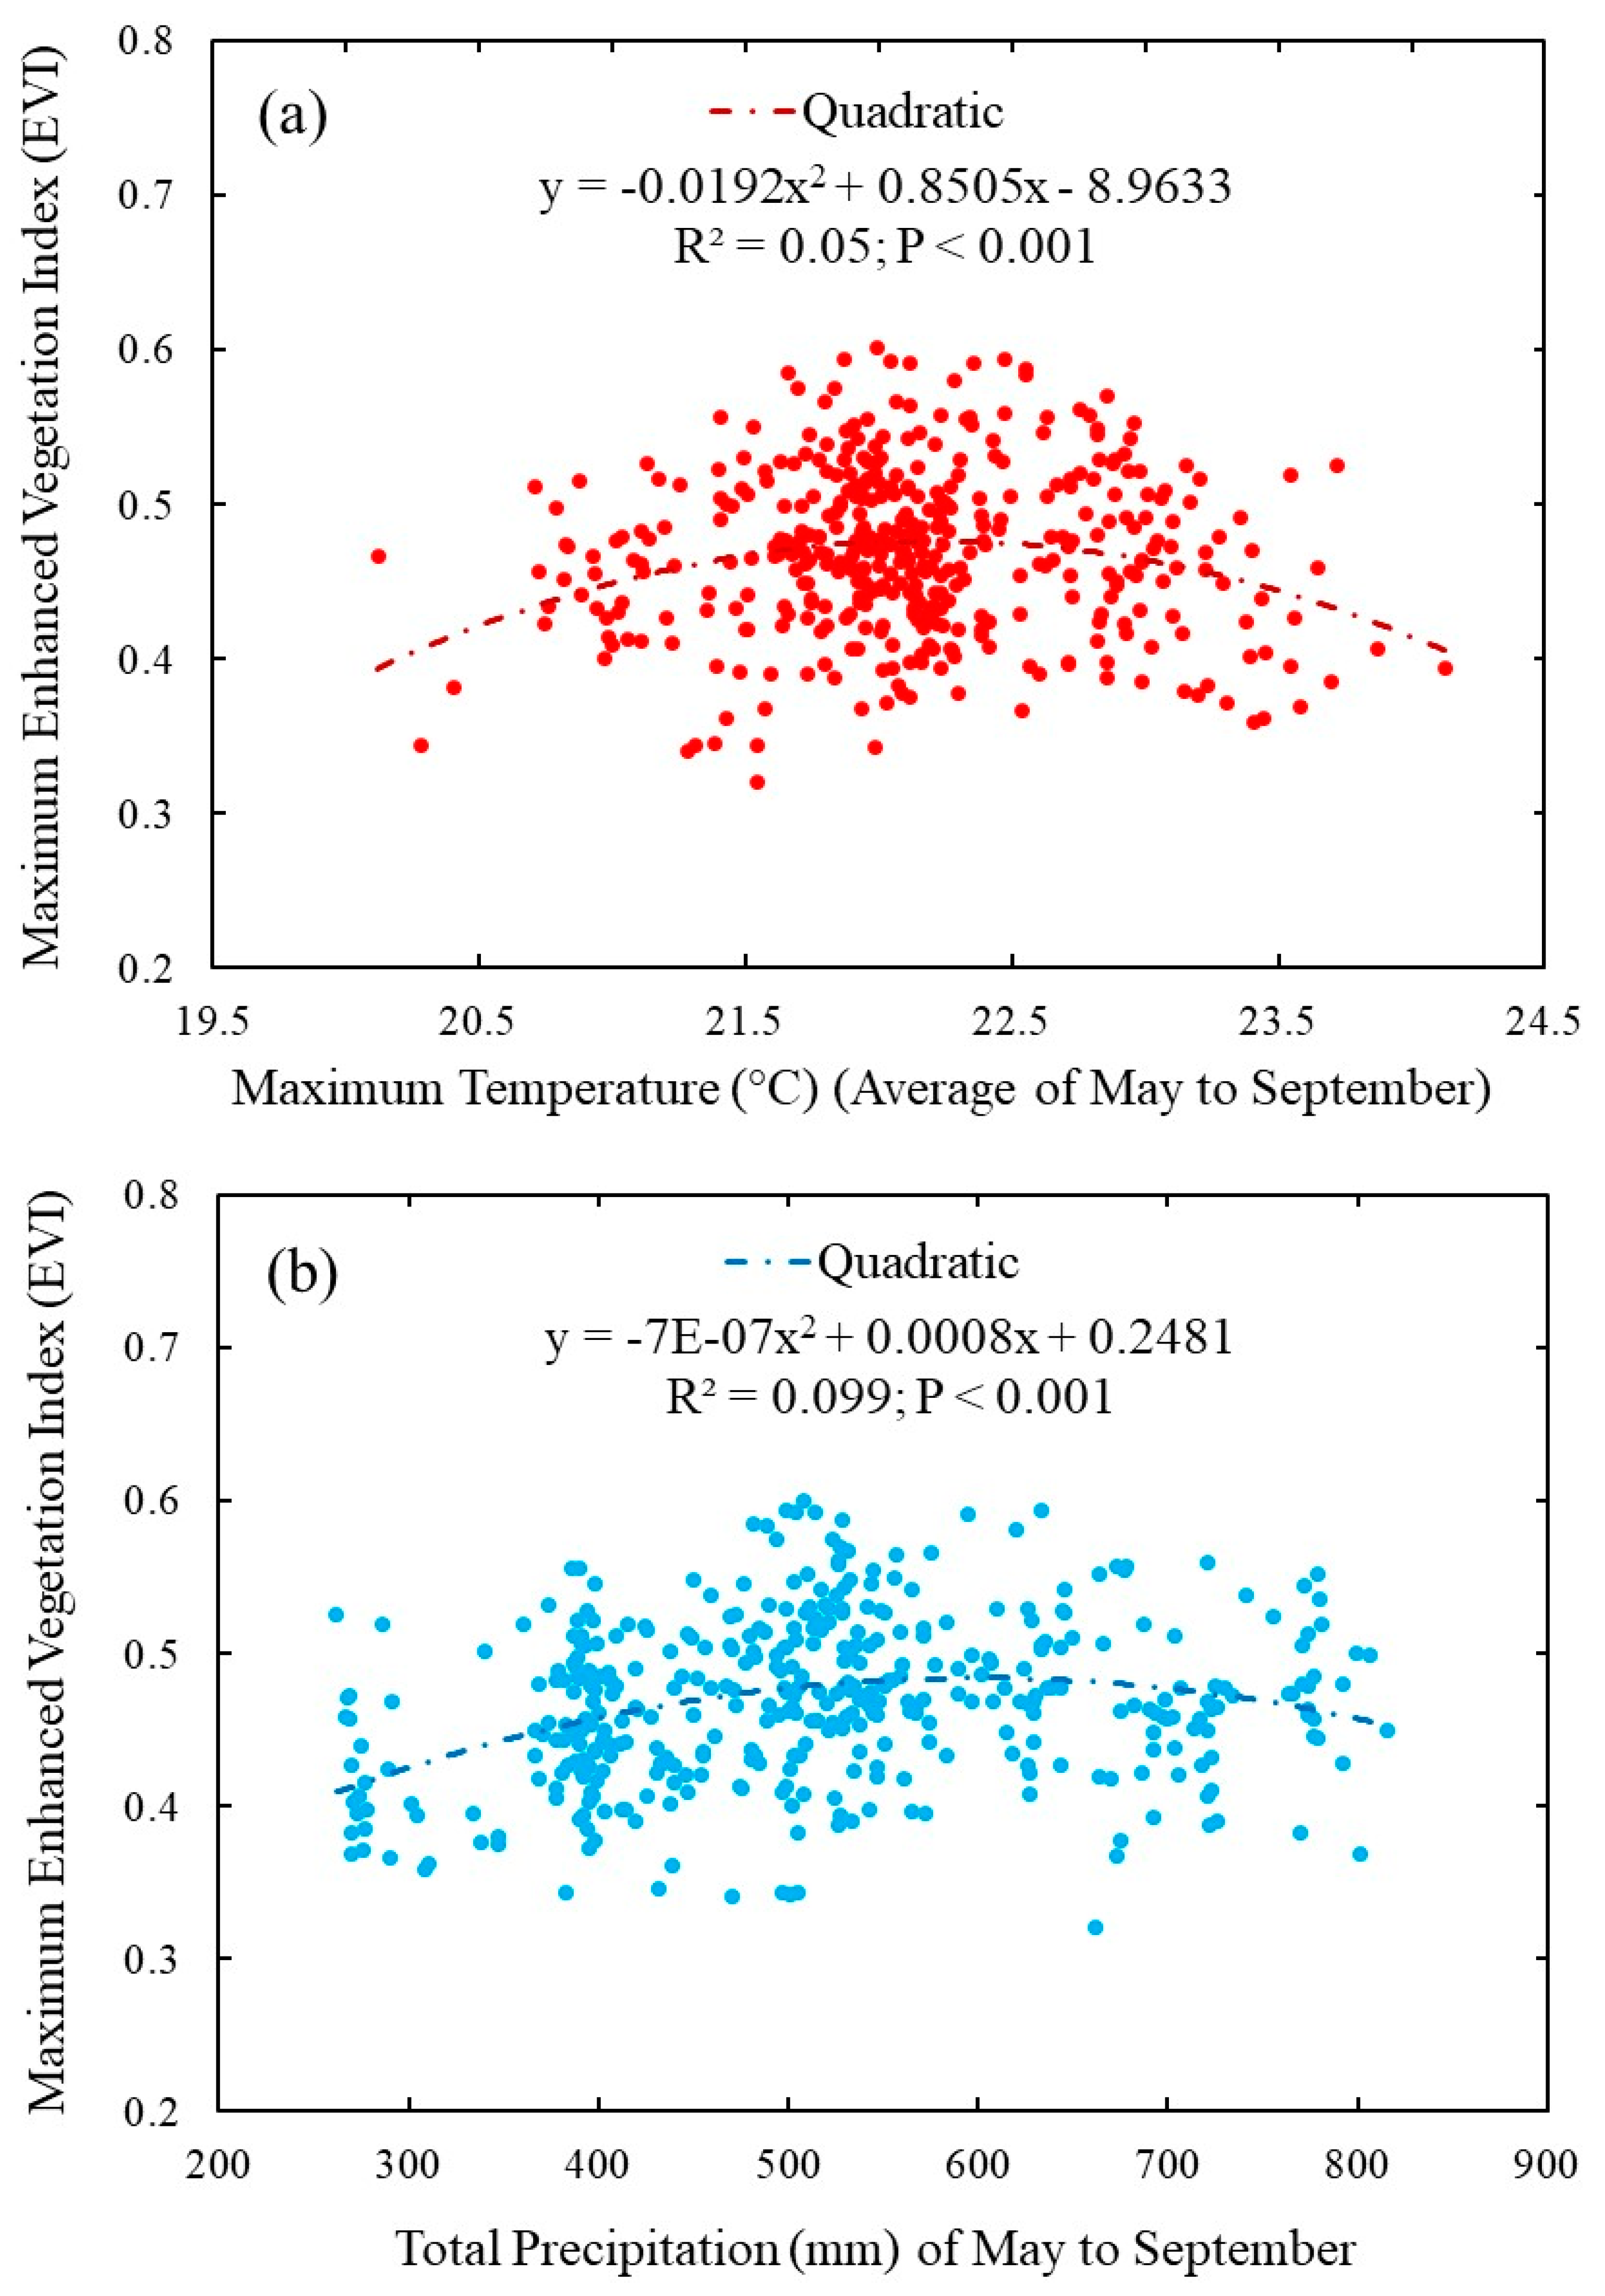
The Maximum Enhanced Vegetation Index (EVImax) in wild blueberry fields during the growing season was significantly (p < 0.001) related to the maximum temperature (Figure 5a) and total precipitation (Figure 5b). A significant quadratic relationship (p < 0.001) was observed between EVImax and maximum temperature (Figure 5a), as well as between the EVImax and total precipitation (Figure 5b).
3.4. Wild Blueberry Fields Experienced Suboptimal Temperatures during the Peak Season (July and August)
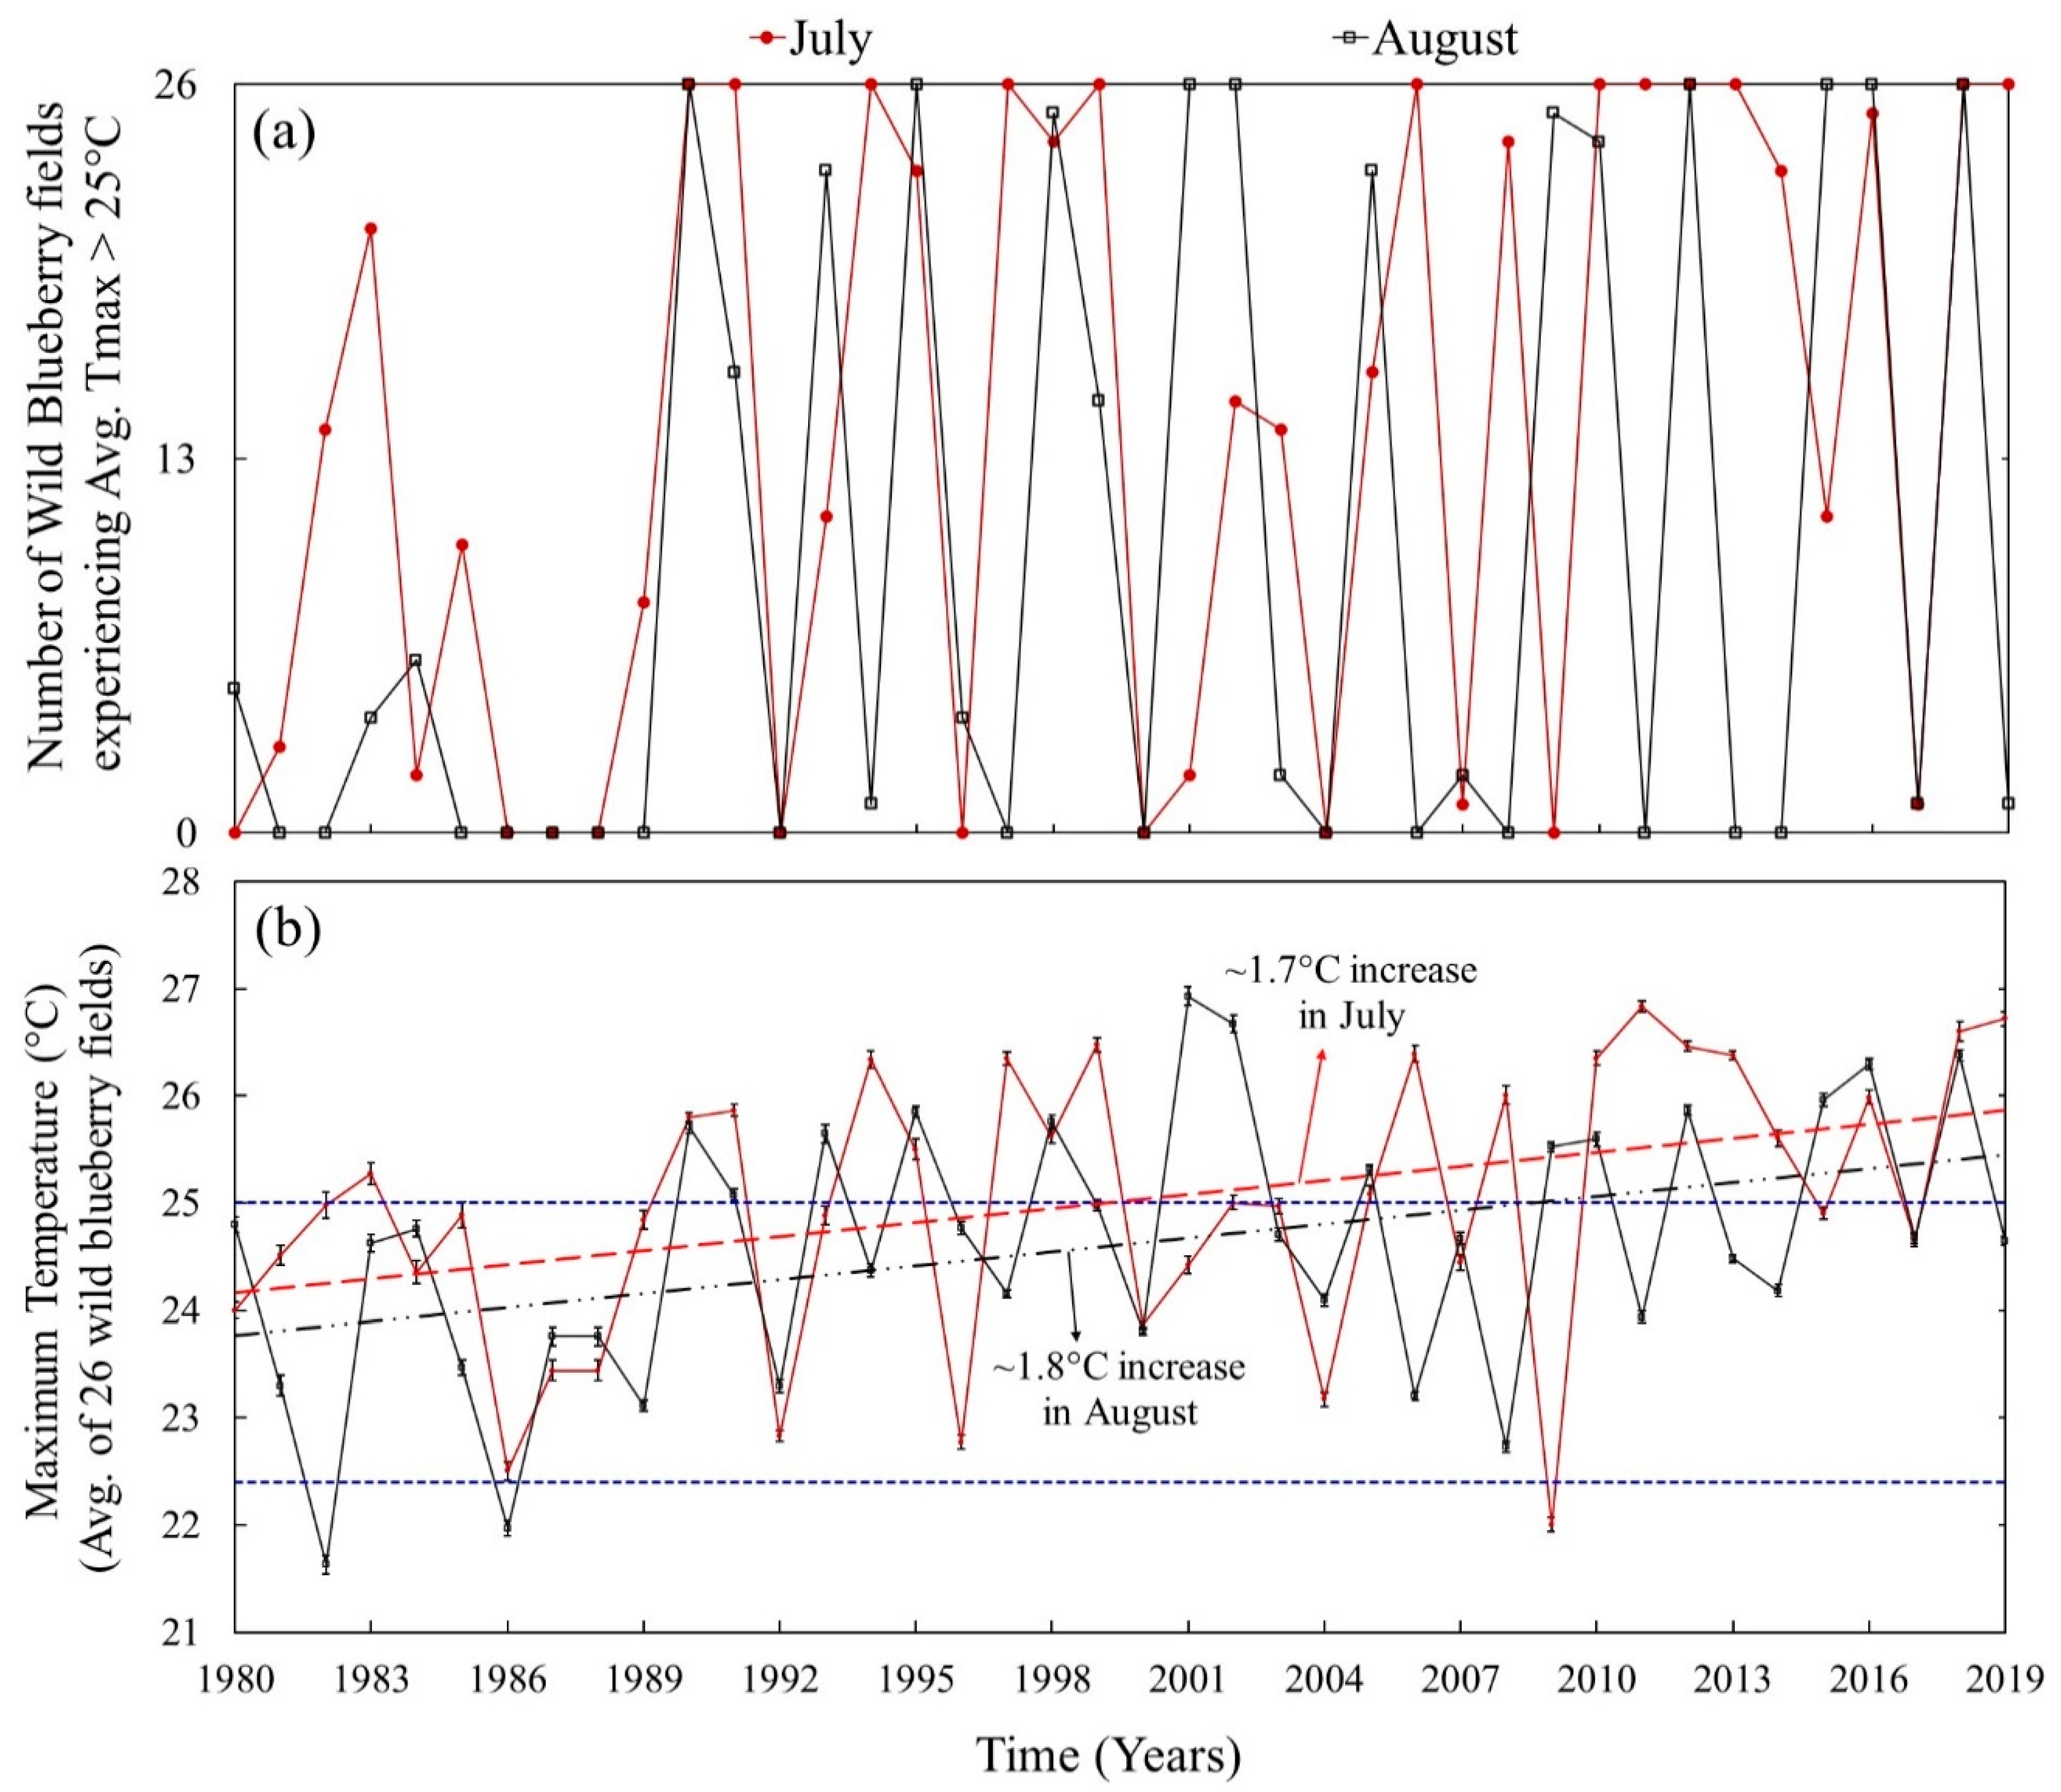
More than half of the studied 26 wild blueberry fields experienced an average maximum temperature greater than 25 °C during the peak season (July and August) for 15–20 years out of the last 40 years (1980–2019) (Figure 6a). Here, 25 °C was the potential threshold temperature for wild blueberries observed by Tasnim et al. [9], above which wild blueberry photosynthesis started to decline. Furthermore, the average maximum temperature of the studied wild blueberry fields in July and August has increased ~1.7 °C to 1.8 °C over the last 40 years (Figure 6b). The average maximum temperature in July and August was also observed to increase beyond the potential threshold temperatures of 22.4 °C (Figure 5a) and 25 °C (based on a field study by Tasnim et al. [9]) in the studied wild blueberry fields.
3.5. Potential Evapotranspiration (PET) Rate of the Wild Blueberry Fields
Average potential evapotranspiration (PET; mm/month) was significantly different (F(1,2) = 22.2, p < 0.001) between the two time periods (1970–2000 and 2001–2014) during the 12 months. Furthermore, the monthly total potential evapotranspiration (averaged over 1970–2000 and 2001–2014 period) was significantly different between the 1970–2000 and 2001–2014 periods for every month from January to December (Figure 7a). Potential evapotranspiration (mm/month) was significantly higher during the 2001–2014 period compared to the 1970–2000 period in the months of April, June, July, and August to October (3.3 mm/month–17.5 mm/month). In contrast, potential evapotranspiration (mm/month) was significantly higher during the 1970–2000 period compared to the 2001–2014 period in the months of January to March, May, and October to December (2.1 mm/month–11.4 mm/month).
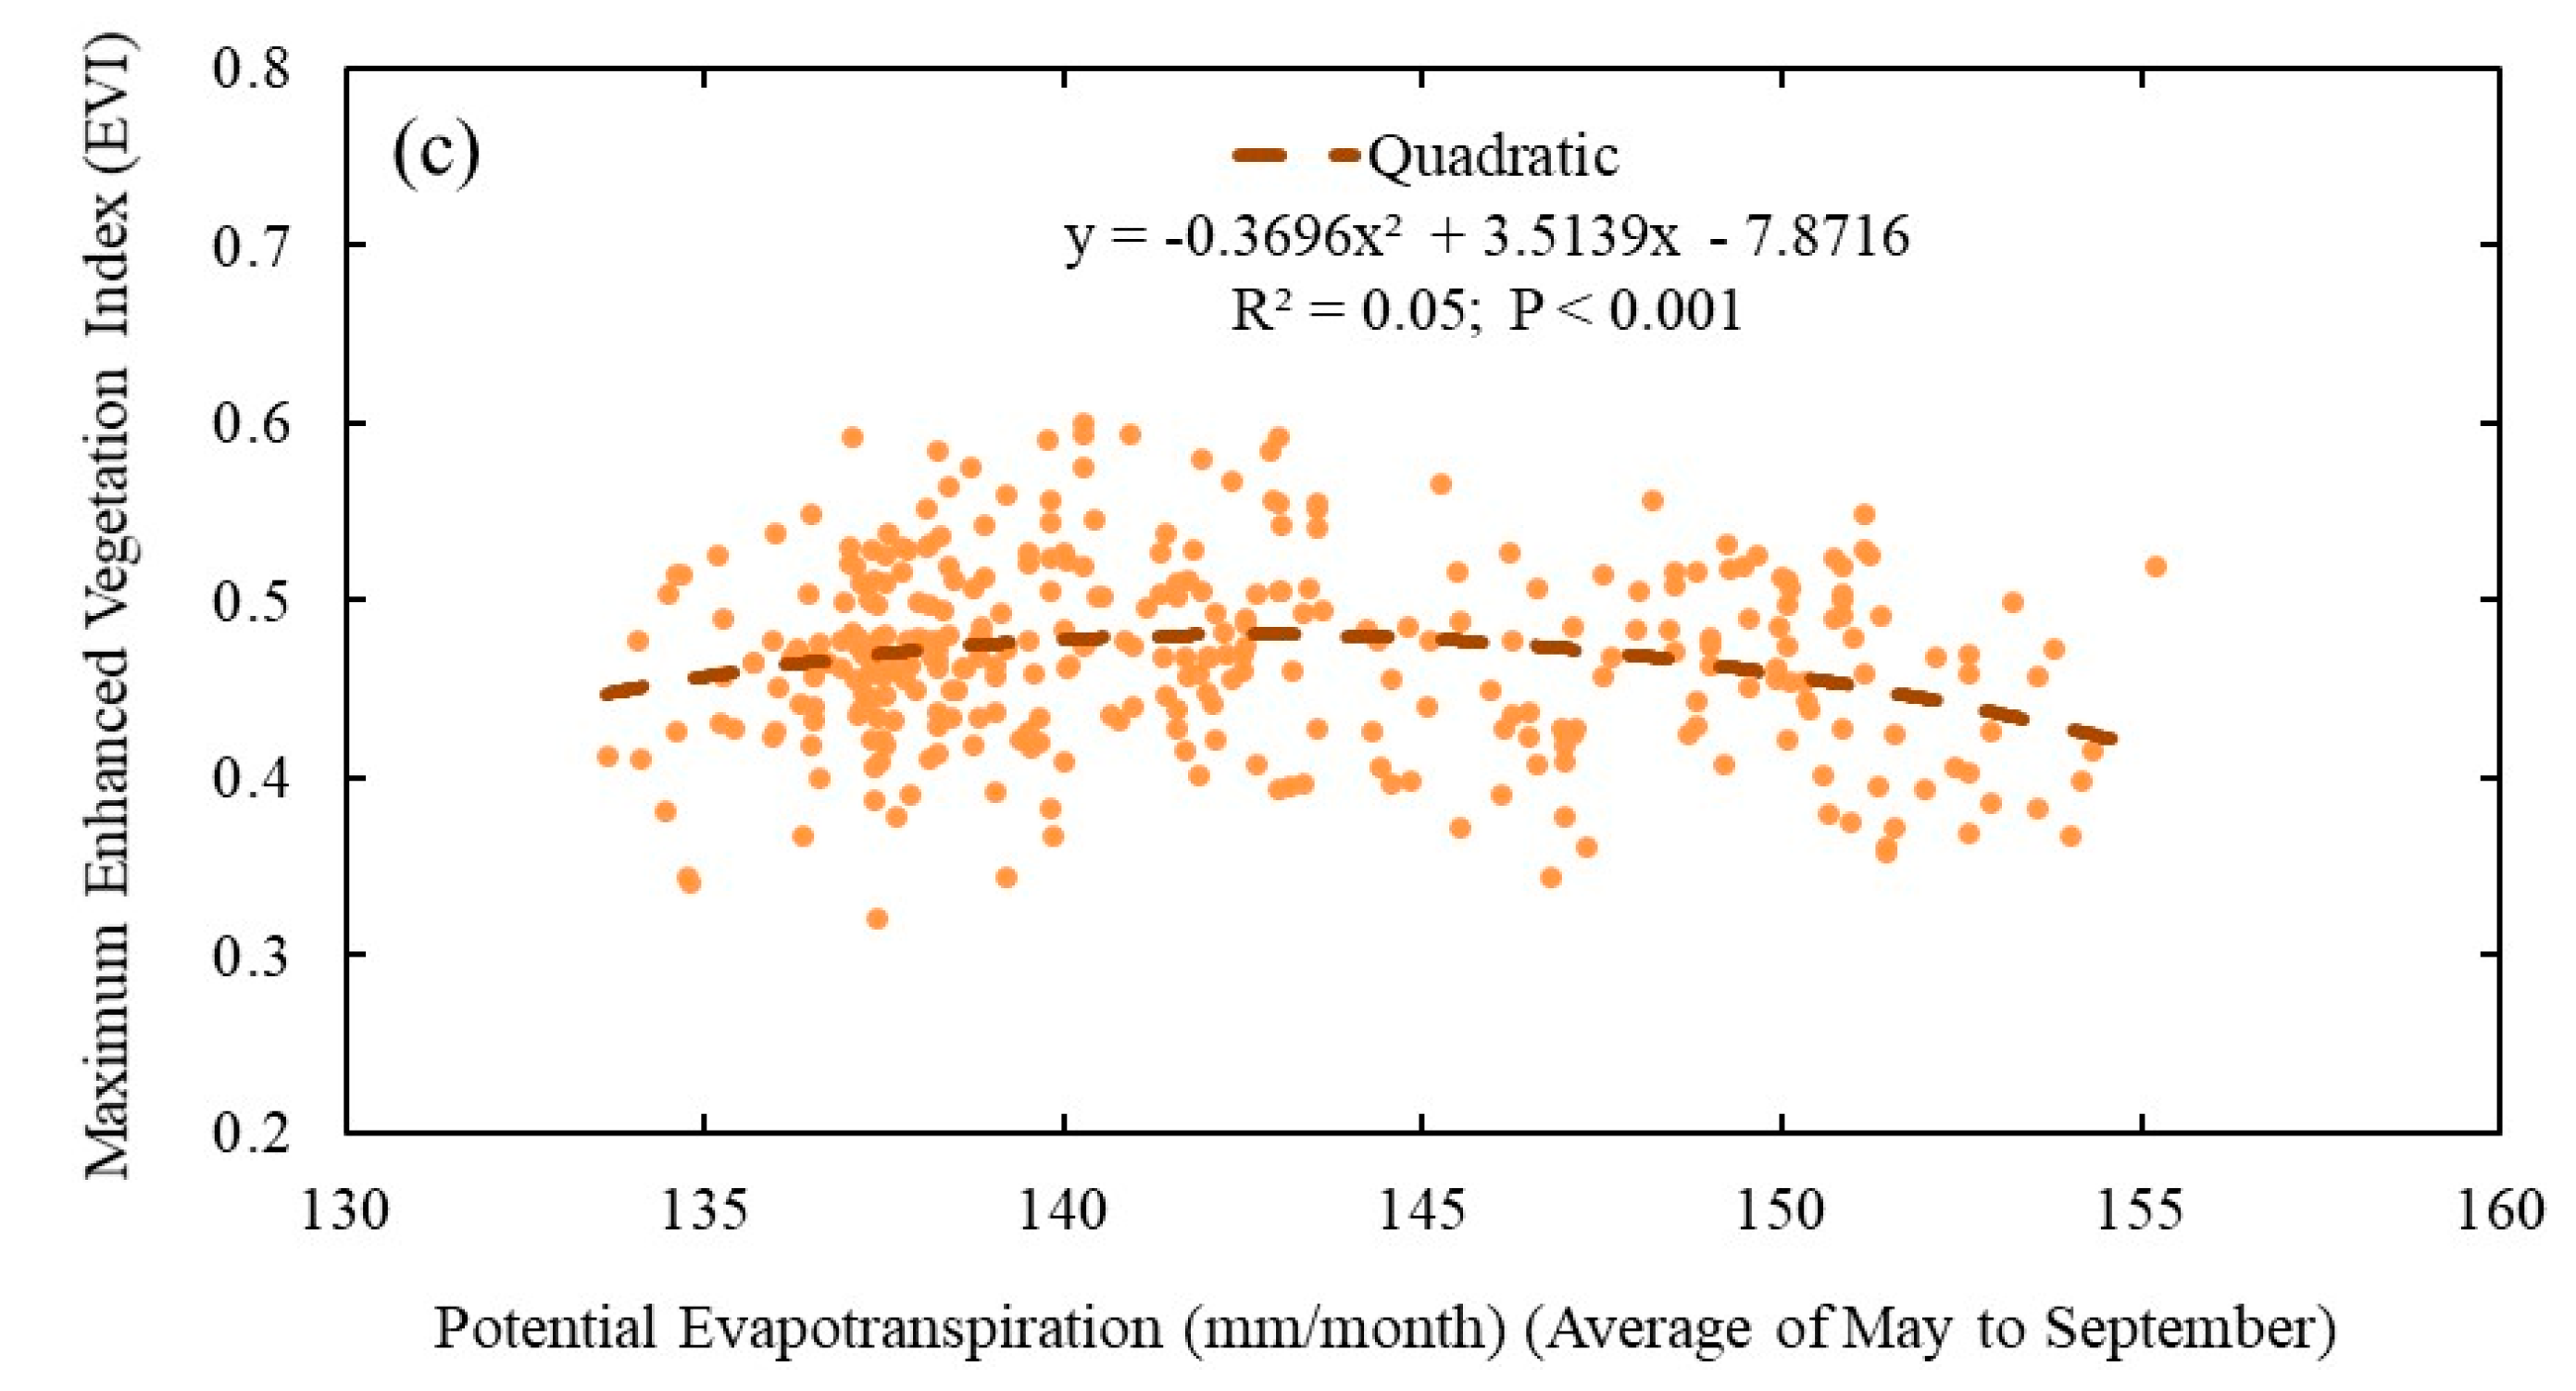
The average PET had a significant positive linear relationship (R2 = 0.42; p < 0.001) with the average maximum temperature during the growing season in wild blueberry fields (Figure 7b). A significant negative linear relationship (R2 = 0.55; p < 0.001) was also observed between average PET and total precipitation (mm) during the growing season (relationship not shown). Furthermore, multiple regression showed that the average maximum temperature and total precipitation together explained 73% of the variance in average potential evapotranspiration (R2 = 0.73; p < 0.001). Similar to the temporal dynamics of the climate variables, the average potential evapotranspiration (mm/month) during the growing season had a significant quadratic relationship (p < 0.001) with EVImax in wild blueberry fields, although only 5% of the variance was explained in EVImax (Figure 7c). This suggests that while average evapotranspiration is a significant predictor of EVImax, there are one or more other factors primarily responsible for driving EVImax.
4. Discussion
Our results indicate that climate change patterns in wild blueberry fields are different from the spatially averaged patterns of Maine. While temperatures have been increasing over the last 40 years everywhere in Maine [5], the temperature increase in wild blueberry fields during the growing season (May–September) is higher than that of the region (state of Maine). Our analysis (Mann–Kendall test) indicated significant increasing trends in historical temperature in those studied wild blueberry fields. Consequently, the potential evapotranspiration (PET) also increased in wild blueberry fields, which is strongly determined by maximum temperatures. In addition, the temporal climate change patterns we observed also varied spatially among wild blueberry fields depending on their geographic locations (i.e., latitude, longitude, elevation, and distance of the fields from the coast). Our study also revealed significant relationships among climate variables, PET, and the maximum enhanced vegetation index (EVImax) for wild blueberry fields in Downeast, Maine which can provide guidelines for developing mitigation strategies against climate change.
The different climate patterns, especially higher temperatures, in wild blueberry fields compared to the state of Maine’s overall average imply that we must not recommend management tactics for those fields based on Maine’s aggregate climate patterns. This pattern is consistent with the designated three climate zones (Northern, Interior, and Coastal) in Maine which are characterized by different maximum, minimum, and average temperatures [5,6]. However, the observed patterns in average maximum temperatures across the wild blueberry fields during the growing season were different compared to the observed annual average maximum temperatures in those three climate zones. It was observed that the wild blueberry fields close to the coast experienced the lowest temperatures and fields farthest from the coast experienced the highest temperatures among the studied fields. This trend is contradictory to the fact that the Coastal climate zone of Maine has historically been the warmest, followed by the Interior and Northern climate zones [5,6]. On the contrary, the observed minimum temperatures of those fields were in agreement with temperature patterns in the three Maine climate zones [5,6]. It was observed that fields near the coast experienced the highest minimum temperatures, and fields farther from the coast experienced the lowest minimum temperatures. However, the calculated average temperatures also followed the trend of maximum temperatures, as fields closest to the coast had slightly lower average temperatures than other fields. These contradictory responses could be because we studied temperature trends of wild blueberry fields during the growing season (May to September), whereas temperature trends in the three Maine climate zones are based on annual average temperatures which incorporate warming trends during the winter [5,6].
Additionally, because many of the fields experienced warming at different rates, spatial variation should be considered when planning for future management strategies (i.e., irrigation, fertilization) under climate change. Since wild blueberry fields closer to the coast showed significantly higher increases in growing season temperatures (Table 2), growers who have fields closer to the coast need to pay more attention to the potential negative effects of warming on crop health and production. Meanwhile, fields closer to the coast also showed a higher increase in precipitation. This suggests a lower risk of water deficits in coastal fields. However, our analysis (sequential Mann–Kendall test) on climate change patterns in wild blueberry fields over the last 40 years demonstrated that air temperatures have been significantly increasing without significant change in precipitation. Hence, at similar precipitation rates, the higher temperature increases in more coastal fields, if they continue in the future, would result in higher PET and hence higher soil and crop water loss. This dynamic needs to be considered in estimating the impacts of climate change on the water needs of wild blueberries on the sandy granitic soils in Maine.
Temperatures strongly determine water-flux (i.e., PET) in agricultural fields, which further affects crop water status, health, and productivity [11]. Aprialdi et al. [25] found a similar correlation between the atmospheric temperature and PET estimated using the Penman–Monteith equation [26,27], as shown in this study. Thus, the significant increase in atmospheric temperature during the growing season over the last 40 years explained the increase in PET in Maine wild blueberry fields. A predicted further increase in temperatures and thus PET will probably increase water deficits of the wild blueberry crops that grow naturally in sandy granitic soils with a low water-holding capacity. Remote-sensing-based PET can be a useful tool for determining crop water deficits [28] and can be analyzed based on the PET–EVI relationship established in this study to infer the needs for irrigation.
The quadratic relationships between maximum EVI and the maximum temperature, and between maximum EVI and PET suggest that, after reaching a threshold maximum temperature (~22.4 °C) and potential evapotranspiration (~145 mm/month), further increases in temperature and PET will cause declines in EVI. These threshold values suggest optimum conditions for wild blueberry health and productivity, and hence can be used to infer effective management. Although these relationships had low coefficients (R2 < 0.1) due to variations among fields, they imply future declines in Maximum EVI, and crop productivity with continued increases in air temperature and PET [29,30]. In support of this prediction, Tasnim et al. [9] have shown that air temperatures above 25 °C result in a reduction of chlorophyll leaf content and photosynthetic performance in wild blueberry plants. This suboptimal temperature (≥25 °C) appears to be a concern for at least half of our studied fields in the peak season (July and August). Moreover, the increasing maximum temperatures beyond the observed threshold temperatures of 22.4 °C or 25 °C in our studied wild blueberry fields in July and August over the past 40 years could be alarming. A temperature between 22.4 °C and 25 °C probably would not impact photosynthetic processes and related enzyme activities directly. However, a temperature increase beyond 22.4 °C could increase soil and crop water loss, resulting in water deficits and consequently decreased photosynthesis. Wild blueberry crops growing on sandy soils can be sensitive to water loss. This is supported by the quadratic relationship between maximum EVI and PET in combating the potential negative effects of further warming. This potential negative effect of warming on wild blueberry production suggests the need for mitigation efforts, and irrigation or soil amendment techniques need to be considered in planning.
While the use of temperature, precipitation, and potential evapotranspiration variables to predict changes in vegetation growth and productivity have been conducted for forest ecosystems (i.e., EVI) [31,32], our study is the first to explore climate change patterns in different fields of a fruit crop within a single production region. We have also established relationships between climate conditions, water flux, and the vegetation index for wild blueberry fields. These environmental variables, PET, and maximum EVI derived from remote sensing measurements can assist researchers in the development of optimal wild blueberry crop production models [28,29,30,31,32]. In turn, predictive crop production models should help wild blueberry growers to efficiently manage their crops during the current unprecedented era of climate change.
Supplementary Materials
The following are available online at https://www.mdpi.com/2073-4441/13/5/594/s1, Figure S1: Comparison of (a) maximum temperature (average of May–September), (b) minimum temperature (average of May–September), (c) average temperature (average of May–September) and (d) precipitation (total of May–September) from 1980 to 2019 among wild blueberry fields in Downeast, Maine, Figure S2: (a) Comparison of the temperature range (Tmax–Tmin) (average of May–September) from 1980 to 2019 among wild blueberry fields in Downeast Maine. The climate variables are represented as the Mean ± Standard error (n = 40; where 40 represents the years from 1980 to 2019). (b) Historical (1980 to 2019) changes in temperature range (Tmax–Tmin) (average of May–September) at the 26 wild blueberry fields (shown in Figure 1) in Downeast Maine, Table S1: Changes (increasing or decreasing) in climate variables (Tmax, Tmin, Tavg, and Ptotal) over the last 40 years from 1980 to 2019 at the studied 26 wild blueberry fields in Downeast, Maine as well as at the overall state of Maine, Table S2: Regression analysis between climate variables (Tmax, Tmin, Tavg, Ptotal and Rainfall anomaly) and Maximum Enhanced Vegetation Index (EVImax) at the studied 26 wild blueberry fields in Downeast, Maine.
Author Contributions
Conceptualized this study, Y.-J.Z. and R.T.; analyzed the remote sensing data in Arc GIS Pro software, conducted the statistical analysis of the data, prepared the figures, interpreted the results, and prepared the manuscript, R.T.; provided important input to the data analysis, figure preparations, interpreting the results as well as reviewed and revised the manuscript, F.D. and Y.-J.Z. All authors have read and agreed to the published version of the manuscript.
Funding
This project was supported by the USDA National Institute of Food and Agriculture, Hatch (or McIntire-Stennis, Animal Health, etc.) Project number ME0-21832 and ME0-22021 through the Maine Agricultural & Forest Experiment Station. Maine Agricultural and Forest Experiment Publication Number 3802. This research was also supported by the Wild Blueberry Commission of Maine, and Maine Department of Agriculture, Conservation and Forestry (SCBGP).
Data Availability Statement
Please See “2.2. Data Acquisition and Methodology” section in this article for the sources of the publicly archived data products used in this study.
Acknowledgments
We would like to acknowledge David Yarborough, Horticulture and Wild Blueberry Specialist, the University of Maine for providing us the KMZ file containing the wild blueberry field polygons in Maine to conduct this study. We would also like to acknowledge Valeria Briones, Graduate student from the School of Forest Resources, the University of Maine for providing us the raster files of the Maximum Enhanced Vegetation Index for Downeast Maine to conduct the analysis of this study. We also acknowledge Zheng Wei, Assistant Professor of Statistics, the University of Maine for suggestions on statistical analyses.
Conflicts of Interest
The authors declare no conflict of interest.
References
- Shrestha, S.; Chapagain, R.; Babel, M.S. Quantifying the impact of climate change on crop yield and water footprint of rice in the Nam Oon Irrigation Project, Thailand. Sci. Total Environ. 2017, 599, 689–699. [Google Scholar] [CrossRef] [PubMed]
- Van Passel, S.; Massetti, E.; Mendelsohn, R. A Ricardian analysis of the impact of climate change on European agriculture. Environ. Resour. Econ. 2017, 67, 725–760. [Google Scholar] [CrossRef] [Green Version]
- Petersen, L.K. Impact of Climate Change on Twenty-First Century Crop Yields in the US. Climate 2019, 7, 40. [Google Scholar] [CrossRef] [Green Version]
- Solomon, S.; Manning, M.; Marquis, M.; Qin, D. Climate Change 2007—The Physical Science Basis: Working Group I Contribution to the Fourth Assessment Report of the IPCC; Cambridge University Press: Cambridge, UK, 2007; Volume 4. [Google Scholar]
- Fernandez, I.; Birkel, S.; Schmitt, C.; Simonson, J.; Lyon, B.; Pershing, A.; Stancioff, E.; Jacobson, G.; Mayewski, P. Maine’s Climate Future 2020 Update. Available online: climatechange.umaine.edu/climate-matters/maines-climate-future/ (accessed on 17 May 2020).
- NOAA–CAAG (National Oceanic and Atmospheric Administration–National Centers for Environmental Information). Climate at a Glance, US Climate Divisional Database. 2019. Available online: ncdc.noaa.gov/cag/statewide/time-series (accessed on 17 May 2020).
- Badaruddin, M.; Reynolds, M.P.; Ageeb, O.A. Wheat management in warm environments: Effect of organic and inorganic fertilizers, irrigation frequency, and mulching. Agron. J. 1999, 91, 975–983. [Google Scholar] [CrossRef]
- Reynolds, M.P.; Gutiérrez-Rodrĺguez, M.; Larqué-Saavedra, A. Photosynthesis of wheat in a warm, irrigated environment: I: Genetic diversity and crop productivity. Field Crops Res. 2000, 66, 37–50. [Google Scholar] [CrossRef]
- Tasnim, R.; Calderwood, L.; Annis, S.; Drummond, F.; Zhang, Y.J. The Future of Wild Blueberries: Testing Warming Impacts Using Open-Top Chambers. Available online: https://umaine.edu/spire/2020/02/10/wildblueberries/ (accessed on 17 May 2020).
- Yarborough, D.E. Wild Blueberry Culture in Maine. Fact Sheet No. 220. Available online: https://extension.umaine.edu/blueberries/factsheets/production/wild-blueberry-culture-in-maine/ (accessed on 16 July 2020).
- Bhatt, R.; Hossain, A. Concept and Consequence of Evapotranspiration for Sustainable Crop Production in the Era of Climate Change. Available online: https://www.intechopen.com/books/advanced-evapotranspiration-methods-and-applications/concept-and-consequence-of-evapotranspiration-for-sustainable-crop-production-in-the-era-of-climate- (accessed on 17 May 2020).
- Waring, R.H.; Coops, N.C.; Fan, W.; Nightingale, J.M. MODIS enhanced vegetation index predicts tree species richness across forested ecoregions in the contiguous USA. Remote Sens. Environ. 2006, 103, 218–226. [Google Scholar] [CrossRef]
- Wu, C.; Chen, J.M.; Huang, N. Predicting gross primary production from the enhanced vegetation index and photosynthetically active radiation: Evaluation and calibration. Remote Sens. Environ. 2011, 115, 3424–3435. [Google Scholar] [CrossRef]
- Huete, A.; Didan, K.; Miura, T.; Rodriguez, E.P.; Gao, X.; Ferreira, L.G. Overview of the radiometric and biophysical performance of the MODIS vegetation indices. Remote Sens. Environ. 2002, 83, 195–213. [Google Scholar] [CrossRef]
- Esri Inc. ArcGIS Pro (Version 2.4.2). 2019. Available online: https://www.esri.com/en-us/arcgis/products/arcgis-pro/ (accessed on 1 February 2020).
- Thornton, P.E.; Running, S.W.; White, M.A. Generating surfaces of daily meteorological variables over large regions of complex terrain. J. Hydrol. 1997, 190, 214–251. [Google Scholar] [CrossRef] [Green Version]
- Thornton, M.M.; Thornton, P.E.; Wei, Y.; Mayer, B.W.; Cook, R.B.; Vose, R.S. Daymet: Monthly Climate Summaries on a 1-km Grid for North America; Version 3; ORNL DAAC: Oak Ridge, TN, USA, 2018. [Google Scholar]
- Didan, K. MOD13A1 MODIS/Terra Vegetation Indices 16-Day L3 Global 500m SIN Grid V006 [Data set]. Available online: https://doi.org/10.5067/MODIS/MOD13A1.006 (accessed on 25 May 2020).
- Trabucco, A.; Zomer, R.J. Global Aridity Index and Potential Evapotranspiration (ET0) Climate Database v2. Available online: https://doi.org/10.6084/m9.figshare.7504448.v3 (accessed on 19 May 2020).
- IBM SPSS Statistics for Windows; Version 23.0; IBM Corp: Armonk, NY, USA, 2015.
- Addinsoft. XLSTAT Statistical and Data Analysis Solution. Available online: https://www.xlstat.com (accessed on 26 December 2020).
- Hamed, K.H.; Rao, A.R. A modified Mann-Kendall trend test for autocorrelated data. J. Hydrol. 1998, 204, 182–196. [Google Scholar] [CrossRef]
- Benjamini, Y.; Hochberg, Y. Controlling the false discovery rate: A practical and powerful approach to multiple testing. J. R. Stat. Soc. Ser. B (Methodol.) 1995, 57, 289–300. [Google Scholar] [CrossRef]
- Brown, M.B.; Forsythe, A.B. Robust tests for the equality of variances. J. Am. Stat. Assoc. 1974, 69, 364–367. [Google Scholar] [CrossRef]
- Aprialdi, D.; Haiban, M.I.; Kløve, B.; Torabi Haghighi, A. Irrigation Requirement for Eucalyptus pellita during Initial Growth. Water 2019, 11, 1972. [Google Scholar] [CrossRef] [Green Version]
- Allen, R.G.; Pereira, L.S.; Raes, D.; Smith, M. Crop evapotranspiration-Guidelines for computing crop water requirements-FAO Irrigation and drainage paper 56. Fao Rome 1998, 300, D05109. [Google Scholar]
- Walter, I.A.; Allen, R.G.; Elliott, R.; Jensen, M.E.; Itenfisu, D.; Mecham, B.; Howell, T.A.; Snyder, R.; Brown, P.; Eching, S.; et al. ASCE’s standardized reference evapotranspiration equation. In Proceedings of the Nat’l Irrigation Symp., Phoenix, AZ, USA, 14–16 November 2000. [Google Scholar]
- Wambura, F.J.; Dietrich, O. Analysis of Agricultural Drought Using Remotely Sensed Evapotranspiration in a Data-Scarce Catchment. Water 2020, 12, 998. [Google Scholar] [CrossRef] [Green Version]
- Xiao, X.; Boles, S.; Liu, J.; Zhuang, D.; Frolking, S.; Li, C.; Salas, W.; Moore, B., III. Mapping paddy rice agriculture in southern China using multi-temporal MODIS images. Remote Sens. Environ. 2005, 95, 480–492. [Google Scholar] [CrossRef]
- Wu, C.; Niu, Z.; Gao, S. Gross primary production estimation from MODIS data with vegetation index and photosynthetically active radiation in maize. J. Geophys. Res. Atmos. 2010, 115. [Google Scholar] [CrossRef] [Green Version]
- Deng, F.; Su, G.; Liu, C. Seasonal variation of MODIS vegetation indexes and their statistical relationship with climate over the subtropic evergreen forest of Zhejiang, China. IEEE Geosci. Remote Sens. Lett. 2007, 4, 236–240. [Google Scholar] [CrossRef]
- Jahan, N.; Gan, T.Y. Modelling the vegetation–climate relationship in a boreal mixed-wood forest of Alberta using normalized difference and enhanced vegetation indices. Int. J. Remote Sens. 2011, 32, 313–335. [Google Scholar] [CrossRef]
Figure 1.
Location and average climatic conditions of the study sites. (a) A map of Maine showing the study location in Downeast, Maine by the dark blue boundary (a large part of the Washington Co. and a small part of the Hancock Co.). (b) Average maximum temperature (Tmax, °C). (c) Average minimum temperature (Tmin, °C). (d) Total rainfall (Ptotal, mm) during the growing season (May to September) averaged over 40 years (1980–2019) in Downeast, Maine where 26 wild blueberry fields (area of each field ≥ 1 km2) are shown as the 26 black points inside the field polygons (shown by light blue borders) and labeled with numbers 1 to 26.

Figure 2.
Historical (1980 to 2019) changes in (a) maximum temperature (average of May–September), (b) minimum temperature (average of May–September), and (c) average temperature (average of May–September) throughout the state of Maine (averaged spatially), as well as at the 26 wild blueberry fields (shown in Figure 1) in Downeast, Maine. The climate variables from the fields are represented as the mean ± standard error (n = 26). The dotted lines are linear regression lines for the state of Maine and the dashed lines are linear regression lines for the wild blueberry fields in Downeast Maine over 40 years from 1980 to 2019.

Figure 3.
Changes in precipitation of the studied wild blueberry fields in the past 40 years. (a) Historical (1980 to 2019) changes in precipitation (total of May–September) throughout the state of Maine (averaged spatially), as well as at the 26 wild blueberry fields (shown in Figure 1) in Downeast, Maine. The climate variables from the fields are represented as the mean ± standard error (n = 26). The dotted lines are linear regression lines for the state of Maine and the dashed lines are linear regression lines for the wild blueberry fields in Downeast, Maine over 40 years from 1980 to 2019. (b) Rainfall anomaly during 40 years from 1980 to 2019 (deviation in annual precipitation amounts from the long-term mean of 1980 to 2019) at the 26 wild blueberry fields (shown in Figure 1) in Downeast, Maine.

Figure 4.
Sequential Mann–Kendall test statistics (UF and UB values) calculated from the (a) maximum temperature (average of May–September), (b) minimum temperature (average of May–September), (c) average temperature (average of May–September), and (d) total precipitation (total of May–September) in the 26 wild blueberry fields (shown in Figure 1) in Downeast, Maine.

Figure 5.
Maximum Enhanced Vegetation Index (EVImax) of the wild blueberry fields in relation to (a) maximum temperature (average of May–September) and (b) precipitation (total of May–September), from 2001 to 2017. The observed data points (n = 26 × 17 = 442) are from the 26 wild blueberry fields over 17 years (2001–2017). The dashed lines are quadratic relationships fitted to the data with multiple linear regression (p < 0.001).

Figure 6.
Maximum temperatures in the fields compared to optimum (threshold) maximum temperatures for enhanced vegetation index. (a) Number of wild blueberry fields among the 26 fields (shown in Figure 1) experiencing average maximum temperatures greater than 25 °C during July and August over the last 40 years (1980–2019). (b) Historical (1980 to 2019) changes in maximum temperature during July and August of the 26 wild blueberry fields (shown in Figure 1) in Downeast, Maine. The maximum temperatures from the fields are presented as means ± standard error (n = 26). The red solid lines with circles and the black solid lines with squares represent July and August, respectively. The dashed red lines and black lines are linear regression lines fitted to the data observed in July and August, respectively. The blue dotted lines represent the threshold maximum temperatures of 22.4 °C (observed from Figure 5a) and 25 °C (reported in the study by Tasnim et al. [9]).

Figure 7.
Potential evapotranspiration (PET) of 26 wild blueberry fields and its relationships with temperatures and enhanced vegetation index. (a) Historical comparison in average potential evapotranspiration (PET) between 1970–2000 and 2001–2014 periods from January to December. The data are represented as the means ± standard errors (n = 26; where 26 represents the number of wild blueberry fields). Differences are significant at p < 0.001 ***; p < 0.01 **; p < 0.05 *. (b) The relationship between maximum temperature (average of May–September) and potential evapotranspiration (average of May–September) from 2000 to 2014. The observed data points (n = 26*15 = 390) are from the 26 wild blueberry fields in Downeast Maine over 15 years (2000–2014). The dashed line in (b) is a linear relationship fitted to the data with multiple linear regression (p < 0.001). (b) The relationship between potential evapotranspiration (average of May–September) and Maximum Enhanced Vegetation Index (EVImax) of the 26 wild blueberry fields in Downeast Maine from 2001 to 2014. The observed data points (n = 26 × 14 = 364) are from the 26 wild blueberry fields for 14 years (2001–2014). The dashed line in (c) is a quadratic relationship fitted to the data with multiple linear regression (p < 0.001).


Table 1.
Trend analysis of climate variables (Tmax, Tmin, Tavg, Ptotal) using the Mann–Kendall test at the studied 26 wild blueberry fields of Downeast, Maine from 1980 to 2019.
Table 1.
Trend analysis of climate variables (Tmax, Tmin, Tavg, Ptotal) using the Mann–Kendall test at the studied 26 wild blueberry fields of Downeast, Maine from 1980 to 2019.
| Mann–Kendall Test | Tmax | Tmin | Tavg | Ptotal |
|---|---|---|---|---|
| Kendall’s tau | 0.323 | 0.474 | 0.454 | 0.06 |
| Mann–Kendall Stat (S) | 252 | 370 | 354 | 47 |
| Var (S) | 7366.67 | 7366.67 | 7366.67 | 7365.67 |
| p-value (two-tailed) | 0.003 | <0.0001 | <0.0001 | 0.592 |
| alpha | 0.05 | 0.05 | 0.05 | 0.05 |
| Trend | Increasing | Increasing | Increasing | Not significant |
| Sen’s slope Q | 0.031 | 0.038 | 0.037 | 0.96 |
Tmax, Tmin, and Tavg represent the maximum, minimum, and average temperatures, respectively, averaged during the growing period (May to September); Ptotal represents the total precipitation of the growing season (May to September).
Table 2.
Correlation analysis of climate variables (Tmax, Tmin, Tavg, Ptotal, and PET) and the increases in climate variables (Increase in Tmax, Tmin, Tavg, and Ptotal from Table S1) and in PET (potential evapotranspiration) with the geographic factors (Latitude, Longitude, Elevation, and Distance from the coast) from the studied 26 wild blueberry fields in Downeast, Maine.
| Factors/Variables | Latitude | Longitude | Elevation | Distance from Coast |
|---|---|---|---|---|
| Tmax | 0.476 * | −0.864 ** | 0.542 ** | 0.743 ** |
| Tmin | −0.866 ** | −0.416 * | −0.544 ** | −0.512 * |
| Tavg | 0.019 | −0.95 ** | 0.225 | 0.416 |
| Ptotal | 0.155 | 0.093 | 0.602 ** | 0.122 |
| PET | −0.04 | −0.57 ** | 0.493 * | 0.088 |
| Increase in Tmax | −0.15 | 0.945 ** | −0.338 | −0.59 ** |
| Increase in Tmin | 0.056 | 0.313 | 0.444 | −0.273 |
| Increase in Tavg | 0.003 | 0.893 ** | −0.082 | −0.526 * |
| Increase in Ptotal | −0.889 ** | 0.253 | −0.556 ** | −0.769 ** |
| Increase in PET | −0.005 | 0.365 | −0.51 * | −0.004 |
Tmax, Tmin, and Tavg represent the maximum, minimum, and average temperatures, respectively, averaged for the growing period (May–September); Ptotal represents the total precipitation of the growing period (May–September) averaged over 1980 to 2019; PET represents the average potential evapotranspiration of the growing period (May–September) averaged over 1970 to 2014. The increase in Tmax, Tmin, Tavg, and Ptotal represent the increments in those variables over 1980 to 2019 and the increase in PET represents the increment in PET during 2001–2014 compared to 1970–2000 during the growing season at the studied 26 wild blueberry fields in the Downeast, Maine. [Numbers are Pearson correlation coefficient values. p < 0.001***; p < 0.01**; p < 0.05*, where Benjamini–Hochberg adjusted p values are used at a False Discovery Rate of 0.05].
Table 3.
Generalized linear model (GLM) analysis between climate variables (Tmax, Tmin, Tavg, Ptotal) and geographic factors (Latitude, Longitude, Elevation, Distance from the coast) at the studied 26 wild blueberry fields of Downeast, Maine over 40 years from 1980 to 2019.
Table 3.
Generalized linear model (GLM) analysis between climate variables (Tmax, Tmin, Tavg, Ptotal) and geographic factors (Latitude, Longitude, Elevation, Distance from the coast) at the studied 26 wild blueberry fields of Downeast, Maine over 40 years from 1980 to 2019.
| Fixed Factors | Tmax | Tmin | Tavg | Ptotal | ||||
|---|---|---|---|---|---|---|---|---|
| F 1 | P 2 | F | P | F | P | F | P | |
| Latitude | 33.64 | <0.001 | 44.82 | <0.001 | 0.025 | 0.87 | 0.04 | 0.84 |
| Longitude | 119.5 | <0.001 | 10.01 | 0.002 | 66.045 | <0.001 | 0.014 | 0.905 |
| Elevation | 43.94 | <0.001 | 17.26 | <0.001 | 3.49 | 0.062 | 0.607 | 0.436 |
| Distance from coast | 85.74 | <0.001 | 15.223 | <0.001 | 12.055 | 0.001 | 0.025 | 0.875 |
Tmax, Tmin, and Tavg represent the maximum, minimum, and average temperatures, respectively, averaged during the growing season (May–September); Ptotal represents the total precipitation of the growing season (May–September). 1 F-statistics for fixed factors, degrees of freedom are x and y for the numerator and denominator degrees of freedom, respectively. 2 Estimated p-values for generalized linear model fixed factors.
Publisher’s Note: MDPI stays neutral with regard to jurisdictional claims in published maps and institutional affiliations. |
© 2021 by the authors. Licensee MDPI, Basel, Switzerland. This article is an open access article distributed under the terms and conditions of the Creative Commons Attribution (CC BY) license (http://creativecommons.org/licenses/by/4.0/).
Share and Cite
MDPI and ACS Style
Tasnim, R.; Drummond, F.; Zhang, Y.-J. Climate Change Patterns of Wild Blueberry Fields in Downeast, Maine over the Past 40 Years. Water 2021, 13, 594. https://doi.org/10.3390/w13050594
AMA Style
Tasnim R, Drummond F, Zhang Y-J. Climate Change Patterns of Wild Blueberry Fields in Downeast, Maine over the Past 40 Years. Water. 2021; 13(5):594. https://doi.org/10.3390/w13050594
Chicago/Turabian StyleTasnim, Rafa, Francis Drummond, and Yong-Jiang Zhang. 2021. "Climate Change Patterns of Wild Blueberry Fields in Downeast, Maine over the Past 40 Years" Water 13, no. 5: 594. https://doi.org/10.3390/w13050594
Note that from the first issue of 2016, this journal uses article numbers instead of page numbers. See further details here.