Article

Flood Hazard Assessment for the Tori Levee Breach of the Indus River Basin, Pakistan

1
State Key Laboratory of Desert and Oasis Ecology, Xinjiang Institute of Ecology and Geography, Chinese Academy of Sciences, Urumqi 830011, China
2
School of Civil and Environmental Engineering (SCEE), National University of Sciences and Technology, Islamabad 44000, Pakistan
3
Department of Civil and Environmental Engineering and Construction, University of Nevada Las Vegas, 4505 S Maryland Parkway, Las Vegas, NV 89154, USA
4
Irrigation Department, Government of Sindh, Pakistan
5
Kleinschmidt Associates, 1500 NE Irving St., Suite 550, Portland, OR 97232, USA
*
Authors to whom correspondence should be addressed.
Authors with equal contribution in this work.
Water 2021, 13(5), 604; https://doi.org/10.3390/w13050604
Submission received: 23 December 2020 / Revised: 7 February 2021 / Accepted: 15 February 2021 / Published: 25 February 2021
(This article belongs to the Special Issue Sensing Technology for Flood Monitoring and Forecasting)

Abstract

:
Levee breaches are some of the most common hazards in the world and cause the loss of lives, livelihoods, and property destruction. During the 2010 flood in Pakistan, the most devastating breach occurred at Tori Levee on the right bank of the Indus River, downstream of the Guddu Barrage, which caused residual floods in northern Sindh and the adjoining regions of the Balochistan province. In this study, 2D unsteady flow modeling performed for Tori Levee breach computed residual flood inundation by coupling a HEC-RAS (Hydrological Engineering Centre—River Analysis System) 2D hydraulic model with remote sensing and Geographic Information System techniques. The model performance was judged by comparing the observed and simulated water levels (stage) during peak flow at seven different gauging stations located within the Indus River reach and daily flood extents and multi-day composites. The quantitative values for the calibration and validation of the HEC-RAS model showed good performance with a range of difference from 0.13 to −0.54 m between the simulated and observed water levels (stage), 84% match for the maximum flood inundation area, and 73.2% for the measure of fit. The overall averages of these values for the daily flood comparison were 57.12 and 75%, respectively. Furthermore, the simulated maximum flow passed through the Tori Levee breach, which was found to be 4994.47 cumecs (about 15% of peak flow) with a head water stage of 71.56 m. By using the simulated flows through the Tori Levee breach, the flood risk maps for the 2010 flood identified hazard zones according to the flood characteristics (depth, velocity, depth times velocity, arrival time, and duration). All the flood risk maps concluded the fact that the active flood plain was uninhabitable under flood conditions.

Graphical Abstract

1. Introduction

Floods are among the most common natural disasters around the world, claiming a substantial loss of life and property in the vicinity of rivers. Extreme rainfall is a major contributor to flooding along with minor contributions from snow–glacier melt, earthquakes, landslides, glacial lake outburst flooding (GLOF), and dam and levee failure/overtopping [1,2]. Pakistan is one of the most vulnerable countries in the world in terms of exposure to different natural calamities [3]. According to the Long-Term Global Climate Risk Index (CRI) 1991–2011, Pakistan ranked as the eight most disaster-prone country in the world; however, after the 2010 floods, Pakistan ranked at the top of the list of countries most affected by weather-related disasters [4]. In Pakistan, the Flood Forecasting Commission [5] classifies floods as low (river flowing within deep channel), medium (partly inundating river), high (river almost fully submerging and flowing up to high banks/levees), very high (river flowing between high banks/bunds with encroachment on the freeboard) and exceptionally very high flood (imminent danger of overtopping/breaching). For the Indus River, low flood discharge ranges from 7000 to 8500 cumecs, medium flood ranges from 8500 to 12,700 cumecs, high flood ranges from 12,700 to 18,400 cumecs, high flood ranges from 18,400 to 22,700 cumecs and exceptionally very high flood have discharge exceeding 22,700 cumecs [6]. Historically, overall Pakistan has faced about 38 floods (1947–2011) of various types and magnitudes causing severe damage to life and property [7,8]. This count has increased to 42 floods (1947–2015) with six years of consecutive flooding due to over topping of river discharge in most of cases, since 2010.
In Pakistan, the extreme monsoon precipitation augmented by snow–glacier-melt are the contributing factors for floods [9]. Climate change, deforestation, urbanization, flood plain encroachment for human settlement and other economic activities, siltation, increase in impervious surface with consequent reduction in infiltration and increase in runoff, and reduced conveyance of water due to poorly maintained flood channels have not only amplified the risk of flooding in general, but have also specifically expanded the risk of residual flooding (flooding in areas behind levee) [10,11].
Although floods are inevitable, some structural and nonstructural measures can be adopted to mitigate floods. Among structural measures, levees provide some relief for certain magnitudes of the flood but when floods exceed designed protection, levee failure or overtopping may occur. The flood risk behind the protected levees is known as “Residual Risk” and flooding is known as “Residual Flooding” in the case of a levee failure. The “Residual Risk” increases with the height of levees [12,13]. The rise of the riverbed due to sedimentation, ever-changing river morphology, flood plain occupancy, and reduced conveyance have augmented the residual flood risk and levees vulnerability. Thus, it is vital to study the residual flood risk associated with levees and to devise a flood mitigation plan in the case of levee overtopping and/or failure.
Multiple structural and nonstructural measures have been adopted to mitigate floods in Pakistan. The structural measures are time- and resource-dependent and provide localized flood mitigation, while non-structural measures are more productive, resource-efficient, and do not have localized effects. Numerical flood modeling and flood hazard mapping are examples of non-structural measures and can be used for effective flood simulation and management [14,15,16]. Due to the extremity and recurrence of floods worldwide, interest in flood modeling is gaining importance.
However, in Pakistan, most of the flood hazard mapping and modeling is carried out for the active flood plain, while the “Residual Flood Risk” behind the levees (inactive flood plain) is often challenging and ignored. Flood inundation modeling can be used for effective flood risk mapping and the prediction of inundation in active and inactive floodplains. Specifically, two-dimensional (2D) hydrodynamic models integrated with GIS and remote sensing are capable of developing residual flood risk maps for inactive floodplains. Flood modeling is a complex task and can be affected by many factors like geography, land use land cover pattern, hydro-meteorological conditions, and other anthropogenic activities [17,18]. Numerous studies have been carried out previously on levee breach flood inundation modeling, using 1D, 1D–2D coupled, and full 2D models. Several researchers [19,20,21,22,23] have used one-dimensional (1D) models for dyke breach flood inundation and for flood modeling in rivers and floodplains. The 1D models can simulate flows within the rivers, where the primary flood path predictably follows the axis of the river, however, they are limited in their ability to simulate flows in floodplains where the flow direction is much more unpredictable.
Several researchers [12,24,25,26,27] have used a 1D–2D coupled approach for modeling levee breach flood inundation. However, this approach is not suitable for large rivers and vast floodplains [28]. The exchange of flow between 1D and 2D elements is also complex and may introduce substantial uncertainties. Hence, the use of 2D models for modeling rivers and floodplains becomes the right choice. 2D models based on the Saint Venant Equations calculate flows in x and y spatial dimensions [29]. Although, the computational burden for 2D models is larger than 1D and 1D–2D models, more accuracy can be achieved. Unlike using cross-section interpolation to represent river topography as in the case of 1D, 2D models provide flexibility to incorporate a physical and topographic representation of terrain to improve accuracy for complex terrains. 2D models with the integration of remote sensing data are frequently used by several researchers [1,30,31,32] for levee breach and urban flood inundation modeling.
In Pakistan, flood hazard mapping and modeling are mostly performed using 1D models for active flood plain, while the risk of flooding behind levees (inactive flood plain) is often underestimated or ignored. Therefore, for this study, we chose a region which is highly vulnerable to devastating floods and the failure of levees, particularly Tori Levee, historically breached more than 19 times [33]. To the best of our knowledge, not a single published study has been carried out on levee breaching, dam breaching, nor residual flood mapping using 2D unsteady flow modeling in Pakistan. Therefore, this study is an attempt to provide a comprehensive methodology for the research community in Pakistan and globally to analysis flood risk behind levees through the modeling of a devastating flood event which occurred in Pakistan during the 2010 monsoon period. The Tori Levee breach event was modeled using HEC-RAS 2D Model, by comparing observed verses simulated water levels at several gauging stations (within the active floodplain) and daily flood extent of MODIS (MODerate Resolution Imaging Spectroradiometer) with the simulated flood extent for that day (in avulsion area that is inactive floodplain). The discharge passed through the Tori Levee breach was unknown and predicted by using the HEC-RAS model. Subsequently, several flood components including water depth, velocity, product of depth and velocity, flood arrival time and flood duration maps were determined by using a calibrated and validated HEC-RAS 2D model of a Tori Levee breach.

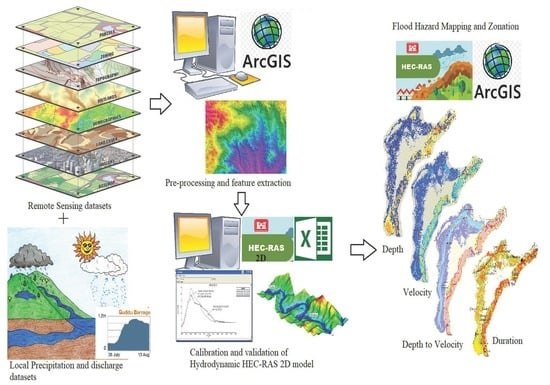
2. Materials and Methods

2.1. Study Area

The Indus River is the largest river system and a major source of water resources in Pakistan. The study region is mainly influenced by the summer monsoon precipitation pattern with approximately 130 mm mean annual areal precipitation. However, the river reach selected in the current study mostly receives major flows from high-altitude regions of Pakistan due to western distribution precipitation and snow- and glacier-melt. In this study, the Indus River reach, affected by a devastating flood in 2010, was selected with a length of 120 km between two barrages (i.e., the Guddu and Sukkur Barrages). The study area (reach and flood plain area) lies between 28° 32′ 30.4116″ bottom 25°59′5.6724″ right 69°54′42.6384″ left 67°18′20.6964″ and covers an area of 42,376.68 km2. The study area starts from upstream of Guddu Barrage near Kashmore and ends downstream of Sukkur Barrage near Sehwan, from where the avulsion rejoined the main Indus River (see Figure 1). The Guddu and Sukkur Barrages are located at 28°25′07.2″ N, 69°42′47.46″ E and, 27°40′44.82″ N, 68°50′44.82″ E, respectively. The Tori Levee is located on the right bank of Indus River 30 km downstream of the Guddu Barrage at the geographical coordinates 28° 80′49.26″ N and 69°09′31.32″ E. The floodplain including channel width varies from 0.59 km (at upstream of Sukkur Gorge) to 23.08 km (downstream). The channel slope or river gradient (vertical to horizontal ratio) of the selected reach between the Guddu–Sukkur is 1:7000 (V:H) (as per data provided by Sindh Irrigation and Drainage Authority (SIDA)). The study area lies in the flat topography of the lower Indus Basin in the northern part of the Sindh.
Historically, the 2010 flood is considered the most devastating disaster with a return period of 20 years as estimated using generalized Pareto (GPA) distribution at site flood frequency analysis performed by [34], resulting in 2000 fatalities and the displacement of more than 20,000,000 people for weeks to several months [9,35]. Sindh and Khyber Pakhtunkhwa (KP) were the most impacted provinces in Pakistan. KP was affected due to flash floods, while embankment breaches were the major cause of flooding in Sindh and Punjab. The most devastating breach of the 2010 flood occurred at Tori Levee, the main embankment on the right bank of Indus downstream of Guddu with the top, bottom elevation and length equal to 72, 69.13 and 2879 m, respectively. The riverbed and flood plain elevation in the vicinity of Tori Levee was approximately was 65 and 68 m, respectively. The Tori Levee on the night of 7th and 8th of August, collapsed when Guddu reached a flood peak of 31,714.8 cumecs [36,37,38]. The Tori Levee breached at three different locations and depths equal to 272, 103 and 629 m with a cumulative bottom width of the breach sections equal to 1004 m, estimated using the method proposed by [14] (Figures S1 and S2).
This breach on the right bank of Indus caused the avulsion of the Indus River and overwhelmed the irrigation and flood protection infrastructure in northern Sindh and adjoining Baluchistan and caused widespread devastation in areas well outside the Kacha area active flood plain [2]. The Tori Levee breach immediately transformed the scale of the disaster. The flow from the breach traveled over 300 km and rejoined the mainstream of the Indus River via Manchar Lake near Shewan (Figure 1). This residual flood lasted for a long time as the Indus River remained above flood stage at Guddu until 2nd September 2010.

2.2. Datasets

The daily discharge, stage data, and the architectural design specification of Guddu and Sukkur Barrages were obtained from the Guddu and Sukkur Barrage authorities, for the flood events of 2010 and 2015. High flood level (HFL) data for the 2010 flood along the right levees were acquired from Sind Irrigation and Drainage Authority (SIDA). The longitudinal geometrical and 3D profiles of all levees were generated using data obtained from Sindh Irrigation and Drainage Authority (SIDA). The Digital Surface Model (ALOS (Advanced Land Observing Satellite Digital Elevation Model) World 3D) of 30 m spatial resolution was downloaded from http://www.eorc.jaxa.jp/ALOS/en/aw3d30/registration.htm (accessed on 19 October 2020). The Japan Aerospace Exploration Agency (JAXA) released the global Digital Surface Model (DSM) of 30 m (1-arcsec) spatial resolution with a vertical accuracy of 5 m as standard deviation (1 sigma).
ALOS 30 m digital elevation model (DEM) performed better then Advanced Spaceborne Thermal Emission and Reflection Radiometer (ASTER) 30 m and SRTM (Shuttle Radar Topography Mission) 30 m hence can be used for flood modeling [14]. In this study, channel bathymetry was also incorporated using cross-section (extracted from ALOS DEM) interpolation and combining the interpolated channel and floodplain DEM [14,16]. The daily flood extent was extracted for the flood period using daily MODIS Terra images at 250 m spatial resolution for the study area. The land use land cover (LULC) classification of Landsat 5 was acquired from the Ministry of Environment (MoE), produced under the National Land Use Plan Project (2004–2009). The composites of 2010 and 2015 flood extents provided by the United Nations Operational Satellite Applications Programme (UNOSAT) were used for the comparison of HEC-RAS simulations (calibration and validation) in this study.

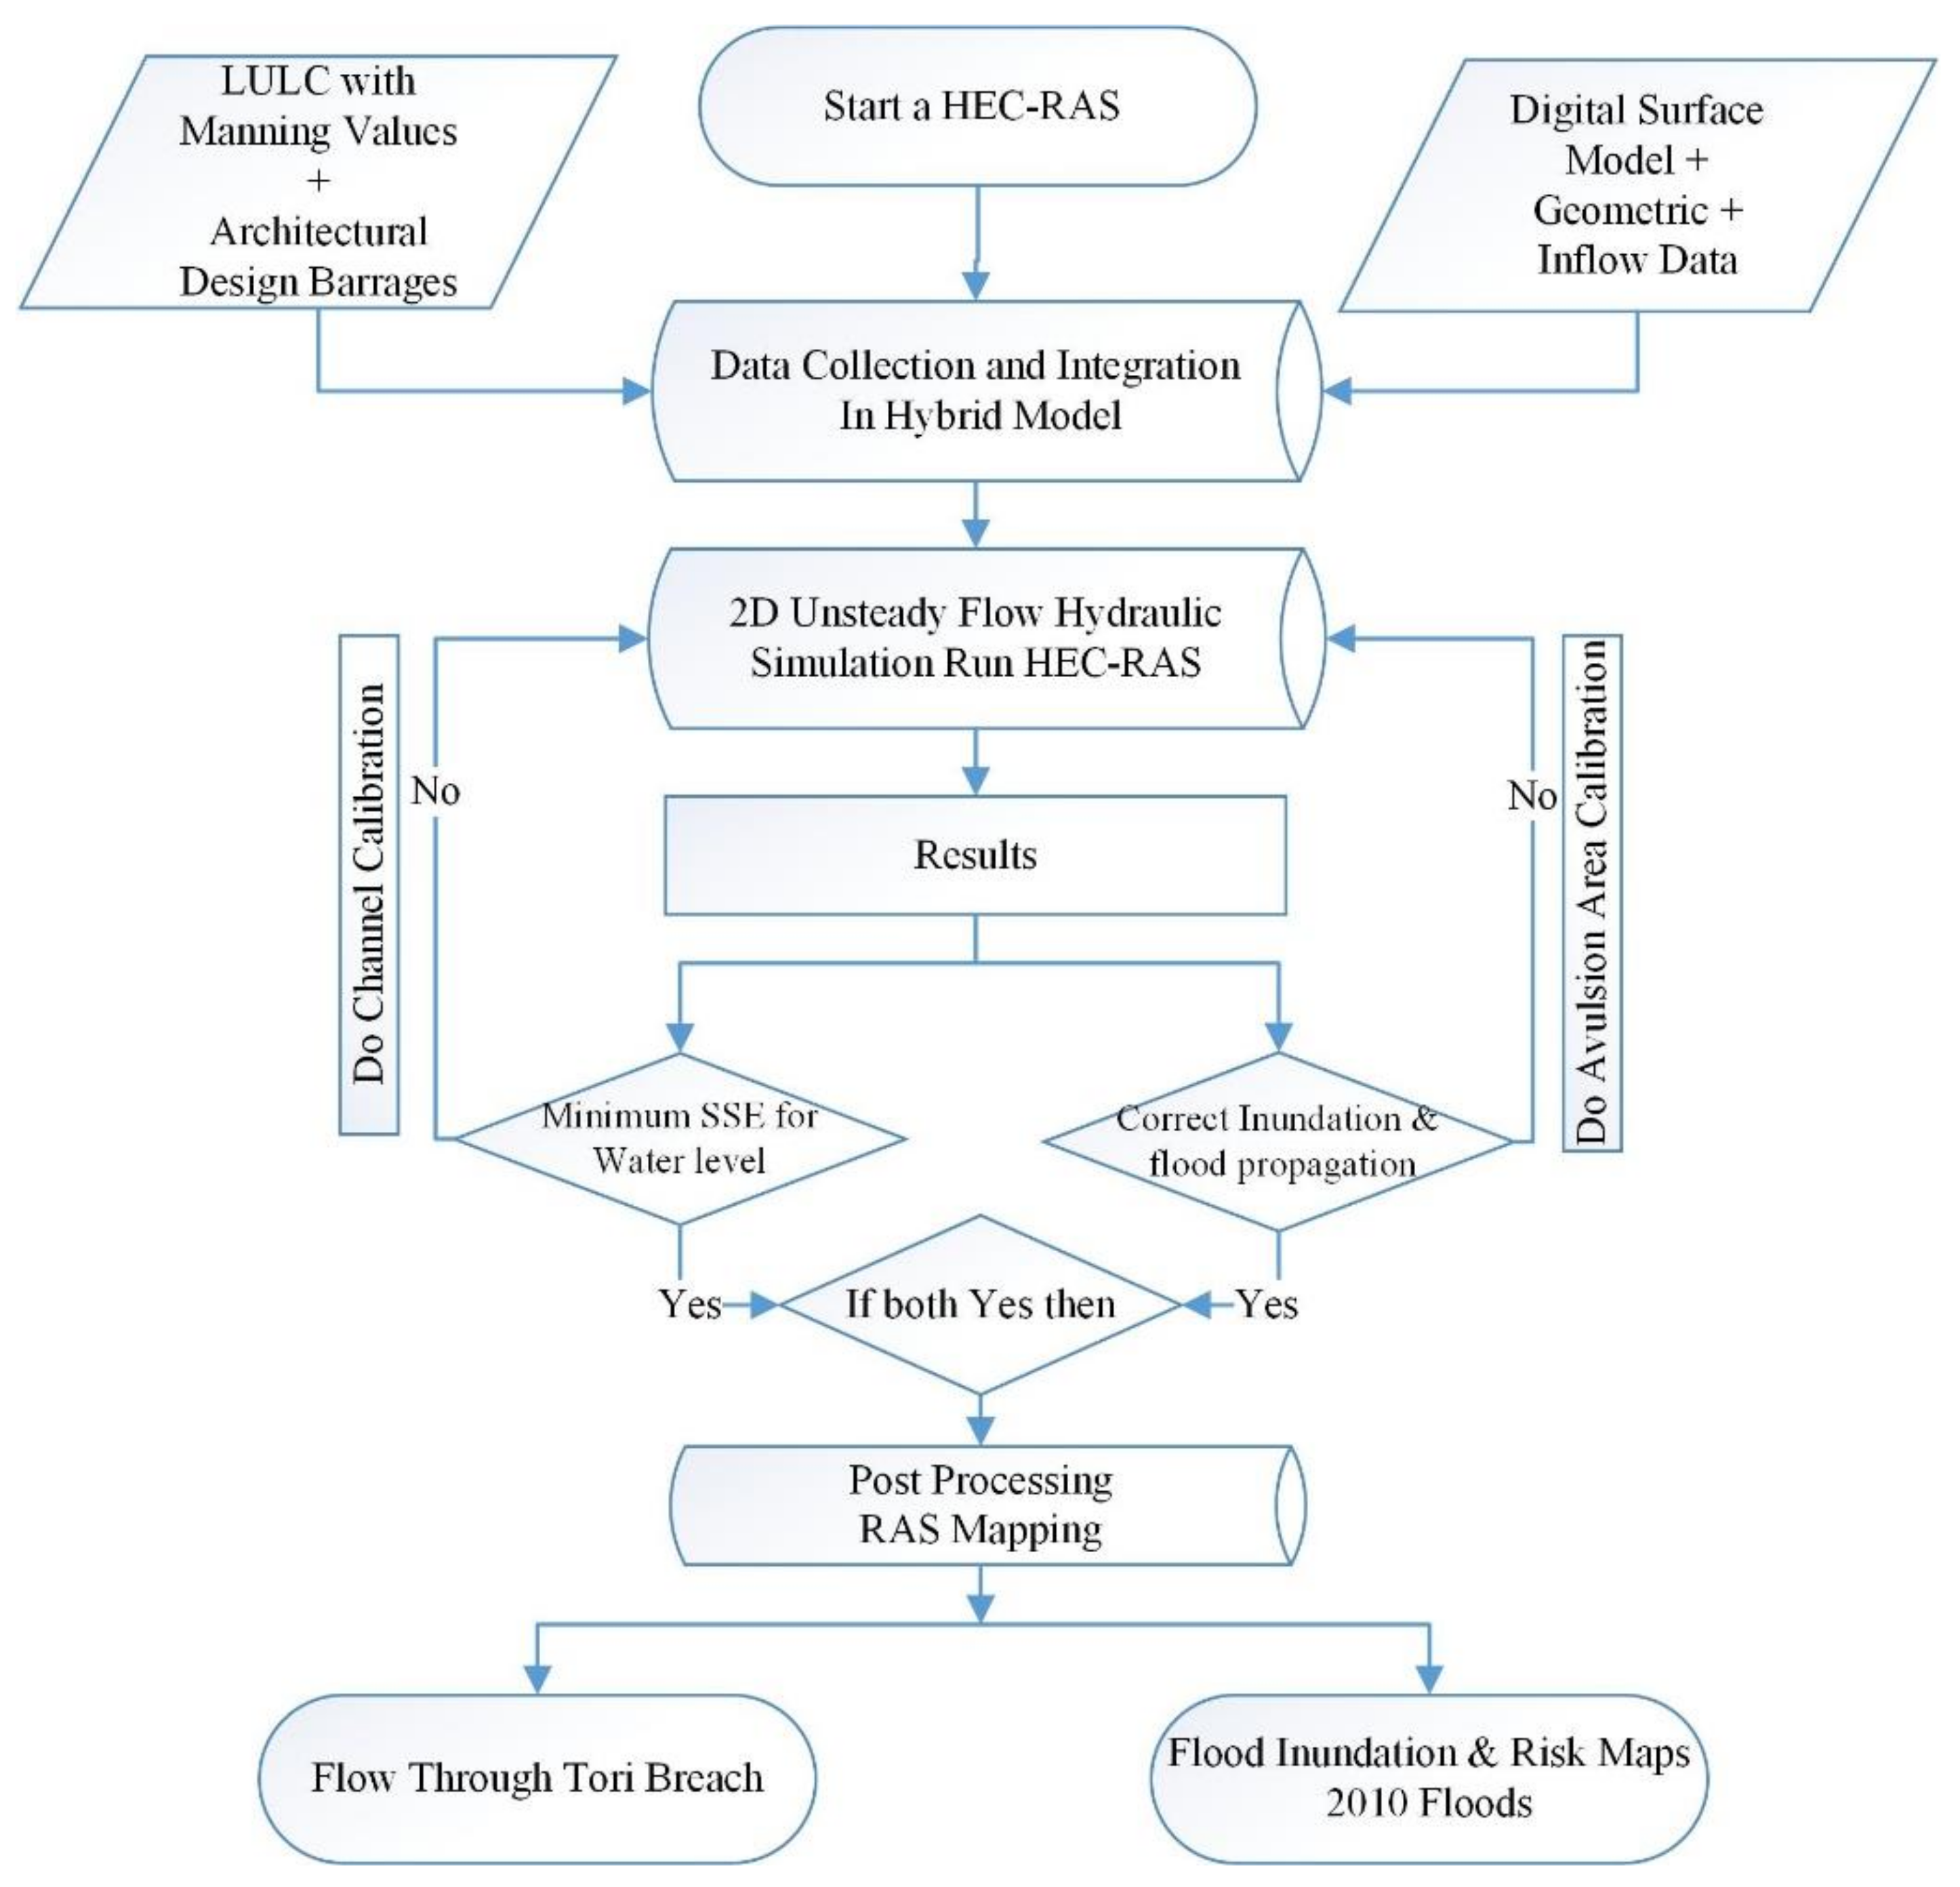
2.3. HEC-RAS Model Application

The HEC-RAS 5.0 two-dimensional (2D), a widely used hydrodynamic model developed by the U.S. Army Corps of Engineers, was employed in this study for the hazard mapping of the 2010 flood in Pakistan. The HEC-RAS model simulated the flood using the combination of 2D Saint-Venant and diffusive wave equations [39]. The model can use the 2D Saint-Venant equations for multiple situations such as dynamic flood wave, mixed flow regime, abrupt contraction, wave propagation modeling and super elevation around bends. However, the diffusive wave equation is applicable for floodplain flows with minimal acceleration and turbulence. The HEC-RAS 2D model provides flexibility to calibrate using a manning (n) roughness coefficient based on LULC, the contraction and coefficient of expansion using boundary conditions of hydrographs (stage and flow), normal depth and rating curve [40]. Additionally, in HEC-RAS, the RAS mapper facilitates the creation, and improvement of terrain data (channel bathymetry), creation and definition of user-defined land cover data or importing from web services [41]. Additionally, the RAS mapper can visualize the outputs of HEC-RAS such as the static and dynamic flood hazard maps in form of water depth, velocity, product of depth and velocity, water surface elevation, shear stress, inundation boundary, flood arrival time, duration time and recession time at specific depth levels [40]. The detailed description of HEC-RAS is provided by [40,41]. The detail of the methodology adopted in this study is shown in Figure 2.
A two-dimensional 2D unsteady flow simulation of HEC-RAS based on 2D diffusive wave equations were calibrated and validated for the 2010 flood (15 June–15 October) and 2015 (01 July–20 August), respectively. The hydraulic structures such as the Guddu (65 gates) and Sukkur (56 gates) Barrages were modeled in HEC-RAS using the architectural and functional specification data provided by the barrage authorities, to control flows as per actual operation during flood condition, as shown in Figure S3. Furthermore, the Tori Levee breach was modeled using breach specifications extracted from the previous study [36] (see Figure S2), carried out for the 2010 flood. Overall, the Tori Levee was breached into three sections with different bottom widths (272, 103 and 629 m) with sum of 1004 m (see Figures S2 and S3), also confirmed by [36]. However, the top and final bottom elevation of the Tori Levee was incorporated as equal to 72 and 69.13 m obtained from SIDA, respectively. The breach section was considered as trapezoidal, and the final specifications/dynamics of the bottom width (b), side slope (S), cross-sectional length (top width of Tori Breach) and height (h) of the breach section were determined to be 1004 m, 80 degrees, 1459 and 2.87 m, respectively. The top width of the Tori Levee breach was measured with the help of the bottom width (i.e., 1004 m) by using the trapezoidal channel design equation, as suggested by [14]. However, the other breach parameters like breach formation time and water elevation triggering the breach (water surface elevation) was set at 168 h (with a one-minute interval) and 71.34 m, respectively, estimated using methodology adopted by [14]. The aforementioned factors and parameters were used for the 2010 flood (calibration flood event). The 2015 flood (validation event) occurred within the river reach without any levee breach, therefore, the validation was carried out by keeping the river reach and structural design factors of the barrages and parameters constant, except Tori Levee breach parameters.
Furthermore, the LULC data were adopted to define Manning’s roughness (n) values for the model domain. The built-up clusters from open street map (OSM) and Wikimapia were extracted and used to improve the original LULC, as used by several researchers [42,43]. Furthermore, the calibration of HEC-RAS for the 2010 flood was carried out by the optimization of Manning’s roughness (n) values for different LULC classes as per the guidelines provided by the United States Geological Survey (USGS) [44] and some other available sources in the literature [45,46], altering breach dimensions and breach parameters and integrating other flood control structures. The LULC data were spatially bifurcated for the optimization of Manning (n) roughness coefficients in the active flood plain (river channel and floodplain within the levees) and inactive floodplain (avulsion area). The final optimized Manning’s (n) roughness values for different classes are shown in Table 1. Finally, after providing complete data inputs, the model was run with computation at one (1) minute interval and 168 h as a breach develop time in levee calculated using a method proposed by [14] as shown in Figure S2, on a core i5 machine with 4 Gb RAM, that successfully computed the simulation in 18 h.
The statistical indices were applied for the evaluation of HEC-RAS simulations during calibration and validation in two different ways. Firstly, within levees calibration was performed using an observed high flood level at seven gauging stations and simulated water level data at peak flow. Secondly, in the case of an avulsion area, due to the non-availability of gauging data, the satellite (UNOSAT (for composite flood extant) and MODIS (daily basis flood propagation)) images were adopted for the calibration. It is important to note that the complete simulation was carried out within the levee water levels and avulsion plain extant in a single HEC-RAS model run. The HEC-RAS model automatically takes the outputs of first step daily flow (cumecs) and stage (m) time series (15 June–15 October) at the Tori Levee during the flood event as an input. The observed and simulated water levels (stage) were evaluated using difference, Nash–Sutcliffe efficiency (NSE), index of agreement (d), relative deviations of Nash–Sutcliffe efficiency (Erel) as well as relative deviations of index of agreement (drel) at seven gauging stations (i.e., Guddu, Begari, Kacha Kharif, Ghora Ghat, Tori, Sukkur Beghari and Sukkur Barrage), as the Equations (1)–(3) are given below:
The Nash–Sutcliffe Efficiency (NSE) was computed by using Equation (1), as follows:
NSE = 1 t = 1 T ( Q m t Q o t ) 2 t = 1 T ( Q o t Q o ¯ ) 2
where Q o ¯ = mean of water levels, Q m = simulated water levels Q o t = observed water levels at time t.
The difference was estimated using following established Equation: (2):
Difference = Simulated Observed
The index of agreement (d) was computed using Equation (3) given below:
d = 1 i = 1 n ( P i O i ) 2 i = 1 n ( P O ¯ + O i O ¯ ) 2
where O i = observed water levels, P i = simulated water levels, O ¯ = average observed water levels, P ¯ = average simulated water levels.
The relative deviations of Nash–Sutcliffe efficiency (Erel) and relative deviations of index of agreement (drel) are as follows:
E r e l = 1 i = 1 n O i P i O i 2 i = 1 n O i O ¯ O ¯ 2
d r e l = 1   i = 1 n O i P i O ¯ 2 i = 1 n P i O ¯ + O i O ¯ O ¯ 2
With modifications in the Nash–Sutcliffe efficiency and Index of Agreement, the differences between the observed and simulated water levels can be computed as relative deviations, which can reduce the substantial effect of the absolute differences during peak flows or water levels. Furthermore, the aforementioned efficiency indices are discussed in detail by [16].
Furthermore, the ‘percent match’ and ‘measure of fit’ statistics were used for the comparison of daily flood extents simulated by HEC-RAS and extracted from MODIS, and maximum composite flood extent provided by UNOSAT [47]. The best simulation values for the ‘percent match’ and ‘measure of fit’ were obtained by tuning the manning roughness coefficient (n) up to the benchmark of the least betterment in statistical descriptors, as final optimized ‘n’ values for each LULC class are given in Table 1. Finally, after setting breach parameters and channel calibration, the HEC-RAS integrated model was used to compute a stage-flow hydrograph at the Tori Levee during the breach event and for the modeling of flood in the avulsion plain. The modeling of the avulsion plain was comprised of flood inundation/hazard simulations (mapping of flood-depth, -velocity, -depth to velocity product-, -inundation duration for 0.5, 1.0, 1.50 and 2.0 m depth and -arrival up to 96 h or 4 day maps).

3. Results and Discussion

3.1. Calibration and Validation of HEC-RAS Model

Initially, three different DEMs (ALOS 30 m, ASTER 30 m and SRTM 30 m) were adopted for the river morphology, topography and breach formation dynamics measurements. However, during the analysis, it was observed that the ALOS 30 m DEM performed far better than ASTER and SRTM 30 m DEM. The ASTER and SRTM DEM were unable to show the proper river morphology for the selected river reach. The sensitivity of the model for ALOS, ASTER and SRTM was evaluated for maximum depth (m), velocity (m/s) and flood extent (km2). It was observed that the ALOS DEM 30 m performed fairly well for maximum depth, velocity and flood extent in comparison to ASTER and SRTM (Table 2), as confirmed by [40].
The calibration and validation process of the HEC-RAS model include the water levels (stage) at seven gauging stations within the Indus River levees and flood extent over the avulsion plain. The results for the stage within the Indus River levees at seven different gauging stations produced a difference ranging between 0.13 and −0.54 m during the peak flow discharge (Table 3). Overall, the results showed that the HEC-RAS model performed fairly well to simulate water levels during peak floods in comparison to the observed. The computed statistical descriptors show substantial efficiency for the comparison between observed and HEC-RAS simulated water levels at all gauging stations, including five along the right bank Indus River levees and two on the barrages (Table 3).
However, for the calibration of an avulsion plain, the flood extent simulated by the HEC-RAS model was compared with the maximum flood extant composite provided by UNOSAT and the daily flood extent extracted from MODIS. Overall, a mixed pattern of over- and under-estimations of flood extant was found over the avulsion plain for 2010 flood (Figure 3). The HEC-RAS model performed fairly well for the reproduction of flood extent with 84% (≈12,362 km2) overall matching, 16% (≈2290 km2) over- and under-estimations and 73% measure of fit.
Additionally, the simulated flood propagation and flood extents on a daily basis were compared with cloud free MODIS Terra images (Table S1). The factual values in Table S1 shows that the HEC-RAS model performed fairly well in reproducing daily flood propagation in comparison to the MODIS extent with average, overestimation and underestimation matching values of 75, 37 and 25%, respectively (see Figure S5). Since the model was calibrated for 2010 flood (within the river reach and avulsion plain), therefore, by keeping all modeling parameters constant, the HEC-RAS model was validated for 2015 flood inundation over the avulsion plain, which occurred in the same Indus River reach. The result for the validation with 89% match and 77.22% measure of fit shows HEC-RAS model efficient (Figure S4). The over- (15%) and under-estimations (11%) were found to be slightly less for the validation in comparison to the calibration of the HEC-RAS model. The over- and under-estimations may be associated with the use of the coarse resolution DEM (i.e., DEM at 30 m resolution), uncertainties involved in modeling and MODIS based flood extent, as confirmed by [30]. Additionally, during the 2010 flood, the local flood control and management efforts, including engineered breaches (intentionally created), can cause of different simulated flood propagation in contrast to actual. The results obtained for the calibration and validation of HEC-RAS are in line with previous studies conducted in different regions of the world [1,17,40].

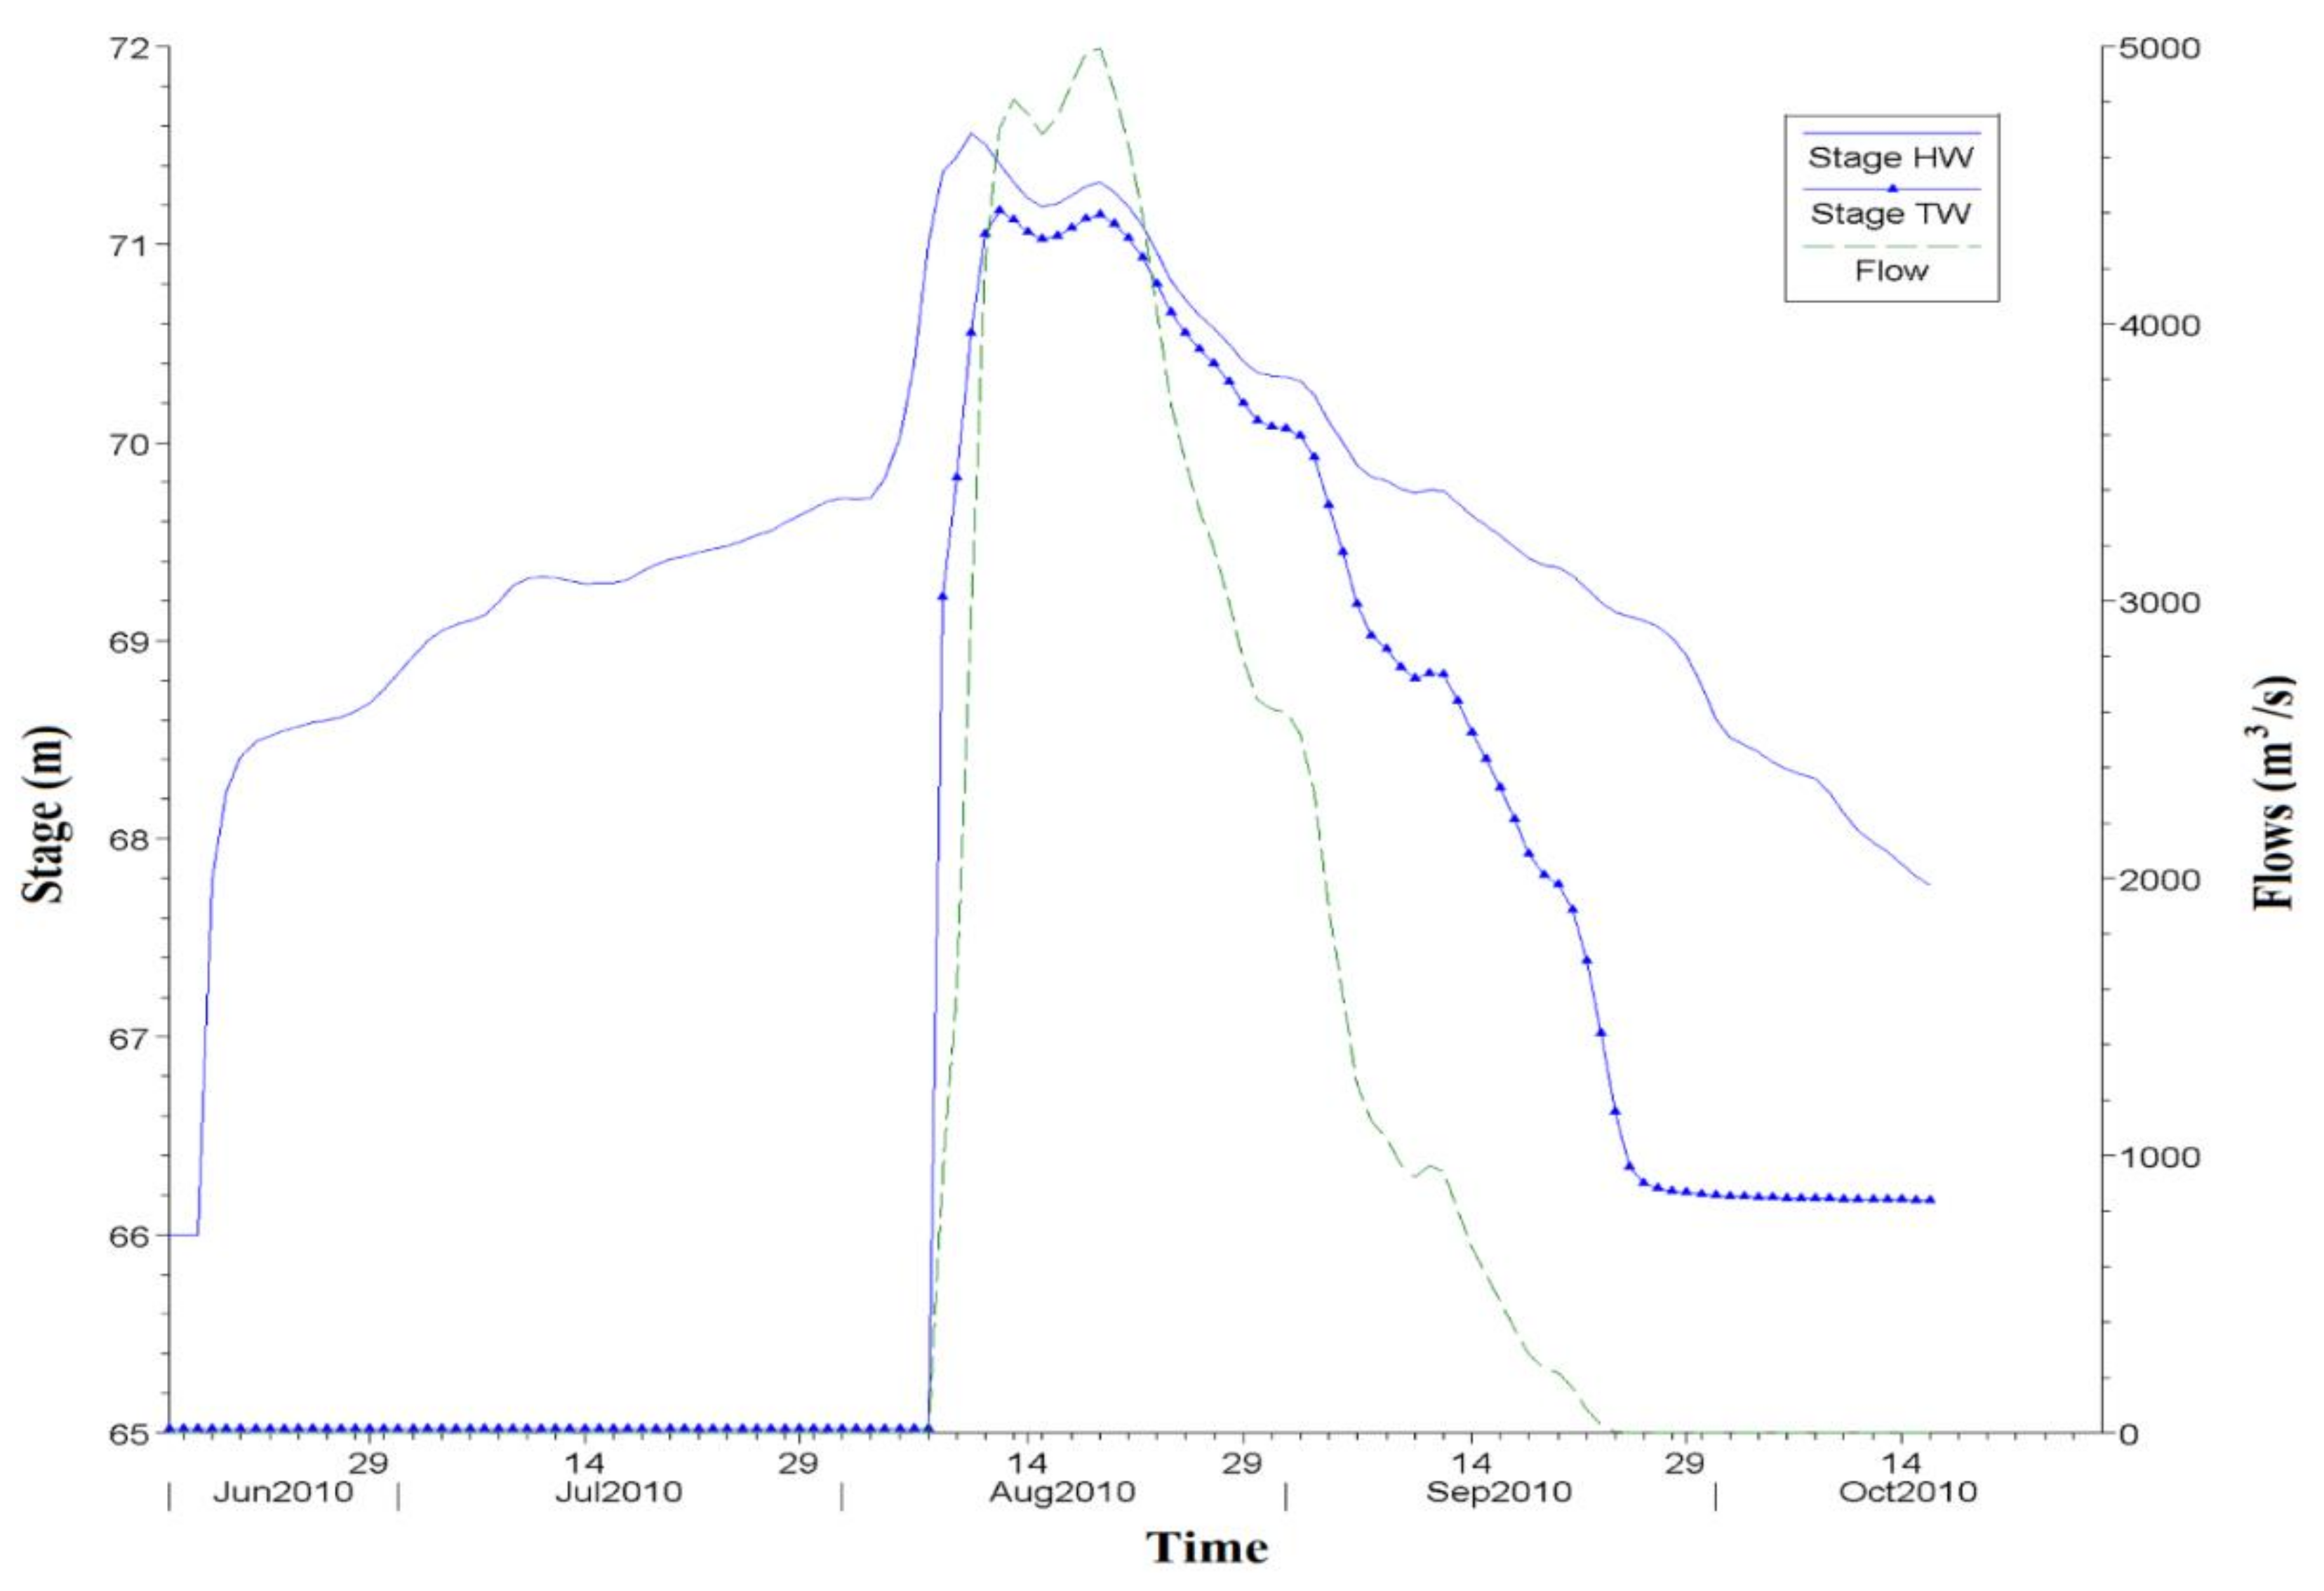
3.2. Tori Levee Breach Outflow Hydrograph

The flow passed through the Tori Levee breach during the flood event was unknown. Therefore, to investigate the flood inundation simulations over the alluvial plain, the Tori Levee breach flow (i.e., stage-flow hydrograph) was obtained from the calibrated HEC-RAS Model (Figure 4). The maximum flow passed through the Tori Levee breach simulated by HEC-RAS and was found equal to 4994.47 cumecs (about 15% of the upstream Guddu peak flow) with a head water (HW) stage of 71.56 m and occurred on 19 August and 10 August, 2010. Subsequently, the flood rejoined the Indus River on the 17 September 2010 after making its way through Manchar Lake (see Figure 1 for locations). The results obtained in this study are in line with a previous study conducted in this region with slight underestimations demonstrated in the current study [33] as reported that the 22% (≈7000 cumecs) Indus River flows which were diverted through Tori Levee at the time of breach. This may be associated with the use of a different simulation method, as [33] used multi-temporal remote sensing images for the assessment in contrast to the current study (HEC-RAS model).

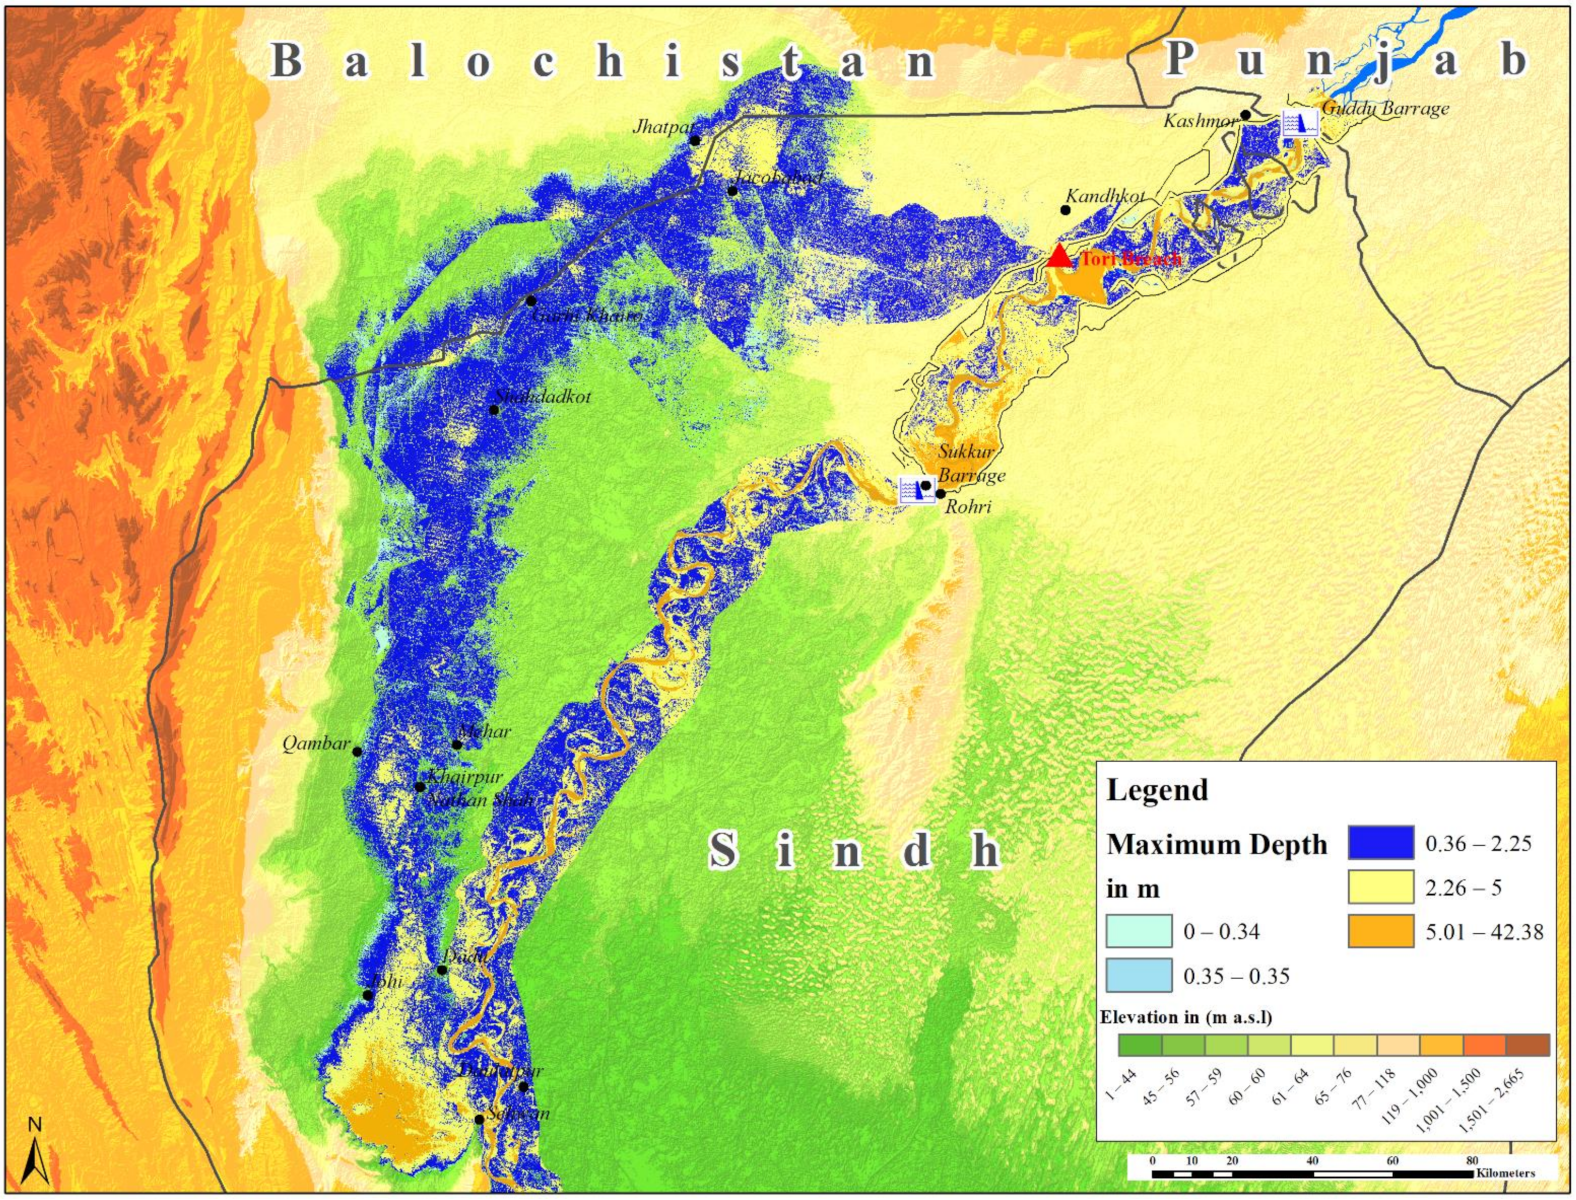
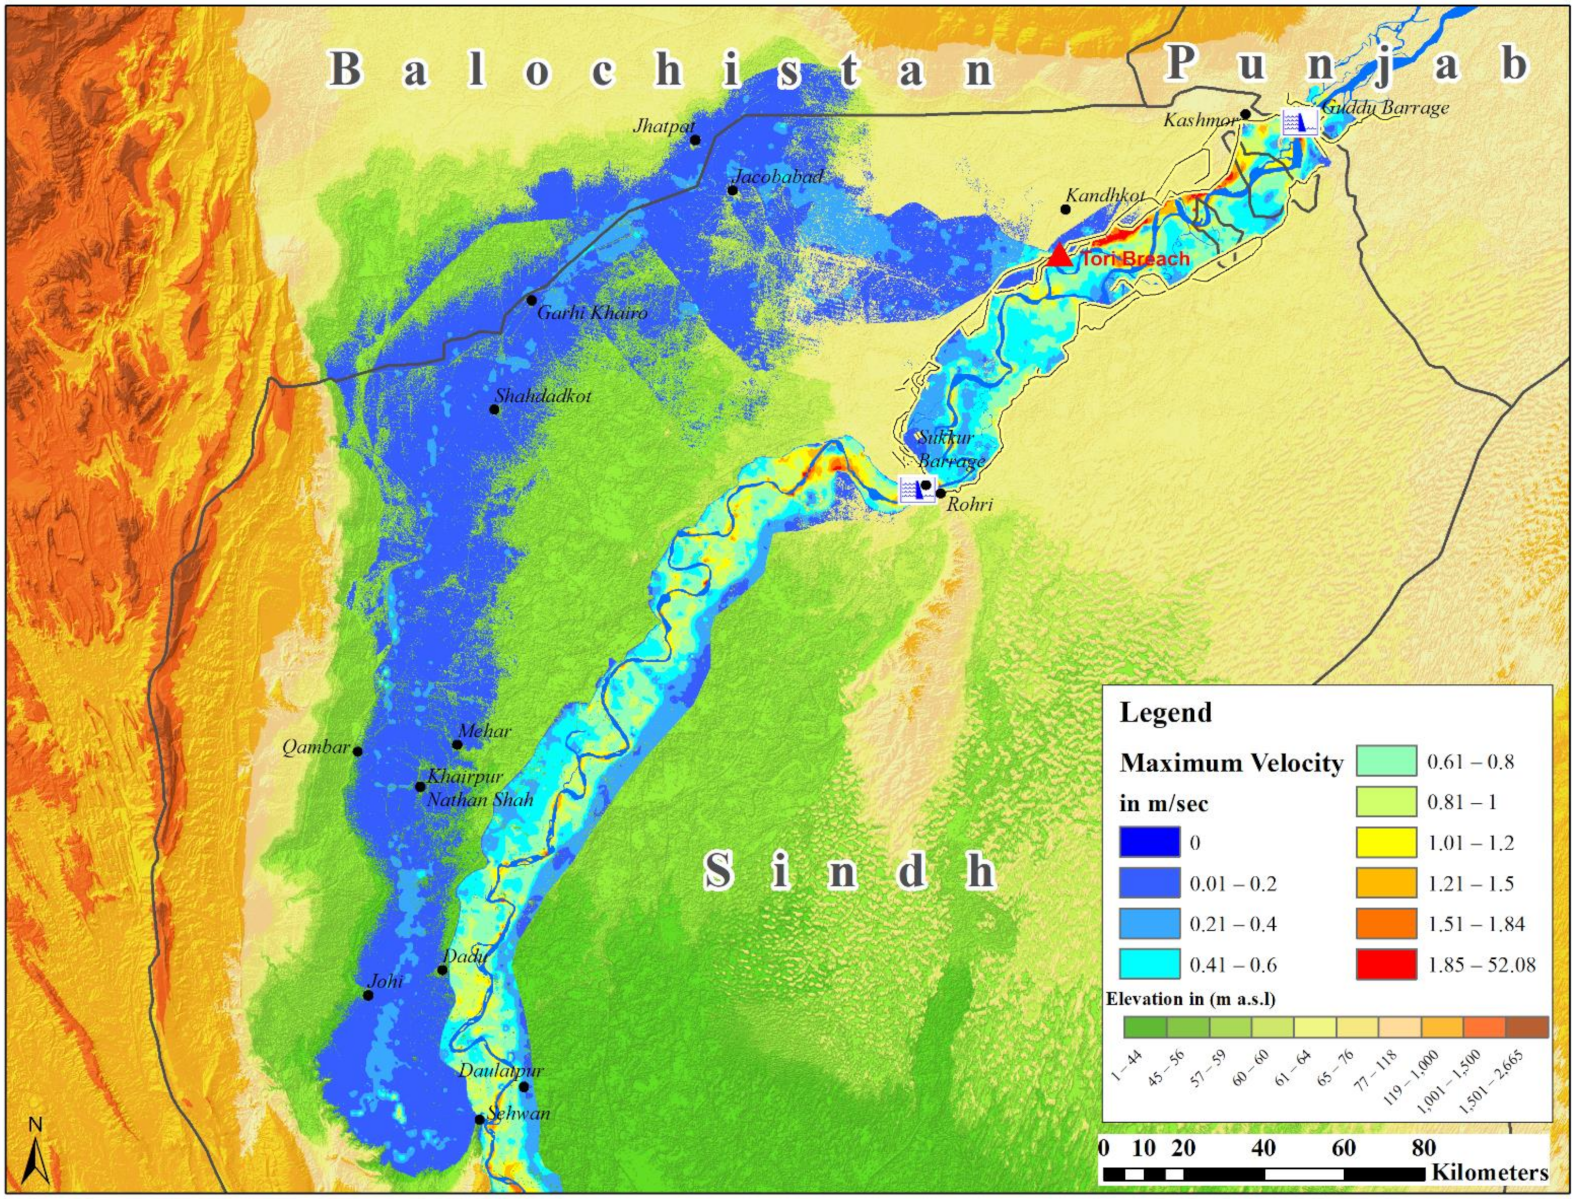
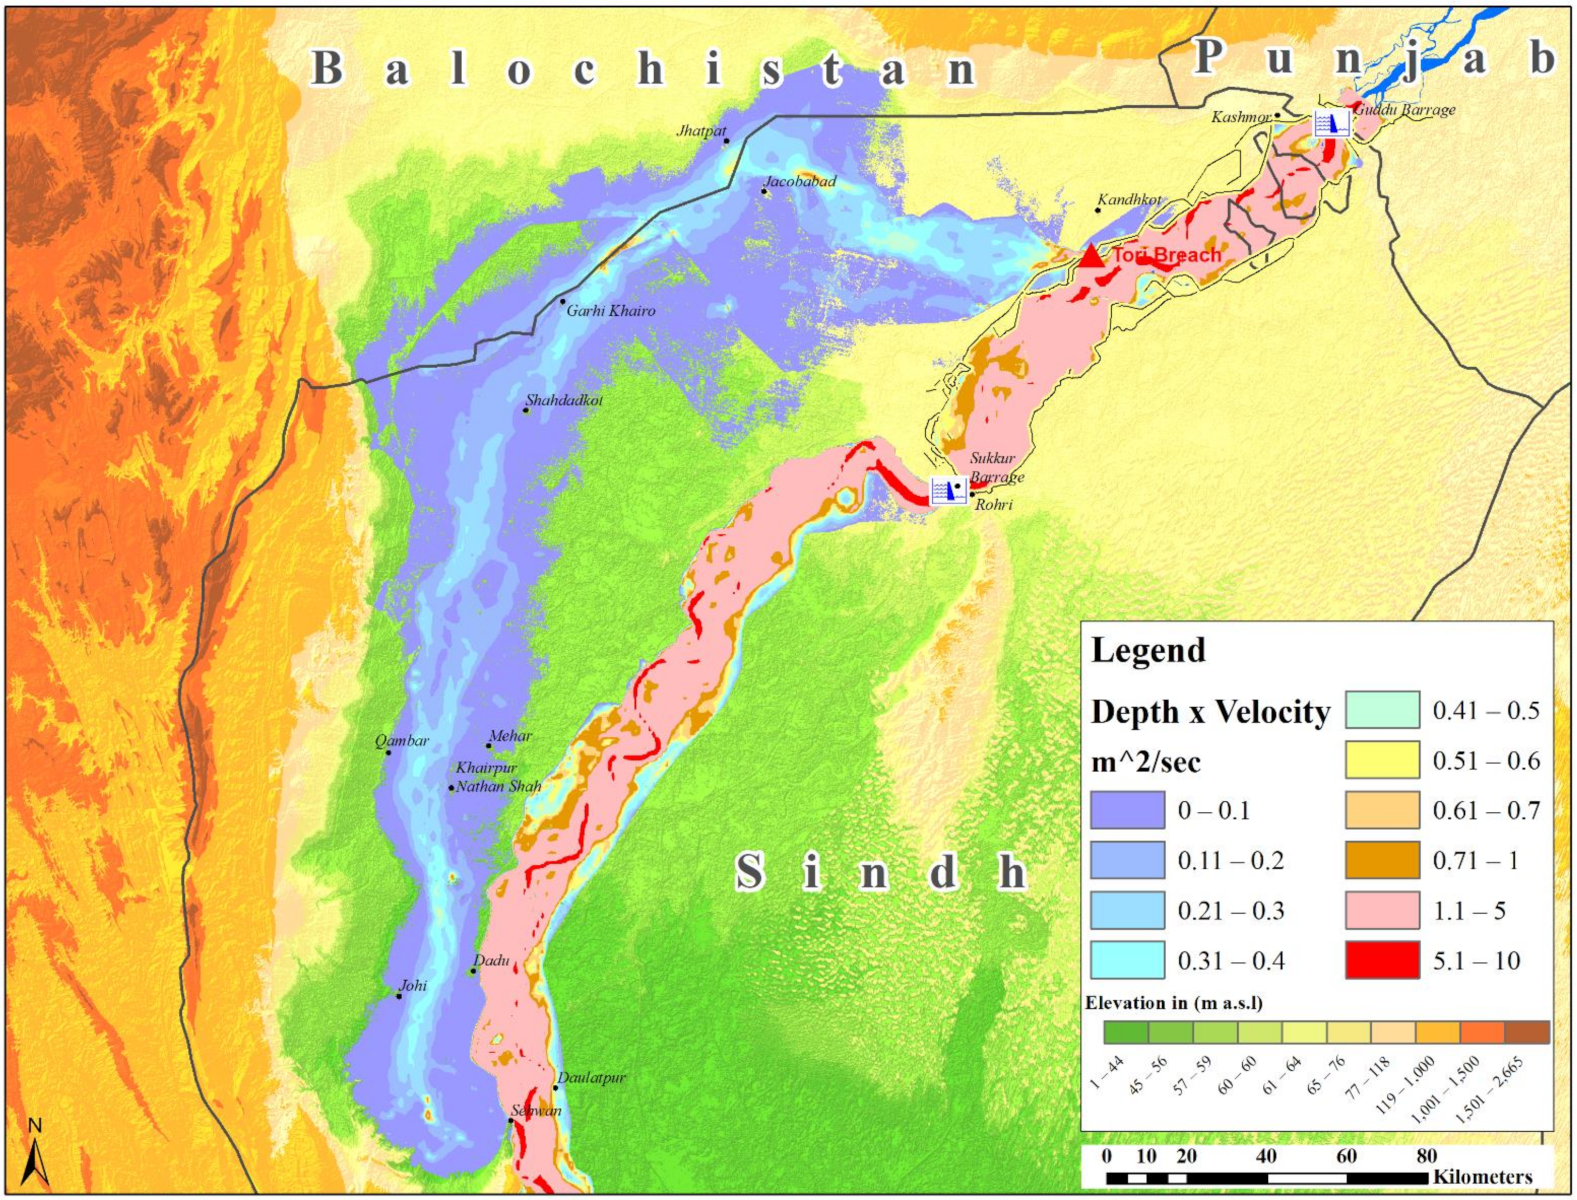
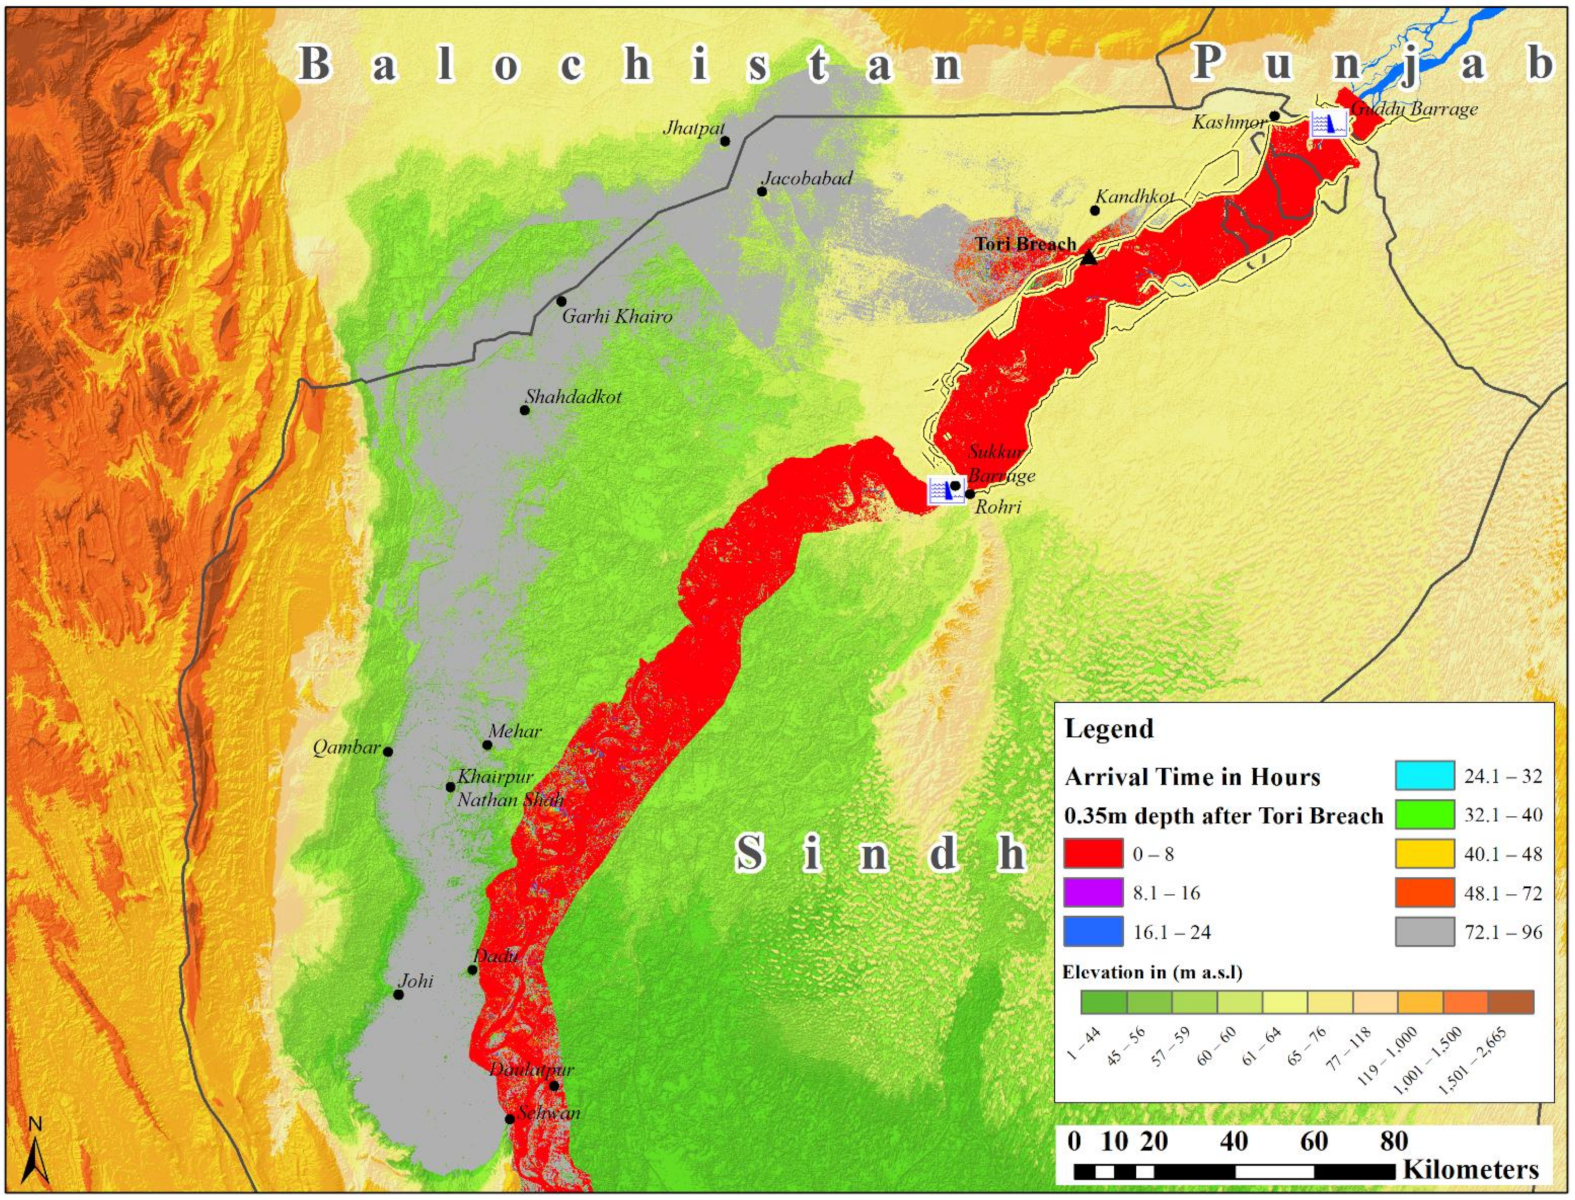
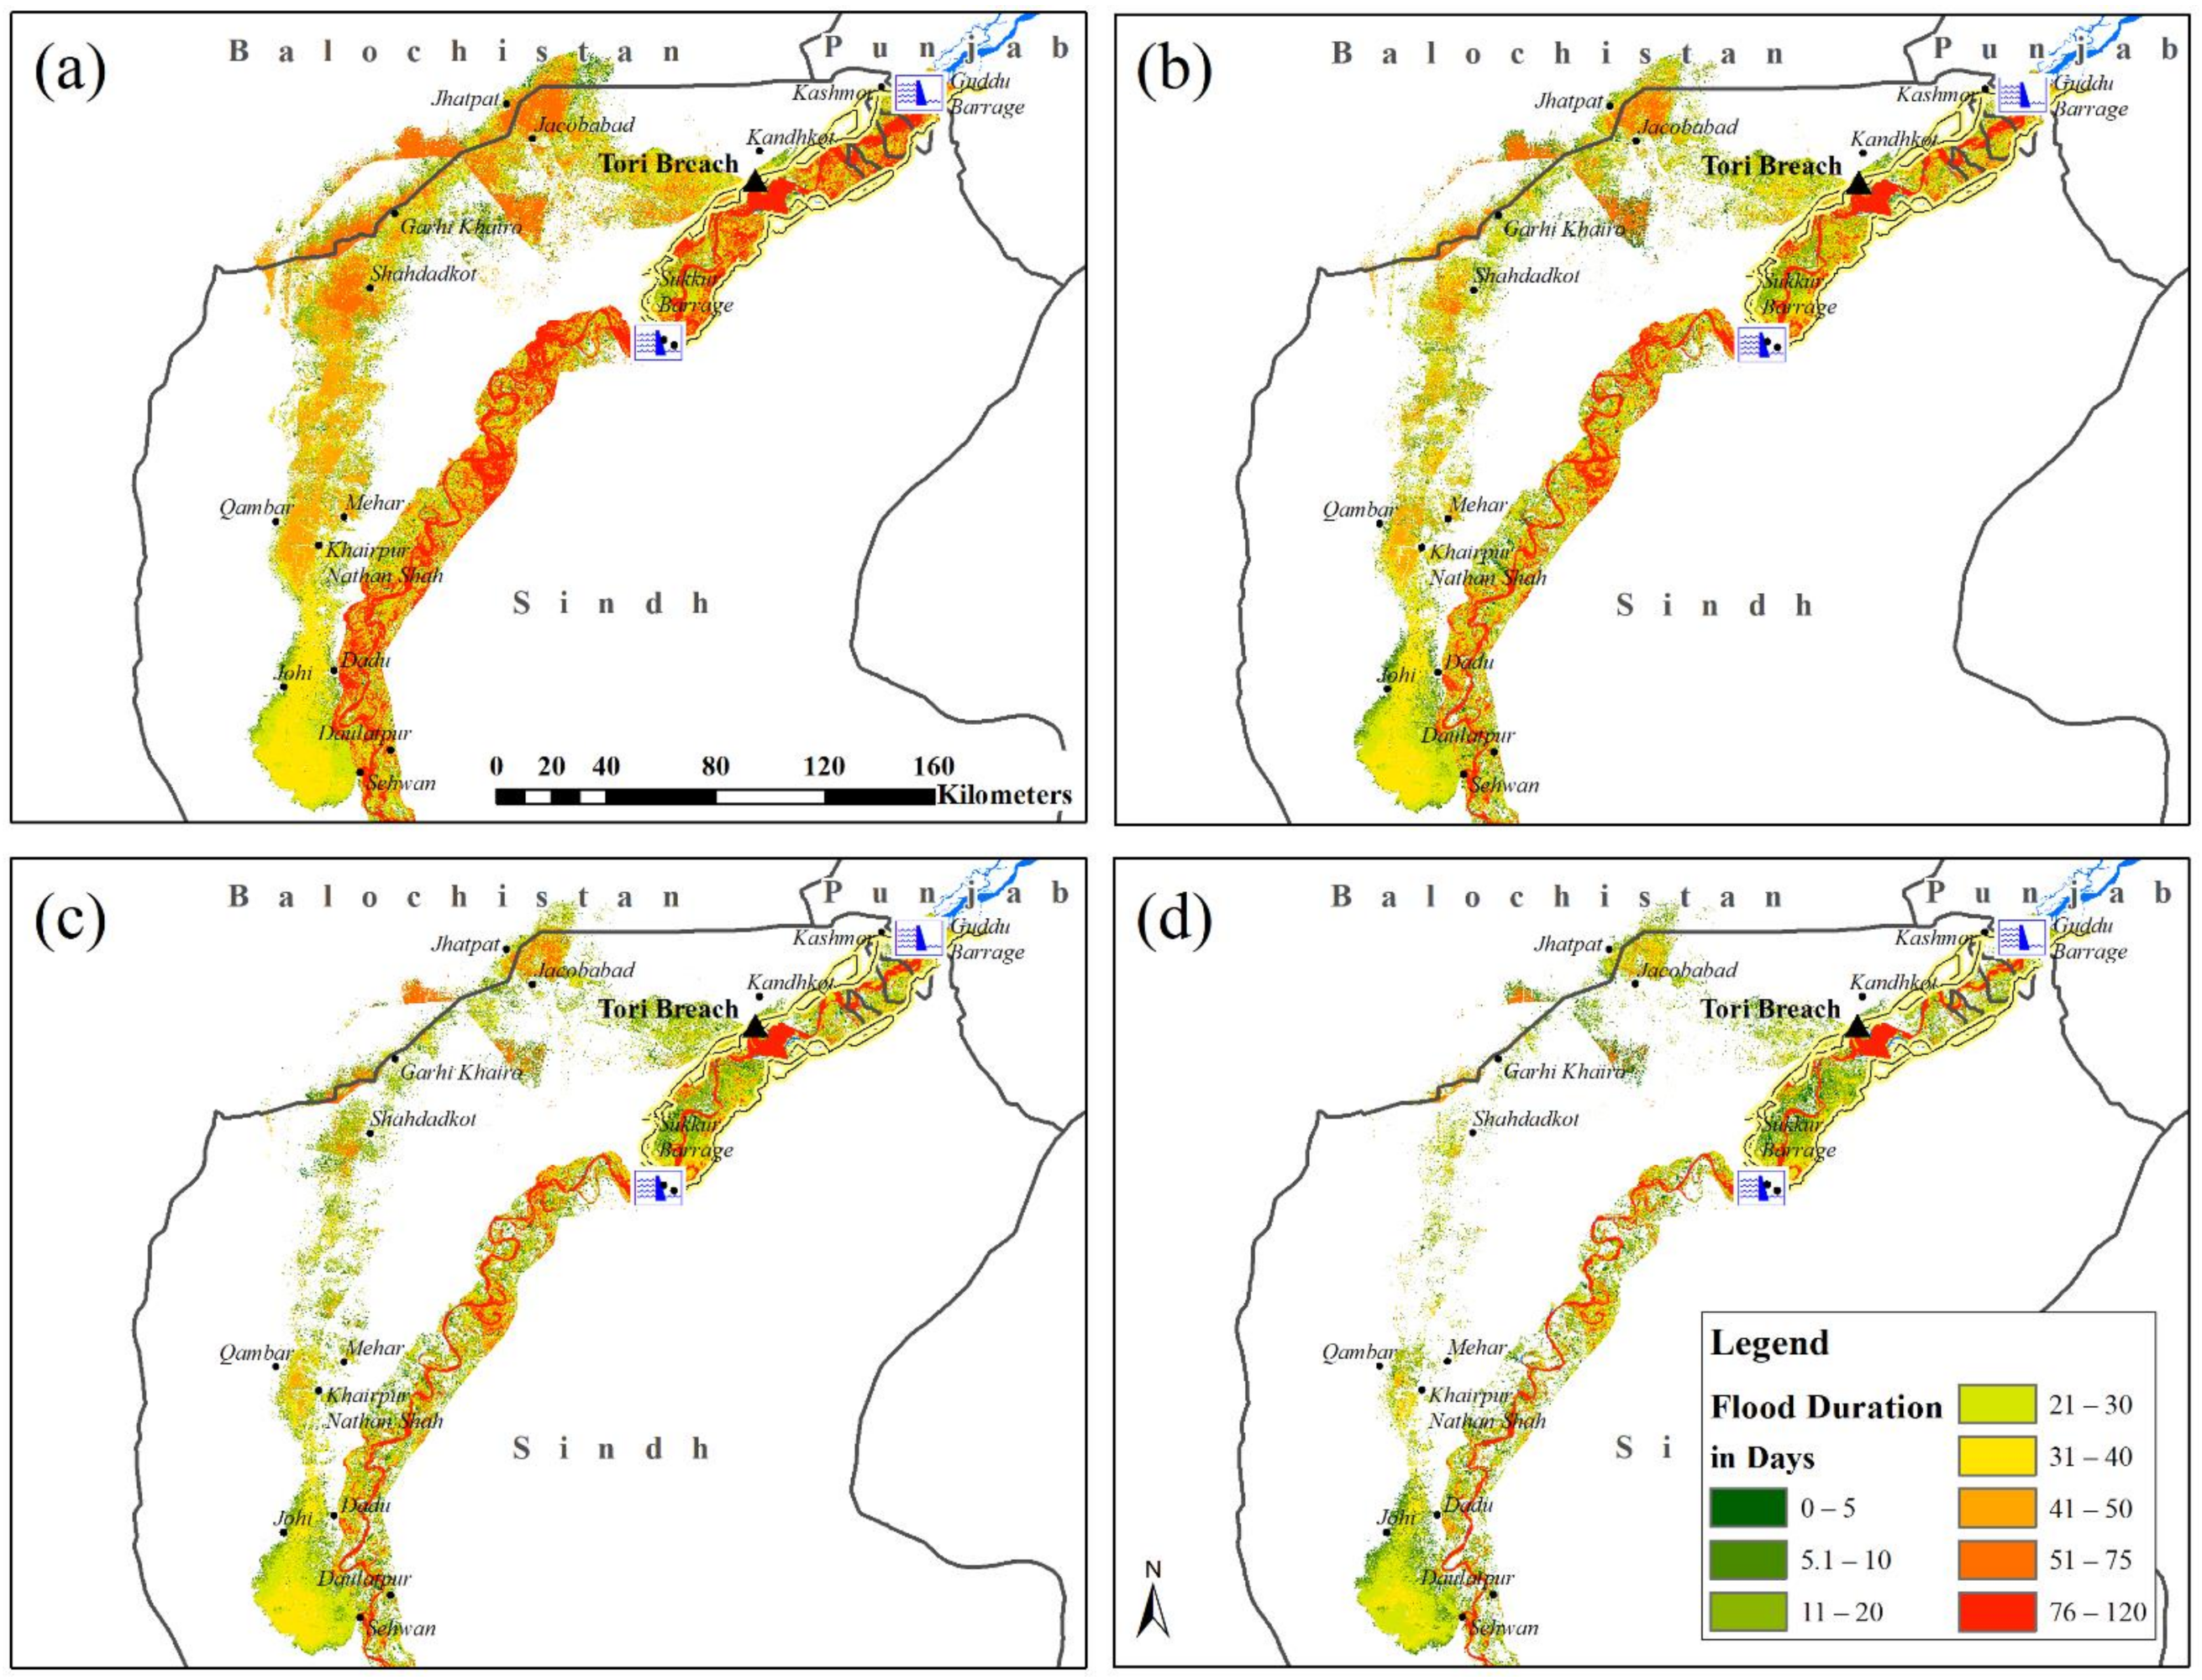
3.3. Flood Inundation and Risk Maps

The calibrated HEC-RAS model was further used for flood inundation and risk hazard mapping of the study area by using flows simulated at Tori Levee as shown in Figure 5, Figure 6, Figure 7, Figure 8 and Figure 9. These maps included maximum flood-depth, -arrival, -duration, -velocity and -depth times velocities. The depth threshold, taken as 0.35 m, is beyond which the water depth can be life-threatening [48]. The floodplain depth (1.0 to 15 m) shown in Figure 5 shows the maximum depth >5 m within the main Indus River reach, Sukkur Barrage and Manchar lake. However, the depth over most of the alluvial areas varied between 0.36 and 2.25 m, with few places in different cities (i.e., Jacobabad, Shuhdadkot, Qambar, Johi and Dadu) ranged between 2.25 and 5.0 m which shows a greater life threat. Additionally, the maximum depth was noticed upstream of the barrages and near Tori Levee (Figure 5).
Furthermore, the flood velocity is another major hazard for human life and property, so extreme velocity maps were simulated using HEC-RAS to highlight the most fatality-prone areas due to high flood velocity. The floodwater velocity of 1.50 m/s can cause instability for an adult [49]. In relation to that, Figure 6 depicts the maximum velocity within the main Indus River course substantially above the threshold, resulting in a hazardous conditions, in comparison to the alluvial and floodplain where the range of velocities (0.01 to 0.80 m/s) was demonstrated by itself. Overall, low velocities were observed in the floodplain which may be associated with a low slope topography and an increase in elevation level on the western flood protection levees, as well as a high level of roads and irrigation canals compared to the natural surface level in the floodplain [33,36]. The slow propagation of the breaching water was dually confirmed by other studies [33] and reported the average velocity of 0.1 to 0.3 m/s over the avulsion plain down-valley, some propagation slowdown due to the high elevation of roads, irrigation canals and topographic gradient on the west side of the floodplain, as confirmed by [20,33]. However, in the southern part, the flood propagation was driven by the topographic gradient without the contribution of major breach flows from the Indus River. Conversely, the flood velocity within the main course of the Indus River channel travelled at three times this rate [33].
Additionally, the combined effect of the depth and velocity of water is a more realistic measure for the flood hazard analysis. The individual 1.5 m/s of velocity and 0.35 m of depth are life threatening, so the product of both can provide a combined threshold value (0.52 m2/s) for the quantification of human hazard [48]. Figure 7 depicts that most of the floodplain was at a <0.5 m2/s velocity to depth product, which is close to the threshold value (i.e., 0.52 m2/s). However, several spots within the floodplain were also found to be extremely dangerous to life in the flood situation with values of 0.51–0.60 m2/s, which make the active floodplain uninhabitable, particularly close to Jacobabad and Jhatpat city. Furthermore, it was observed that the main route of the flood in the floodplain starts from the Tori Levee breach and includes major populated cities (i.e., Jacobabad, Jhatpat, Gari Khairo, Shahdadkot, Qambar and Johri) where between 0.31 and 0.50 m2/s values resulted in greater life threat (Figure 7).
Additionally, the flood arrival map shows the time of flood arrival at a certain point and certain depth of inundation from a specified time in the simulation. The flood arrival maps in the hours were produced for the avulsion plain, computed from the time the breach occurred at the Tori Levee breach (on 08 August 2010 01:30) and for threshold depth (i.e., 0.35 m). The maps depict that the majority of the avulsion area was flooded under at least 0.35 m water depth after the four days (96 h) from the Tori Levee breach, except for Ghauspur Town and nearby settlements, which were under complete flooding instantly after the breach.
The flood duration maps for the 2010 flood were produced on the basis of four different threshold depths (i.e., 0.35, 1.0, 1.5 and 2.0 m) after the breach of Tori Levee (Figure 9a–d). Figure 9a shows that most of the floodplain was inundated for 31–50 days under 0.35 and 1.0 m water depth. Notably, several parts of the floodplain were also inundated under 1.50 and 2.0 m water depth for approximately up to 41 to 75 days, particularly the spots of Jhatpat, Jacobabad Qambar and Johi cities. Overall, it was noticed that the inundation of 2.0 m was retained for ≈50 days over a few spots of the floodplain after the time of Tori Levee breach, resulting in longer durations of internally displaced peoples (IDPs) in flooded regions. This avulsion flow propagated down valley at an average speed of (0.1 to 0.3 m/s); three times slower than the main channel flow. Periodically, the flow was delayed due to confrontation with elevated structures like irrigation canals, and levees and roads, until it rejoined the main Indus River on 21 September 2010 (after 37 days) [33], as also confirmed by comparing the simulation results and the MODIS daily flood extents.
Overall, extensive damage over the avulsion plain was not only associated with the flood wave impacting inadequate and weak levee structures but also due to the lack of enough storage capacities of two major reservoirs (Mangla and Tarbela dams), barrages located upstream of Tori Levee, and flood diversion channels along the Indus River even at the locations where breaches occurred in the past. According to previous studies, both reservoirs and all barrages located upstream of Tori Levee were at peak storage capacity during the 2010 flood event [9,33], which created substantial pressure on flood protection bunds/levees constructed along the Indus River. Furthermore, reportedly, the Tori Levee breach event leads to a devastating flood towards the northern avulsion plain and particularly the 2.7 km breach at the location of Tori Levee. The Tori Levee was already historically in poor condition due to continuous failures and had lost 1.7 m in design height prior to the 2010 flood event due to soil erosion and a lack of maintenance. Although this extreme event damaged the region, it was not a rare event occurring along this river. Several major floods have occurred due to a breach of different levee structures and spilling of water, aforementioned facts confirmed by [33]. Overall, this study can conclude that the Indus River and its tributaries are highly vulnerable to precipitation extremes and structurally inadequate flood protection levees along the reach. Therefore, both non-structural flood management strategies such as flood forecasting and warning systems [50,51,52,53,54] and structural flood management strategies such as additional storage reservoirs [55,56,57], flood diversion structures, and the widening of the river channel at the most critical locations are needed [58].This study is an attempt to help the future planning for improving flood management by identifying potential flood diversion channels location and management options and by considering the flood extent and inundation maps along the Indus River.

4. Conclusions

This study carried out the modeling of the devastating 2010 flood caused by the Tori Levee breach in Pakistan by using a well-known hydrodynamic model (i.e., HEC-RAS 2D). In this study, the HEC-RAS model was calibrated and validated for the peak water levels at different gauging stations and flood extent for the years 2010 and 2015. Additionally, the flood inundation risk analysis using the HEC-RAS model provided maps for the spatial variations in flood depth, velocity of water, depth times velocity product, flood arrival, and flood retention duration over the Northern Sindh Province of Pakistan (study area).
This study showed that the HEC-RAS 2D model is capable of modeling the water levels (stage) at seven different gauging stations during the peak flood with a sum of square errors value of 0.90. The HEC-RAS 2D model performed well in calibrating and validating the 2010 and 2015 flood extents with overall 84 and 89% matching, respectively, between the extents simulated by HEC-RAS and the UNOSAT and MODIS images. Additionally, the calibrated and validated HEC-RAS model simulated how the flows (4994.47 cumecs) passed through the breached Tori Levee, resulting in the devastating flood. The inundation map of flood depth over the study area showed maximum water depths over several spots in floodplain. However, the velocity of flooded water was maximum within the main course of the Indus River. The flood poses very little treat to life in floodplain with the values below the life-threatening threshold except within the vicinity of the breach. However, the product of the velocity and depth map showed that the active floodplain is uninhabitable due to life threat with several spots far beyond the threshold (0.52 m2/s) values over the floodplain of the study area. Furthermore, the flood duration map at different depth levels showed the depth of flood water retained at particular spots for particular times. The results showed that the 0.35 m depth of water was retained for approximately 70 days at most of the floodplain after the initiation of the flood event. Several spots were under the 2.0 m depth of water retention over floodplain.
Overall, the study showed that apart from the Ghauspur Town and nearby settlements which were instantly flooded after the breach, the majority of the areas were completely flooded after the four days of Tori Levee breach, resulting in human life loss and economic loss. These losses could be avoidable by providing residual flood risk maps for the avulsion area in advance, resulting in quick evacuation from the active floodplain to safe havens located in nearby regions. The results and methodology adopted in this study can be used for potential hazarding mapping and management for the regions frequently facing floods. Additionally, since, the Tori Levee is a hotspot for breaching and was already breached several times before the 2010 flood, therefore, the results of this study can be useful for the local government authorities, federal flood commission (FFC) and National Disaster Management (NDMA) to evacuate and shift the population under threat during expected flooding conditions in the future.

Supplementary Materials

The following are available online at https://www.mdpi.com/2073-4441/13/5/604/s1, Figure S1: Pre-flood (top), post-flood or breached (bottom) situation of Tori Levee images obtained from SPOT, Figure S2: Estimation of the dam crest width using the Xu and Zhang method for Tori Levee breach, Figure S3: Design of Guddu Barrage structure in HEC-RAS. Upper figure shows the modelling of gates at the Guddu Barrage, whereas the lower figure shows the operational and non-operational gates at Guddu Barrage, Figure S4: The validation of HEC-RAS model for maximum flood inundation comparison of the 2015 flood map by comparing remotely sensed and simulated flood extents, Figure S5: Sample comparison of the flood extent in flood plain between MODIS daily images and simulated by the HEC-RAS model during the period of the 03–12 September 2010 flood. Table S1: Comparison of the daily observed and simulated flood extents based on MODIS images of the 2010 flood event.

Author Contributions

Conceptualization, B.N. and M.A.; Data curation, B.N. and S.A. (Sajjad Ahmad); Formal analysis, M.A.; Funding acquisition, H.T.; Investigation, S.A (Shakil Ahmed) and Z.K.; Methodology, M.A., H.T. and S.A. (Sajjad Ahmad); Resources, H.T. and M.U.K.; Software, M.U.K. and C.R.G.; Supervision, Z.K.; Validation, B.N., S.A. (Shakil Ahmed) and S.H.; Writing—original draft, M.A. and S.H.; Writing—review and editing, H.T. and C.R.G. All authors read and agreed to the published version of the manuscript.

Funding

This study was supported by the National Key Research and Development Program of China (2018FY100501).

Informed Consent Statement

It is stated that the informed consent was obtained from all subjects involved in the study.

Data Availability Statement

Data sharing not applicable.

Acknowledgments

This study acknowledges the extended help and datasets provided by United Nations Operational Satellite Applications Programme (UNOSAT), Ministry of Environment, Sindh Irrigation, Drainage Authority, Sindh Irrigation Department and specially Regional Computer Cell, Guddu Barrage.

Conflicts of Interest

The authors declare no conflict of interest. The funders had no role in the design of the study; in the collection, analyses, or interpretation of data; in the writing of the manuscript, or in the decision to publish the results.

References

  1. Abdelkarim, A.; Gaber, A.F.D.; Youssef, A.M.; Pradhan, B. Flood Hazard Assessment of the Urban Area of Tabuk City, Kingdom of Saudi Arabia by Integrating Spatial-Based Hydrologic and Hydrodynamic Modeling. Sensors 2019, 19, 1024. [Google Scholar] [CrossRef] [Green Version]
  2. Semple, K. On Flood Plain, Pondering Wisdom of Rebuilding Anew. New York Times, 4 September 2011. [Google Scholar]
  3. Ahmad, F.; Kazmi, S.F.; Pervez, T. Human response to hydro-meteorological disasters: A case study of the 2010 flash floods in Pakistan. J. Geogr. Reg. Plan. 2011, 4, 518–524. [Google Scholar]
  4. Harmeling, S. Global Climate Risk Index 2012, 7th ed.; Germanwatch: Berlin, Germany, 2011. [Google Scholar]
  5. WAPDA. Annual Flood Report 2009; Federal Flood Commission: Islamabad, Pakistan, 2009.
  6. Khan, B.; Iqbal, M.J. Forecasting flood risk in the Indus River system using hydrological parameters and its damage assessment. Arab. J. Geosci. 2012, 6, 4069–4078. [Google Scholar] [CrossRef]
  7. Manzoor, M.; Bibi, S.; Manzoor, M.; Jabeen, R. Historical Analysis of Flood Information and Impacts Assessment and Associated Response in Pakistan (1947–2011). Res. J. Environ. Earth Sci. 2013, 5, 139–146. [Google Scholar] [CrossRef]
  8. Paulikas, M.; Rahman, M. A temporal assessment of flooding fatalities in Pakistan (1950–2012). J. Flood Risk Manag. 2013, 8, 62–70. [Google Scholar] [CrossRef]
  9. Hashmi, H.N.; Siddiqui, Q.T.M.; Ghumman, A.R.; Kamal, M.A.; Mughal, H. A critical analysis of 2010 floods in Pakistan. Afr. J. Agric. Res. 2012, 7, 1054–1067. [Google Scholar]
  10. Di Baldassarre, G.; Castellarin, A.; Montanari, A.; Brath, A. Probability-weighted hazard maps for comparing different flood risk management strategies: A case study. Nat. Hazards 2009, 50, 479–496. [Google Scholar] [CrossRef]
  11. Di Baldassarre, G.; Castellarin, A.; Brath, A. Analysis of the effects of levee heightening on flood propagation: Example of the River Po, Italy. Hydrol. Sci. J. 2009, 54, 1007–1017. [Google Scholar] [CrossRef]
  12. Huthoff, F.; Remo, J.; Pinter, N. Improving flood preparedness using hydrodynamic levee-breach and inundation modelling: Middle Mississippi River, USA. J. Flood Risk Manag. 2013, 8, 2–18. [Google Scholar] [CrossRef]
  13. Xia, J.; Falconer, R.A.; Lin, B.; Tan, G. Modelling flash flood risk in urban areas. In Proceedings of the Institution of Civil Engineers—Water Management; Thomas Telford: Telford, UK, 2011; Volume 164, pp. 267–282. [Google Scholar]
  14. Xu, Y.; Zhang, L.M. Breaching Parameters for Earth and Rockfill Dams. J. Geotech. Geoenviron. Eng. 2009, 135, 1957–1970. [Google Scholar] [CrossRef]
  15. Khan, M. Report of the Flood Inquiry Commission, Appointed by the Supreme Court of Pakistan: Supreme Court of Pakistan; University of Colorado: Boulder, CO, USA, 2011; p. 84. [Google Scholar]
  16. Krause, P.; Boyle, D.P.; Bäse, F. Comparison of different efficiency criteria for hydrological model assessment. Adv. Geosci. 2005, 5, 89–97. [Google Scholar] [CrossRef] [Green Version]
  17. Dimitriadis, P.; Tegos, A.; Oikonomou, A.; Pagana, V.; Koukouvinos, A.; Mamassis, N.; Koutsoyiannis, D.; Efstratiadis, A. Comparative evaluation of 1D and quasi-2D hydraulic models based on benchmark and real-world applications for uncertainty assessment in flood mapping. J. Hydrol. 2016, 534, 478–492. [Google Scholar] [CrossRef]
  18. Hoque, M.A.-A.; Tasfia, S.; Ahmed, N.; Pradhan, B. Assessing Spatial Flood Vulnerability at Kalapara Upazila in Bangladesh Using an Analytic Hierarchy Process. Sensors 2019, 19, 1302. [Google Scholar] [CrossRef] [Green Version]
  19. Zhang, L.; Xu, Y.; Liu, Y.; Peng, M. Assessment of flood risks in Pearl River Delta due to levee breaching. Georisk: Assess. Manag. Risk Eng. Syst. Geohazards 2013, 7, 122–133. [Google Scholar] [CrossRef]
  20. Heimhuber, V.; Hannemann, J.-C.; Rieger, W. Flood Risk Management in Remote and Impoverished Areas—A Case Study of Onaville, Haiti. Water 2015, 7, 3832–3860. [Google Scholar] [CrossRef]
  21. Ehsan, S.; Haider, N.I.; Ghani, S.; Zaman, T. Assessment of Flood Vulnerable Areas Downstream of Mangla Dam. NFC IEFR J. Eng. Sci. Res. 2016, 4, 32–36. [Google Scholar] [CrossRef] [Green Version]
  22. Jung, C.-G.; Kim, S.-J. Comparison of the Damaged Area Caused by an Agricultural Dam-Break Flood Wave Using HEC-RAS and UAV Surveying. Agric. Sci. 2017, 8, 1089–1104. [Google Scholar] [CrossRef] [Green Version]
  23. Khalil, U.; Khan, N.M. Floodplain Mapping for Indus River: Chashma–Taunsa Reach. Pak. J. Eng. Appl. Sci. 2017, 20, 30–48. [Google Scholar]
  24. Lea, D.; Yeonsu, K.; Hyunuk, A. Case study of HEC-RAS 1D–2D coupling simulation: 2002 Baeksan flood event in Korea. Water 2019, 11, 2048. [Google Scholar] [CrossRef] [Green Version]
  25. Bertrand, N.; Liquet, M.; Moiriat, D.; Bardet, L.; Duluc, C.-M. Uncertainties of a 1D Hydraulic Model with Levee Breaches: The Benchmark Garonne; Gourbesville, P., Cunge, J., Caignaert, G., Eds.; Springer: Singapore, 2018; pp. 189–204. [Google Scholar]
  26. Patel, D.P.; Ramirez, J.A.; Srivastava, P.K.; Bray, M.; Han, D. Assessment of flood inundation mapping of Surat city by coupled 1D/2D hydrodynamic modeling: A case application of the new HEC-RAS 5. Nat. Hazards 2017, 89, 93–130. [Google Scholar] [CrossRef]
  27. Pinter, N.; Huthoff, F.; Dierauer, J.; Remo, J.W.; Damptz, A. Modeling residual flood risk behind levees, Upper Mississippi River, USA. Environ. Sci. Policy 2016, 58, 131–140. [Google Scholar] [CrossRef]
  28. Dutta, S.; Medhi, H.; Karmaker, T.; Singh, Y.; Prabu, I.; Dutta, U. Probabilistic flood hazard mapping for embankment breaching. ISH J. Hydraul. Eng. 2010, 16, 15–25. [Google Scholar] [CrossRef]
  29. Connell, R.J.; Painter, D.J.; Beffa, C. Two-Dimensional Flood Plain Flow. II: Model Validation. J. Hydrol. Eng. 2001, 6, 406–415. [Google Scholar] [CrossRef]
  30. Bhuyian, M.; Dullo, T.; Kalyanapu, A.; Vanden Berge, D. Identifying Levee Breach Hotspots via Fine Resolution 2D Hydrodynamic Modeling—A Case Study in the Obion River; Tennessee Tech University: Cookeville, TN, USA, 2017. [Google Scholar]
  31. Carr, K.J.; Tu, T.; Ercan, A.; Kavvas, M.L.; Nosacka, J. Two-Dimensional Unsteady Flow Modeling of Flood Inundation in a Leveed Basin. In World Environmental and Water Resources Congress 2015; American Society of Civil Engineers: Reston, VA, USA, 2015; pp. 1597–1606. [Google Scholar]
  32. Shustikova, I.; Neal, J.C.; Domeneghetti, A.; Bates, P.D.; Vorogushyn, S.; Castellarin, A. Levee Breaching: A New Extension to the LISFLOOD-FP Model. Water 2020, 12, 942. [Google Scholar] [CrossRef] [Green Version]
  33. Syvitski, J.P.; Brakenridge, G.R. Causation and avoidance of catastrophic flooding along the Indus River, Pakistan. GSA Today 2013, 23, 4–10. [Google Scholar] [CrossRef]
  34. Ahmad, I.; Fawad, M.; Mahmood, I.; Fawad, M. At-Site Flood Frequency Analysis of Annual Maximum Stream Flows in Pakistan Using Robust Estimation Methods. Pol. J. Environ. Stud. 2015, 24, 2345–2353. [Google Scholar] [CrossRef]
  35. Rahman, A.-U.; Khan, A.N. Analysis of 2010-flood causes, nature and magnitude in the Khyber Pakhtunkhwa, Pakistan. Nat. Hazards 2012, 66, 887–904. [Google Scholar] [CrossRef]
  36. Ahmad, R.; Daniyal, D. Evaluating damage assessment of breaches along the embankments of indus river during flood 2010 using remote sensing techniques. ISPRS Int. Arch. Photogramm. Remote. Sens. Spat. Inf. Sci. 2013, 1, 7–11. [Google Scholar] [CrossRef] [Green Version]
  37. WAPDA. Annual Flood Report 2010; Federal Flood Commission, Ministry of Water and Power: Islamabad, Pakistan, 2010.
  38. Semple, M. Breach of Trust People’s Experiences of the Pakistan Floods and their Aftermath, 1st ed.; PanGraphics (Pvt) Ltd.: Islamabad, Pakistan, 2011. [Google Scholar]
  39. USACE. HEC-RAS River Analysis System Hydraulic Reference Manual. Version 5.0.; Hydrologic Engineering Center Davis: Davis, CA, USA, 2016.
  40. Farooq, M.; Shafique, M.; Khattak, M.S. Flood hazard assessment and mapping of River Swat using HEC-RAS 2D model and high-resolution 12-m TanDEM-X DEM (WorldDEM). Nat. Hazards 2019, 97, 477–492. [Google Scholar] [CrossRef]
  41. Yalcin, E. Assessing the impact of topography and land cover data resolutions on two-dimensional HEC-RAS hydrodynamic model simulations for urban flood hazard analysis. Nat. Hazards 2020, 101, 995–1017. [Google Scholar] [CrossRef]
  42. Estima, J.; Painho, M. Exploratory analysis of OpenStreetMap for land use classification. In Proceedings of the Second ACM SIGSPATIAL International Workshop on Mobile Geographic Information Systems-MobiGIS ‘13; Association for Computing Machinery (ACM): New York, NY, USA, 2013; pp. 39–46. [Google Scholar]
  43. Fritz, S.; McCallum, I.; Schill, C.; Perger, C.; See, L.; Schepaschenko, D.; Van Der Velde, M.; Kraxner, F.; Obersteiner, M. Geo-Wiki: An online platform for improving global land cover. Environ. Model. Softw. 2012, 31, 110–123. [Google Scholar] [CrossRef]
  44. Arcement, G.J.; Schneider, V.R. Guide for Selecting Manning’s Roughness Coefficients for Natural Channels and Flood Plains; U.S. Government Printing Office: Washington, DC, USA, 1989.
  45. Phillips, J.V.; Tadayon, S. Selection of Manning’s Roughness Coefficient for Natural and Constructed Vegetated and Non-Vegetated Channels, and Vegetation Maintenance Plan Guidelines forVegetated Channels in Central Arizona; US Department of the Interior: Washington, DC, USA, 2006.
  46. Te Chow, V. Open Channel Hydraulics; McGraw-Hill Book Company Inc.: New York, NY, USA, 1959. [Google Scholar]
  47. Horritt, M.S.; Di Baldassarre, G.; Bates, P.D.; Brath, A. Comparing the performance of a 2-D finite element and a 2-D finite volume model of floodplain inundation using airborne SAR imagery. Hydrol. Process. 2007, 21, 2745–2759. [Google Scholar] [CrossRef]
  48. Brasil. Decreto—Lei No. 227, de 28 de fevereiro de 1967. Dá Nova Redação ao Decreto-lei No. 1.985, de 29 de Janeiro de 1940 (Código de Minas). 1967; Brasília. Available online: http://www.planalto.gov.br/ccivil_03/Decreto-Lei/Del0227.htm (accessed on 19 October 2020).
  49. Chen, Q.; Xia, J.; Falconer, R.A.; Guo, P. Further improvement in a criterion for human stability in floodwaters. J. Flood Risk Manag. 2018, 12, e12486. [Google Scholar] [CrossRef] [Green Version]
  50. Rind, M.A.; Ansari, K.; Saher, R.; Shakya, S.; Ahmad, S. 2D Hydrodynamic Model for Flood Vulnerability Assessment of Lower Indus River Basin, Pakistan; American Society of Civil Engineers (ASCE): Reston, VA, USA, 2018. [Google Scholar]
  51. Nyaupane, N.; Thakur, B.; Kalra, A.; Ahmad, S. Evaluating Future Flood Scenarios Using CMIP5 Climate Projections. Water 2018, 10, 1866. [Google Scholar] [CrossRef] [Green Version]
  52. Simonovic, S.P.; Ahmad, S. Computer-based model for flood evacuation emergency planning. Nat. Hazards 2005, 34, 25–51. [Google Scholar] [CrossRef]
  53. Ahmad, S.; Simonovic, S.P. Integration of heuristic knowledge with analytical tools for selection of flood control measures. Can. J. Civ. Eng. 2001, 28, 208–221. [Google Scholar] [CrossRef]
  54. Ahmad, S.; Simonovic, S.P. An intelligent decision support system for management of floods. Water Resour. Manag. 2006, 20, 391–410. [Google Scholar] [CrossRef]
  55. Ahmad, S.; Simonovic, S.P. System dynamics modeling of reservoir operations for flood management. ASCE J. Comput. Civ. Eng. 2000, 14, 190–198. [Google Scholar] [CrossRef]
  56. Tamaddun, K.A.; Ahmed, W.; Burian, S.; Kalra, A.; Ahmad, S. Reservoir Regulations of the Indus River Basin under Different Flow Conditions; American Society of Civil Engineers (ASCE): Reston, VA, USA, 2018. [Google Scholar]
  57. Siyal, A.A.; Misrani, D.M.; Dars, G.H.; Ahmad, S. Application of GIS and Remote Sensing for Identification of Potential Runoff Harvesting Sites: A Case Study of Karoonjhar Mountainous Area, Pakistan; American Society of Civil Engineers (ASCE): Reston, VA, USA, 2018. [Google Scholar]
  58. Mosquera-Machado, S.; Ahmad, S. Flood hazard assessment of Atrato river in Colombia. Water Resour. Manag. 2007, 21, 591–609. [Google Scholar] [CrossRef]
Figure 1. Study area map showing the Tori Levee breached residual flood inundation the flood-effected areas (northern Sindh) during the 2010 floods. (Source: flood extent by UNOSAT (United Nations Institute for Training and Research—Operational Satellite Applications Programme)).
Water 13 00604 g001
Figure 2. Detailed methodology flow chart adopted in this study for the simulation of the 2010 and 2015 flood using the HEC-RAS model.
Water 13 00604 g002
Figure 3. The calibration of the HEC-RAS model for the maximum flood inundation comparison of 2010 flood map by comparing remotely sensed and simulated flood extents.
Water 13 00604 g003
Figure 4. The stage-flow hydrograph during the flood event from June to October 2010, simulated by using HEC-RAS at Tori Levee including the time of breach during the 2010 flood. Note: HW; headwater is the stage and flow measurement upstream of the barrage, TW; tail water is the stage and flow measurement downstream of the barrage.
Water 13 00604 g004
Figure 5. The spatial change in maximum flood depth in meters over the study region during the 2010 flood simulated by HEC-RAS.
Water 13 00604 g005
Figure 6. The spatial change in maximum flood velocity (m/s) over the study region during the 2010 flood.
Water 13 00604 g006
Figure 7. The spatial change in the product of maximum flood velocity and depth (m2/s) over the study region during the 2010 flood.
Water 13 00604 g007
Figure 8. Flood arrival map after the Tori Levee breach in hours up to 96 h, for a threshold depth of 0.35 m.
Water 13 00604 g008
Figure 9. Flood inundation duration maps for depth thresholds of 0.35, 1.0, 1.5 and 2.0 m shown in (a), (b), (c), and (d), respectively, in days after the Tori Levee breach.
Water 13 00604 g009
Table 1. Optimized Manning’s (n) roughness values for the calibration of active and inactive floodplain avulsion.
Area (inactive Flood Plain)Within Levees Area (Active Flood Plain)
Land Use ClassManning (n)Land Use ClassManning (n)
No Data0.04No Data0.008
Broad Leaf Forest0.10Broad Leaf Forest 0.03
Built-Up Lands0.15Built-Up Lands 0.15
Desert0.03Desert 0.02
Exposed Rocks0.05Exposed Rocks 0.02
Irrigated Agriculture0.07Irrigated Agriculture 0.028
Open Ground0.05Open Ground 0.02
Orchard0.06Orchard 0.03
Range Land0.05Range Land 0.025
Riverine Forest0.10Riverine Forest 0.025
Saline Areas0.03Saline Areas 0.02
Tree Plantation0.06Tree Plantation 0.03
Water Bodies0.06Water Bodies 0.025
Waterlogged Area0.07Waterlogged Area 0.027
Manchar Lake Area0.08Goraghat Area0.008
RodKohi Agriculture0.05
Table 2. Flood modeling sensitivity analysis to different DEMs available at 30 m, for 2010 flood maximum depth (m), velocity (m/s) and flood extant (%).
Used DEM (30 m)Maximum Depth (m)Velocity (m/s)Flood Extent Match
ALOS141.1–2.384%
ASTER191.3–2.573%
SRTM221.3–2.675%
Table 3. Comparison of the water levels (meters) between the observed and simulated by HEC-RAS at seven different gauging stations located at within Indus River channel during 2010 and 2015 flood calibration and validation, respectively.
CalibrationWater Levels (m) Flood 2010Difference = Simulated − Observed
Gauge Stations(O) Observed(S) Simulated
Guddu Barrage79.4379.89−0.46
Begari Sindh79.1178.980.13
Kacha Kharif76.3976.89−0.50
Ghora Ghat72.5972.83−0.24
Tori71.5371.68−0.15
Sukkur Beghari70.2570.47−0.22
Sukkur Barrage61.5662.10−0.54
Nash–Sutcliffe Efficiency (NSE)0.979
Index of Agreement (d)0.995
Relative Deviations of Nash–Sutcliffe Efficiency (Erel)0.980
Relative Deviations of Index of Agreement (drel)0.995
ValidationWater Levels (m) Flood 2015Difference = Simulated − Observed
(O) Observed(S) Simulated
Guddu Barrage78.8077.391.41
Begari Sindh76.9276.020.9
Kacha Kharif72.3571.800.55
Ghora Ghat71.0370.450.58
Tori70.8870.320.56
Sukkur Beghari67.1066.660.44
Sukkur Barrage61.7561.97−0.22
Nash–Sutcliffe Efficiency (NSE)0.980
Index of Agreement (d)0.995
Relative Deviations of Nash–Sutcliffe Efficiency (Erel)0.981
Relative Deviations of Index of Agreement (drel)0.999
Publisher’s Note: MDPI stays neutral with regard to jurisdictional claims in published maps and institutional affiliations.

