
Effect of the Particle Size of Clinoptilolite Zeolite on Water Content and Soil Water Storage in a Loamy Sand Soil


1
Department of Soil Science, College of Food and Agricultural Sciences, King Saud University, P.O. Box 2460, Riyadh 11451, Saudi Arabia
2
Department of Soils and Water, Faculty of Agriculture, Suez Canal University, Ismailia 41522, Egypt
*
Author to whom correspondence should be addressed.
Water 2021, 13(5), 607; https://doi.org/10.3390/w13050607
Submission received: 3 February 2021
/
Revised: 21 February 2021
/
Accepted: 22 February 2021
/
Published: 26 February 2021
Abstract
:Limited water resources in arid and semi-arid regions require innovative management to maintain crop production while minimizing the amounts of water used for irrigation. We investigated the impact of the particle size of natural clinoptilolite zeolite (CZ) on water content (WC) and hydraulic properties of a loamy sand soil. WC was measured using 5TE sensors installed at five depths (10, 20, 30, 40, and 50 cm) in soil columns (7.4 cm ID, 56 cm length). Three sizes of macro- and nano-CZ particles (20, 2.0, and 0.2 µm) were added to the soil at an application rate of 1%. The columns were subject to 14 wetting/drying cycles from 24 February to 8 December 2020. The HYDRUS-1D model was used to simulate WC and soil water storage inside the soil columns. WC increased with the decreasing particle size of CZ, especially when columns were subject to long drying periods. The larger surface area and smaller pore size of CZ altered the pore-size distribution of the loamy sand soil and increased the amount of microporosity inside the soil system, leading to increased water retention. Available water and soil water storage were increased by 3.6–14.7% and 6.8–10.5%, respectively, with larger increases with the decrease in CZ particle size. Variations in infiltration rate and hydraulic conductivity were statistically significant only with the smallest CZ particle size, with a reduction of 25.6% and 19.3% compared to the control, respectively. The HYDRUS-1D model accurately simulated WC and soil water storage, with only slight overestimation of WC (2.4%) at depths ≤ 30 cm. The results suggest that, in light-textured soils, the application of CZ in the ultra-fine nanoparticle size would increase water-holding capacity and reduce hydraulic conductivity, which would enhance the efficiency of water use and contribute to water conservation in dry regions.
1. Introduction
Water is the most essential element to achieve sustainable development, especially in arid and semi-arid regions where renewable water resources are very limited [1,2,3]. The increased population worldwide necessitates enhanced and more efficient agricultural production to meet the needs of this growing population. However, agricultural activities are consuming more than two-thirds of the renewable water resources [4]; therefore, it is a dilemma to meet the increased food demand while maintaining our limited renewable water resources [5]. Agricultural production is highly dependent on efficient and effective irrigation and fertilization strategies [6]. In many arid and semi-arid regions, most agricultural lands are characterized by light-textured soils having a high infiltration rate and low potential to retain water [7]. Increasing irrigation efficiency in light-textured soils relies on the ability to enhance soil physical properties to reduce infiltration and hydraulic conductivity and increase water retention [8]. The application of organic and inorganic amendments has long been suggested as a method to improve the physical properties of the soil and to increase water-holding capacity and plant-available water [9]. Organic amendments can help to reduce bulk density and increase water and nutrient retention in light-textured soils [10,11]. However, organic amendments tend to lose their favorable characteristics due to decomposition over time [12,13], particularly under the hot and dry climatic conditions in arid and semi-arid regions. On the other hand, inorganic amendments are more resistant to decomposition and have less potential to spread pathogenic organisms; therefore, they will improve the physical properties of light-textured soils over longer time periods [14].
Among the different inorganic amendments, zeolites have received greater attention because of their unique characteristics including large surface area and adsorption capacity [15]. The application of zeolites can reduce infiltration and hydraulic conductivity in light-textured soils [16] and increase water-use efficiency (WUE) due to enhanced water retention and storage in the soil [4]. Clinoptilolite is a natural zeolite found in extensive deposits in several countries around the world [17] and is widely used as a soil amendment to light-textured soils. Clinoptilolite zeolite is a crystalline hydrated aluminosilicate of alkaline and earth alkaline elements having an open framework that is characterized by several channels and tunnels capable of holding water molecules [18]. The specific crystal structure of clinoptilolite provides the necessary microporosity required to increase the ability to retain water [19], whereas the secondary mesoporosity formed through the connection between clinoptilolite particles and other minerals in the zeolite rocks provides adequate aeration and drainage conditions, making clinoptilolite an idealized inorganic amendment to improve the physical and chemical properties of the soil [20].
Infiltration rate and hydraulic conductivity in light-textured soils (e.g., sand and loamy sand) are typically high, leading to fast water movement, and a significant amount of soil water is lost by gravity to sub-surface layers [16]. The increased pore volume and low bulk density of clinoptilolite zeolite can alter the infiltration rate and hydraulic conductivity over the long term by changing the soil structure and texture [21,22]. Mahabadi et al. [23] observed that the application of clinoptilolite zeolite to sand and loamy sand soils resulted in a reduction in the average particle size, which lowered hydraulic conductivity compared to the control soil. The enhancement in the physical properties of light-textured soils also was attributed to the reduction in bulk density with the application of clinoptilolite zeolite, which can improve total porosity and aggregate stability in the soil [24].
A number of studies have documented the improvement in the water-holding capacity (WHC) of light-textured soils with the application of zeolite [25,26]. Xiubin and Zhanbin [4] found an increase in the capacity of holding water of 5–15% with the application of natural zeolite to a fine-grained calcareous loess, and the water content remained higher in treated soils even after 25 h from the time of water addition. An application rate of 10% v v−1 of clinoptilolite zeolite improved the water content in a sandy soil by 60% at −100 hPa matric potential [27]. To a lesser extent, an increase in the water content in sandy soil (16–20%) with the application of clinoptilolite zeolite was also reported [26,28]. Zeolites also improve WUE by increasing the soil water-holding capacity, which subsequently increases the availability of water and the efficiency of water use of plants [4,29]. The amount of available water in a sandy soil was increased by 15%, 51%, and 111% compared to the control soil after being amended with natural zeolite application rates of 3.33%, 6.67%, and 10% w w−1, respectively [29].
Variation in the size of zeolite particles can significantly affect the ability of zeolite amendments to enhance the physical properties of light-textured soils. This factor has received much less attention in the literature. For example, Huang and Petrovic [12] examined the effect of clinoptilolite zeolite in six particle sizes, ranging from >1 to <0.047 mm, on the physical properties of sandy soil. They reported a larger decrease in the saturated hydraulic conductivity and higher water content as the size of the clinoptilolite particles became smaller. The high pore volume of smaller-size zeolite particles allows for more water to be held in their structure, which increases the water-holding capacity of the soil and zeolite mixture [24]. In recent years, the impact of the application of natural and modified clinoptilolite zeolite on drainage water and crop yield has gained greater attention [30]. However, to our knowledge, the impact of macro- and nano-sized clinoptilolite zeolite on the physical and hydrological properties of light-textured soils has not been addressed. Therefore, the objectives of this research were to assess the effect of macro- and nano-sized clinoptilolite zeolite on the water retention and hydraulic properties of a sandy loam soil and to use the HYDRUS-1D model to simulate water content and soil water storage in soil columns.
2. Materials and Methods
2.1. Soil Sampling
A surface soil sample (0–30 cm) was collected from Riyadh city, Saudi Arabia (24°32′58.1″ N and 46°55′30.0″ E). The bulk density of the soil was determined in the field with the core method. The soil sample was air dried and passed through a 2-mm sieve. The physical and chemical characteristics of the soil sample were determined according to standard procedures [31]. The texture of the soil was loamy sand, and the percentages of sand, silt, and clay, as determined by laser diffraction (Mastersizer 2000, Malvern Panalytical, Malvern, UK), were 86.3%, 7.4%, and 6.3%, respectively. The soil classification according to the World Reference Base for Soil Resources [32] was Calcaric Arenosols with good drainage. Measured chemical and physical properties of the air-dried soil sample were as follows: pH (H2O) of 7.6; electrical conductivity (EC) (soil paste) of 2.92 dS m−1; organic matter (OM) of 0.18%; cation exchange capacity (CEC) of 6.1 cmolc kg−1; calcium carbonate of 15.1%; bulk density of 1.5 g cm−3; and WHC of 10.2%.
2.2. Clinoptilolite Zeolite
Natural clinoptilolite zeolite (CZ) was purchased from Heiltropfen (Heiltropfen Laboratory, 27 Old Gloucester Street, London, UK). According to the manufacturer, the product is 100% natural volcanic powder of Norwegian origin, with 90–92% clinoptilolite of ultra-fine size (<20 µm). The CZ was used in this research as received without any further activation. The chemical formula of the representative unit cell of CZ was (KNa2Ca2 (Si29Al7) O72 24H2O). The crystalline structure and phases of the CZ particles were investigated using X-ray diffraction (XRD). The XRD analysis was conducted with an Altima IV X-ray diffractometer (Rigaku, Austin, TX, USA); CZ particles were scanned from 0° to 40° at a rate of 2.0° min−1. The particle size of the original purchased powder CZ was determined using a particle size analyzer (Mastersizer 2000, Malvern, UK). The diameter of 90% of the particles (D90) was 20 ± 1.5 µm. The size of the powdered CZ was taken as the first macro-size of the CZ particles (referred to hereafter as CZ1). For the preparation of the nano-sized CZ particles, the powder CZ first was ground in a jet mill, and 2 g of the ground CZ was suspended in 1 L of nano-pure water. The suspension was sonicated for 30 min (Ultrasonic sonicator Q700, Qsonica, Newtown, CT, USA) and left for gravity sedimentation for 8 h [33]. After the designated time, CZ particles suspended in the top 5 cm of the cylinder were siphoned. The process was repeated several times to collect a sufficient amount, and the amount collected was completed to 1 L, sonicated for 5 min, and the average hydrodynamic size of the CZ particles was measured using laser doppler velocimetry (Zetasizer Nano ZS, Malvern, UK). The hydrodynamic size of the CZ particles (D90) collected after 8 h of sedimentation was 2 ± 0.1 µm (referred to hereafter as CZ2). Then, nano-sized CZ particles were prepared in the same manner, but with a longer, 24-h sedimentation time. The hydrodynamic size of the CZ particles (D90) collected after 24 h of sedimentation was 0.2 ± 0.05 µm (referred to hereafter as CZ3). Hence, three particle sizes were prepared for the CZ: one macro-sized CZ (CZ1) and two nano-sized CZ (CZ2 and CZ3). Zeta potential of the soil sample and the prepared CZ macro- and nano-sized particles was determined by dynamic light scattering techniques by measuring the electrophoretic mobility of the suspended soil and CZ particles (Zetasizer Nano ZS, Malvern, UK). The specific surface area (SSA) of the soil and CZ particles was determined by the Brunauer, Emmett, and Teller (BET) method with nitrogen (N2) at 77 K using a surface area and microporosity analyzer (ASAP 2020, Micromeritics, Norcross, GA, USA). Dynamic aggregation of CZ suspensions, prepared in nano-pure water, was quantitatively determined by time-resolved optical absorbance methodology. The change in optical absorbance of CZ particles at a wavelength of 297 nm was monitored over time, every 3 min for 6 h, using a UV/VIS Spectrophotometer (GENESYS 10S, Thermo, Madison, WI, USA).
2.3. Laboratory Column Experiment
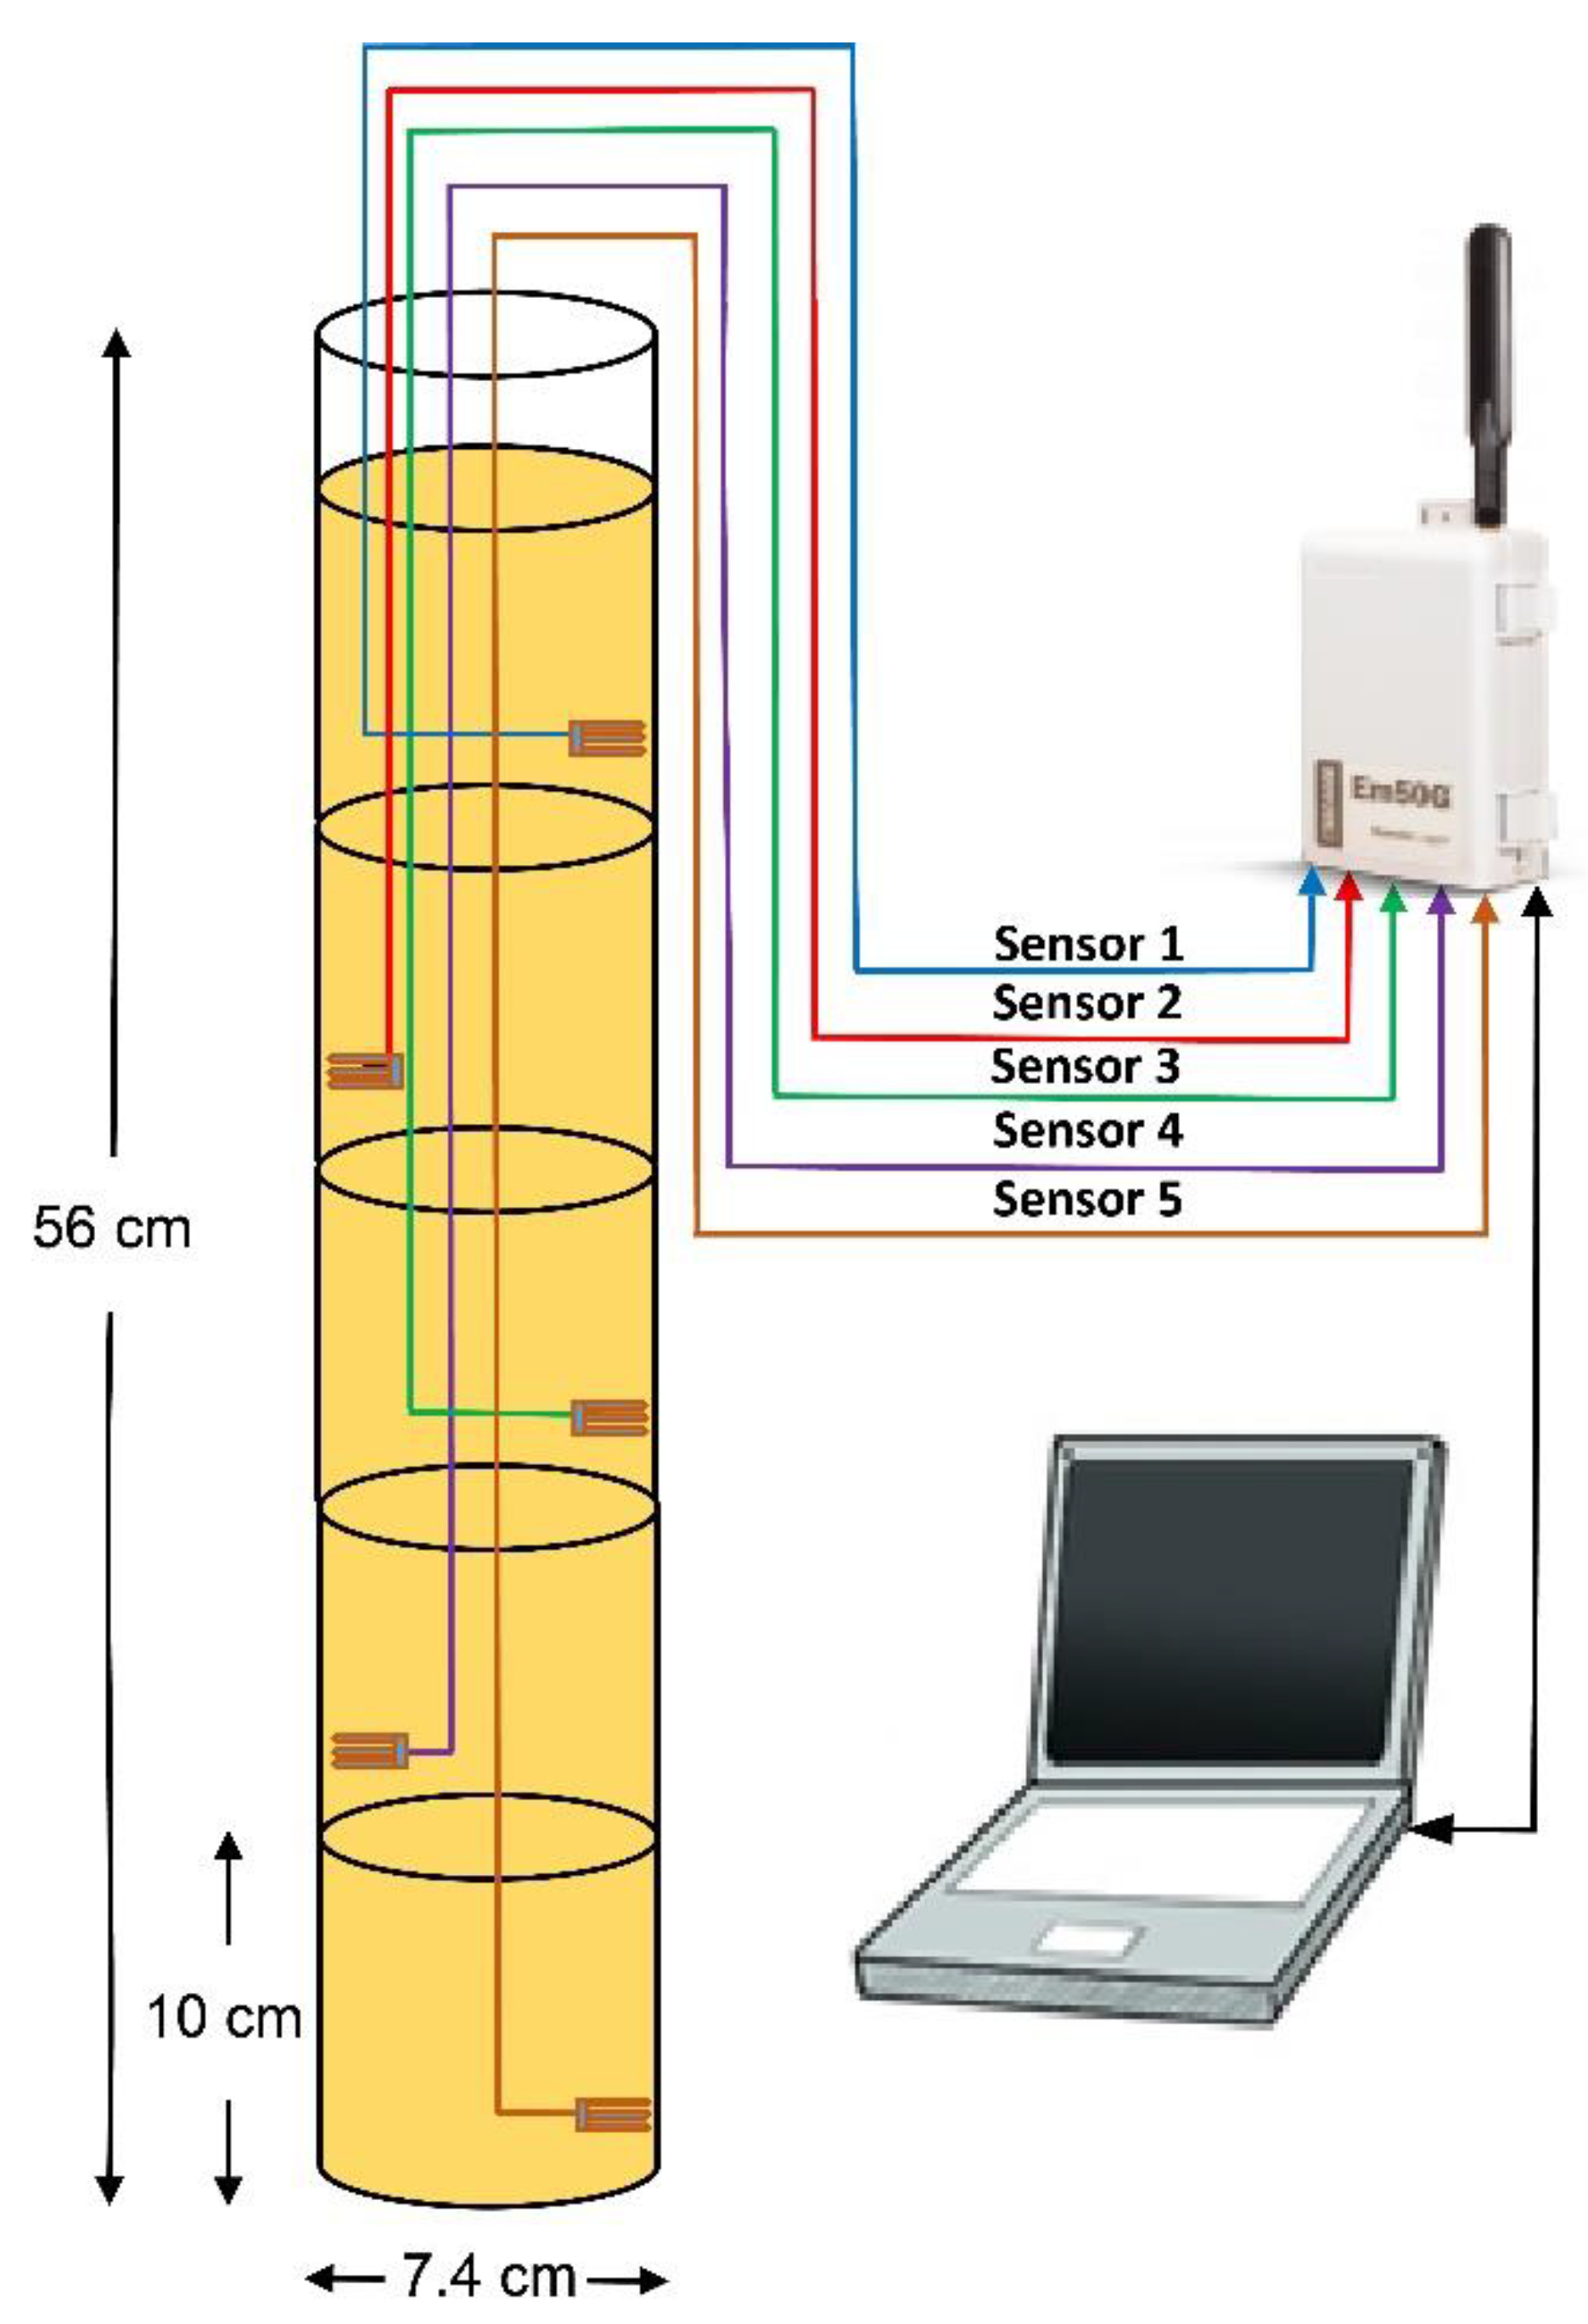
The assessment of the impact of CZ particle size on the hydraulic properties of the loamy sand soil was carried out using acrylic soil columns (ID of 7.4 cm and length of 56 cm). The columns were sealed from the bottom using a nylon membrane (45-μm pore opening) and were mounted on a wooden stand inside the laboratory at a controlled temperature of 22 ± 2 °C. Therefore, there were no significant variations in ambient temperature during the experiment time. The soil was wet-packed (2% w w−1) to a bulk density of 1.5 g cm−3 in 10-cm increments to eliminate particle segregation. The soil was packed to a depth of 50 cm. Five 5TE sensors (METER Group, Pullman, WA, USA) were installed inside the soil column at depths of 10, 20, 30, 40, and 50 cm from the soil surface. The 5TE sensors are designed to measure the volumetric water content, EC, and temperature in soil. Measurements were carried out every 30 s, and the average was calculated every 30 min and was recorded to a connected EM50G micrologger (METER Group, WA, USA). The setup of the soil column, 5TE sensors, and the micrologging system is illustrated in Figure 1.
The total weight of the soil packed inside the column was 3.225 kg. CZ was added at an application rate of 1%. For the macro-sized CZ particles (CZ1), an amount of 6.45 g of the powdered CZ was thoroughly mixed with the top 10 cm of the soil at the time of packing. For the nano-sized CZ (CZ2 and CZ3), a suspension with a concentration of 500 mg L−1 of CZ2 and CZ3 was prepared in deionized (DI) water, and the application was carried out using this suspension over several wetting and drying cycles during the time of the experiment. Four treatments (CZ0 (control soil), CZ1, CZ2, and CZ3) were used in this experiment and each treatment was replicated three times. Therefore, the experimental setup included 12 soil columns that were equipped with 60 5TE sensors, which were connected to 12 EM50G microloggers. The columns were packed on 24 February 2020 and the 5TE sensors were installed at the time of packing. The soil columns were left for 3 weeks to stabilize the soil before the start of the wetting and drying cycles. The amount of water added at each wetting cycle was 921 mL of DI water for the control soil and CZ1 treatments, or of CZ suspensions for the CZ2 and CZ3 treatments. The first wetting cycle started on 20 March 2020. Applications of DI water and CZ suspensions were carried out for 13 additions (wetting/drying cycles) with a time of approximately 10 days in between. The 10-day period was selected as an average irrigation interval in arid and semi-arid regions. After the 13 additions, a time period of 60 days was allowed to examine the impact of CZ particle size on water retention under long periods of drought. This was followed by the final 14 additions of DI water and CZ suspensions on 8 October 2020. Finally, another long drought period of 60 days was allowed and the experiment was terminated on 8 December 2020. The volume of the added DI water and CZ suspensions in each cycle (921 mL) and the number of additions used (14 wetting/drying cycles) were selected to ensure that, by the end of the experiment, the three CZ treatments (CZ1, CZ2, and CZ3) received the same application rate of 1% CZ. The porosity of the soil inside the column was 0.433, indicating that one pore volume would equal 932.7 mL. Therefore, the application of 921 mL of DI water and CZ suspensions ensured that columns were not under saturated conditions throughout the time of the experiment.
2.4. Measurement of the Soil Hydraulic Properties
At the end of the column experiment, the soil column was dissected into 5 segments at 10-cm intervals. The soil water retention at matric potentials of −10, −33, −61, −102, −306, −510, −714, −1020, and −1500 kPa was determined using a pressure plate extractor (Soilmoisture Equipment, Santa Barbara, CA). The soil water characteristics curve (SWCC) was determined by fitting the retention data to the equation of van Genuchten [34]:
where is the volumetric water content (cm3 cm−3) at a matric potential point, h (cm); and are the residual and saturated water content (cm3 cm−3), respectively; (cm−1) is an empirical parameter representing the inverse of the air entry pressure; and n (-) is a shape parameter relating to the pore size distribution. The four parameters of the van Genuchten equation were obtained by fitting measured soil water retention data using a least-squares fitting procedure in the RETC program [35].
Saturated hydraulic conductivity (SHC) was determined using the constant head method [36], and calculations were carried out according to Darcy’s equation:
where is the flux density (m s−1), is the volume of water (m3) flowing through a cross-sectional area (m2) during time (s), is the SHC (m s−1), (m) is the difference in water potential between two points, and (m) is the distance between the two points.
Infiltration of water was measured in the soil collected from of the top 10 cm of the soil column using a mini disk infiltrometer (model M12, 2-cm suction; Decagon Devices, Pullman, WA, USA). The cumulative volume of water infiltrating was recorded every minute for 15 min. Each treatment was replicated three times. Cumulative infiltration was calculated according to Philip [37]:
where I is the cumulative infiltration (cm), S is the sorptivity (cm min−0.5), t is the time (min), and A is a constant related to the hydraulic conductivity.
2.5. Modeling of Water Movement
In light-textured soils, water movement is mostly dominated by vertical flow. Therefore, the HYDRUS-1D package [38] was selected to simulate the transient water flow inside the soil columns. The one-dimensional water flow in variably saturated porous media is described by a modified form of the Richards equation [39]:
where is the function of the volumetric water content (as described in Equation (1)), t is the time (day), is the vertical coordinate axis (cm), is the hydraulic conductivity function (cm day−1), is the matric potential (cm), and is a water sink term (cm day−1) (the water sink term was set to zero in our simulation). The hydraulic conductivity function was described as:
where is the saturated hydraulic conductivity (cm day−1), Se is the relative saturation (-), l is a pore connectivity parameter (estimated to equal 0.5 for many soils), and m is an empirical shape factor for the water retention curve (m = 1 − 1/n, n > 1).
The water balance inside the soil column was described as:
where is the soil water storage (cm), I is irrigation depth (cm day−1), and E is the evaporation (cm day−1). We assumed a constant evaporation rate of 0.1 cm day−1 throughout the simulation period. The HYDRUS-1D code numerically solves the Richards equation using a Galerkin finite element scheme, which requires the prior identification of a set of initial and boundary conditions for the numerical domain. The upper boundary condition was set to an atmospheric boundary condition based on the rates of evaporation and irrigation (irrigation rates were in accordance with the time of application and the amount added of the 14 water additions during the time of the experiment). The lower boundary condition was set to seepage face, which is often selected for laboratory soil columns, and indicates that the bottom of the soil column is exposed to atmosphere (i.e., gravity drainage). If the lower boundary becomes saturated during simulation, the program will apply a zero water potential as the lower boundary and the simulation of water flow will continue accordingly. The initial boundary condition was set to a constant pressure head of −330 hPa, which corresponds with a water content of 0.03 and 0.05 cm3 cm−3 (close to day air conditions) for the control and the soil amended with CZ, respectively. Because of the controlled temperature inside the laboratory, the effect of temperature variations on water flow was not taken into consideration in the simulation process.
2.6. Statistical Evaluations
The accuracy of the HYDRUS-1D model in the simulation of water flow inside the soil columns was evaluated using several statistical indices [40,41], including the root mean square error (RMSE), the mean relative error (MRE), the D-index, and the Nash–Sutcliffe coefficient of efficiency (NSCE), described as:
where and are the measured and simulated values, respectively; is the average measured values; and n is the number of observations.
RMSE close to zero indicates better accuracy in the simulation process. MRE is a measure of bias in the simulation, with positive and negative values indicating underestimation and overestimation, respectively. A D-index value close to 1 indicates better matching between measured and simulated values. NSCE values close to 1 indicate better model performance, while values close to zero or negative indicate lower accuracy.
3. Results and Discussion
3.1. Characterization of Clinoptilolite Zeolite
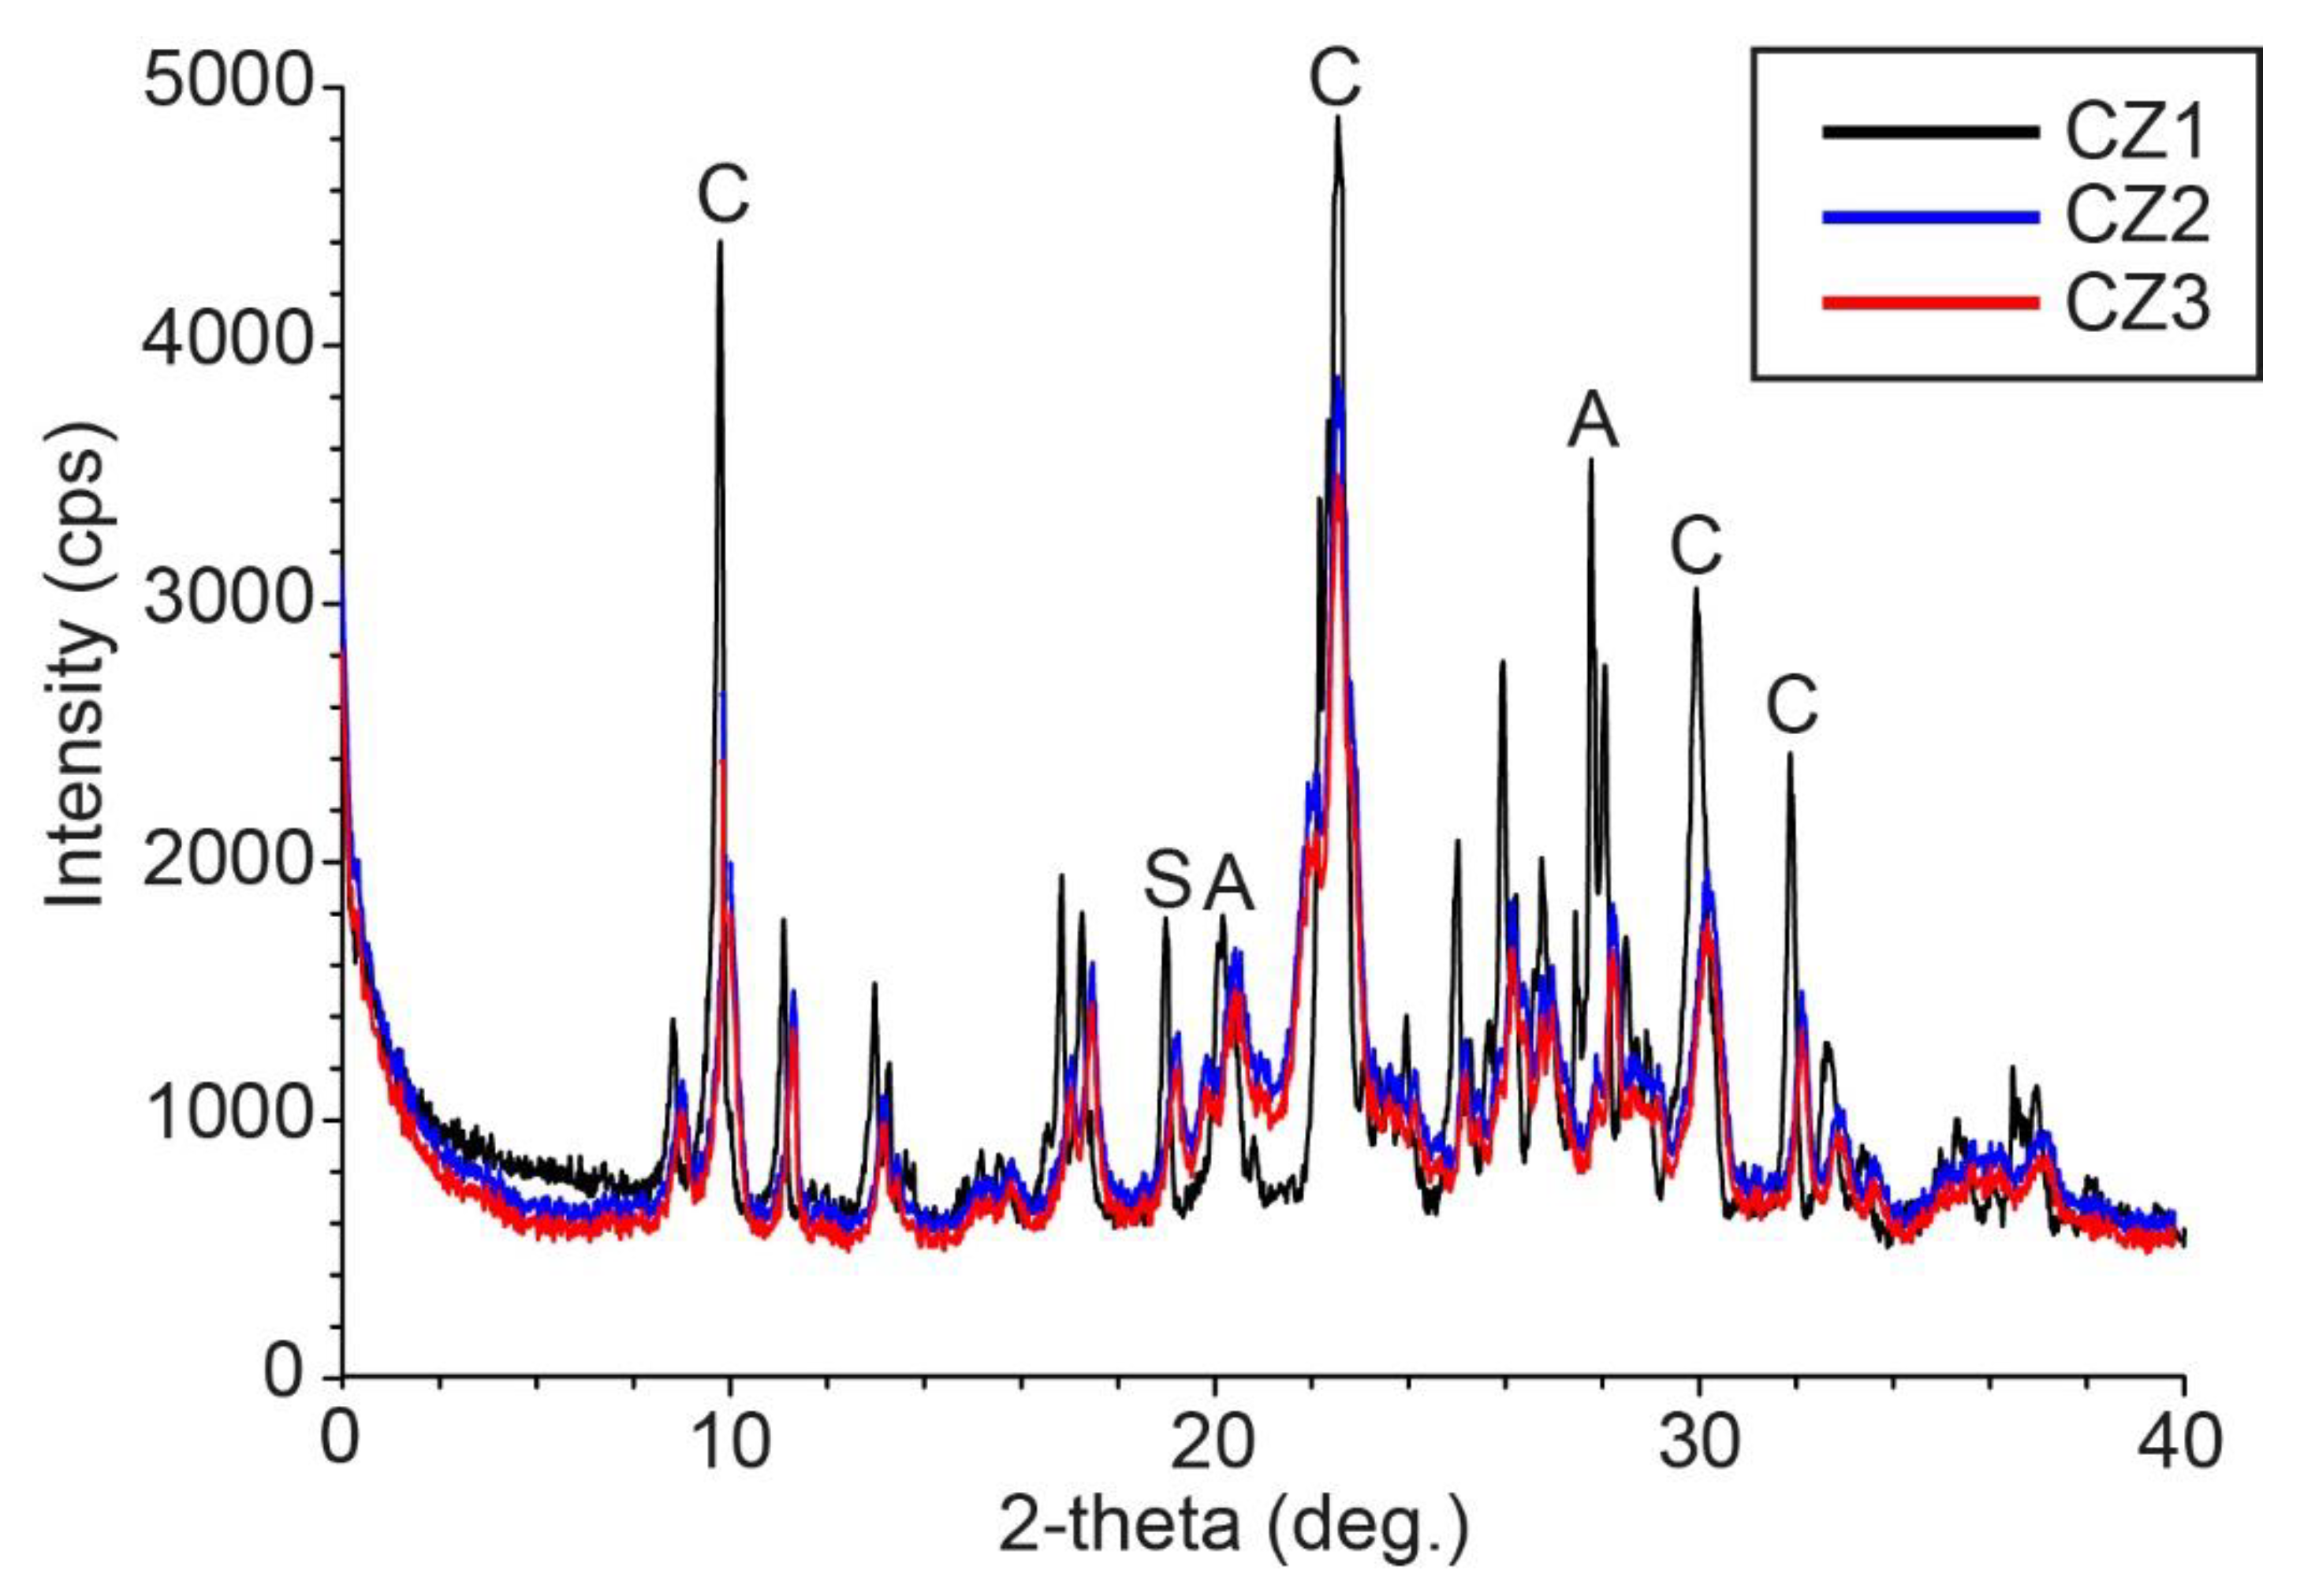
X-ray diffraction (XRD) confirmed that clinoptilolite was the dominant crystalline phase in the CZ sample. Characteristic peaks of macro-CZ (CZ1) were visible at 9.86°, 22.54°, 30.18°, and 32.12° [42]. Less intensive peaks of anorthite and stilbite were also visible at 21.9° and 28.08°, and 19.06°, respectively (Figure 2). Similar XRD patterns were observed for the two particle sizes of nano-CZ (CZ2 and CZ3). However, the comparison between macro- and nano-CZ showed that crystallinity and the intensity of XRD peaks decreased with the nano-CZ. These findings are in agreement with Charkhi et al. [43], who found that the loss in crystallinity and the reduction in the intensity of CZ peaks during the preparation of nano-CZ depend on the conditions of the ball milling, including the milling duration and the ratio of CZ powder to water.
The specific surface area (SSA) of both macro- and nano-CZ particles was 10-fold greater than that of the loamy sand soil (Table 1). No significant (p < 0.05) differences were found in the SSA between CZ1 and CZ2 particles. On the other hand, the SSA of the CZ3 particles was increased by 7.4% and 6.6% compared to the SSA of CZ1 and CZ2 particles, respectively. The SSA of CZ is consistent with reported values in the literature for zeolites. The SSA of two natural zeolitic soils collected from western Turkey, which were mainly composed of clinoptilolite, ranged between 30 and 35 m2 g−1 [44]. In contrast to the relatively small increase in the SSA between macro- and nano-CZ particles, micropore area showed a large increase with the smaller nano-CZ particles. The micropore area of the CZ3 particles was increased by 76.9% and 50.7% compared to that of CZ1 and CZ2 particles, respectively. Microporosity is attributed to the specific crystal structure of CZ [19]. The observed increase in the micropore area with CZ3 indicates that as the size of the CZ becomes smaller, more channels of the alumino-silicate framework structure are being unblocked and, hence, are accessible to be occupied by water molecules and exchangeable cations [45].
The pore volume of CZ particles was approximately 10 times larger than that of the loamy sand soil. The increased pore volume of the CZ particles, along with their low particle density (measured to be 1.1 g cm−3), can act to change the structure of light-textured soils, reduce infiltration and hydraulic conductivity, and, subsequently, increase water availability to plants [21]. The pore size of CZ1, CZ2, and CZ3 was reduced by 8.8%, 8.9%, and 12.6%, respectively, compared to the loamy sand soil (Table 1). Smaller pore size indicates better ability to hold water against gravity forces. This was evident from the larger WHC of the CZ (measured to be 54.3%), which was more than five times larger than that of the loamy sand soil.
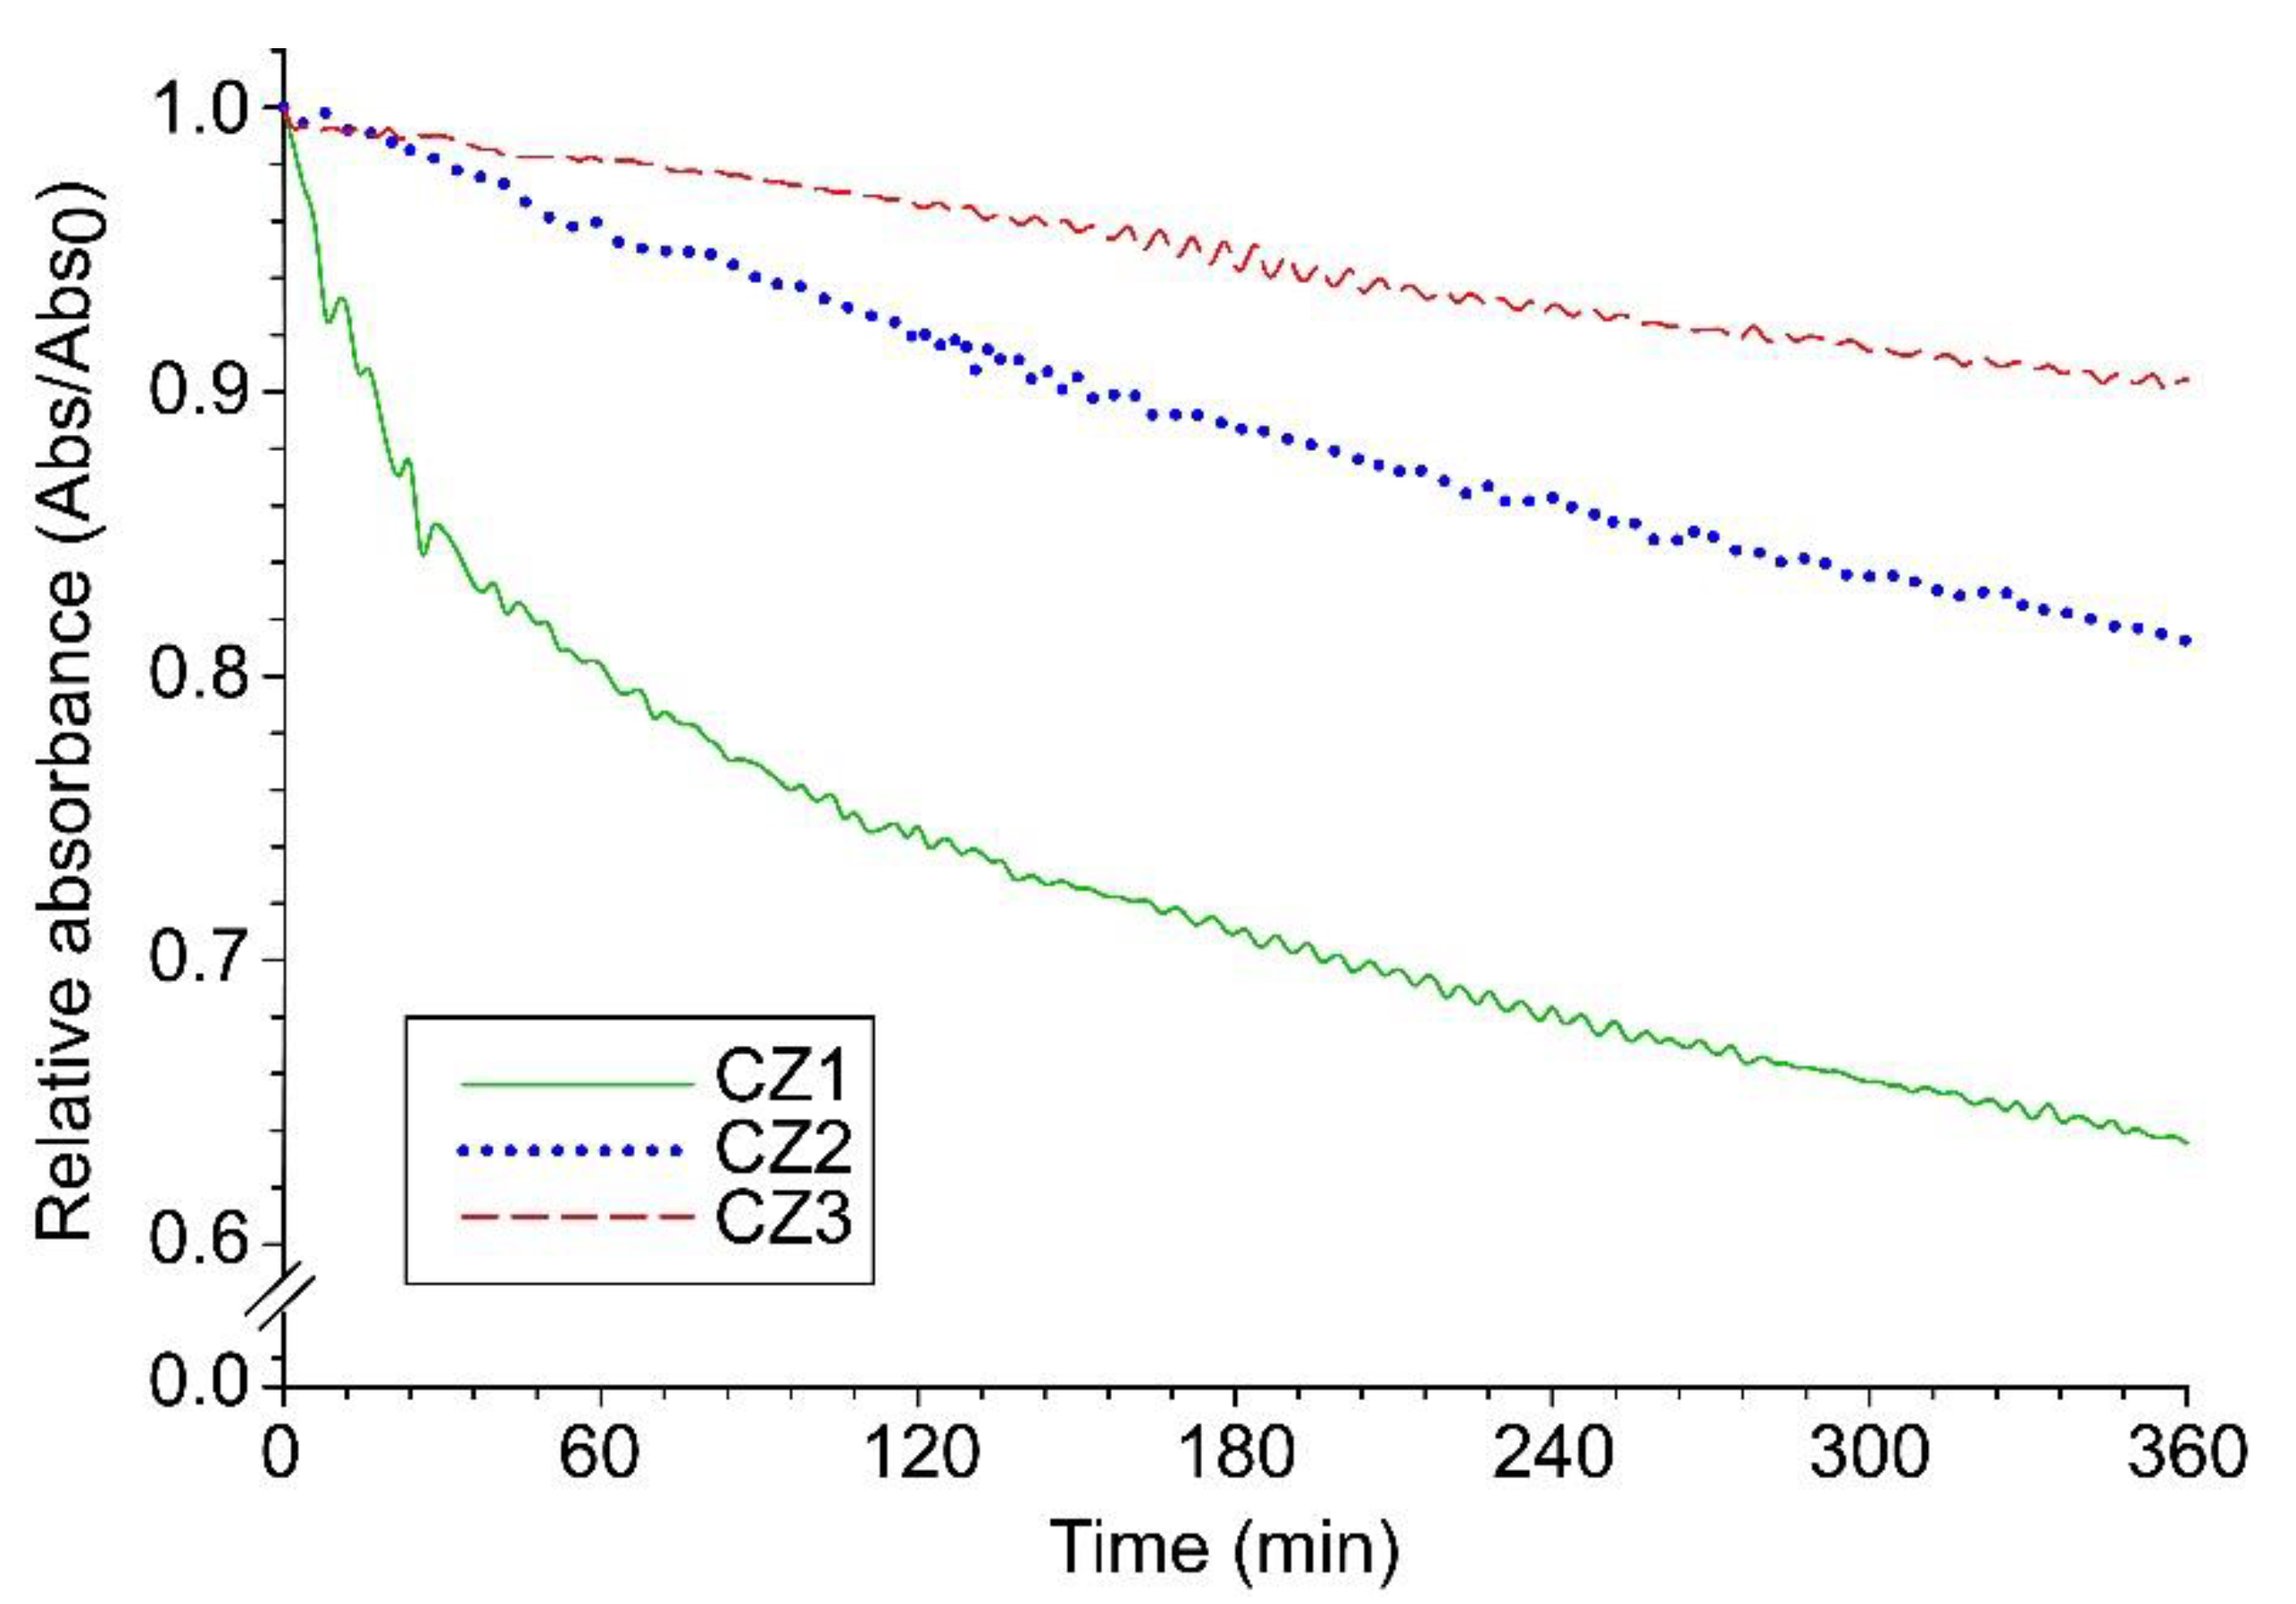
The surface of CZ possesses a negative charge due to isomorphous substitution of Si+4 by Al+3 in the tetrahedral sites [46]. In general, the zeta potential of the macro- and nano-CZ was larger than the zeta potential of the loamy sand soil by 3.5–19.8%. CZ1 showed the lowest (−29.3 mV) zeta potential among the different CZ particles. On the other hand, the maximum zeta potential (−33.9 mV) was observed with CZ3 particles, which was larger than that for CZ1 and CZ2 by 15.7% and 9.0%, respectively. Ersoy and Celik [47] reported that clinoptilolite suspensions in water exhibited a negative surface charge and maintained this nature over a wide range of pH values (4–12). The pH of the CZ suspensions in this study was 7.6 ± 0.1. Zeta potential values reported for the macro- and nano-CZ particles in this study were slightly larger than those of Ozkan et al. [48], who found that the zeta potential of a high-purity clinoptilolite (<38 µm) sample from Sivas, Turkey, was −24 mV at pH 7.6–7.7. This variation could be attributed to the larger particle size of clinoptilolite used compared to the smaller particle size of CZ used in our study. Nano-zeolite particles tend to coagulate over time, forming larger-size aggregates, which would limit the transport of the particles [49]. Investigation of the dynamic aggregation of CZ suspensions revealed that after 1 h of sedimentation, relative absorbance of CZ3 was reduced to only 0.99, whereas the reduction reached 0.8 and 0.96 for CZ1 and CZ2, respectively (Figure 3). The impact of the increase in zeta potential on CZ particle stability was more pronounced after 6 h, with relative absorbance reaching 0.64, 0.83, and 0.91 for CZ1, CZ2, and CZ3, respectively. The larger zeta potential (more negative) on the CZ3 particles indicates better stability and possible enhanced transport to subsurface layers.
3.2. Effect of CZ on Water Retention and Availability
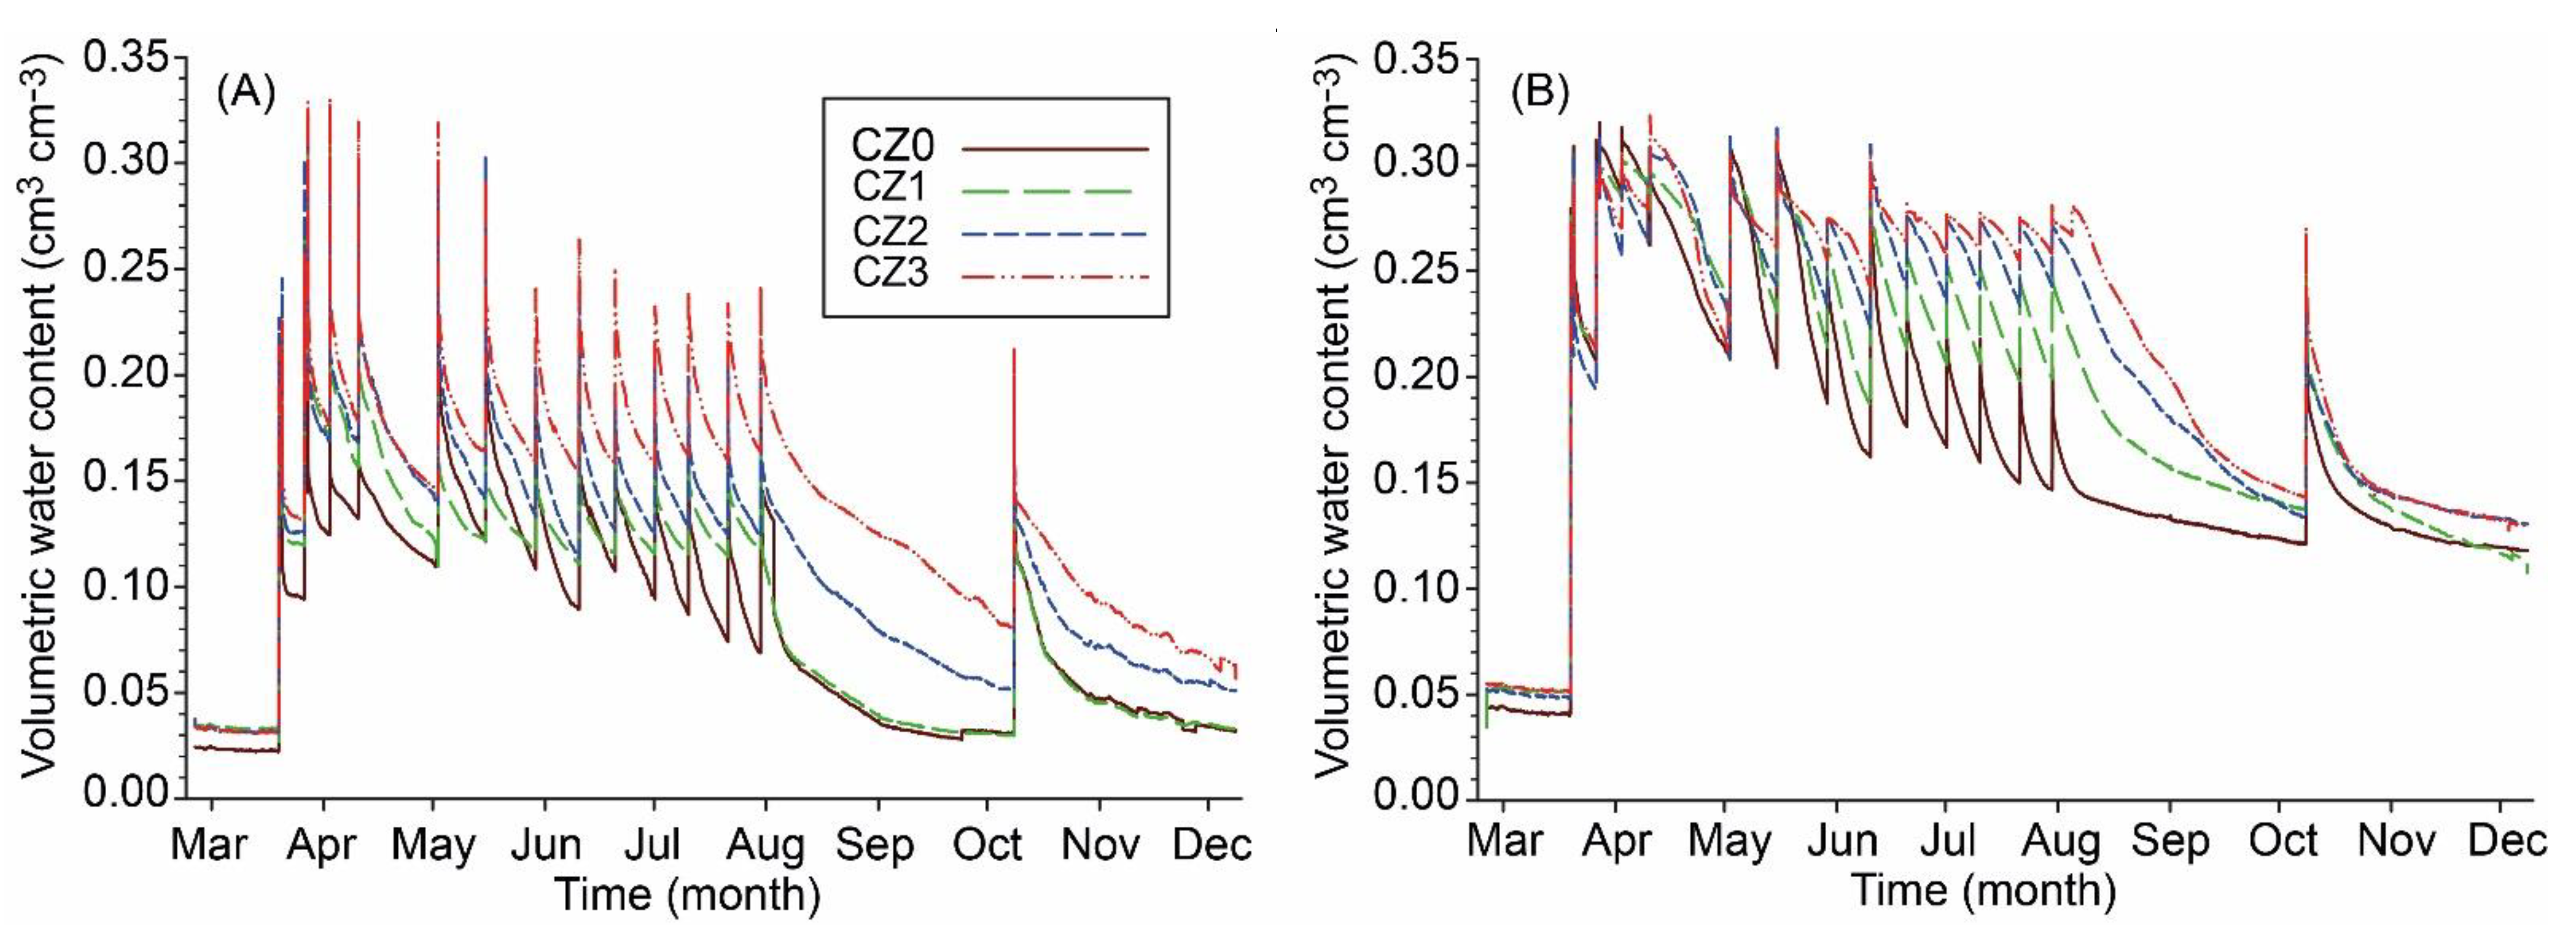
The measured water content (WC) inside the soil columns ranged between 0.05 and 0.32 and 0.1 and 0.33 cm3 cm−3 for the 10- and 50-cm soil depths, respectively (Figure 4). The slightly lower WC in the top 10 cm of the soil column could be attributed to the higher evaporation rates at the soil surface during drying periods. The measured water content reached its maximum approximately 5–6 h after the time of water addition; this was followed by a gradual decrease in water content until the time of the next addition of water. In general, less significant variation in measured WC was observed between the control soil and CZ1. With only few exceptions, the increase in the measured WC between the control soil and CZ1 ranged between 10.9% and 14.8%. In contrast, the measured WC of CZ2 and CZ3 varied considerably compared to the control soil, and the increase in WC ranged between 22.9% and 49.4% and 28.3% and 92.3% compared to the control soil for the CZ2 and CZ3 particles, respectively. The specific values of the increase in WC varied based on the elapsed time between water additions (drying time). The increase in WC due to the presence of the CZ amendment was lower during the first 13 water additions (short drying interval of 10 days). For example, on April 15, the measured WC at 10 cm increased by 23.1%, 33.4%, and 33.9% compared to the control soil for the CZ1, CZ2, and CZ3 particles, respectively. On the same date, the increase in measured WC at 50 cm was less profound and reached 4.4%, 9.8%, and 10.4% compared to the control soil for the CZ1, CZ2, and CZ3 particles, respectively. On the other hand, after the two long drying periods implemented on August 1 and October 6, a much larger increase in WC was observed, especially with the CZ2 and CZ3 particles. For instance, on September 1, one month after the start of the drying period, the measured WC at 10 cm was two- and threefold higher compared to the control soil for CZ2 and CZ3, respectively (Figure 4A). The increase in WC on the same date at 50 cm, again, was lower and reached 35.5% and 49.8% for the CZ2 and CZ3 particles, respectively (Figure 4B). The increase in WC with the application of CZ in this study is consistent with other research on zeolite amendments to light-textured soils, which showed an increase in WC and available water by 60% and 110%, respectively [27,29]. The increase in WC during drought periods with the application of CZ has been reported by several researchers, noting that the application of zeolite in drought periods has a significant effect on the physiological characteristics of the plants and on crop yield [4,50,51].
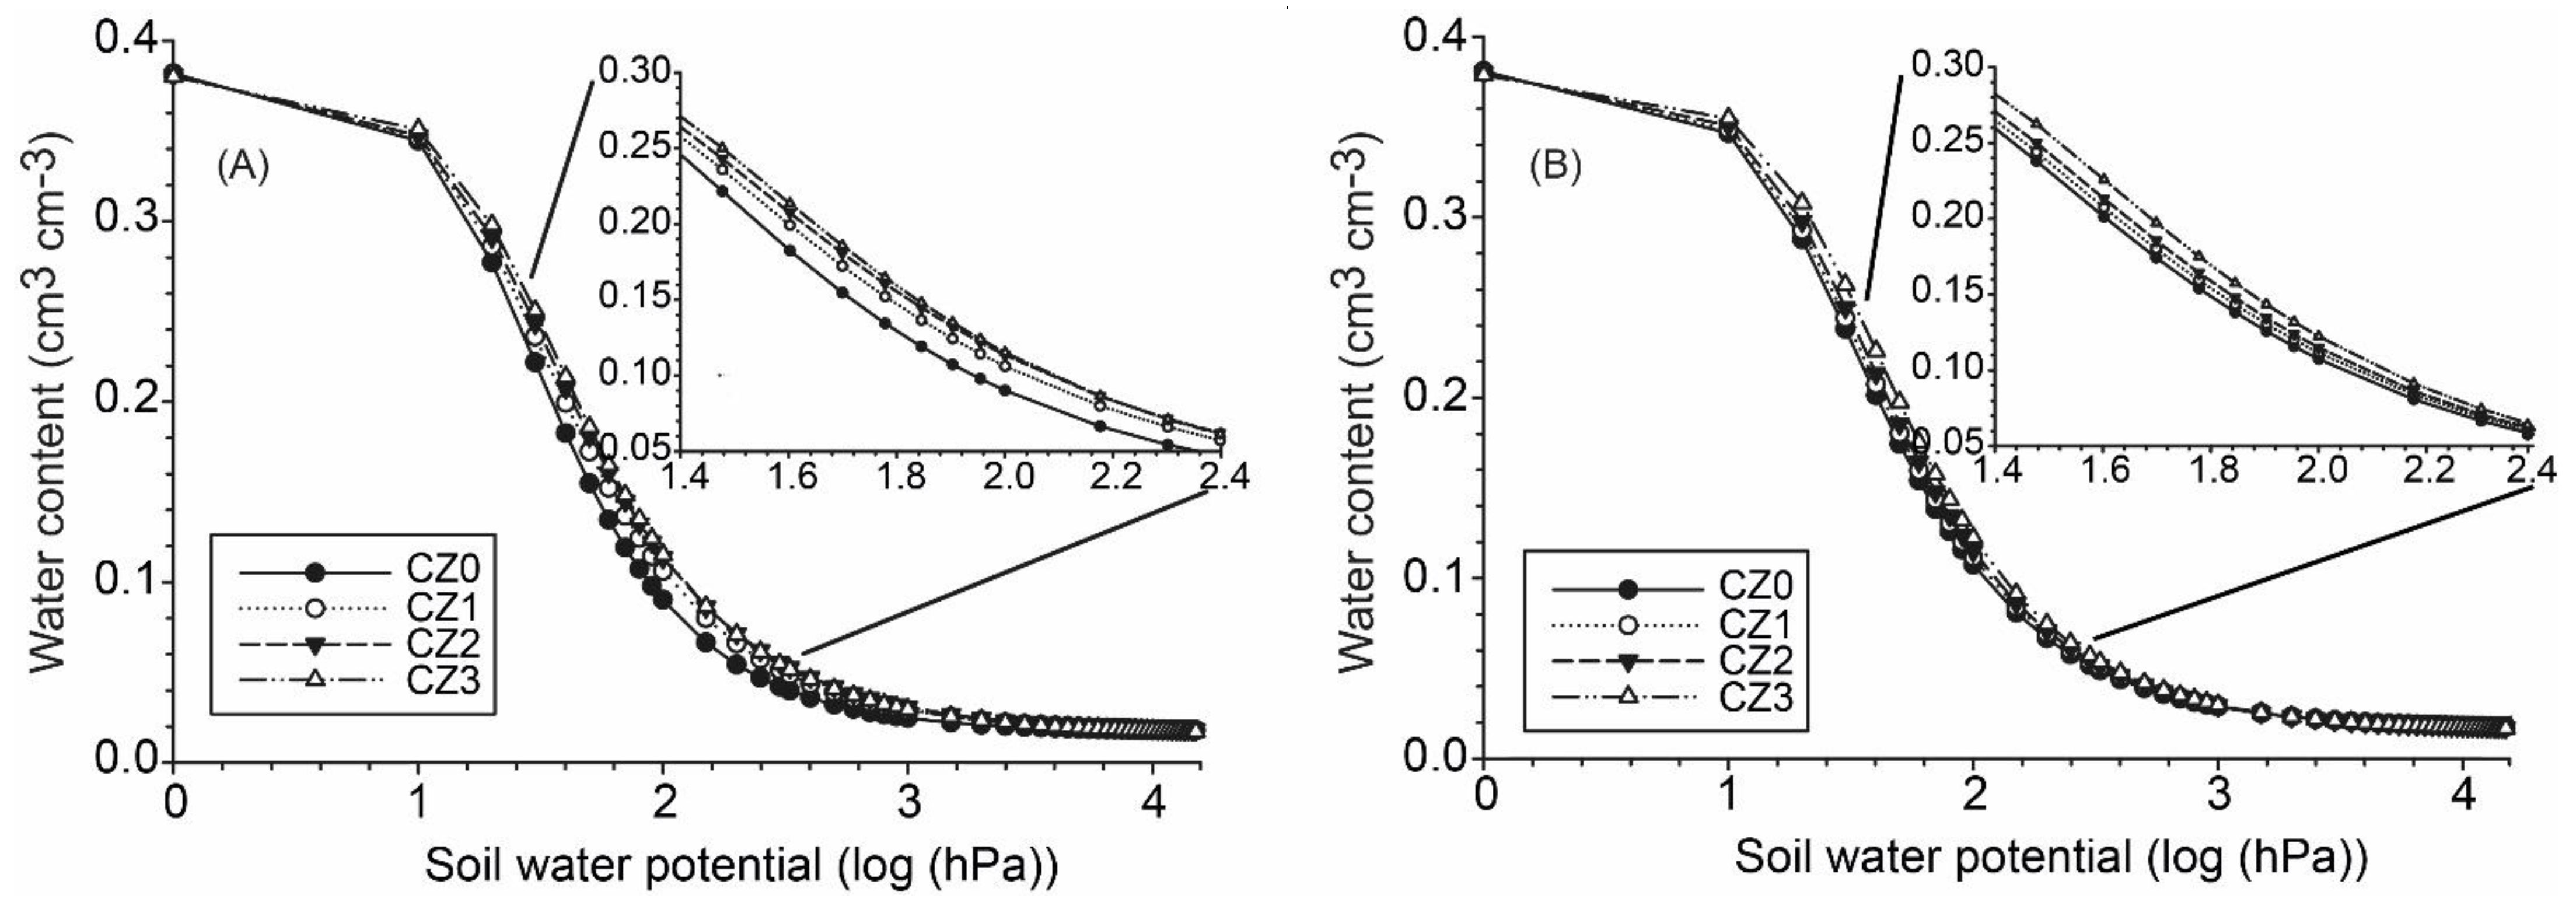
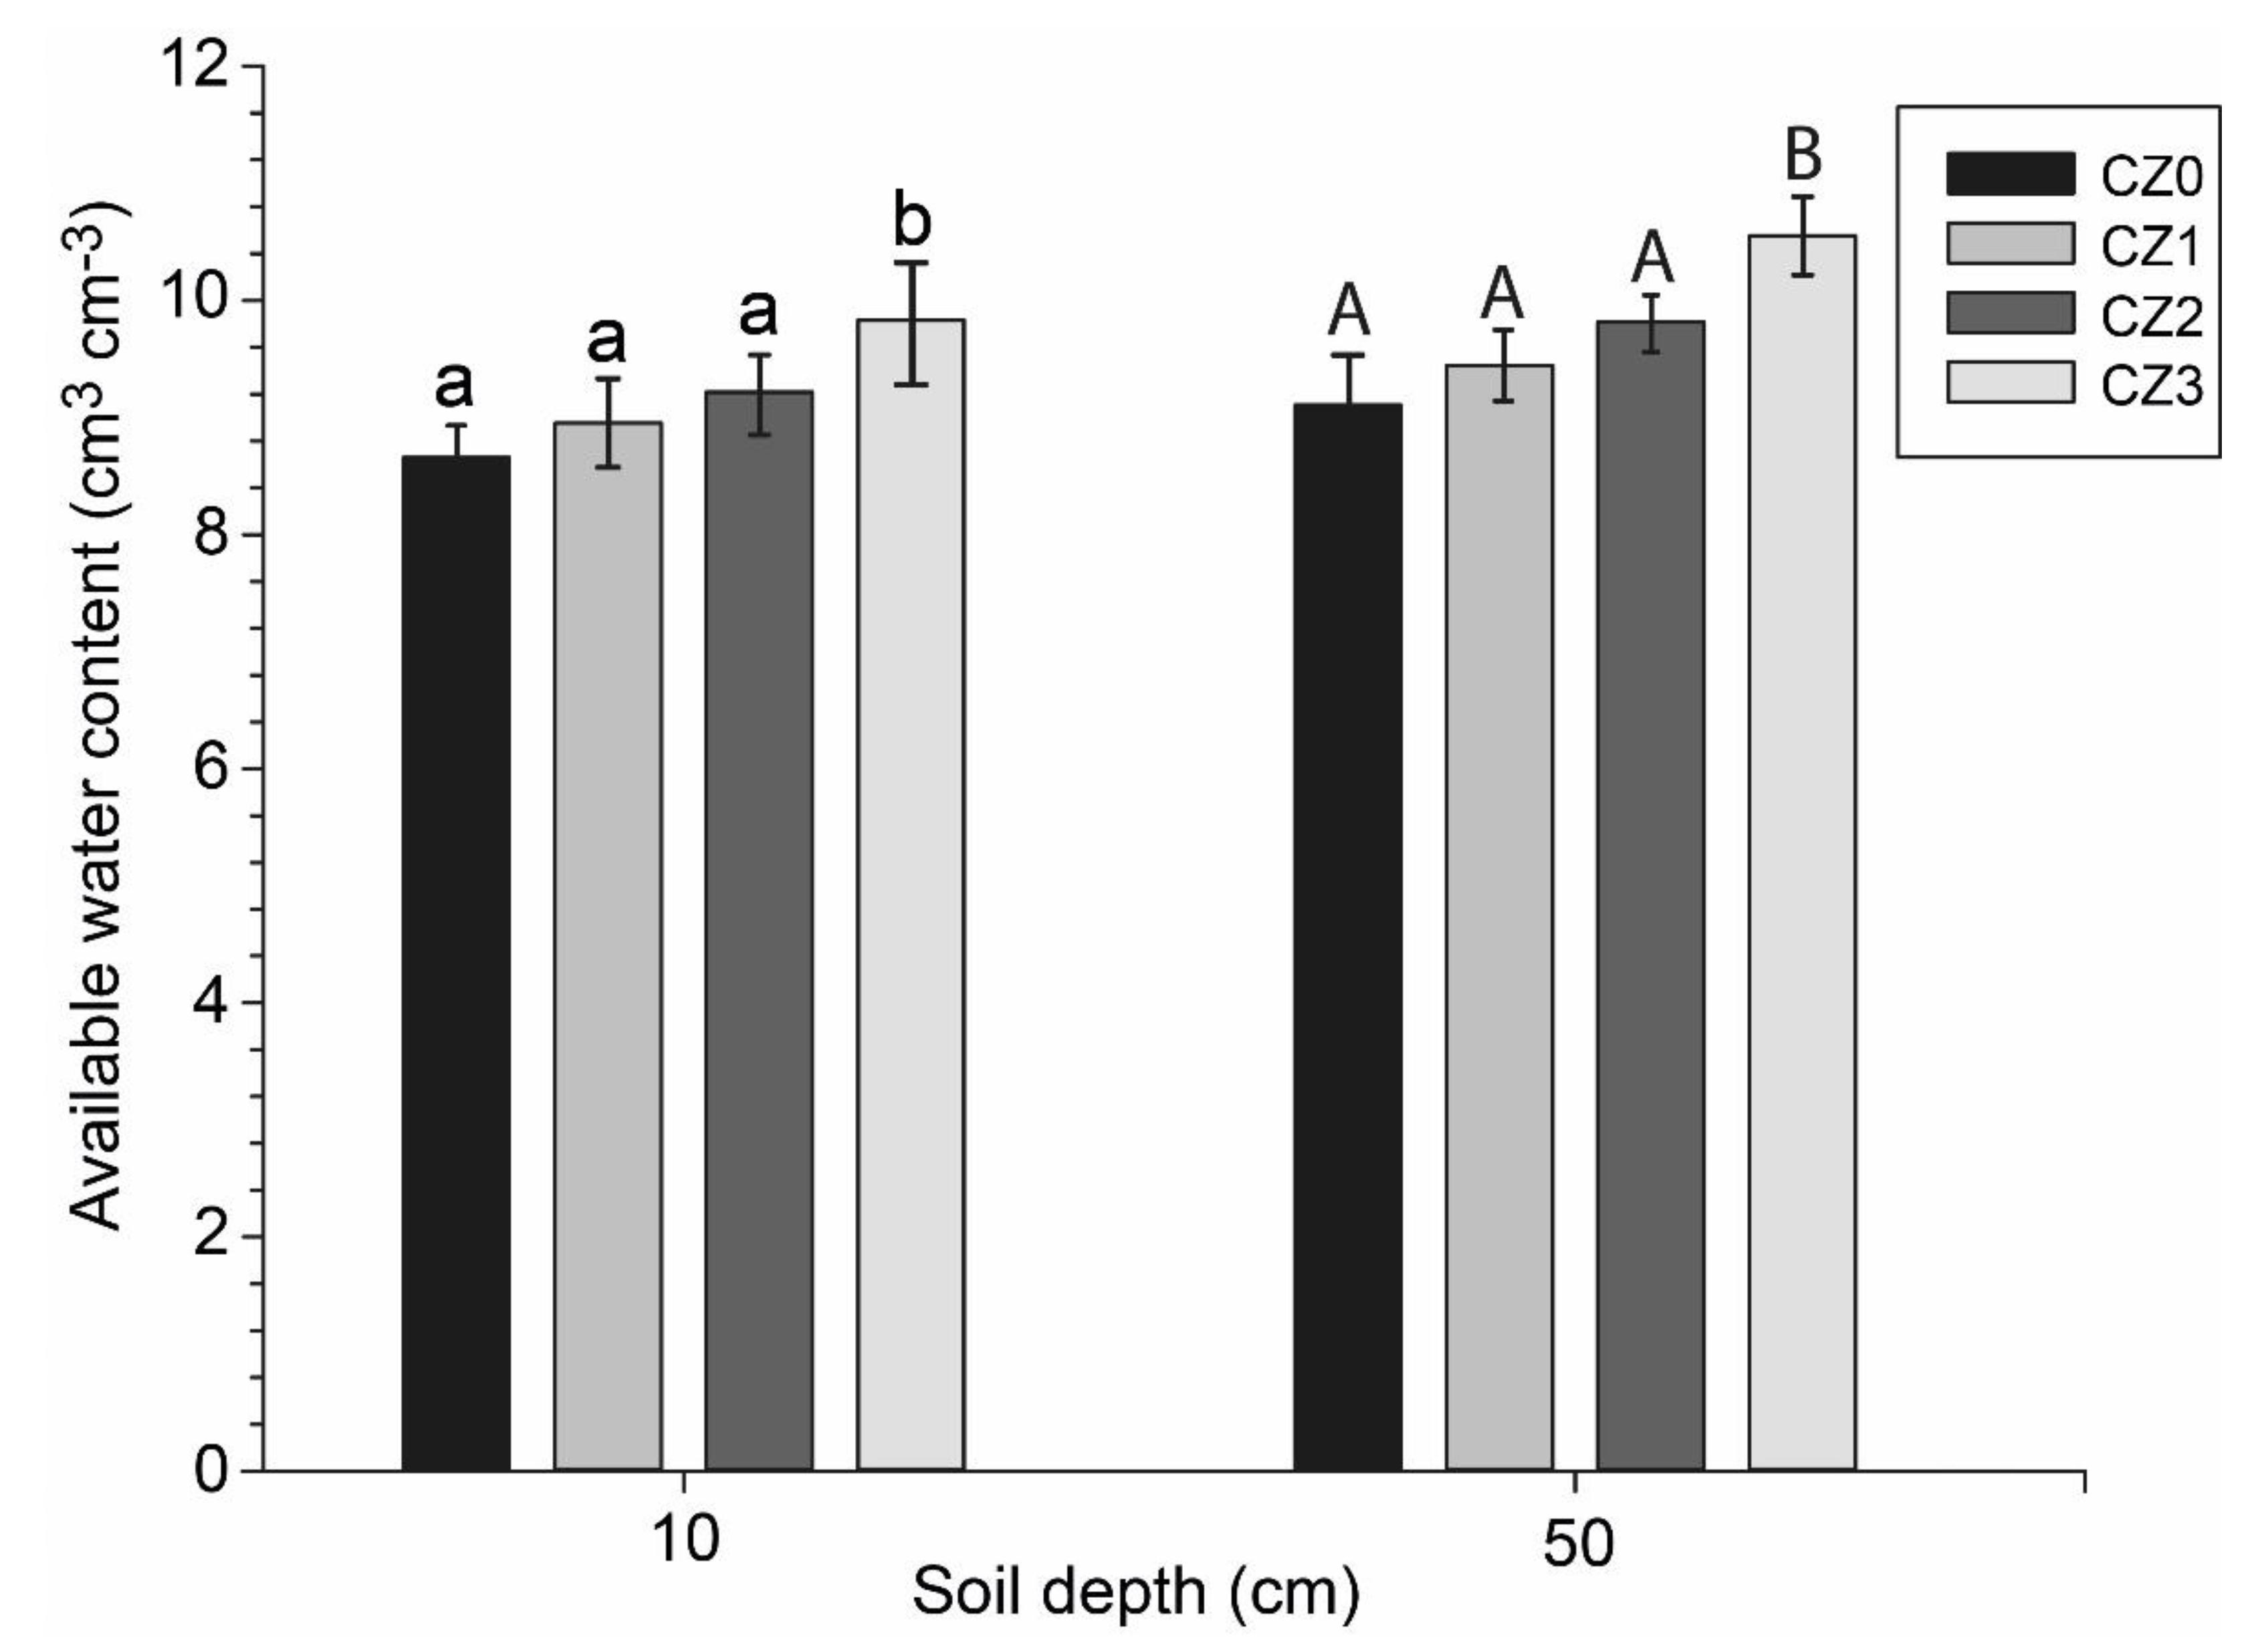
Measurement of the soil moisture characteristics curve (SMCC) showed that the maximum enhancement of water retention with the application of macro- and nano-CZ was observed at a matric potential between −140 and −240 hPa (Figure 5, small insert). At −200 hPa, the water content in the top 10 cm of the soil column was increased by 17.6%, 25.9%, and 27.7% compared to the control soil for the CZ1, CZ2, and CZ3 particles, respectively (Figure 5A). For the bottom depth at 50 cm, the increase in water content with the application of the macro- and nano-CZ was lesser and reached 3.8%, 7.1%, and 13.9% compared to the control soil for the CZ1, CZ2, and CZ3 particles, respectively (Figure 5B). No statistically significant variations (P < 0.05) were observed between the control soil and the macro- and nano-CZ at lower matric potential (−15,000 hPa, i.e., wilting point (WP)). The fact that no increase in WC was observed at the WP indicates that the application of macro- and nano-CZ will have a final positive impact on the available water, which will enhance plant growth and crop yield. Nevertheless, measurements of available water showed that variations between the control soil and both CZ1 and CZ2 particles were not statistically significant (P< 0.05), and only a slight increase that ranged, on average, between 3.6% and 7.1% was observed for the CZ1 and CZ2 particles, respectively (Figure 6). In contrast, the increase in available water with nano-CZ (CZ3) compared to the control soil reached 13.5% and 15.8% for the 10- and 50-cm soil depths, respectively. An increase up of to 50% in the water available for plants in sandy soils due to the application of zeolite amendment was previously reported [52]. It is worth mentioning that despite the large increase in WC with the application of CZ (maximum of 14.8%, 49.4%, and 92.3% for CZ1, CZ2, and CZ3, respectively), the average increase in available water reached only 3.6%, 7.1%, and 14.7% for the CZ1, CZ2, and CZ3 particles, respectively. This could be attributed to the distribution amount between primary microporosity arising from the specific crystal structure of the CZ and secondary mesoporosity formed through the connection between the different particles in the zeolite rocks. Microporosity is important for increasing the ability of light-textured soils to retain water. However, water present in the micropores could be held so tightly such that it is difficult for the plants to obtain this water [19]. Mesopores provide better aeration and drainage conditions, which facilitate water availability to plants. Zeolites possessing adequate amounts of both types of porosity (e.g., CZ) are considered an idealized amendment to enhance the physical properties of soil and to increase available water for plants [20].
3.3. Effect of CZ on Infiltration Rate and Hydraulic Conductivity
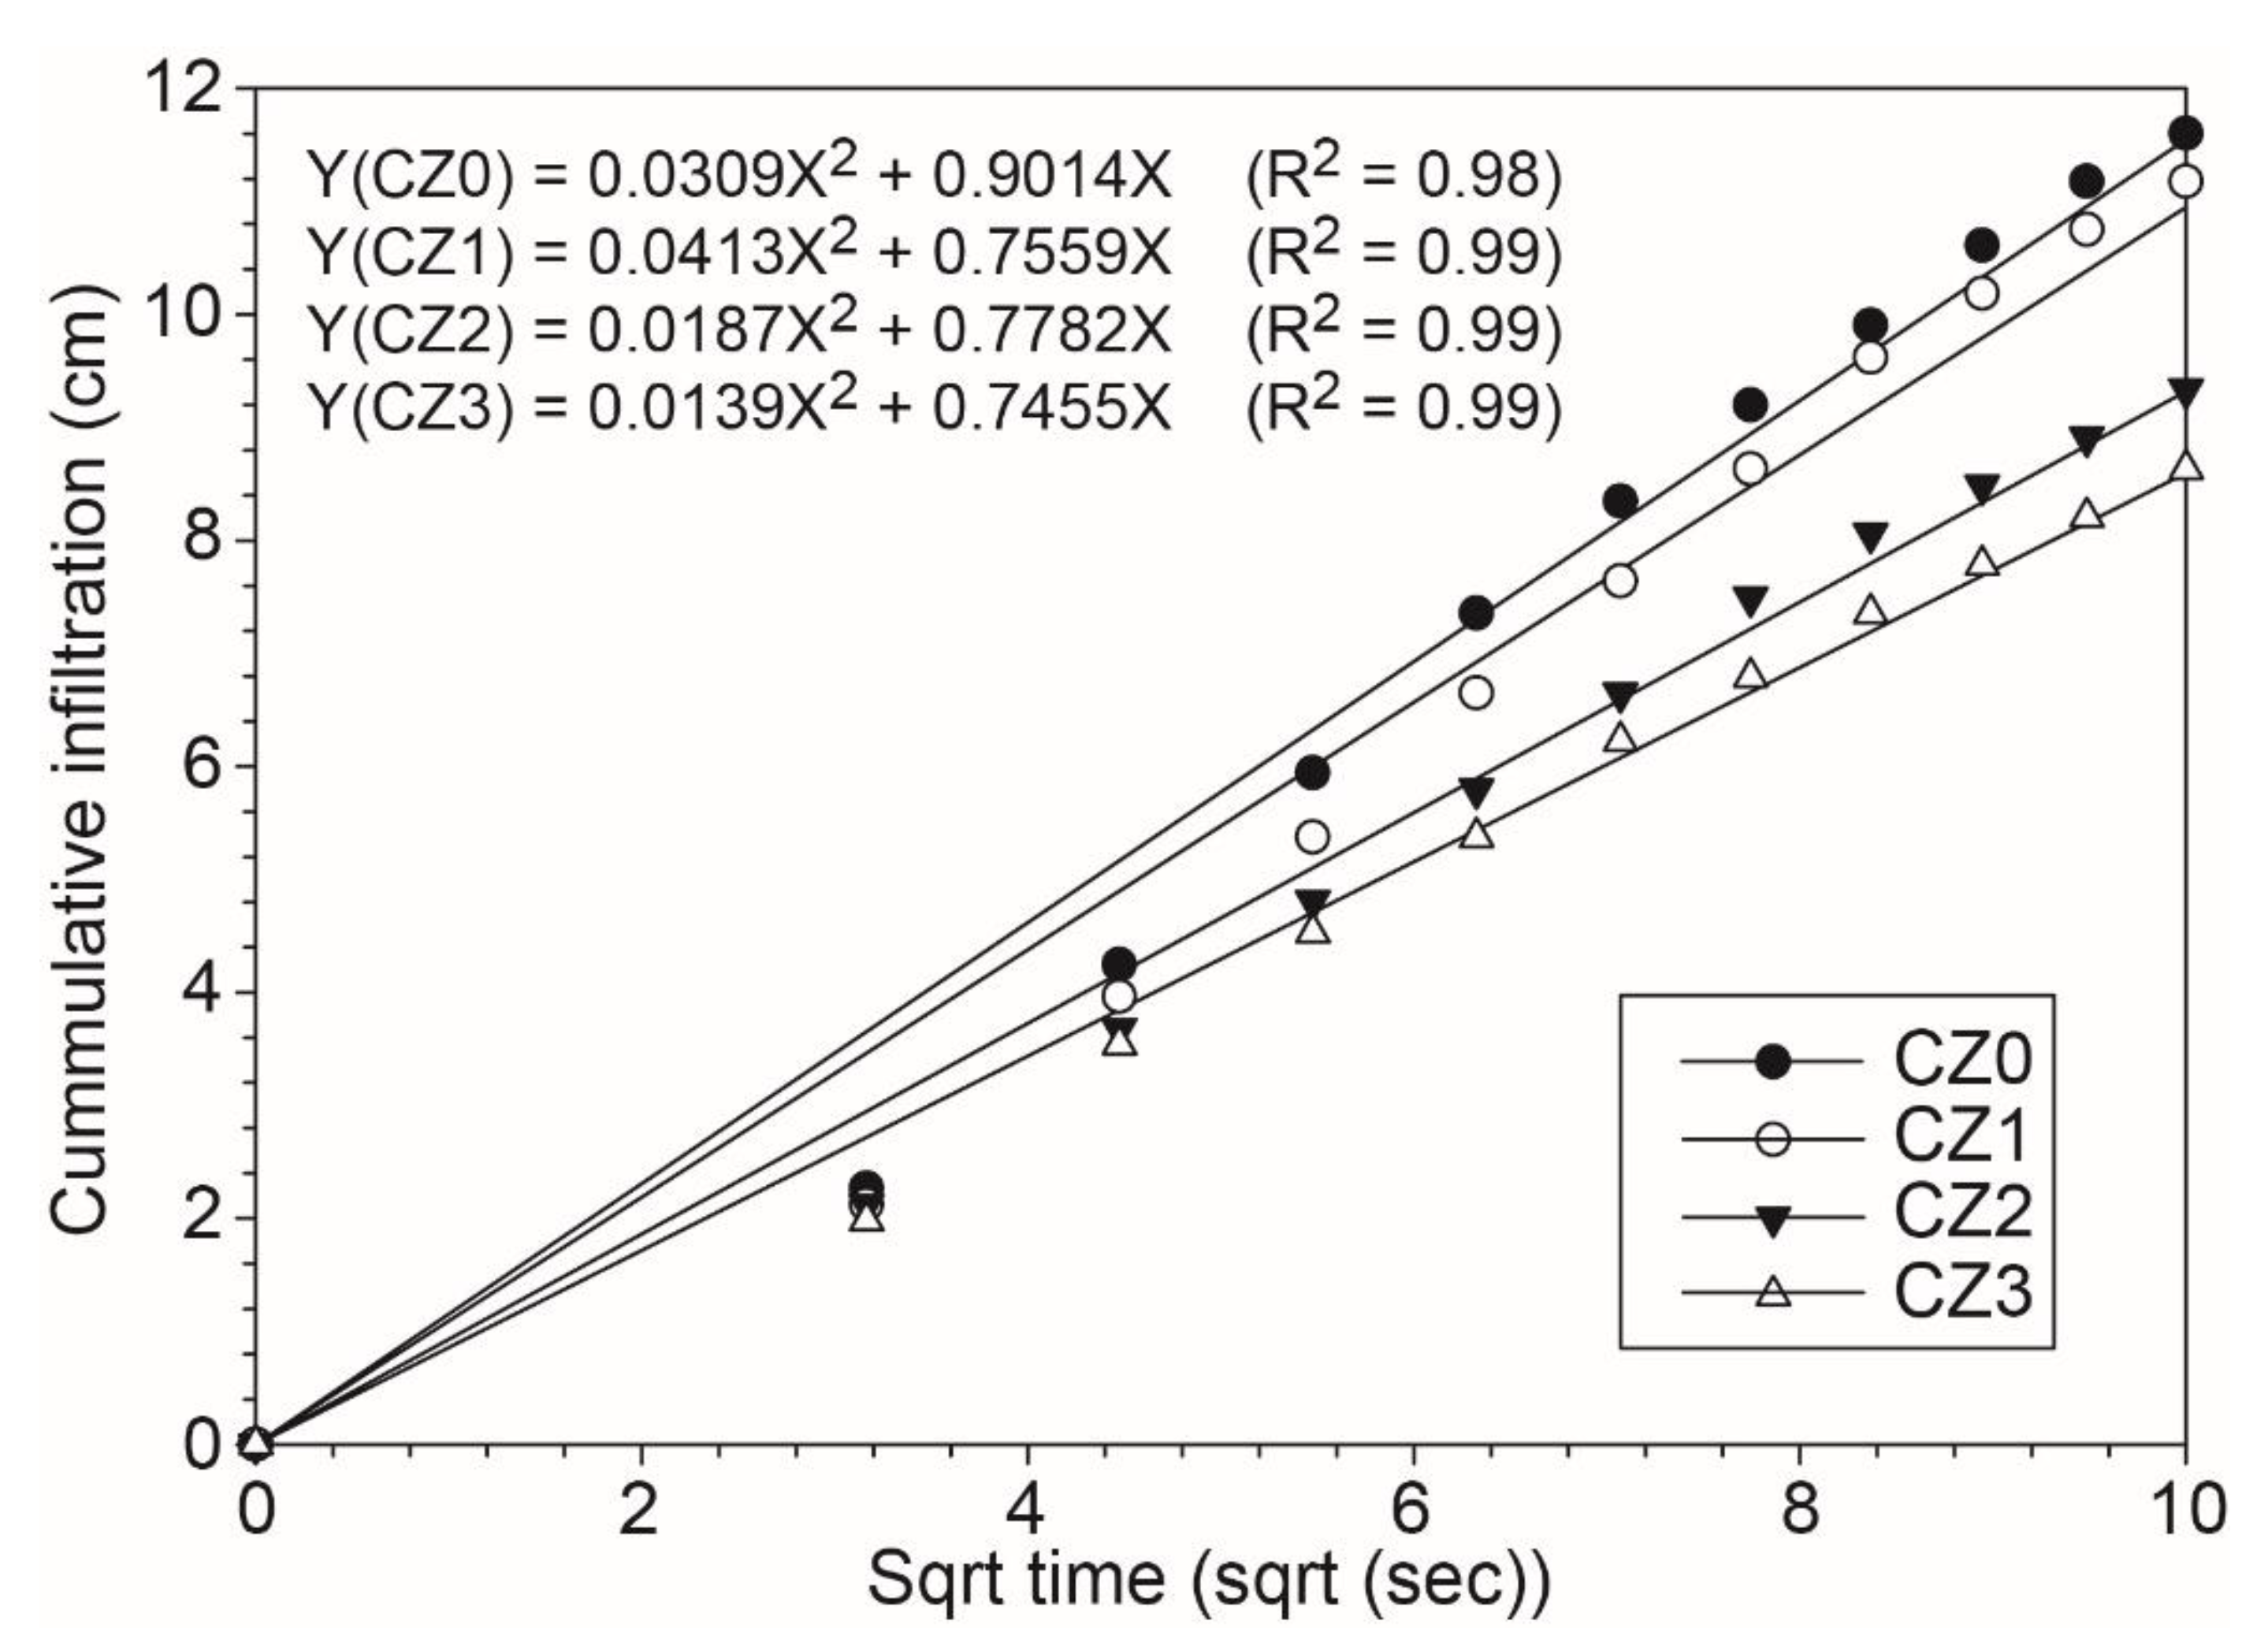
Cumulative infiltration was represented mathematically by fitting a second-order polynomial to measured cumulative infiltration versus the square root of time (t0.5). Cumulative infiltration was reduced in the presence of macro- and nano-CZ. The decrease in cumulative infiltration compared to the control soil reached 3.7%, 19.5%, and 25.6% for the CZ1, CZ2, and CZ3 particles, respectively (Figure 7). Smaller sizes of CZ particles will most likely reduce the macropore channels inside the soil and, subsequently, reduce infiltration [53]. The values of sorptivity as determined by Philip’s equation ranged between 0.75 and 0.78 (cm s0.5) for the soil amended with the macro- and nano-CZ particles (Figure 7). Sorptivity is the ability of soil to draw water, which is a function of the capillary and adsorption forces [54]. Therefore, larger sorptivity indicates larger cumulative infiltration, particularly during the initial time of infiltration. The control soil showed higher sorptivity (0.9 cm s0.5), hence the larger cumulative infiltration that was observed compared to the soil amended with the macro- and nano-CZ particles. The values of sorptivity in the control soil and in soils amended with the macro- and nano-CZ particles are consistent with previous measurements of WC, since sorptivity usually decreases with the increase in WC.
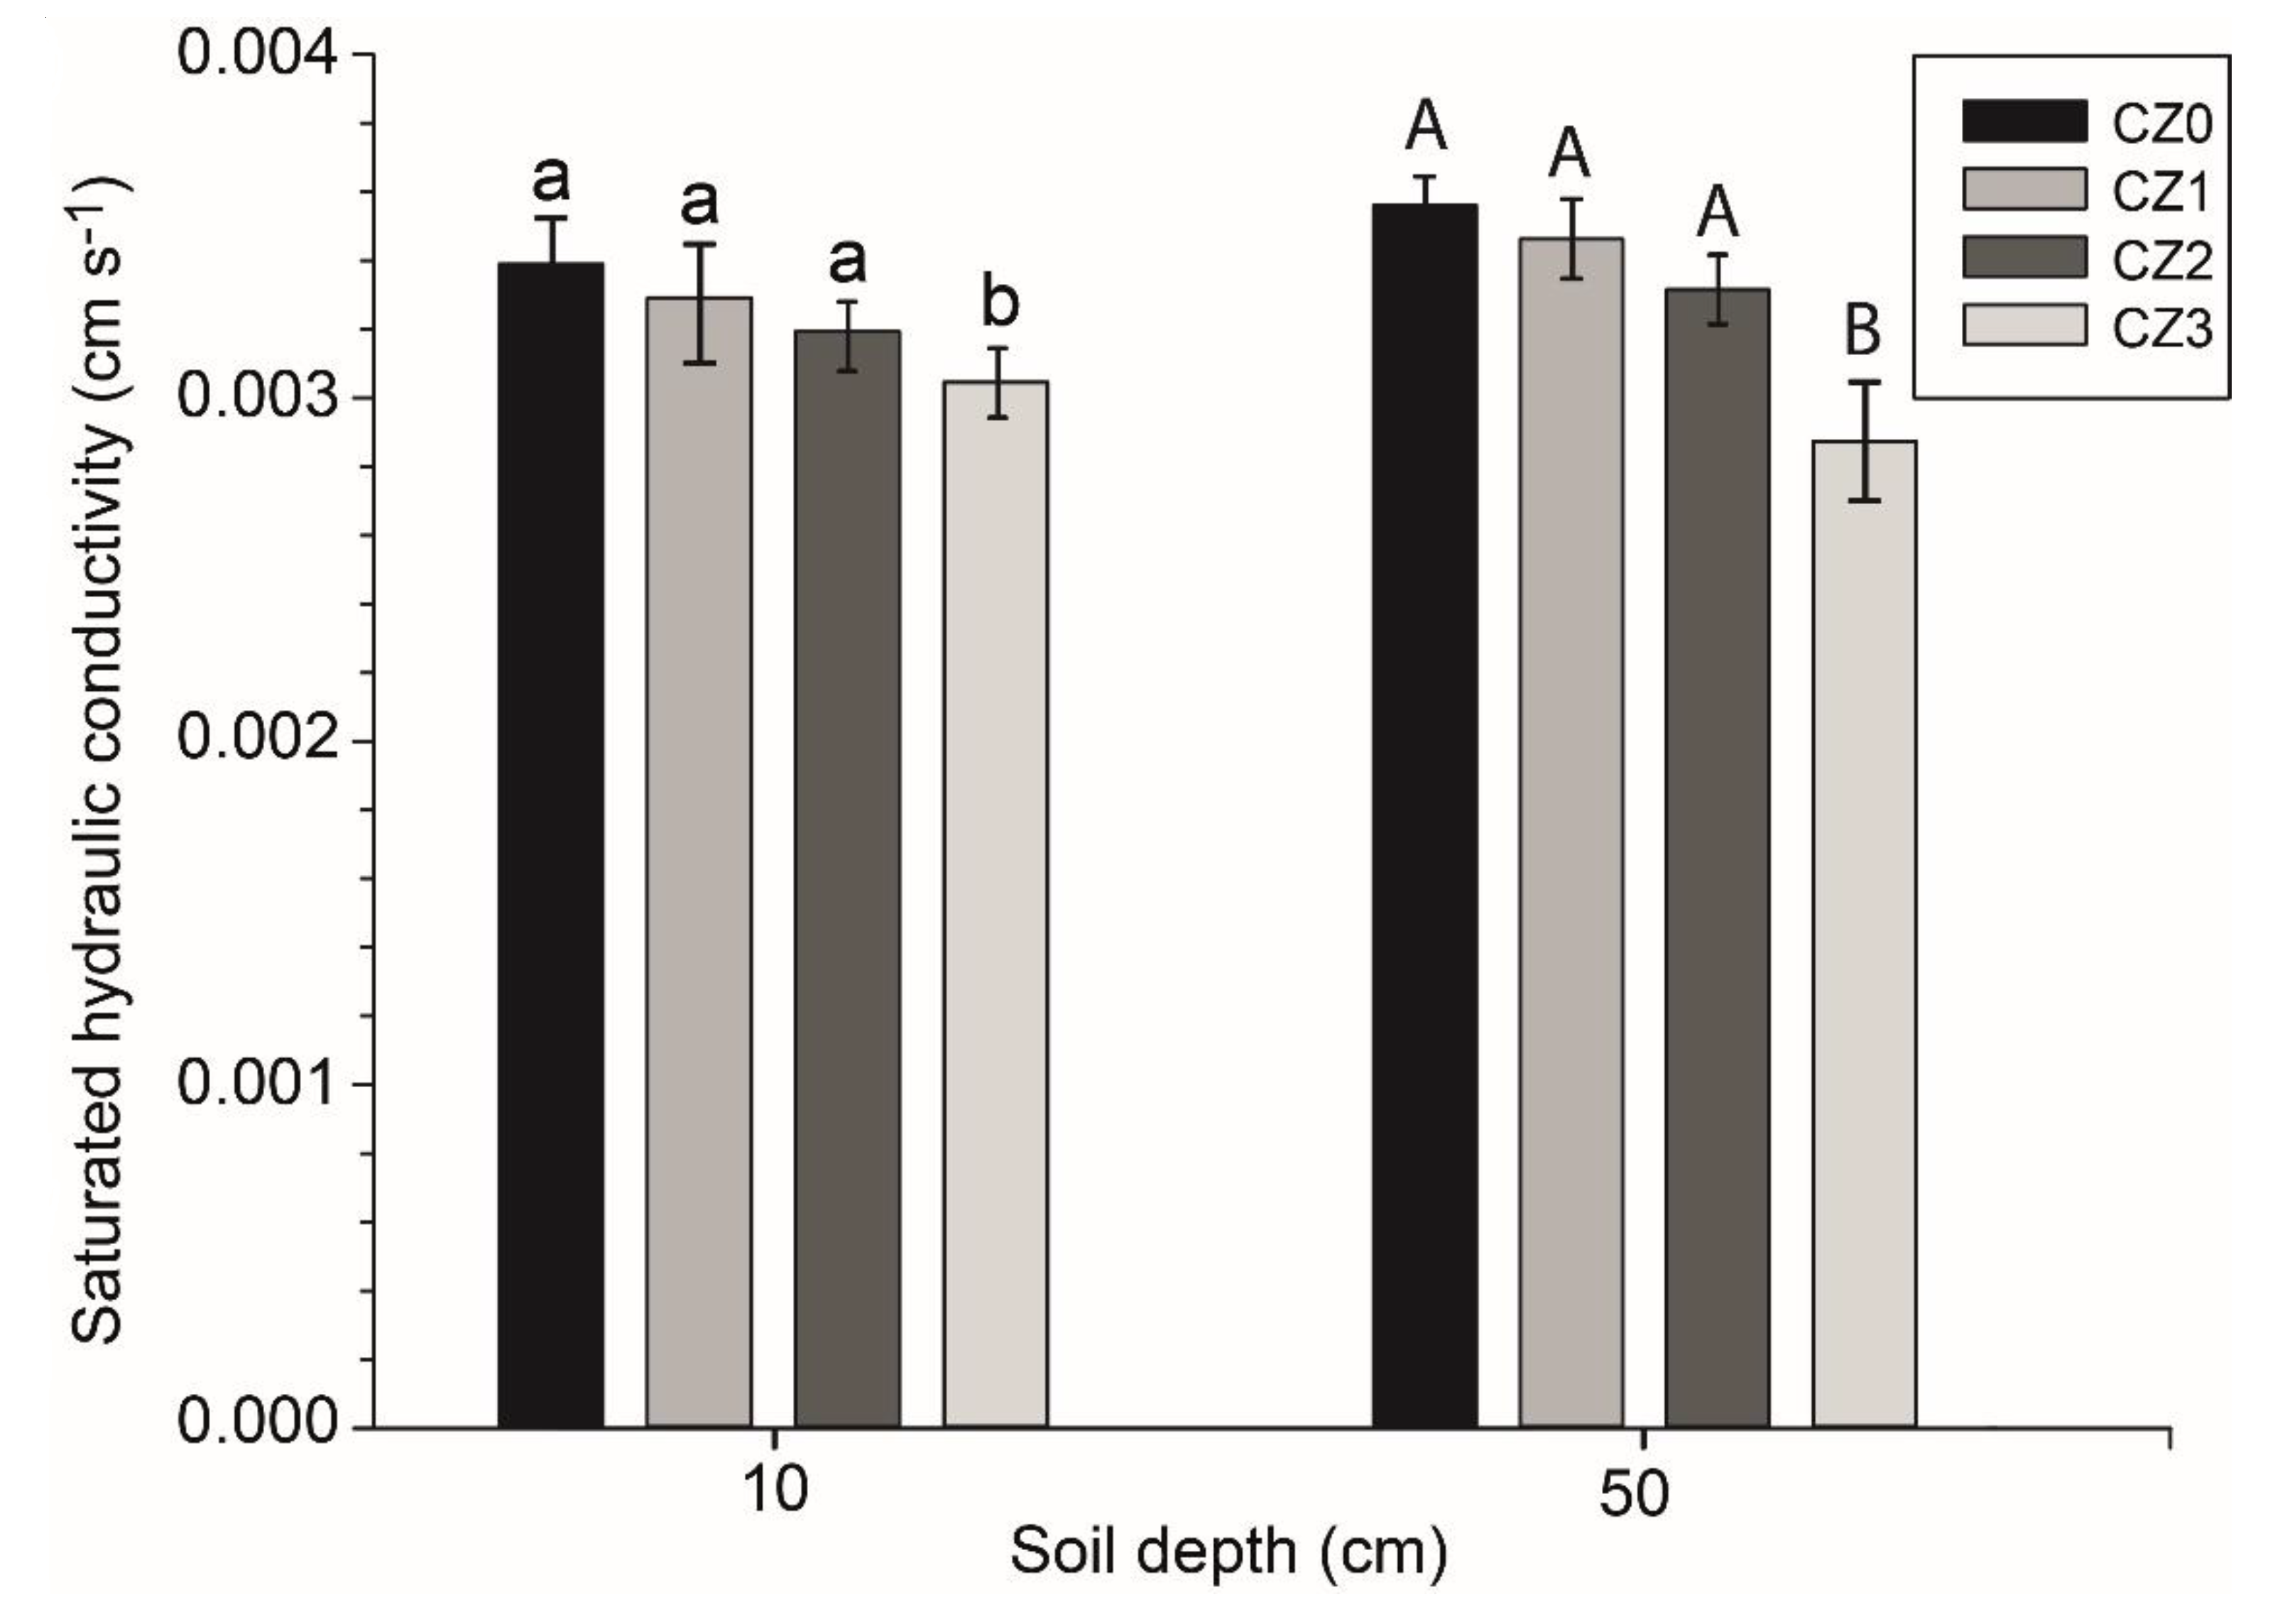
The saturated hydraulic conductivity (Ksat) of the control soil was also decreased with the application of the macro- and nano-CZ. However, only the soil that was amended with CZ3 showed statistically significant differences (P < 0.05), and the reduction in Ksat reached 10.1% and 19.3% compared to the control soil at the soil depths of 10 and 50 cm, respectively (Figure 8). The reduction in Ksat with the CZ1 and CZ2 soils was much lower and reached an average of 2.9% and 6.4% compared to the control soil, respectively. Because of the high values of Ksat in light-textured soils, proper water management of such soils requires frequent irrigation to compensate for the water lost by deep drainage [20]. Amending light-textured soils with CZ can reduce the high values of Ksat and help to conserve water used for irrigation. The results showed that nano-CZ (CZ3) was more efficient in the reduction in Ksat of the loamy sand soil used in this research. Application of CZ of a finer particle size to light-textured soils can reduce the average particle size in the CZ–soil mixture, which would limit water pathways and eventually reduce Ksat [23]. Our results are in agreement with Huang and Petrovic [12], who reported that amending sandy soils, particularly in arid regions, with CZ of finer particle sizes (0.25–0.047 mm) significantly reduced Ksat and increased the capacity of the soil to hold water.
3.4. Simulation of Volumetric Water Content
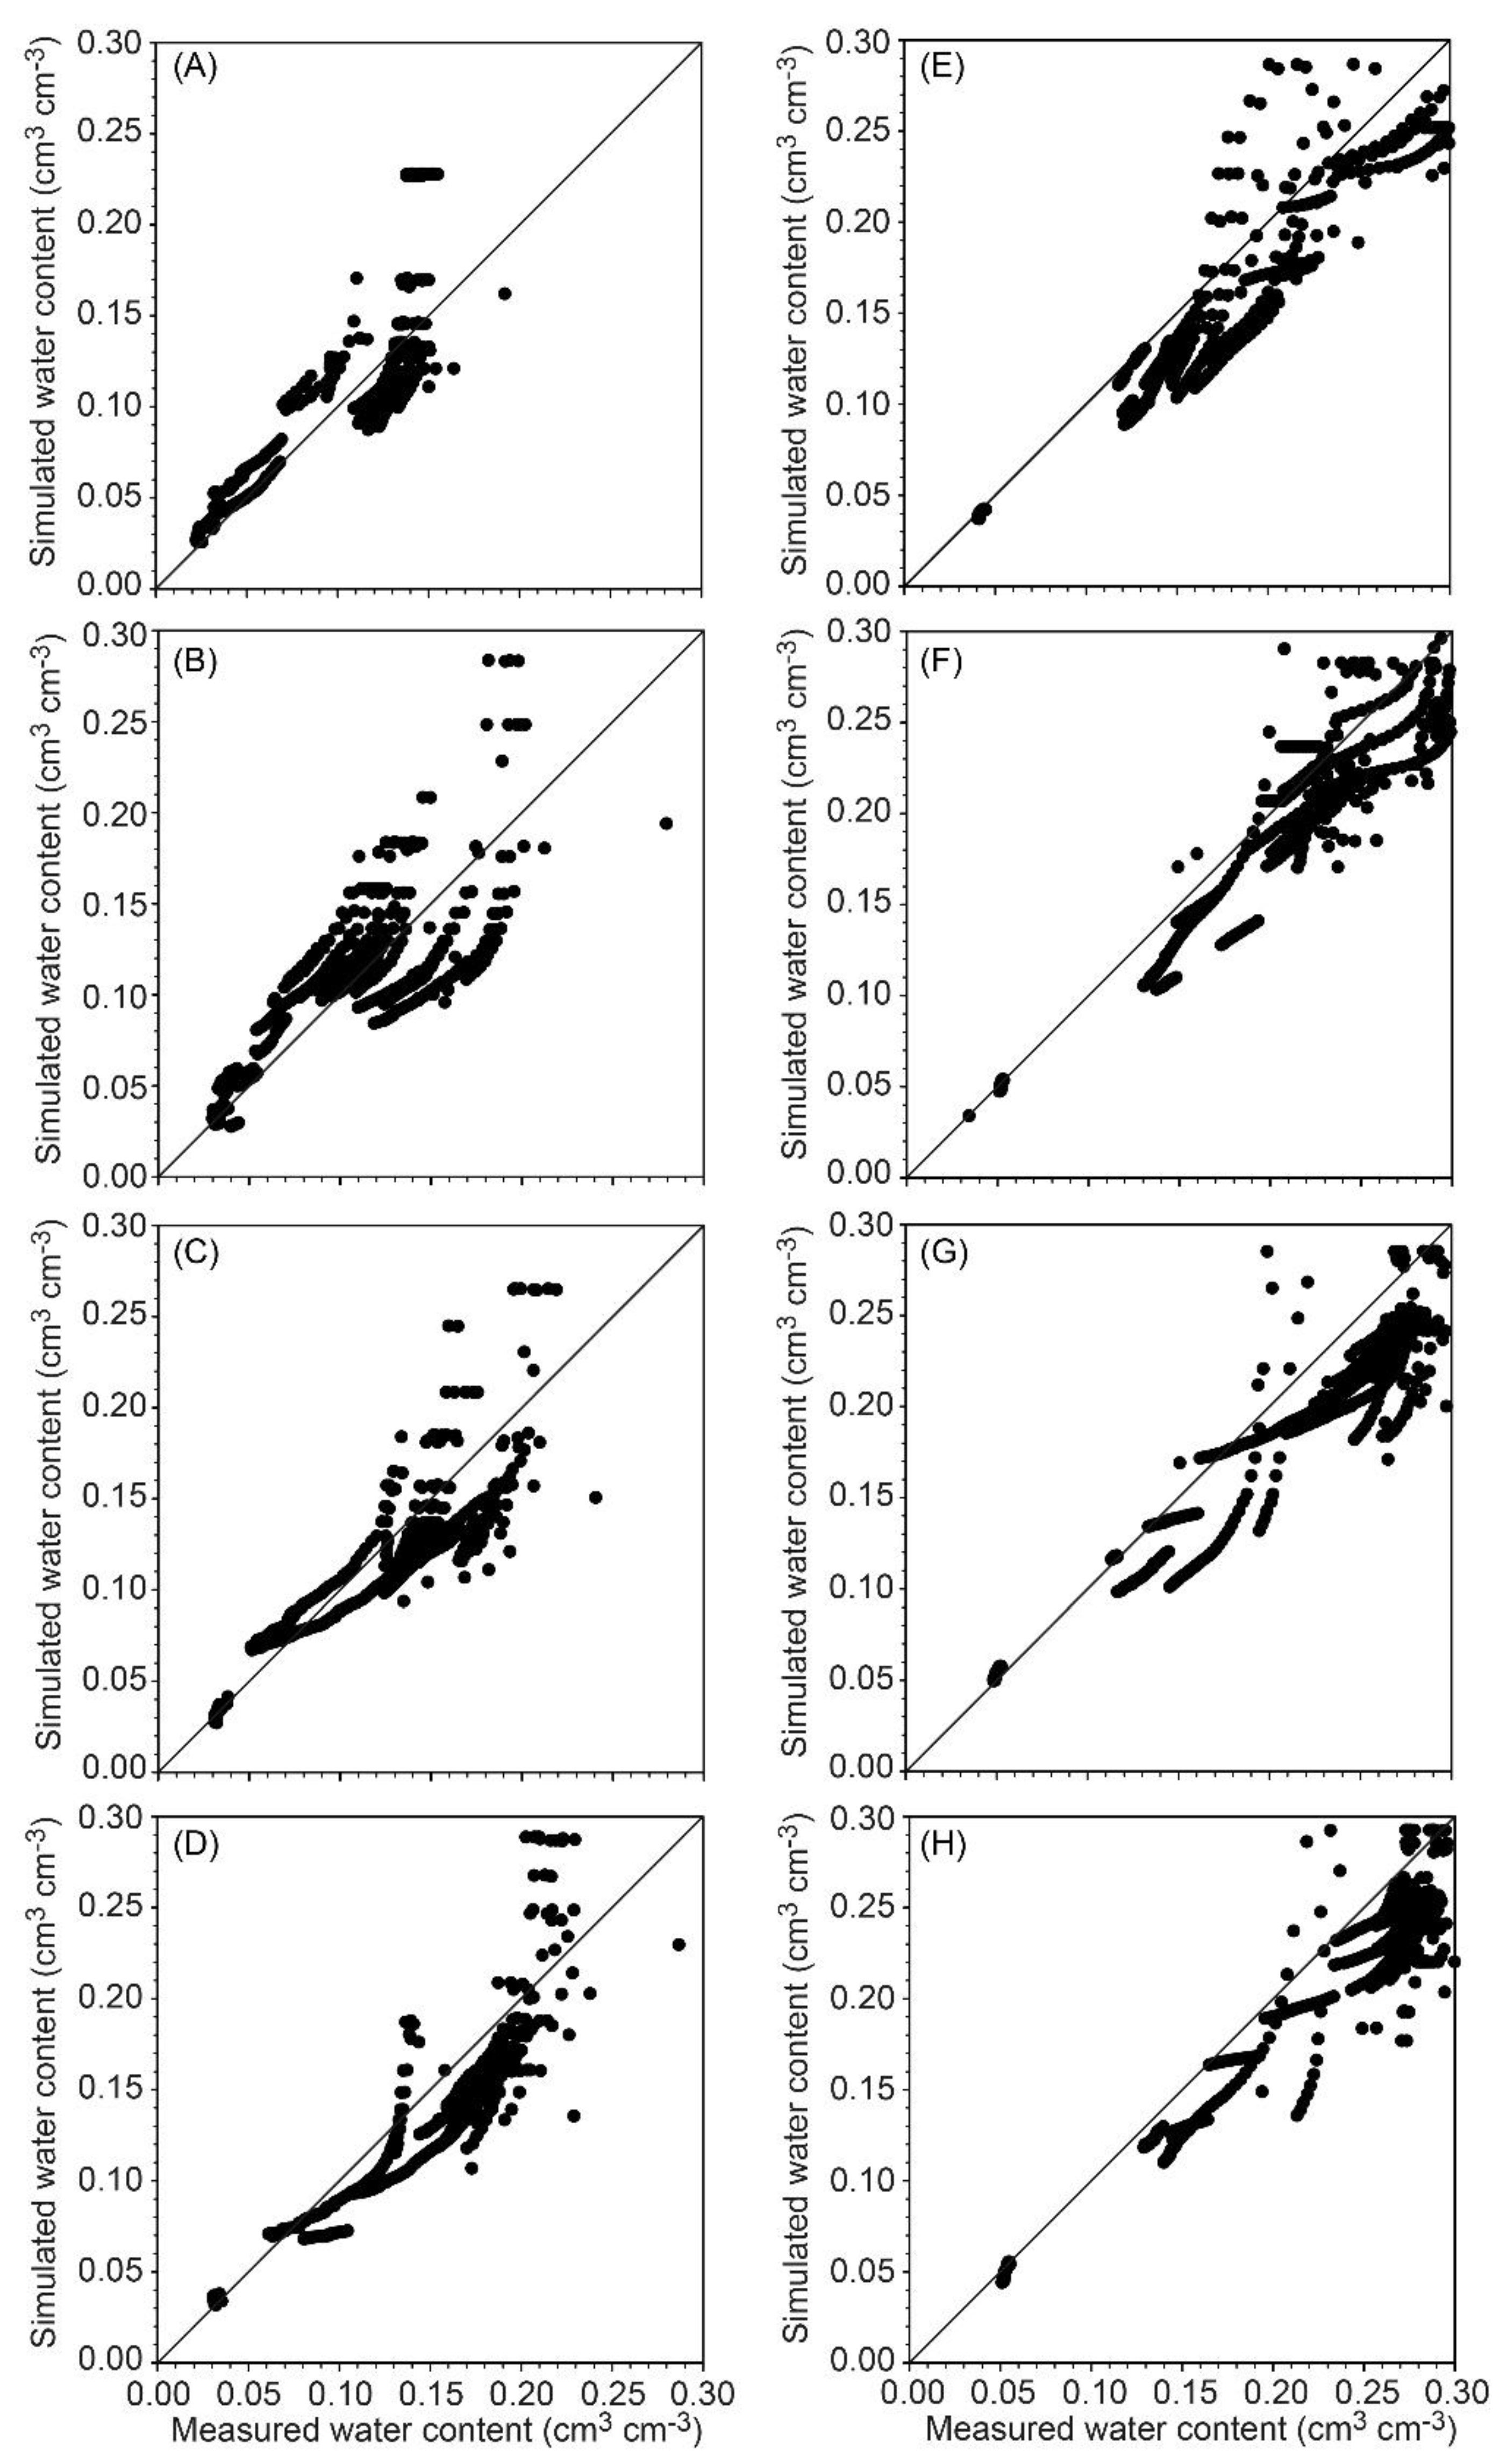
In general, the simulated WC values were close to the measured WC throughout the entire period of the column experiment. Variations were mostly noticed at the end of the dry period (7–8 days after water addition) of each cycle. This could be attributed to the lower boundary conditions imposed at the bottom of the soil column. We adopted a seepage face condition for the lower boundary during the entire time of the simulation, which implies free drainage conditions under the force of gravity. However, the nylon membrane used to seal the bottom of the column could induce partial saturation at the lower boundary until enough water pressure built up to overcome the air-entry pressure of the membrane. This could cause some delays in water movement; hence, some discrepancy between measured and simulated WC may occur. Nevertheless, the HYDRUS-1D model successfully and efficiently simulated WC and soil water storage in the soil columns under the specified initial and boundary conditions. The HYDRUS-1D model has been used extensively to examine the impact of organic and inorganic amendments on soil water dynamics under field and laboratory conditions [13,55,56]. For example, Soudejani et al. [55] used HYDRUS-1D to simulate soil WC and the volume of drainage water in a loamy sand soil amended with natural zeolite. They found that simulation of WC by the HYDRUS-1D model closely matched measured values (R2 = 0.6–0.9, and RMSE = 0.07–0.19) and reported an increase in the WC of the top soil by 5.5–9.1% in the presence of natural zeolite. Scatter plots of measured versus simulated WC at depths of 10 and 50 cm are presented in Figure 9 for CZ0 (A and E), CZ1 (B and D), CZ2 (C and D), and CZ3 (D and H). Analysis of the collected data revealed that in the top 10 cm of the soil columns, most of the points fall on or close to the straight 1:1 line. In contrast, at the 50-cm soil depth, few points are located below the straight 1:1 line, which indicates underestimation in the prediction of the WC values.
The accuracy of the HYDRUS-1D model to simulate WC inside the soil columns was assessed using a number of statistical indices (Table 2). Values of the coefficient of determination (R2) ranged between 0.73 and 0.93, with larger values for the lower soil depths at 30, 40, and 50 cm and for CZ2 and CZ3 particles. The RMSE indicated lower values (0.023–0.033 cm3 cm−3) for the absolute error between measured and simulated WC. The MRE indicated that the HYDRUS-1D model mostly underestimated WC values at depths below 30 cm in the soil column. The maximum underestimation of WC was observed at 50 cm and reached 2.4% for both the CZ2 and CZ3 particles. In contrast, slight overestimation (0.2–0.5%) in the HYDRUS-1D simulation of WC was observed at 10 and 20 cm with the control soil. The D-index values were consistent at all soil depths, and high values (0.92–0.95) were observed with the control and all particle sizes of the CZ. The NSCE statistical indicator also showed higher values (0.75–0.83) at the lower depths inside the soil column (≤30 cm) and slightly lower values (0.69–0.75) in the top 20 cm (Table 2). The overall performance of the HYDRUS-1D model in the simulation of WC inside the soil columns was high. This indicates that fitting the van Genuchten equation to the measured water retention data adequately described the hydraulic parameters of the soil amended with the different macro- and nano-CZ particles, which enabled the accurate simulation of WC and soil water storage.
3.5. Soil Water Storage
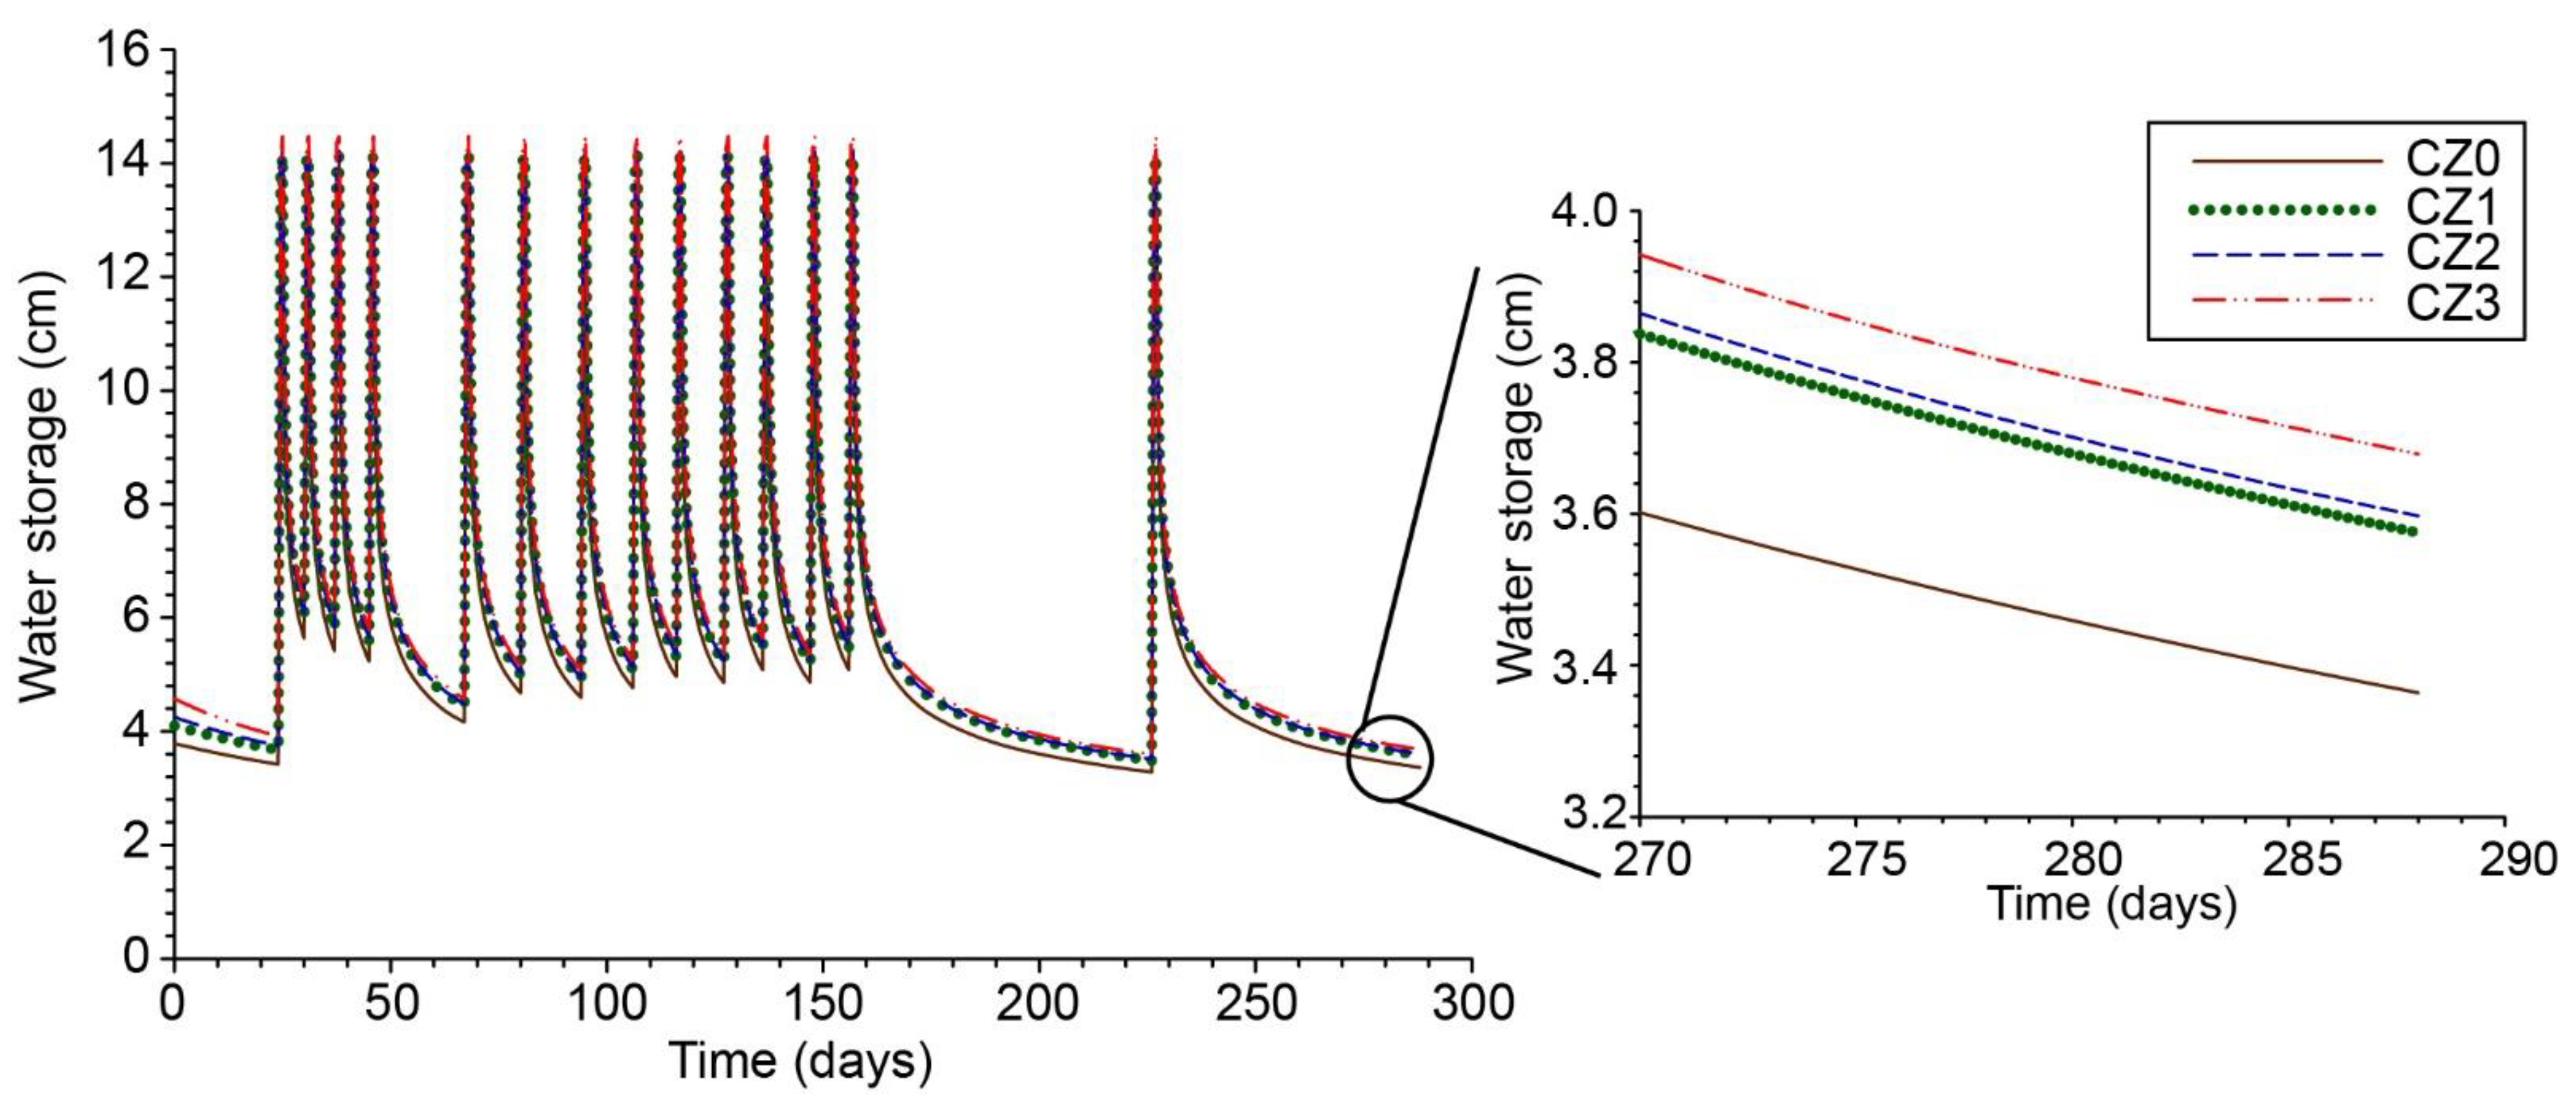
Simulation of soil water storage showed that fluctuations in the water storage inside the soil column were consistent with the wetting and drying cycles (14 cycles). Water storage rapidly increased after water addition, followed by a gradual decrease due to evaporation and deep drainage. The maximum water storage ranged from 14.2 to 14.6 cm and was reached approximately 5–6 h after each water addition. The minimum water storage ranged from 3.8 to 4.6 cm and was observed by the end of the drying period (Figure 10). As a result of the reduction in SHC and the increase in water retention with CZ having smaller particle sizes, more water storage was observed with the CZ3 particles. By the end of the column experiment, the average increase in water storage reached 6.8%, 7.9%, and 10.5% compared to the control soil for the CZ1, CZ2, and CZ3 particles, respectively. The HYDRUS-1D model was successfully used to assess water content and storage of a silty clay soil amended with natural zeolites. Modeling results showed a reduction in surface dryness, higher volumetric water content, and increased water storage, indicating that the application of natural zeolites substantially improved the physical and hydraulic properties of the soil [13].
4. Conclusions
We investigated the impact of the particle size of natural CZ amendment on the water retention and hydraulic properties of a loamy sand soil. Three sizes of CZ particles (CZ1, 20 µm; CZ2, 2.0 µm; and CZ3, 0.2 µm) were either mixed with the soil (CZ1) or added as a suspension (CZ2 and CZ3) with water over 14 wetting/drying cycles. The increase in WC with the application of CZ was larger after the long drying periods and reached 14.8%, 49.4%, and 92.3% for CZ1, CZ2, and CZ3, respectively. CZ particles had a much larger surface area (10-fold) and smaller pore size compared to the loamy sand soil. This led to a change in the pore size distribution of the soil amended with CZ, reducing the number of larger pores and increasing the number of micropores. At matric potential lower than −100 hPa, any water in macropores will drain quickly, whereas the larger suction in micropores will help to retain water. This was also evident from the large decrease in infiltration rate (25.6%) and hydraulic conductivity (19.3%), compared to the control soil, that was observed with the smallest CZ particles (CZ3).
The highly microporous crystalline structure of CZ results in water being held tightly inside the cavities of the aluminosilicates layer. Therefore, the large increase in WC in the soil amended with CZ was not fully reflected in the amount of available water. The average increase in available water reached only 3.6%, 7.1%, and 14.7% for the CZ1, CZ2, and CZ3 particles, respectively. However, measurements of the SMCC showed that the maximum enhancement of water retention was observed at a matric potential between −140 and −240 hPa, which is suitable for water absorption by most vegetables and field crops. The HYDRUS-1D model was capable of accurately simulating WC and soil water storage (R2 = 0.73–0.93, and RMSE = 0.023–0.033 cm3 cm−3) under the specified initial and boundary conditions. The HYDRUS-1D model underestimated (1.0–2.4%) WC at depths below 30 cm and slightly overestimated (0.2–0.5%) WC in the top 20 cm of the soil column. The small variations between measured and simulated WC could be attributed to the partial saturation that occurred at the outlet of the soil column due to the nylon membrane used to support the soil, whereas the HYDRUS-1D model assumed free drainage as the lower boundary condition throughout the simulation period. The largest increase in soil water storage reached 10.5% with the CZ3 nano-CZ. Our results suggest that the application of CZ in the ultra-fine nanoparticle size can be used to increase WC and soil water storage, thus enhancing plant growth and crop production in light-textured soils.
The increase in available water observed with the nano-CZ particles also can help to tolerate drought stress due to climatic conditions in arid and semi-arid regions. Moreover, the reduction in infiltration rate and hydraulic conductivity would minimize the amount of water lost by drainage, which will increase the water use efficiency and help to reduce the amounts of water used for irrigation. The application of large amounts of nano-CZ under field conditions remains a major challenge. Applying nano-CZ suspended in irrigation water can provide efficient methodology to facilitate the transport of CZ particles to subsurface layers. However, this will highly depend on the stability of the nano-CZ and on possible interactions with other ions in the water. Moreover, under natural field conditions, variations in the atmospheric boundary and the presence of root water uptake are likely to affect the impact of macro- and nano-CZ on the water retention and availability in light-textured soils.
Author Contributions
Conceptualization, H.M.I. and A.G.A.; methodology, H.M.I.; software, H.M.I.; validation, H.M.I. and A.G.A.; formal analysis, H.M.I. and A.G.A.; investigation, H.M.I. and A.G.A.; resources, H.M.I. and A.G.A.; data curation, H.M.I. and A.G.A.; writing—original draft preparation, H.M.I. and A.G.A.; writing—review and editing, H.M.I.; visualization, H.M.I.; supervision, H.M.I.; funding acquisition, H.M.I. and A.G.A. All authors have read and agreed to the published version of the manuscript.
Funding
The authors extend their appreciation to the Deanship of Scientific Research at King Saud University for funding this work through research group NO. (RG-1440-089).
Data Availability Statement
The data presented in this study are available in a publicly accessible repository at: http://doi.org/10.5281/zenodo.4554400, accessed on 24 February 2021.
Conflicts of Interest
The authors declare no conflict of interest.
References
- Akhtar, M.; Ahmed, M.; Hayat, R.; Stöckle, C.O.; Hassan, F. Is Rainwater Harvesting an Option for Designing Sustainable Cropping Patterns for Rainfed Agriculture? Land Degrad. Dev. 2015, 27, 630–640. [Google Scholar] [CrossRef]
- Al-Busaidi, A.; Yamamoto, T.; Inoue, M.; Eneji, A.E.; Mori, Y.; Irshad, M. Effects of Zeolite on Soil Nutrients and Growth of Barley Following Irrigation with Saline Water. J. Plant Nutr. 2008, 31, 1159–1173. [Google Scholar] [CrossRef]
- Sepaskhah, A.R.; Barzegar, M. Yield, water and nitrogen-use response of rice to zeolite and nitrogen fertilization in a semi-arid environment. Agric. Water Manag. 2010, 98, 38–44. [Google Scholar] [CrossRef]
- Xiubin, H.; Zhanbin, H. Zeolite application for enhancing water infiltration and retention in loess soil. Resour. Conserv. Recycl. 2001, 34, 45–52. [Google Scholar] [CrossRef]
- Roghani, M.; Nakhli, S.A.A.; Aghajani, M.; Rostami, M.H.; Borghei, S.M. Adsorption and oxidation study on arsenite removal from aqueous solutions by polyaniline/polyvinyl alcohol composite. J. Water Process. Eng. 2016, 14, 101–107. [Google Scholar] [CrossRef]
- Nyssen, J.; Frankl, A.; Zenebe, A.; Poesen, J.; Deckers, J. Environmental Conservation for Food Production and Sustainable Livelihood in Tropical Africa. Land Degrad. Dev. 2013, 26, 629–631. [Google Scholar] [CrossRef]
- Mamedov, A.I.; Bar-Yosef, B.; Levkovich, I.; Rosenberg, R.; Silber, A.; Fine, P.; Levy, G.J. Amending Soil with Sludge, Manure, Humic Acid, Orthophosphate and Phytic Acid: Effects on Infiltration, Runoff and Sediment Loss. Land Degrad. Dev. 2016, 27, 1629–1639. [Google Scholar] [CrossRef]
- Thierfelder, C.; Wall, P.C. Effects of conservation agriculture techniques on infiltration and soil water content in Zambia and Zimbabwe. Soil Tillage Res. 2009, 105, 217–227. [Google Scholar] [CrossRef]
- Waltz, F.C.; Quisenbrry, V.L.; McCart, L.B. Physical and hydraulic properties of root zone mixes amended with inorganics for golf putting green. Agron. J. 2003, 95, 395–404. [Google Scholar] [CrossRef]
- McCoy, E.L. Quantitative physical assessment of organic materials used in sports turf root zone mixes. Agron. J. 1992, 84, 375–381. [Google Scholar] [CrossRef]
- Bigelow, C.A.; Bowman, D.C.; Cassel, K. Germination and establishment with root-zone amendments. Golf Course Manag. 1999, 67, 62–65. [Google Scholar]
- Huang, Z.T.; Petrovic, A.M. Physical Properties of Sand as Affected by Clinoptilolite Zeolite Particle Size and Quantity. J. Turfgrass Manag. 1994, 1, 1–15. [Google Scholar] [CrossRef]
- Colombani, N.; Mastrocicco, M.; Di Giuseppe, D.; Faccini, B.; Coltorti, M. Variation of the hydraulic properties and solute transport mechanisms in a silty-clay soil amended with natural zeolites. Catena 2014, 123, 195–204. [Google Scholar] [CrossRef]
- Ok, C.-H.; Anderson, S.H.; Ervin, E.H. Amendments and Construction Systems for Improving the Performance of Sand-Based Putting Greens. Agron. J. 2003, 95, 1583–1590. [Google Scholar] [CrossRef] [Green Version]
- Talebnezhad, R.; Sepaskhah, A.R. Effects of bentonite on water infiltration in a loamy sand soil. Arch. Agron. Soil Sci. 2013, 59, 1409–1418. [Google Scholar] [CrossRef]
- Gholizadeh-Sarabi, S.; Sepaskhah, A.R. Effect of zeolite and saline water application on saturated hydraulic conductivity and infiltration in different soil textures. Arch. Agron. Soil Sci. 2013, 59, 753–764. [Google Scholar] [CrossRef]
- Carotenuto, G.; Camerlingo, C. Kinetic investigation of water physisorption on natural clinoptilolite at room temperature. Microporous Mesoporous Mater. 2020, 302, 110238. [Google Scholar] [CrossRef]
- Mier, M.V.; Callejas, R.L.; Gehr, R.; Cisneros, B.E.J.; Alvarez, P.J.J. Heavy metal removal with Mexican clinoptilolite: Multi-component ionic exchange. Water Res. 2001, 35, 373–378. [Google Scholar] [CrossRef]
- Sprynskyy, M.; Golembiewski, R.; Trykowski, G.; Buszewski, B. Heterogeneity and hierarchy of clinoptilolite porosity. J. Phys. Chem. Solids 2010, 71, 1269–1277. [Google Scholar] [CrossRef]
- Githinji, L.J.M.; Dane, J.H.; Walker, R.H. Physical and hydraulic properties of inorganic amendments and modeling their effects on water movement in sand-based root zones. Irrig. Sci. 2010, 29, 65–77. [Google Scholar] [CrossRef]
- Azooz, R.H.; Arshad, M.A. Soil infiltration and hydraulic conductivity under long-term no-tillage and conventional tillage systems. Can. J. Soil Sci. 1996, 76, 143–152. [Google Scholar] [CrossRef]
- Razmi, Z.; Sepaskhah, A.R. Effect of zeolite on saturated hydraulic conductivity and crack behavior of silty clay paddled soil. Arch. Agron. Soil Sci. 2011, 58, 805–816. [Google Scholar] [CrossRef]
- Mahabadi, A.A.; Hajabbasi, M.; Khademi, H.; Kazemian, H. Soil cadmium stabilization using an Iranian natural zeolite. Geoderma 2007, 137, 388–393. [Google Scholar] [CrossRef]
- Ramesh, K.; Damodar, D.; Kumar, A.; Subba, A. Zeolites and their potential uses in agriculture. Adv. Agron. 2011, 113, 215–236. [Google Scholar]
- He, Z.L.; Calvert, D.V.; Alva, A.K.; Li, Y.; Banks, D.J. Clinoptilolite zeolite and cellulose amendments to reduce ammonia volatilization in a calcareous sandy soil. Plant Soil 2002, 247, 253–260. [Google Scholar] [CrossRef]
- Bigelow, C.A.; Bowman, D.C.; Cassel, D.; Rufty, T.W. Creeping Bentgrass Response to Inorganic Soil Amendments and Mechanically Induced Subsurface Drainage and Aeration. Crop. Sci. 2001, 41, 797–805. [Google Scholar] [CrossRef]
- Nus, J.; Brauen, S. Clinoptilolitic zeolite as an amendment for establishment of creeping bentgrass on sandymedia. Hortscience 1991, 26, 117–119. [Google Scholar] [CrossRef]
- Miller, G.L. Physiological response of Bermuda grass grown in soil amendments during drought stress. Hortscience 2000, 35, 213–216. [Google Scholar] [CrossRef] [Green Version]
- Bernardi, A.C.D.C.; Oliviera, P.P.A.; Monte, M.B.D.M.; Souza-Barros, F. Brazilian sedimentary zeolite use in agriculture. Microporous Mesoporous Mater. 2013, 167, 16–21. [Google Scholar] [CrossRef] [Green Version]
- Soudejani, H.T.; Heidarpour, M.; Shayannejad, M.; Shariatmadari, H.; Kazemian, H.; Afyuni, M. Composts Containing Natural and Mg-Modified Zeolite: The Effect on Nitrate Leaching, Drainage Water, and Yield. CLEAN Soil Air Water 2019, 47. [Google Scholar] [CrossRef]
- Sparks, D.L.; Page, A.L.; Helmke, P.A.; Leoppert, R.H.; Soltanpour, P.N.; Tabatabai, M.A.; Johnston, G.T.; Sumner, M.E. Methods of Soil Analysis; Soil Science Society of America: Madison, WI, USA, 1996. [Google Scholar]
- IUSS Working Group WRB. World Reference Base for Soil Resources 2014, Update 2015: International Soil Classification System for Naming Soils and Creating Legends for Soil Maps; World Soil Resources Reports No. 106; FAO: Rome, Italy, 2015. [Google Scholar]
- Vladimir, A.H.; Chen-Yuan, D.; Feng-Jie, L.; Nan-Shan, C.; Shean-Jen, C. Natural zeolite for adsorbing and release of functional materials. J. Biomed. Opt. 2018, 23, 091411. [Google Scholar]
- Van Genuchten, M.T. A Closed-form Equation for Predicting the Hydraulic Conductivity of Unsaturated Soils. Soil Sci. Soc. Am. J. 1980, 44, 892–898. [Google Scholar] [CrossRef] [Green Version]
- Van Genuchten, M.T.; Leij, F.J.; Yates, S.R. The RETC Code for Quantifying the Hydraulic Functions of Unsaturated Soils; EPA/600/2-91/065–U. S. Salinity Laboratory; USDA ARS: Riverside, CA, USA, 1991. [Google Scholar]
- Bootlink, H.W.G.; Bouma, J. Saturated and field-saturated water flow parameters: 3.4.2.4 steady flow soil column method. In Methods of Soil Analysis; Dane, J.H., Topp, G.C., Eds.; Soil Science Society of America, Inc.: Madison, WI, USA, 2002; pp. 812–814. [Google Scholar]
- Philip, J.R. The theory of infiltration: 1. The infiltration equation and its solution. Soil Sci. 1957, 83, 345–357. [Google Scholar] [CrossRef]
- Simunek, J.; Sejna, M.; Saito, H.; Sakai, M.; van Genuchten, M.T. The HYDRUS-1D Software Package for Simulating the One-Dimensional Movement of Water, Heat, and Multiple Solutes in Variably-Saturated Media Version 4.17; University of California Riverside: Riverside, CA, USA, 2013; pp. 1–342. [Google Scholar]
- Richards, L.A. Capillary conduction of liquids through porous mediums. Physics 1931, 1, 318–333. [Google Scholar] [CrossRef]
- Loague, K.; Green, R.E. Statistical and graphical methods for evaluating solute transport models: Overview and application. J. Contam. Hydrol. 1991, 7, 51–73. [Google Scholar] [CrossRef]
- Nash, J.E.; Sutcliffe, J.V. River forecasting through conceptual models, part I, a discussion of principle. J. Hydrol. 1970, 10, 282–290. [Google Scholar] [CrossRef]
- Treacy, M.M.J.; Higgins, J.B. Collection of Simulated XRD Powder Patterns for Zeolites, 4th ed.; Revised; Elsevier: Amsterdam, The Netherlands, 2001. [Google Scholar]
- Charkhi, A.; Kazemian, H.; Kazemeini, M. Optimized experimental design for natural clinoptilolite zeolite ball milling to produce nano powders. Powder Technol. 2010, 203, 389–396. [Google Scholar] [CrossRef]
- Yeliz, Y.A. Characterization of two natural zeolites for geotechnical and geoenvironmental applications. Appl. Clay Sci. 2010, 50, 130–136. [Google Scholar]
- Korkuna, O.; Leboda, R.; Skubiszewska-Zie, J.; Vrublevs’Ka, T.; Gun’Ko, V.; Ryczkowski, J. Structural and physicochemical properties of natural zeolites: Clinoptilolite and mordenite. Microporous Mesoporous Mater. 2006, 87, 243–254. [Google Scholar] [CrossRef]
- Mc Bride, M.B. Surface chemistry of soil minerals. In Minerals in Soil Environments; Dixon, J.B., Weed, S.B., Eds.; Soil Science Society of America: Madson, WI, USA, 1989; pp. 35–88. [Google Scholar]
- Ersoy, B.; Celik, M.S. Electrokinetic properties of clinoptilolite with mono- and multivalent electrolytes. Microporous Mesoporous Mater. 2002, 55, 305–312. [Google Scholar] [CrossRef]
- Ozkan, A.; Sener, A.; Ucbeyiay, H. Investigation of coagulation and electrokinetic behaviors of clinoptilolite suspension with multivalent cations. Sep. Sci. Technol. 2017, 53, 823–832. [Google Scholar] [CrossRef]
- Castagnola, N.B.; Dutta, P.K. Nanometer-Sized Zeolite X Crystals: Use as Photochemical Hosts. J. Phys. Chem. B 1998, 102, 1696–1702. [Google Scholar] [CrossRef]
- Ghanbari, M.; Ariafar, S. The effect of water deficit and zeolite application on Growth Traits and Oil Yield of Medicinal Pep-permint (Mentha piperita L.). Int. J. Med. Arom. Plants 2013, 3, 33–39. [Google Scholar]
- Gholizadeh, A.; Amin, M.S.M.; Anuar, A.R.; Saberioon, M.M. Water stress and natural zeolite impacts on phisiomorphological characteristics of moldavian balm (Dracocephalum moldavica l.). Aust. J. Basic Appl. Sci. 2010, 4, 5184–5190. [Google Scholar]
- Voroney, R.P.; Van Straaten, P. Use of natural zeolites in sand root zones for putting greens. Greenmaster Mag. 1988, 8, 17–19. [Google Scholar]
- Schwen, A.; Bodner, G.; Scholl, P.; Buchan, G.D.; Loiskandl, W. Temporal dynamics of soil hydraulic properties and the water-conducting porosity under different tillage. Soil Tillage Res. 2011, 113, 89–98. [Google Scholar] [CrossRef]
- Touma, J.; Voltz, M.; Albergel, J. Determining soil saturated hydraulic conductivity and sorptivity from single ring infiltration tests. Eur. J. Soil Sci. 2007, 58, 229–238. [Google Scholar] [CrossRef]
- Soudejani, H.T.; Shayannejada, M.; Kazemianc, H.; Heidarpoura, M.; Rutherford, M. Effect of co-composting municipal solid waste with Mg-modified zeolite on soil water balance components using HYDRUS-1D. Comput. Electron. Agric. 2020, 176, 105637. [Google Scholar] [CrossRef]
- Filipović, V.; Coquet, Y.; Pot, V.; Houot, S.; Benoit, P. Modeling water and isoproturon dynamics in a heterogeneous soil profile under different urban waste compost applications. Geoderma 2016, 268, 29–40. [Google Scholar] [CrossRef] [Green Version]
Figure 1.
Setup of the laboratory soil column. The 5TE sensors were set at a depth of 10, 20, 30, 40, and 50 cm from the soil surface for the sensors 1, 2, 3, 4, and 5, respectively.
Figure 1.
Setup of the laboratory soil column. The 5TE sensors were set at a depth of 10, 20, 30, 40, and 50 cm from the soil surface for the sensors 1, 2, 3, 4, and 5, respectively.

Figure 2.
X-ray diffraction (XRD) spectra of macro-clinoptilolite (CZ1) and nano-clinoptilolite (CZ2 and CZ3). Main peaks shown are for clinoptilolite (C), anorthite (A), and stilbite (S) phases.
Figure 2.
X-ray diffraction (XRD) spectra of macro-clinoptilolite (CZ1) and nano-clinoptilolite (CZ2 and CZ3). Main peaks shown are for clinoptilolite (C), anorthite (A), and stilbite (S) phases.

Figure 3.
Effect of macro- and nano-sizes of clinoptilolite zeolite particles on particle stability and dynamic aggregation over time. CZ1, 20 µm; CZ2, 2 µm; and CZ3, 0.2 µm.
Figure 3.
Effect of macro- and nano-sizes of clinoptilolite zeolite particles on particle stability and dynamic aggregation over time. CZ1, 20 µm; CZ2, 2 µm; and CZ3, 0.2 µm.

Figure 4.
Measured volumetric water content inside soil columns at depths of 10 (A) and 50 cm (B), as affected by the particle size of clinoptilolite zeolite: control soil, CZ0; 20 µm, CZ1; 2 µm, CZ2; and 0.2 µm, CZ3. Values were measured using 5TE sensors every 30 s, and the average was recorded to an EM50G micrologger every 30 min.

Figure 5.
Effect of the particle size of clinoptilolite zeolite (control soil, CZ0; 20 µm, CZ1; 2 µm, CZ2; and 0.2 µm, CZ3) on the soil moisture characteristics curve (SMCC) at depths of 10 (A) and 50 cm (B).
Figure 5.
Effect of the particle size of clinoptilolite zeolite (control soil, CZ0; 20 µm, CZ1; 2 µm, CZ2; and 0.2 µm, CZ3) on the soil moisture characteristics curve (SMCC) at depths of 10 (A) and 50 cm (B).

Figure 6.
Effect of the particle size of clinoptilolite zeolite (control soil, CZ0; 20 µm, CZ1; 2 µm, CZ2; and 0.2 µm, CZ3) on available water content at soil depths of 10 and 50 cm. Values of the columns with the same letter are not statistically significant (p < 0.05). Vertical bars represent ±1 SD.

Figure 7.
Cumulative infiltration as affected by the particle size of clinoptilolite zeolite (control soil, CZ0; 20 µm, CZ1; 2 µm, CZ2; and 0.2 µm, CZ3).
Figure 7.
Cumulative infiltration as affected by the particle size of clinoptilolite zeolite (control soil, CZ0; 20 µm, CZ1; 2 µm, CZ2; and 0.2 µm, CZ3).

Figure 8.
Effect of the particle size of clinoptilolite zeolite (control soil, CZ0; 20 µm, CZ1; 2 µm, CZ2; and 0.2 µm, CZ3) on saturated hydraulic conductivity at soil depths of 10 and 50 cm. Values of the columns with the same letter are not statistically significant (p < 0.05). Vertical bars represent ±1SD.

Figure 9.
Scatter plots of measured versus simulated values of water content as affected by the particle size of clinoptilolite zeolite at depths of 10 cm—control soil (CZ0), A; 20 µm (CZ1), B; 2 µm (CZ2), C; and 0.2 µm (CZ3), D—and 50 cm—control soil (CZ0), E; 20 µm (CZ1), F; 2 µm (CZ2), G; and 0.2 µm (CZ3), H.

Figure 10.
Effect of the particle size of clinoptilolite zeolite (control soil, CZ0; 20 µm, CZ1; 2 µm, CZ2; and 0.2 µm, CZ3) on soil water storage.
Figure 10.
Effect of the particle size of clinoptilolite zeolite (control soil, CZ0; 20 µm, CZ1; 2 µm, CZ2; and 0.2 µm, CZ3) on soil water storage.


Table 1.
Size and surface properties of the loamy sand soil and clinoptilolite particles of different sizes.
Table 1.
Size and surface properties of the loamy sand soil and clinoptilolite particles of different sizes.
| Soil/ Clinoptilolite | Size | Surface Area 1 | Micropore Area 2 | Pore Volume 3 | Pore Size 4 | Zeta Potential 5 |
|---|---|---|---|---|---|---|
| (µm) | (m2 g−1) | (m2 g−1) | (cm³ g−1) | (Å) | (mV) | |
| CZ0 (Control) | <2000 | 3.559 ± 0.004 a | 0.114 ± 0.001 a | 0.0126 a | 141.6 a | −28.3 ± 0.6 a |
| CZ1 | 20 ± 1.5 | 34.722 ± 0.291 b | 7.074 ± 0.095 b | 0.1121 b | 129.1 b | −29.3 ± 0.6 a |
| CZ2 | 2.0 ± 0.1 | 35.001 ± 0.185 b | 8.301 ± 0.131 b | 0.1128 b | 128.9 b | −31.1 ± 0.4 b |
| CZ3 | 0.2 ± 0.05 | 37.296 ± 0.443 c | 12.514 ± 0.184 c | 0.1153 b | 123.7 c | −33.9 ± 0.5 c |
CZ0, CZ1, CZ2, and CZ3 are the control soil and clinoptilolite particles having average sizes of 20, 2, and 0.2 µm, respectively. Different superscript letters indicate significant differences (p < 0.05) among mean values in each column. 1 Brunauer–Emmett–Teller (BET) total surface area. 2 t-plot micropore area. 3 Barrett–Joyner–Halenda (BJH) adsorption/desorption cumulative volume of pores. 4 BJH adsorption/desorption average pore diameter. 5 Calculated by the measurement of electrophoretic mobility and the application of Smoluchowski approximation.
Table 2.
Statistical evaluation of the simulation of water content inside the soil columns by the HYDRUS-1D model.
Table 2.
Statistical evaluation of the simulation of water content inside the soil columns by the HYDRUS-1D model.
| Soil Depth (cm) | Clinoptilolite | Statistical Index | ||||
|---|---|---|---|---|---|---|
| R2 | RMSE | MRE | D-Index | NSCE | ||
| 10 | CZ0 | 0.765 | 0.023 | −0.280 | 0.932 | 0.726 |
| CZ1 | 0.731 | 0.027 | −0.240 | 0.920 | 0.721 | |
| CZ2 | 0.788 | 0.024 | 0.533 | 0.933 | 0.776 | |
| CZ3 | 0.835 | 0.026 | 1.451 | 0.937 | 0.752 | |
| 20 | CZ0 | 0.752 | 0.025 | −0.521 | 0.901 | 0.715 |
| CZ1 | 0.764 | 0.026 | 0.821 | 0.923 | 0.695 | |
| CZ2 | 0.801 | 0.024 | 1.241 | 0.935 | 0.712 | |
| CZ3 | 0.795 | 0.025 | 1.534 | 0.925 | 0.724 | |
| 30 | CZ0 | 0.821 | 0.023 | 1.025 | 0.904 | 0.756 |
| CZ1 | 0.785 | 0.025 | 0.954 | 0.926 | 0.801 | |
| CZ2 | 0.805 | 0.026 | 0.846 | 0.920 | 0.795 | |
| CZ3 | 0.815 | 0.023 | 1.235 | 0.915 | 0.812 | |
| 40 | CZ0 | 0.855 | 0.028 | 2.045 | 0.912 | 0.784 |
| CZ1 | 0.905 | 0.032 | 1.864 | 0.925 | 0.804 | |
| CZ2 | 0.895 | 0.029 | 2.315 | 0.948 | 0.820 | |
| CZ3 | 0.915 | 0.028 | 2.125 | 0.938 | 0.815 | |
| 50 | CZ0 | 0.884 | 0.032 | 2.215 | 0.944 | 0.781 |
| CZ1 | 0.904 | 0.028 | 1.876 | 0.956 | 0.825 | |
| CZ2 | 0.909 | 0.033 | 2.386 | 0.940 | 0.786 | |
| CZ3 | 0.925 | 0.031 | 2.381 | 0.950 | 0.814 | |
R2, coefficient of determination; RMSE, root mean square error (cm3 cm−3); MRE, mean relative error (%); D-index, index of agreement; NSCE, Nash–Sutcliffe coefficient of efficiency. CZ0, CZ1, CZ2, and CZ3 are the control soil and clinoptilolite particles having average sizes of 20, 2, and 0.2 µm, respectively.
Publisher’s Note: MDPI stays neutral with regard to jurisdictional claims in published maps and institutional affiliations. |
© 2021 by the authors. Licensee MDPI, Basel, Switzerland. This article is an open access article distributed under the terms and conditions of the Creative Commons Attribution (CC BY) license (http://creativecommons.org/licenses/by/4.0/).
Share and Cite
MDPI and ACS Style
Ibrahim, H.M.; Alghamdi, A.G. Effect of the Particle Size of Clinoptilolite Zeolite on Water Content and Soil Water Storage in a Loamy Sand Soil. Water 2021, 13, 607. https://doi.org/10.3390/w13050607
AMA Style
Ibrahim HM, Alghamdi AG. Effect of the Particle Size of Clinoptilolite Zeolite on Water Content and Soil Water Storage in a Loamy Sand Soil. Water. 2021; 13(5):607. https://doi.org/10.3390/w13050607
Chicago/Turabian StyleIbrahim, Hesham M., and Abdulaziz G. Alghamdi. 2021. "Effect of the Particle Size of Clinoptilolite Zeolite on Water Content and Soil Water Storage in a Loamy Sand Soil" Water 13, no. 5: 607. https://doi.org/10.3390/w13050607
Note that from the first issue of 2016, this journal uses article numbers instead of page numbers. See further details here.