
Eco-Efficiency Assessment of Control Actions in Wastewater Treatment Plants


1
Department of Computer Science and Automatic, University of Salamanca, 37008 Salamanca, Spain
2
Department of Telecommunications and Systems Engineering, School of Engineering, Universitat Autonoma de Barcelona, 08193 Barcelona, Spain
*
Author to whom correspondence should be addressed.
Water 2021, 13(5), 612; https://doi.org/10.3390/w13050612
Submission received: 31 December 2020
/
Revised: 15 February 2021
/
Accepted: 20 February 2021
/
Published: 26 February 2021
(This article belongs to the Special Issue Application of Circular Economy Principles in Water and Wastewater Utilities)
Abstract
:This work explores the possibilities of improving the eco-efficiency of Wastewater Treatment Plants (WWTPs) introducing a plant-wide perspective in the formulation of the control strategy. Eco-efficiency goals are contemplated in the analysis of the appropriateness of control actions, considering the seasonal effects of temperature into the decision-making process. Plant-wide control strategy handles are the operation variables of the activated sludge process, the volume of the primary clarifier, and the temperature of the anaerobic digester. Performance is evaluated in terms of energy use, biogas production, effluent quality, emissions to air and soil, considering annual and bimestrial average values of indicators to capture seasonal effect of temperature. The result is a set of possible solutions, obtained from a multi-objective decision-making procedure, consisting on a sequence of control actions applied at different temporal windows that improve the eco-efficiency indicators of the plant. The results obtained when applying the different solutions make evident how the application of plant-wide control strategies is useful to improve performance indicators that represent individual goals, leading to trade-off solutions that describe WWTPs’ eco-efficiency.
1. Introduction
The eco-efficiency concept is proposed as a new paradigm within an industrial framework as defined by the World Business Council for Sustainable Development (WBCSD): “eco-efficiency is achieved by the delivery of competitively priced goods and services that satisfy human needs and bring quality of life, while progressively reducing ecological impacts and resource intensity throughout the life-cycle to a level at least in line with the Earth’s estimated carrying capacity” [1]. Eco-efficiency is a management philosophy that encourages business to search for environmental improvements that yield parallel economic benefits. It focuses on business opportunities and allows companies to become more environmentally responsible and profitable.
Wastewater Treatment Plants (WWTPs) are crucial to mitigate the impact of pollutants on water bodies. The urban wastewater treatment plants (WWTPs) comprise a water line, where pollutants are removed from wastewater, a sludge line, where sludge is stabilized while biogas is obtained as by-product, and a gas line for biogas conditioning [2]. In WWTPs facilities, efficiency of the process is determined by the amount of energy used to remove pollution [3]. Then, energy consumption and energy recovery from biogas are important issues to be considered in processes oriented to produce environmental benefits, since the use of energy from external sources to treat wastewater involve additional environmental impacts (i.e., emissions of greenhouse gasses, GHG). Moreover, the use of chemicals agents for nutrient removal and sludge conditioning affect toxicity, but it also involves environmental impacts associated with the production and transportation of chemicals [4]. Thus, WWTPs exhibit an interesting compromise between environmental costs and energy consumption. Energy is required to treat wastewater to avoid polluting emissions to water, mainly reducing eutrophication potential, but energy and chemical consumption implies environmental costs associated with global warming potential and toxicity [4]. As an important part of the urban water cycle, WWTPs face significant challenges to improve its efficiency to achieve a sustainable management of water [5] and to contribute to the circular economy, through energy generation, water reuse, and material recycling [5,6]. Then, in urban environments it is necessary to consider environmental impacts from a wider viewpoint, not only mitigating emissions to water, but also avoiding the transference of environmental impacts of wastewater treatment over time or space [7,8].
The attainment of eco-efficiency targets when running WWTPs is a complex task, where a holistic viewpoint is necessary. Regarding the implementation of technological solutions based on the optimization of control system performance, the challenges faced by control systems designers rely on the complexity of biological processes, the dynamic effects of temperature, and influential variables and interactions between the different units. WWTPs comprise several units working at different time scales: primary/secondary clarifiers for physical separation, activated sludge reactors for biological treatment, anaerobic digesters for sludge stabilization, thickener/flotation units, dewatering systems, and storage tanks. The configuration of the plant with sequential unit processes constituting the water line, the sludge line, and the gas line and numerous returns of mass flows produce an integrated system with several units interconnected in an intricate manner [2,9]. Moreover, the influent load exhibits fluctuations associated with human activity in the catchment, or rainfall in the case of combined sewage systems, and seasonal effects due to temperature and influent flowrate variations. This complex system should be operated and controlled considering plant-wide effects, addressing the interactions between the different subsystems and the multi-objective nature of the problem to consider eco-efficiency targets.
Recent works of the research group [2,9] address the improvement of the overall efficiency of wastewater treatment plants, considering the compromise between energy consumption, as one part of operation costs, and environmental costs. The Benchmark Simulation Model 2 (BSM2), that is a widely accepted simulation model [10], is used as a reference plant in both cases, even though the analysis and methodology could be extended to real applications. A holistic perspective of WWTP control system performance is introduced in [9], where an optimizing PI-control strategy is used to regulate an overall efficiency index (N/E index), that represents the ratio between the amount of nitrogenated compounds eliminated (kgN) and the energy (kWh) consumed in the whole plant. Moreover, a dynamic evaluation of an index that measures the ratio between environmental benefits of WWTP, and the energy required to achieve that goal, is used to optimize the operation of the plant. The proposed strategy is compared with typical WWTP control strategies used in real practice. In [2], a comprehensive analysis of the environmental impact of typical control/operational strategies through a dynamic perspective has been performed. This work shows the advantage of considering different temporal windows to identify dynamic effects and the impact of slow and fast disturbances on performance indicators that are hidden when evaluation focuses only on annual-based indicators.
In this paper, the wider concept of eco-efficiency is considered to address the environmental impacts associated with WWTP operation. Energy recovery from biogas is considered as an important factor that affects energy efficiency of the process. Moreover, the evaluation of dynamic performance is focused, in this case, on capturing seasonal effects of temperature on effluent quality and energy recovery from biogas. The idea of the application of a plant-wide control strategy to introduce a holistic perspective into WWTP operation strategy to improve eco-efficiency is adopted from [9]. In [9] overall performance was considered, but control actions were limited to activated sludge process (ASP). In this paper, control actions are also applied to the digester’s operation temperature and primary settler, considering the possibility of affecting biogas production, electricity consumption, and effluent quality, taking into consideration the eco-efficiency philosophy. Moreover, while previous works [2,9] focus on the evaluation of the performance of different control schemes applied to the activated sludge process, this work focuses on the evaluation of the impact of different control decisions involving different operation variables, under cascaded control of ammonium in the ASP, which exhibited the best performance in terms of energy consumption in [2,9]. This paper aims to promote the transition to the sustainability of the WWTP operation taking advantage of systems thinking to identify root causes and implement better solutions [11]. The plant-wide conception of the control problem and the selection of control actions is important to exploit the resources of a plant considering eco-efficiency goals.
The remainder of this paper is organized as follows. A description of the reference wastewater treatment plant (BSM2 model), control strategies, and environmental performance indicators is presented in Section 2. In Section 3, the results and discussion of the evaluation of control actions and the evaluation of the proposed plant-wide control solutions are presented. Conclusions of the work are presented in Section 4.
2. Materials and Methods
2.1. Description of the Wastewater Treatment Plant Represented by BSM2 Platform
The Benchmark Simulation Model (BSM2) has been selected as a reference WWTP model, where the units of the water and sludge line are “linked together and need to be operated and controlled not only on a local level as individual processes but by supervisory systems taking into account all the interactions between the processes” [10,12,13]. However, the proposed methodology and analysis of the impact of control actions, considering the available data, measurements, and control systems, can be adapted to full scale WWTPs to attain eco-efficiency goals.
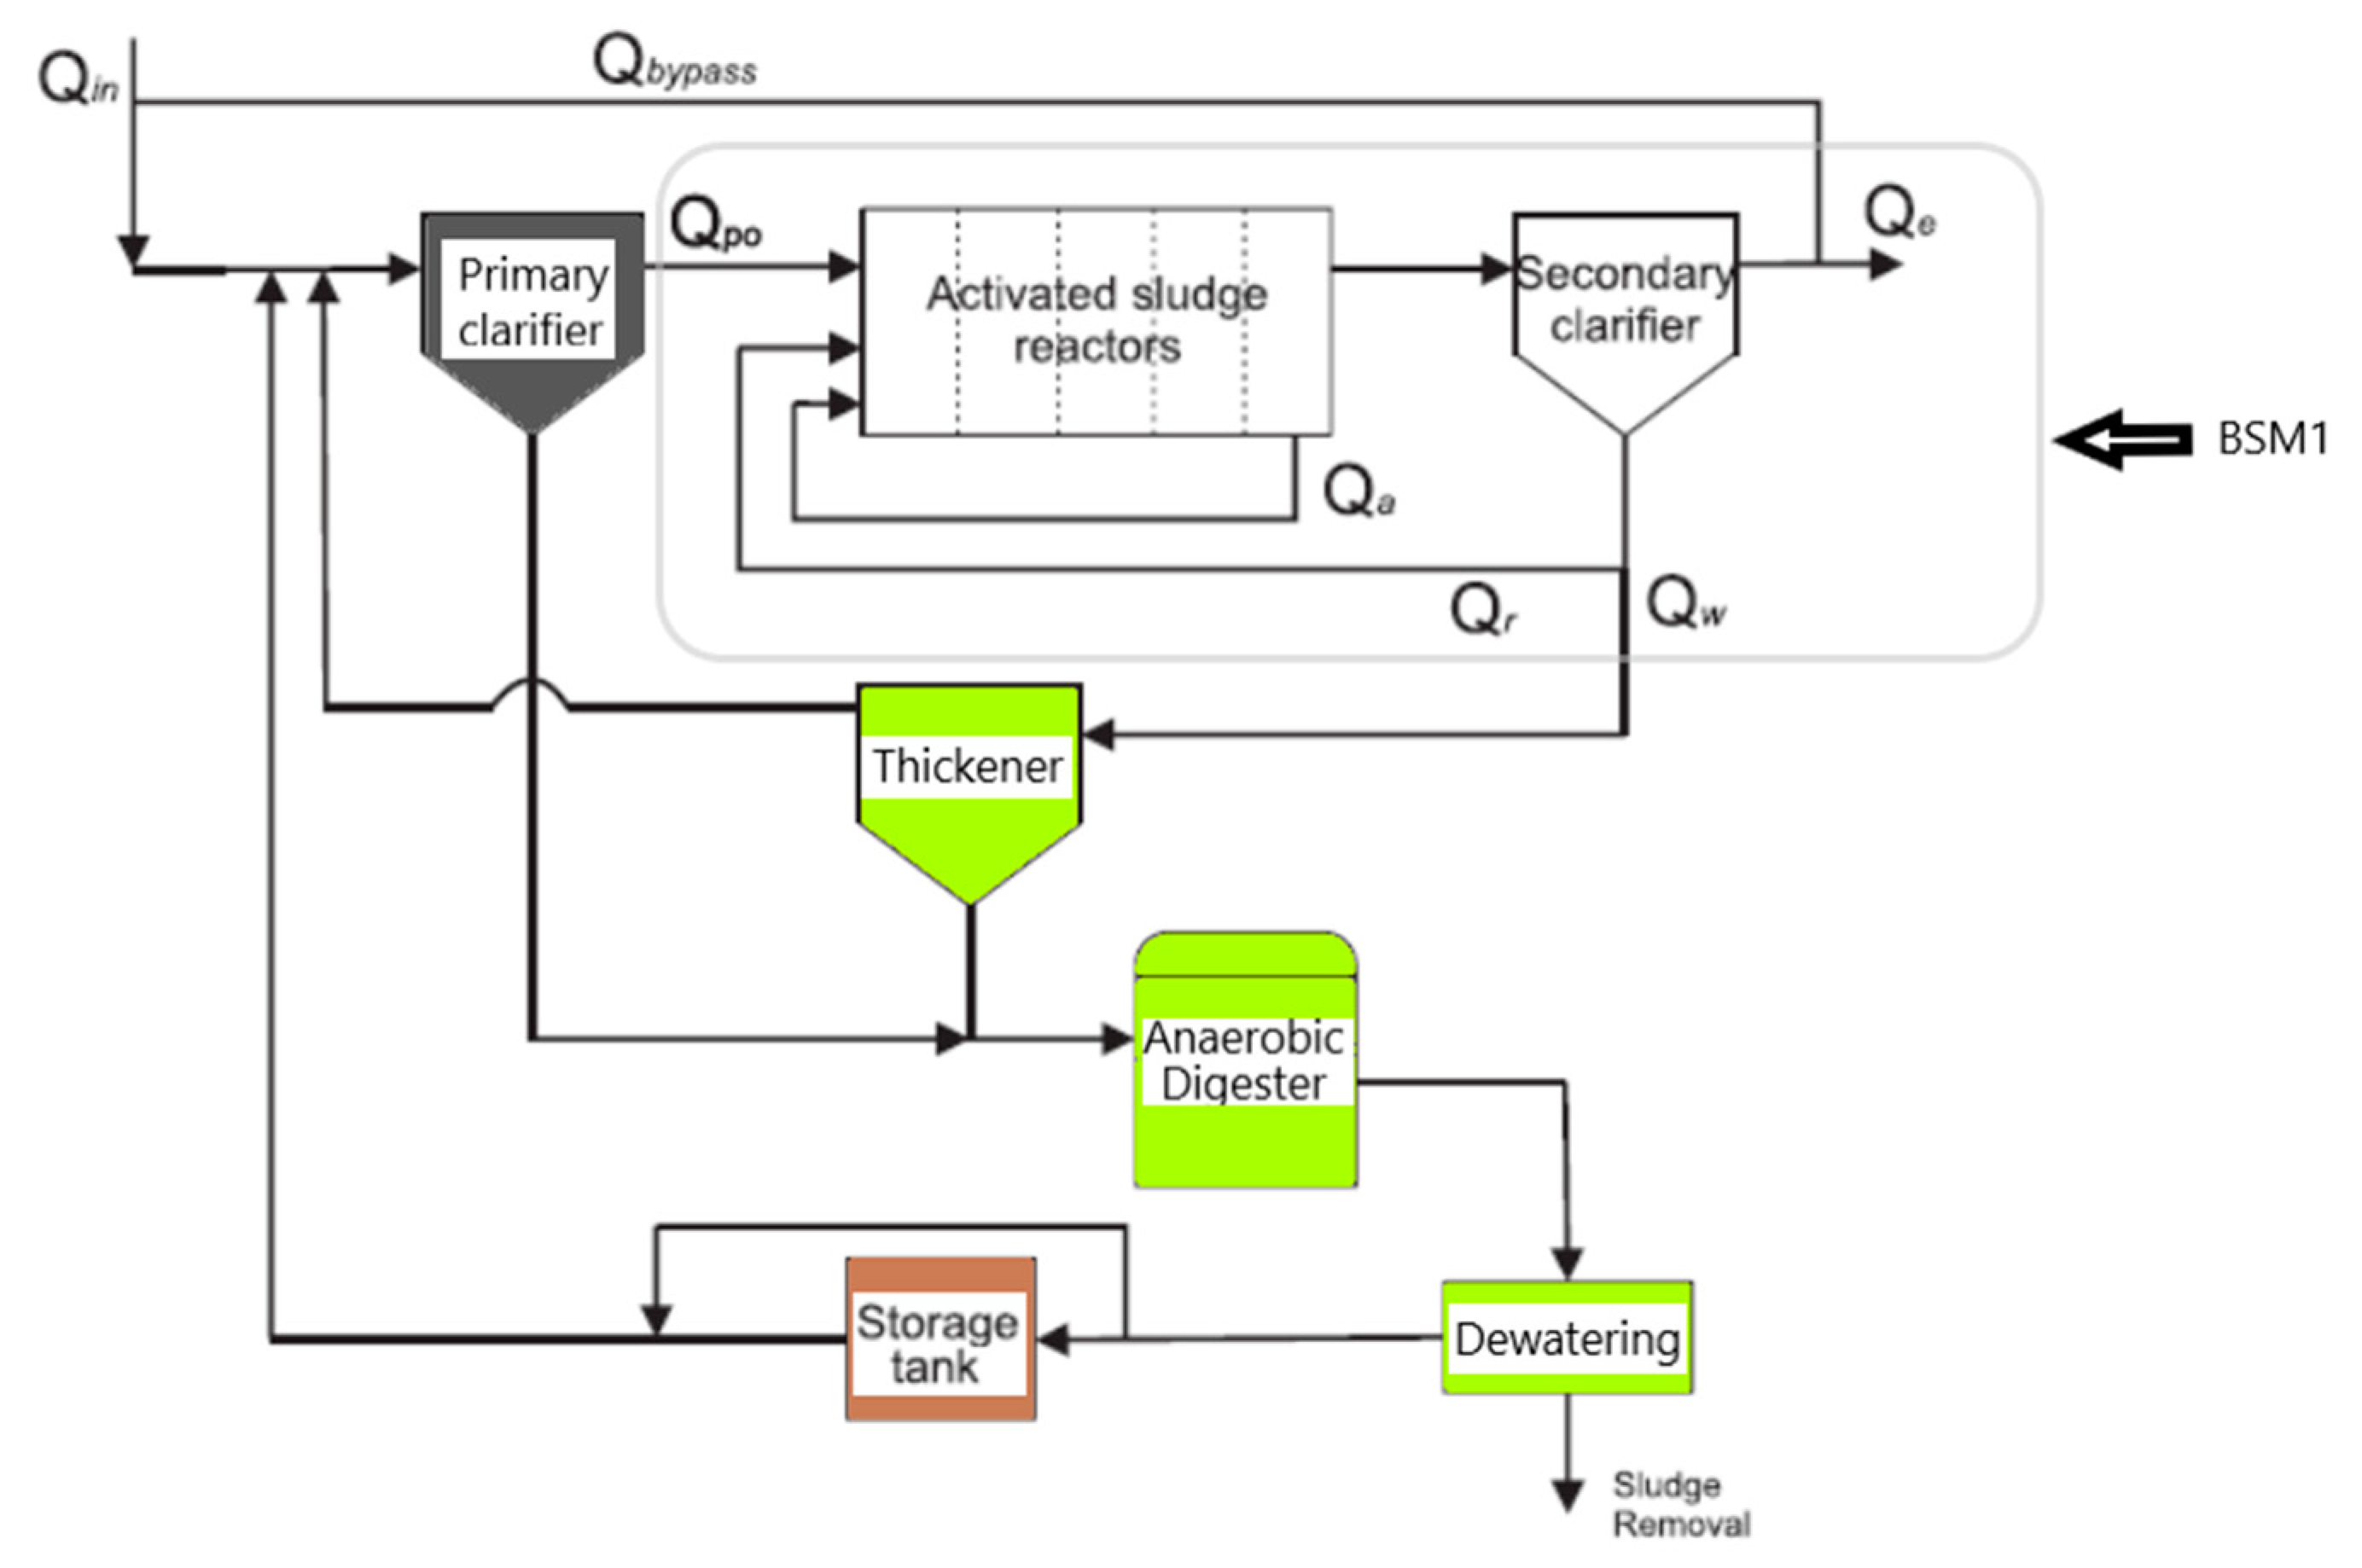
The BSM2 simulation environment [10,12,13] describes the plant layout, the simulation model, the influent profile, and the evaluation protocol. The BSM2 represents a WWTP comprising two operating lines: the water line and the sludge line (Figure 1). The water line includes primary clarification and activated sludge process units, and the sludge line includes anaerobic digestion, thickening units, and dewatering units. The BSM2 plant is described in [10,12,13], a detailed description of influent modelling is presented in [14], and the main characteristics associated with this study can be found in [2,9]. Table 1 summarizes the characteristic influence parameters.
In the water line of the BSM2 plant, a primary clarifier performs a pre-treatment of wastewater, which is the physical separation of the settleable solids from raw wastewater. The overflow is the input flow of the activated sludge process. The underflow is the primary sludge, which is treated in the sludge line. The volume of primary clarifier (VP) affects hydraulic retention time (th), which affects the removal efficiency of the soluble from the particulate organic matter measured as COD (chemical oxygen demand) [10]. In the BSM2 model, VP is defined as a fixed operation condition; however it is possible to directly change this operation variable; the input and output streams adjust to meet mass balances.
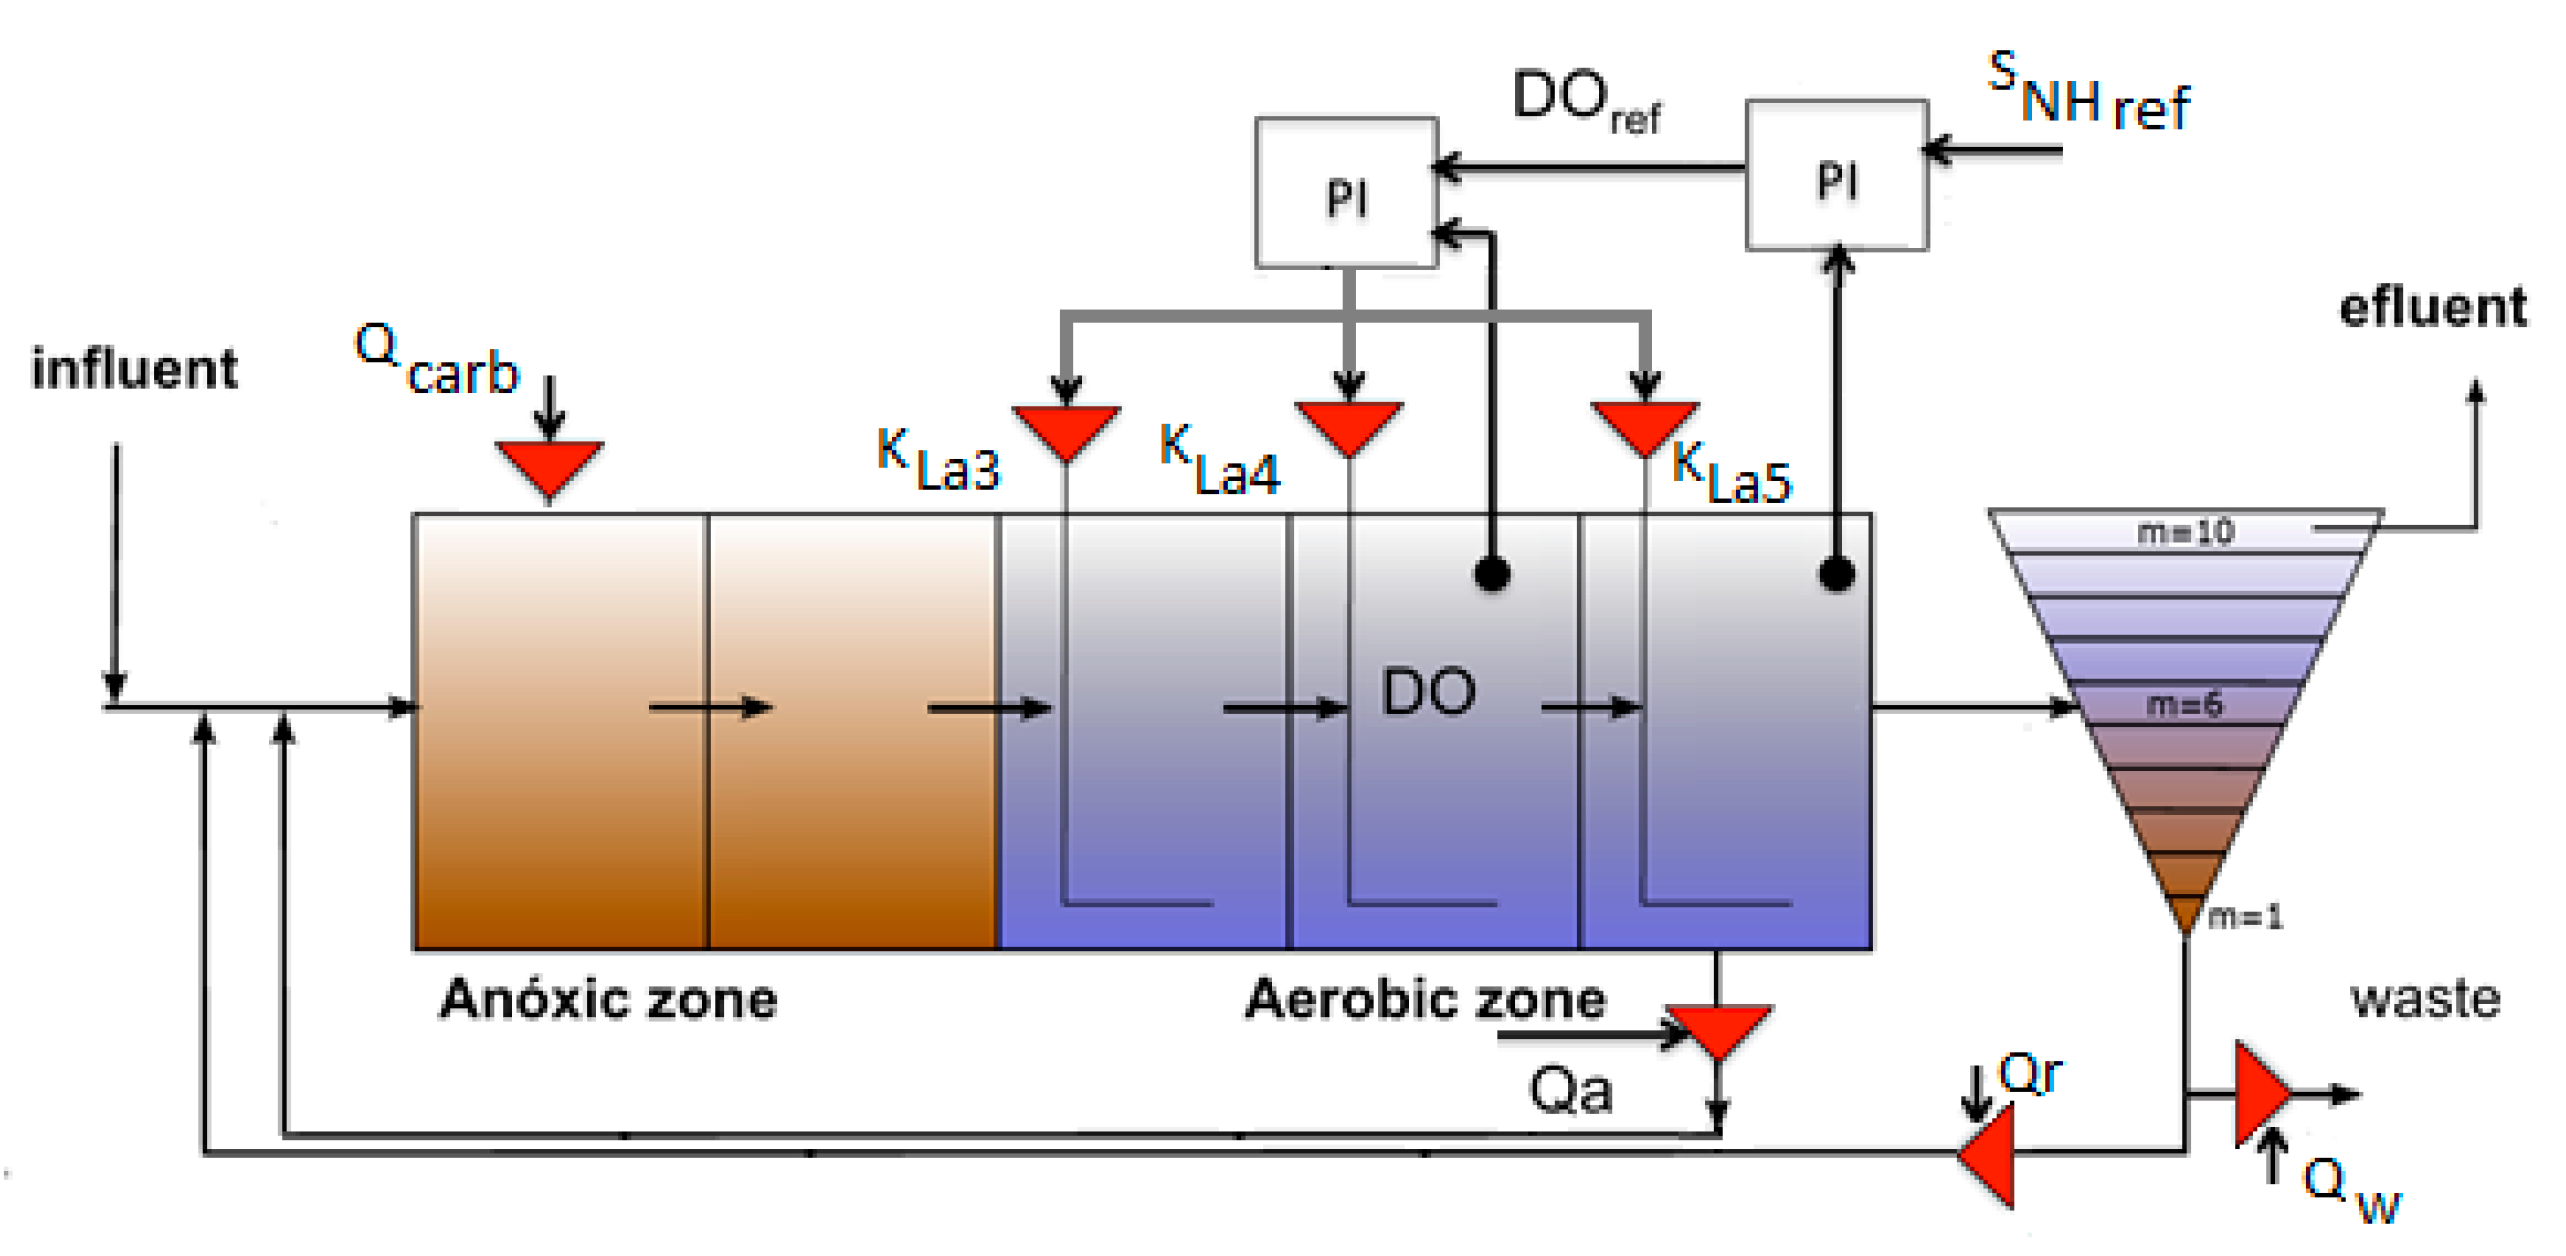
The activated sludge process (ASP) where biological elimination of nitrogen and organic matter takes place, is represented using the Benchmark Simulation Model 1 (BSM1) [15]. The BSM1 plant, represents a series of activated sludge reactors, the first two reactors are anoxic and perfectly mixed to facilitate the denitrification process, which is affected by internal recirculation (Qa) that transfer nitrates from the aerobic zone. The last three reactors are aerated to promote the nitrification step, which depends on Dissolved Oxygen (DO) concentration in the aerobic zone, which is regulated manipulating the air supply from the aeration system. The clean effluent (Qe) is discharged, and wastage flow (Qw) is fed to the sludge line and partly recycled to the anoxic zone (external recycle flow Qr). External carbon dosage (Qcarb) is necessary to keep the levels of biodegradable substrate required by heterotrophs for denitrification. The sludge recirculation (Qr) and the sludge purge flow (Qw) affect the food to microorganism ratio (F:M) and the sludge age or solids’ retention time (SRT), respectively.
Primary clarifier underflow (Qpu), named primary sludge, and wastage flow (Qw), named secondary sludge, connect the water line and sludge line. Due to the energy potential of biogas produced in anaerobic digestion, sludge management is crucial for the attainment of eco-efficiency goals [16].
In the sludge train, the thickener thickens the secondary sludge prior to being mixed with the primary sludge. The mixed sludge is fed to the anaerobic digester where organic matter is transformed, in the absence of oxygen, into biogas (65–70% CH4, 30–33% CO2, 1–2% H2) and digestate (digested sludge) [16]. The anaerobic digestion is affected by the loading rate, operation temperature of digester (Top), the solid’s retention time (more than 20 days), and pH (6.8–7.2). The biogas is used to provide the heating energy (HE) required by the sludge fed to the digester to reach the operation temperature (Top). The digester should be between 30 and 38 °C for mesophilic digestion [17]. BSM2 default value is Top = 35 °C. Then, the dewatering unit thickens the digestate (flow rate Qad). The reject water is recycled to the primary clarifier while the sludge for disposal can be used as fertilizer [4]; however, treatment could be necessary to guaranty health and safety conditions.
The biogas produced in anaerobic digestion can be used for electricity generation, or for the simultaneous production of heat and electricity. The cogeneration, attained by the use of Combined Heat and Power technologies (CHP) is a sound solution to cover heating requirements and reduce electricity consumption from external sources [16,17]. Thus, cogeneration reduces operation and environmental costs. Biogas-fueled CHP systems are available for installation in WWT facilities, and some alternatives are internal combustion engines, micro-gas turbines, combustion turbines, and fuel cells [16,18].
BSM2 considers a micro gas turbine for immediate electricity and heat production, required to heat the digester [19]. In this work, reciprocating engine (Rich-burn), with a 29.1% electrical efficiency, power to heat ratio of 0.62 and 76% CHP efficiency [20] is selected to produce energy from biogas. The energy content of biogas is estimated to be 13.89 kWh/kg CH4 in the BSM2 evaluation tool. Then, electricity produced from biogas is estimated to be 29.1% of the energy content of the biogas produced in the anaerobic digester (METprod).
2.2. Plantwide Control Strategy
For integrated processes comprised of several interconnected units, the application of plant-wide control approaches produces significant benefits. In BSM2, more than 60 control handles are available for the application of plant-wide control strategies, including almost all volumetric flow rates, external carbon dosage, and all possible combinations of mixing and aeration in ASP bioreactors [12,13,19].
The reference control system implemented in BSM2 considers aeration control based on a DO sensor in the fourth ASP reactor (set point 2 g/m3) and direct manipulation of the oxygen transfer coefficient (KLa4), while transfer coefficients of the third and fifth reactors (KLa3 and KLa5) are proportionally adjusted [10,15]. In practice, airflow rate is used as manipulated variable in the aerobic zone of ASP. An alternative control system that can be used in real practice (if an ammonium sensor is available) is the cascade control of ammonium concentration in the fifth ASP reactor (SNH5), (set-point 1 g/m3) by manipulating DO set points in the aerobic ASP reactors [21]. Ammonium-based control varies DO set point, in most cases to levels below set-point (2 g/m3) imposed by a DO control selected as the reference control system in BSM2. Consequently, aeration intensity is reduced in the periods of lower load, producing significant energy savings while total Nitrogen (Ntot) removal is improved, as have been shown in previous works [2,9].
According to Riegler et al. [21] the application of an ammonium-based control to limit aeration minimizes the impact of actuators of the aeration system, reduces energy consumption, and reduces operation costs. It partially limits nitrification rate and increases denitrification; it improves nitrogen removal while maintaining the levels of ammonia in the effluent below legal limits. This strategy reduces energy consumption of the ASP process and improves performance, avoiding the unnecessary use of resources (air supply), which is a desired characteristic to improve WWTP eco-efficiency goals.
Hence, the operation strategy considered in this paper for the BSM2 plant (summarized in Table 2) combines the cascade control of ammonium concentration in the last ASP reactor, which is an improvement of the ammonium-based control strategy used in [2,9], with the control actions contemplated in the reference BSM2 operation strategy [10]. In the proposed ammonium control scheme (Figure 2), an external Proportional Integral (PI) loop manipulates DO set-point of the fourth ASP reactor, and the DO reference control system is the secondary control loop of cascade scheme. This strategy, named Default Strategy, reduces energy consumption with respect to [2,9], because the variation of the DO set-point is reduced to 1.0–2.5 g/m3. The PI controllers used in the cascaded ammonium control scheme are of the form:
where u is the manipulated variable, y is the controlled variable, ysp the desired set-point, ylim the limit values of the controlled variables, Kp is the proportional gain and Ti the integral time, and Tt is the anti-windup constant
Table 2 summarizes the main parameters involved on BSM2 operation strategy considered in this paper. It is identified as the Default strategy.
2.2.1. Selection of Control Actions to Improve Eco-Efficiency of WWTP
The effects of control actions are evaluated in Section 3 to find the conditions with a positive effect on WWTP eco-efficiency in the full operation horizon, or in a given period of time. The analysis is performed from a plant-wide perspective, since control handles associated with different units of the plant are considered. The control handles to be evaluated are selected considering the possibility increase biogas availability and reduce energy consumption, with a minimum effect on effluent quality.
The selected control handles are:
- Primary clarifier volume (VP-m3).
- Operation temperature of digester (Top-°C)
- Limits imposed on DO set-point in the primary loop of ammonium control (DOsp-g/m3)
- Internal recycle flow of activated sludge process (Qa-m3/d)
- Wastage flow of activated sludge process (Qw-m3/d)
- Ammonium set-point (SNHSP-g/m3)
Preliminary simulations of BSM2 response have been performed to determine magnitude of the changes applied on selected control handles with a significant effect on plant response and eco-efficiency indicators.
Table 3 summarizes selected control changes and variations. The control handles are changed from default condition to a lower and larger value. Each variation is maintained in the full operation horizon (one year), and its effect on performance indicators is evaluated considering the impact on average annual values of indicators and the impact on the dynamic input profile when seasonal effects are relevant.
The knowledge of process behavior and process model, and the observation of preliminary simulation, make it possible to distinguish between slow dynamics control actions and faster dynamics control actions.
Anaerobic digestion exhibits a large time constant, with solid retention time over 20 days, and the effect of changes on Top on plant performance indicators is evidenced on larger periods of time (weeks to months). Regarding the volume of primary clarifier, in real practice VP is affected by seasonal variations of influent flow, therefore, VP can change on larger periods of time (months). Clarifier sludge blanket depth is regulated by sludge withdrawal, it affects VP. Then, in this study, modification of VP and Top are considered slow dynamic control actions. On the other hand, Qa, Qw, DOsp, and SNHSP are ASP operation variables, and the process exhibits and hydraulic retention time of 12–24 h; Qa and Qw modifications affect WWTP behavior on a scale of hours to days, and DOsp and SNHSP modifications affect behavior on a scale of minutes to hours.
It is important to mention, that in BSM2 model, primary clarifier overflow Qpo and Qbypass (Figure 1) are available as control handles. In simulations VP has been changed directly as the reference of a closed loop level control system, then Qpo has been adjusted to keep the equilibrium. The other possible way of changing VP is bypassing from ASP (Activating Qbypass in BSM2 model), but this modification significantly increases pollution levels in the effluent, and it is discarded as a control action.
2.3. Performance Indicators and Energy Recovery
The BSM2 platform provides a systematic protocol for the evaluation of the operational strategies tested in the plant [10,15]. The most important variables associated with the load and composition of influent, effluent, biogas, and sludge are computed for a given evaluation period (from to to tf). Key performance indicators are included to measure influent and effluent quality, violations of the limits imposed over the levels of pollutants in the effluent, energy requirements, and overall operation costs. The default evaluation period is one year, starting the 1st of July, but shorter or larger temporal windows can be considered.
The effluent quality is determined by the levels of pollutants in the effluent: Nitrogen (Ntot), ammonium (SNH), nitrates (SNO), total Chemical Oxygen Demand (COD), total Suspended Solids (TSS), and Biological Oxygen Demand (BOD5). The effluent quality requirements considered in this work, as are those given by the BSM2 platform [10,13,15]: Ntot < 18 gN/m3, SNH < 4 gN/m3, COD <100 gCOD/m3, TSS < 30 g/m3.
The effluent quality index defined in theBSM2 protocol to measure pollution load of the plant discharge [8,14] is defined as follows:
where and T is the evaluation period, from to to tf in days.
The biological oxygen demand (BOD), chemical oxygen demand (COD), total nitrogen concentration (Ntot), and suspended solids (SS) are computed in terms of ASM1 variables as shown in [10,15].
The Influent Quality Index (IQI) is also defined to measure influent pollution [10,15]:
where SSi, CODi, Ntoti, and BODi are analogous to SSe, CODe, Ntote, and BODe but the subscript index i denotes that indicators are measured in the influent.
The global operational cost index (OCI) is [10,19]:
where AE represents the aeration energy in the activated sludge process, PE is the pumping energy in the full plant (involving all flows), ME is the mixing energy in the full plant, SP is the sludge production for disposal, EC is the external carbon addition, and MP is the methane production.
The indicators associated with energy use and heating energy production from biogas considered in the BSM2 evaluation protocol are presented here to address energy efficiency. In the following equations, T is the evaluation period, from to to tf in days
Pumping energy is computed considering the pumps available on each unit [10]:
Qa is the internal recycle flow, Qr is the external recirculation flow, Qw is the wastage flow, Qpu is the primary clarifier bottom flow, Qtu is the thickener feed flow, and Qdu is the dewatering unit bottom flow.
The aeration energy depends on aeration system characteristics: type of diffuser, bubble size, and depth of submersion. It is computed from the oxygen transfer coefficient on each reactor KLak, SO,sat concentration of saturation of oxygen and volume Vk, for Degrémont DP230 porous disks at an immersion depth of 4 m [10]:
The mixing energy (ME) is computed for activated sludge reactors if KLak(t) < 20d−1 (Vk is the volume of each reactor) and digester volume Vad [10]:
Methane produced in anaerobic digester is used to cover its heating requirements; therefore, the BSM2 protocol calculates the net heating energy HEnet as [10,17]:
where HE is heating energy necessary to heat the sludge to the digester operating temperature and METprod is the methane production (kg/d) [10,18]:
where Qgas is the total flow of gas from the anaerobic digester, pgas, CH4 is the partial pressure of methane in the mixture of gases, and Pgas is total pressure of the gas that contains methane, carbon dioxide, and hydrogen, R is the ideal gases constant 0.083 barL/molK, Top is the operation temperature of digester, and Patm is atmospheric pressure.
The heat required to reach the operation temperature of digester is computed from the following expression, where Qad is digester feed flow [10], Qpu is primary clarifier underflow, Qad is thickener output flow, and Tpu is temperature of primary clarifier underflow and Ttu is thickener output temperature:
The CHP system produces the heat required to cover digester requirements according to Equation (7), but the selected reciprocating engine exhibits a heat to power ratio of 0.62, then total heating energy produced is computed as:
and heat in excess is calculated from:
Finally, net energy used by BSM2 plant with reciprocating engine for cogeneration is computed as:
It is interesting to use efficiency indices as a measure of performance. In this case, the ratio between pollution removed by BSM2 plant in kg and the energy consumed to achieve such objective (kWh) is considered. For comparison purposes, two versions of the index are used, the ratio between pollution removed and the total energy required and the ratio between pollution removed and net energy used.
2.3.1. Definition of Temporal Windows to Observe Seasonal Effects of Temperature and Selection of Performance Indicators
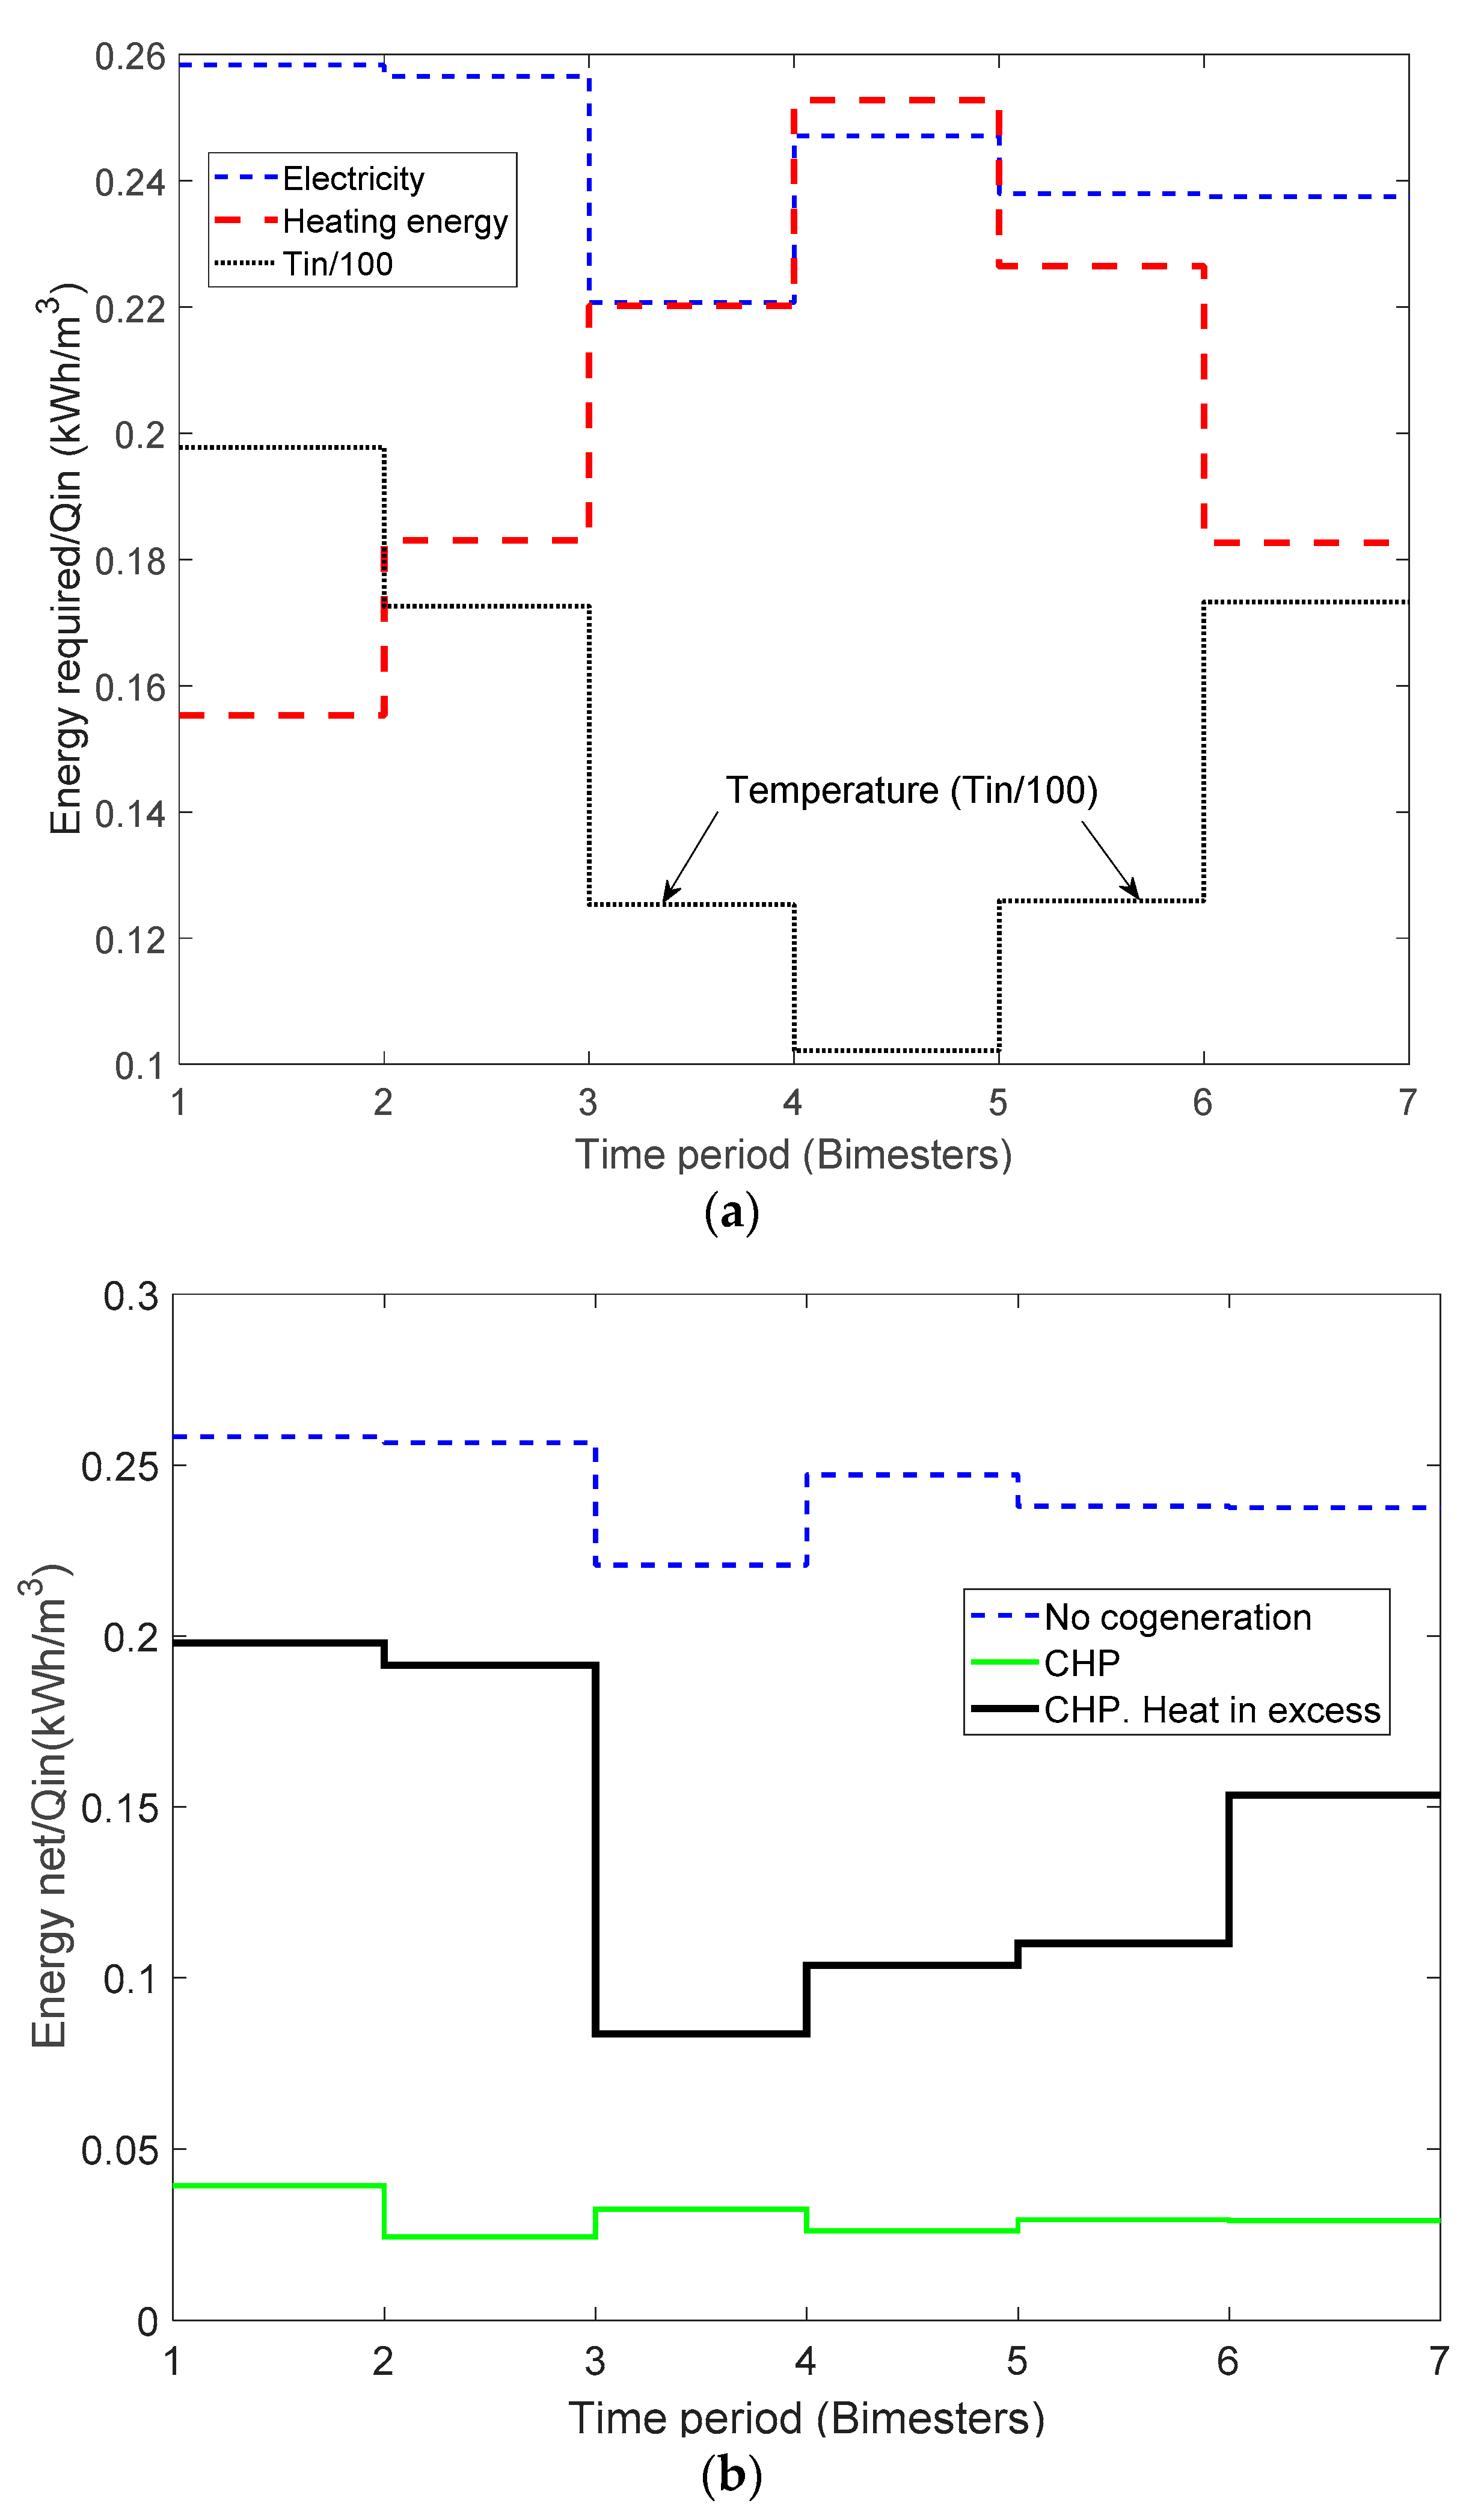
The analysis is carried out considering the annual average values of indicators and the dynamic evolution of indicators to capture seasonal effects associated with influent temperature variations (Tin). In the BSM2 model a sine function is used to represent the gradual variation of temperature in a year. Warmer seasons with temperatures close to 20 °C and colder seasons with temperatures close to 10 °C are distinguished, as well as periods of mild temperatures close to 15 °C. To differentiate the seasons, a bimestrial dynamic profile is considered. Then, the operation horizon is divided in six (6) temporal windows. The first one is the warmest period, the second and the sixth are periods of moderate temperatures, the third and fifth bimesters are colder, and the fourth is the coldest period (Figure 3a).
The assessment of the effect of control actions on performance is carried out considering eco-efficient indicators of energy consumption and the potential to produce energy from biogas, energy self-sufficiency, effluent quality, emissions to air (CO2 produced in anaerobic digestion), and emissions to soil (sludge for disposal).
Then, the indicators selected for the evaluation of the impact of control actions are:
- Biogas flow (Qgas-m3/d)
- Heating energy (HE-kWh) (Equation (9))
- Net energy (Energy net-kWh/d) (Equation (13))
- Electricity consumption (Electricity, PE +AE + ME-kWh/d) (Equations (4)–(6))
- Effluent quality indicators: effluent quality index (EQI-kg/d) (Equation (1)), total nitrogen (Ntot-g/d), ammonium concentration in the effluent (SNH-g/d)
- Sludge for disposal (Sludge-kg/d)
All indicators are expressed with respect to average influent flow Qin (m3/h) in such a period.
Analysis focuses in BSM2 variables, and, therefore, chemical or biological elimination of phosphorus is not considered in the performance analysis.
The result of the analysis of the effect of control actions is a set of possible solutions (control strategies), that combines sequences of changes on control handles that improve WWTP eco-efficiency, either in the full operation period or in a specific season defined by bimestrial temporal windows. The comparison of the proposed solutions is performed through the analysis of the dynamic profiles of the mentioned indicators of performance and the evaluation of the average annual values of indicators of effluent quality, energy efficiency, and economic performance as:
- Effluent quality index (EQI-kg/d)
- Overall Cost Index (OCI-Eur/d) (Equation (3))
- Net energy (Energy net-kWh/d) (Equation (13))
- Excess heating energy (HEExcess- kWh/d) (Equation (12))
- Electricity consumption (Electricity, PE + AE + ME-kWh/d) (Equations (4)–(6))
- Pumping energy (kWh/d) (Equation (4))
- Aeration energy (AE kWh/d) (Equation (5))
- Heating energy (HE kWh/d) (Equation (9))
- Energy/Pollution removed (kg/kWh) (Inverse of Equation (14))
- Energy net/Pollution removed (kg/kWh) (Inverse of Equation (15))
- Violations of the permit limits of total Nitrogen (Ntot-g/d), ammonium concentration (SNH-g/d) and COD in the effluent
2.3.2. Energy Issues Associated with CHP Implementation
The Combined Heat and Power (CHP) system, used to obtain electricity and heat from biogas, is a key element to achieve eco-efficiency goals in the WWTP. Furthermore, it determines the connection between the water line and sludge line in terms of energy flows. The bimestrial profiles of electricity (Electricity, PE +AE + ME-kWh/d), heating energy requirements (Equation (9)) of BSM2 plant under Default strategy (Table 2) are presented in Figure 3a together with an influent temperature profile. As expected, heating energy requirements increase as temperature decreases while the electricity profile does not exhibit temperature dependency. It is also observed that heating energy requirements are significantly lower than electricity requirements in the warmer bimesters (1,2,6), but in the colder bimesters (3,4,5) energy requirements for heating purposes and electricity use are similar in magnitude. Figure 3b compares net energy of the plant when biogas is used only for heating purposes and when the CHP system is used to generate electricity and heat (Enet, Equation (13)). The difference between blue and green lines in Figure 3b (no cogeneration and CHP) evidence the significant reduction on external energy demand, as biogas provides approximately 85% of electricity, while heat in excess (black line) is still available to other purposes in WWTP. When biogas is used only for heating, it is assumed that biogas in excess is flared, and electricity is obtained from external sources with the corresponding impact on operation costs and direct and indirect emissions of greenhouse gases (GHG). The comparison illustrates the importance of cogeneration system to self-sufficiency and energy efficiency of the WWTP. A detailed review of biogas energy recovery options can be found in [17,20].
3. Results and Discussion
3.1. Assesment of the Effect of Individual Control Actions on WWTP Eco-Efficiency
The effect of each control movement on energy consumption, biogas production, energy recovery from biogas, effluent quality, CO2 produced in anaerobic digestion, and sludge for disposal is evaluated. Annual average values of indicators are computed to measure the performance in the full operation period, and bimestrial variations are considered to capture relevant and beneficial seasonal effects associated with temperature variation.
The selected control handles (Section 2.2.1) are varied, increasing, and decreasing their default values (see Table 3), and the effect on performance indicators (Section 2.3.1) is analyzed. Results for slower dynamics control actions are separated from faster dynamics control action to facilitate discussion of results. The percentage deviations of performance indicators, with respect to Default Strategy for each variation on control actions, are computed. Except for biogas flow (Qgas/Qin), a positive deviation implies that the evaluated control action produces an improvement on energy consumption, effluent quality or sludge for disposal reducing the magnitude of the performance indicator. Only in the case of biogas flow does a negative deviation represent a beneficial effect of the control action since it is desired to increase biogas production to increase the potential production of energy.
3.1.1. Impact on Annual Average Performance Indicators
Table 4 shows the effect on annual average indicators of the changes applied to primary clarifier volume (VP) and digester temperature (Top). These are considered to be slower dynamic control actions. Symmetrical dynamic profiles have been observed on performance indicators; therefore, results of bimestrial evaluation are not presented here. Performance indicators for Default Strategy are presented in the first column and deviations for each control action are presented in the subsequent columns. There, it is observed that increasing VP to 1000 m3 produces a significant reduction of net energy (Enet) which reduces energy consumption from external sources. It also produces a slight increase of biogas production, and a slight decrease on heating energy (HE) and electricity consumption. Minor undesirable effects are also observed on effluent quality (EQI) and total nitrogen (Ntot) removal and no effect is observed on the production of sludge for disposal. On the other hand, Top variation only affects heating energy requirements (HE) and consequently, net energy (Enet), producing considerable benefits when Top is reduced to 32 °C.
These control actions affect energy efficiency with a minimum impact on effluent quality. Their effect could be complementary and affect digester operation variables in similar time scales. VP affects biogas production of the digester and consequently, net energy, and Top affects heating energy of digester (HE), and consequently, net energy (Enet).
The effects of control actions that exhibit faster dynamics Qa, Qw, DOsp, and SNHSP on annual average values of performance indicators are presented in Table 5. First, it is observed that most of these control actions do not affect indicators associated with digester operation: biogas production, heating energy (HE), and sludge for disposal production. On the other hand, as in the case of slower dynamic control actions, all actions produce a significant variation of net energy. Regarding effluent quality indicators, ammonium concentration in the effluent (SNH) is affected by all these faster dynamic control actions, but the effect of the slow dynamics control actions was negligible. Internal recycle flow (Qa) and ammonium set-point (SNHSP) also affects total nitrogen (Ntot) concentration in the effluent. Regarding wastage flow manipulation (Qw), changes applied on this control handle, produce negative effects on WWTP eco-efficiency. However, it is the only selected control handle that affects the amount of sludge for disposal. Biogas production decreases and net energy consumption is significantly increased when constant Qw = 300 m3/d is kept for the full operation period, while effluent quality is worsened when constant Qw = 450 m3/d is maintained.
In all instances of evaluation of the impact of control actions on annual average values of performance indicators, net energy is affected because the sludge line and water line are connected by energy flow when biogas is used to produce electricity; therefore, it is affected by any action that affects any operation line. On the other hand, changes in Qw, that are another link between water and sludge lines, produce an appreciable impact in all performance indicators considered in the study. An approximate constant CH4/CO2 ratio of 0.69 is computed for all the changes on control actions (Table 4 and Table 5), then variations are neglectable in all cases that suggest that CO2 production in anaerobic digester with respect to biogas production is not affected by selected control actions.
3.1.2. Impact on Bimestrial Average Performance Indicators
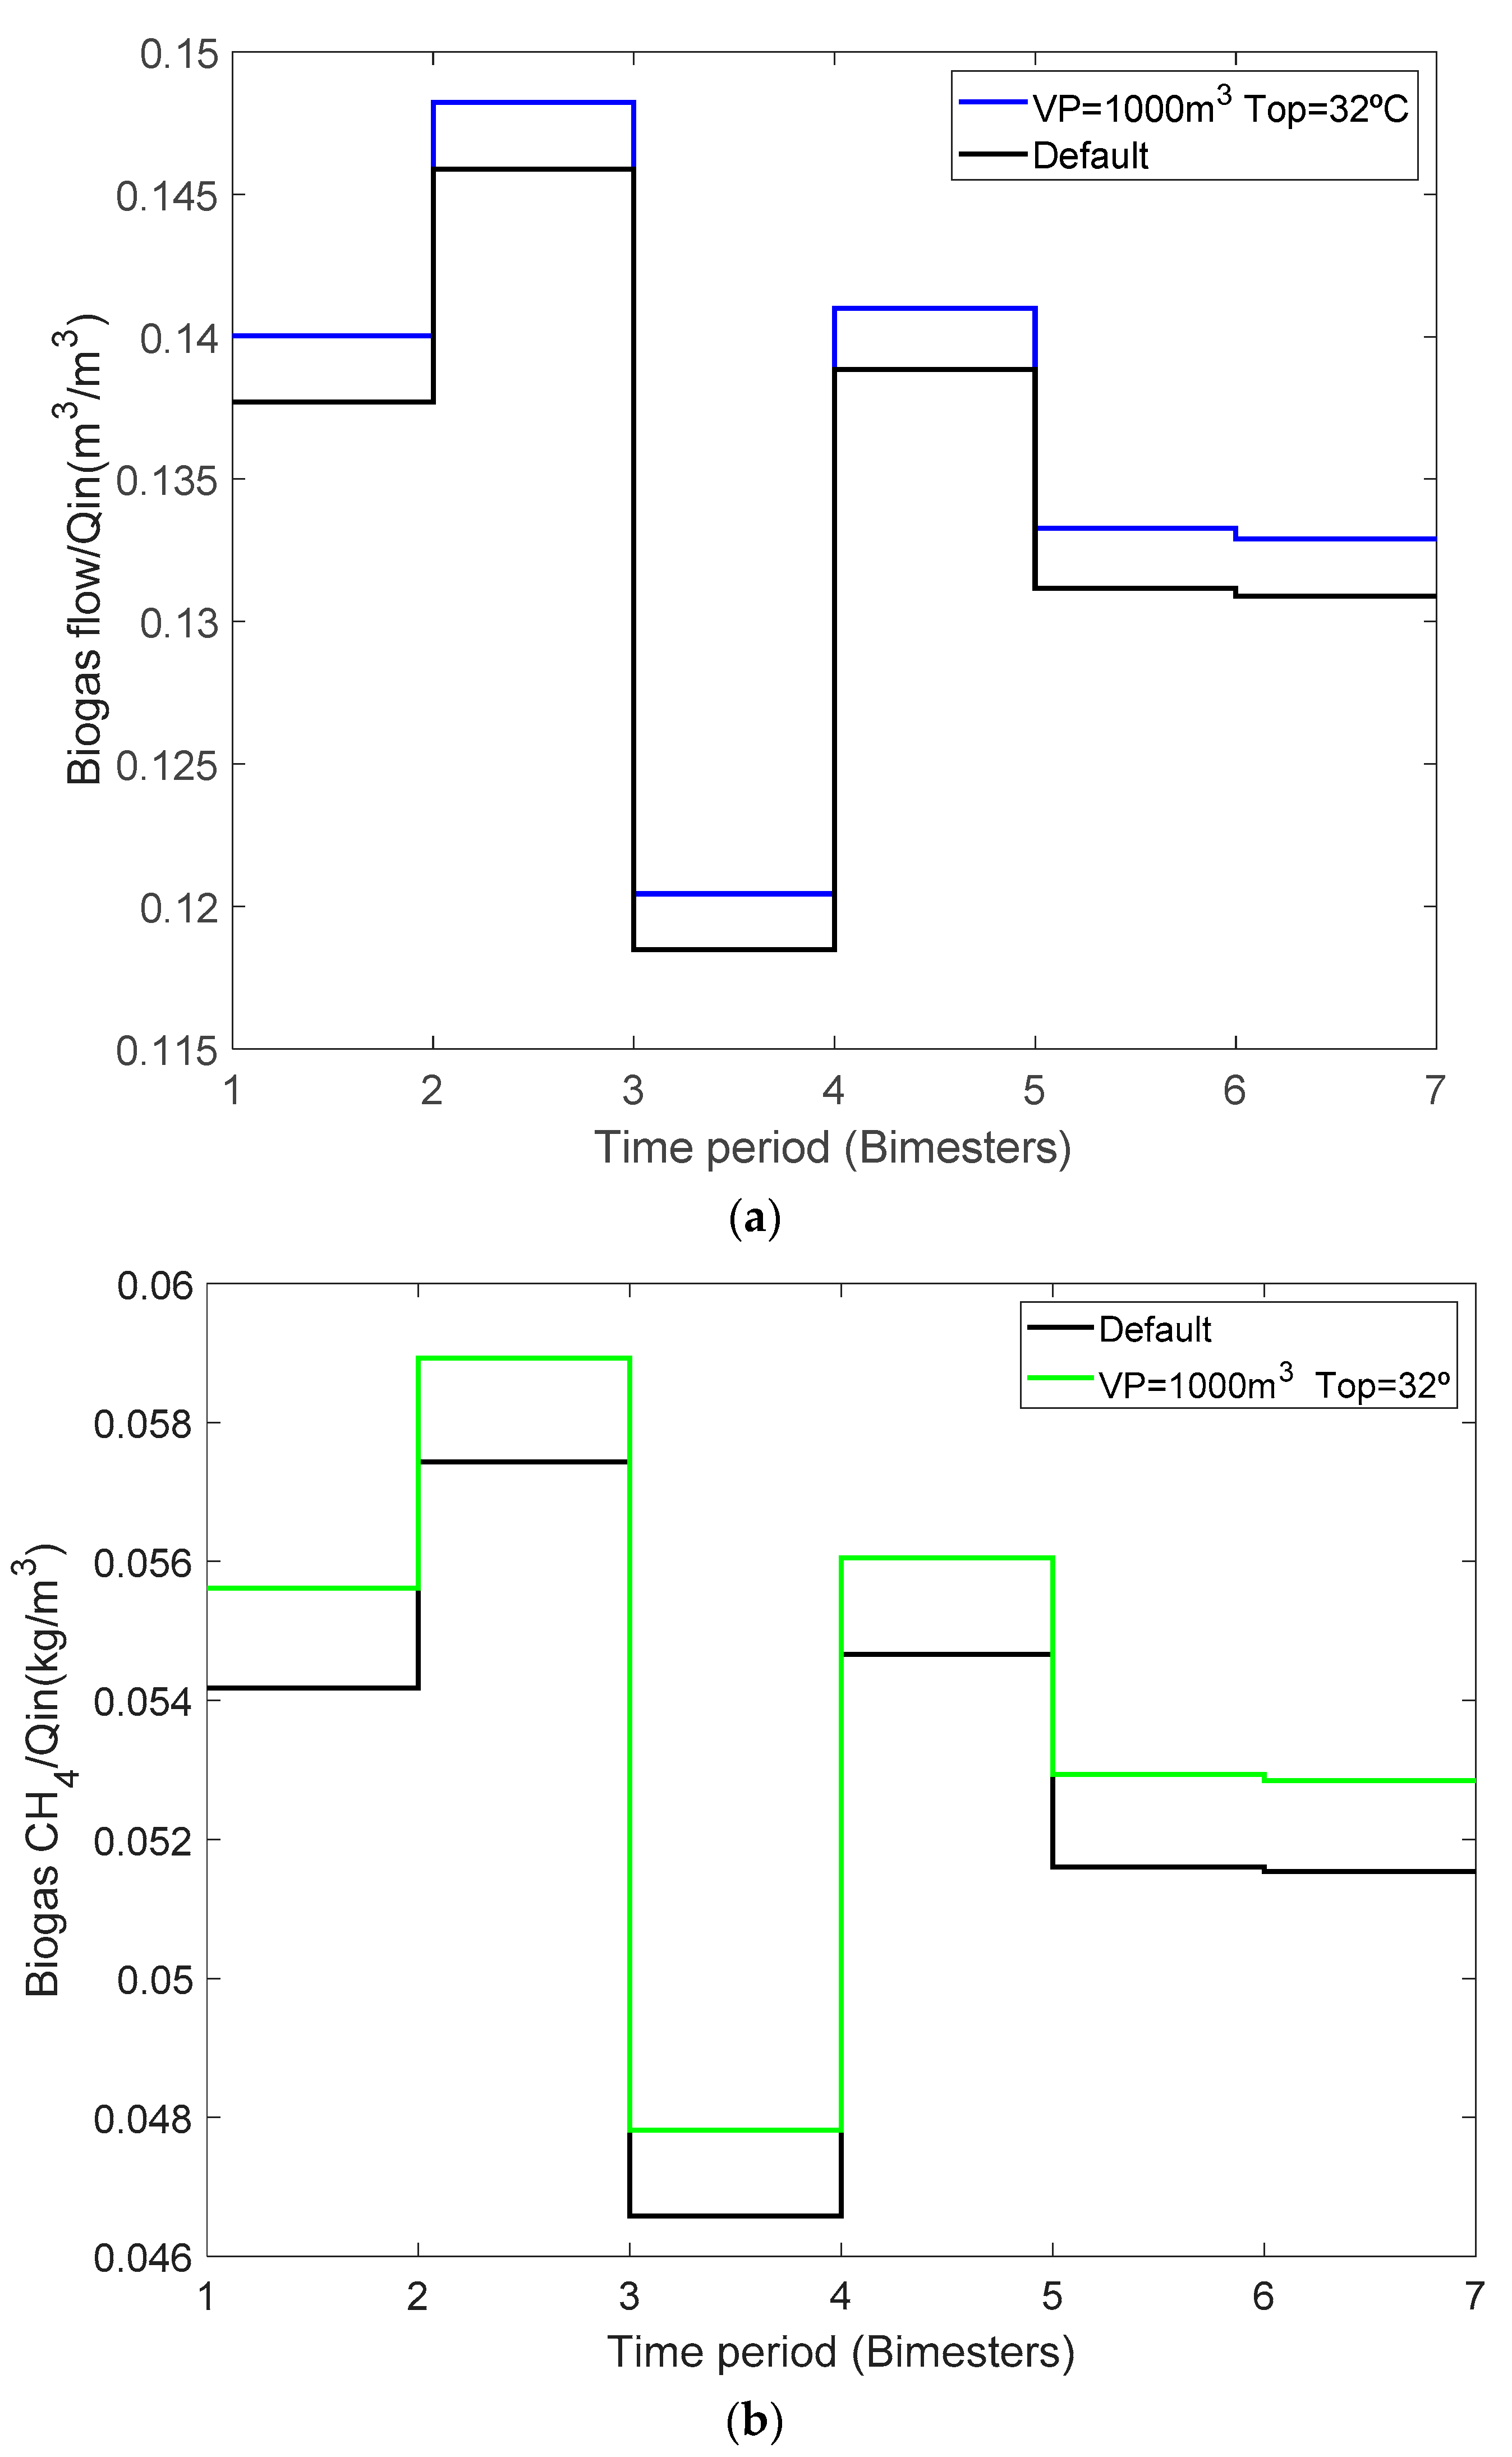
Primary settler volume VP and digester operation temperature Top, are the only control actions that affect indicators of performance of anaerobic digester, then bimestrial profiles of biogas flow and methane content of biogas are presented in Figure 4a,b for simultaneous variation of VP to 1000 m3 and Top to 32 °C. Figures show how the magnitude of indicators in both profiles increases uniformly in the whole operation horizon. Therefore, the changes in these slow dynamics operation conditions can be applied in the full operation period to increase the amount and the quality of biogas.
Since faster dynamic control actions, Qa, Qw, DOsp, and SNHSP exhibited a significant impact on effluent quality indicators (EQI, Ntot, SNH), and electricity consumption in ASP is crucial for process efficiency, the analysis focuses only on Electricity, EQI, Ntot, and SNH indicators. Table 6 shows the effect of selected faster dynamic control actions on performance indicators considering bimestrial temporal windows. Percentage deviations of performance indicators with respect to Default Strategy (Table 2), for each variation on control actions, are computed for each bimester. From the observation of the table, different situations where performance indicators exhibit different reactions to control actions on different periods of time are detected. For instance, relaxing DO set-point range to 0.5–4 g/m3, decreases electricity consumption in the first and sixth bimesters, but increases consumption from the second to the fifth bimester. Total Nitrogen (Ntot) is worsened in the 3rd and 4th bimesters but improved the rest of the bimesters. This is an interesting observation that allows us to define specific periods of time where certain control actions could be applied to improve performance. Moreover, even though the effect of a control movement is beneficial or unfavorable for performance in the whole operation horizon, the percentage variations of performance indicators in the different bimesters are heterogeneous, which indicates a non-linear effect of the same control action along the operation horizon.
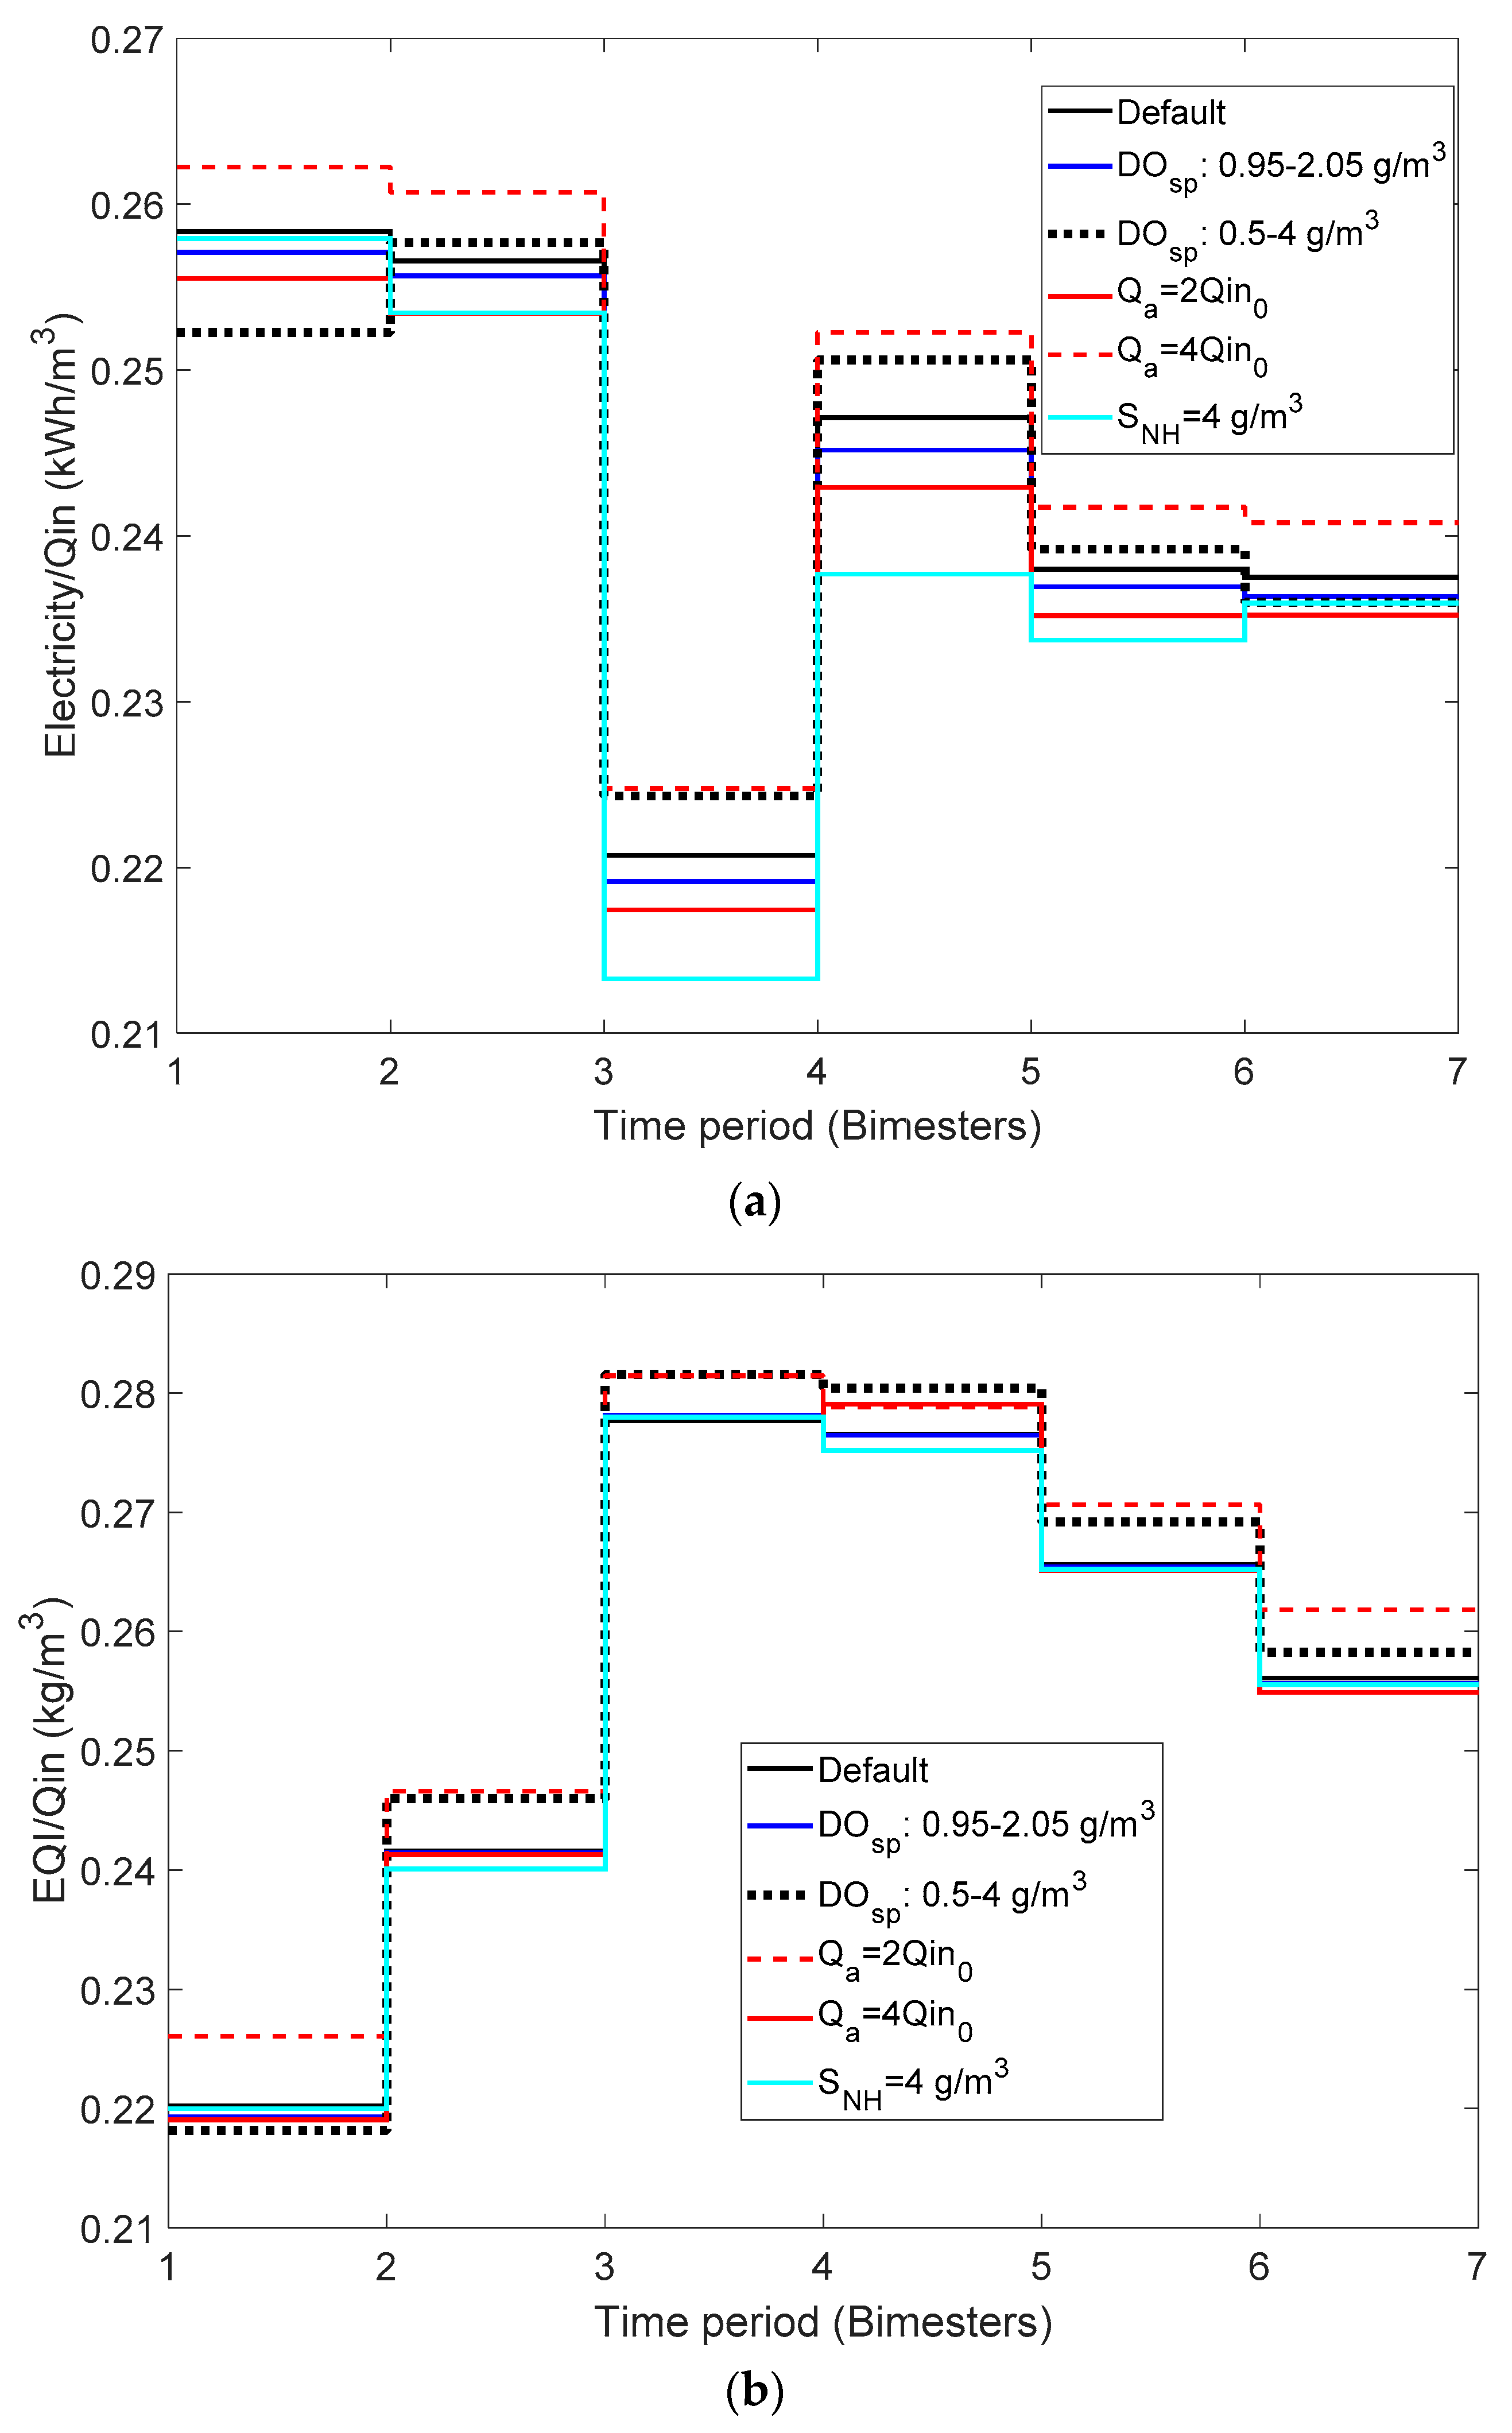
Figure 5a,b show the bimestrial profile of electricity consumption and effluent quality index (EQI) for changes in the faster dynamics control actions. It is observed that profiles are not uniformly separated parallel lines, but variations of different magnitude and tendency are observed on each bimester. However, differences between the different profiles seem to be larger in the colder bimester. Variability of the magnitude of the profiles for different control actions is considerable for electricity consumption, while effluent quality does not exhibit significant variations between different control actions.
3.2. Plantwide Control Solutions to Improve WWTP Eco-Efficiency Framework
Bimestrial variations of performance indicators have been used to determine the temporal windows where specific control actions produce beneficial effects that can be translated to improvements of WWTP eco-efficiency. Data presented in Table 6 and bimestrial profiles of performance indicators were examined, and multiple objectives were considered to select the appropriated control actions to be applied in each bimester. Improving WWTP eco-efficiency implies attaining a compromise solution between these goals: reducing energy consumption (net energy, electricity consumption), increasing biogas volumetric flow to produce as much as necessary heat and electricity for self-sustaining operation, and improving effluent quality indicators, or at least, producing the minimum deterioration on effluent quality indicators.
Four possible solutions are proposed from the examination of Table 6 and bimestrial profiles of each indicator: Solution 1, Solution 2, Solution 1 VP, Top and Solution 2 VP, Top. Each possible solution has been designed following a simple multi-objective optimization procedure.
The first strategy, named Solution 1, is obtained from the selection of the changes on faster dynamic control actions that improve the major number of indicators on each bimester, disregarding the effects on ammonium concentration in the effluent (SNH). An exception is considered in the third bimester, where electricity consumption is minimal, so the priority for the selection of control action was the improvement of effluent quality indicators. The criteria to formulate the second strategy, named Solution 2, is the selection of the possible combination of control actions that improve the major number of indicators, avoiding significant deterioration of ammonium concentration in the effluent (SNH). VP and Top conserve their default values VP = 900 m3 and Top = 35 °C. On the other hand, from the analysis of Section 3.1, VP = 1000 m3 and Top = 32 °C could be applied in the full operation horizon to increase biogas production that is a desired effect to enhance WWTP eco-efficiency. This condition is combined with Solution 1 and Solution 2, to obtain the strategies named Solution 1 VP, Top and Solution 2 VP, Top. The changes on faster control actions performed of each bimester for each proposed solution are presented in Table 7.
The four possible solutions (control strategies), consisting of sequences of changes on control handles applied on each bimester that improve WWTP eco-efficiency goals are implemented in BSM2 plant. Electricity consumption and EQI are presented in Figure 5, but for the sake of simplicity the dynamic profiles of the other indicators are not presented in the paper, since the same information is presented in Table 6.
The comparison of Default Strategy and proposed solutions considering the annual average values of indicators of effluent quality, energy efficiency and economic performance, is presented in Table 8.
The comparison of Default Strategy and Solutions 1 and 2, the three strategies where VP = 900 m3 and Top = 35 °C, considering information of Table 8, shows that selected changes on faster dynamics control actions produce slight to moderate improvements on the indicators associated with operation costs and energy consumption (OCI and energy consumption indicators associated with electricity use). Heating energy requirements and available heating energy in excess are not affected by changes in the faster dynamics control actions. Therefore, the favorable effect of Solution 1 and Solution 2 is associated with energy savings attained with the application of selected faster dynamic control actions and exploitation of electricity produced by the CHP system. Regarding the effect on effluent quality, violations of the Ntot and SNH limits are slightly worsened on percentage, incidence, and duration with proposed solutions, but deterioration is not significant except for Ntot violations with Solution 1, the impact on EQI is not significant. Similar ratios between pollution removal and energy required and pollution removal and net energy are observed for the Default Strategy and proposed solutions. Operation costs quantified by OCI are slightly reduced applying Solution 1 and Solution 2.
On the other hand, information in Table 8 reveals that Solution 1 VP, Top and Solution 2 VP, Top, produce a significant improvement on net energy due to the increase of biogas production and a slight decrease on electricity usage. Reduction of heating energy of digester (HE) makes a larger amount of heating energy available that can be used for other purposes. The effect on effluent quality indicators is similar to that observed with Solution 1 and Solution 2. The ratio between pollution removal and energy required decrease from 0.133 for Default Strategy to 0.122, and the ratio between pollution removal is reduced from 0.009 for Default Strategy to 0.006 for the proposed solutions with VP = 1000 m3 and Top = 32 °C. A moderate reduction of OCI is observed.
It is important to note that control actions considered in Solution 1 and Solution 2, are limited to control handles of activated sludge process, but Solution 1 VP, Top and Solution 2 VP, Top include control movements in different processes of water line (ASP and primary clarifier) and Top in sludge line. It means that consideration of the interactions between different units, that is a characteristic of plant-wide control strategies, is better addressed in the formulation of Solution 1 VP, Top and Solution 2 VP, Top. Therefore, Solution 1 VP, Top and Solution 2 VP, Top exhibit better performance indicators, producing a significant improvement of WWTP eco-efficiency.
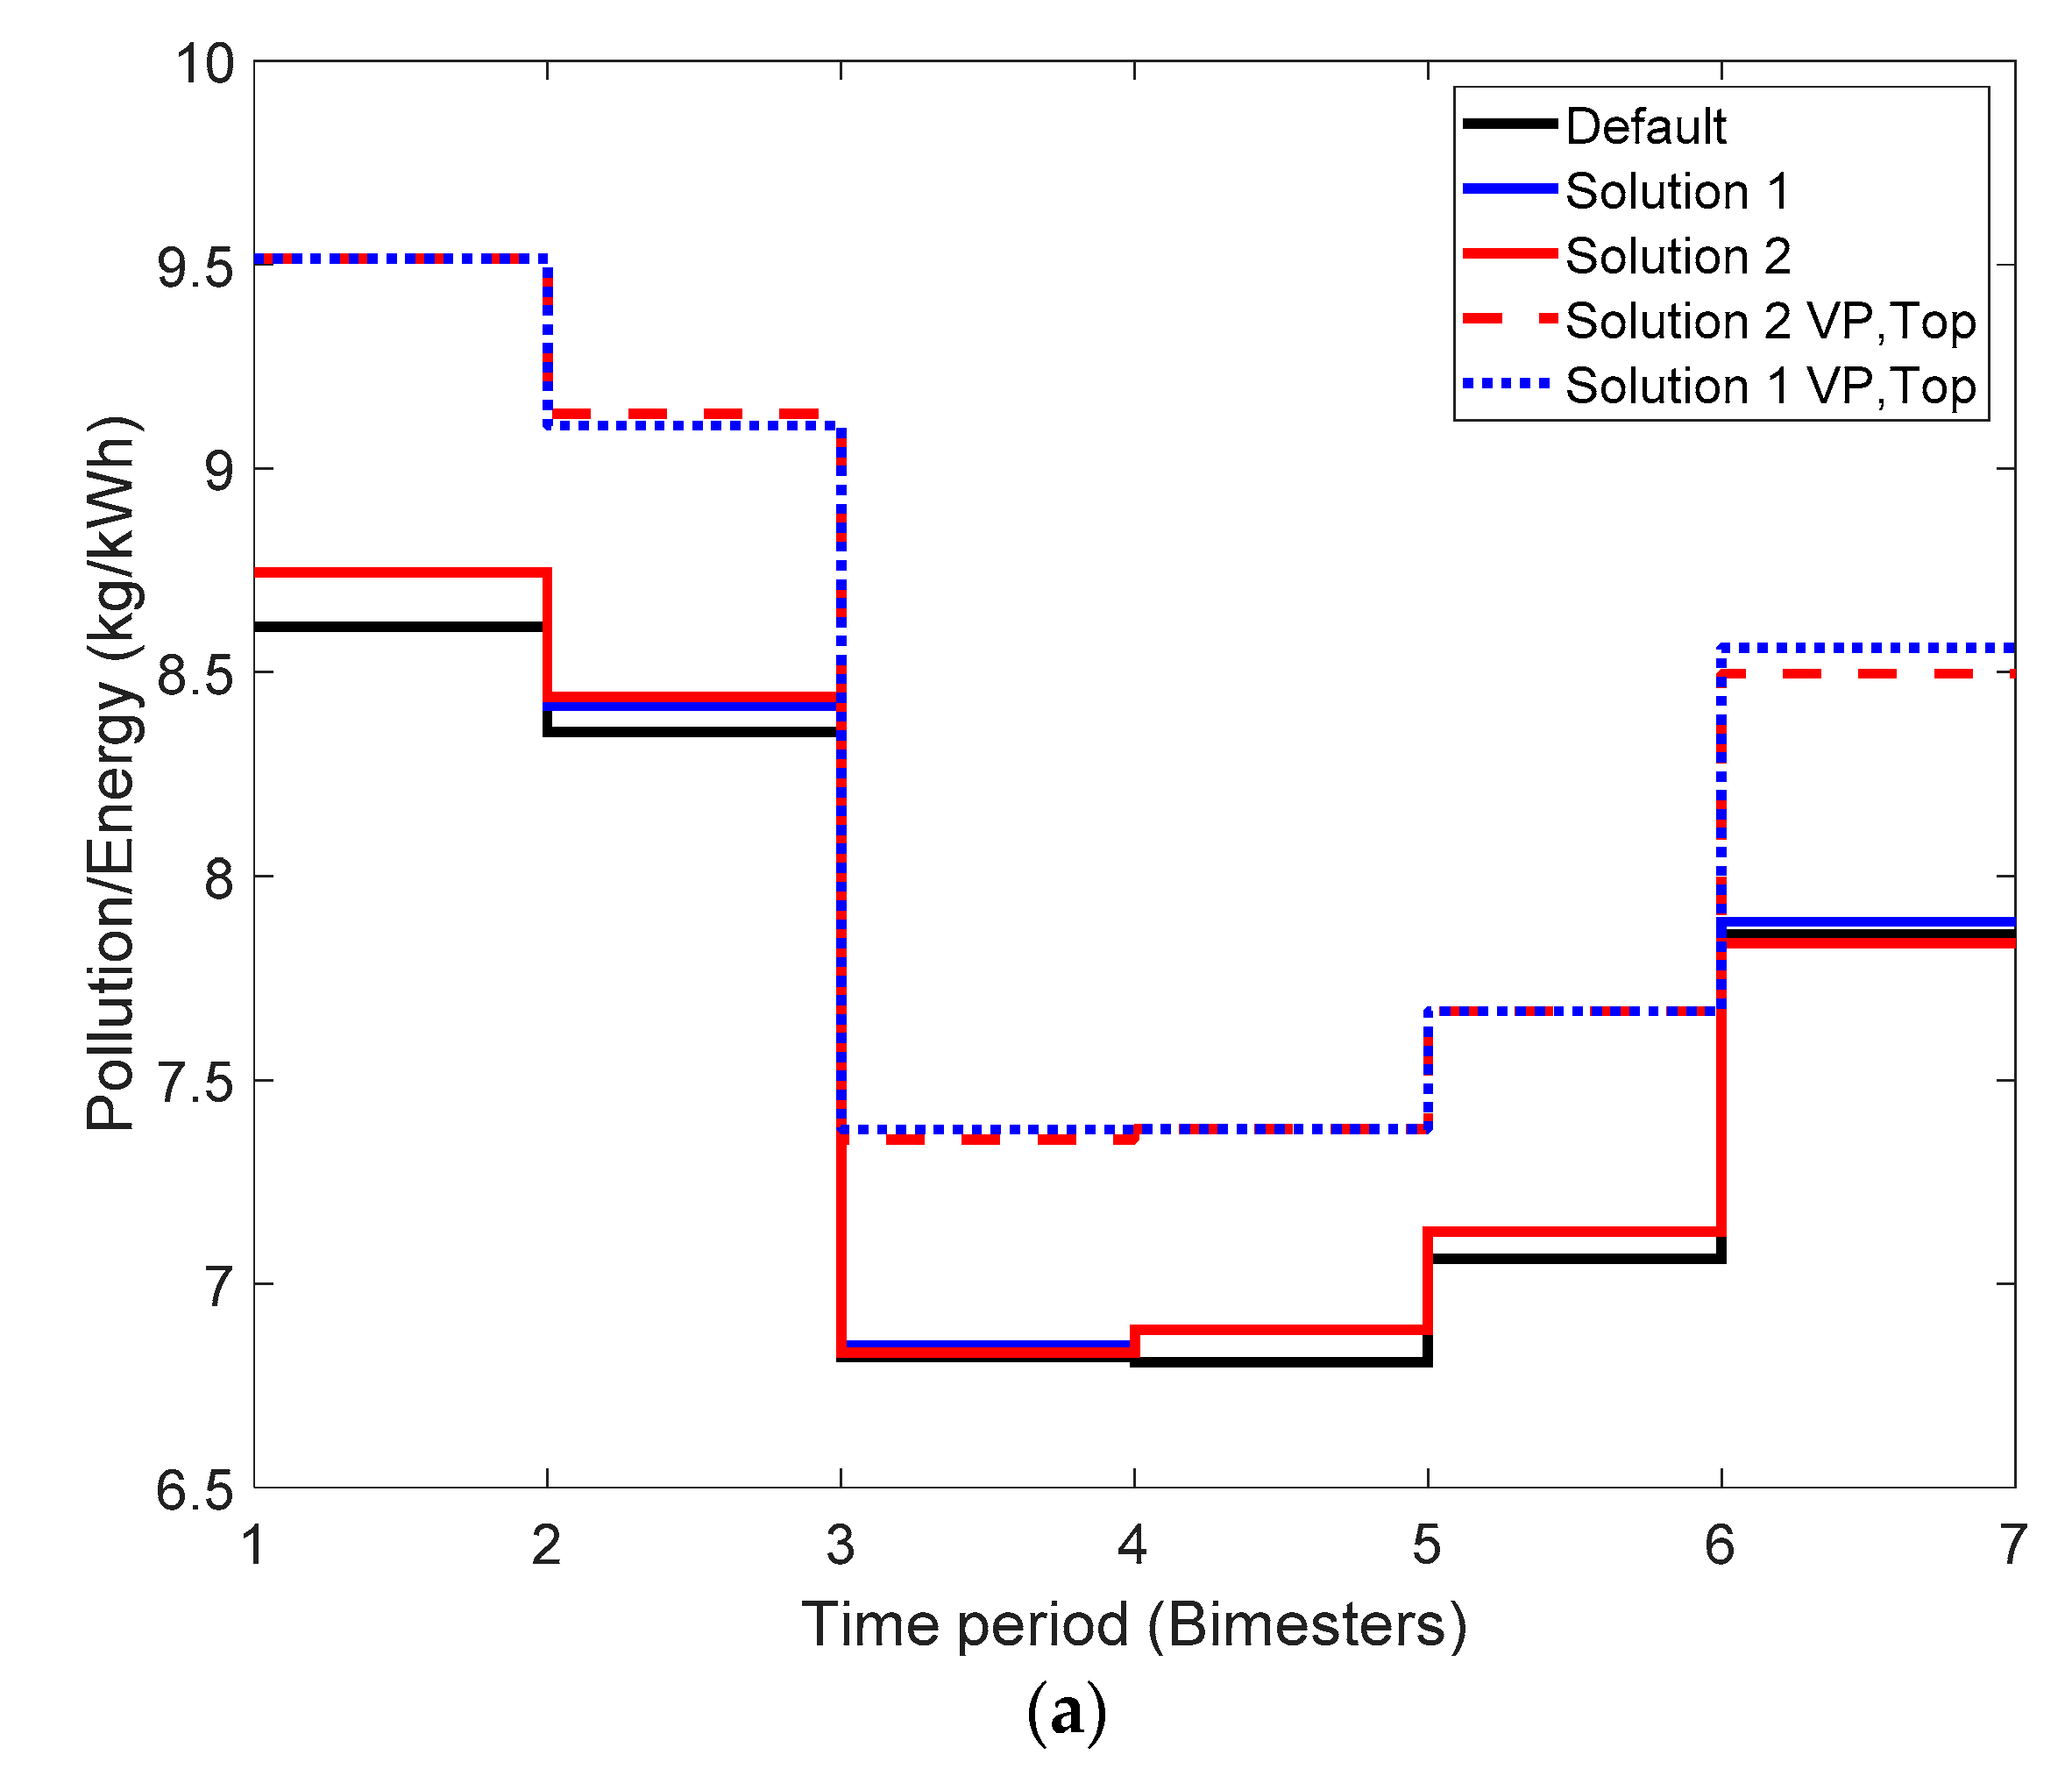
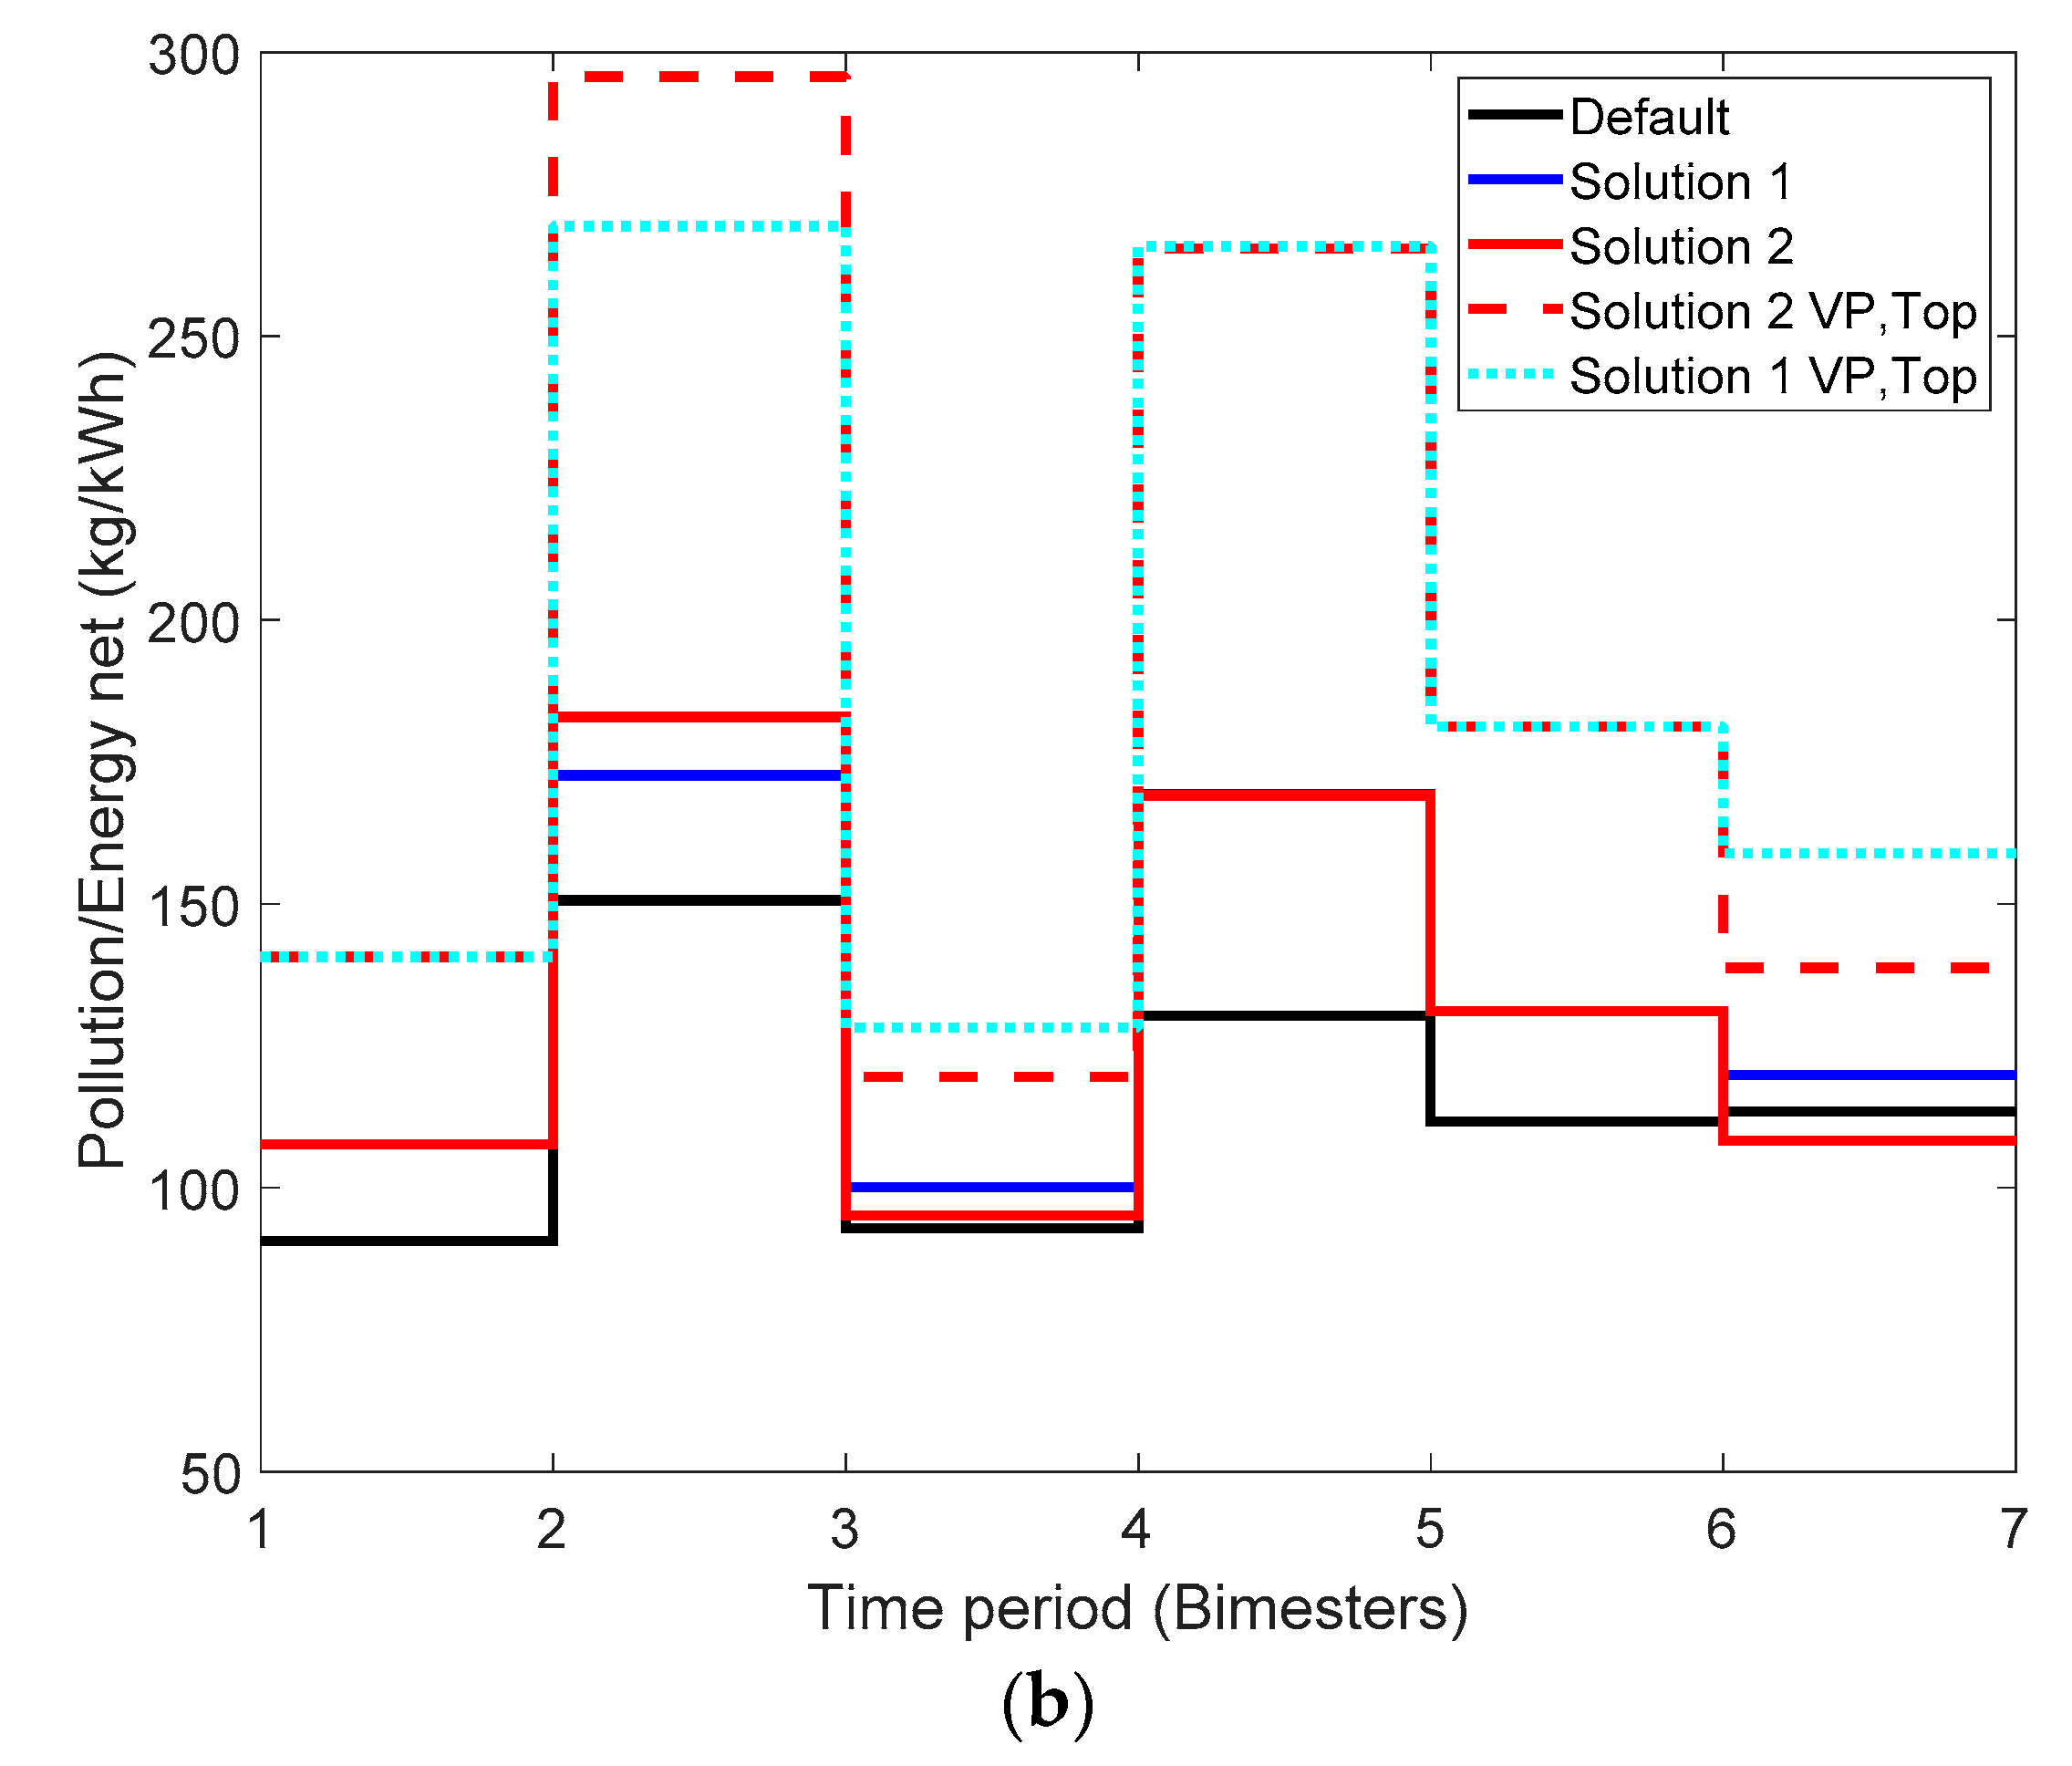
Figure 6 shows in Figure 6a the bimestrial profile of pollution/energy (kg/kWh) ratio, that is computed considering the energy required to run the process, and in Figure 6b the bimestrial profile of pollution/energy net (kg/kWh) computed considering the net energy used to remove that amount of pollution (Enet). The profiles show how efficiency of wastewater treatment varies in the different bimesters. The temperature effect is evidenced on Figure 6a, with lower values of Pollution/Energy (kg/kWh) ratio in the colder bimesters. This temperature effect is not appreciable in Figure 6b, where energy net is considered to compute pollution removal efficiency index. It suggests that heat and electricity obtained from biogas exploitation compensate the impact of seasonal variations of temperature on energy requirements. Moreover, the advantage of Solution 1 VP, Top and Solution 2 VP, Top over the other control strategies is more noticeable when efficiency is expressed in terms of net energy, suggesting that the effectivity of the control actions is notorious when interconnection between the water line and sludge is considered in the evaluation of performance.
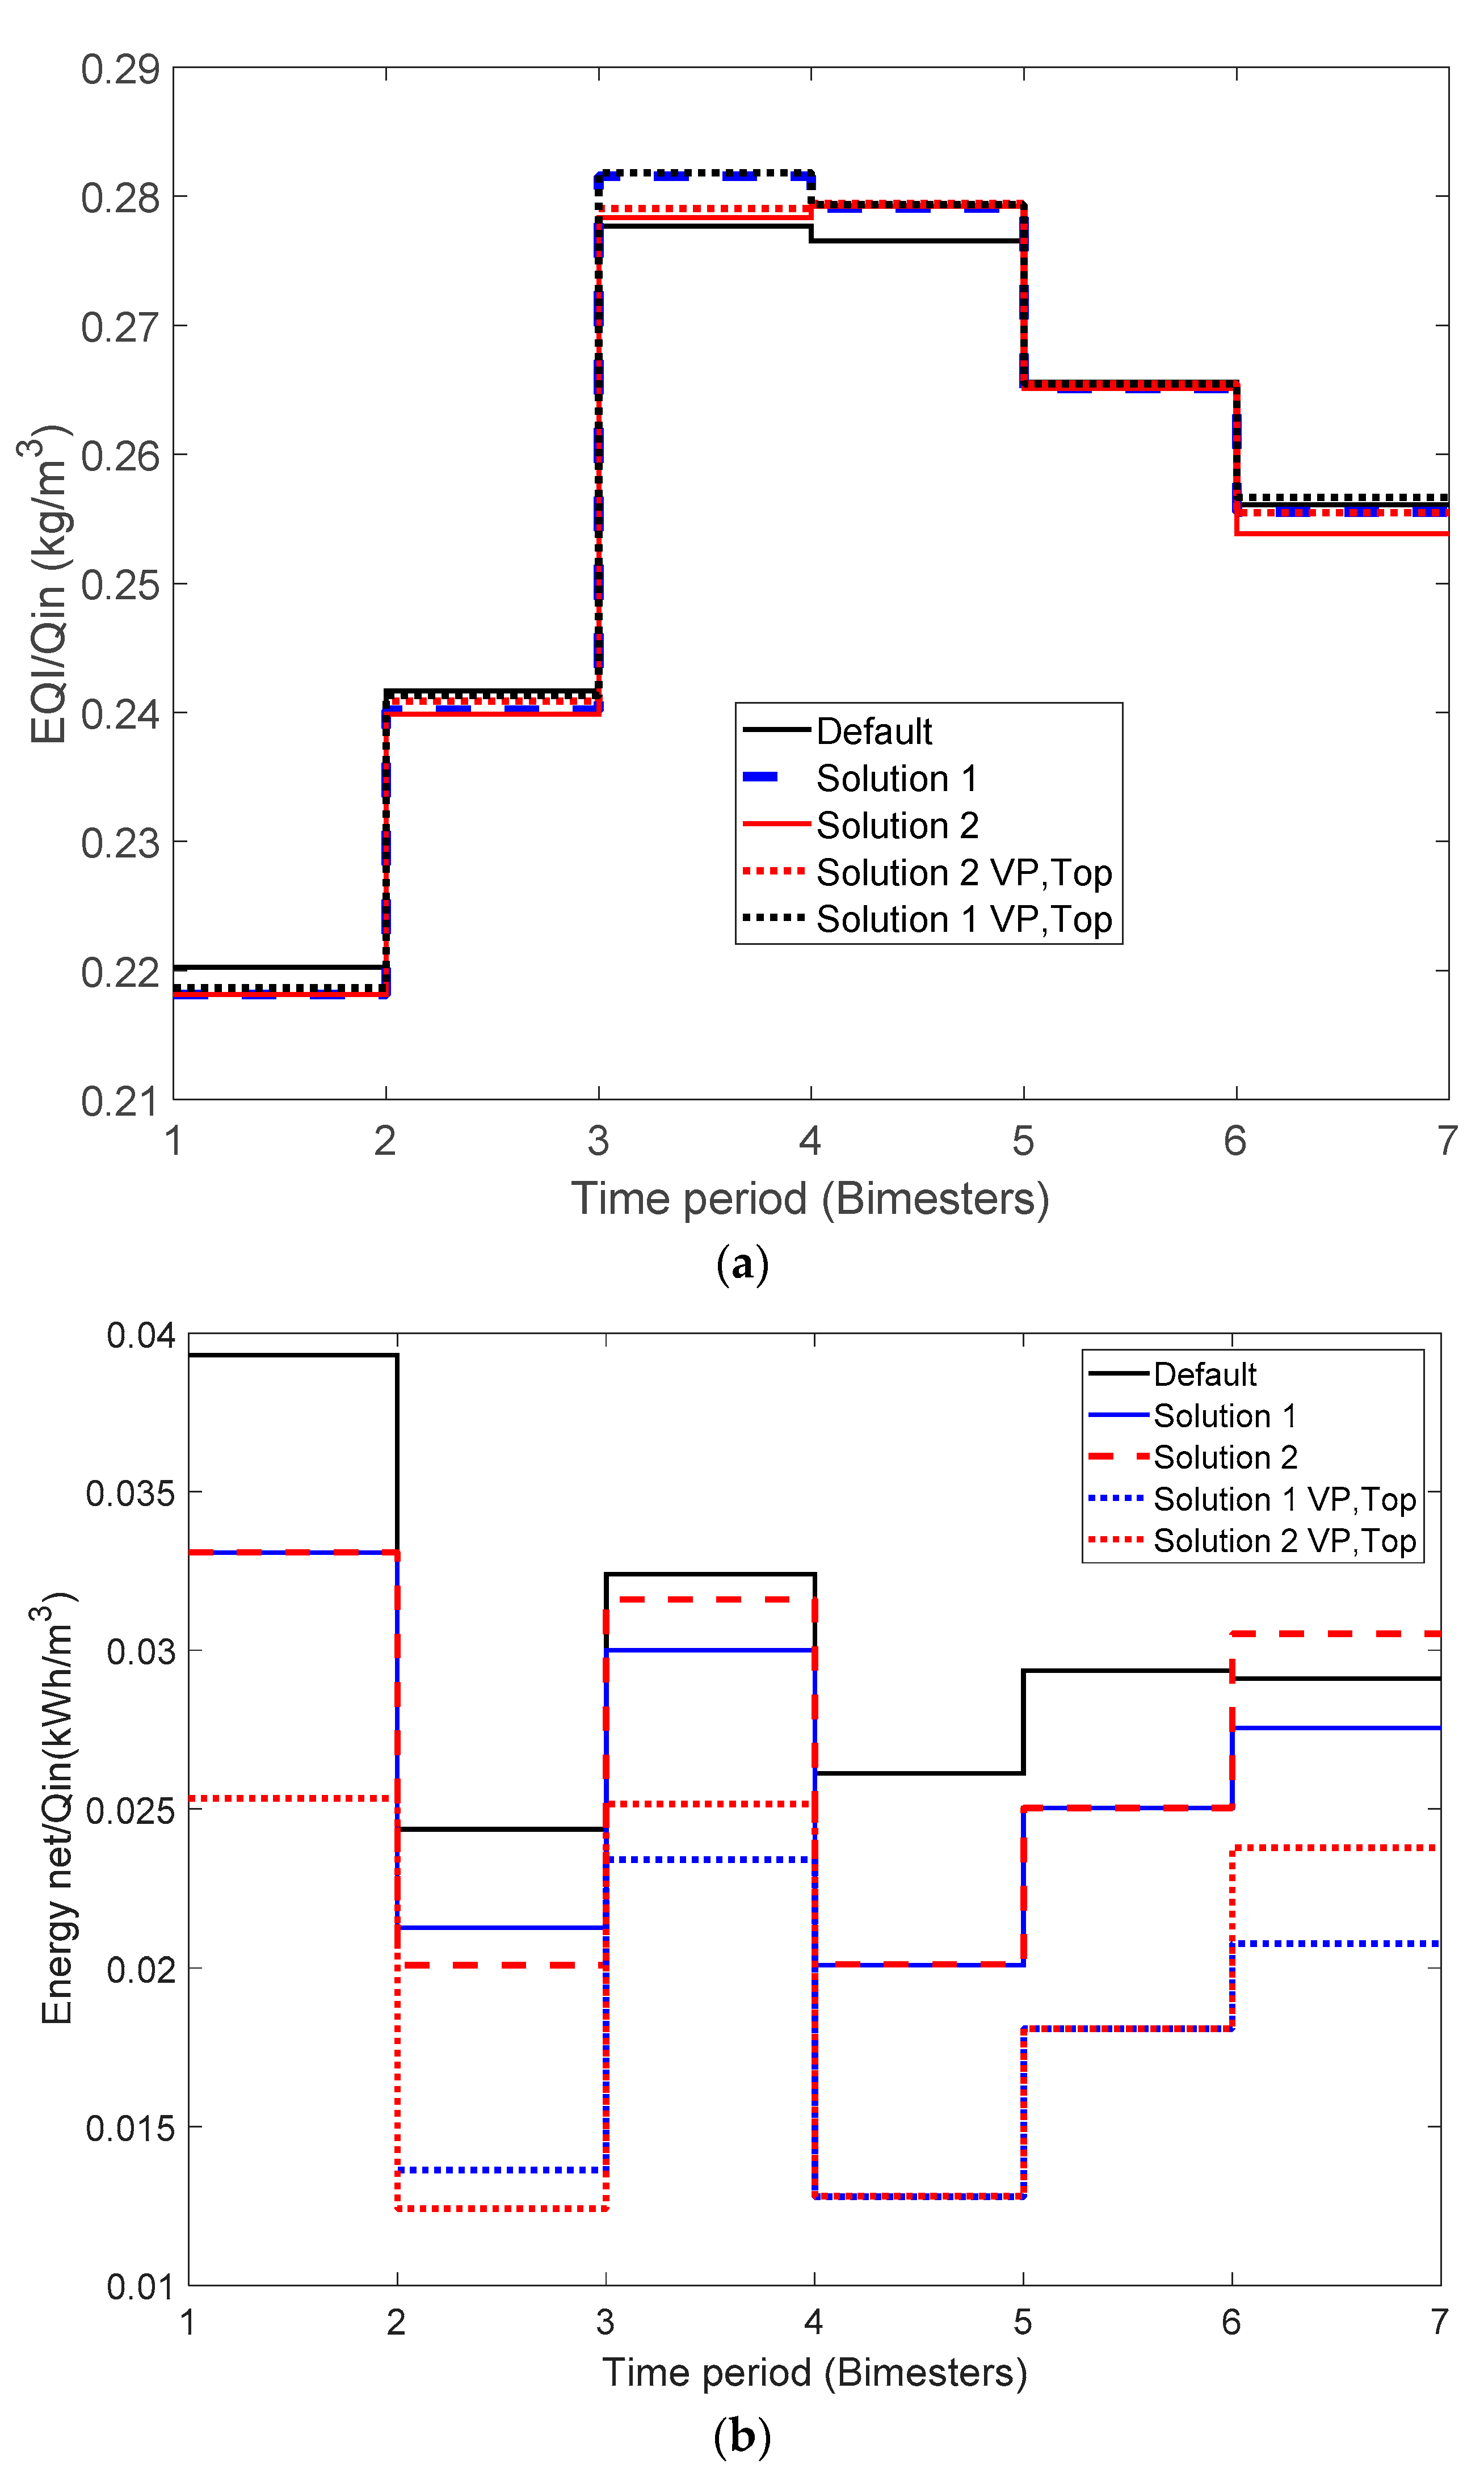
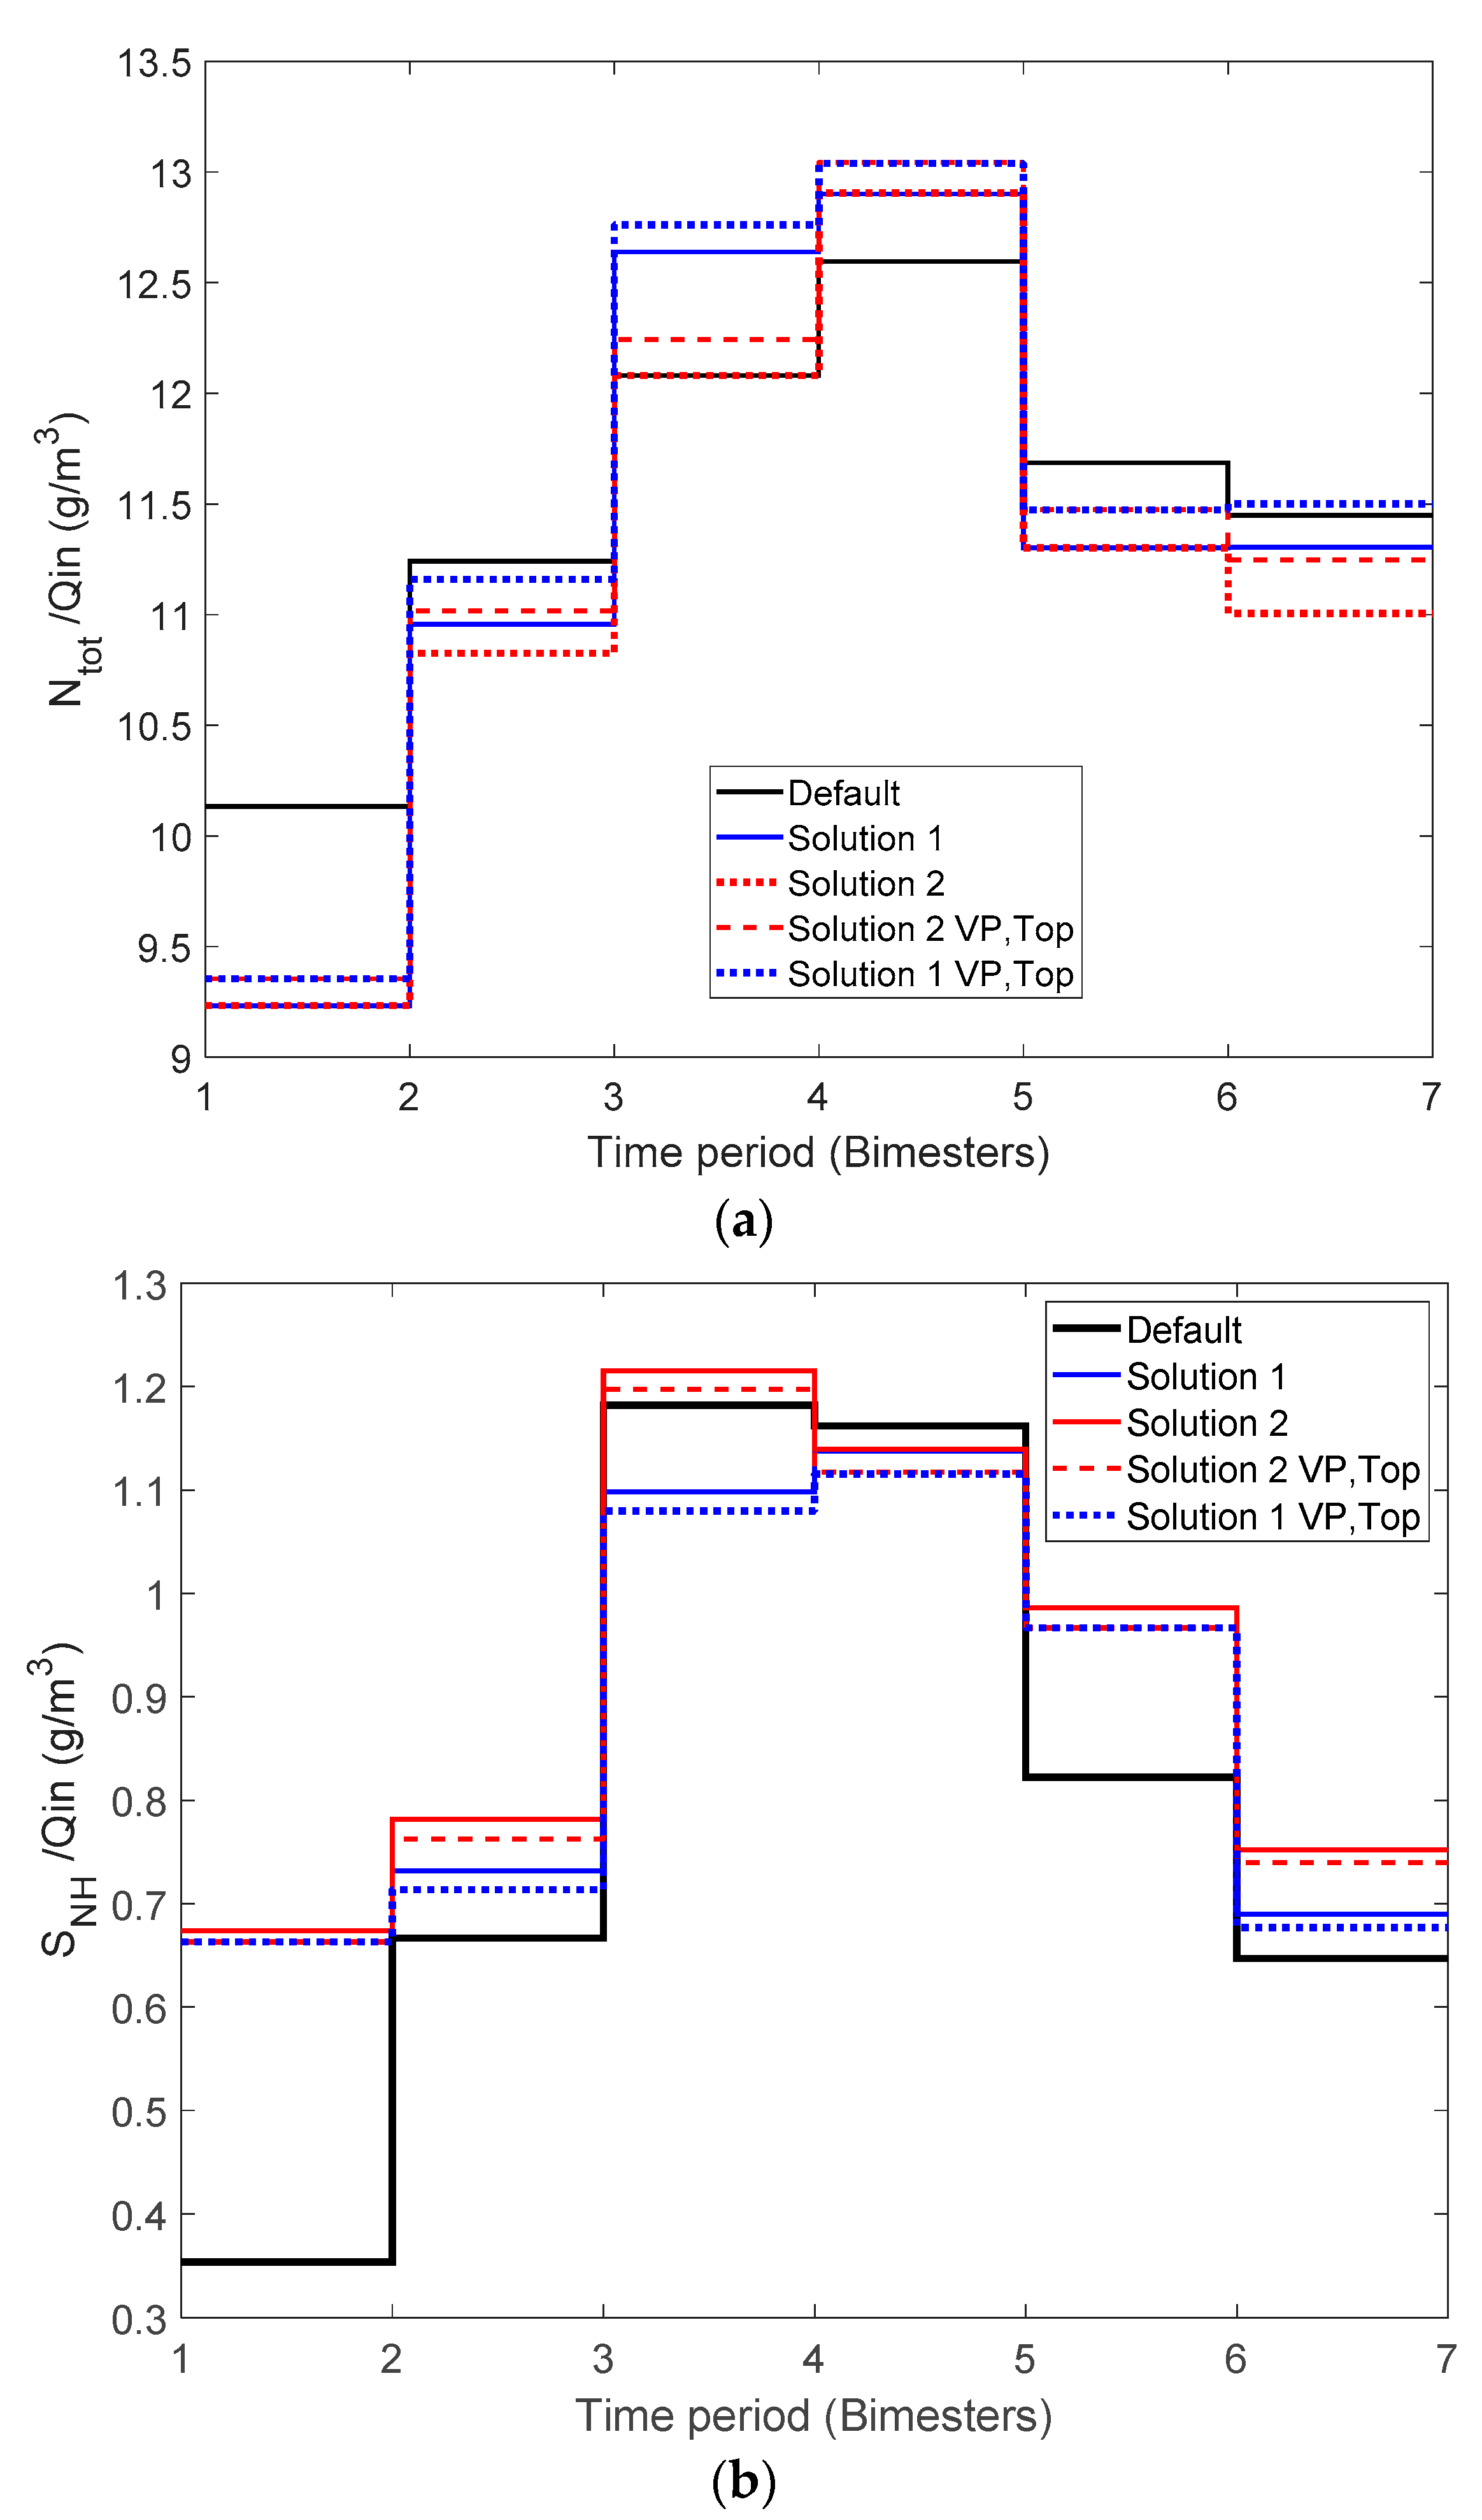
Figure 7a shows effluent quality index (EQI) and Figure 7b shows net energy bimestrial profiles. In the first case, temperature effects are noticed since the EQI profile increases in the colder season and decreases in the warmer period because microbial growth rate increases with temperature. It is also observed that magnitude of EQI profile is similar for all the proposed strategies, which demonstrates that improvements on energy efficiency achieved by application selected control actions produced a minimal deterioration of effluent quality, despite the trade-off between both objectives (reducing energy consumption and improving effluent quality). Net energy profile (Figure 7b) is influenced by temperature, slow, and fast dynamics control actions, which explains its variability. Figure 8a,b show bimestrial profiles of total nitrogen concentration in the effluent (Ntot) and ammonium concentration in the effluent (SNH), respectively. In both cases, temperature effects are noticed, with higher values of indicators in the colder season because biomass growth rate increase with temperature with a positive effect on nitrification and denitrification.
Finally, the comparison of the control strategies resulting from the application of this methodology with strategies resulting from previous work [9] is carried out considering OCI and EQ, which are the common performance indicators used in actual and previous work. In [9], the cascaded ammonium control strategy and the proposed N/E control strategy, produce EQI values of 5374 kg/d and 5494 kg/d, OCI values of 9023 EUR/d and 8760 EUR/d, and Electricity consumption of 5016 kwh/d and 4757 kWh/d, respectively. Form observation of Table 8, it is determined that all solutions proposed in this paper improve those EQ values, but only Solution 1 VP, Top and Solution 2 VP, Top, that consider control actions in WWTP units different from ASP, improves OCI with respect to the N/E strategy. A comparison with strategies presented in [2] is difficult since variations on carbon dosage are considered, so performance is affected by different control actions.
The consideration of energy recovery from biogas complements the assessment of global performance addressed in [9], and the implementation of a control strategy based on the dynamic monitoring of performance could be the next step for the implementation of a comprehensive methodology to address WWTP eco-efficiency.
The results presented in this section make evident how the application of plant-wide control strategies is useful to improve performance indicators that represent individual goals, while their trade-offs describe WWTP eco-efficiency. A systematic study of the effect of control actions on energy efficiency indicators, biogas production and effluent quality, considering dynamic effects associated with temperature variations can lead to the formulation of control strategies that produce significant improvements on WWTP eco-efficiency. Other methodologies proposed in the literature to address WWTP eco-efficiency [4,22] and energy efficiency [2] could be considered in future work to improve the proposed procedure entailing to a systematic analysis of WWTPs eco-efficiency.
4. Conclusions
In this paper, different solutions based on plant-wide control strategies have been designed based on the evaluation of the impact of different control actions on the WWTP eco-efficiency considering annual and bimestrial behavior. In particular, performance indicators that measure potential energy recovery from biogas, electricity consumption, CO2 emissions, production of sludge for disposal, and effluent quality have been considered. Such performance indicators are mainly associated with global warming potential, toxicity, and eutrophication potential. The annual-based analysis of performance indicators showed that sludge production and CO2 emissions are not affected by selected control actions. Digester operation temperature do not affect effluent quality variables, and selected ASP variables (Qa, Qw, DO set-point range, and SNHSP) do not affect biogas production in the digester, but all selected control actions affect net energy, that is the connection between the water line and sludge line.
The evaluation of bimestrial profiles of performance indicators under selected control actions to address the seasonal effect of temperature, led us to distinguish between slow and fast dynamic control actions. The slow dynamic control actions, VP and Top, produce a unidirectional effect on dynamic profiles of performance indicators in the full operation horizon, while the faster dynamic variable (Qa, Qw, DO set-point range, and SNHSP) effect varies in magnitude and impact (positive or negative) in the different bimesters.
The analysis allowed us to find the conditions that increase biogas availability (reducing Top and increase VP) as well as the faster dynamic control actions that reduce energy consumption, with a minimum deterioration of effluent quality. The result has been a set of possible solutions, obtained from a multi-objective decision-making procedure, consisting of a sequence of control actions applied at different temporal windows that improve the eco-efficiency indicators of the plant. The results obtained when applying the different solutions make evident how the application of plant-wide control strategies is useful to improve performance indicators that represent individual goals, leading to trade-off solutions that describe WWTP eco-efficiency.
The results evidence the importance of systematic study on the effect of control actions on energy efficiency indicators, biogas production, and effluent quality, considering dynamic effects of input variables to produce significant improvements in WWTP efficiency. Other methodologies proposed in the literature to address WWTP eco-efficiency [4,21] and energy efficiency [2] could be considered in future work to improve the proposed procedure entailing a systematic analysis of WWTP eco-efficiency.
Author Contributions
Conceptualization, M.M. and R.V.; methodology, S.R., M.M.; software, S.R.; formal analysis, M.M. and S.R.; investigation, all authors; writing—original draft preparation, M.M. and S.R.; writing—review and editing, P.V. and M.F.; supervision, R.V. and P.V.; project administration, M.F. All authors have read and agreed to the published version of the manuscript.
Funding
The authors wish to thank the support of the Spanish Government through the MICINN projects PID2019-105434RB-C31, PID2019-105434RB-C33 and the Samuel Solórzano Foundation through project FS/20-2019.
Institutional Review Board Statement
Not applicable.
Informed Consent Statement
Not applicable.
Data Availability Statement
Data is contained within the article. The data presented in this study has been generated using BSM2 platform [10].
Acknowledgments
To the WWTP of Salamanca (Aqualia) for allowing our research group visiting the plant and the IWA Task Group from the Department of Industrial Electrical Engineering and Automation (IEA), Lund University, Sweden (Ulf Jeppsson, Christian Rosen) for the BSM2 models.
Conflicts of Interest
The authors declare no conflict of interest.
References
- World Business Council for Sustainable Development. Available online: https://www.wbcsd.org/ (accessed on 18 January 2021).
- Revollar, S.; Meneses, M.; Vilanova, R.; Vega, P.; Francisco, M. Quantifying the Benefit of a Dynamic Performance Assessment of WWTP. Processes 2020, 8, 206. [Google Scholar] [CrossRef] [Green Version]
- Torregrossa, D.; Castellet-Viciano, L.; Hernández-Sancho, F. A data analysis approach to evaluate the impact of the capacity utilization on the energy consumption of wastewater treatment plants. Sustain. Cities Soc. 2019, 45, 307–313. [Google Scholar] [CrossRef]
- Lorenzo Toja, Y.; Vázquez-Rowe, I.; Amores, M.; Termes-Rife, M.; Marín-Navarro, D.; Moreira, M.; Gumersindo, F. Benchmarking wastewater treatment plants under an eco-efficiency perspective. Sci. Total Environ. 2016, 566–567. [Google Scholar] [CrossRef] [PubMed]
- European Environment Agency 2020. Available online: https://www.eea.europa.eu/themes/water/european-waters/water-use-and-environmental-pressures/uwwtd/urban-waste-water-treatment (accessed on 18 January 2021).
- Neczaj, E.; Grosser, A. Circular Economy in Wastewater Treatment Plant–Challenges and Barriers. Proceedings 2018, 2, 614. [Google Scholar] [CrossRef] [Green Version]
- Balkema, A.J.; Preisig, H.A.; Otterpohl, R.; Lambert, F. Indicators for the sustainability assessment of wastewater treatment systems. Urban Water 2002, 4, 153–161. [Google Scholar] [CrossRef]
- Davidson, C.I.; Matthews, H.S.; Hendrickson, C.T.; Bridges, M.W.; Allenby, B.R.; Crittenden, J.C.; Chen, Y.; Williams, E.; Allen, D.T.; Murphy, C.F.; et al. Viewpoint: Adding sustainability to the engineer’s toolbox: A challenge for engineering educators. Environ. Sci. Technol. 2007, 41, 4847–4849. [Google Scholar] [CrossRef] [PubMed] [Green Version]
- Revollar, S.; Vilanova, R.; Vega, P.; Francisco, M.; Meneses, M. Wastewater Treatment Plant Operation: Simple Control Schemes with a Holistic Perspective. Sustainability 2020, 12, 768. [Google Scholar] [CrossRef] [Green Version]
- Alex, J.; Benedetti, L.; Copp, J.; Gernaey, K.; Jeppsson, U.; Nopens, I.; Pons, M.; Rosen, C.; Steyer, J.; Vanrolleghem, P.A. Benchmark Simulation Model No. 2 (BSM2); Technical Report No 3; IWA Taskgroup on Benchmarking of Control Strategies for WWTPs: London, UK, 2018. [Google Scholar]
- Ellen Macarthur Foundation 2020. Available online: https://www.ellenmacarthurfoundation.org/explore/systems-and-the-circular-economy (accessed on 15 December 2020).
- Gernaey, K.; Jeppsson, U.; Vanrolleghem, P.; Copp, J.; Steyer, J. Benchmarking of Control Strategies for Wastewater Treatment Plants; IWA Publishing: Colchester, UK, 2010. [Google Scholar]
- Rosén, C.; Jeppsson, U. Aspects on ADM1 Implementation within the BSM2 Framework; Cod.: LUTEDX/(TEIE-7224); Department of Industrial Electrical Engineering and Automation, Lund Institute of Technology, (TEIE): Lund, Sweden, 2006; pp. 1–35. [Google Scholar]
- Gernaey, K.V.; Rosén, C.; Jeppsson, U. BSM2: A Model for Dynamic Influent Data Generation; Cod.: LUTEDX/(TEIE-7231); Lund University: Lund, Sweden, 2005; pp. 1–73. [Google Scholar]
- Alex, J.; Benedetti, L.; Copp, J.; Gernaey, K.; Jeppsson, U.; Nopens, I.; Pons, M.; Rieger, L.; Rosen, C.; Steyer, J.; et al. Benchmark Simulation Model No. 1 (BSM1). IWA Taskgroup on Benchmarking of Control Strategies for WWTPs; Cod.: LUTEDX-TEIE 7229; Dpt. of Industrial Electrical Engineering and Automation, Lund University: Lund, Sweden, 2008; pp. 1–62. [Google Scholar]
- Kiselev, A.; Magaril, E.; Magaril, R.; Panepinto, D.; Ravina, M.; Zanetti, M.C. Towards Circular Economy: Evaluation of Sewage Sludge Biogas Solutions. Resources 2019, 8, 91. [Google Scholar] [CrossRef] [Green Version]
- Riley, D.M.; Tian, J.; Güngör-Demirci, G.; Phelan, P.; Villalobos, J.R.; Milcarek, R.J. Techno-Economic Assessment of CHP Systems in Wastewater Treatment Plants. Environments 2020, 7, 74. [Google Scholar] [CrossRef]
- Bordons, C.; Garcia-Torres, F.; Ridao, M.A. Model predictive control of interconnected microgrids and electric vehicles. Rev. Iberoam. Autom. Inform. Ind. 2020, 17, 239. [Google Scholar] [CrossRef]
- Jeppsson, U.; Pons, M.N.; Nopens, I.; Alex, J.; Copp, J.B.; Gernaey, K.V.; Rosen, C.; Steyer, J.P.; Vanrolleghem, P.A. Benchmark simulation model no 2: General protocol and exploratory case studies. Water Sci. Technol. 2007, 56, 67–78. [Google Scholar] [CrossRef] [PubMed]
- EPA 2011. Available online: https://www.epa.gov/sites/production/files/2015-07/documents/opportunities_for_combined_heat_and_power_at_wastewater_treatment_facilities_market_analysis_and_lessons_from_the_field.pdf (accessed on 15 December 2020).
- Rieger, L.; Jones, R.M.; Dold, P.; Bott, C. Ammonia-based feedforward and feedback aeration control in activated sludge processes. Water Environ. Res. 2014, 86, 63–73. [Google Scholar] [CrossRef] [PubMed]
- Molinos-Senante, M.; Gémar, G.; Gómez, T.; Caballero, R.; Sala-Garrido, R. Ecoefficiency assessment of wastewater treatment plants using a weighted Russell directional distance model. J. Clean. Prod. 2016, 137, 1066e1075. [Google Scholar] [CrossRef]
Figure 1.
Benchmark Simulation Model (BSM2) plant layout.

Figure 2.
Selected BSM2 operation strategy: ammonium-based control scheme in activated sludge process (ASP).
Figure 2.
Selected BSM2 operation strategy: ammonium-based control scheme in activated sludge process (ASP).

Figure 3.
(a) Bimestrial profile of electricity and energy requirements of the BSM2 plant. (b) Comparison of net energy consumption of WWTP using biogas to cover heating requirements (no cogeneration) and using CHP to cover electricity and heating requirements (CHP), together with heat in excess available when CHP is used.

Figure 4.
(a) Bimestrial profile of biogas flow. Default operation strategy vs. alternative strategy with Top = 32 °C and VP = 1000 m3 (b) Methane content in biogas. Default operation strategy vs. alternative strategy with Top = 32 °C and VP = 1000 m3.
Figure 4.
(a) Bimestrial profile of biogas flow. Default operation strategy vs. alternative strategy with Top = 32 °C and VP = 1000 m3 (b) Methane content in biogas. Default operation strategy vs. alternative strategy with Top = 32 °C and VP = 1000 m3.

Figure 5.
(a) Bimestrial profile of electricity consumption Default operation strategy vs. faster dynamics control actions (b) Effluent Quality Index (EQI) under Default operation strategy vs faster dynamics control actions.
Figure 5.
(a) Bimestrial profile of electricity consumption Default operation strategy vs. faster dynamics control actions (b) Effluent Quality Index (EQI) under Default operation strategy vs faster dynamics control actions.

Figure 6.
(a) Bimestrial evolution of pollution/energy (kg/kWh): the ratio between pollution removed (IQI-EQI) and total energy required to remove that amount of pollution (AE + PE + HE + ME) in BSM2 plant. (b) Bimestrial evolution of pollution/energy net (kg/kWh): the ratio between pollution removed (IQI-EQI) and net energy used to remove that amount of pollution (Enet) exploiting biogas produced in digestion unit of the BSM2 plant.


Figure 7.
(a) Bimestrial evolution of effluent quality index: EQI (kg/m3) in BSM2 plant (b) Bimestrial evolution of energy net: Enet (kWh/m3) in BSM2 plant.
Figure 7.
(a) Bimestrial evolution of effluent quality index: EQI (kg/m3) in BSM2 plant (b) Bimestrial evolution of energy net: Enet (kWh/m3) in BSM2 plant.

Figure 8.
(a) Bimestrial evolution of total nitrogen concentration in the effluent: Ntot (g/m3) in BSM2 plant (b) Bimestrial evolution of ammonium concentration in the effluent: SNH (g/m3) in BSM2 plant.
Figure 8.
(a) Bimestrial evolution of total nitrogen concentration in the effluent: Ntot (g/m3) in BSM2 plant (b) Bimestrial evolution of ammonium concentration in the effluent: SNH (g/m3) in BSM2 plant.


Table 1.
Characteristic values of the significant variables of the influent including weekly and bimonthly means (Bi.m Av.: Bimestrial average).
Table 1.
Characteristic values of the significant variables of the influent including weekly and bimonthly means (Bi.m Av.: Bimestrial average).
| Variable | Average | Maximum | Minimum | Bi-m. Av Max. | Bi-m. Av. Min. |
|---|---|---|---|---|---|
| T (°C) | 15 | 20.5 | 9.5 | 19.8 | 10.2 |
| Qin (m3/d) | 20,648 | 85,841 | 5146 | 23,200 | 18,000 |
| Ntot (g/m3) | 55.2 | 114.2 | 7.7 | 59.6 | 50 |
| COD influent (g/m3) | 592.2 | 1213.0 | 36.5 | 615 | 540 |
Qin: Influent flowrate; Ntot: Total nitrogen; COD: Chemical oxygen demand.
Table 2.
Operation strategy applied to BSM2 (Default strategy).
| Activated Sludge Process (Water Line) | ||
| Control Actions | Parameters | Default Conditions |
| Ammonium-based control scheme | Kp = −1, Ti = 1, Tt = 0.2 | Ammonium set-point: SNHSP = 1 g/m3 DO set-point range: 1.0–2.5 g/m3 |
| Open loop control of [2,9,10]: | ||
| Carbon dosage (Qcarb) | Qcarb = 2 m3/d | |
| Sludge age manipulating Qw | Warm season: Qw = 450 m3/d Cold season: Qw = 300 m3/d | |
| F:M ratio manipulating Qr | Qr = 20,648 m3/d | |
| Nitrates concentration in the anoxic zone manipulating Qa | Qa = 61,944 m3/d | |
| Primary clarifier (Water line) | ||
| Open-loop control of: Separation volume (VP) by manipulation of Qpo | VP = 900 m3 | |
| Anaerobic digester (Sludge line) | ||
| Regulation of Top using heating energy from biogas | Top = 35 °C | |
Table 3.
Possible variations on selected control handles.
| Control Handle | Default Value | Variation | |
|---|---|---|---|
| Primary clarifier volume (VP-m3) | 900 m3 | 800 m3 | 1000 m3 |
| Operation temperature of digester (Top-°C) | 35 °C | 32 °C | 37 °C |
| DO set-point limits (DOsp-g/m3) | 1.0–2.5 g/m3 | 0.5–4.0 g/m3 | 0.95–2.05 g/m3 |
| Internal recycle flow-ASP (Qa-m3/d) | 61,944 m3/d | 2 Qin0 | 4 Qin0 |
| Wastage flow-ASP (Qw-m3/d) | Warm season: 450 m3/d Cold season: 300 m3/d | 300 m3/d full operation horizon | 450 m3/d full operation horizon |
| Ammonium set-point (SNHSP-g/m3) | 1.0 g/m3 | - | 4 g/m3 |
Qin0 = 20,648.36 m3/d.
Table 4.
Effect of slower dynamics control actions on annual average values of selected performance indicators.
Table 4.
Effect of slower dynamics control actions on annual average values of selected performance indicators.
| Default | VP = 800 m3 | VP = 1000 m3 | Top = 32 °C | Top = 38 °C | |
|---|---|---|---|---|---|
| Qgas/Qin | 0.133 | 1.785 | −1.600 | 0 | 0 |
| HE (kWh/m3) | 0.204 | −0.351 | 0.315 | 14.91 | −14.91 |
| Energy net/Qin (Enet, Equation (13)) (kWh/m3) | 131.03 | −18.70 | 16.80 | 7.05 | −6.73 |
| Electricity/Qin (kWh/m3) | 0.242 | −0.764 | 0.677 | 0 | 0 |
| EQI/Qin (kg/m3) | 0.257 | 0.330 | −0.365 | 0 | 0 |
| Ntot (g/m3) | 11.56 | 1.664 | −1.612 | 0 | 0 |
| SNH (g/m3) | 0.817 | −1.902 | 1.774 | 0 | 0 |
| Sludge (kg/m3) | 131.03 | 0 | 0 | 0 | 0 |
| CH4/CO2 ratio | 0.69 | 0 | 0 | 0 | 0 |
Table 5.
Effect of faster dynamics control actions on annual average values of selected performance indicators.
Table 5.
Effect of faster dynamics control actions on annual average values of selected performance indicators.
| Default | DOsp: 0.95–2.05 g/m3 | DOsp: 0.5–4.0 g/m3 | Qa = 2 Qin0 | Qa = 4 Qin0 | Qw = 300 m3/d | Qw = 450 m3/d | SNHSP = 4.0 g/m3 | |
|---|---|---|---|---|---|---|---|---|
| Qgas/Qin | 0.133 | 0 | 0 | 0 | 0 | 2.33 | −2.76 | 0 |
| HE (kWh/m3) | 0.204 | 0 | 0 | 0 | 0 | 1.11 | −1.77 | 0 |
| Energy net/Qin (Enet, Equation (13)) (kWh/m3) | 0.03 | 4.50 | −1.18 | 10.30 | −13.30 | −26.10 | 15.3 | 14.91 |
| Electricity/Qin (kWh/m3) | 0.24 | 0.55 | −0.17 | 1.27 | −1.66 | −1.16 | −0.58 | 1.83 |
| EQI/Qin (kg/m3) | 0.26 | 0.08 | −1.05 | −1.79 | 0.032 | 1.63 | −5.91 | 0.23 |
| Ntot (g/m3) | 11.56 | 0.87 | 1.89 | −5.19 | 1.03 | 4.52 | −10.88 | 3.41 |
| SNH (g/m3) | 0.82 | −4.81 | −28.8 | 8.14 | −6.26 | 14.92 | −41.91 | −20.15 |
| Sludge (kg/m3) | 131.0 | 0 | 0.012 | 0 | 0 | 1.94 | −2.08 | 0 |
| CH4/CO2 ratio | 0.69 | 0 | 0 | 0 | 0 | 0 | 0 | 0 |
Table 6.
Effect of faster dynamics control actions on bimestrial values of selected performance indicators.
Table 6.
Effect of faster dynamics control actions on bimestrial values of selected performance indicators.
| Default | ||||||
|---|---|---|---|---|---|---|
| Bimester | 1 | 2 | 3 | 4 | 5 | 6 |
| Electricity/Qin (kWh/ m3) | 0.258 | 0.257 | 0.221 | 0.247 | 0.238 | 0.237 |
| EQI/Qin (kg/m3) | 0.220 | 0.242 | 0.278 | 0.277 | 0.266 | 0.256 |
| Ntot (g/ m3) | 10.132 | 11.242 | 12.080 | 12.595 | 11.686 | 11.449 |
| SNH (g/ m3) | 0.353 | 0.667 | 1.182 | 1.162 | 0.822 | 0.647 |
| DOsp: 0.95–2.05 g/m3 | ||||||
| Bimester | 1 | 2 | 3 | 4 | 5 | 6 |
| Electricity/Qin (kWh/ m3) | 0.482 | 0.349 | 0.715 | 0.789 | 0.444 | 0.485 |
| EQI/Qin (kg/m3) | 0.417 | 0.076 | −0.174 | 0.029 | 0.056 | 0.168 |
| Ntot (g/ m3) | 1.438 | 0.812 | 0.600 | 0.740 | 0.762 | 1.023 |
| SNH (g/ m3) | −6.996 | −5.241 | −5.037 | −3.607 | −4.372 | −5.469 |
| DOsp: 0.5–4.0 g/m3 | ||||||
| Bimester | 1 | 2 | 3 | 4 | 5 | 6 |
| Electricity/Qin (kWh/ m3) | 2.350 | −0.435 | −1.627 | −1.413 | −0.510 | 0.634 |
| EQI/Qin (kg/m3) | 0.957 | −1.782 | −1.408 | −1.402 | −1.357 | −0.847 |
| Ntot (g/m3) | 8.896 | 1.800 | −0.886 | −0.924 | 0.736 | 3.730 |
| SNH (g/m3) | −91.320 | −45.793 | −11.790 | −11.509 | −26.348 | −47.694 |
| Qa = 2 Qin0 | ||||||
| Bimester | 1 | 2 | 3 | 4 | 5 | 6 |
| Electricity/Qin (kWh/ m3) | 1.089 | 1.236 | 1.490 | 1.700 | 1.179 | 0.964 |
| EQI/Qin (kg/m3) | −2.634 | −2.046 | −1.364 | −0.833 | −1.893 | −2.238 |
| Ntot (g/m3) | −6.878 | −5.891 | −4.162 | −2.964 | −5.507 | −6.230 |
| SNH (g/m3) | 15.169 | 11.847 | 5.095 | 5.918 | 8.620 | 10.355 |
| Qa = 4 Qin0 | ||||||
| Bimester | 1 | 2 | 3 | 4 | 5 | 6 |
| Electricity/Qin (kWh/m3) | −1.510 | −1.618 | −1.835 | −2.084 | −1.574 | −1.390 |
| EQI/Qin (kg/m3) | 0.540 | 0.134 | −0.113 | −0.917 | 0.184 | 0.471 |
| Ntot (g/m3) | 2.188 | 1.485 | 0.524 | −1.210 | 1.377 | 2.088 |
| SNH (g/m3) | −13.071 | −9.288 | −3.714 | −3.972 | −6.613 | −8.501 |
| SNHSP = 4.0 g/m3 | ||||||
| Bimester | 1 | 2 | 3 | 4 | 5 | 6 |
| Electricity/Qin (kWh/m3) | 0.16 | 1.22 | 3.36 | 3.81 | 1.80 | 0.65 |
| EQI/Qin (kg/m3) | 0.12 | 0.64 | −1.20 | 0.49 | 0.14 | 0.22 |
| Ntot (g/m3) | 0.37 | 2.52 | 5.01 | 6.91 | 3.32 | 1.25 |
| SNH (g/m3) | −1.56 | −9.41 | −26.6 | −31.22 | −21.04 | −6.64 |
Table 7.
Selected faster dynamics control actions considered in the formulation of Solution1 and Solution 2 control strategies.
Table 7.
Selected faster dynamics control actions considered in the formulation of Solution1 and Solution 2 control strategies.
| Bimesters | Solution 1 | Solution 2 |
|---|---|---|
| 1st | DOsp: 0.5–4.0 g/m3, Qa: Default, SNHSP: Default | DOsp: 0.5–4.0 g/m3, Qa: Default, SNHSP: Default |
| 2nd | DOsp: Default, Qa: Default, SNHSP: 4.0 g/m3 | DOsp: 0.95–2.05 g/m3, Qa: Default, SNHSP: 4.0 g/m3 |
| 3rd | DOsp: Default, Qa: 2 Qin0, SNHSP: Default | DOsp: 0.95–2.05 g/m3, Qa: 2 Qin0, SNHSP: Default |
| 4th | DOsp: 0.95–2.05 g/m3, Qa: 2 Qin0, SNHSP: Default | DOsp: 0.95–2.05 g/m3, Qa: 2 Qin0, SNHSP: Default |
| 5th | DOsp: Default, Qa: Default, SNHSP: 4.0 g/m3 | DOsp: Default, Qa: Default, SNHSP: 4.0 g/m3 |
| 6th | DOsp: Default, Qa: Default, SNHSP: 4.0 g/m3 | DOsp: Default, Qa: 4 Qin0, SNHSP: 4.0 g/m3 |
Table 8.
Comparison of annual performance indicators for the different solutions proposed to improve energy efficiency and plant sustainability.
Table 8.
Comparison of annual performance indicators for the different solutions proposed to improve energy efficiency and plant sustainability.
| Default | Solution 1 | Solution 2 | Solution 1 VP, Top | Solution 2 VP, Top | |
|---|---|---|---|---|---|
| EQ (kg/d) | 5318.0 | 5326.6 | 5309.0 | 5339.2 | 5324.7 |
| OCI (BSM2) (Eur/ d) | 9016.2 | 8937.3 | 8953.4 | 8732.3 | 8748.9 |
| Energy net (Enet, Equation (13)) (kWh/d) | 619.5 | 541.4 | 557.7 | 393.8 | 410.6 |
| Excess Heating Energy (kWh/ d) | 2853.2 | 2853.5 | 2853.6 | 3678.2 | 3678.4 |
| Total Electricity consumption (kWh/ d) | 5008.1 | 4930.1 | 4946.5 | 4896.2 | 4913.2 |
| Aeration Energy (kWh/ d) | 3794.6 | 3743.9 | 3731.9 | 3710.0 | 3698.6 |
| Pumping Energy (kWh/ d) | 445.5 | 418.2 | 446.6 | 418.2 | 446.6 |
| Heating Energy (kWh/ d) | 4225.2 | 4225.2 | 4225.2 | 3583.8 | 3583.8 |
| Energy/Pollution removed (kWh/kg) | 0.133 | 0.132 | 0.132 | 0.122 | 0.122 |
| Energy net/Pollution removed (kWh/kg) | 0.009 | 0.008 | 0.008 | 0.006 | 0.006 |
| Ntot Violations (%) | 0.47 | 0.77 | 0.53 | 0.84 | 0.57 |
| Ntot Violations (occur) | 13.00 | 25.00 | 16.00 | 23.00 | 17.00 |
| Ntot Violations (days) | 1.72 | 2.81 | 1.93 | 3.06 | 2.08 |
| SNH Violations (%) | 1.69 | 1.97 | 2.10 | 1.76 | 1.92 |
| SNH Violations (occur) | 55.00 | 66.00 | 70.00 | 60.00 | 65.00 |
| SNH Violations (days) | 6.15 | 7.17 | 7.66 | 6.42 | 6.99 |
| COD Violations (%) | 0.06 | 0.06 | 0.06 | 0.06 | 0.06 |
Publisher’s Note: MDPI stays neutral with regard to jurisdictional claims in published maps and institutional affiliations. |
© 2021 by the authors. Licensee MDPI, Basel, Switzerland. This article is an open access article distributed under the terms and conditions of the Creative Commons Attribution (CC BY) license (http://creativecommons.org/licenses/by/4.0/).
Share and Cite
MDPI and ACS Style
Revollar, S.; Meneses, M.; Vilanova, R.; Vega, P.; Francisco, M. Eco-Efficiency Assessment of Control Actions in Wastewater Treatment Plants. Water 2021, 13, 612. https://doi.org/10.3390/w13050612
AMA Style
Revollar S, Meneses M, Vilanova R, Vega P, Francisco M. Eco-Efficiency Assessment of Control Actions in Wastewater Treatment Plants. Water. 2021; 13(5):612. https://doi.org/10.3390/w13050612
Chicago/Turabian StyleRevollar, Silvana, Montse Meneses, Ramón Vilanova, Pastora Vega, and Mario Francisco. 2021. "Eco-Efficiency Assessment of Control Actions in Wastewater Treatment Plants" Water 13, no. 5: 612. https://doi.org/10.3390/w13050612
Note that from the first issue of 2016, this journal uses article numbers instead of page numbers. See further details here.