Article

Regional Hydrogeochemical Evolution of Groundwater in the Ring of Cenotes, Yucatán (Mexico): An Inverse Modelling Approach

by
Rosela Pérez-Ceballos
1,*,
Cesar Canul-Macario
2,
Roger Pacheco-Castro
2,
Julia Pacheco-Ávila
3,
Jorge Euán-Ávila
4 and
Martín Merino-Ibarra
5
1
Instituto de Ciencias del Mar y Limnología Estación El Carmen, Universidad Nacional Autónoma de México, Cd. del Carmen C.P. 24157, Campeche, Mexico
2
Laboratorio de Ingeniería y Procesos Costeros, Universidad Nacional Autónoma de México, Sisal C.P. 97355, Yucatán, Mexico
3
Facultad de Ingeniería, Universidad Autónoma de Yucatán, Mérida C.P. 97203, Yucatan, Mexico
4
Centro de Investigación y de Estudios Avanzados del Instituto Politécnico Nacional, Mérida C.P. 97205, Yucatán, Mexico
5
Unidad Académica de Ecología y Biodiversidad Acuática, Instituto de Ciencias del Mar y Limnología, Universidad Nacional Autónoma de México, Ciudad Universitaria, Ciudad de México C.P. 04510, Mexico
*
Author to whom correspondence should be addressed.
Water 2021, 13(5), 614; https://doi.org/10.3390/w13050614
Submission received: 8 January 2021 / Revised: 22 February 2021 / Accepted: 22 February 2021 / Published: 26 February 2021

Abstract

:
The Ring of Cenotes (RC) extends along the edge of the Chicxulub crater, in the limestone platform of the Yucatan Peninsula (YP), where groundwater shows two preferential flow paths toward the coast near Celestun and Dzilam Bravo towns. The objectives of this study were to describe the regional hydrogeochemical evolution of the groundwater in the RC, and its association with the dissolution/precipitation of the minerals present along its pathway to the ocean. These objectives results were obtained by: (a) characterizing groundwater hydrogeochemistry; (b) calculating calcite, dolomite, and gypsum saturation indexes in the study area; and (c) developing a hydrogeochemical model using PHREEQC (U. S. Geological Survey) inverse modelling approach. The model predictions confirmed that there are two evolution pathways of the groundwater consistent with the preferential flow paths suggested in a previous regionalization of the RC. On the western path, where groundwater flows towards Celestun, marine intrusion influences the hydrogeochemical processes and represents a risk for the freshwater. On the eastern path, where groundwater flows toward Dzilam Bravo, rainfall has an important effect on the hydrogeochemical processes, evidenced by a higher concentration in sulfates during droughts than during rainy periods. Then, monitoring of marine intrusion and phases dissolution in the RC is highly recommended.

1. Introduction

Karstic aquifers represent about 20% of the Earth’s surface, and they are formed by the dissolution of carbonate rocks [1,2,3]. Coastal aquifers are often the main source of freshwater for human coastal settlements. They have a strong interaction with the sea, and their equilibrium depends on both natural hydrological forces (such as the hurricanes) and anthropic activities (such as groundwater extractions) [4,5].
Carbonate aquifers, such as the one in the Yucatan Peninsula (YP), show different karstification levels depending on the dominant carbonate rocks dissolution process [6]. The YP aquifer shows characteristic karstic manifestations connected with groundwater (sinkholes, locally named cenotes) and does not exhibit surface runoff [7]. In the YP, regional groundwater flow pathways are complex and depend on karstic manifestations at several scales: (a) regional scale due to geologic alignments such as the Ring of Cenotes (RC), and the Holbox Fracture Zone; (b) large dissolution conduits at subregional scale such as the Aktun-Chen cave in Quintana Roo, and (c) local-scale heterogeneities caused by erosion, tectonics, and the dissolution of limestone [8]. Therefore, RC is an important karstic zone which influences the regional groundwater flow path in YP.
The RC is located at the northwest of the YP (Figure 1), and it is formed by several sinkholes that are aligned forming a semicircle, along which groundwater preferentially flows [8,9,10]. The RC is the surficial manifestation of the deep crater structure caused by the Chicxulub meteorite impact 65 Ma (million years ago) [11,12,13]. Mechanisms such as erosion, tectonics and dissolution of limestones created a morphologic aspect in the Miocene-Pliocene zone that shows a more karstified and inclined setting from Ticul to the RC. In contrast, in the interior of the Yucatan’s plain (from RC to the coast), the topography is smoother and shows a less karstified landscape than the former [12]. The main characteristic of the sinkholes of the RC is that they intercept the phreatic level of the regional aquifer [14]. Sinkholes are of great importance for human settlements because they are a source of water in the YP since the ancient Mayan civilization. Nowadays, sinkholes also relate to productive activities, such as tourism, on which the income of some RC’s inhabitants depends [9]. Additionally, the discharge of the regional aquifer into the sea is a major component of the hydrologic balance of the coastal lagoons and mangrove ecosystems of Celestun and Dzilam Bravo [15].
The hydrogeochemistry of the RC suggests that groundwater quality evolves from the central recharge zone to its final destinations on the coast [10]. Vertically, the study zone is characterized by a saline interface (halocline) located between 50 to 60 m in the recharge zone of the RC, and between 18 to 26 m in the coastal zone (Figure 2). Halocline shows the maximal dissolution activity and chemical exchange of calcium with other elements such as magnesium coming from intruded saline waters and carbonate rocks [16]. Such a phenomenon is more noticeable at the coastal zone of the RC. On the other hand, gypsum dissolves more easily than calcite in the groundwater, especially in the areas close to Sierrita de Ticul, which is the main physiographic feature of the YP, reaching 350 m above sea level (m. a.s.l.) [17,18,19].
Earlier studies on the hydrogeochemistry of the RC focused on the presence of pollutants and hazardous substances of anthropic origin [20,21,22,23], as well as on the presence of sulfides, groundwater hardness and water salinization associated with the natural dissolution of calcite and gypsum, and to the interaction with marine water [18,19,21,24]. Other studies are related to the hydrogeochemical evolution of the water quality at the regional scale using a chemical-based approach on the chemical balance of major elements’ concentration and the saturation indexes of the lithological phases [18,19,24]. However, few studies on the hydrogeochemistry of the RC region identify areas susceptible to natural dissolution of these minerals (calcite, gypsum and dolomite), and zones with higher saline intrusion by using inverse hydrogeochemical modeling.
The large number of sinkholes distributed along the RC offers the opportunity to study the evolution of groundwater along the regional flow paths using hydrogeochemical approaches. This work aims to understand the interaction of groundwater with the main lithological phases and to assess the dissolution and precipitation of minerals along the RC by means of analyzing the concentration of major elements in groundwater, building hydrogeochemical diagrams, and using the inverse modeling software PHREEQC. Finally, we also assessed the proportion of seawater present in the groundwater samples of the sinkholes to understand how marine intrusion modifies the dissolution/precipitation of minerals and interacts with the rainfall. Understanding such processes can help to implement management strategies at the RC for a better use of groundwater.

2. Materials and Methods
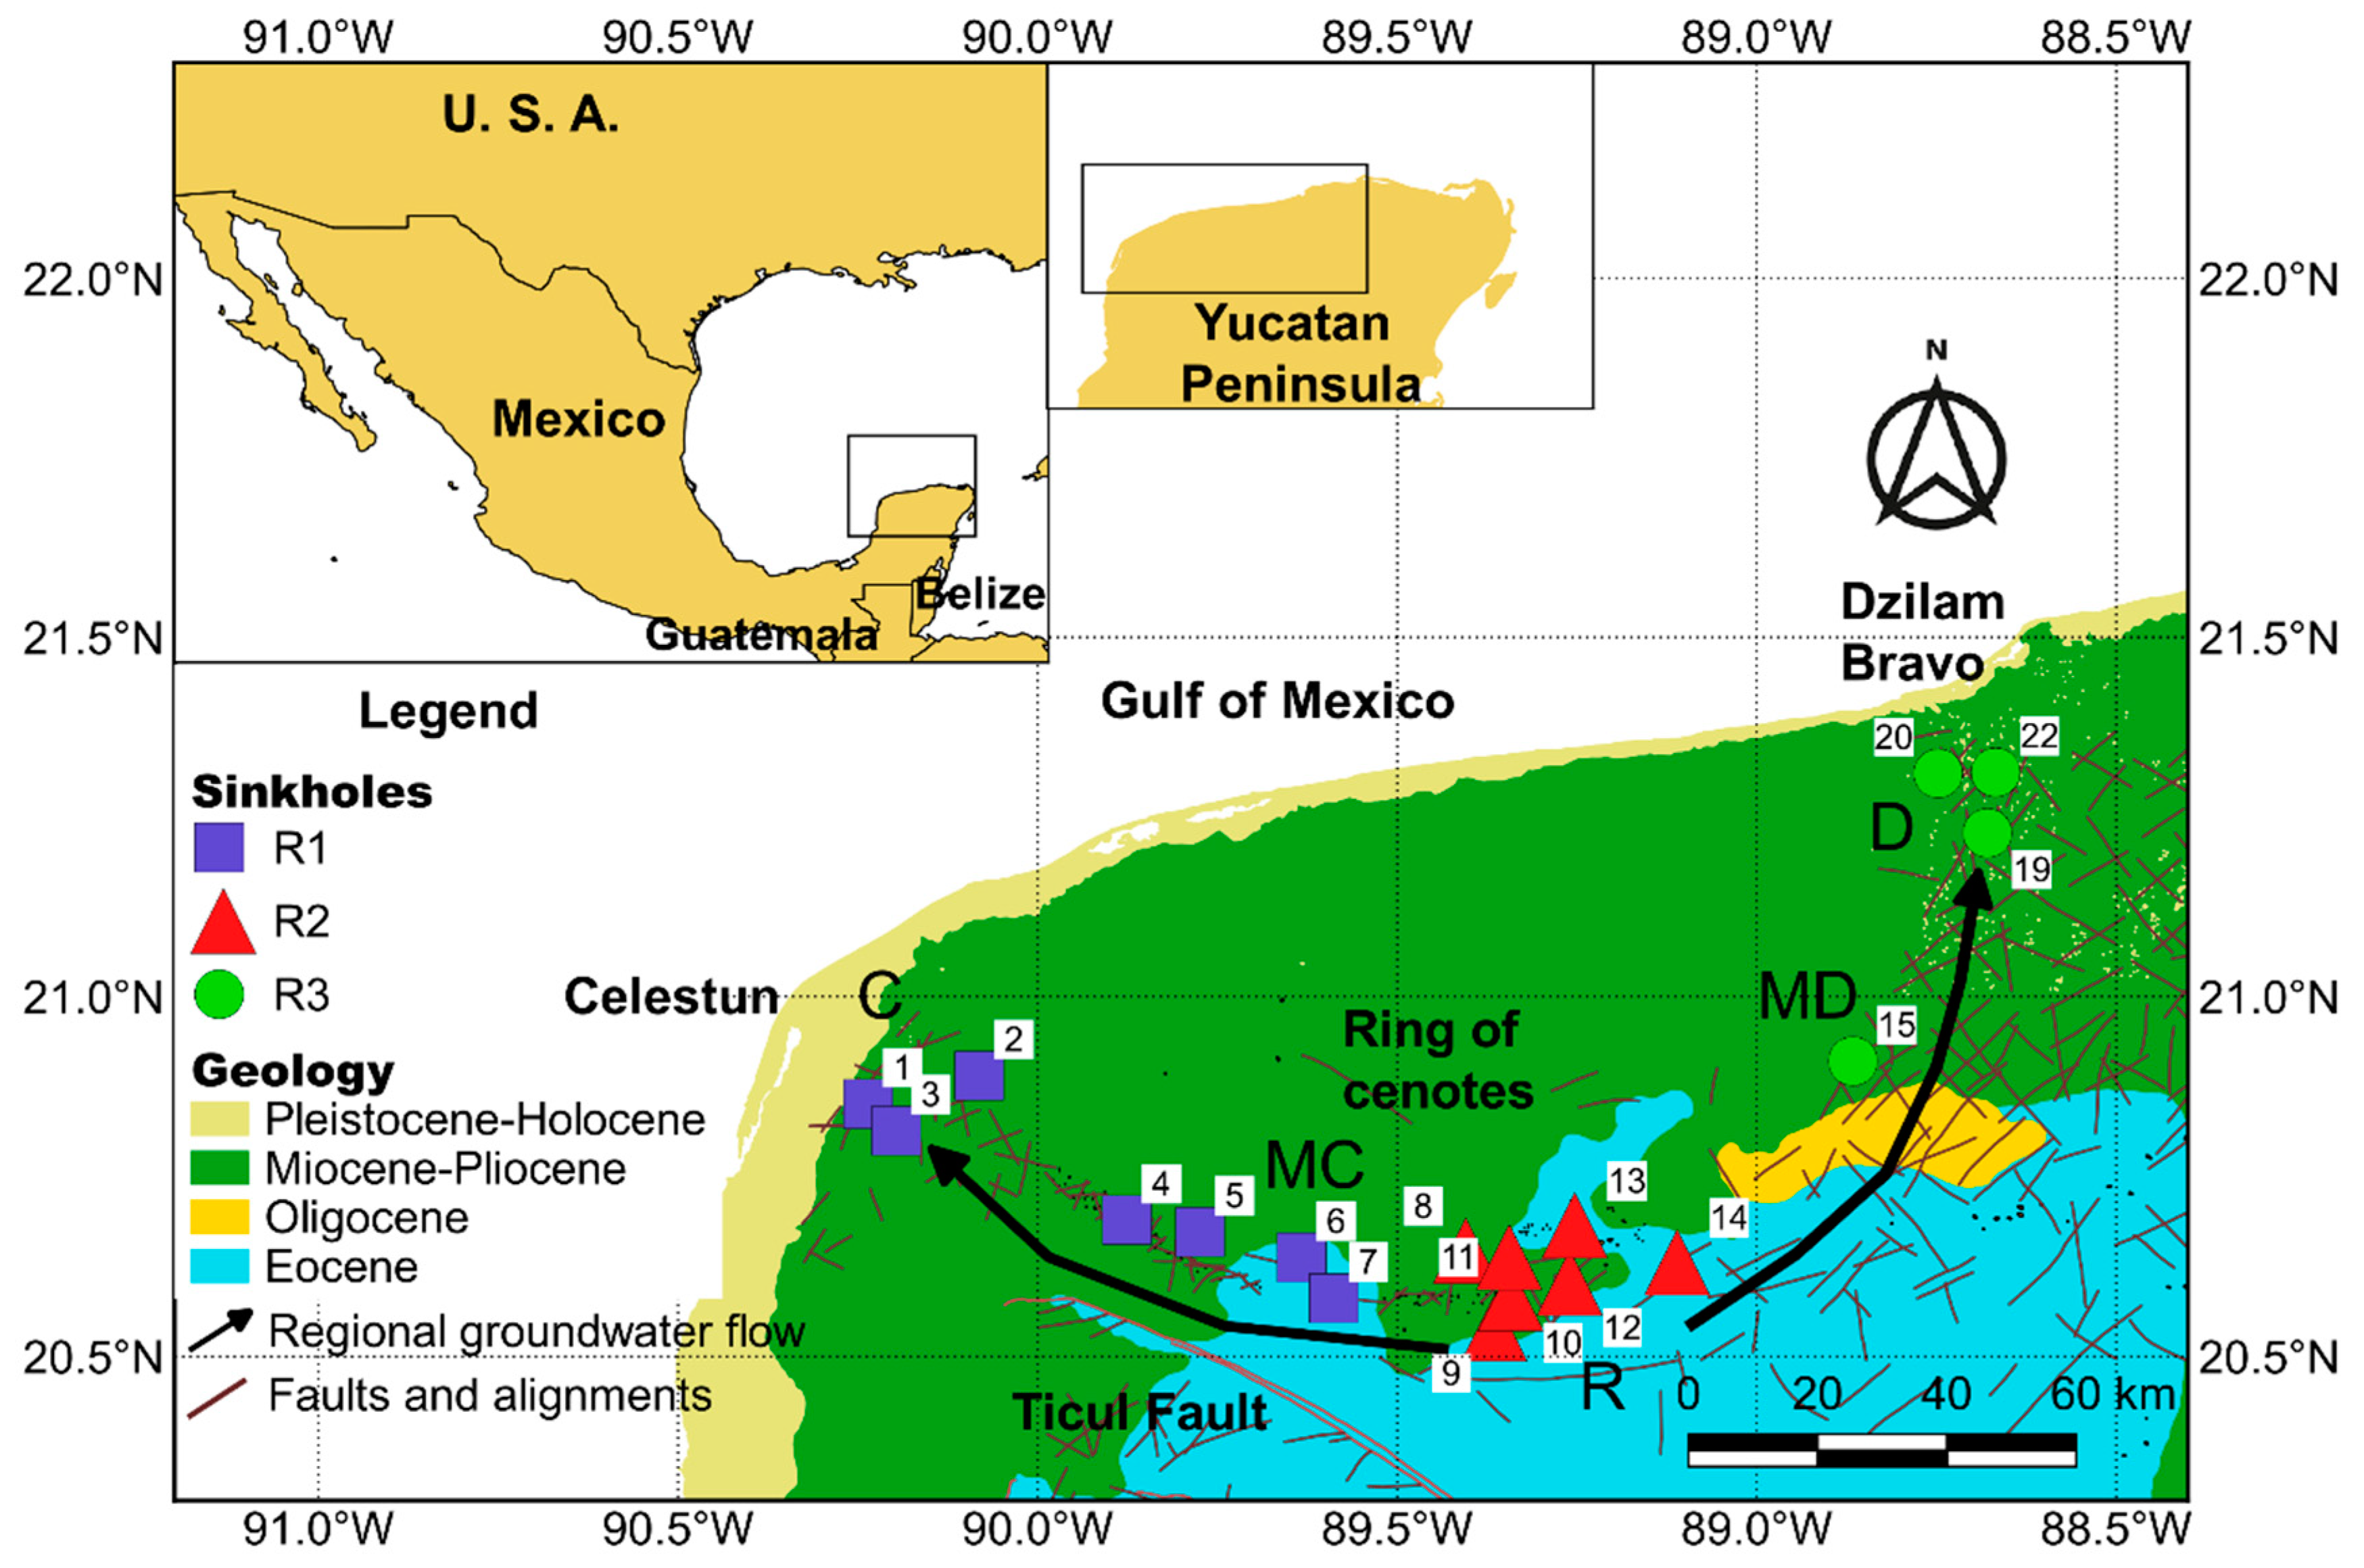
2.1. Study Zone

The Ring of Cenotes is located in Mexico, at the northwest of the YP, between the parallels 88.5–90.5° W, and meridians 20.5–21.5° N (Figure 1). The aquifer is unconfined, except for a coastal strip where variable hydrogeological confinement occurs [24,25]. The hydraulic gradient typically ranges from 1 to 10 cm km−1 (extremely low). The regional groundwater flow is towards the coast and the RC has been reported as a preferential flow path [8,24,25]. The prevailing climate is wet-tropical, with an annual average temperature of about 26 °C, with a minimum in December and January and maximum from May to August [7]. The rainy season occurs from June to October, while the period between November and May is dry. The annual rainfall averages 1218 mm for the whole YP, while the potential evapotranspiration index is 1200–1400 mm [26]. Within the RC, the annual cumulative rainfall varies from 500 mm in the north coast to 1200 mm in the south [26].
Because of its water reserves and high biodiversity, the RC has been designated a RAMSAR site. Moreover, it is part of a state reserve containing 99 sinkholes that constitute a freshwater source for rural human settlements [9]. The RC lacks of surficial runoff (rivers and creeks), and the aquifer has high transmissivity, particularly along the alignment of karstic structures [8,24]. The flow paths discharge into two coastal lagoons: Ria Celestun and Bocas de Dzilam. This discharge helps in maintaining the health of the mangrove and seagrasses ecosystems which support a high diversity wildlife of ecological and commercial concern [15].
Butterline and Bonet described the study area surficial geology as sedimentary carbonic-dolomitic sequences and intercalations of evaporites from Paleocene to Miocene [27]. The RC extends over four geological formations [18,28,29,30,31]: (a) the Chichen Itzá formation composed of massive fossiliferous limestones from the Eocene, (b) Oligocene stratified sandy limestones with the presence of clays, (c) the Carrillo Puerto formation composed by fossiliferous limestones from the Miocene-Pliocene that covers discontinuously to the Oligocene, and (d) Pleistocene-Holocene littoral and lacustrine sediments with the presence of shells and mollusks along the coast (Figure 1). Geochemically, the RC has been regionalized [10] into three regions: (a) Region 1 (R1), located at the west, where sulfates, sodium and chlorides increase towards the coast, (b) Region 2 (R2), located at the south side, characterized by slightly acid pH values, lower electrical conductivity, and lower ion (Na+, K+, Mg+2, Cl) concentrations. Here, near the Eocene formation, is where the recharge of the RC occurs, and (c) Region 3 (R3) at the east of the RC, characterized by an increase of pH and chloride towards the coast.
The surficial geology and the regional hydrogeochemistry [19,24] show that calcite, gypsum, and dolomite are the most common minerals of the RC, and these solid phases interact with groundwater and seawater from the marine intrusion [16]. Apparently, groundwater dissolves calcite, while sulfates and chloride increase its concentrations as the groundwater flows to the coast due to marine influence [19,24]. On the other hand, Velazquez [19] identified a sulfate enrichment pathway in the Eocene aquifer and the influence of dolomites and gypsum. Graniel-Castro et al. [17] and Perry et al. [18] suggest that Sierrita de Ticul is the main way along which the dissolved sulfates—originated from gypsum dissolution due to weathering of the Paleocene Icaiché formation—travel from the Chichancanab lagoon (located 110 km southeast of the RC).

2.2. Field Measurements and Laboratory Analyses

Water samples were collected from sinkholes (n = 18). during four periods: May–June 2006 (SP1), October–November 2006 (SP2), February–March 2007 (SP3), and April–May 2008 (SP4). Selection of the sampled sinkholes followed the regionalization proposed by [10]. During each field survey, water samples were collected at three depth levels (0.5, 5.5, and 10.5 m) using a Van Dorn bottle (WILCO®). However, to avoid bias due to variations in temperature, dissolved oxygen, pH, and suspended solids at the surficial levels, only the samples from the deeper level (10.5 m) were considered for analyses. All the collected samples came from the freshwater lens because the halocline was at least 18–25 m below the water table, no saline water was collected neither in the coastal zone (C and D) nor the recharge zone (MD, MC, and R). Temperature (T), pH, electrical conductivity (EC) and dissolved oygen (O2) were measured in situ using a multiparametric probe (Hydrolab G-Quanta®). The concentrations of major elements (Na+, K+, Ca+2, Mg+2, Cl, HCO3, SO4−2, NO3) were determined according to [32]. All water samples had an ionic balance in the range of ± 5% to ± 10%.

2.3. Hydrogeochemical Model of the RC

2.3.1. Hydrogeochemical Evolution of Groundwater in the RC

The RC’s evolution analysis included ternary hydrogeochemical diagrams of the groundwater, using milliequivalents per liter for all samples (sinkholes 1–22) [33]. The rSO4−2/rCl ratio was plotted to identify the spatial patterns of sulfates and the salinization in the RC [19,24]. The conceptual model was based on the interactions between groundwater and the lithologic solid phases along the regional groundwater flow paths.

2.3.2. Determination of Saturation Indexes (SI)

Calcite, dolomite and gypsum saturation indexes (SI) can be a good proxy of the saturation level of these minerals in groundwater [34]. Positive SI means that the solution is oversaturated, and the mineral will tend to precipitate. When SI is negative, the solution is undersaturated, and the mineral will dissolve. If SI is close to zero, then the solution is at equilibrium. Because it is uncommon to find solutions exactly at equilibrium (SI = 0), an equilibrium interval within 0 ± 5% from the log of K was assumed [33,35]. SI estimation was carried out using the software PHREEQC 3.0, which calculates SI from the molality and the activity coefficient of the dissolved species [36].
Rainfall (H2O) with a high content of carbon dioxide (CO2) forms carbonic acid (H2CO3), which allows the dissolution of carbonate rocks when it comes in contact with surficial minerals [33], as described by Reactions (1)–(4):
H 2 O + C O 2 H 2 C O 3
C a C O 3 + H 2 C O 3 C a + 2 + 2 H C O 3
C a M g ( C O 3 ) 2 + 2 H 2 O + 2 C O 2 4 H C O 3 + C a + 2 + M g + 2 C a C O 3 + M g C O 3 + 2 H 2 O + 2 C O 2
C a S O 4 ( H 2 O ) 2 C a + 2 + S O 4 2 + 2 H 2 O
Early studies showed that groundwater in the Yucatan aquifer is near-equilibrium with respect to calcite and dolomite because of the low velocity of groundwater [18,19,24]. However, the dissolution/precipitation rate of these minerals is not quantified yet.

2.3.3. Groundwater Mineral Precipitation/Dissolution Rate Modeling

The estimation of the dissolution and precipitation rates in the sinkholes water was carried out using the inverse modelling module, implemented in the PHREEQC 3.0 software [36]. Inverse modelling is based on the initial and final chemical compositions of a solution along a flow line, as well as on the minerals and gases present in the environment, using the mass balance approach. The results obtained are the estimates of seawater mixing proportions and potential mass transfers from the considered lithological phases in millimoles per kilogram of water (mmol kg1H2O) [36].
Using the RC regionalization proposed by [10], two groundwater trajectories, from the recharge region (R), were analysed using inverse modelling: (a) toward Celestun and (b) toward Dzilam Bravo.
The trajectory to Celestun flows through the Eocene and Miocene formations from the recharge region (R) to the midpoint MC, and then continues to the coast through the Miocene only. The trajectory towards Dzilam flows from the recharge region (R) to the midpoint MD passing through the Eocene, Oligocene, and Miocene formations and continues to the coast through the Miocene only (Figure 1).
Average ion concentrations from sinkholes (Table 1, excluding NO3) were used for the inverse modelling. For the recharge area R, ion concentrations from sinkholes 8, 10–14 were averaged. For MC, concentrations of sinkholes 6, 7 and 9 were averaged. For MD, concentrations from sinkhole 15 were used. In the case of the coastal areas, the average concentrations from sinkholes 1–5 was used for C, and the average concentrations from sinkholes 19, 20, 22 for D. Calcite, dolomite, and gypsum were provided as the lithological solid phases [18,19,24]. Additionally, marine water solution was included to simulate the marine influence within the aquifer towards the coast [39]. Finally, O2 and CO2 phases were also included in the model as suggested in Equation (1).
For convergence, a global uncertainty of 0.10 was set. All possible water-rock interactions were considered. The best solution was selected based on the smaller molal balance residual, previously estimated by the simplex method implemented in PHREEQC [36].

2.4. Rainfall Analysis

To analyse the rainfall influence in the study area during the sampling period (SP1-SP4), we used diurnal and monthly accumulated precipitation data from ten meteorological stations from the National Commission of Water (CONAGUA): four stations for the recharge zone (Cuzama, Cantamayec, Sotuta, and Kantuninkil), two for Celestun (Kinchil and Celestún), and four for Dzilam Bravo (Tunkas, Temax, Buctzotz, and Dzilam Bravo). We averaged the accumulated precipitation measured during each sampling period (two months).
We analysed the rainfall’s influence on the seawater mixing, chemical activities, and saturation indexes through a simple linear regression model. The regression considered the rainfall as the explanatory variable and seawater mixing, chemical activities, and saturation indexes as response variables. Pearson’s correlation was used for most of the data that met normality, and Spearman’s method was used for those with non-normal distribution. All tests were performed applying a significance level of 0.05.

3. Results

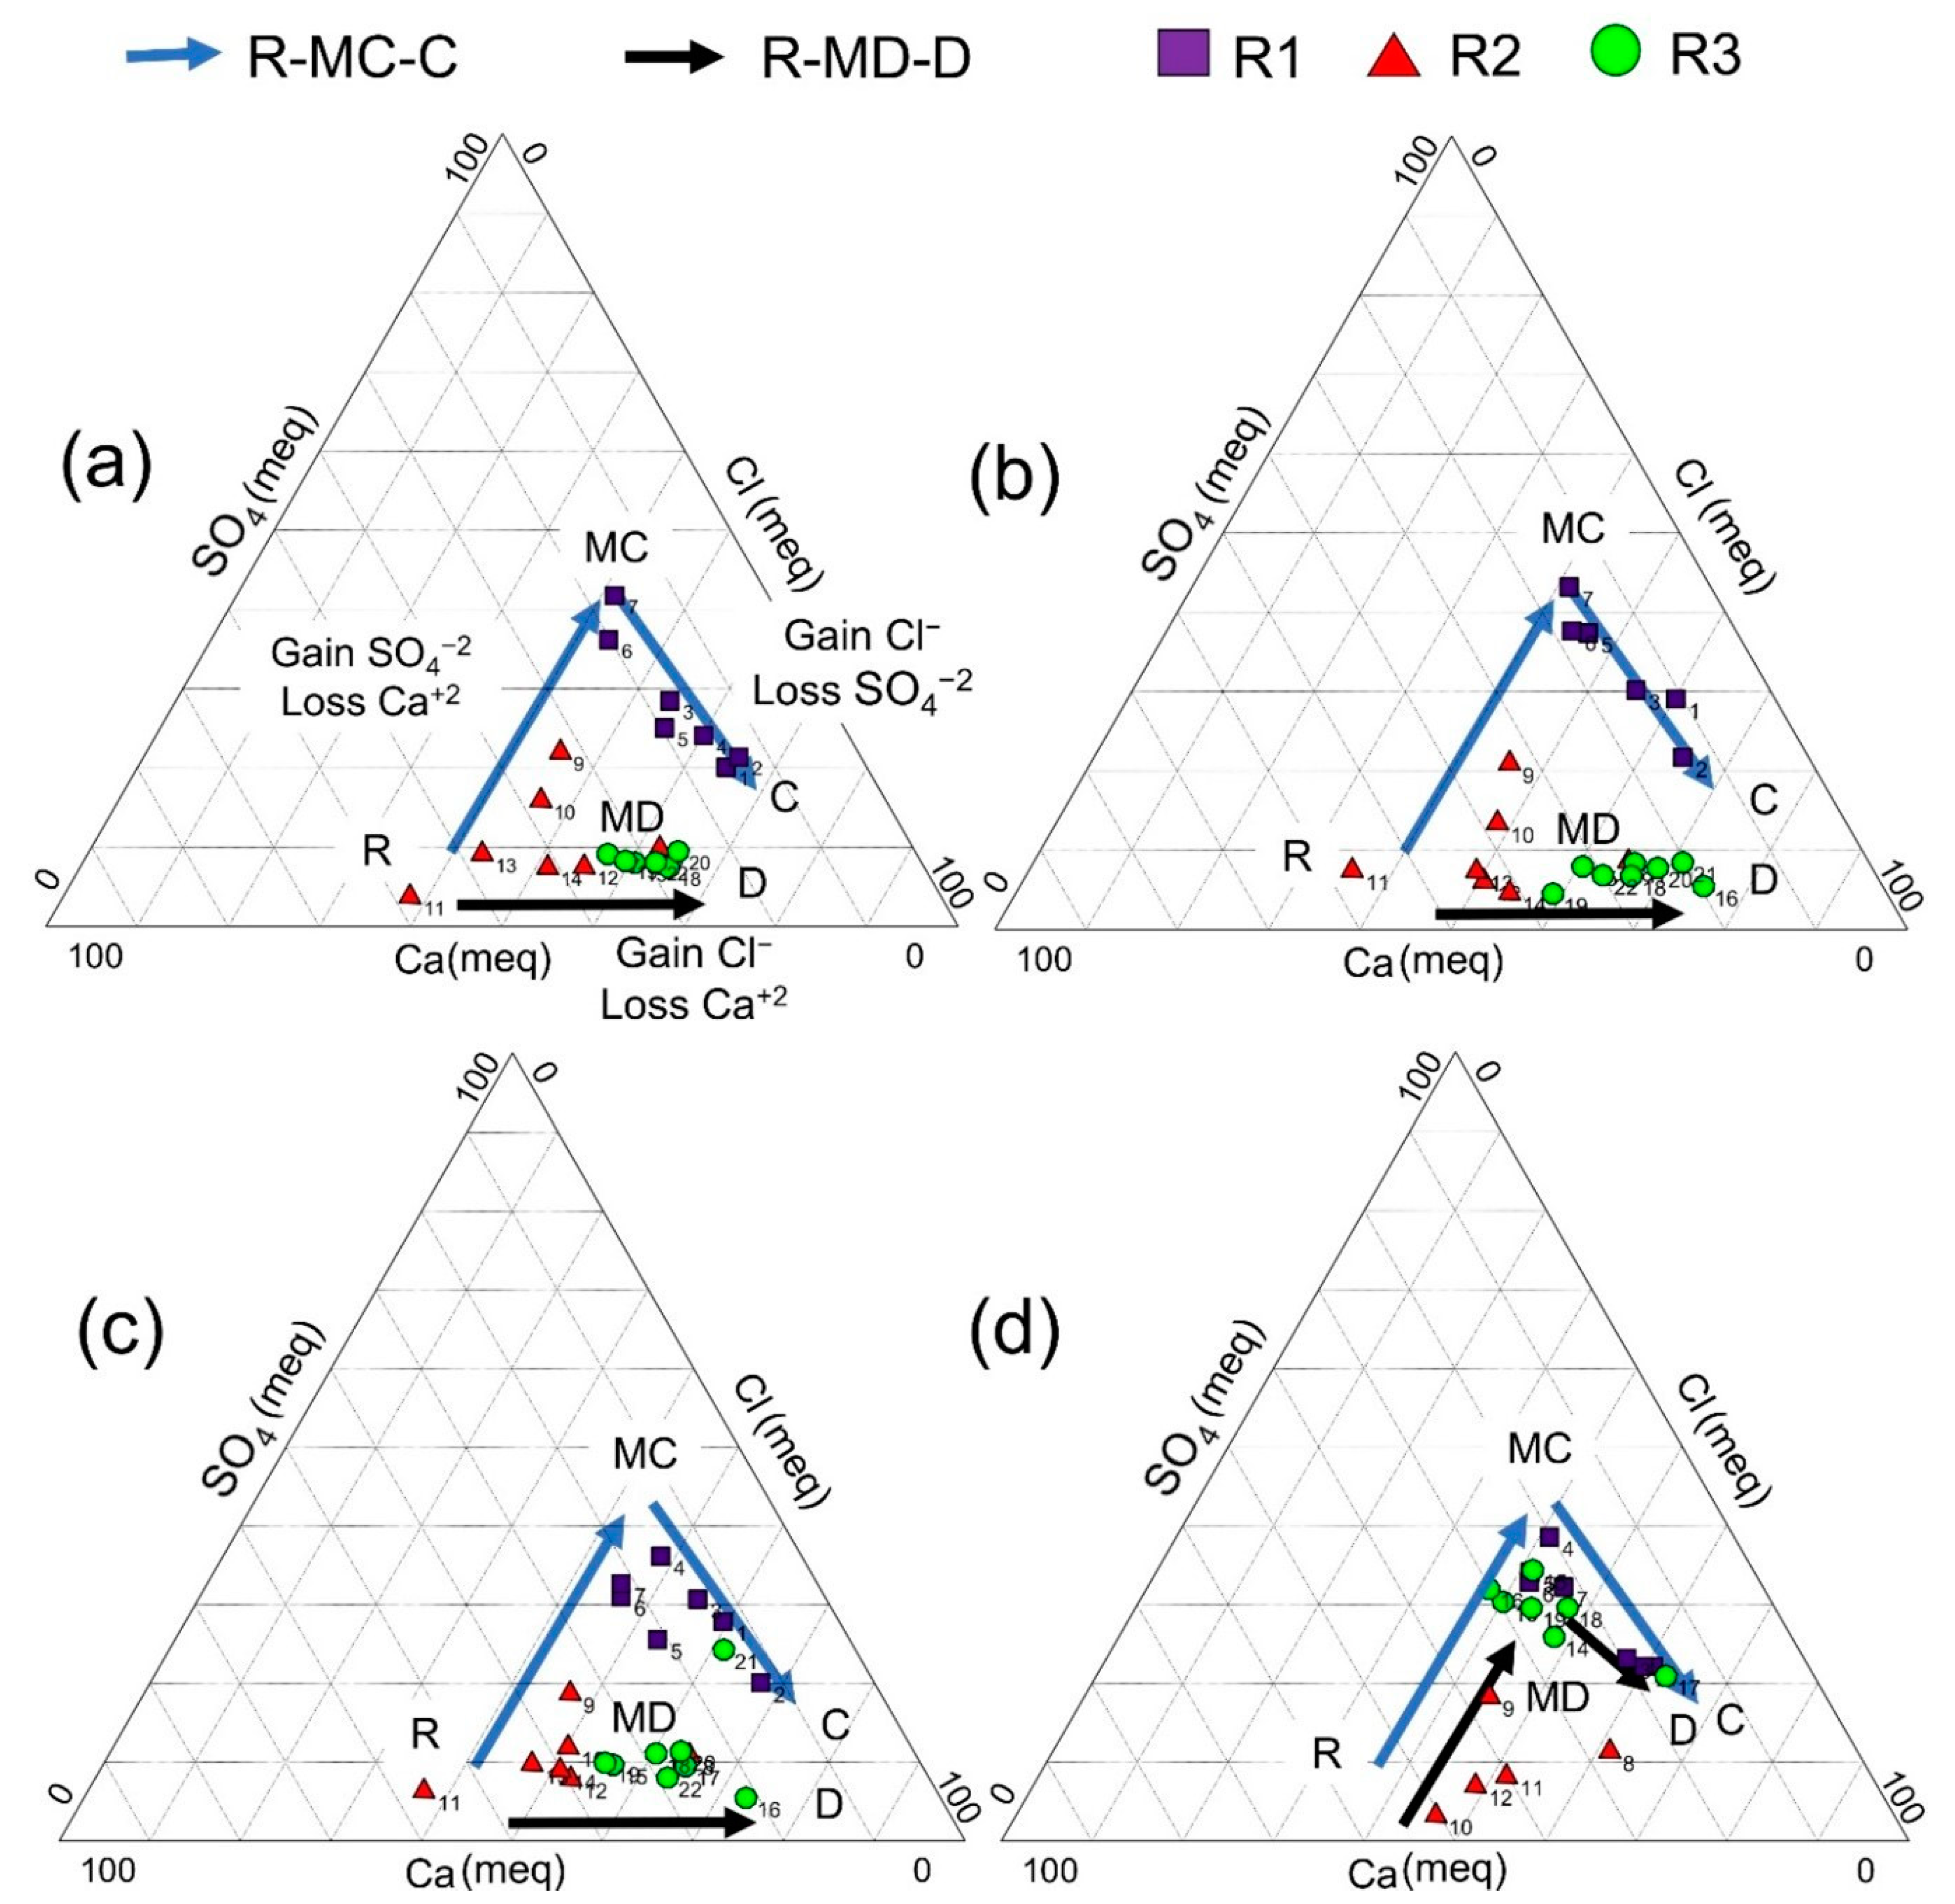
3.1. Hydrogeochemical Evolution of the Groundwater of the RC

Major ion concentrations in the RC showed two different evolution trajectories toward the coastal areas of Celestun and Dzilam Bravo (Figure 3 and Figure 4).
Celestun’s trajectory showed an increase of sulfates associated with gypsum’s dissolution from the Eocene aquifer on the middle trajectory (R-MC). This behaviour is consistent with previous studies for the Eocene aquifer near Ticul [19,24]. In the MC–C segment, we found an increase in chloride and a decrease in sulfate concentration (Figure 3), revealing marine influence due to the reduction in the freshwater lens’s thickness above the halocline that caused groundwater salinization near Celestun [19]. The freshwater lens reduction also caused decreased sulfates because of seawater mixing.
The Dzilam Bravo trajectory showed an increasing chloride concentration toward the coast (samplings SP1 to SP4) and a decreasing calcium concentration (Figure 3). Figure 3d shows an increase in R-MD sulfate concentration, similar to the Celestun R-MC trajectory only during SP4, probably due to meteorological reasons.
The saturation indexes of calcite, dolomite, and gypsum (SIc, SId and SIg, respectively) are shown in Figure 4a–c. SI showed equilibrium for calcite (−0.424 < SIc < 0.424) and dolomite (−0.416 < SId < 0.416) at all samples from R. On the middle points (MC and MD), most of the samples were also in equilibrium with calcite (−0.424 < SIc < 0.424) and dolomite (−0.416 < SId < 0.416); the only exceptions were the MC average sample, which was undersaturated for dolomite (SId = −0.74) during survey SP2 and oversaturated during SP3 (SId = 0.64), and MD samples from survey SP3, which were oversaturated for both calcite (SIc = 0.67) and dolomite (SId = 1.45). Point C showed chemical equilibrium with calcite (−0.424 < SIc < 0.424), except for the sample from SP2 (SIc = 1.05), while dolomite showed oversaturation in SP2 and SP3 (SId = 2.29 and 0.69, respectively). Point D showed oversaturation with calcite in SP2 and SP4 (SIc = 1.39 and 0.88, respectively) and with dolomite in SP2, SP3, and SP4 (0.56 < SId < 2.87). All samples showed the potential to dissolve gypsum, but it was more evident in the R sample (SIg < −0.229, Figure 4c). The recharge zone showed chemical balance with calcite and dolomite but towards the coast dolomite may precipitate, while gypsum could be dissolved at any point of the trajectories described.
Marine influence was stronger in Celestun as compared to Dzilam Bravo. Point C showed a seawater proportion between 1.0 and 1.9% (SP2 and SP3 respectively), while point D showed a percentage range of 0.2 to 0.5% (SP1 and SP2 respectively Figure 4). Pérez-Ceballos et al. [10] described such behaviour in their regionalization, and this was also supported by the results observed in SP4.
Finally, the rSO4−2/rCl ratio in contrast to rCl showed that groundwater hydrogeochemical evolution was consistent with the regional trajectories of the YP’s aquifer [19,24]. The trajectory towards Celestun showed sulfate enrichment, likely a consequence of the gypsum dissolution, while the trajectory towards Dzilam Bravo showed only seawater enrichment (Figure 5). During the period SP4, the sulfates and chloride enrichment increased towards the Dzilam trajectory, likely due to reduced rainfall.

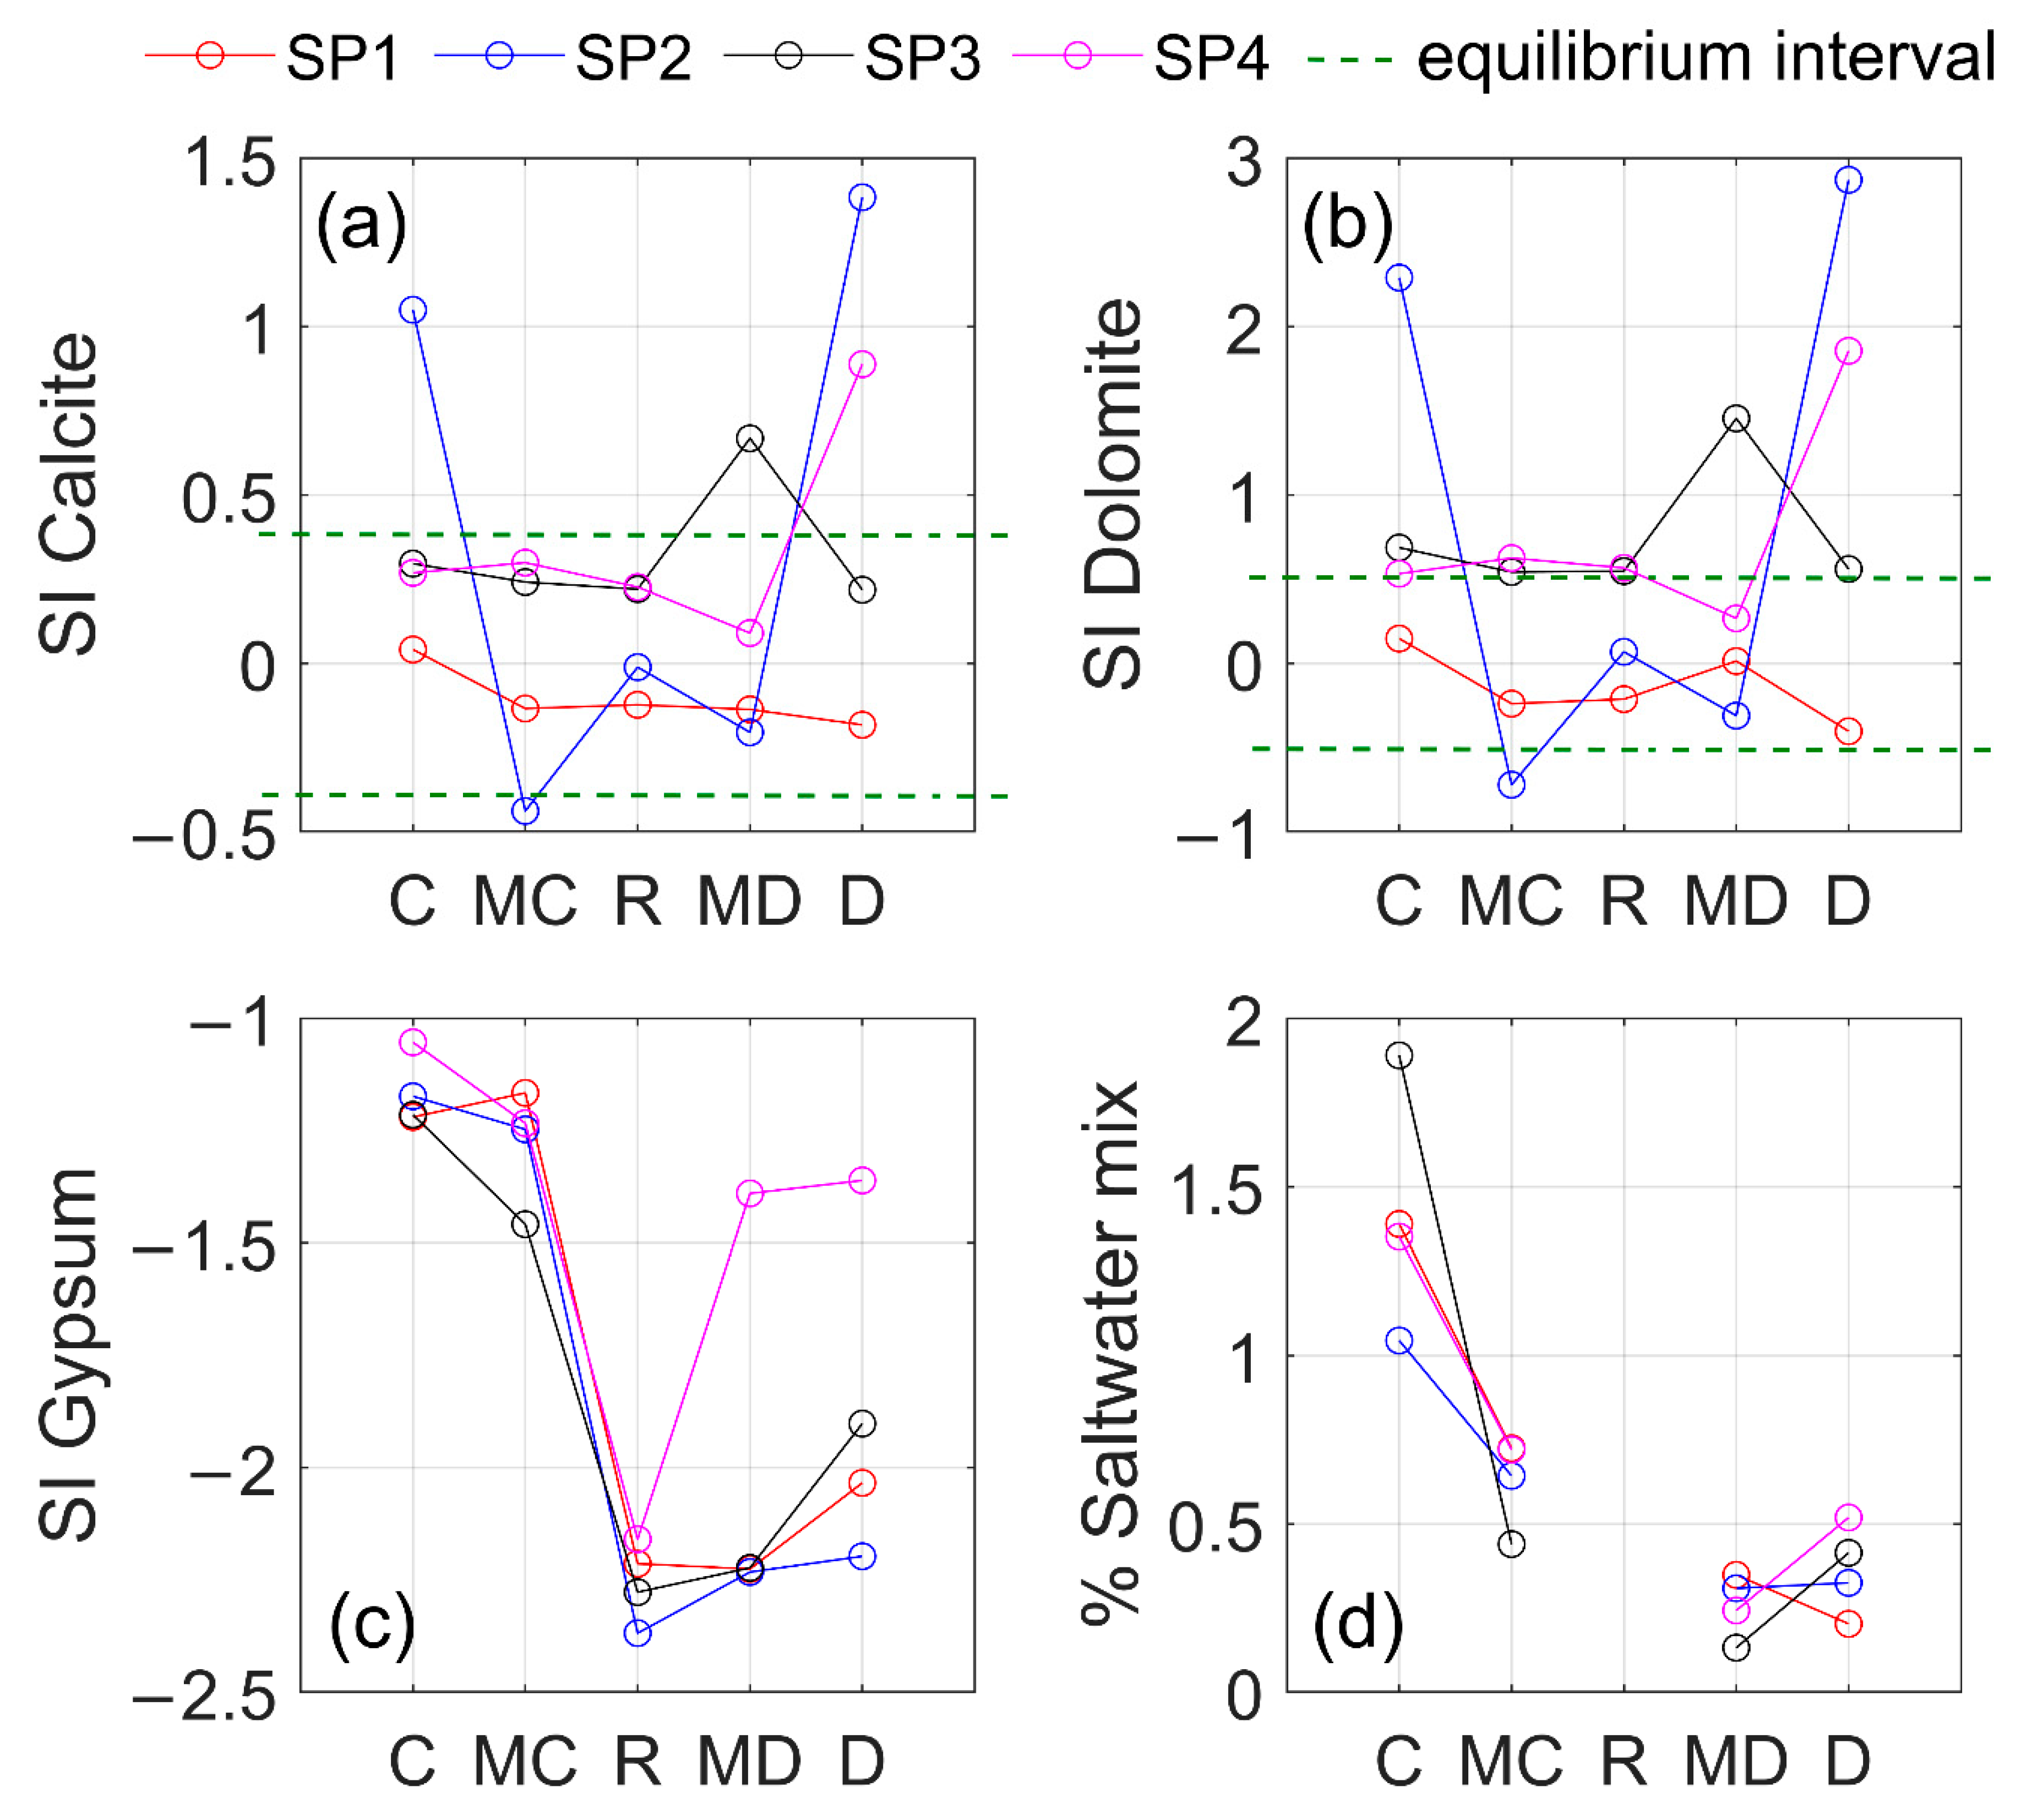
3.2. Groundwater-Rock Interaction in RC

The analysis of the chemical evolution along the trajectories and the SI explained the regional spatial distribution of the water quality in the RC. However, this approach only considered the potential for dissolution of each one of the minerals without considering coupled interactions. Conversely, inverse modelling (fed with the information of the lithological phases) allowed prediction of the dissolution/precipitation rates of these minerals, considering the known concentration in the water samples (Table 1). The optimal hydrogeochemical model was selected using the criterion of smaller molal residual. This model shows the calcite-dolomite-gypsum interaction additionally to the interaction of oxygen and carbon dioxide as phases of the balance. There were fewer model solutions to explain the evolutionary trajectories from R to MC and MD compared with the number of solutions found from MC, MD to C, D, respectively.
In the trajectory towards Celestun, our results indicate calcite precipitation and gypsum and dolomite dissolution on the segment (R-MC). In contrast, on the second segment (MC-C), the gypsum and dolomites showed a decrease dissolution activity (these minerals even precipitated), and calcite had a potential dissolution rate greater than the remaining lithological phases. On the R-MC, the precipitation of calcite was consistently indicated on all the surveys (SP1-SP4), showing activity rates between −0.42 and −2.048 mmol kg−1H2O (Figure 6a). The potential dissolution activity rate of dolomite and gypsum was in the range of 0.33–1.05 and 1.06–1.99 mmol kg−1H2O, respectively (Figure 6b,c). Finally, on segment MC-C the calcite showed average potential dissolution rates of 0.71 mmol kg−1H2O for the surveys SP1 and SP4, while for surveys SP2 and SP3, the average precipitation was 0.23 mmol kg−1H2O (Figure 6a). The potential dissolution activity rate of dolomite showed a decreasing trend (0.07 and 0.14 mmol kg−1H2O, surveys SP2 and SP3), smaller than those observed on the segment R-MC, and we even observed potential precipitation of this mineral in survey SP1 (activity rates of −0.14 mmol kg−1H2O, Figure 6b). Similarly, gypsum showed a reduced potential dissolution activity on the segment MC-C, contrasting with the segment R-MC. Gypsum potential dissolution rates ranged between 0.38 to 0.71 mmol kg−1H2O (surveys SP2 to SP4), and in survey SP1 precipitated at the activity rate of −0.6 mmol kg−1H2O (Figure 6c).
On the Dzilam Bravo trajectory, the first segment (R-MD) the calcite precipitation showed potential activity between −0.2 and −1.5 mmol kg−1H2O, except during SP2, which showed a potential dissolution rate equal to 0.056 mmol kg−1H2O (Figure 6a). The dolomite activity rate was in the range of 0.2–1.46 mmol kg−1H2O (Figure 6c). The least activity of gypsum was observed in SP1–SP3, with precipitation rates between −0.006 and −0.02 mmol kg−1H2O (Figure 6c). During SP4, the dissolution rate of gypsum was 1.16 mmol kg−1H2O (Figure 6c). On the second segment (MD-D), enrichment with calcite was revealed, while the precipitation dolomite and gypsum showed less activity. However, during SP1, we observed a further enrichment of calcite and dolomite precipitation due to higher rainfall.
There was less calcite activity on the segments R-MC and R-MD (for both trajectories: Celestun and Dzilam Bravo) than on the coastal zone (calcite dissolution increased along MC-C and MD-D). The dissolution of dolomite was consistent on the segments R-MC and R-MD and higher than the activity rates and precipitation towards the coast (MC-C and MD-D). The hydrogeochemical inverse model predicted the Eocene aquifer’s influence with inputs of dissolved dolomite in the groundwater, as described by [19]. At the coast, the process of dolomite precipitation was mainly due to chemical exchange with cations such as Mg+2 available in the aquifer and from mixing with marine water. Such a process has previously been described for the coastal area of YP by [16,40,41].
Regarding the trajectory towards Celestun, a constant enrichment of gypsum on the segment R-MC was observed, which matches the evolution of sulfates dissolution described by [19,24]. On the trajectory to Dzilam Bravo, this mineral showed little activity as compared to the other lithological phases. However, an atypical behaviour was found, in the samples from SP4 survey which showed high gypsum concentrations on the segment R-MD, similar to those in segment R-MC (Figure 6c).

4. Discussion

The groundwater showed two different hydrogeochemical evolutions along the trajectories from the recharge zone towards the coastal zones of Celestun (R-MC-C) and Dzilam Bravo (R-MD-D), as suggested by the ternary diagrams and the ratio rSO4−2/rCl. The inverse modelling approach confirmed such hydrogeochemical tendencies.
From the recharge area to Celestun, the increase of sulfates is likely associated with the dissolution of the gypsum’s Eocene aquifer. The dissolution of gypsum in R-MC was present in all surveys, which is consistent with the results of Perry et al. [18,24,28], who argued that sulfates originate from gypsum dissolution at the Chichancanab lagoon, and move through the Ticul fault.
The segment R-MC showed chemical equilibrium for calcite and dolomite, and undersaturation for gypsum (Figure 4). Additionally, gypsum and dolomite dissolution, as well as calcite precipitation, were observed. This combination of processes is also known as dedolomitization [42], and is closely related to coupled variations of Mg+2 and Ca+2 concentrations in the groundwater [23].
In the coastal segment of this trajectory (MC-C), gypsum and dolomite showed a decreasing activity (and even precipitation during SP1, Figure 6b,c); but calcite dissolution and marine water influence were also evident (Figure 4d or Figure 6a). Conceptual models [16,40] predict dolomite precipitation through lattice replacement with Mg+2 from seawater [43]. The observed decrease of sulfates (Figure 3) was due to seawater mixing as a consequence of the reduction in the thickness of the freshwater lens above the halocline. Overall, the inverse modelling implemented in this work is in agreement with earlier conceptual models proposed by [16,18,19,23,24,40,41,42] and supports them.
The Dzilam Bravo trajectory also showed salinization toward the coast, although less intense than in the Celestun trajectory (Figure 4d). The enrichment of chloride and sulfate was more noticeable during the dry season of 2008 (SP4, Figure 3d or Figure 5d), likely being a consequence of the scarce rainfall. Calcite was the lithological phase showing higher activity along the Dzilam trajectory, contrasting with gypsum and dolomite. While calcite apparently precipitated on the R-MD segment, later it dissolved on the MD-D segment (Figure 6a), which was likely favoured by the higher influence of seawater towards the coast [16]. On the other hand, gypsum activity, which was overall lower in this trajectory, increased to levels as high as those found along the Celestun trajectory (Figure 4 and Figure 6) during SP4 when rainfall was lowest at Dzilam Bravo (Figure 7).
The importance of rainfall for Dzilam Bravo is further outlined by the strong inverse relation found for seawater mixing with rainfall in this trajectory (R2 = 0.94; p = 0.03, Figure 8), showing the effect of rainfall variations on the marine intrusion there. In contrast, although seawater mixing was higher at Celestun, it did not relate significantly with rainfall (R2 = 0.26; p = 0.49, Figure 8).
Although the regression analyses were non-significant for most of the analysed variables (Figure 9), our findings suggest a groundwater input, non-dependent on the rainfall coming from the south towards Dzilam, as suggested by Long et al. [23]. Earlier studies suggest that gypsum dissolves by weathering downstream in the older formations (Eocene and Paleocene), traveling toward the RC [18,19,24,28] and, according to our findings, later to the coast. This suggests that gypsum concentration depends on the previously dissolved sulfates in the Eocene and Icaiché formations and not necessarily on the local recharge by rainfall.
For the Celestun trajectory, gypsum was inversely related with the rainfall, although such regression was statistically non-significant (Figure 9a). Similarly, no statistically significant regression of the dissolution/precipitation rates for dolomite and gypsum regarding the rainfall were present for Dzilam (Figure 9b). These results suggest, according to the hydrogeochemical model, that the rainfall causes an important effect on the aquifer’s recharge only for the Dzilam Bravo trajectory, similarly to the findings of [21,23]. However, Celestun showed a higher potential transference rate from the lithological phases as compared with Dzilam Bravo due to higher influence of marine water. Thus, the hydrogeochemistry of Celestun is more closely related to seawater mixing, as opposed to Dzilam Bravo, where the rainfall effect is more important.
This higher seawater mixing towards Celestun relative to Dzilam Bravo could be related to hydrogeological coastal differences among these two sites. Along the Yucatán’s coast, the confinement influences the interaction between seawater and the aquifer, affecting the coastal aquifer’s salinity [25,44,45]. The coastal confinement effect extends about 20 km towards Celestun, but only about 3 km toward Dzilam Bravo [24,46]. This means that Celestun is more confined towards the continent than Dzilam Bravo, and hypothetically, Celestun is more influenced by the seawater and its physical processes, which results in the higher precipitation rate of gypsum and dolomite, and the higher seawater mixing as compared to Dzilam Bravo.
Therefore, saline intrusion on the Celestun trajectory could have a significant effect on the RC water quality, adding up to the impacts caused by increasing human population, tourism and industrial development, as well as sea rise level driven by climate change [47,48]. Because of this higher vulnerability of the RC groundwater on the Celestun trajectory, we here highlight the importance of establishing a permanent salinization monitoring program with higher priority during the winter months, when atypical meteorological tides are caused by cold fronts [10,45]. In this regard, chlorides should be monitored on segment MC-C (about 70 km from the shoreline), while sulfates are of particular concern in segment MC-R. We also propose monitoring sulfates during the dry season for Dzilam Bravo because of the increase of sulfates activity during lower rainfall periods. We recommend seasonal monitoring along the MD-D segment (sinkholes 17 and 19) and in R-MD (sinkhole 10 to 16) located a 20 km and 30 to 62 km, respectively, from the Dzilam Bravo’s shoreline.
The high concentrations of sulfate we found in the recharge zone (R) of the RC have a natural origin in the dissolution of gypsum from the Eocene formations. However, earlier studies reported high concentrations of sulfate in wells drilled near Ticul, likely due to extensive use of fertilizers in local agriculture that eventually reach the aquifer contributing to the increase of sulfate concentration [17,23], which could in the short term become unacceptable for human populations [49]. For example, it is known that sulfates may have a laxative effect when combined with Ca+2 and Mg+2 [49,50], and both ions are also present in the RC. Therefore, the cenotes at the recharge zone must also be monitored, especially during the dry season, when gypsum interaction is higher (Figure 8 and Figure 9).

5. Conclusions

Groundwater in the RC flows along two different trajectories with different evolution. Both initiate at the RC’s recharge zone and travel towards the coastal towns of Celestun and Dzilam Bravo.
In the Celestun trajectory, gypsum inputs from the Eocene aquifers were detected, which then precipitate due to mixing with seawater towards the coast. The marine intrusion influences the dissolution and precipitation processes of the lithological phases showing dedolomization in the segment R-MC of the trajectory to Celestun and dolomite precipitation in the coastal zone (MC-C).
In the trajectory towards Dzilam Bravo, calcite precipitation/dissolution processes were more active than gypsum and dolomite. Groundwater with higher gypsum concentration due to the weathering on the Eocene formations was observable only during the lower rainfall sampling (SP4).
The marine intrusion (up to 2% of seawater) in the Celestun trajectory was higher than in the Dzilam Bravo trajectory. Marine intrusion in the Celestun trajectory is not affected by the rainfall, while in the coastal zone of Dzilam Bravo, it strongly varies inversely with rainfall.
We would like to briefly outline the advantages of the inverse model here used over the SI analyses derived from its capability to analyse the lithological phases in a coupled way, producing more detailed predictions. For example, the SIg suggested gypsum dissolution all along the Celestun trajectory (Figure 4), but the inverse model predicted a decrease of gypsum’s activity and even its precipitation at the MC-C segment. Additionally, the inverse model allowed to identify the occurrence of dolomite precipitation at R-MC. Altogether, our results sustain the usefulness of this approach for assessing the evolution of groundwater hydrogeochemistry and quality.
Finally, both regional flow trajectories of the RC are vulnerable to climate change effects, such as the sea level rise, because the hydrogeochemical processes are affected by the interaction with seawater. However, Celestun is more likely susceptible to the rising sea level. In contrast, Dzilam Bravo can be affected by changes in the rainfall patterns because the hydrogeochemical processes taken place, depend more on the aquifer recharge. Monitoring of marine intrusion and phases dissolution in the RC is highly recommended to assess the evolution of the system and could be done simply through chlorides and sulfates measurements.

Author Contributions

Conceptualization, R.P.-C. (Rosela Pérez-Ceballos); Formal analysis, R.P.-C. (Rosela Pérez-Ceballos), C.C.-M. and R.P.-C. (Roger Pacheco-Castro); Investigation, R.P.-C. (Rosela Pérez-Ceballos), R.P.-C. (Roger Pacheco-Castro), J.P.-Á. and J.E.-Á.; Methodology, R.P.-C. (Rosela Pérez-Ceballos), R.P.-C. (Roger Pacheco-Castro), J.P.-Á. and J.E.-Á.; Resources, J.P.-Á. and J.E.-Á.; Supervision, J.P.-Á. and J.E.-Á.; Writing–original draft, R.P.-C. (Rosela Pérez-Ceballos), C.C.-M. and R.P.-C. (Roger Pacheco-Castro); Writing–review and editing, J.P.-Á. and M.M.-I. All authors have read and agreed to the published version of the manuscript.

Funding

We would like to thank CONACYT and the Government of the State of Yucatan, Mexico for the financial supports to the research projects: CB-2006-01-60126 and YUC-2008-C06-108520. R.P.-C. (Rosela Pérez-Ceballos) and R.P.-C. (Roger Pacheco-Castro) acknowledges to the CONACYT for doctoral and master’s scholarships, respectively.

Institutional Review Board Statement

Not applicable.

Informed Consent Statement

Not applicable.

Data Availability Statement

The chemical data is presented in Table 1, data for Figure 2 can be found on [37,38].

Acknowledgments

R.P.-C. (Rosela Pérez-Ceballos) and R.P.-C. (Roger Pacheco-Castro) are CONACyT research fellows commissioned to the Universidad Nacional Autónoma de México. We are grateful to Victor Coronado Peraza, Armando Cabrera-Sansores, Arturo Zaldívar-Jiménez, Grisell Marrufo for their technical assistance with the sampling and Julio Cesar Canales-Delgadillo whose valuable comments contributed to improve this manuscript. All the authors thank the anonymous reviewers for their insightful comments.

Conflicts of Interest

We declare that there is no conflict of interest and that all co-authors have seen and approved the current version for submission.

References

  1. Hartmann, A.; Goldscheider, N.; Wagener, T.; Lange, J.; Weiler, M. Karst water resources in a changing world: Review of hydrological modeling approaches. Rev. Geophys. 2014, 52, 218–242. [Google Scholar] [CrossRef]
  2. Stevanović, Z. Karst Aquifers—Characterization and Engineering; Stevanović, Z., Ed.; Professional Practice in Earth Sciences; Springer International Publishing: Cham, Swizerland, 2015; ISBN 978-3-319-12849-8. [Google Scholar]
  3. Ford, D.; Williams, P. Karst Hydrogeology and Geomorphology; Wiley: Hoboken, NJ, USA, 2013; ISBN 9781118684986. [Google Scholar]
  4. Post, V.E.A.; Werner, A.D. Coastal aquifers: Scientific advances in the face of global environmental challenges. J. Hydrol. 2017, 551, 1–3. [Google Scholar] [CrossRef] [Green Version]
  5. Werner, A.D.; Bakker, M.; Post, V.E.A.; Vandenbohede, A.; Lu, C.; Ataie-Ashtiani, B.; Simmons, C.T.; Barry, D.A. Seawater intrusion processes, investigation and management: Recent advances and future challenges. Adv. Water Resour. 2013, 51, 3–26. [Google Scholar] [CrossRef]
  6. Perry, E.; Paytan, A.; Pedersen, B.; Velazquez-Oliman, G. Groundwater geochemistry of the Yucatan Peninsula, Mexico: Constraints on stratigraphy and hydrogeology. J. Hydrol. 2009, 367, 27–40. [Google Scholar] [CrossRef]
  7. CONAGUA. Programa Hídrico Regional Visión 2030 (Regional Hydric Program: 2030 Vision); CDMX: Ciudad de México, Mexico, 2012. [Google Scholar]
  8. Bauer-Gottwein, P.; Gondwe, B.R.N.; Charvet, G.; Marín, L.E.; Rebolledo-Vieyra, M.; Merediz-Alonso, G. Review: The Yucatan Peninsula karst aquifer, Mexico. Hydrogeol. J. 2011, 19, 507–524. [Google Scholar] [CrossRef]
  9. Gobierno del Estado de Yucatan. Decreto número 117-Reserva estatal geohidrológica del Anillo de Cenotes; Gobierno del Estado de Yucatan: Mérida, Yucatán, Mexico, 2013. Available online: https://sds.yucatan.gob.mx/areas-naturales/documentos/decreto-reserva-estatal-geohidrologica-anillo-de-cenotes.pdf (accessed on 21 February 2021).
  10. Pérez-Ceballos, R.; Pacheco-Ávila, J.; Euán-Ávila, J.I.; Hernández-Arana, H. Regionalization based on water chemistry and physicochemical traits in the ring of Cenotes, Yucatan, Mexico. J. Cave Karst Stud. 2012, 74, 90–102. [Google Scholar] [CrossRef]
  11. Hildebrand, A.R.; Penfield, G.T.; Kring, D.A.; Pilkington, M.Z.; Camargo, A.; Stein, B.J.; Boynton, W.V. Chicxulub crater: A possible Cretaceous/Tertiary boundary impact crater on the Yucatan Peninsula, Mexico. Geology 1991, 19, 867–871. [Google Scholar] [CrossRef]
  12. Pope, K.O.; Ocampo, A.C.; Duller, C.E. Surficial geology of the Chicxulub impact crater, Yucatan, Mexico. Earth Moon Planets 1993, 63, 93–104. [Google Scholar] [CrossRef] [Green Version]
  13. Urrutia-Fucugauchi, J.; Camargo-Zanoguera, A.; Pérez-Cruz, L.; Pérez-Cruz, G. The chicxulub multi-ring impact crater, yucatan carbonate platform, Gulf of Mexico. Geofis. Int. 2011, 50, 99–127. [Google Scholar] [CrossRef]
  14. Gaona Vizcayno, S.; Gordillo de Anda, T.; Villasuso Pino, M. Cenotes, karst característico en mecanismos de formación. Rev. Mex. Cienc. Geológicas 1980, 4, 32–36. [Google Scholar]
  15. Young, M.B.; Gonneea, M.E.; Fong, D.A.; Moore, W.S.; Herrera-Silveira, J.; Paytan, A. Characterizing sources of groundwater to a tropical coastal lagoon in a karstic area using radium isotopes and water chemistry. Mar. Chem. 2008, 109, 377–394. [Google Scholar] [CrossRef]
  16. Stoessell, R.K.; Coke, J.G. An Explanation for the Lack of a Dilute Freshwater Lens in Unconfined Tropical Coastal Aquifers: Yucatan Example. Gulf Coast Assoc. Geol. Soc. Trans. 2006, 56, 785–792. [Google Scholar]
  17. Graniel-Castro, E.; Pacheco-Medina, A.; Coronado-Peraza, V. Origen de los sulfatos en el agua subterránea del sur de la sierrita de Ticul, Yucatán. Ingeniería 2009, 13, 49–58. [Google Scholar]
  18. Perry, E.C.; Velazquez-Oliman, G.; Leal-Bautista, R.M.; Dunning, N. The Icaiche Formation: Major contributor to the stratigraphy, hydrogeochemistry and geomorphology of the northern Yucatán peninsula, Mexico. Boletín Soc. Geológica Mex. 2019, 71, 741–760. [Google Scholar] [CrossRef]
  19. Velazquez, L. Aplicación de principios geoquímicos en la Hidrología Kárstica de la Península de Yucatán. Ing. Hidráulica México 1986, 1, 21–29. [Google Scholar]
  20. Arcega-Cabrera, F.; Velázquez-Tavera, N.; Fargher, L.; Derrien, M.; Noreña-Barroso, E. Fecal sterols, seasonal variability, and probable sources along the ring of cenotes, Yucatan, Mexico. J. Contam. Hydrol. 2014, 168, 41–49. [Google Scholar] [CrossRef]
  21. Pacheco Castro, R.; Pacheco Ávila, J.; Ye, M.; Cabrera Sansores, A. Groundwater Quality: Analysis of Its Temporal and Spatial Variability in a Karst Aquifer. Groundwater 2018, 56, 62–72. [Google Scholar] [CrossRef] [PubMed]
  22. Derrien, M.; Cabrera, F.A.; Tavera, N.L.V.; Kantún Manzano, C.A.; Vizcaino, S.C. Sources and distribution of organic matter along the Ring of Cenotes, Yucatan, Mexico: Sterol markers and statistical approaches. Sci. Total Environ. 2015, 511, 223–229. [Google Scholar] [CrossRef] [PubMed]
  23. Long, D.T.; Pearson, A.L.; Voice, T.C.; Polanco-Rodríguez, A.G.; Sanchez-Rodríguez, E.C.; Xagoraraki, I.; Concha-Valdez, F.G.; Puc-Franco, M.; Lopez-Cetz, R.; Rzotkiewicz, A.T. Influence of rainy season and land use on drinking water quality in a karst landscape, State of Yucatán, Mexico. Appl. Geochem. 2018, 98, 265–277. [Google Scholar] [CrossRef]
  24. Perry, E.; Velazquez-Oliman, G.; Marin, L. The Hydrogeochemistry of the Karst Aquifer System of the Northern Yucatan Peninsula, Mexico. Int. Geol. Rev. 2002, 44, 191–221. [Google Scholar] [CrossRef]
  25. Villasuso-Pino, M.; Sanchez y Pinto, I.; Canul-Macario, C.; Baldazo Escobedo, G.; Casares Salazar, R.; Souza Cetina, J.; Poot Euan, P.; Pech, C. Hydrogeology And Conceptual Model Of The Karstic Coastal Aquifer In Northern Yucatan State, Mexico. Trop. Subtrop. Agroecosyst. 2011, 13, 243–260. [Google Scholar]
  26. De la Barreda, B.; Metcalfe, S.E.; Boyd, D.S. Precipitation regionalization, anomalies and drought occurrence in the Yucatan Peninsula, Mexico. Int. J. Climatol. 2020, 40, 4541–4555. [Google Scholar] [CrossRef]
  27. Butterlin, J.; Bonet, F. Las Formaciones Cenozoicas de la parte Mexicana de la Península de Yucatán (The Cenozoic Formations of the Mexican part of the Yucatan Peninsula). Ing. Hidráulica México 1963, 17, 63–71. [Google Scholar]
  28. Perry, E.; Velazquez-Oliman, G.; Leal-Bautista, R.M.; Sánchez-Sánchez, J.; Wagner, N. Aspects of the Hydrogeology of southern Campeche and Quintana Roo, Mexico. Boletín Soc. Geológica Mex. 2021, 73. [Google Scholar] [CrossRef]
  29. SGM. Carta Geológico-Minera Calkiní: F15-9-12; Pachuca: Hidalgo, México, 2005. [Google Scholar]
  30. SGM. Carta Geológico-Minera Tizimín: F16-7; Pachuca: Hidalgo, México, 2006. [Google Scholar]
  31. SGM. Carta Geológico-Minera Mérida: F16-10; Pachuca: Hidalgo, México, 2006. [Google Scholar]
  32. APHA-AWWA. Standard Methods for the Examination of Water and Wastewater. In American Public Health Association/American Water Works Association/Water Environment Federation, Plant Performance, 21st ed.; APHA-AWWA-WEF, Ed.; APHA-AWWA-WEF: Washignton, DC, USA, 2005. [Google Scholar]
  33. Appelo, C.A.J.; Postma, D. (Eds.) Geochemistry, Groundwater and Pollution, 2nd ed.; CRC Press: Boca Raton, FL, USA, 2004; ISBN 9780429152320. [Google Scholar]
  34. Martinez, D.E.; Bocanegra, E.M.; Manzano, M. La modelacion hidrogeoquimica como herramienta en estudios hidrogeologicos. Bol. Geol. Min. 2000, 111, 83–97. [Google Scholar]
  35. Custodio, E.; Llamas, M. Hidrología Subterránea; OMEGA, Ed.; OMEGA: Barcelona, España, 1976; ISBN 8428204462. [Google Scholar]
  36. Parkhurst, D.L.; Appelo, C.A.J. PHREEQC (Version 3)-A Computer Program for Speciation, Batch-Reaction, One-Dimensional Transport, and Inverse Geochemical Calculations. Model. Tech. B 2013, 6. [Google Scholar] [CrossRef] [Green Version]
  37. Stoessell, R.K. Yucatan Water Chemistry Collected by Ronald Stoessell and Co-Workers. Available online: http://www.ronstoessell.org/PublicationsandData/Yucatan_Data.pdf (accessed on 25 February 2021).
  38. Canul-Macario, C.; González-Herrera, R.; Sánchez-Pinto, I.; Graniel-Castro, E. Contribution to the evaluation of solute transport properties in a karstic aquifer (Yucatan, Mexico). Hydrogeol. J. 2019, 27, 1683–1691. [Google Scholar] [CrossRef]
  39. Pytkowicz, R.; Kester, D. The Physical Chemistry of Seawater. In Oceanography Marine Biology: An Annual Review; Barnes, H., Ed.; George Allen y Unwin Ltd.: London, UK, 1971; pp. 11–60. [Google Scholar]
  40. Back, W.; Hanshaw, B.B. Comparison of aqueous geochemistry of the carbonate peninsulas of Florida and Yucatan. Geol. Soc. Am. 1963, 121, 15–16. [Google Scholar]
  41. USGS. Geological Survey Research 1970, Chapter A; USGS: Washington, DC, USA, 1970.
  42. Bischoff, J.L.; Juliá, R.; Shanks, W.C., III; Rosenbauer, R.J. Karstification without carbonic acid: Bedrock dissolution by gypsum-driven dedolomitization. Geology 1994, 22, 995–998. [Google Scholar] [CrossRef]
  43. Bąbel, M.; Schreiber, B.C. 9.17-Geochemistry of Evaporites and Evolution of Seawater. In Treatise on Geochemistry, 2nd ed.; Holland, H.D., Turekian, K.K., Eds.; Elsevier: Oxford, UK, 2014; pp. 483–560. ISBN 978-0-08-098300-4. [Google Scholar]
  44. Canul-Macario, C.; Salles, P.; Hernández-Espriu, J.A.; Pacheco-Castro, R. Empirical relationships of groundwater head–salinity response to variations of sea level and vertical recharge in coastal confined karst aquifers. Hydrogeol. J. 2020, 28, 1679–1694. [Google Scholar] [CrossRef]
  45. Valle-Levinson, A.; Mariño-Tapia, I.; Enriquez, C.; Waterhouse, A.F. Tidal variability of salinity and velocity fields related to intense point-source submarine groundwater discharges into the Coastal Ocean. Limnol. Oceanogr. 2011, 56, 1213–1224. [Google Scholar] [CrossRef]
  46. Batllori Sampedro, E.; González Piedra, J.I.; Díaz Sosa, J.; Febles Patrón, J.L. Caracterización hidrológica de la región costera noroccidental del estado de yucatán, MÉXICO. Investig. Geogr. 2006, 59, 74–92. [Google Scholar] [CrossRef]
  47. IPCC. IPCC Workshop on Sea Level Rise and Ice Sheet Instabilities; IPCC: Geneva, Switzerland, 2010; ISBN 978-92-9169-130-2. [Google Scholar]
  48. Church, J.A.; Clark, P.U.; Cazenave, A.; Gregory, J.; Jevrejava, S.; Lebermann, A.; Merrifield, M.; Milne, G.; Nerem, R.S.; Nunn, P.; et al. Sea Level Change. In Climate Change 2013: The Physical Science Basis. Contribution of Working Group I to the Fifth Assessment Report of the Intergovernmental Panel on Climate Change; Jouzel, J., van de Wal, R., Woodworth, P., Xiao, C., Eds.; Cambridge University Press: New York, NY, USA, 2013; p. 227. [Google Scholar]
  49. WHO-World Health Organization. Guidelines for Drinking-Water Quality; WHO: Geneva, Switzerland, 2017; ISBN 9241546964. [Google Scholar]
  50. DOF, Diario Oficial de la Federación NORMA Oficial Mexicana NOM-127-SSA1-1994, Salud ambiental, agua para uso y consumo humano-Límites permisibles de calidad y tratamientos a que debe someterse el agua para su potabilización. Última reforma publicada DOF 03-02-1995. 2000. Available online: http://www.agrolab.com.mx/sitev002/sitev001/assets/nom-127-ssa1-1994.pdf (accessed on 21 February 2021).
Figure 1. Study area of the Ring of Cenotes (RC). In the map, the surficial geology described by [29,30,31]. The 18 sinkholes of the study area split into three regions (R1, R2, R3) according to [10]. R is the recharge zone, MC—middle Celestun trajectory, C—Celestun, MD—middle Dzilam trajectory and D—Dzilam. RC’s regional groundwater flow was described by [8].
Water 13 00614 g001
Figure 2. Specific conductivity vs. depth in (a) sinkholes in R and MD zone (it can consult original data in reference [16,37]), (b) sinkhole 1 and one well in coastal zone Dzilam (2A, [38]). The numbers 1, 7 and 15 represent sinkholes in this study; data from sinkhole 1 were recorded in March 2007.
Water 13 00614 g002
Figure 3. Ternary diagram of calcium, chloride and sulfate (Ca+2, Cl, SO4−2) and their gain trajectories in the RC. (a) SP1 May–June 2006, (b) SP2 October–November 2006, (c) SP3 February–March 2007, and (d) SP4 April–May 2008.
Water 13 00614 g003
Figure 4. Saturation indexes for (a) Calcite, (b) Dolomite, and (c) Gypsum. (d) Percentage of seawater mixed with the groundwater. The dotted lines show the balance interval for calcite and dolomite. The mineral values under the lower limit are not shown. Labels: Recharge zone (R), middle Celestun (MC), the coast of Celestun (C), middle Dzilam Bravo (MD), the coast of Dzilam Bravo (D).
Water 13 00614 g004
Figure 5. Hydrogeochemical evolution based on the ratio rSO4−2/rCl−1 suggested by [19,24]. (a) SP1 May–June 2006, (b) SP2 October–November 2006, (c) SP3 February–March 2007, and (d) SP4 April–May 2008.
Water 13 00614 g005
Figure 6. Dissolution/precipitation rates of Calcite (a), Dolomite (b), and Gypsum (c) in the RC. Positive values indicate dissolution and negative values indicate mineral precipitation.
Water 13 00614 g006
Figure 7. Average rainfall during the two months of each sampling survey (SP1, SP2, SP3, and SP4) for Celestun (C), the Recharge zone (R) and Dzilam Bravo (D).
Water 13 00614 g007
Figure 8. Relation of seawater percentage mixing and saturation index of gypsum (SIg) with the rainfall (average the accumulated precipitation measured during each sampling period) for the Celestun trajectory, and the Dzilam Bravo trajectory.
Water 13 00614 g008
Figure 9. Relation of the potential precipitation/dissolution rates for calcite, dolomite, and gypsum with average the accumulated precipitation measured during each sampling period (two months) for: (a) the Celestun trajectory (R-MC-C) and, (b) the Dzilam Bravo trajectory (R-MD-D).
Water 13 00614 g009
Table 1. Average concentrations for the representative samples. NO3 was excluded from the inverse modelling. Regions in this table were defined as the description in Figure 1.
SPRegionT
(°C)
pHEC
(µS cm−1)
O2
(mg L−1)
Ca+2
(mg L−1)
Mg+2
(mg L−1)
Na+
(mg L−1)
K+
(mg L−1)
HCO3 (mg L−1)Cl
(mg L−1)
SO4−2 (mg L−1)NO3
(mg L−1)
1C26.96.7926967.93155.877.7283.79.9411.5589.6230.43.6
MC27.46.6317903.38140.964.6141.15.4403.2294.1252.06.2
R25.96.7110302.4298.946.355.04.1417.5128.923.710.4
MD26.76.5712780.65105.286.388.53.1570.9202.827.00.6
D26.46.6113500.71112.444.1113.75.1417.2244.334.00.8
2C27.17.8927641.03131.387.5264.09.5423.5539.7312.010.2
MC27.46.3618123.36120.874.1137.75.1432.0274.2242.85.5
R26.16.8510583.0788.346.953.84.0432.6119.318.213.0
MD26.86.5713700.1598.252.185.53.2488.8187.424.610.5
D26.78.2415310.21100.452.9121.85.3453.7255.727.74.4
3C26.77.1126142.88138.074.4396.210.8412.7539.9266.46.7
MC27.27.0615644.98115.558.6102.14.6422.6218.0137.212.7
R25.67.0810564.4188.648.249.934.9428.1123.622.611.3
MD26.37.5013265.9891.851.567.83.2464.9151.926.011.6
D25.87.0916300.9697.256.3106.77.0417.9238.554.66.6
4C27.16.8927362.6203.286.1295.010.1443.5550.4284.813.7
MC27.46.9917943.2165.874.9143.55.4405.8282.9191.217.7
R26.36.9810833.4119.866.661.72.5435.3166.325.413.9
MD26.86.8213231.4139.973.590.13.5420.3189.5143.39.6
D26.27.6816370.4137.371.6145.46.7400.2287.7161.89.2
Publisher’s Note: MDPI stays neutral with regard to jurisdictional claims in published maps and institutional affiliations.

