
Water Ecosystem Service Quality Evaluation and Value Assessment of Taihu Lake in China


College of Economics and Management, Nanjing Forestry University, Nanjing 210037, China
*
Author to whom correspondence should be addressed.
Water 2021, 13(5), 618; https://doi.org/10.3390/w13050618
Submission received: 19 January 2021
/
Revised: 19 February 2021
/
Accepted: 23 February 2021
/
Published: 27 February 2021
Abstract
:Taihu Lake is the third largest freshwater lake in China. Water ecosystems play an important role in the survival and development of human society. The evaluation of water ecosystem services is helpful to understand and grasp the changing rules of Taihu Lake’s ecosystem services value in recent years. First, we used the Water Environment Qualities Index (WQI) to evaluate the water ecological quality of Taihu Lake; second, on the basis of the survey data from 2010 to 2018, we combined economic and ecological methods to evaluate the water ecosystem of Taihu Lake. The evaluation system includes four major service functions, 11 second-class evaluation indicators and 19 index factor. Research indicates that, (1) in the past 8 years, the WQI of Taihu Lake increased year by year and Taihu Lake changed from moderate pollution to light pollution; (2) provisioning services are the main service of Taihu Lake’s water ecosystem and the order of various service values was provisioning service value > regulation service value > cultural service value > support service value, with water supply as the core function of provisioning services; and (3) the total values in 2010, 2014, and 2018 were 115.39 billion yuan, 113.31 billion yuan, and 119.96 billion yuan, respectively, showing a trend of first decreasing and then increasing. To a certain extent, the improvement in Taihu Lake’s water ecological quality has led to an increase in the value of regulation services.
1. Introduction
Survival and development of human society are inseparable from the services provided by ecosystems. Ecosystems provide products and services for humans directly or indirectly. Therefore, the value of ecosystem services (ES) is part of the total value of the global economy [1]. Quantitative evaluation of the value of ecosystem services is a research hotspot in the fields of ecology and ecological economics and is an important basis for the sustainable use and management of ecosystem resources [2]. In 1997, Costanza [1] summarized the ecosystem service functions into 17 categories based on an evaluation of ecosystem value in the past few decades and calculated the service value of all biomes, providing a reference for the evaluation of ecosystem service values. The Millennium Ecosystem Assessment came up with four ecosystem service categories based on functions: provisioning services, regulation services, support services, and cultural services [3]. From the perspective of monetary value classification, ecosystems can be divided into direct use value and indirect use value [4]. Direct use value means the value of providing product production functions, and indirect use value refers to the value of providing life support system functions. Tomscha et al. [5] reviewed the utility, advantages, and challenges of some unconventional historical data sets that may be tracked by ES for a long time and linked each type of data to a simple ES framework to distinguish ES capacity, ES flow, and ES demand. Water ecological quality assessment refers to the monitoring and evaluation of different indicators in a water ecosystem to reflect the overall situation of the water ecosystem. Early assessments of water ecological quality mostly focused on the study of chemical indicators of water quality and could not accurately reflect the quality of the water environment. Therefore, it is very important to establish a comprehensive evaluation system that includes chemical indicators of water quality and aquatic biological indicators [6]. According to the water framework directive, the indicators above are already included in water quality management. Lake ecosystems play an important role in supply, regulation, support, and culture and has great economic value [7]. The functional classification method is used in this paper to evaluate the service value of Taihu Lake’s water ecosystem and the quantified ecosystem services belong to ES capacity.
At present, scholars have carried out a lot of research on ecosystem service value evaluation, and the research mainly focuses on two aspects: One is the establishment and quantitative evaluation of an ecosystem service evaluation accounting system. The second is an analysis of spatial differences at multiple time and space scales, especially the impact of different land use conditions or different socioeconomic indicators on the value of ecosystem services. In terms of the ecosystem service value evaluation framework system, Krutilla and Fisher [8] divided the ecosystem service value into tangible and intangible parts, namely market value and non-market value, according to whether the ecosystem service can be traded in the market. Bolan and Freeman [9] divided ecosystem services into use value and non-use value. Use value includes direct use value, indirect use value, and option value; non-use value includes existence value and bequest value. These value evaluation frameworks are centered on human well-being and are recognized by the economics community. In addition, there are ecological-centric value evaluation frameworks that emphasize the intrinsic value of ecosystem services without considering human needs and welfare. Halkos and Matsiori [10] believe that the above two valuation frameworks are complementary. However, due to the limitations of economics in evaluating the value of ecosystem services, different methods are used to evaluate the same object and the results often lack comparability. Lange et al. [11] evaluated the value of ecosystem services through traditional economic and monetary value methods. Mander [12] believed that traditional methods such as economy and currency can only quantify the value of part of the ecology that can be monetized while ignoring some non-monetary values. In addition, scholars’ research mostly focus on evaluation of the value of ecosystem services such as forests [13,14,15,16], grasslands [17,18,19], and wetlands [20,21,22], while comprehensive evaluation and calculation of the value of lake ecosystem services are relatively rare. However, value assessments of Hangzhou West Lake [23] and Wuhan East Lake [24] as well as global meta-analysis of the value of ecosystem services provided by lakes [25] were assessed. In quantitative studies of the value of ecosystem services, many methods such as conditioned value method [26], equivalent factor method [27], and opportunity cost [28] method have been proposed by scholars. Evaluation of the service value of a lake ecosystem is helpful to find out the value of a lake’s contributions to humans. It can provide theoretical support for improving the lake water ecological environment and creating ecological compensation policies in the future and is of great significance to the protection of ecosystem and sustainable development [29]. With rapid economic development, the water environment continues to deteriorate. Therefore, scholars have conducted much research on the characteristics and influencing factors of water ecological quality changes [30,31]. When evaluating water ecological quality, the commonly used methods mainly include the single factor evaluation [32] method, comprehensive index [33] method, and grey clustering method [34]. Among them, the comprehensive index method is the most widely used [35].
Taihu Lake is the third largest freshwater lake in China, located in the center of the Taihu Lake Basin. It not only is responsible for the urban water supply tasks of Suzhou and Wuxi but also improves the water quality of the water sources in the upper reaches of the Huangpu River. The lake has made great contributions to the social and economic development of the Yangtze River Delta. Extensive industrialization has worsened the ecological environment in the basin, severely damaged the water environment in the basin, and has a high degree of eutrophication. In 2007, the outbreak of cyanobacteria in Taihu Lake caused the drinking water crisis in Wuxi City. Scholars have conducted a series of studies on the characteristics of biophysical quantity changes [36,37], ecological benefits of water environment management [38,39,40], and factors affecting water environment changes [41,42,43] in Taihu Lake. However, there is still a lack of research on the evaluation of the service value of the Taihu Lake water ecosystem, and few studies combine the water ecological quality of Taihu Lake with ecosystem service value. This research first evaluates the water ecological quality of Taihu Lake, then evaluates the value of Taihu’s ecosystem services, and finally draws a link between changes in water ecological quality and the value of ecosystem services. By discovering the relationship between water ecological quality and ecosystem service value, it provides a theoretical basis for creating a comprehensive treatment plan for Taihu Lake.
Study Area and Data Sources
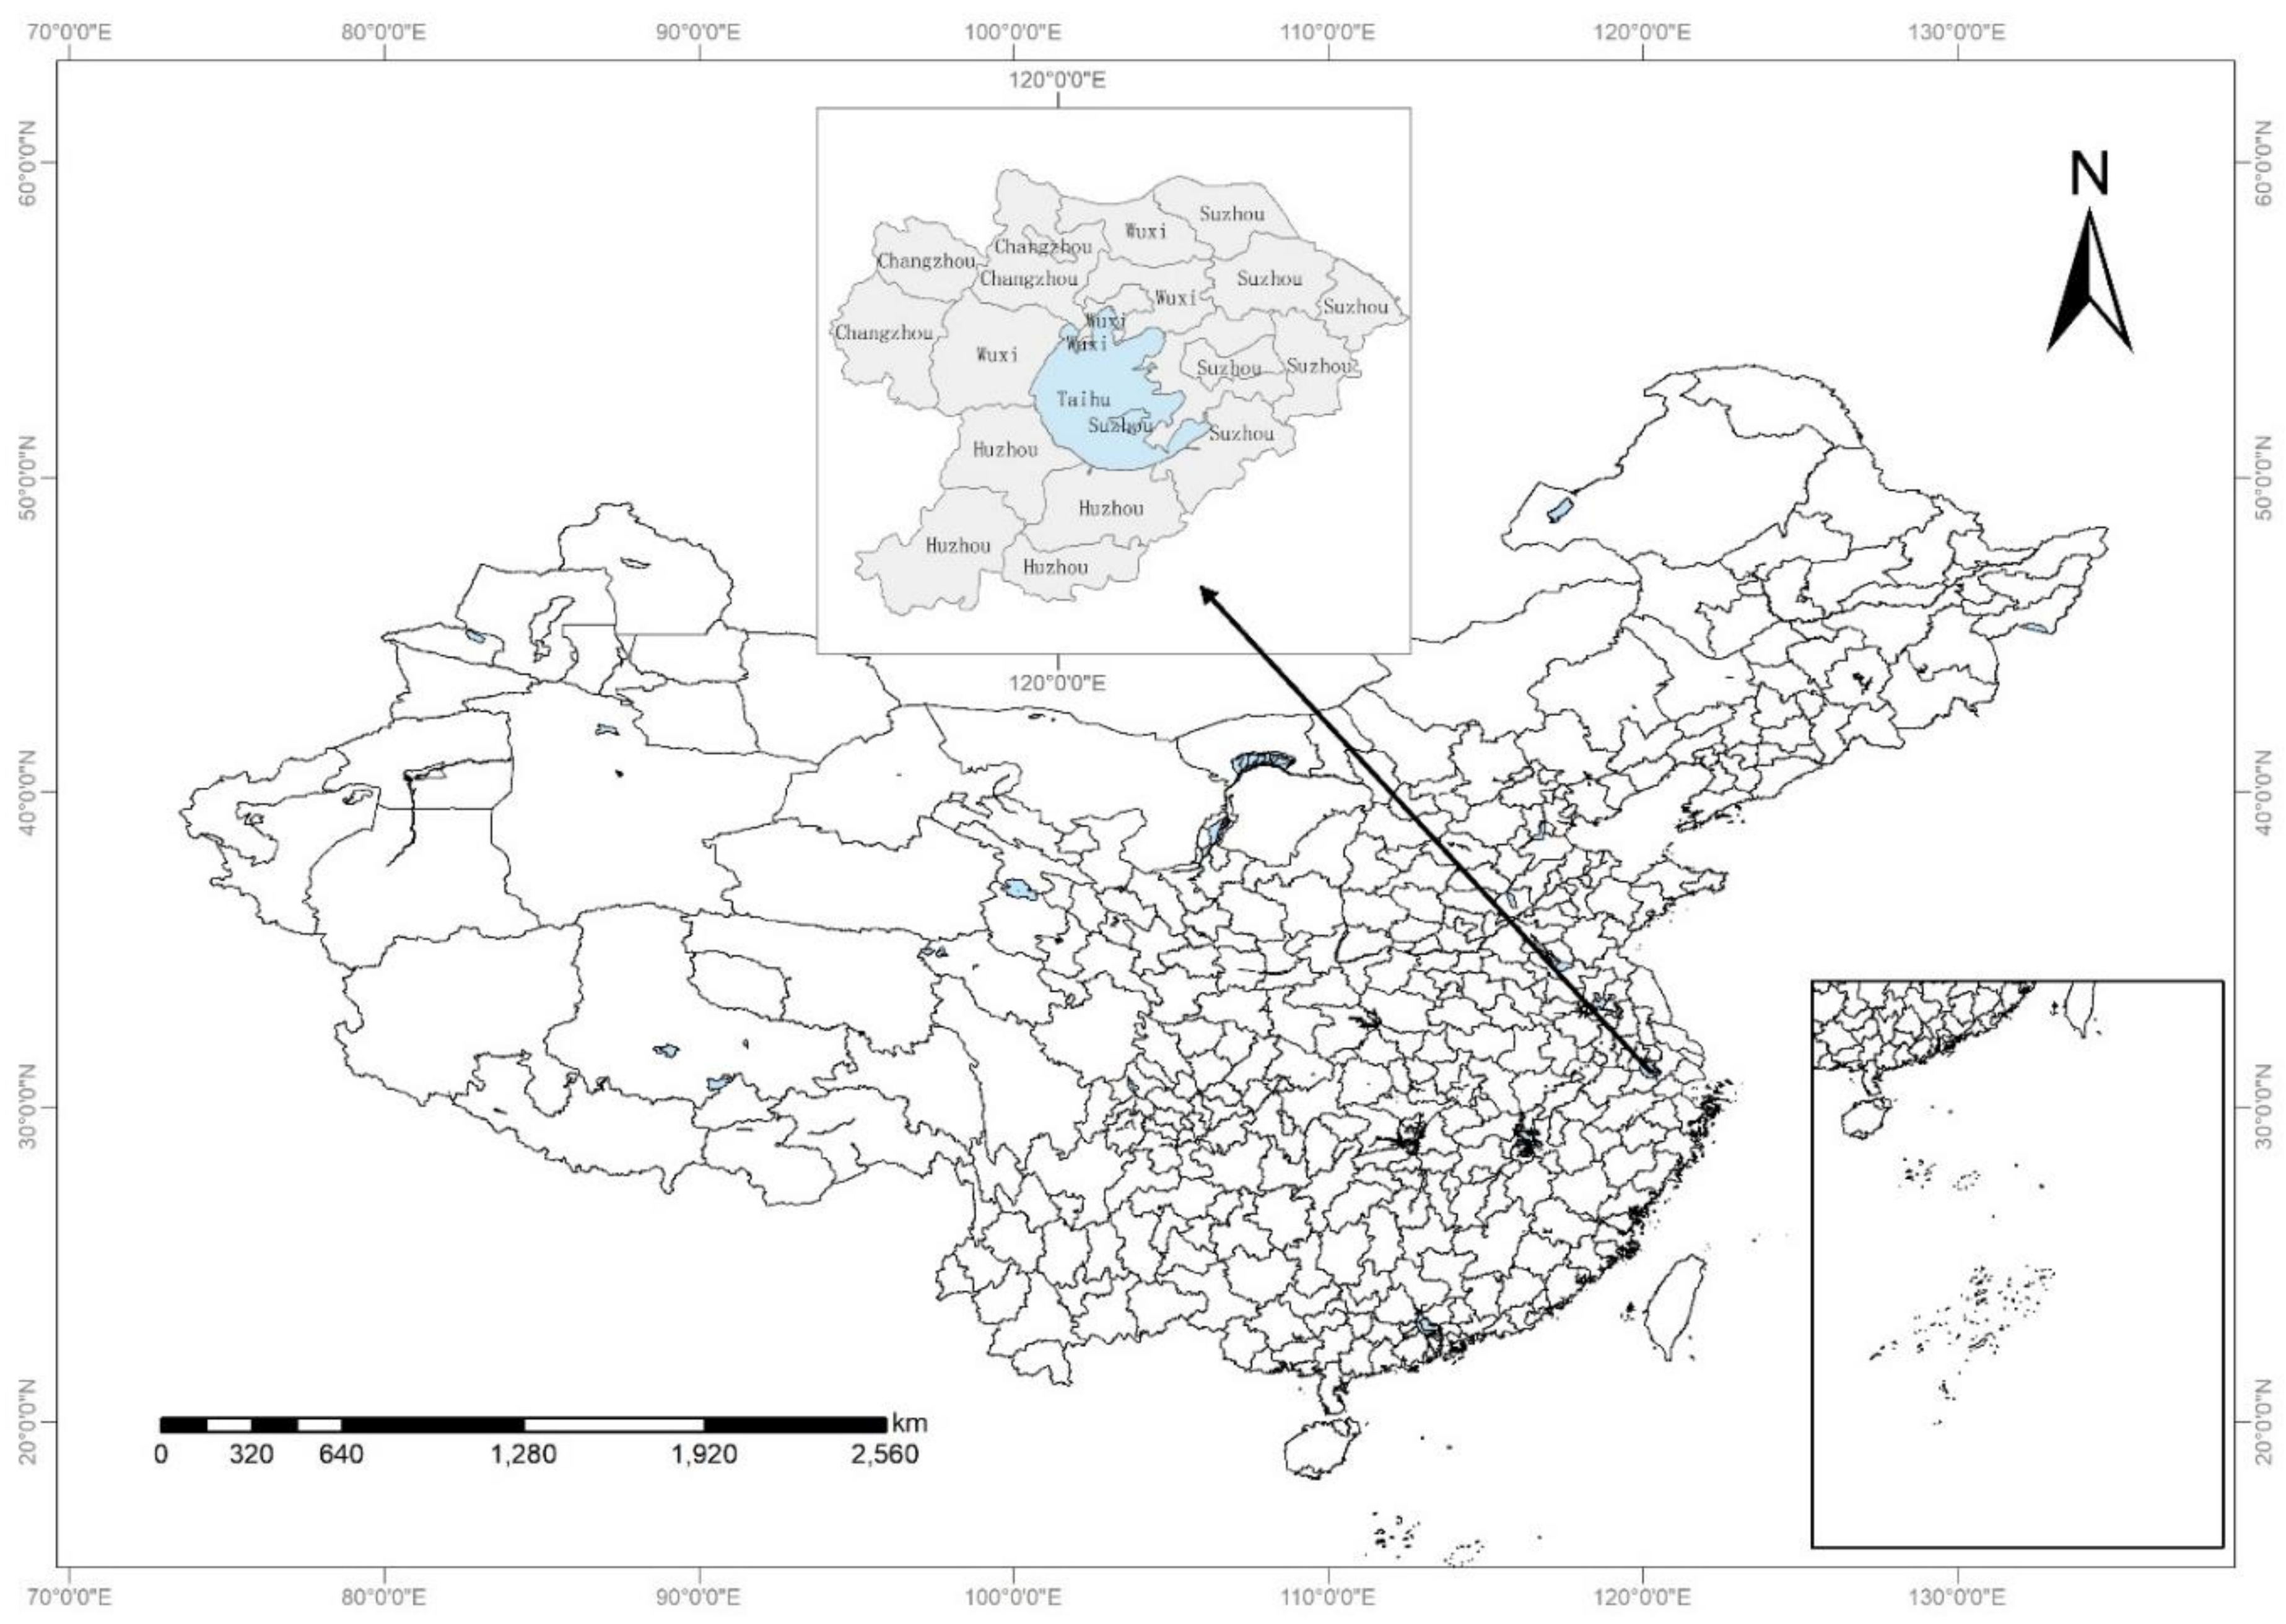
Taihu Lake is one of the five largest freshwater lakes in China, straddling Jiangsu and Zhejiang provinces (Figure 1). The lake area is 3192 km2, the water area is 2338.1 km2, and the island area is 89 km2. The shoreline of the lake is 393.2 km long, and there are 228 rivers flowing into and out of Taihu Lake [44]. The lakes in the basin are densely covered, and the river network extends in all directions. It is one of the most economically developed areas in China. The aquaculture and ecotourism service functions provided by Taihu Lake play an important role in socioeconomic development of the eastern region. In recent years, a series of comprehensive improvement projects have been carried out in the Taihu Lake Basin, and the water quality of Taihu Lake has been greatly improved.
2. Methods
2.1. Evaluation Method of Water Ecological Quality
2.1.1. Evaluation Indexes () of Water Ecological Quality
The chemical indicators of water quality and aquatic biological indicators were selected as the two main indicators for comprehensive evaluation of the water ecological quality of Taihu Lake. The chemical indicators of water quality are based on the main pollutants of Taihu Lake: the hypermanganate index, ammonia nitrogen (NH3–N), total nitrogen (TN), and total phosphorus (TP). The assignment of each parameter took the “Surface Water Environmental Quality Standard” (GB3838-2002) as reference, and the assignment criteria are shown in Table 1. If the four parameter values were inconsistent, the one with the smallest score was used as the value of the chemical indicators of water quality. For example, when the assignments of the four parameters were 4, 3, 2, and 1, respectively, 1 was regarded as the value of the water quality chemical indicators.
The Shannon–Wiener Diversity Indexes of phytoplankton, zooplankton, and benthic fauna were used as the evaluation parameter of aquatic biological indicators, expressed as , and , respectively. According to the evaluation and assignment criteria in Table 2, the minimum of the three parameters is accepted as the aquatic biological indicators’ value.
2.1.2. Water Ecological Quality Index (WQI)
The water quality chemical indicators and aquatic biological indicators were weighted and summed to obtain the comprehensive water ecological quality index (WQI). The calculation equation is [33]
where represents the evaluation indexes’ score and represents the weight of the evaluation index, which is determined based on empirical judgment and expert scores [33]. The water quality chemical indicators and aquatic biological indicators have the same weight, so both are taken as 0.5. The WQI is divided into 5 levels from large to small, as shown in Table 3, which indicates that the water ecological quality of Taihu Lake in different situations would be assigned to good, common, lightly polluted, moderately polluted, and heavily polluted level, respectively.
2.2. Water Ecosystem Service Value Evaluation Index System
In this paper, the service functions of the Taihu Lake water ecosystem were divided into four categories: provisioning services, regulation services, support services, and cultural services. Taking the availability of data into account, 10 services and 18 indicators were selected (Table 4). The provisioning service functions include water supply, the provision of aquatic products, and shipping functions. In detail, the value of water supply is quantified by the total market value of industrial, agricultural, and domestic water. Considering that the population size of fish is large and difficult to quantify, the total fishery output value was used to quantify the value of aquatic products. Cargo turnover and passenger turnover value were used to quantify the shipping value in Taihu Lake. The regulation service function was embodied in the regulation of the atmospheric CO2/O2 production, water quality purification, and surface water regulation and storage. The value of regulating atmospheric CO2/O2 production was quantified by the value of carbon fixation and oxygen release. In general, the value of carbon fixation adopts the afforestation cost method, and the value of oxygen release is replaced by the industrial oxygen production cost. The water purification value was calculated by the reduction in the concentration of the main pollutants (hypermanganate index, NH3–N, TN, and TP) entering and exiting the lake. The support services include soil conservation and maintenance of biodiversity. The cultural service function is intuitively reflected in the provision of tourism and leisure, and scientific research and education services. The price substitution method was used to quantify the tourism and leisure value. Calculation of the value of scientific research and education refers to the research results of Xie Gaodi [45] and Costanza [1]. A systematic evaluation index system was proposed, as described in Table 4.
2.3. Service Value Evaluation Methods (Table S1 for Easy Understanding)
2.3.1. Provisioning Services
- (1)
- Water supply
Water supply is a direct service function provided by the water ecosystem. Sufficient water supply is important to meet the basic needs of residents’ daily life and to ensure the production needs of various production departments. In the Taihu Lake region, water quality is not used as the quantitative indicator of the service value of water supply. It is practical to quantify the value of water supply from the perspective of water quantity. The market value method is taken to evaluate the value of water supply from Taihu Lake. The calculation equation is as follows:
where depicts the total value of water supply, depicts the amount of water used for the application (tons), and depicts the water supply price for the use. The values of are 1, 2, and 3, which represent industrial water, agricultural water, and residential water, respectively.
- (2)
- Provide aquatic products
Taihu Lake provides a wealth of aquatic products for mankind, mainly including plum, grass carp, whitebait, and other fishes. Although it is feasible to quantify aquatic product services based on fish populations, it is difficult to accurately quantify the numerous fish species in Taihu Lake. Considering the availability of data, we use the fishery output value per unit area to calculate the value of aquatic products provided by Taihu Lake [54]. The data of the fishery output value comes from the official announcements and are reliable. Suzhou, Wuxi, Changzhou, and Huzhou are the main cities around Taihu Lake. Therefore, the fishery output values of the 4 cities in 2010, 2014, and 2018 were calculated in this paper and then divided by the administrative division area to obtain the fishery output value per unit area. The equation for calculating the value of aquatic products provided by Taihu Lake is as follows:
where represents the value of aquatic products provided by Taihu Lake (100 million yuan), represents the water area of Taihu Lake, = 2338.1 km2, and represents the fishery output value per unit area (100 million yuan per km2).
where and represent the total fishery output value (100 million yuan) and administrative division area (km2) of each city, respectively. The values of are 1, 2, 3, or 4, representing Suzhou, Wuxi, Changzhou, and Huzhou, respectively.
- (3)
- Shipping
Taihu Lake provides shipping services thanks to its dense water network, abundant water volume, and open waters. The shipping value of Taihu Lake is mainly reflected in the cargo transportation and passenger turnover through waterways. The market value method is used to calculate the shipping value, and the calculation equation is as follows:
where represents shipping value; and , respectively, represent cargo turnover (ton-kilometer) and passenger turnover (person-kilometer); and and , respectively, represent cargo turnover price (yuan/ton-kilometer) and passenger turnover price (yuan/person-kilometer).
2.3.2. Regulation Service
- (1)
- Regulate the atmospheric CO2/O2 production
The value of regulating the atmosphere lies in the amount of carbon dioxide absorbed and oxygen released. Phytoplankton in the water absorb CO2 in the atmosphere and release O2 through photosynthesis, thereby regulating the atmosphere. Commonly, the carbon tax method, the afforestation cost method, and the artificial fixed carbon dioxide cost method are used to calculate the value of carbon sequestration. The carbon tax method refers to a tax system that reduces greenhouse gas emissions by levying taxes. The afforestation cost method means replacing the carbon sequestration value of water resources with afforestation costs that absorb the same amount of CO2. The afforestation cost method was used to evaluate the carbon sequestration value of Taihu Lake’s water resources. The equation as follows [55]:
where represents the value of carbon sequestration, represents the afforestation cost of an absorbed unit of CO2 (yuan/ton), and represents the annual fixed amount of CO2 (ton) of the water ecosystem.
Based on the measured data of primary productivity in Meiliang Bay of Taihu Lake, an empirical equation between the primary productivity of phytoplankton and the concentration of surface chlorophyll-a was established [56] as follows:
where represents the primary productivity of phytoplankton (mg C/m2 d) and represents the concentration of surface chlorophyll a (mg/m3).
Plants in the water will release O2 while absorbing CO2. The alternative engineering method is adopted to calculate the value of oxygen release. The equation as follows [55]:
where represents the value of oxygen release, represents the unit cost of industrial oxygen production (yuan/ton), and represents the amount of O2 released by the water ecosystem (ton) each year.
The photosynthesis equation is as follows:
From Equation (9), plants will release about 2.67 g O2 for every 1 g C absorbed. In other words, the amount of carbon dioxide absorbed is converted into data on oxygen released by the photosynthesis equation.
- (2)
- Water purification
Rivers and lakes have a certain self-purification ability, and this ability is reflected in reducing pollutants. The value of water purification can be calculated by substitute engineering methods, and the cost of the corresponding pollutants treated by the sewage treatment plant is used to replace the reduction value of the lake to the pollutants. The equation is as follows [4]:
where represents the total value of water purification, represents the reduction amount of the pollutant entering and leaving the lake (tons), and represents the cost of treating the pollutant by the sewage treatment plant (yuan/ton). The values of are 1, 2, 3, or 4, which represent the hypermanganate index, NH3–N, TP, and TN, respectively.
In this part, the water purification service itself is related to water quality, so we provide more information about water quality than other services, and it is difficult to calculate the value of other services based on water quality.
- (3)
- Surface water storage
The lake ecosystem provides services for humans through the water cycle. Rainwater is collected and stored by the lake during the rainy season. This not only avoids flood disasters in the flood season but also ensures sufficient and stable water resources provided during the dry season. The regulation of water volume plays an important role in meeting the needs of the ecological environment and rational use of water resources. The shadow price [57] method is chosen to calculate the storage value of surface water resources. The equation is as follows:
where is the storage value of surface water resources; is the capacity of surface water storage (m3); and is the unit storage value, which took the price of domestic water supply in Wuxi City.
2.3.3. Support Service
- (1)
- Protect biodiversity
The value of protecting biodiversity refers to the value of species diversity and genetic diversity provided by the ecosystem. The water ecosystem provides a habitat for a variety of aquatic animals and plants. The equivalent value model [45] of biodiversity was used in this paper to calculate the value of the Taihu Lake water ecosystem to protect biodiversity. The calculation equation is as follows:
where represents the value of maintaining biodiversity; represents the ecological service value of 1 standard equivalent factor, that is, the unit area value of the water ecosystem to protect biodiversity services; represents the equivalent value of maintaining biodiversity service function in per unit area of water ecosystem, = 2.49 [45]; and represents the water area of Taihu Lake.
The economic value of grain output per unit area of farmland ecosystem under natural conditions was used to measure the value of ecological services with a standard equivalent. However, in practical applications, especially on a regional scale, it is difficult to completely eliminate the interference of human factors to accurately measure the economic value of farmland ecosystems. Therefore, this article takes the net profit of food production per unit area as the value of ecosystem services with a standard equivalent factor. The three main crops in the Taihu Lake area are rice, wheat, and rape. In this study, the weighted average of their net profits was used as the ecological service value of a standard equivalent factor. The calculation equation is as follows:
where represents the percentage (%) of the cultivated area of the crop in the total cultivated area of the crops; represents the average net profit per unit area of the crop in the country (yuan/mu); and the values of are 1, 2, or 3, representing rice, wheat, and rapeseed, respectively.
- (2)
- Soil conservation
Over the years, due to the flow of sediment, a large amount of soil has been deposited at the bottom of Taihu Lake. The dredging project (one of the ecological projects in Taihu Lake) salvages the soil deposited on the bottom of the lake and reuses it for planting crops, etc. Therefore, we believe that the sedimented surface mud and bottom mud are the values of Taihu Lake in terms of soil conservation. The equivalent factor method was used for estimation. The calculation equation for the soil conservation value is as follows [45]:
where represents the soil conservation value (yuan/year); represents the percentage of cultivated area of the mth crop (%); represents the average net profit per unit area of the mth crop in the country (yuan/mu); = 1, 2, and 3, respectively, representing rice, wheat, and rape; and represents the soil conservation service value equivalent per unit area of the water ecosystem. According to ecosystem service value equivalent in 2015 [45], the soil conservation service value equivalent of the water system is 0.93. represents the water area of Taihu Lake.
2.3.4. Cultural Service
- (1)
- Tourism and leisure
Lake tourism is of great value. In addition to providing ecological environmental landscapes such as waters and islands, it can also make visitors feel comfortable and can benefit physical and mental health. However, the value of making humans feel happy and of physical and mental health is greatly affected by subjective factors and is difficult to measure, so it is not considered. This article only quantifies the tourism and leisure value of Taihu Lake from the objective perspective of operating profit, calculated by the price substitution method. The difference between operating income and expenditure (i.e., operating profit) was used to quantify the value of tourism and leisure in Taihu Lake. The data come from the statistical data of national scenic spots in the 2010–2018 [58].
- (2)
- Research and education
We took the research results of others as a reference to calculate the value generated by scientific research and education based on Taihu Lake. The calculation equation is as follows [59]:
where represents the value generated by scientific research and education and represents the average value generated by scientific research and education per unit area of wetland. Wetlands are formed by swamping on lake shores or shallow lakes. According to the Ramsar International Convention, Ramsar, Iran, lake wetlands also include the lake water itself. Therefore, we believe that the value of scientific research and education of wetlands can be substituted for the value of scientific research and education of lakes. Here, is based on research results of References [1,33]. The specific calculation steps are as follows: First, the research result of Reference [1] is converted into CNY at the average exchange rate published by the Bank of China. Then, the average value of the research results of the two references is taken as .
In addition, we would like to point out that the data sources of all the above parameters will be listed in detail in the result section when calculating the results. Through the above methods, all services are converted into monetary value, so that the later analysis and comparison are based on a comparison of monetary value, which eliminates the inconvenience caused by different units and scales. For the comparison of data between years, the absolute value of the ecosystem service value in each year will be used.
2.4. Link Water Quality and Ecosystem Service Value
Pearson Correlation Coefficient
Pearson correlation coefficient [60] is used to examine the correlation between WQI and other ecosystem services. The strength of the correlation depends on the absolute value of the correlation coefficient r. Normally, in statistics, when 0.8 < ≤ 1.0 indicates a strong correlation, 0.6 < ≤ 0.8 indicates a strong correlation, 0.4 < ≤ 0.6 means moderate correlation, 0.2 < ≤ 0.4 means weak correlation, and 0.0 < ≤ 0.2 means very weak correlation or no correlation [61]. r > 0 means a positive correlation, and r < 0 means a negative correlation. SPSS software was used for the Pearson correlation analysis.
3. Results
3.1. Evaluation Results of Taihu Lake Water Ecological Quality
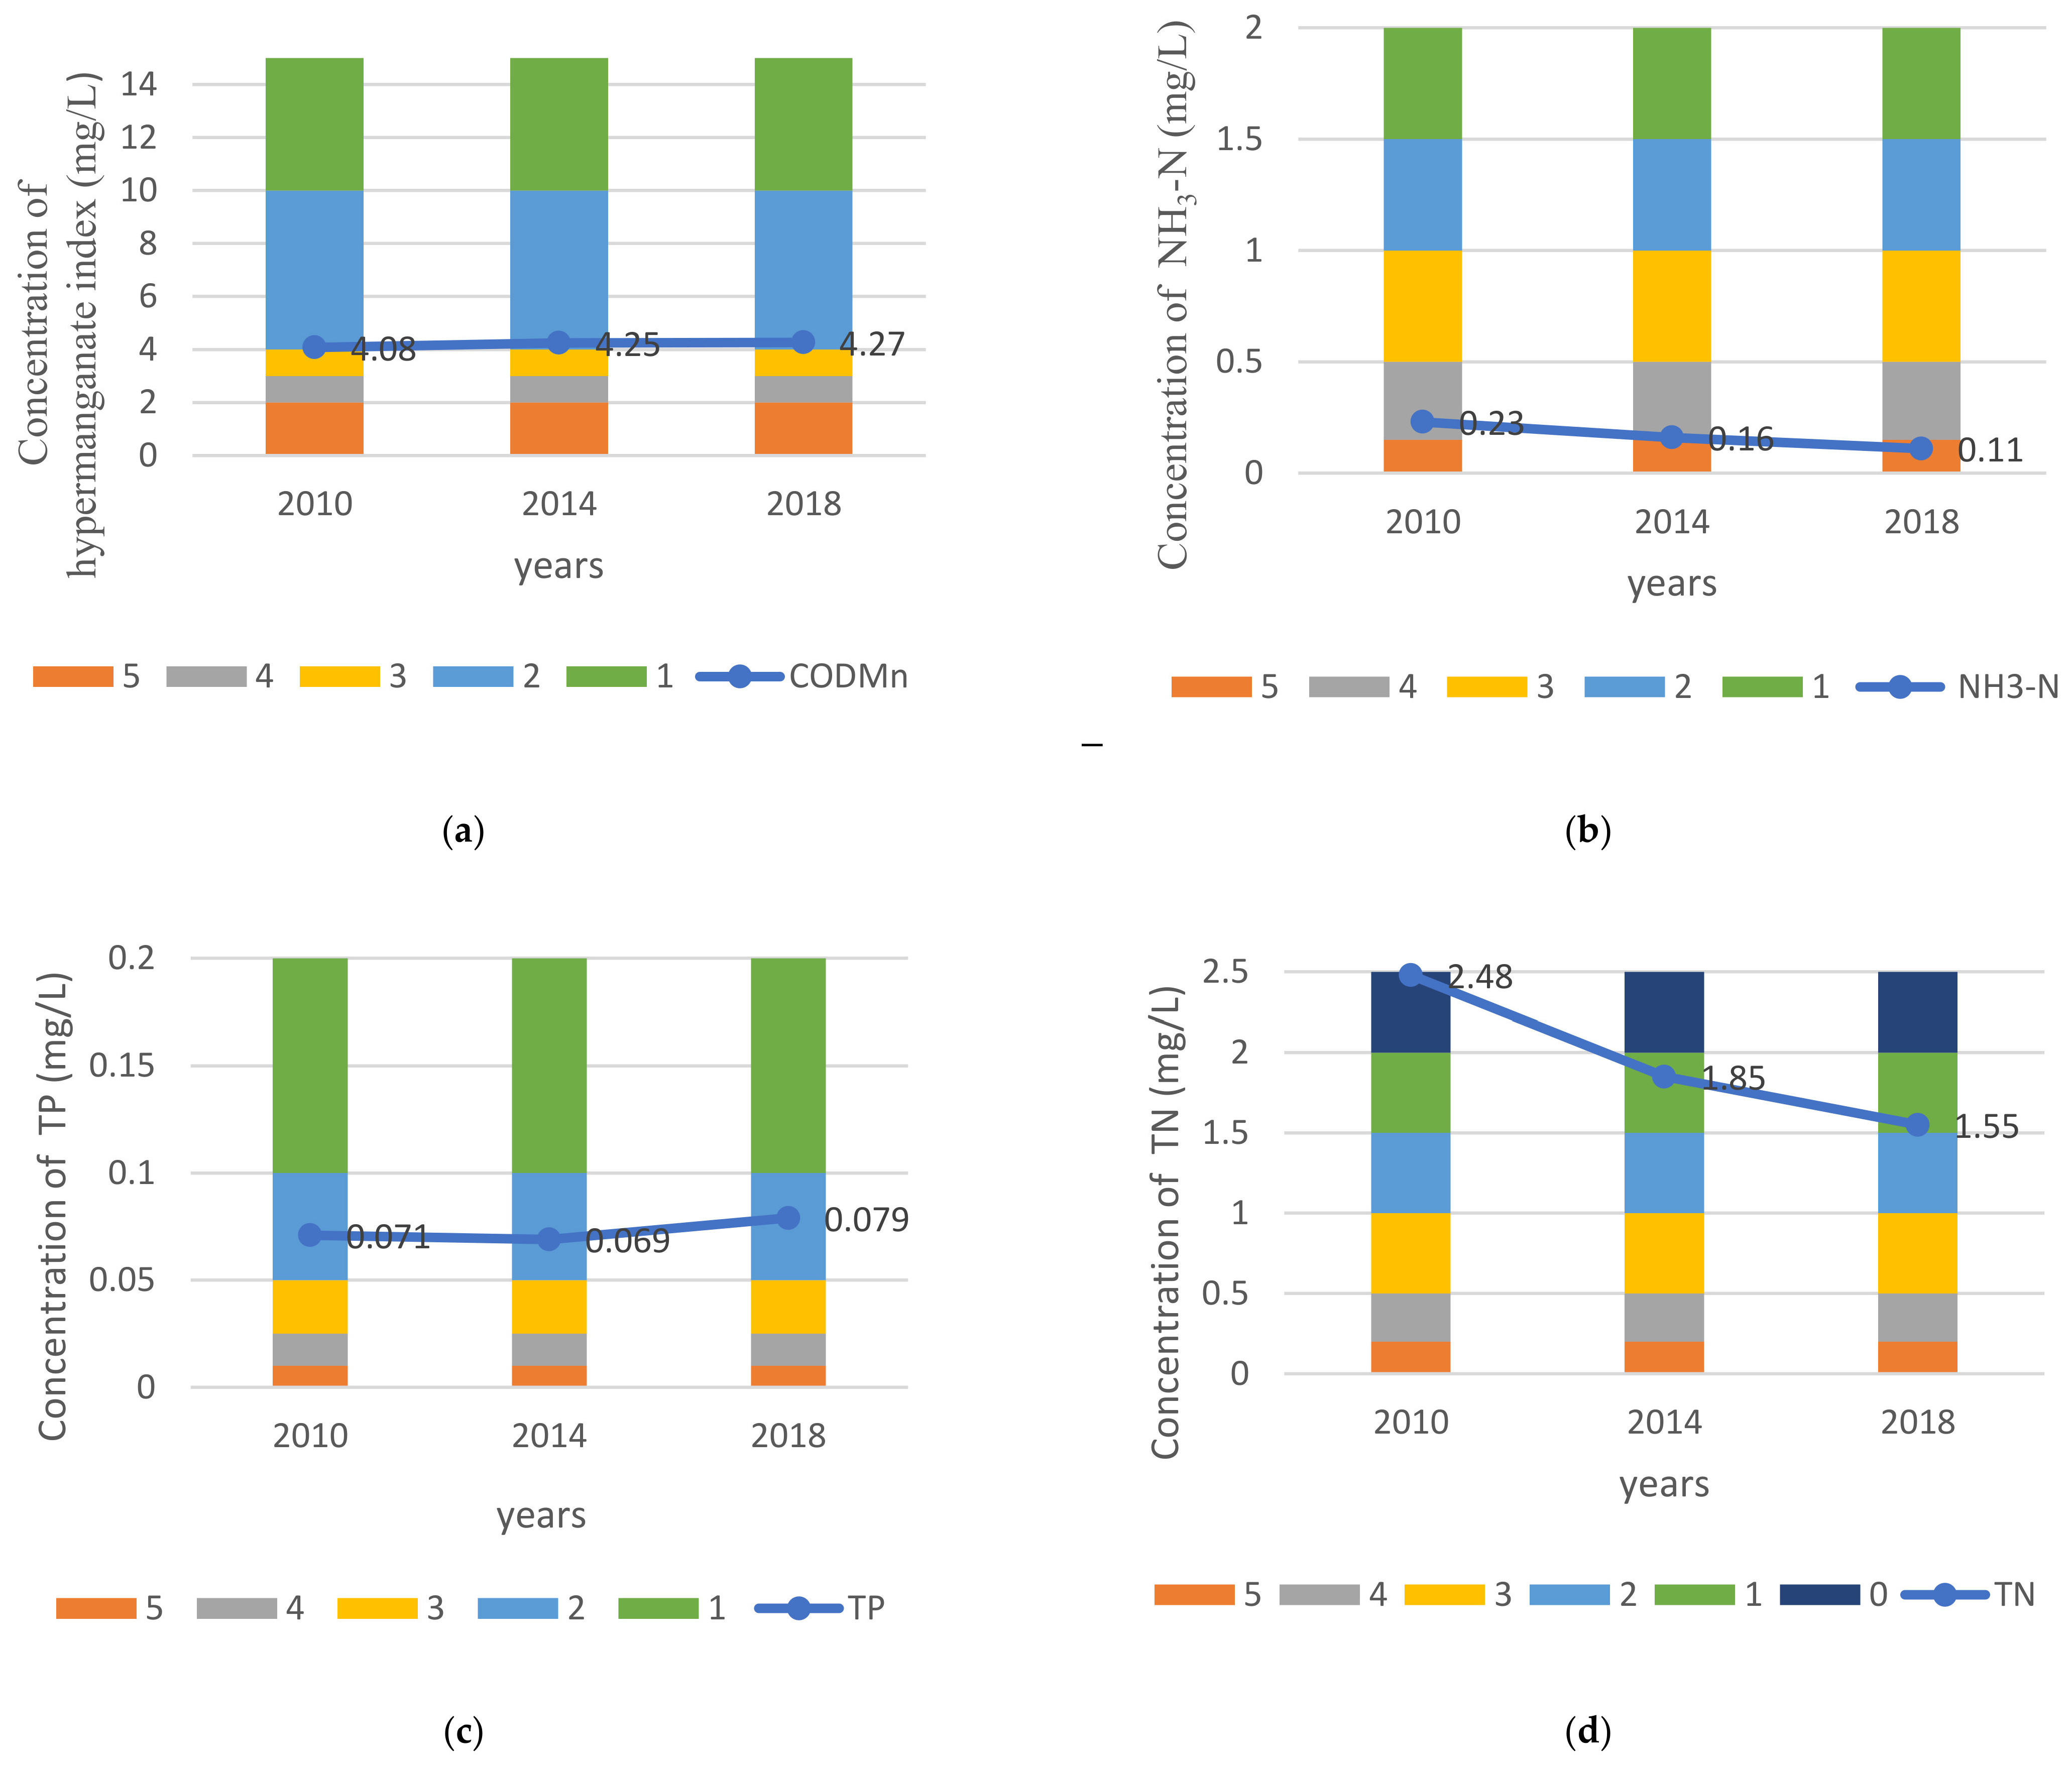
The main pollutants in Taihu Lake are the hypermanganate index, NH3–N, TP, and TN. The values of the four main pollutants from 2010 to 2018 were assigned according to Table 1, and the changes in the assignment results are shown in Figure 2. The results of the hypermanganate index and TP did not change, always being 2 (Figure 2a,c), but the assignments of NH3–N and TN changed. From 2010 to 2018, the assignment of NH3–N changed from 4 to 5 (Figure 2b), and the assignment of TN changed from 0 to 1 (Figure 2d). The concentration of the hypermanganate index and TP of Taihu Lake did not change much and the concentrations of NH3–N and TN have become lower in the past 8 years. Overall, the pollutant content of Taihu Lake has been reduced.
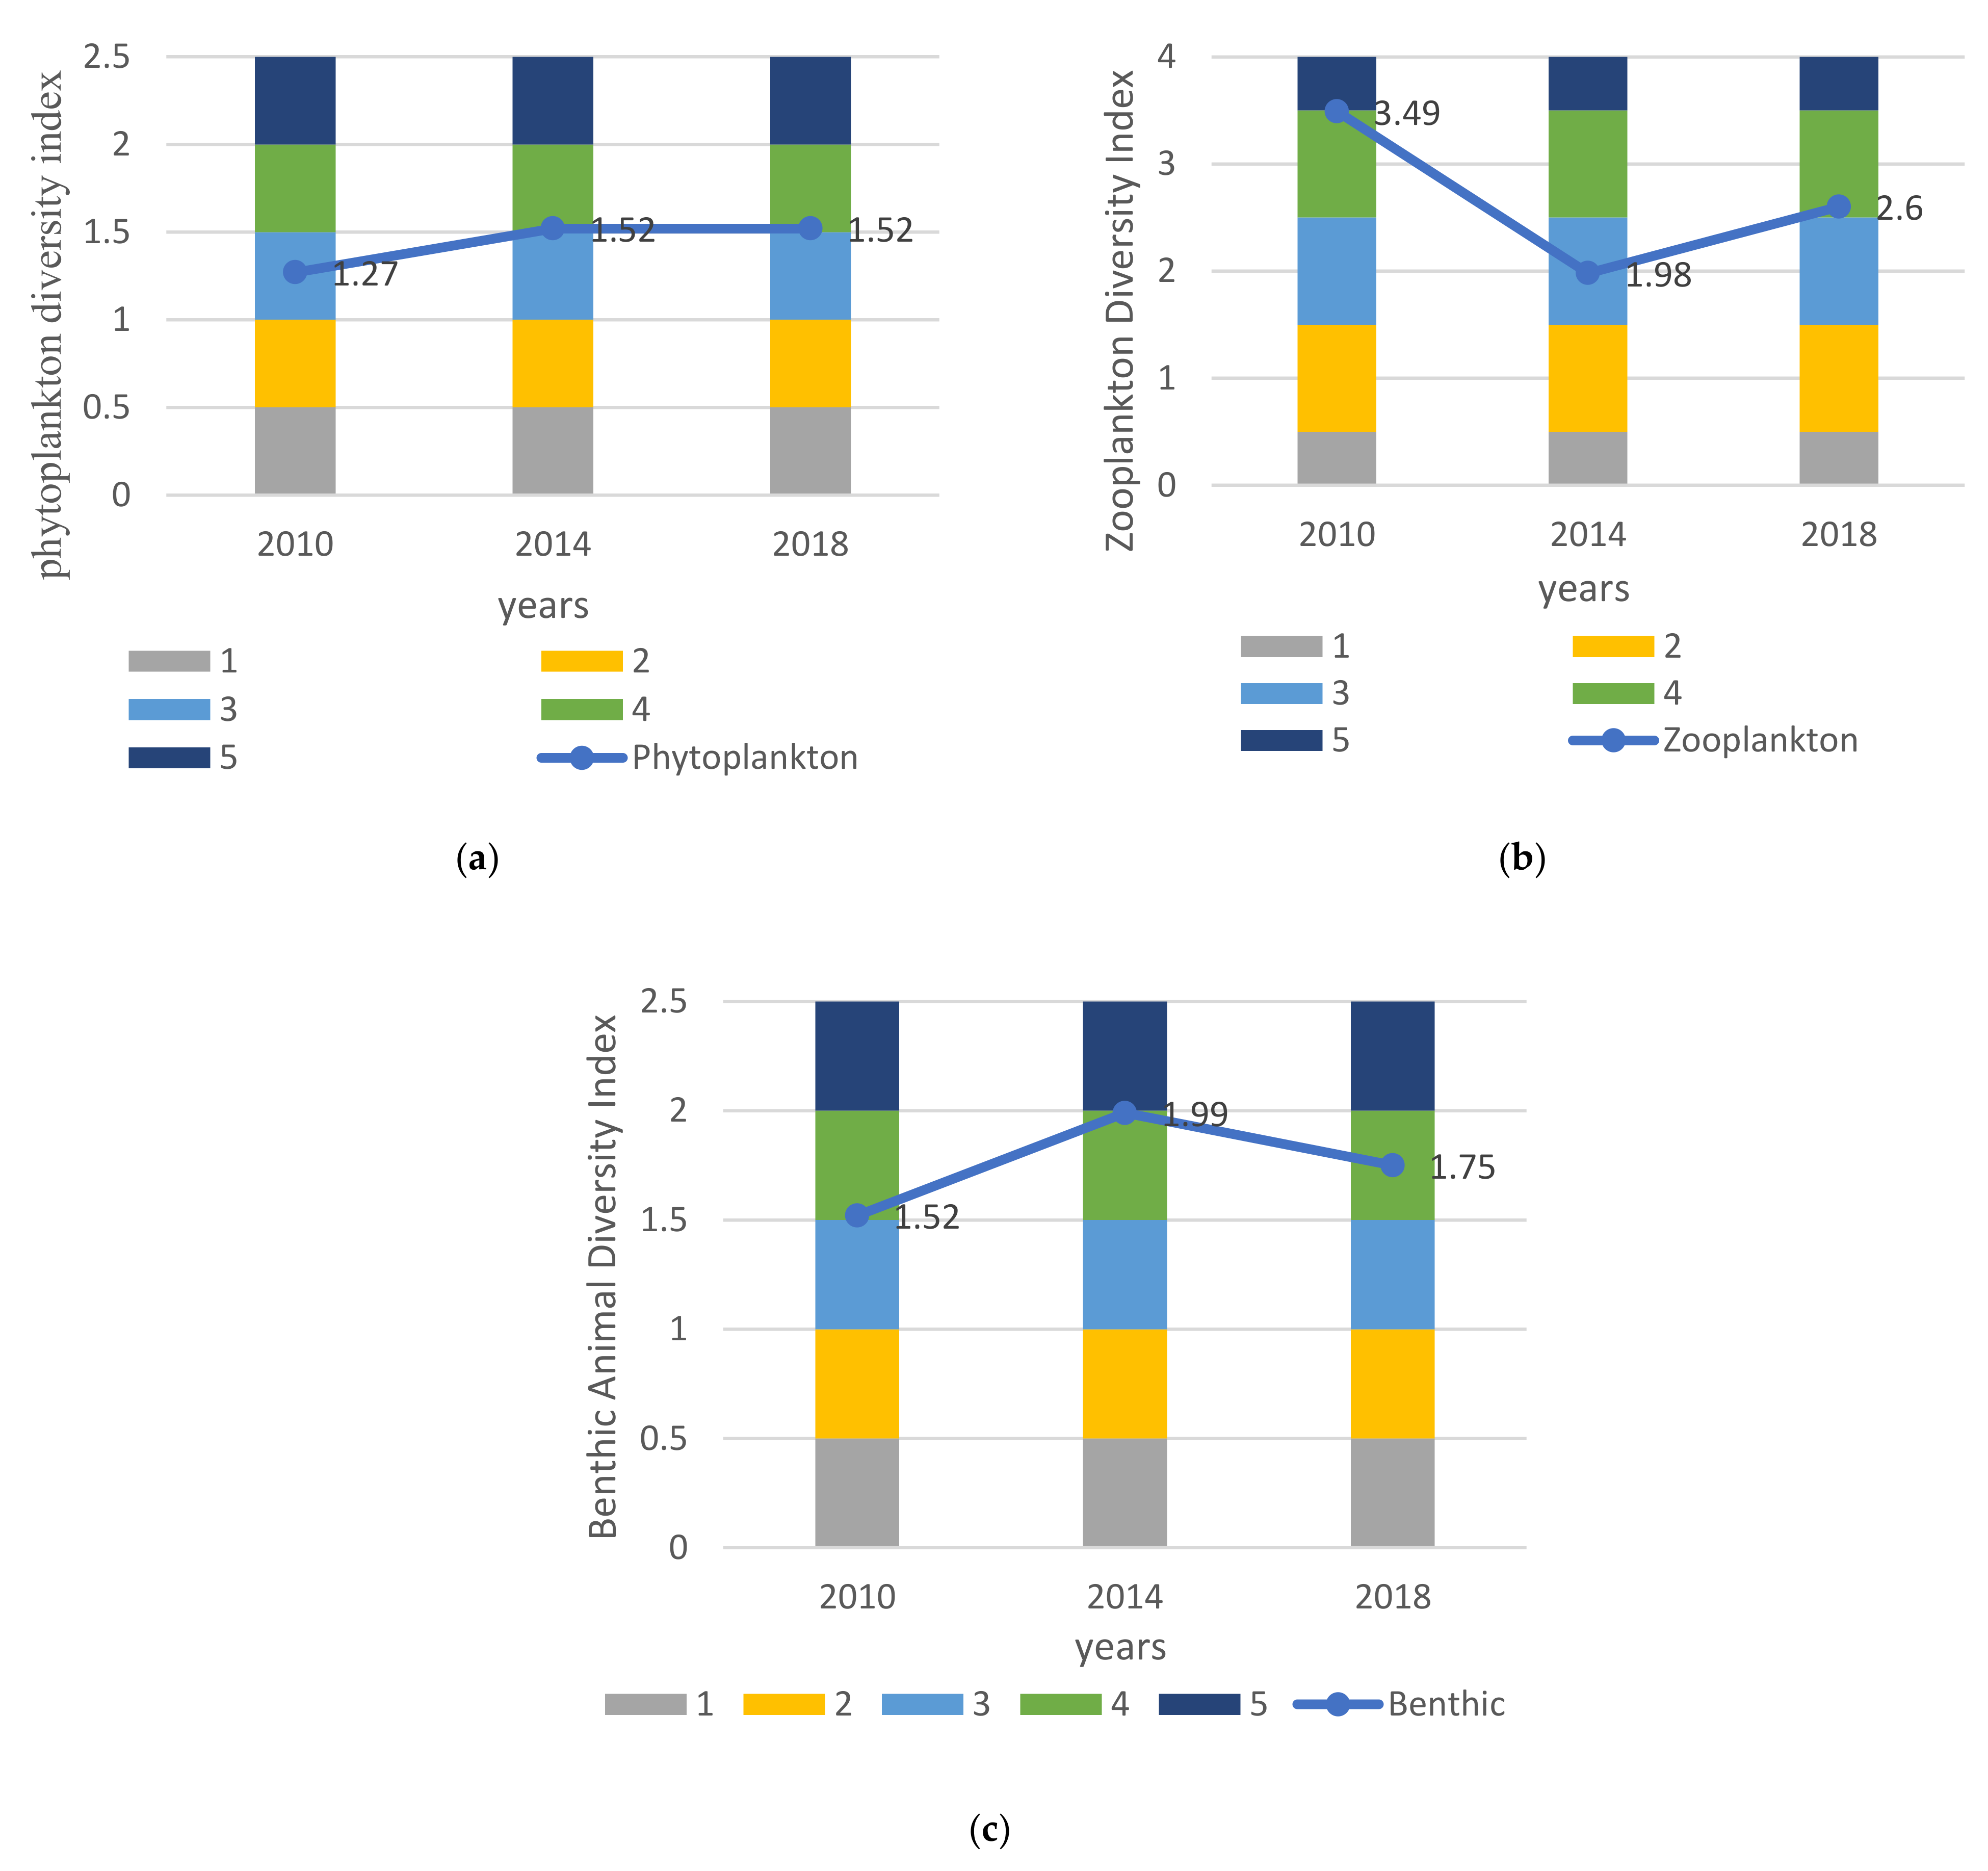
The assignment results of the four types of pollutants in 2010 were 2, 4, 2, and 0. The minimum value of 0 was taken as the assignment of the water quality chemical indicators in 2010. The evaluation results of the chemical indicators of water quality in 2014 and 2018 were both 1. Similarly, the aquatic biological indicators’ values were assigned according to Table 2, and the results are shown in Figure 3. From 2010 to 2018, the assignment of the phytoplankton diversity index changed from 3 to 4 (Figure 3a). The zooplankton diversity index first changed from 5 to 3 and then to 4 (Figure 3b). Finally, the benthos diversity index is always assigned a value of 4 (Figure 3c).
The WQI value was calculated using Equation (1), and the results of the water ecological quality were obtained according to Table 3. The evaluation results of the water ecological quality of Taihu Lake are shown in Table 5.
From Table 5, it can be concluded that the values of chemical indicators of water quality and aquatic biological indicators of Taihu Lake from 2010 to 2018 are greater, indicating that the water quality of Taihu Lake is getting better and that the biodiversity is improved. The value of WQI is increasing year by year. The water ecological quality changed from moderate pollution to light pollution.
3.2. Evaluation Results of Water Ecosystem Service Value of Taihu Lake
3.2.1. Provisioning Service Value
- (1)
- Water supply
According to the survey, the price of industrial water around the Taihu Lake is 4.1 yuan/t, the price of irrigation water for farmland is 0.6 yuan/t, and the price of residential water is 2.8 yuan/t. The water supply value was calculated according to Equation (2), and the results are shown in Table 6. The water supply value of Taihu Lake changed very little from 2010 to 2018 (998.97, 974.26, and 99.87 billion yuan, respectively), for which industrial water consumption decreased in 2014. Compared with 2010, industrial water consumption in 2018 increased by only 10 million m3. In the past 8 years, agricultural irrigation water consumption decreased year by year while residential water consumption increased year by year. As a result, the total water supply value reached a trough in 2014, and the value of water supply in 2018 was reduced compared with 2010. Therefore, the economic value of industrial water supply is greater, followed by agricultural irrigation, and the economic value of residential water supply is the least.
- (2)
- Provide aquatic product
The value of aquatic products provided was calculated according to Equations (3) and (4), and the results are shown in Table 7. The service value of provided aquatic products by Taihu Lake has continued to increase from 1.86 billion yuan in 2010 to 3.18 billion yuan in 2018. The increase in value of the aquatic products provided by Taihu Lake is due to the policies implemented by the Taihu Fishery Management Office to strengthen the protection, proliferation, and scientific utilization of Taihu’s fishery resources, which protects the fishery ecological environment of Taihu Lake.
- (3)
- Shipping
The data in the “2010–2018 Jiangsu Provincial Statistical Bulletin of National Economic and Social Development” was used as the reference to calculate the shipping value of Taihu Lake in proportion. There are more than 2900 inland waterways in Jiangsu Province with a navigable mileage of 24,248 kilometers. The navigable mileage of the Taihu Lake Basin is about 12,000 kilometers, of which Jiangsu accounts for 1/2 of the navigable distance. Therefore, the navigable mileage of the Taihu Lake Basin in Jiangsu is recorded as 6000 kilometers, and the shipping value of Taihu Lake is 25% of the shipping value in Jiangsu Province. According to Equation (5), the shipping values of Taihu Lake in 2010, 2014, and 2018 were calculated to be 6.153 billion yuan, 6.141 billion yuan, and 9.204 billion yuan, respectively (Table 8).
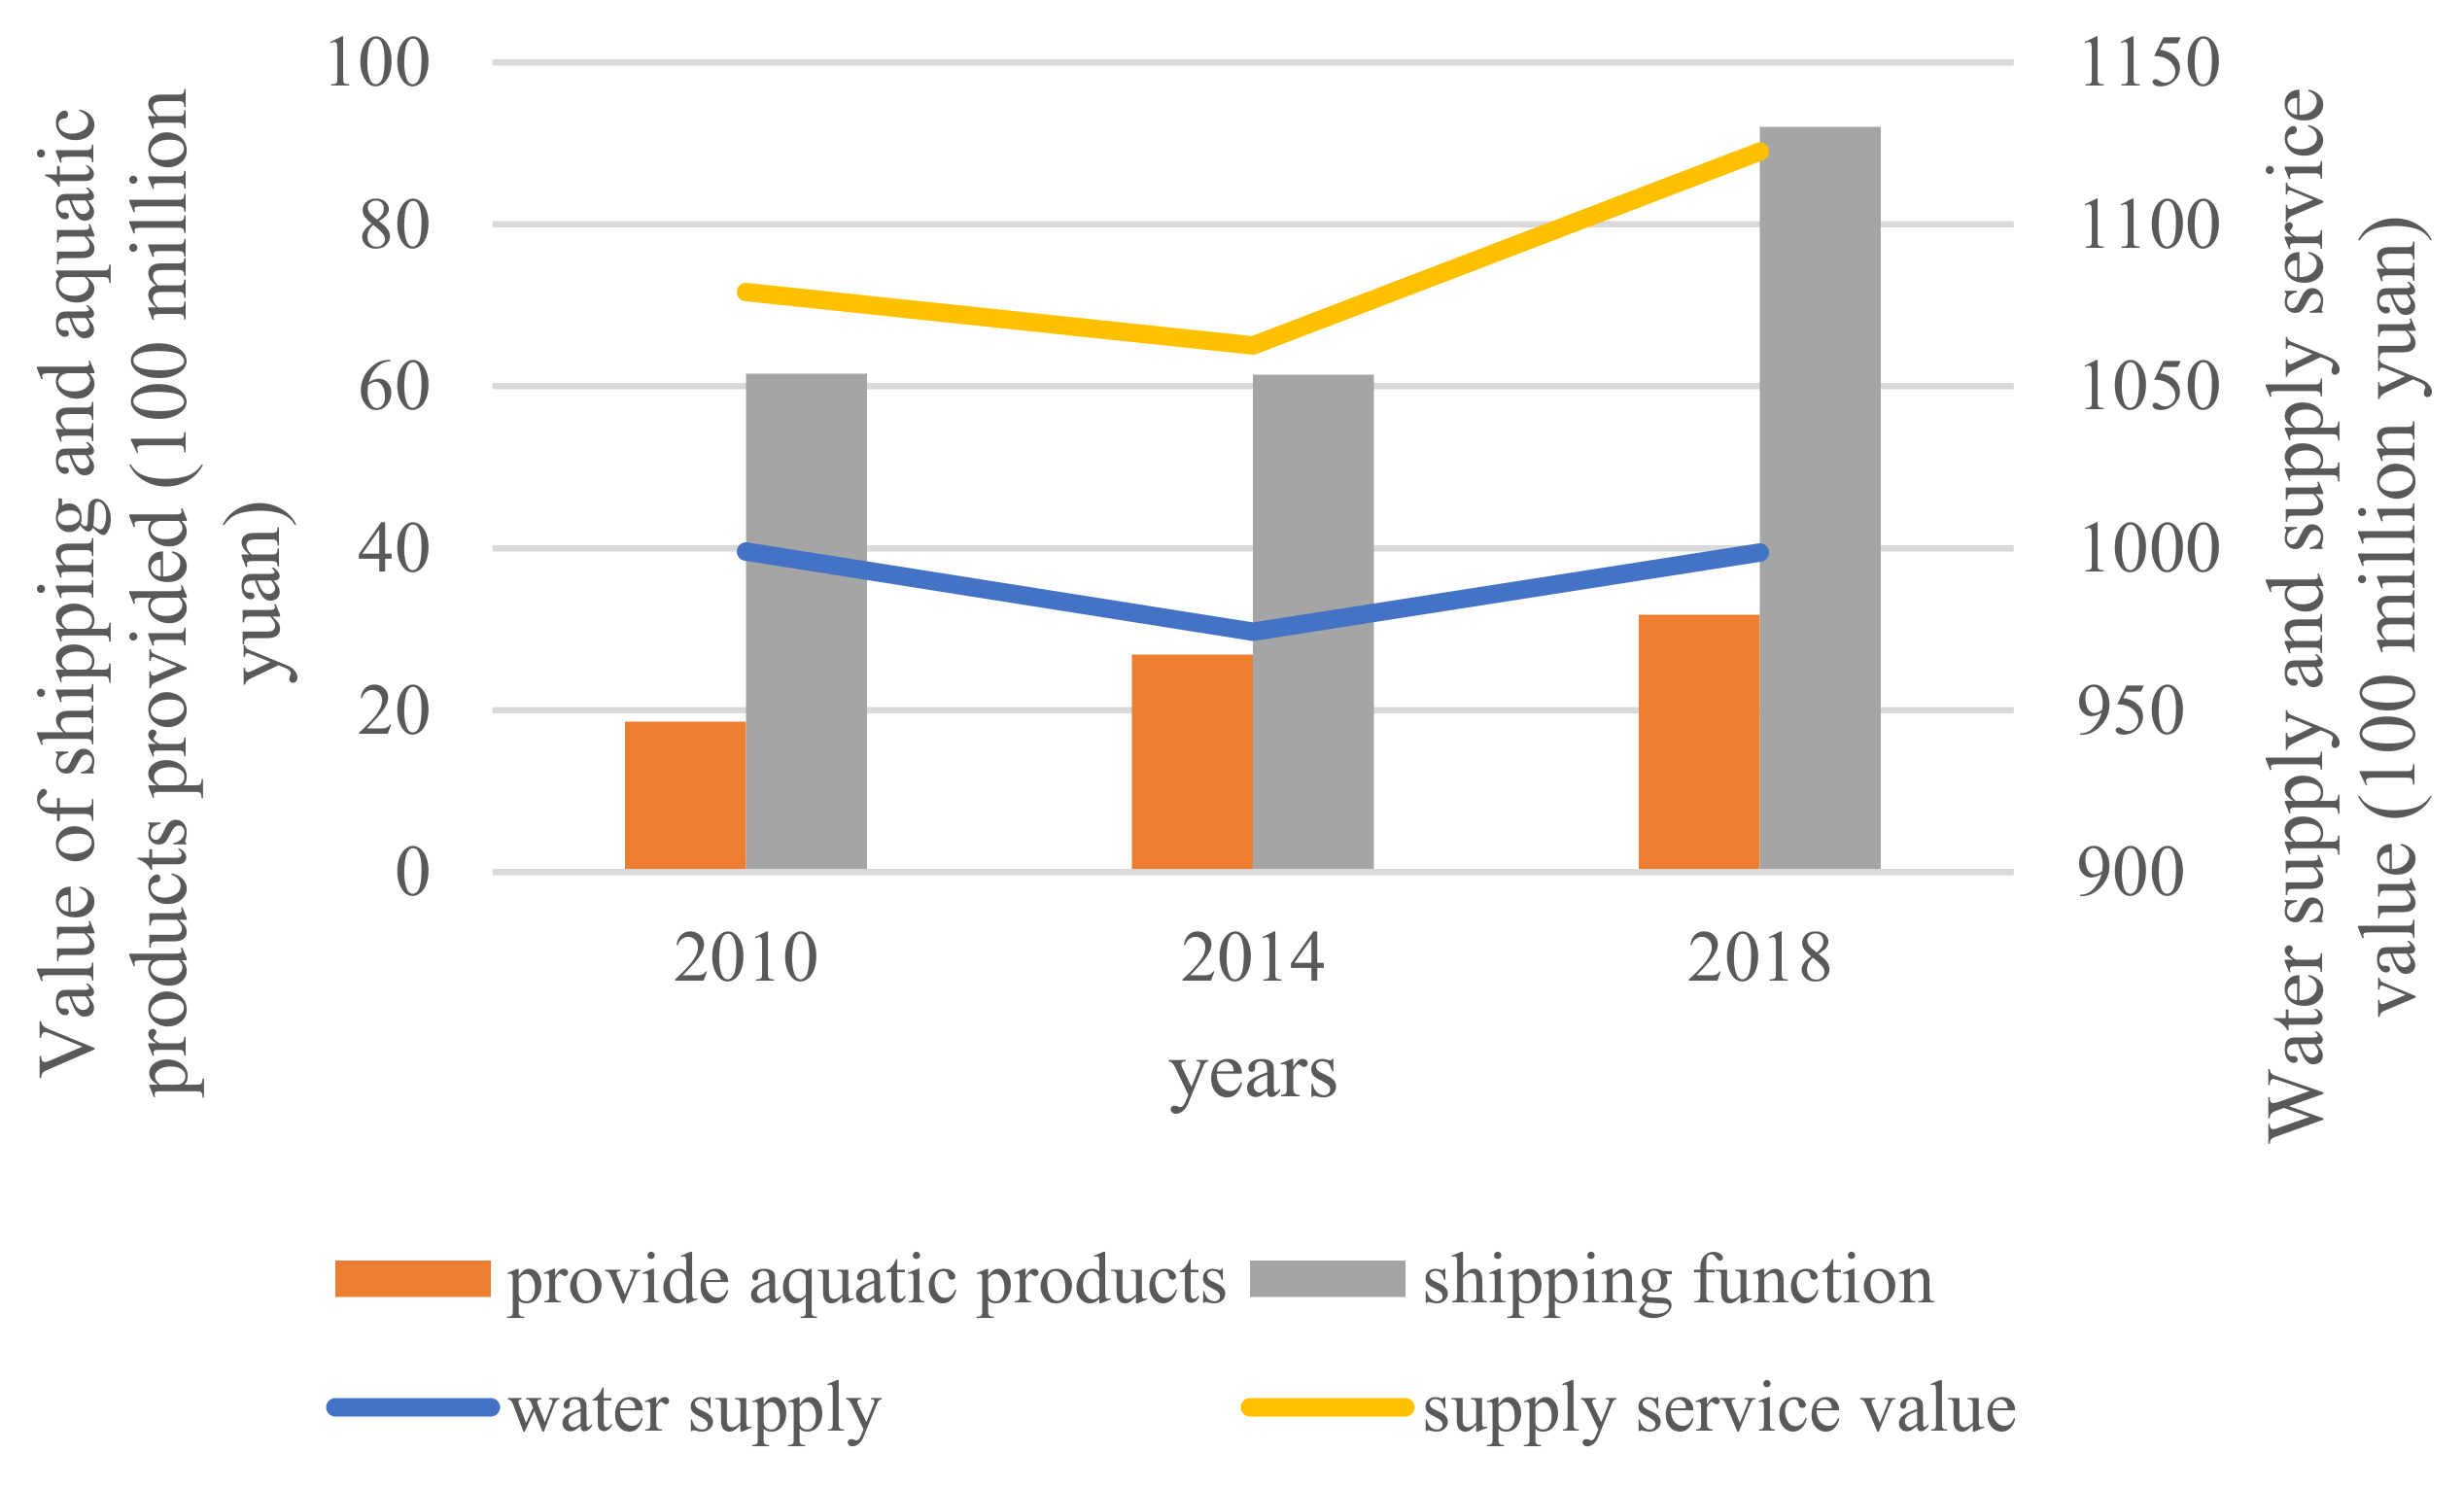
In summary, from 2010 to 2018, the value of Taihu Lake’s provisioning services showed a trend of first decreasing and then increasing. This trend of change is consistent with the trend of water supply value. The value of shipping functions and the value of aquatic products were increasing year by year, as shown in Figure 4. In terms of value, there is a large gap in the value contribution of various indicators in the provisioning service. The value of water supply is the largest, which fully reflects the characteristics of the Taihu Lake that thrive on water. A large amount of water supply ensures the economic development of surrounding cities and people’s demand for water resources. The shipping value is ranked second. There are many water networks of rivers in and out of the Taihu lake. These water networks extend in all directions, with abundant water and slow water surface velocity, which provide favorable conditions for shipping. The value of aquatic products provided by Taihu Lake is relatively small among the provisioning service values, which may be related to the Taihu Lake closure policy. In order to protect and scientifically use fishery resources, Taihu Lake implements a lake closure policy to maintain the ecology and to ensure the order of fishery production. This policy has resulted in a relatively low value of aquatic products provided.
3.2.2. Regulation Service Value
- (1)
- Regulate the atmospheric CO2/O2 production
In this research, the afforestation cost price of absorbing CO2 was 260.9 yuan/t and the industrial oxygen production cost price was 352.93 yuan/t [62]. The concentration of chlorophyll a in 2010 was 19.2 μg/L [49], and the average concentration of chlorophyll a in 2014 and 2018 were 28.75 mg/m3 and 31.5 mg/m3 [50]. Therefore, the PP (primary productivity) values were 885.684 mg C/m2, 1215.35 mg C/m2 d, and 1310.28mg C/m2 d, respectively.
The value of Taihu Lake’s atmospheric regulation function was calculated according to Equations (6)–(8), and the results are shown in Table 9. The value of Taihu Lake’s regulation of atmospheric CO2/O2 production has increased year by year. From 2010 to 2014, the added value reached 339 million yuan, and the value of regulation of the atmospheric CO2/O2 production increased by 97 million yuan from 2014 to 2018. The Taihu Lake’s regulation value of the atmosphere in 2018 was 1.48 times that of 2010. The increase in value indicates that Taihu Lake’s comprehensive pollution control has achieved goals and that the pollutant emissions have been effectively controlled, thereby improving the value of Taihu Lake’s water ecosystem in regulating atmospheric CO2/O2 production.
- (2)
- Water purification
Through the investigation of the cost of dealing various pollutants in 8 sewage treatment plants in the Taihu Lake Basin, the average processing costs of hypermanganese acid index, NH3–N, TP, and TN are rounded to about 900 yuan/t, 20,000 yuan/t, 50,000 yuan/t and 20,000 yuan/t [51], respectively. The water purification value of Taihu Lake was calculated according to Equation (10); they are 1.066 billion yuan (2010), 856 million yuan (2014), and 669 million yuan (2018) (Table 10). The value of water purification gradually decreases. By observing the concentration of pollutants entering and leaving the lake, the decrease in the value of water purification is not due to a weakening of the lake’s self-purification capacity, but the content of pollutants entering the lake decreasing year by year, which can be observed from Table 10. Compared with 2010, the pollutant content out of the lake decreased slightly in 2018. Among them, the hypermanganate index decreased by 7300 tons, NH3–N decreased by 600 tons, TP decreased by 100 tons, and TN decreased by 9300 tons. Therefore, the water purification capacity of Taihu Lake has been improved. In the future, it is necessary to strengthen the protection of Taihu Lake’s water resources to enhance the self-purification ability.
- (3)
- Surface water storage
According to the 2010–2018 “Taihu Lake Basin Water Resources Bulletin”, the total water storages of Taihu Lake in 2010, 2014, and 2018 were 4.7 billion m3, 4.72 billion m3, and 5.49 billion m3, respectively. Since the unit storage cost is 0.67 yuan per year, according to Equation (11) we calculated the storage value of the surface water in Taihu Lake as 3.15 billion yuan, 3.16 billion yuan, and 3.68 billion yuan respectively. Compared with 2010, the value of surface water storage in Taihu Lake increased by only 134 million yuan, almost unchanged. However, the value of surface water storage increased significantly from 2014 to 2018, with a significant increase of 515.9 million yuan. The increase in the value of surface water storage in 2014–2018 was 38.5 times the increase in 2010–2014. The reason for this is that the total water storage of Taihu Lake in 2018 increased compared with previous years. As the water storage capacity of Taihu Lake improved, the value of water storage increased.
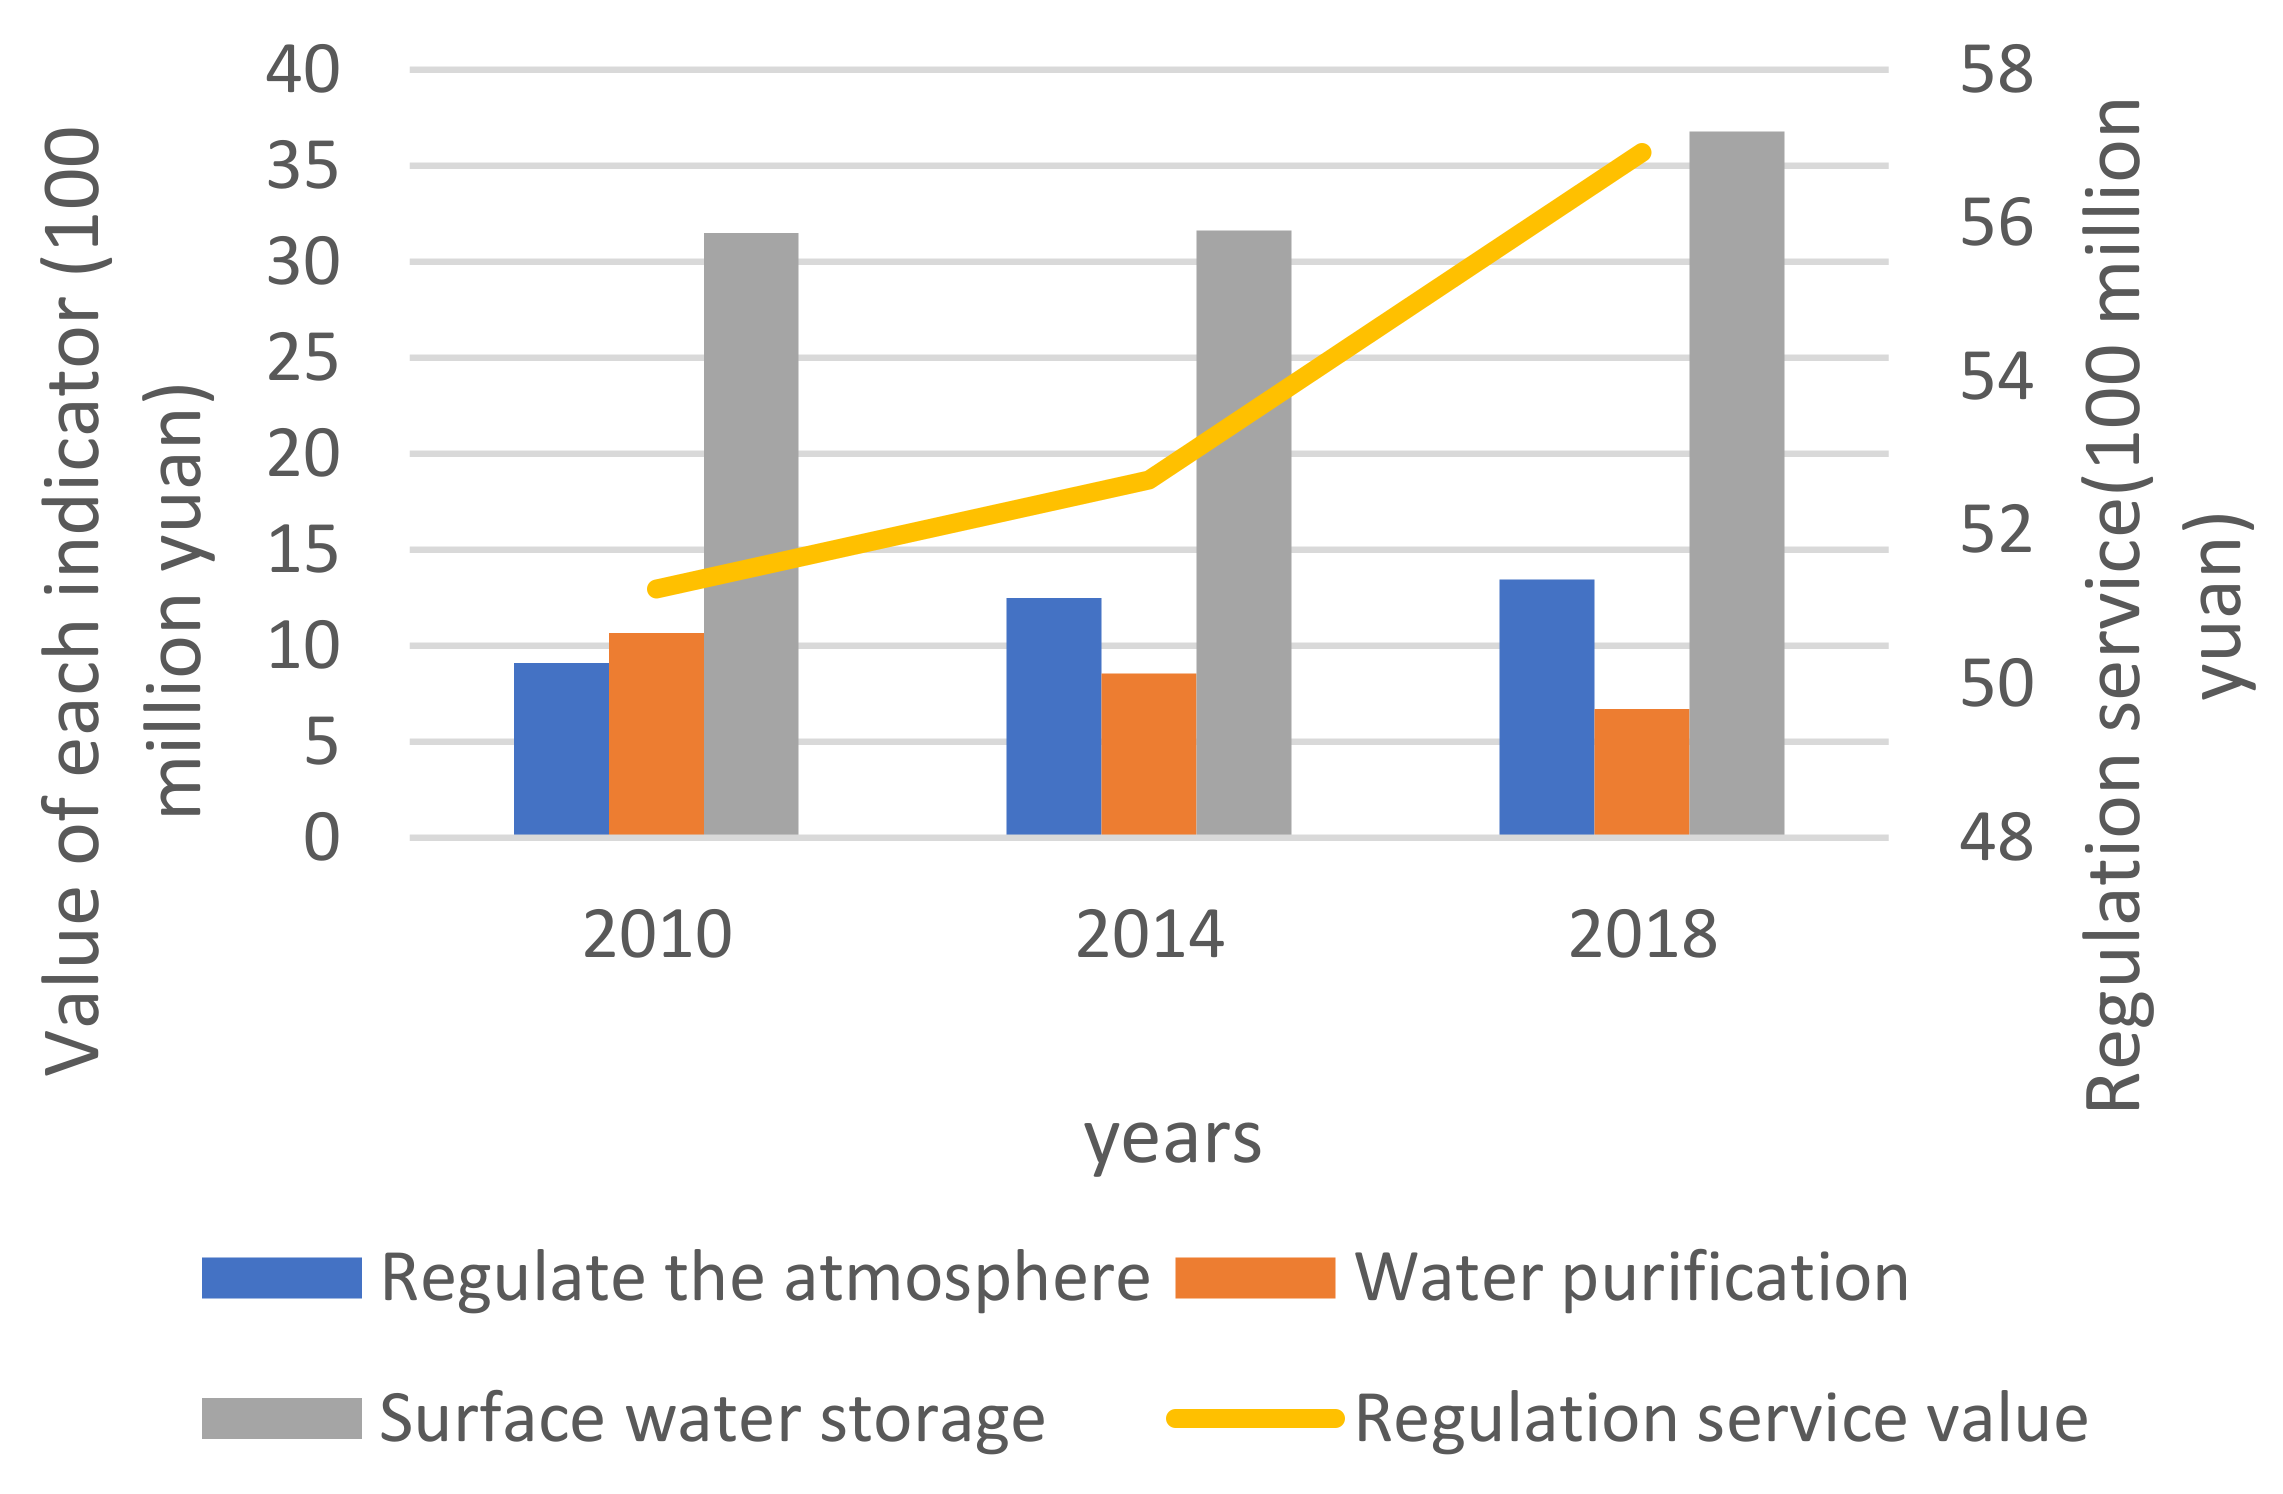
From 2010 to 2018, the value of Taihu Lake’s regulation service showed an upward trend, as shown in Figure 5. This is due to the fact that the value of all kinds of regulation services showed an increasing trend. Among them, surface water storage is the core function of Taihu Lake’s regulation service. The self-purification function of the Taihu Lake’s water has reduced the pressure on the sewage treatment plant to a certain extent, which in turn brings economic benefits. Although the value of water purification has decreased in the past 8 years, the reduction is not large and it is not caused by a weakening of the lake’s self-purification capacity. Atmospheric regulation is not the main function of the water ecosystem, but the plants in the Taihu Lake have contributed to the regulation of the atmospheric CO2/O2 production, and the value of regulating the atmosphere in 2014 and 2018 even exceeded the water purification value.
3.2.3. Support Service Value
- (1)
- Protect biodiversity
The economic value of the annual natural grain output of the national average output of farmland was used as the basis of the equivalent factor method [45]. The Taihu Lake Basin is a famous land of fish and rice in history. The main crops in the Taihu Lake area are rice, wheat, and rape. Statistical data on the planting area of rice, wheat, and rape in the major cities around Taihu Lake, namely Suzhou, Changzhou, and Wuxi, was presented in this paper. The total planting area and average net profit per unit area of the three crops are shown in Table 11. The value of biodiversity protection was calculated from Equations (12) and (13). From 2010 to 2018, the value of Taihu Lake’s biodiversity protection gradually decreased, and the value even became negative in 2018. Therefore, it can be concluded that the biodiversity of Taihu Lake has gradually decreased in recent years. The water environment of Taihu Lake is gradually unsuitable for certain types of aquatic animals and plants to inhabit, resulting in a decrease in the types of aquatic organisms. This result is consistent with the change trend of the official statistics of Taihu Lake aquatic species data. According to statistics (Figure S1), there were 154 species of phytoplankton in 2010, while there were only 145 and 125 species in 2014 and 2018, respectively [50]. The total number of species of phytoplankton, zooplankton, and benthic decreased by nearly 100. The total biological species showed a downward trend from 2010 to 2018. Among them, the species of zooplankton decreased the most, followed by phytoplankton. Only the species of benthic animals showed little change. The negative value of biodiversity protection in 2018 indicates that the biodiversity protection services cannot meet people’s needs. In the future, measures have to be taken to improve the biodiversity protection capacity.
- (2)
- Soil conservation
The soil conservation value was calculated by Equation (14). The results show that the soil conservation value of Taihu Lake continued to decrease in the past 8 years. In 2010, the Taihu Lake’s soil conservation value was 232 million yuan. In 2014, the soil conservation value was reduced to 143 million yuan. In 2018, the value was negative, which was −42 million yuan. Taihu Lake achieves soil conservation services mainly through siltation of soil. However, with the implementation of the Taihu Lake ecological dredging project, the accumulation of sediment in Taihu Lake has decreased. The dredging resulted in soil appreciation to a certain extent, but this paper did not calculate it.
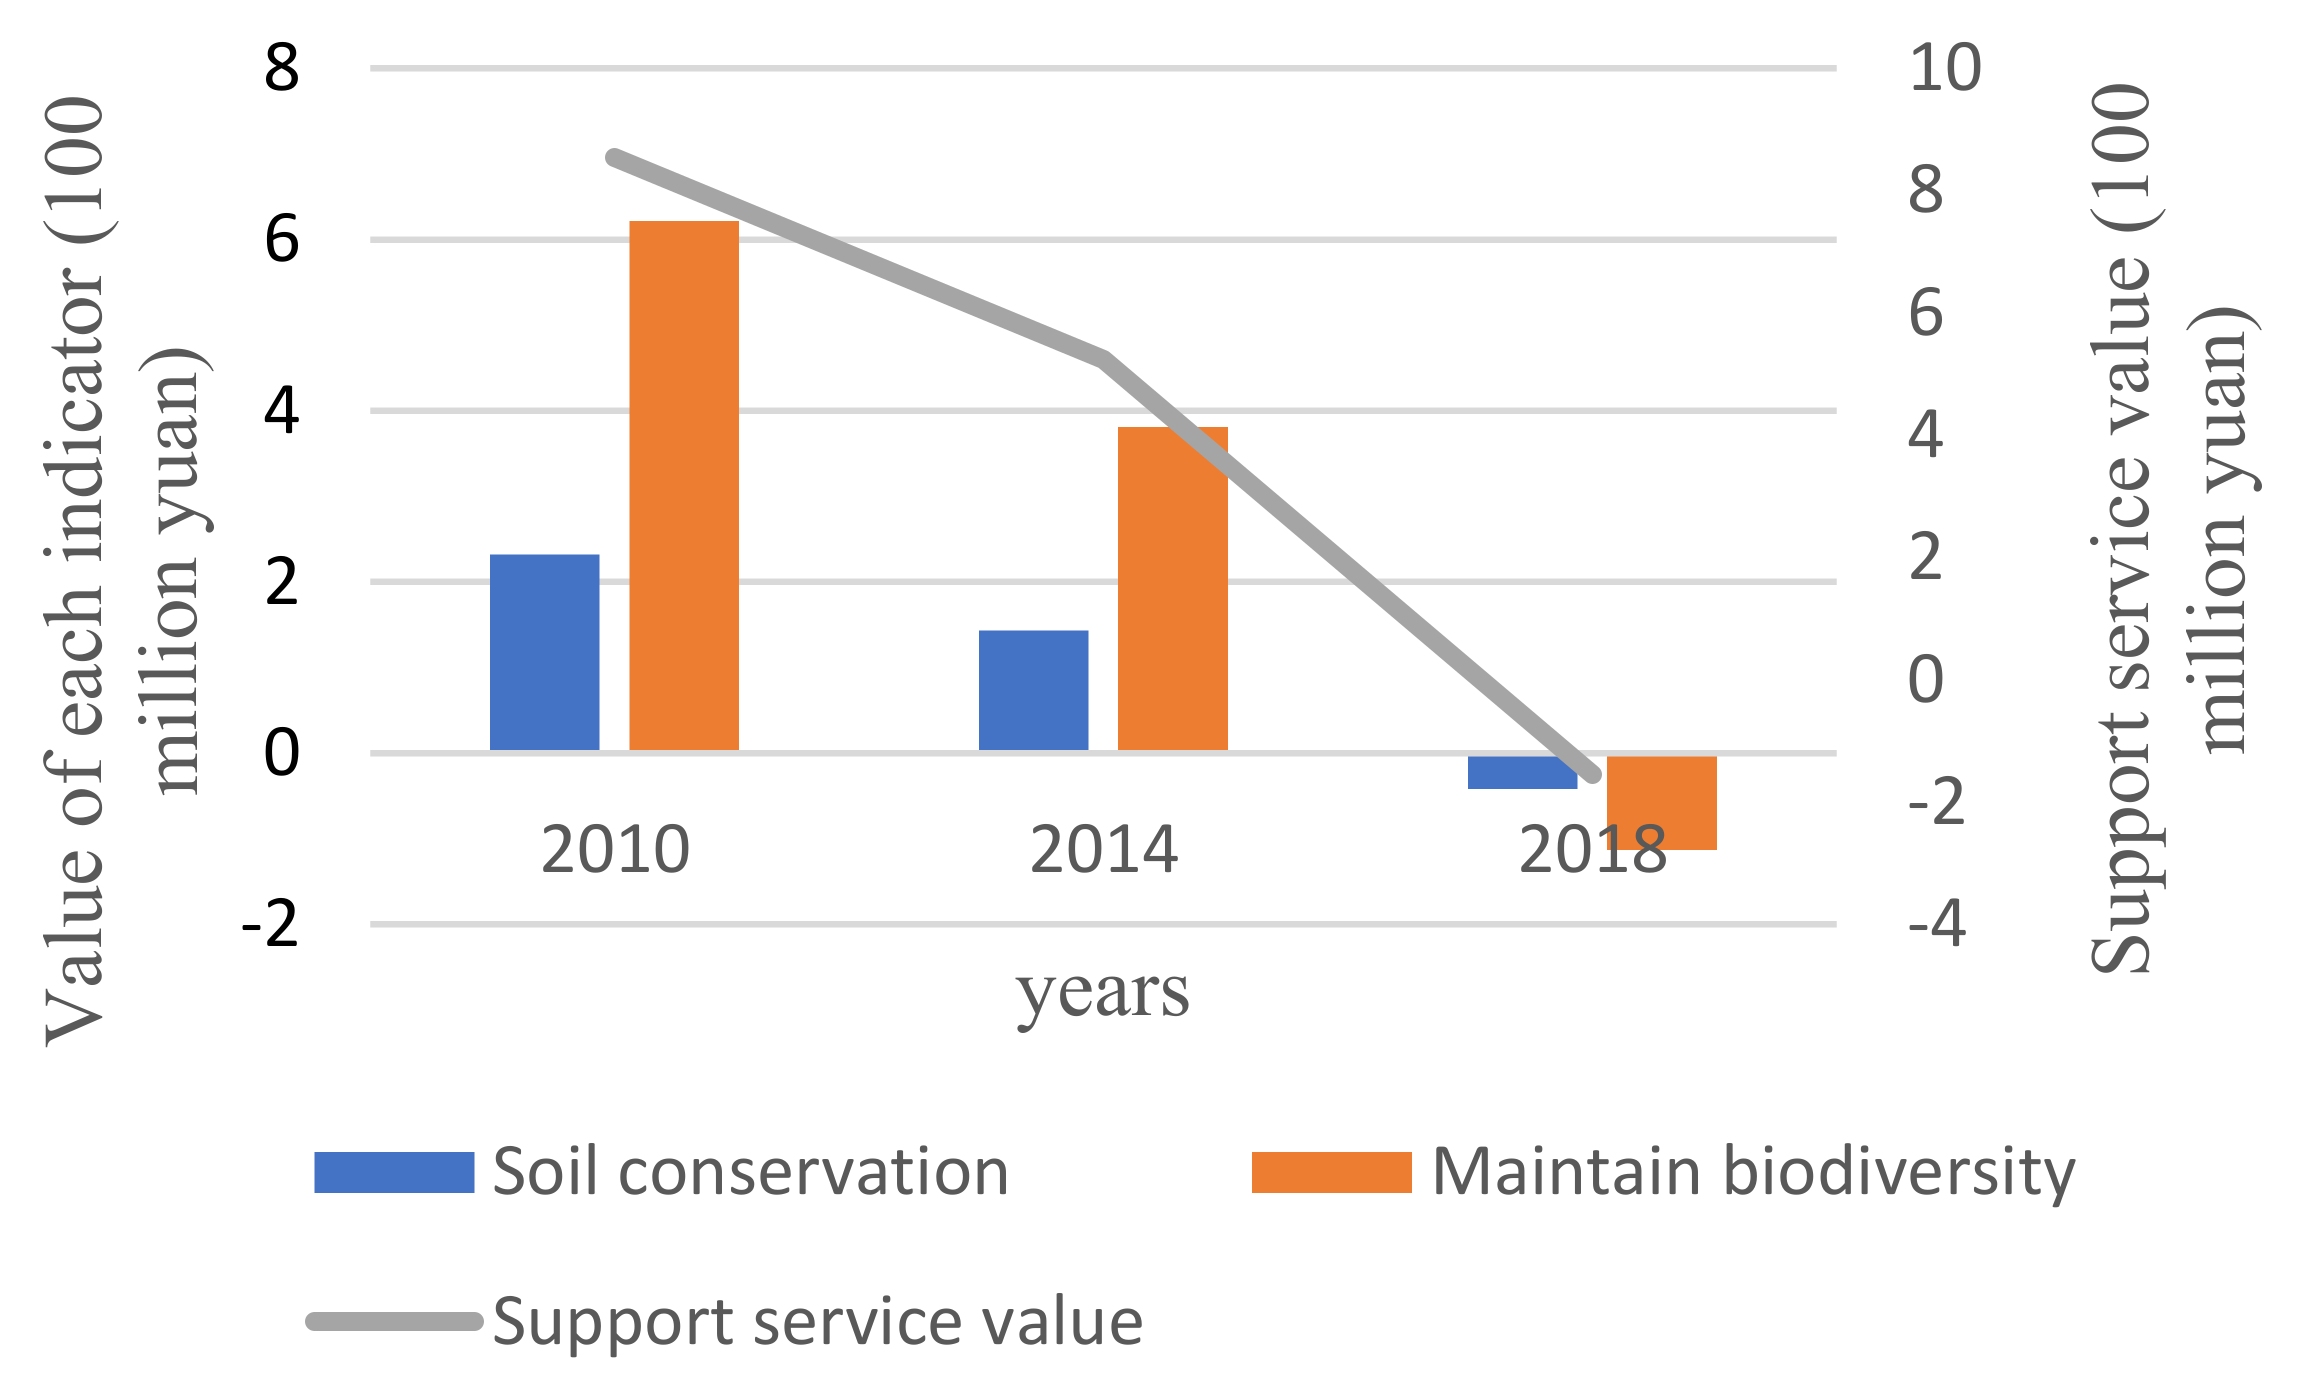
In summary, the values of Taihu’s support service functions are 854 million yuan (2010), 524 million yuan (2014), and 155 million yuan (2018), as shown in Figure 6. Among them, the protection of biodiversity is the main function of the support services, and the reduction in biodiversity is the main factor in the decline of the value of the support services. Since the fluidity of the water itself will erode the soil to a certain extent, the role of aquatic ecosystems in soil protection is very weak. Although marginal vegetation plays an important role in improving soil protection, the focus of this paper is on water ecosystems, so vegetation assessment is not taken into account. The flow velocity of Taihu Lake is slow, and the soil can be deposited on the bottom of the lake, thus maintaining the soil. The excessive siltation of sediment has hidden dangers for the outbreak of water crisis events such as eutrophication of the water body and the outbreak of blue algae. Therefore, ecological dredging is particularly important. The reduction in sediments caused by the Taihu Lake Ecological Dredging Project is a secondary factor in the reduction of soil protection value.
3.2.4. Cultural Service Value
- (1)
- Tourism and leisure
Taihu Lake is a famous national-level tourist attraction in China. Its water ecosystem provides islands, wetlands, and other ecological environments for tourism and leisure and has great tourism and leisure value. Based on the statistical data (Table 12) of national tourist attractions in the “Statistical Yearbook of China’s Urban and Rural Construction”, the tourism and leisure value of Taihu Lake is estimated from the difference between operating income and operating expenditure of Taihu Lake. From 2010 to 2018, the tourism and leisure value first decreased and then increased. Compared with 2010, operating income increased in 2014, but operating expenses were 4.29 times that of 2010. The value of the increase in income was less than the value of expenditure, so the value of tourism and leisure decreased in 2014. The value of tourism and leisure in 2018 was 1.94 times that of 2010. The change was thanks to an increase in operating income of 781 million yuan. Although operating expenses have also increased in 2018, the increase was far lower than the increase in operating income, which was only 68 million yuan, so the value of tourism and leisure increased in 2018.
- (2)
- Research and education
The value of scientific research and education per unit area of wetland ecosystem in China is 382 yuan/hm2 a [45], and the value of scientific research and education of global wetland ecosystem calculated by Constanza is 881 US dollars/ha [1]. The average exchange rates for 2010, 2014, and 2018 announced by the People’s Bank of China were 6.77, 6.12, and 6.32 respectively. According to the above exchange rates, the values of scientific research and education of the global wetland ecosystem were calculated as 5964.37 yuan/ha, 5390.84 yuan/ha, and 5567.92 yuan/ha. The average value was taken as the scientific research and education per unit area value of the lakes in our research. The values of scientific research and education of Taihu Lake in 2010, 2014, and 2018 were calculated using Equation (15), which were 742 million yuan, 675 million yuan, and 696 million yuan, respectively. From the calculation results, it can be understood that the scientific research and education value in Taihu Lake has not changed much in recent years. The value of scientific research and education in 2014 and 2018 has decreased compared with 2010.
In summary, the value of the cultural service function of Taihu Lake shows a trend of first decreasing and then increasing, with the values being 1.505 billion yuan (2010), 1.267 billion yuan (2014), and 2.173 billion yuan (2018), as is shown in Figure 7. The increase in cultural value in 2018 is mainly due to the increase in tourism and leisure values. There are many famous tourist attractions in the Taihu Lake area, such as the 4A-level scenic spot Liyuan, Suzhou Taihu Lake National Wetland Park, and Xishan Scenic Area. There are also many national 5A-level scenic spots such as Yuantouzhu, Qionglong Mountain, and the Lingshan Scenic Spot. Rich tourism resources have contributed to the economic development of Taihu Lake Basin. Tourism and leisure are the core functions of cultural services.
As shown in Figure 8, the value of services provided by the Taihu Lake water ecosystem first decreased and then increased from 2010 to 2018. The value of services in 2014 decreased by 1.75 billion yuan compared with 2010. The value of services in 2018 increased by 5.282 billion yuan and 7.02 billion yuan compared to 2010 and 2014, respectively. The change trend of the total service value is consistent with the change trend of the provisioning service value and cultural service value. The change trend of regulation service value is opposite to that of support service value. The value order of each service function of the Taihu Lake water ecosystem is provisioning service > regulation service > cultural service > support service.
According to Table 13, the proportion of each service is obtained by dividing its own value by the overall service value. The value of provisioning service accounted for more than 90% of the total value from 2010 to 2018. Among the functions of provisioning services, the value of water provisioning services is the largest, which fully reflects the characteristics of Taihu Lake as the main source of water supply in the Yangtze River Delta. The proportion of the value of provisioning services increased first and then decreased from 2010 to 2018. This trend is opposite to the trend of value changes. Provisioning services accounted for 93.52% of the total value in 2010, and the proportion of provisioning services in the total value in 2018 increased by 0.04% compared to 2010.
The proportion of regulation service value has always remained above 4% and has continued to increase from 2010 to 2018. In 2010, the value of regulation services in Taihu Lake accounted for 4.44% of the total service value. In 2014, it increased to 4.65%. By 2018, the value of regulation services accounted for 4.74%. The rate of increase in the value of regulation services in Taihu Lake is consistent with the rate of increase in total service value. Among the regulation services, surface water regulation is always the main service function, indicating that Taihu Lake is a huge natural reservoir that plays an important role in water storage.
The value of cultural services accounts for only 1–2% of the total value. The percentage of cultural services value from 2010 to 2018 shows a trend of first decreasing and then increasing. This trend is not only consistent with the changing trend of its value but also with the changing trend of the total value. The value of tourism and leisure is equivalent to the value of scientific research and education in the cultural service. In 2010, the value of tourism and leisure was only 21 million yuan more than the scientific research and education value. However, the value of tourism and leisure of Taihu Lake has reached more than twice the value of scientific research and education by 2018.
The value of support services accounts for less than 1% of the total value, and it keeps dropping every year. We found that the function of Taihu Lake in soil conservation and biodiversity maintenance is not significant. In 2018, the value of Taihu’s support service was negative, which may be due to the loss of the service function or because the service cannot meet people’s needs. These hidden reasons should be taken seriously.
From the above analysis, we know that, when planning and managing Taihu Lake, we should not only pay attention to maintaining the provision services and regulation services to meet the human needs but also take its cultural services and support services into account. The order of value of each evaluation index in 2010 was water supply > shipping function > surface water regulation and storage > provision of aquatic products > water quality purification > atmospheric CO2/O2 production regulation > tourism and leisure > scientific research and education > maintenance of biodiversity > soil conservation. The order of the value of each evaluation index in 2018 is water supply > shipping function > surface water regulation and storage > provision of aquatic products > tourism and leisure > atmospheric CO2/O2 production regulation > scientific research and education > water purification > soil conservation > maintenance of biodiversity. The ranking of each evaluation index’s value has changed greatly from 2010 to 2018. Except for the level of water supply, shipping function, surface water storage, and atmospheric CO2/O2 production regulation, there is no change in the rest.
3.3. Correlation Between Water Quality and Service Value
SPSS is a software for statistical analysis, and it was used to conduct the Pearson correlation analysis to find the correlation between WQI and ecosystem service values; the results are shown in Table 14. WQI has a significant negative correlation with water purification at the 0.05 level. That is to say, when the water ecological quality becomes better, the value of water purification decreases. Although the correlation between WQI and other service values (except water supply services) is also high, the results are not significant and inferences cannot be simply drawn. Therefore, only the correlation between WQI and the value changes of water purification services has been further analyzed. The water purification service belongs to regulation services. It can be seen that WQI and regulation services have a stronger correlation than supply, support, and cultural services. Through the previous analysis, we learned that the annual average concentration of hypermanganate index and TP in the Taihu Lake increased while NH3–N and TN decreased from 2010 to 2018. At the same time, the assignment of water quality chemical indicators increased, which indicates that changes in the annual average concentration of NH3–N and TN have a greater impact on water quality changes. The total amount of pollutants that need to be purified in the lake decreases as the concentration of pollutants in the lake drops, and the value of water purification also declines. Since the value of water purification accounts for only about 15% of the value of regulation services, the reduction in the value of water purification has little impact on the value of regulation services and the value of regulation services as a whole is still increasing. Therefore, it can be concluded that the improvement in water ecological quality can increase the value of regulation services.
4. Discussion
Taihu Lake is the important source of water for dozens of cities in the Yangtze River Delta. For a long time, the water environment changes of Taihu Lake has received extensive attention from the public. From 2010 to 2018, the overall water ecological quality of Taihu Lake has changed from moderate pollution to light pollution, and the comprehensive water quality index (WQI) has been increasing year by year. The changing trend of WQI is consistent with regulating service value in the water ecosystem service value. There are many reasons for these changes, such as the reduction of nitrogenous pollutants (TP and NH3–H) and the increase in phytoplankton and benthic animals. In addition, socioeconomic development and investment in the Taihu Project have also changed the water quality of Taihu Lake, thus changing the value of ecosystem services. Zhou Xiaobai’s [63] research found that the results of water quality evaluation and aquatic organisms evaluation showed the same trend on a larger scale. The health of aquatic organisms is related not only to water quality but also to the habitat of the water body. Organic pollutants and excess nutrients affect the water quality and aquatic organisms of Taihu Lake, the main factor of health status; thus, reducing the concentration of organic pollutants and nutrients in Lake Taihu and its rivers is an effective way to improve the water quality and ecological functions of Taihu Lake. Among the existing Taihu Lake Projects, the planting of Eichharnia crassipes is one of the ecological engineering measures to purify water bodies, and the large-scale cultivation of water hyacinth can effectively purify water quality [64], but in the short term, it does not show adverse effects on the living environment of benthic animal communities [65]. The key water quality pollutants of other lakes in China are similar to those of Taihu Lake, but the variation trend of each pollutant concentration with time is different. For example, the main pollutants affecting the water quality of Dongting Lake are TN and TP. The concentration of TN in Dongting Lake increased significantly from 2010 to 2014 and decreased significantly from 2014 to 2018, with an average range of 1.68–2.02 and 1.68–1.93 mg/L [66]. From 2012 to 2018, the concentrations of total phosphorus and total nitrogen in Chao Lake increased significantly, while the concentrations of ammonia nitrogen decreased significantly [67]. From the perspective of service function value, the management and utilization of water resources should not only ensure sustainable development of the provisioning service value and the regulation service value but also the support service and cultural service function. The relevant departments of local government should strengthen cooperation and make overall plans for the development and governance of Taihu Lake to achieve coordinated development and sustainability.
Due to the diversity and complexity of the data required to assess the value of water ecosystem services and since many departments are involved, it is difficult to obtain comprehensive data. When evaluating the value of water purification, just the reduction value of four pollutants including hypermanganate index, NH3–N, TP, and TN have been considered in this paper. Based on the improvement of monitoring data by environmental protection departments in the future, more pollutant indicators can be included, so the water purification value evaluated in this paper is smaller than its actual value.
5. Conclusions
The water ecological quality of Taihu Lake was evaluated. The value of comprehensive water quality index (WQI) is increasing year by year, and the water environment has been effectively improved. The value and influencing factors of the service function of Taihu Lake’s water ecosystem from 2010 to 2018 were calculated. From 2010 to 2018, the total value of Taihu Lake’s water ecosystem services decreased first and then increased. In 2010, 2014, and 2018, the total values were 115.39 billion yuan, 113.31 billion yuan, and 119.96 billion yuan, respectively. Provisioning services is the main function of Taihu Lake’s water ecosystem services. The value of various services is ranked as provisioning service value > regulation service value > cultural service value > support service value. In the provisioning service, the core service function is the water supply function. The improvement in Taihu Lake’s water ecological quality has led to an increase in the value of regulation services to a certain extent. The improvement in water ecological quality will increase the value of providing aquatic products, regulating the atmospheric CO2/O2 production, and regulating and storing surface water, but it does not promote water purification, soil conservation, and an increase in the value of maintaining biodiversity.
Supplementary Materials
The following are available online at https://www.mdpi.com/2073-4441/13/5/618/s1, Figure S1: Biological species of Taihu Lake, Table S1: The table with the description and equation of the variables.
Author Contributions
Conceptualization, Q.W. and Q.Z.; methodology, Q.W.; formal analysis, Q.Z.; investigation, Q.W.; resources, Q.W.; data curation, Q.W.; writing—original draft preparation, Q.W.; writing—review and editing, Q.W.; project administration, Q.Z.; funding acquisition, Q.Z. Both authors contributed with ideas and discussion. Both authors have read and agreed to the published version of the manuscript.
Funding
This research was funded by the National Natural Science Foundation of China, grant number 71373125, and by the Major Project of Philosophy and Social Science Research in Jiangsu Universities, grant number 2020SJZDA073.
Institutional Review Board Statement
Not applicable.
Informed Consent Statement
Not applicable.
Data Availability Statement
The data presented in this study are available on request.
Acknowledgments
The authors would like to acknowledge the Taihu Lake Basin Administration for providing the long-term monitoring data for this study. The authors also would like to thank the editor in chief, the assistant editor and three anonymous commentators for their very helpful feedback.
Conflicts of Interest
The authors declare no conflict of interest.
References
- Costanza, R.; d’Arge, R.; De Groot, R.; Farber, S.; Grasso, M.; Hannon, B.; Limburg, K.; Naeem, S.; O’neill, R.V.; Paruelo, J.; et al. The value of the world’s ecosystem services and natural capital. Nature 1997, 387, 253–260. [Google Scholar] [CrossRef]
- Turner, B.L.; Kasperson, R.E.; Matson, P.A.; McCarthy, J.J.; Corell, R.W.; Christensen, L.; Eckley, N.; Kasperson, J.X.; Luers, A.; Martello, M.L.; et al. A Framework for Vulnerability Analysis in Sustainability Science. Proc. Natl. Acad. Sci. USA 2003, 100, 8074–8079. [Google Scholar] [CrossRef] [PubMed] [Green Version]
- World Health Organization (WHO). Ecosystems and human well-being: Health synthesis. In A Report of the Millennium Ecosystem Assessment; World Health Organization: Geneva, Switzerland, 2005. [Google Scholar]
- Zan, X.; Zhang, Y.; Jia, X.; Xiong, G. Evaluation of water ecosystem service value in the upper reaches of Yongding River. J. Nat. Resour. 2020, 35, 1326–1337. [Google Scholar]
- Tomscha, S.A.; Sutherland, I.J.; Renard, D.; Gergel, S.E.; Rhemtulla, J.M.; Bennett, E.M.; Daniels, L.D.; Eddy, I.M.; Clark, E.E. A Guide to Historical Data Sets for Reconstructing Ecosystem Service Change over Time. Bioscience 2016, 66, 747–762. [Google Scholar] [CrossRef] [Green Version]
- Dong, Z.; Wu, Q.; Wang, J.; Ge, C.; Cao, D. Environmental indicator development in China: Debates and challenges ahead. Environ. Dev. 2013, 7, 125–127. [Google Scholar] [CrossRef]
- Zhang, Y.; Zhou, D.; Niu, Z.; Xu, F. Valuation of Lake and Marsh Wetlands Ecosystem Services in China. Chin. Geogr. Sci. 2014, 24, 269–278. [Google Scholar] [CrossRef] [Green Version]
- Krutilla, J.V.; Fisher, A.C. The Economics of Natural Environments: Studies in the Valuation of Commodity and Amenity Resources; Resources for the Future: Washington, DC, USA, 1985. [Google Scholar]
- Boland, J.J.; Freeman, A.M. The Benefits of Environmental Improvement: Theory and Practice; The Johns Hopkins University Press: Baltimore, MD, USA, 1979. [Google Scholar]
- Halkos, G.; Matsiori, S. Determinants of willingness to pay for coastal zone quality improvement. J. Socioecon. 2012, 41, 391–399. [Google Scholar] [CrossRef]
- Lange, G.M.; Jiddawi, N. Economic value of marine ecosystem services in Zanzibar: Implications for marine conservation and sustainable development. Ocean Coast. Manag. 2009, 52, 521–532. [Google Scholar] [CrossRef]
- Mander, Ü.; Wiggering, H.; Helming, K. (Eds.) Multifunctional Land Use: Meeting Future Demands for Landscape Goods and Services; Springer: Berlin/Heidelberg, Germany, 2007. [Google Scholar]
- Chen, S.; Jiang, H.; Chen, Y.; Cai, Z. Spatial-temporal patterns of net primary production in Anji (China) between 1984 and 2014. Ecol. Indic. 2020, 110. [Google Scholar] [CrossRef]
- Paudyal, K.; Samsudin, Y.B.; Baral, H.; Okarda, B.; Phuong, V.T.; Paudel, S.; Keenan, R.J. Spatial Assessment of Ecosystem Services from Planted Forests in Central Vietnam. Forests 2020, 11, 822. [Google Scholar] [CrossRef]
- Solomon, N.; Segnon, A.C.; Birhane, E. Ecosystem Service Values Changes in Response to Land-Use/Land-Cover Dynamics in Dry Afromontane Forest in Northern Ethiopia. Int. J. Environ. Res. Public Health 2019, 16, 4653. [Google Scholar] [CrossRef] [Green Version]
- Zhao, Q.; Wen, Z.; Zhang, M. Identifying the supply and demand of forest ecosystem service—Based on the perspective of ecosystem service flow. For. Econ. 2014, 36, 3–7. [Google Scholar]
- Sawuti, R.; Manlik, A.; Hu, L.; Kasmu, N.; Fengling, Z.; Xuesen, L.; Abduklimu, R.; Kahal, Y. Evaluation of service value changes of mountain grassland ecosystem in Urumqi—Based on remote sensing and GIS. Acta Ecol. Sin. 2020, 40, 522–539. [Google Scholar]
- Zhao, M.; Zhao, H.; Li, R.; Zhang, L.; Zhao, F.; Liu, L.; Shen, R.; Xu, M. Evaluation of grassland ecosystem service function value in Qinghai Province from 1998 to 2012. J. Nat. Resour. 2017, 32, 418–433. [Google Scholar]
- Qi, A.; Murray, P.J.; Richter, G.M. Modelling productivity and resource use efficiency for grassland ecosystems in the UK. Eur. J. Agron. 2017, 89, 148–158. [Google Scholar] [CrossRef]
- Song, F.; Su, F.; Mi, C.; Sun, D. Analysis of driving forces on wetland ecosystem services value change: A case in Northeast China. Sci. Total Environ. 2021, 751, 141778. [Google Scholar] [CrossRef] [PubMed]
- Shang, H.; Xi, M.; Li, Y.; Kong, F.; Wang, S. Changes in ecosystem service value of coastal wetland in Jiaozhou Bay. Chin. J. Ecol. Sci. 2018, 38, 421–431. [Google Scholar]
- Mahlatini, P.; Hove, A.; Maguma, L.F.; Chemura, A. Using direct use values for economic valuation of wetland ecosystem services: A case of Songore wetland, Zimbabwe. GeoJournal 2020, 85, 41–51. [Google Scholar] [CrossRef]
- Xu, H.; Zhao, P.; Wu, J.; Li, X.; Wu, Z.; Wu, Z. Evaluation of ecosystem service value of West Lake in Hangzhou. Prog. Water Sci. 2013, 24, 436–441. [Google Scholar]
- Zhou, W.; Shi, Y.; Pan, L.; Fu, T.; Zheng, L. Evaluation of the final service value of Wuhan East Lake Wetland Ecosystem in 2017. Wetl. Sci. 2019, 17, 318–323. [Google Scholar]
- Reynaud, A.; Lanzanova, D. A Global Meta-Analysis of the Value of Ecosystem Services Provided by Lakes. Ecol. Econ. J. Int. Soc. Ecol. Econ. 2017, 137, 184–194. [Google Scholar] [CrossRef]
- Jiang, S.; Cao, M.; Tang, C.; Ma, Q.; Cao, Y.; Xue, J. CVM-based non-use value evaluation of Dongtan wetland in Chongming. J. Nanjing For. Univ. (Nat. Sci. Ed.) 2017, 41, 21–27. [Google Scholar]
- Zhao, Q.; Wen, Z.; Chen, S.; Ding, S.; Zhang, M. Quantifying Land Use/Land Cover and Landscape Pattern Changes and Impacts on Ecosystem Services. Int. J. Environ. Res. Public Health 2020, 17, 126. [Google Scholar] [CrossRef] [Green Version]
- Sharma, B.; Rasul, G.; Chettri, N. The economic value of wetland ecosystem services: Evidence from the Koshi Tappu Wildlife Reserve, Nepal. Ecosyst. Serv. 2015, 12, 84–93. [Google Scholar] [CrossRef]
- Cong, J.; Pang, T.; Peng, H. Optimal Strategies for Capital Constained Low-Carbon Supply Chain under Yield Uncertainty. J. Clean. Prod. 2020, 256, 120339. [Google Scholar] [CrossRef]
- Cao, Y.; Mao, D.; Wu, H.; Zhang, H.; Zhang, J. The evolution characteristics of water environment quality in the mainstream of the Xiangjiang River and quantitative identification of key factors. Resour. Environ. Yangtze River Basin 2019, 28, 1235–1243. [Google Scholar]
- Ba, W.; Du, P.; Liu, T.; Bao, A.; Chen, X.; Liu, J.; Qin, C. Chengxin.Impacts of climate change and agricultural activities on water quality in the Lower Kaidu River Basin, China. J. Geogr. Sci. 2020, 30, 164–176. [Google Scholar] [CrossRef] [Green Version]
- Wang, Q.; Sun, J.; Liu, J.; Yang, J. Surface water chemical characteristics and water environment quality evaluation in Shenfuyu mining area. Resour. Environ. Arid Areas 2018, 32, 190–195. [Google Scholar]
- Cui, W.; Liu, D.; Liang, S.; Zhang, P.; Kong, F. Comprehensive assessment of water ecological environment quality in Yongding River Basin. J. Water Ecol. 2020, 41, 23–28. [Google Scholar]
- Xiang, Y.; Liang, C.; Lin, Y. Improved grey clustering method and its application in water environment quality assessment. J. Sichuan Univ. (Eng. Sci. Ed.) 2014, 46, 7–12. [Google Scholar]
- An, G.; Lin, L.; Zou, S. Discussion on Urban River Water Environmental Quality Ranking Based on Comprehensive Index Method. China Environ. Monit. 2016, 32, 50–57. [Google Scholar]
- Qin, M.; Xu, H.; Zeng, J.; Zhao, D.; Yu, Z.; Wu, Q.L. Composition and assembly of bacterial communities in surface and deeper sediments from aquaculture-influenced sites in Eastern Taihu Lake, China. Aquat. Sci. 2020, 82, 80. [Google Scholar] [CrossRef]
- Yang, J.; Ji, X.; Deane, D.C.; Wu, L.; Chen, S. Spatiotemporal Distribution and Driving Factors of Forest Biomass Carbon Storage in China: 1977–2013. Forests 2017, 8, 263. [Google Scholar] [CrossRef] [Green Version]
- Gao, S.; Jiang, H.; Xu, T.; Zhang, L. Environmental performance evaluation of water environment treatment project in Yixing City based on section water quality response. Hydropower Energy Sci. 2020, 38, 135–138. [Google Scholar]
- Kang, R.; Xie, W.; Zhao, W.; Pang, X.; Yu, G. Looking at the effectiveness of key river management in Wunan area of Changzhou City from the water quality change trend. China Environ. Sci. 2019, 39, 4186–4193. [Google Scholar]
- Tian, W.; Yang, Z.; Shao, K.; Pan, H.; Hu, Y.; Bai, C.; Jiang, X.; Gao, G.; Tang, X. The impact of urban lake water environment improvement on improving water quality: A case study of the water quality changes in Lihu Lake in the past 30 years. Environ. Sci. 2020, 41, 183–193. [Google Scholar]
- Deng, J.; Zhang, W.; Qin, B.Q.; Zhang, Y.; Salmaso, N.; Jeppesen, E. Winter Climate Shapes Spring Phytoplankton Development in Non-Ice-Covered Lakes: Subtropical Taihu Lake as an Example. Water Resour. Res. 2020, 56, e2019WR026680. [Google Scholar] [CrossRef]
- Xu, H.; Cai, Y.; Tang, X.; Shao, K.; Qin, B.; Gong, Z. Community structure of macrobenthos and biological evaluation of water environment in Taihu Lake. Lake Sci. 2015, 27, 840–852. [Google Scholar]
- Chang, W.; Sun, J.; Pang, Y.; Zhang, S.; Gong, L.; Lu, J.; Feng, B.; Xu, R. Effects of different habitats on the bacterial community composition in the water and sediments of Taihu Lake, China. Environ. Sci. Pollut. Res. 2020, 27, 44983–44994. [Google Scholar] [CrossRef]
- Taihu Lake Basin Administration. Taihu Lake Basin and Southeastern Rivers Water Resources Bulletin (2018); Taihu Lake Basin Administration: Shanghai, China, 2019. [Google Scholar]
- Xie, G.; Zhang, C.; Zhang, C.; Xiao, Y.; Lu, C. The value of China’s ecosystem services. Resour. Sci. 2015, 37, 1740–1746. [Google Scholar]
- Suzhou Municipal Bureau of Statistics. Suzhou Statistical Yearbook; China Statistics Press: Suzhou, China, 2019.
- Jiangsu Provincial Bureau of Statistics; Jiangsu Survey Team of the National Bureau of Statistics. Jiangsu Provincial National Economic and Social Development Statistical Bulletin in 2019; China Publishing House: Beijing, China, 2020.
- Zhao, T.; Ouyang, Z.; Wang, X.; Miao, H.; Wei, Y. China’s terrestrial surface water ecosystem service function and its ecological economic value evaluation. J. Nat. Resour. 2003, 4, 443–452. [Google Scholar]
- Liu, J.; Lu, J.; Zhu, G.; Gao, M.; Wen, L.; Yao, M.; Nie, Q. The characteristics and influencing factors of Taihu Lake flooding from 2009 to 2017. Lake Sci. 2018, 30, 1196–1205. [Google Scholar]
- Taihu Lake Basin Administration Bureau, Ministry of Water Resources. 2018 Taihu Lake Health Status Report; Taihu Lake Basin Administration Bureau, Ministry of Water Resources: Shanghai, China, 2018.
- Fan, X. Research on the Calculation of Transboundary Ecological Compensation in the Taihu Lake Basin Based on the Cost of Pollutant Reduction. Master’s Thesis, Shanghai Normal University, Shanghai, China, 2015. [Google Scholar]
- National Development and Reform Commission Price Department. National Agricultural Product Cost and Benefit Data Collection; China Statistics Press: Beijing, China, 2018.
- Ministry of Housing and Urban-Rural Development of the People’s Republic of China. 2018 Urban and Rural Construction Statistical Yearbook [EB/OL]. 10 May 2019. Available online: http://www.mohurd.gov.cn/xytj/tjzljsxytjgb/jstjnj/ (accessed on 27 March 2020).
- Yan, R.; Gao, J.; Huang, Q.; Zhao, J.; Dong, C.; Chen, X.; Zhang, Z.; Huang, J. Service value of water ecosystem in the polder area of Taihu Lake Basin. J. Ecol. Sci. 2015, 35, 5197–5206. [Google Scholar]
- Chen, S.; Wen, Z. The service function of carbon fixation and oxygen release of plantation vegetation in Guangxi and its value evaluation. J. Agric. For. Econ. Manag. 2016, 15, 557–563. [Google Scholar]
- Zhang, Y.; Feng, S.; Ma, R.; Liu, M.; Qin, B. The spatial distribution of the true light layer depth and the estimation of phytoplankton primary productivity in Taihu Lake in autumn. Lake Sci. 2008, 3, 380–388. [Google Scholar]
- Xiang, C.; Yan, L.; Han, Y.; Wu, Z.; Yang, W. Evaluation of Ecosystem Service Value of Qiandao Lake. J. Appl. Ecol. 2019, 30, 3875–3884. [Google Scholar]
- Xu, Y.; Gao, J.; Huang, J. Evaluation of Service Function Value of Taihu Wetland Ecosystem. Resour. Environ. Yangtze River Basin 2010, 19, 646–652. [Google Scholar]
- Fu, W.; Jiang, H.; Fang, J.; Guan, Y.; Wu, T.; Zhao, H.; Wu, H. Evaluation of the comprehensive benefits of the ecological engineering of the lakeside buffer zone in Zhushan Bay: Taking Zhoutie Town, Yixing City, Jiangsu Province as an example. Bull. Soil Water Conserv. 2017, 37, 268–273. [Google Scholar]
- Kang, T.; Yang, S.; Bu, J.; Chen, J.; Gao, Y. Quantitative Assessment for the Dynamics of the Main Ecosystem Services and their Interactions in the Northwestern Arid Area, China. Sustainability 2020, 12, 803. [Google Scholar] [CrossRef] [Green Version]
- Sun, Z. Statistical Principle; Peking University Press: Beijing, China, 2014. [Google Scholar]
- Zhang, J.; Ren, Z.; Zhang, J. Dynamic evaluation of carbon fixation and oxygen release in land ecosystems in the middle and lower reaches of Fenhe River. Agric. Res. Arid Areas 2018, 36, 242–249. [Google Scholar]
- Zhou, X.; Zhang, N.; Zhang, Y.; Niu, Z.; Liu, L.; Yu, H. A preliminary study on the relationship between the water quality of Taihu Lake and the health of aquatic organisms. Environ. Sci. 2014, 35, 271–278. [Google Scholar]
- Liu, G.; Bao, X.; Wu, T.; Han, S.; Xiao, M.; Yan, S.; Zhou, Q. Study on water environment restoration effect of water hyacinth ecological engineering measures on Zhushan Lake in Taihu Lake. J. Agric. Environ. Sci. 2015, 34, 352–360. [Google Scholar]
- Liu, G.; Han, S.; He, J.; Yan, S.; Zhou, Q. Effect of water hyacinth ecological purification project on benthic community structure change in Zhushan Lake. J. Ecol. Environ. 2014, 23, 1311–1319. [Google Scholar]
- Wang, L.; Tian, Z.; Li, Y.; Chen, J.; Li, L.; Wang, X.; Zhao, Y.; Zheng, B. Study on water environment evolution trend and influencing factors of Dongting Lake in recent 30 years. Environ. Sci. Res. 2020, 33, 1140–1149. [Google Scholar]
- Zhang, M.; Shi, X.; Yang, Z.; Chen, K. Analysis of water quality change trend and suggestions on cyanobacteria prevention and control in Chaohu Lake from 2012 to 2018. Lake Sci. 2020, 32, 11–20. [Google Scholar]
Figure 1.
Map of Taihu Lake (Between 30°55′40″–31°32′58″ N and 119°52′32″–120°36′10″ E) in China.

Figure 2.
Assignment results of the four major pollutants. Note: The color in the figure represents the assignment level of each concentration range. If the concentration belongs to the green range, it is assigned a value of 1, and if the concentration is in the blue range, it is assigned a value of 2, and so on; orange means the assignment is 3, gray means the assignment is 4, and red means the assignment is 5. The blue points on the figure correspond to the concentration value, and the lines are used to show the change in trend of the concentration and assignment.

Figure 3.
Assignment results of aquatic biodiversity. Note: The color in the figure represents the value range of the diversity index. If the diversity index is in the gray range, it is assigned a value of 1, and in the yellow range, it is assigned a value of 2, and so on. Light blue represents the value of 3, green represents the value of 4, and dark blue means the value is 5. The blue dots in the figure correspond to the value of the diversity index, which is connected by a line to show the change trend in the diversity index and assignment.

Figure 4.
Provisioning service value.

Figure 5.
Regulation service value.

Figure 6.
Support service value.

Figure 7.
Cultural Service Value.

Figure 8.
Comparison of the service value of Taihu Lake water ecosystem from 2010 to 2018.


Table 1.
Water quality chemical index classification evaluation standard.
| Category | Evaluation Parameters (≤mg/L) | Assignment | |||
|---|---|---|---|---|---|
| Hypermanganate Index | NH3–N | TP | TN | ||
| I | 2 | 0.15 | 0.01 | 0.2 | 5 |
| II | 3 | 0.5 | 0.025 | 0.5 | 4 |
| III | 4 | 1 | 0.05 | 1 | 3 |
| IV | 10 | 1.5 | 0.1 | 1.5 | 2 |
| V | 15 | 2 | 0.2 | 2 | 1 |
Table 2.
Classification and evaluation standards of aquatic biological indicators.
| Category | Phytoplankton Diversity Index | Zooplankton Diversity Index | Benthic Diversity Index | Assignment |
|---|---|---|---|---|
| I | > 2 | > 3.5 | > 2 | 5 |
| II | 1.5 < ≤ 2 | 2.5 < ≤ 3.5 | 1.5 < ≤ 2 | 4 |
| III | 1 < ≤ 1.5 | 1.5 < ≤ 2.5 | 1 < ≤ 1.5 | 3 |
| IV | 0.5 < ≤ 1 | 0.5 < ≤ 1.5 | 0.5 < ≤ 1 | 2 |
| V | ≤ 0.5 | ≤ 0.5 | ≤ 0.5 | 1 |
Table 3.
Comprehensive index and grading evaluation standard of water ecological quality.
| Category | WQI | Water Ecological Quality Status |
|---|---|---|
| I | 4 < WQI ≤ 5 | Good |
| II | 3 < WQI ≤ 4 | Common |
| III | 2 < WQI ≤ 3 | lightly polluted |
| IV | 1 < WQI ≤ 2 | moderately polluted |
| V | 0 < WQI ≤ 1 | heavily polluted |
Table 4.
The evaluation index system and method of Taihu Lake’s water ecosystem service value.
| Ecosystem Service Categories | Services | Indicators | Evaluation Method | Data Sources |
|---|---|---|---|---|
| Provisioning service | Water supply | Industrial water value | Market value method: regarding the ecosystem as a production factor, water resources, aquatic products, and shipping are all products and services provided by the ecosystem with market prices, so the respective market prices are used for accounting. | [44] |
| Agricultural water value | ||||
| Domestic water value | ||||
| Provide aquatic products | Total fishery output value | [46] | ||
| Shipping function | Cargo turnover value | [47,48] | ||
| Passenger turnover value | ||||
| Regulation service | Regulate the atmospheric CO2/O2 production | Carbon sequestration value | Afforestation cost method: the cost of afforestation per unit of carbon sequestration and the annual carbon sequestration of aquatic ecosystems in Taihu Lake are necessary. | [49,50] |
| Oxygen release value | Alternative engineering method: industrial unit oxygen production cost is needed. | |||
| Water purification | In and out of the lake hypermanganate index cut value | Alternative engineering method: the cost of plant treatment of pollutants and the amount of pollutants handled are the objects. | [44,51] | |
| Value reduction of NH3–N in and out of the lake | ||||
| TP cut value in and out of the lake | ||||
| TN cut value in and out of the lake | ||||
| Surface water storage | Surface water storage value | Shadow price method: need unit storage cost and storage capacity | ||
| Support service | Soil conservation | Maintain soil value | Equivalence factor method: refer to Xie Gaodi’s research | [45] |
| Protect biodiversity | Biodiversity conservation value | [52] | ||
| Cultural service | Travel | Tourism and leisure value | Price substitution method: replace with operating profit of Taihu Lake tourist attraction | [53] |
| Research and education | Research and education value | Outcome reference method: refer to Xie Gaodi and Costanza’s research | [1,45] |
Table 5.
Evaluation results of water ecological quality.
| Years | Assignment of Water Quality Chemical Indicators | Assignment of Aquatic Biological Indicators | WQI | Water Ecological Quality Status |
|---|---|---|---|---|
| 2010 | 0 | 3 | 1.5 | Moderately polluted |
| 2014 | 1 | 3 | 2 | Moderately polluted |
| 2018 | 1 | 4 | 2.5 | Light pollution |
Table 6.
Water supply value of Taihu Lake during 2010–2018.
| Water Type | Water Consumption (100 Million m3) | Water Price (Yuan/t) | ||
|---|---|---|---|---|
| 2010 | 2014 | 2018 | ||
| Industrial water | 212.5 | 206.6 | 212.6 | 4.1 |
| Agricultural irrigation water | 76.6 | 67.8 | 62.8 | 0.6 |
| Residential water | 29.2 | 30.9 | 32.5 | 2.8 |
| Water supply value (100 million yuan) | 998.97 | 974.26 | 998.72 | — |
Note: Water consumption data comes from the 2010–2018 “Taihu Lake Basin and Southeastern Rivers Water Resources Bulletin”.
Table 7.
Value of aquatic products provided by Taihu Lake during 2010–2018.
| Series | 2010 | 2014 | 2018 | Administrative Area (km2) |
|---|---|---|---|---|
| Suzhou | 85.39 | 122.64 | 134.41 | 8488.42 |
| Changzhou | 42.37 | 64.73 | 81.02 | 4372.15 |
| Wuxi | 27.94 | 36.93 | 35.57 | 4627.46 |
| Huzhou | 29.72 | 43.68 | 65.56 | 5820 |
| Total fishery output value (100 million yuan) | 185.43 | 267.99 | 316.56 | —— |
| Fishery output value per unit area (100 million yuan/km2) | 0.008 | 0.011 | 0.014 | |
| Provide aquatic product service value (100 million yuan) | 18.60 | 26.88 | 31.76 |
Table 8.
Taihu Lake shipping value during 2010–2018.
| Series | 2010 | 2014 | 2018 | Price [48] |
|---|---|---|---|---|
| Cargo turnover (100 million-ton kilometers) | 4095.7 | 4081.78 | 6122 | 0.06 Yuan/ton·km |
| Passenger turnover (100 million person-kilometers) | 1.5 | 3.03 | 3.5 | 0.24 Yuan/person·km |
| Shipping value in Jiangsu Province (100 million yuan) | 246.1 | 245.63 | 368.16 | — |
| Shipping value of Taihu Lake (100 million yuan) | 61.53 | 61.41 | 92.04 |
Table 9.
Taihu Lake regulating air service value during 2010–2018.
| Chlorophyll a Concentration (mg/m3) | pp (mg C/m2 d) | Adjust the Atmospheric Value (100 Million Yuan) | |
|---|---|---|---|
| 2010 | 19.2 | 885.684 | 9.09 |
| 2014 | 28.75 | 1215.35 | 12.48 |
| 2018 | 31.5 | 1310.28 | 13.45 |
Note: The chlorophyll a concentration value data come from the literature.
Table 10.
The content of pollutants entering and leaving Taihu Lake in 2010–2018.
| Unit: 10,000 tons | |||||||||
|---|---|---|---|---|---|---|---|---|---|
| Water Purification Value (100 Million Yuan) | 2010 | 2014 | 2018 | ||||||
| 10.66 | 8.56 | 6.69 | |||||||
| Into the Lake | Out of the Lake | Reduction | Into the Lake | Out of the Lake | Reduction | Into the Lake | Out of the Lake | Reduction | |
| hypermanganese acid index | 6.48 | 4.93 | 1.55 | 5.56 | 4.03 | 1.53 | 5.26 | 4.20 | 1.06 |
| NH3–N | 1.83 | 0.2 | 1.63 | 1.19 | 0.1 | 1.09 | 0.75 | 0.14 | 0.61 |
| TP | 0.28 | 0.07 | 0.21 | 0.17 | 0.06 | 0.12 | 0.19 | 0.06 | 0.13 |
| TN | 5.64 | 2.54 | 3.1 | 4.2 | 1.38 | 2.82 | 3.96 | 1.61 | 2.35 |
Table 11.
The value of maintaining biodiversity calculated by planting area and average net profit per unit area of the three crops (rice, wheat, and rape).
Table 11.
The value of maintaining biodiversity calculated by planting area and average net profit per unit area of the three crops (rice, wheat, and rape).
| Years | Series | Rice | Wheat | Rape |
|---|---|---|---|---|
| 2010 | Planting area (thousand hectares) | 233.18 | 180.81 | 37.54 |
| Net profit per unit area (yuan/mu) | 309.82 | 132.17 | 8.59 | |
| Value (100 million yuan) | 6.22 | |||
| 2014 | Planting area (thousand hectares) | 208.62 | 176.31 | 26.67 |
| Net profit per unit area (yuan/mu) | 204.83 | 87.83 | −161.74 | |
| Value (100 million yuan) | 3.81 | |||
| 2018 | Planting area (thousand hectares) | 167.59 | 133.47 | 9.19 |
| Net profit per unit area (yuan/mu) | 65.89 | −159.41 | −192.81 | |
| Value (100 million yuan) | −1.13 | |||
Table 12.
Tourism and leisure value of Taihu Lake national tourist attractions.
| Unit: 100 Million Yuan | |||
|---|---|---|---|
| Years | Operating Income | Operating Expenses | Tourism and Leisure Value |
| 2010 | 9.43 | 1.79 | 7.63 |
| 2014 | 13.61 | 7.68 | 5.92 |
| 2018 | 17.24 | 2.47 | 14.77 |
Table 13.
Taihu Lake water ecosystem service value comparison during 2010–2014.
| Unit: 100 Million Yuan | ||||||||||
|---|---|---|---|---|---|---|---|---|---|---|
| Ecosystem Service Category | Service | Years | ||||||||
| 2010 | 2014 | 2018 | ||||||||
| Value | Proportion | Value | Value | Proportion | Value | Value | Proportion | Value | ||
| Provision service | Water supply | 1079.1 | 93.52% | 998.97 | 1062.55 | 93.77% | 974.26 | 1122.52 | 93.57% | 998.72 |
| Provide aquatic products | 18.6 | 26.88 | 31.76 | |||||||
| Shipping function | 61.53 | 61.41 | 92.04 | |||||||
| Regulation service | Regulate the atmospheric CO2/O2 production | 51.24 | 4.44% | 9.09 | 52.66 | 4.65% | 12.48 | 56.92 | 4.74% | 13.45 |
| Water purification | 10.66 | 8.56 | 6.69 | |||||||
| Surface water storage | 31.49 | 31.62 | 36.78 | |||||||
| Support service | Soil conservation | 8.54 | 0.74% | 2.32 | 5.24 | 0.46% | 1.43 | −1.55 | −0.13% | −0.42 |
| Protect biodiversity | 6.22 | 3.81 | −1.13 | |||||||
| Cultural service | Tourism and leisure | 15.05 | 1.30% | 7.63 | 12.67 | 1.12% | 5.92 | 21.73 | 1.81% | 14.77 |
| Research and education | 7.42 | 6.75 | 6.96 | |||||||
| Function total value | 1153.93 | 1133.12 | 1199.6 | |||||||
Table 14.
Pearson correlation between Water Environment Qualities Index (WQI) and water ecosystem service value indicators.
Table 14.
Pearson correlation between Water Environment Qualities Index (WQI) and water ecosystem service value indicators.
| Index | WQI | Water Supply | Provide Aquatic | Shipping Function | Regulate the Atmospheric CO2/O2 Production | Water Purification | Surface Water Storage | Soil Conservation | Protect Biodiversity | Tourism and Leisure | Research and Education |
|---|---|---|---|---|---|---|---|---|---|---|---|
| WQI | 1000 | −0.009 | 0.989 | 0.864 | 0.952 | −0.999 * | 0.877 | −0.980 | −0.981 | 0.760 | −0.671 |
Note: * At the 0.05 level (two-tailed), the correlation is significant.
Publisher’s Note: MDPI stays neutral with regard to jurisdictional claims in published maps and institutional affiliations. |
© 2021 by the authors. Licensee MDPI, Basel, Switzerland. This article is an open access article distributed under the terms and conditions of the Creative Commons Attribution (CC BY) license (http://creativecommons.org/licenses/by/4.0/).
Share and Cite
MDPI and ACS Style
Zhao, Q.; Wang, Q. Water Ecosystem Service Quality Evaluation and Value Assessment of Taihu Lake in China. Water 2021, 13, 618. https://doi.org/10.3390/w13050618
AMA Style
Zhao Q, Wang Q. Water Ecosystem Service Quality Evaluation and Value Assessment of Taihu Lake in China. Water. 2021; 13(5):618. https://doi.org/10.3390/w13050618
Chicago/Turabian StyleZhao, Qingjian, and Qiuyan Wang. 2021. "Water Ecosystem Service Quality Evaluation and Value Assessment of Taihu Lake in China" Water 13, no. 5: 618. https://doi.org/10.3390/w13050618
Note that from the first issue of 2016, this journal uses article numbers instead of page numbers. See further details here.