
Riverbed Protection Downstream of an Undersized Stilling Basin by Means of Antifer Artificial Blocks
by
 , , , and
Myrta Castellino
1 ,
,
Monica Moroni
1,*,
Cosmo Cimorelli
1,
Marcello Di Risio
2 and
Paolo De Girolamo
1 1
Dipartimento di Ingegneria Civile Edile e Ambientale, Sapienza Università di Roma, Via Eudossiana 18, 00184 Rome, Italy
2
Department of Civil, Construction-Architectural and Environmental Engineering (DICEAA)-Environmental and Maritime Hydraulic Laboratory (LIam), University of L’Aquila, P.le Pontieri 1, Monteluco di Roio, 67100 L’Aquila, Italy
*
Author to whom correspondence should be addressed.
Water 2021, 13(5), 619; https://doi.org/10.3390/w13050619
Submission received: 29 November 2020
/
Revised: 18 February 2021
/
Accepted: 23 February 2021
/
Published: 27 February 2021
(This article belongs to the Special Issue Planning and Management of Hydraulic Infrastructure)
Abstract
:Erosion at either dam or spillway foundations, destabilization in riverbanks, and damage in the natural environment located downstream of either dams or spillways represent crucial elements to be taken into account in the risk assessment of hydraulic structures. One of the main problems is related to the scouring that water flow may induce at the downstream boundary of spillways. This issue is exacerbated in the case of undersized stilling basins, i.e., when a significant level of energy migrates downstream by acting on unprotected natural riverbed. If the scour depths are large enough, the structural stability of the infrastructure will be threatened. This paper aims to illustrate an innovative technical solution suitable to protect the riverbed located just downstream of stilling basins by means of artificial Antifer blocks. These kinds of artificial blocks are widely used in the field of maritime construction, but in the literature, there are no theoretical formulations for their design within the frame of river engineering. In order to demonstrate the efficacy of the proposed technical solution, it is applied to a real case investigated by means of physical modeling. The riverbed located just downstream of the stilling basin of Liscione Dam (Campobasso, Italy) experienced scour due to high discharges during and after extreme rain events. Different protection strategies have been tested to assess the influence of different placement methods and packing densities on the stability of Antifer block armor layers. Experimental findings reveal that regular placements behave more stable than irregular placements with a similar packing density.
1. Introduction
Hydraulic risk is one of the issues that has most undermined the safety of populations and infrastructures over the years. Risk analysis relies on probabilistic studies carried out through a set of assessment and calculation methodologies (e.g., [1]). Basically, it is employed to quantitatively estimate the possibility of damage to the socio-economic fabric and public health of a specific area because of the occurrence of hazardous events (e.g., [2]). In this context, the investigation of the safety conditions of large hydraulic infrastructures such as dams is of great interest for safeguarding territories and assessing their risk level. This is especially true due to the occurrence of extreme events caused by climatic change [3,4], which motivates the reaudit of hydrological basins for various purposes, such as to verify the suitability of the spillways and outlets of existing dams to withstand any increase in the design flow.
One of the main problems is related to the scouring that water flow may induce at the downstream boundary of spillways. This paper aims to illustrate an innovative technical solution suitable to dissipate excess flow energy at the outlet of undersized stilling basins. The solution consists of protecting the riverbed located just downstream of stilling basins by means of artificial Antifer blocks, widely used in the field of maritime construction. Since in the literature there are no theoretical formulations for the design of such artificial blocks within the frame of river engineering, the originality of the paper consists in the method used to define the mass of stable artificial blocks. It has to be stressed that the proposed technique can be used as an alternative to the modification of the configuration of existing stilling basins that needs to be coupled with diversion works during the deployment. In fact, a particular advantage of the proposed solution lies in its simplicity and speed of execution since it is based on the use of precast artificial blocks that allow having large mass protection elements. The results of this study are then intended to be useful for the design of riverbed protection when natural rocks cannot be employed due to the required large mass and artificial elements are an appropriate alternative to protect riverbeds from scour.
In order to demonstrate the efficacy of the proposed technical solution, it is then applied to a real case (e.g., the Liscione Dam, Italy) investigated by means of physical modeling. Indeed, in this framework, physical models, i.e., “physical” reproductions of a scaled artifact (i.e., geometric similarity) and the phenomena that occur in it (i.e., cinematic and dynamic similarities), coupled with suitable instruments and methodologies, are key tools for assessing the current and future safety conditions of dam structures, as well as of receiving riverbeds which require proper protection strategies. Basically, laboratory measurements, also coupled to numerical models, can be very useful for existing dams, which may need either maintenance or upgrading works, such as in case of flood discharge increments or for new constructions [5].
The paper is structured as follows. Section 2 details the problem tackled by the study and describes the main features of the Liscione Dam, the investigated case study to test the efficacy of the proposed solution to protect riverbeds from scouring. Section 3 describes the experimental set-up by paying attention to the scale effects. Section 4 aims to detail the experimental method used to estimate the scour pattern. Experimental scenarios are also reported in this section. Section 5 illustrates the main results of the experimental investigation to highlight the effectiveness of the proposed solution. Concluding remarks (Section 6) close the paper.
2. Problem Definition and the Case Study of Liscione Dam
Undersized stilling basins may be ineffective in dissipating energy, which in turn may affect the stability of the downstream unprotected riverbed. Scour depths may be so high to threaten the structural stability of the stilling basin itself and sometimes also of spillways or dams.
Practical difficulties arise when modification of the geometry of existing (undersized) stilling basins are selected as a corrective measure to solve the scour issue. Indeed, diversion works are needed in this case. Alternative measures rely on the protection of the downstream riverbed. In this case, the protection system also has to fulfill the requirement of being able to be deployed quickly and possibly in phases, using summer months during which water discharge is likely to be low, hence by making it possible to work safely in the downstream river.
Jet-like flow may occur due to the configuration of the stilling basin enhancing the scour phenomena at the downstream riverbed. Then, conventional types of riverbed protection systems (i.e., gabions, small concrete blocks, riprap, etc.) do not work properly. Indeed, such a kind of protection may experience severe damage during flood event, even if the water discharge is lower than the design one, due to the singularity of the flow related to the jet-like flow. Based on these observations, the use of large (artificial) boulders is proposed herein. The main idea is to borrow the technical solutions used in the maritime field. In particular, arrangement of Antifer-type blocks [6] is suggested (and tested as well) as a protection system downstream of dams. Antifer-type blocks are used in the maritime constructions field to deploy the armor layers of rubble mound breakwaters subjected to breaking wave conditions [7]. The block has four grooves and a slightly tapered shape, so that it can be easily released from the mold. The hydraulic action of the grooves and the improved friction caused by them noticeably improve the stability of protective layers built with Antifer blocks compared to plain cubes [8]. This kind of protection is characterized by a high porosity (about 40%–50%) which contributes to the flow energy dissipation. This particular type of artificial block is chosen for its structural resistance and the reduced technical difficulties related to its construction and installation. Non-reinforced concrete with a density between 2.3 and 2.4 t/m3 and a compression resistance within a range of 20–25 MPa are recommended for Antifer blocks [9].
For the calculation of the (stable) mass of the Antifer block, the Hudson formula (e.g., [10]) is used to estimate the ratio of the Antifer and natural blocks weights:
where:
- and are the artificial (Antifer) and natural element weights, respectively;
- and are the artificial and natural elements specific weights, respectively;
- is water specific weight;
- and are the stability coefficients of natural and artificial boulders.
The main assumption of Equation (1) is that the stability number [11] usually employed in marine construction can be substituted by the well-known Izbash number [12]. In this case, the wave load is replaced by the hydrodynamic load related to the fluid flow responsible for potential displacements of the blocks. On the other hand, it is usually accepted that for the design of armor stones that undergo current loads [13,14,15,16], the general criterion based on shear stress (i.e., based on the Shield number conservation) can be applied [13]. Basically, the significant wave height may be conceptually replaced by u2/2g (where u is a characteristic velocity, e.g., the mean flow velocity or the velocity at the bed) and the stability number can be extended also to the case at hand.
The design of (stable) Antifer blocks can be then achieved by estimating the natural rocks (stable) mass by using standard methods (e.g., [13,14,15,16]) and then by estimating the ratio by criterion (1), hence by estimating the (stable) mass of the equivalent Antifer block. It should be noticed that the increased stability of the Antifer blocks with respect to natural rocks is taken into account by using an increased value of the stability coefficient (i.e., and , [10]). The difference of material density (i.e., calcareous mineral for natural rocks and concrete for Antifer blocks) is considered as well.
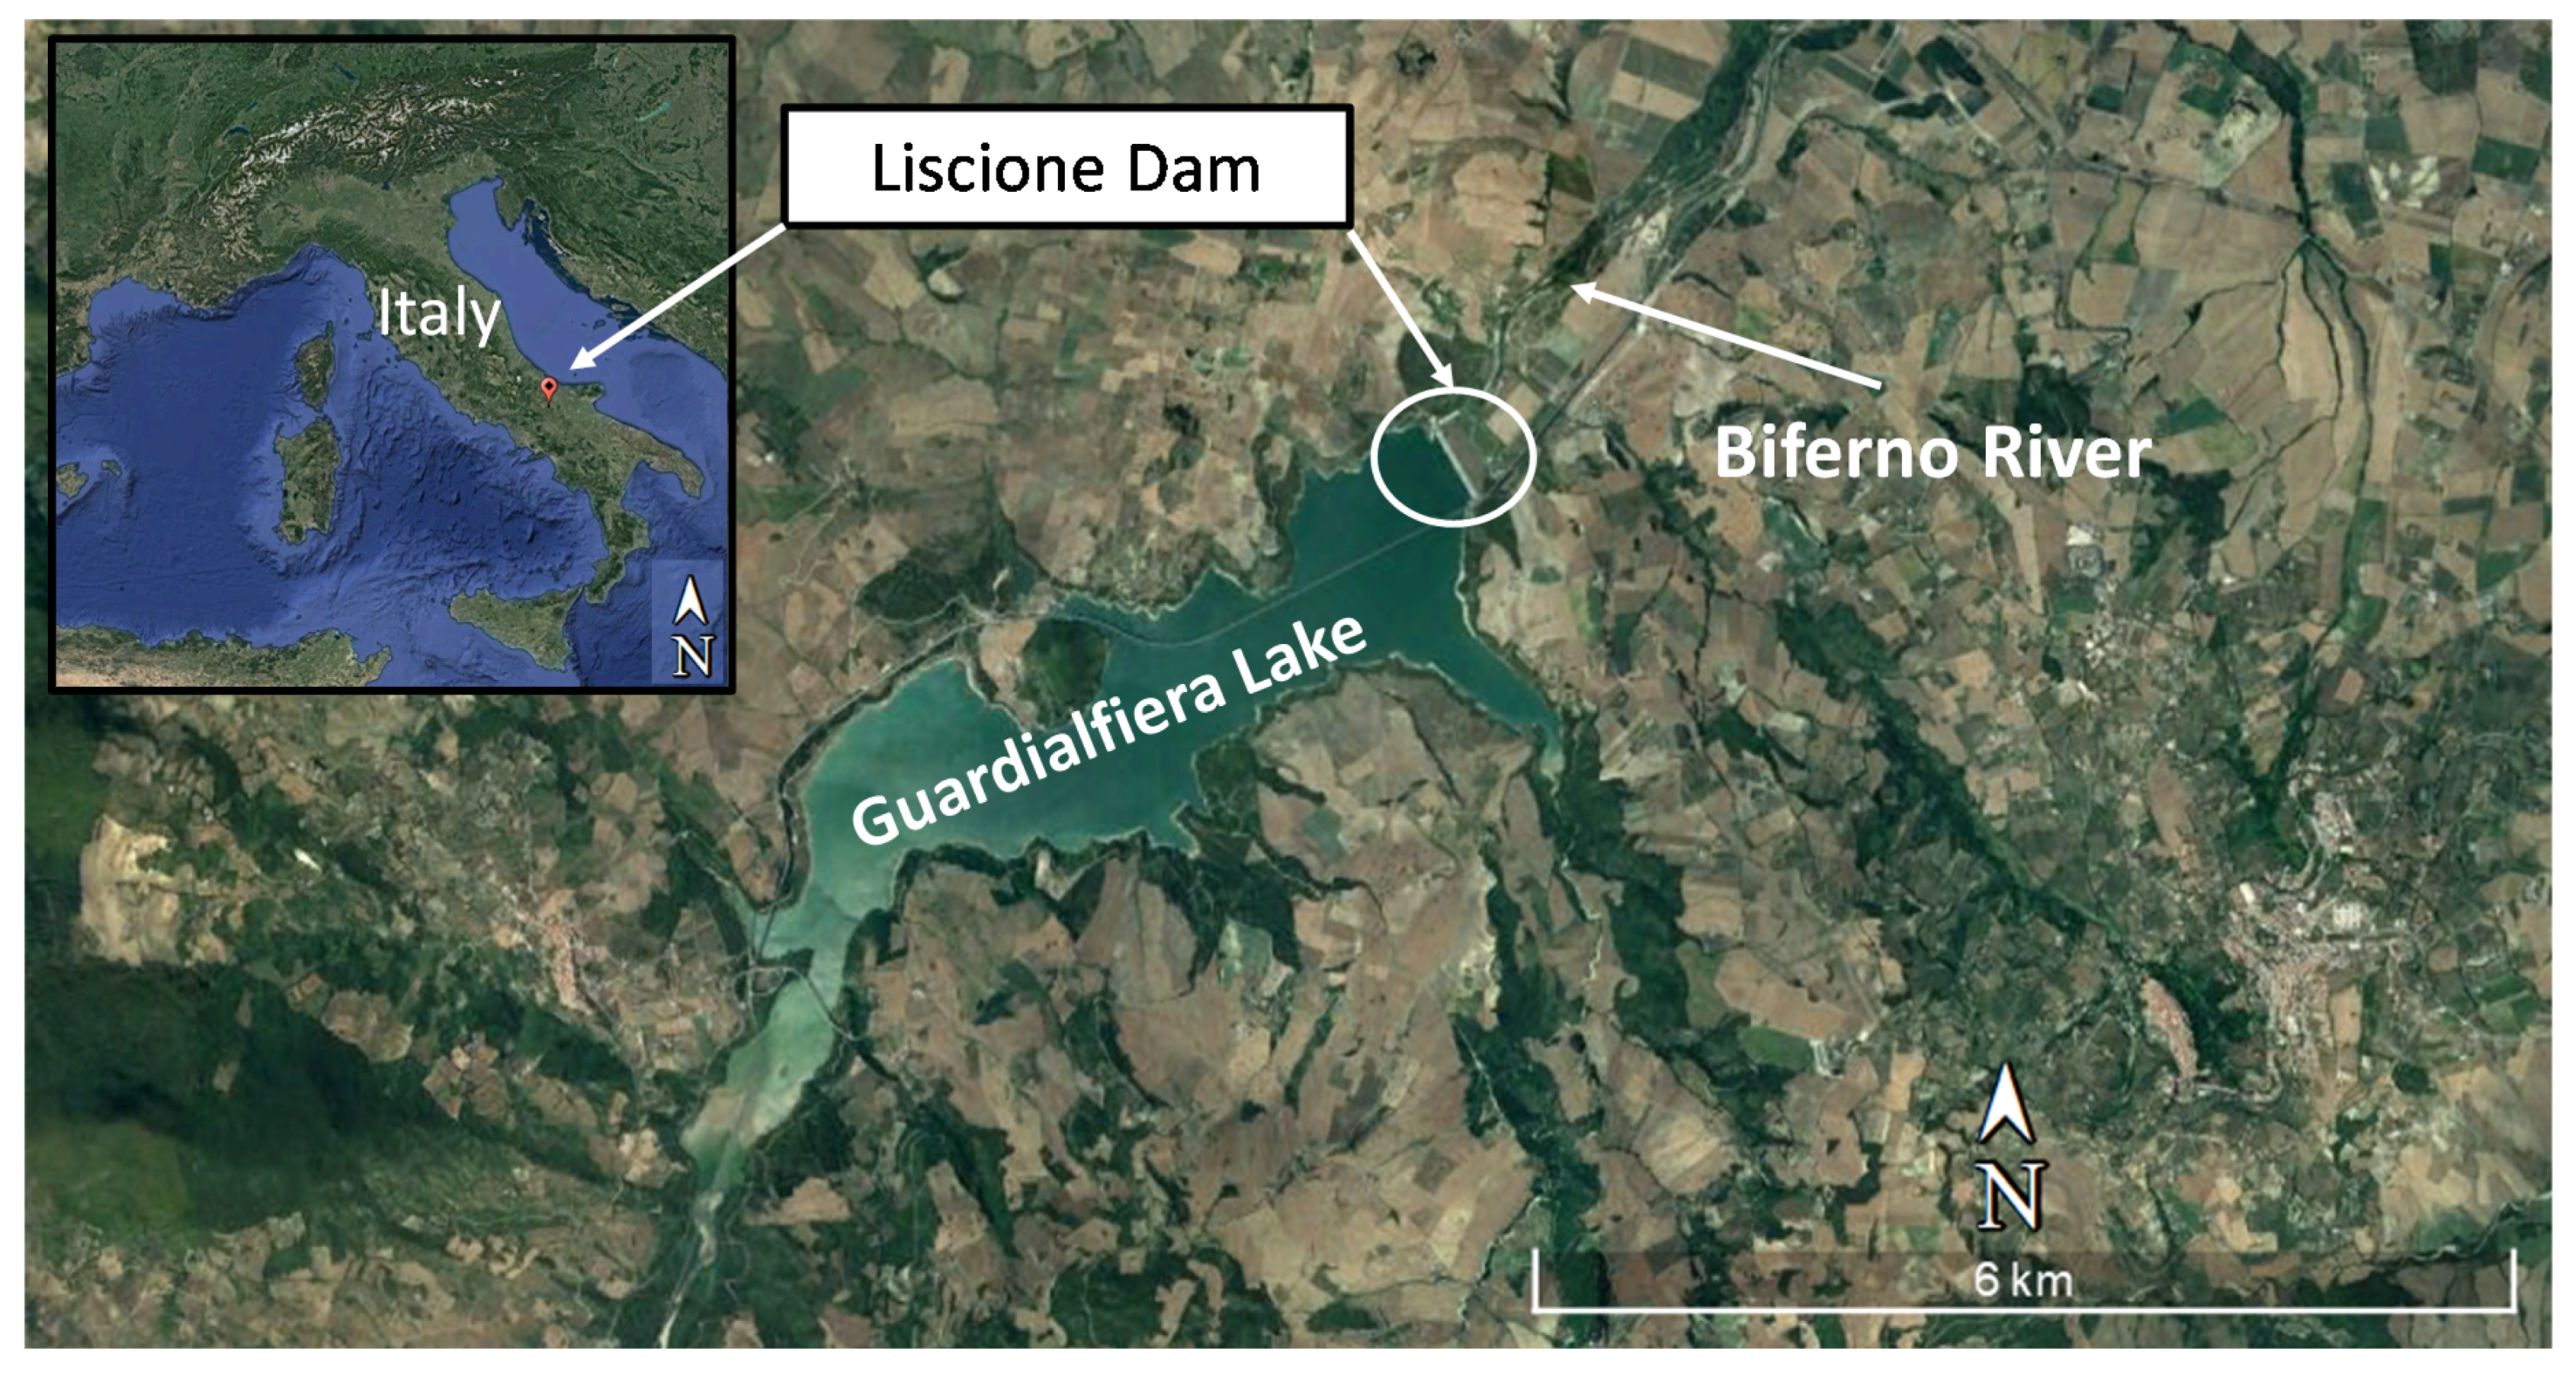
The proposed protection technique is tested in a real case configuration, i.e., the spillway of Liscione dam. It was built between 1967 and 1973 and it is located about 45 km NE from Campobasso (central Italy) in the locality of Ponte Liscione on the Biferno river (Figure 1). The purpose of the infrastructure was to create an artificial reservoir, called Lake Guardialfiera, for water storage and flood retention. The dam is an embankment of loose and permeable materials (river floods), obtained from the riverbed of the Biferno river, with the sealing of the upstream face made of bitumen conglomerate (Figure 1). The dam crest is located at 131.5 m a.s.l., with the maximum reservoir water level set at 129.0 m a.s.l. The maximum surface area of the reservoir is 7.45 km2 while the total volume amounts to 173 million m3.
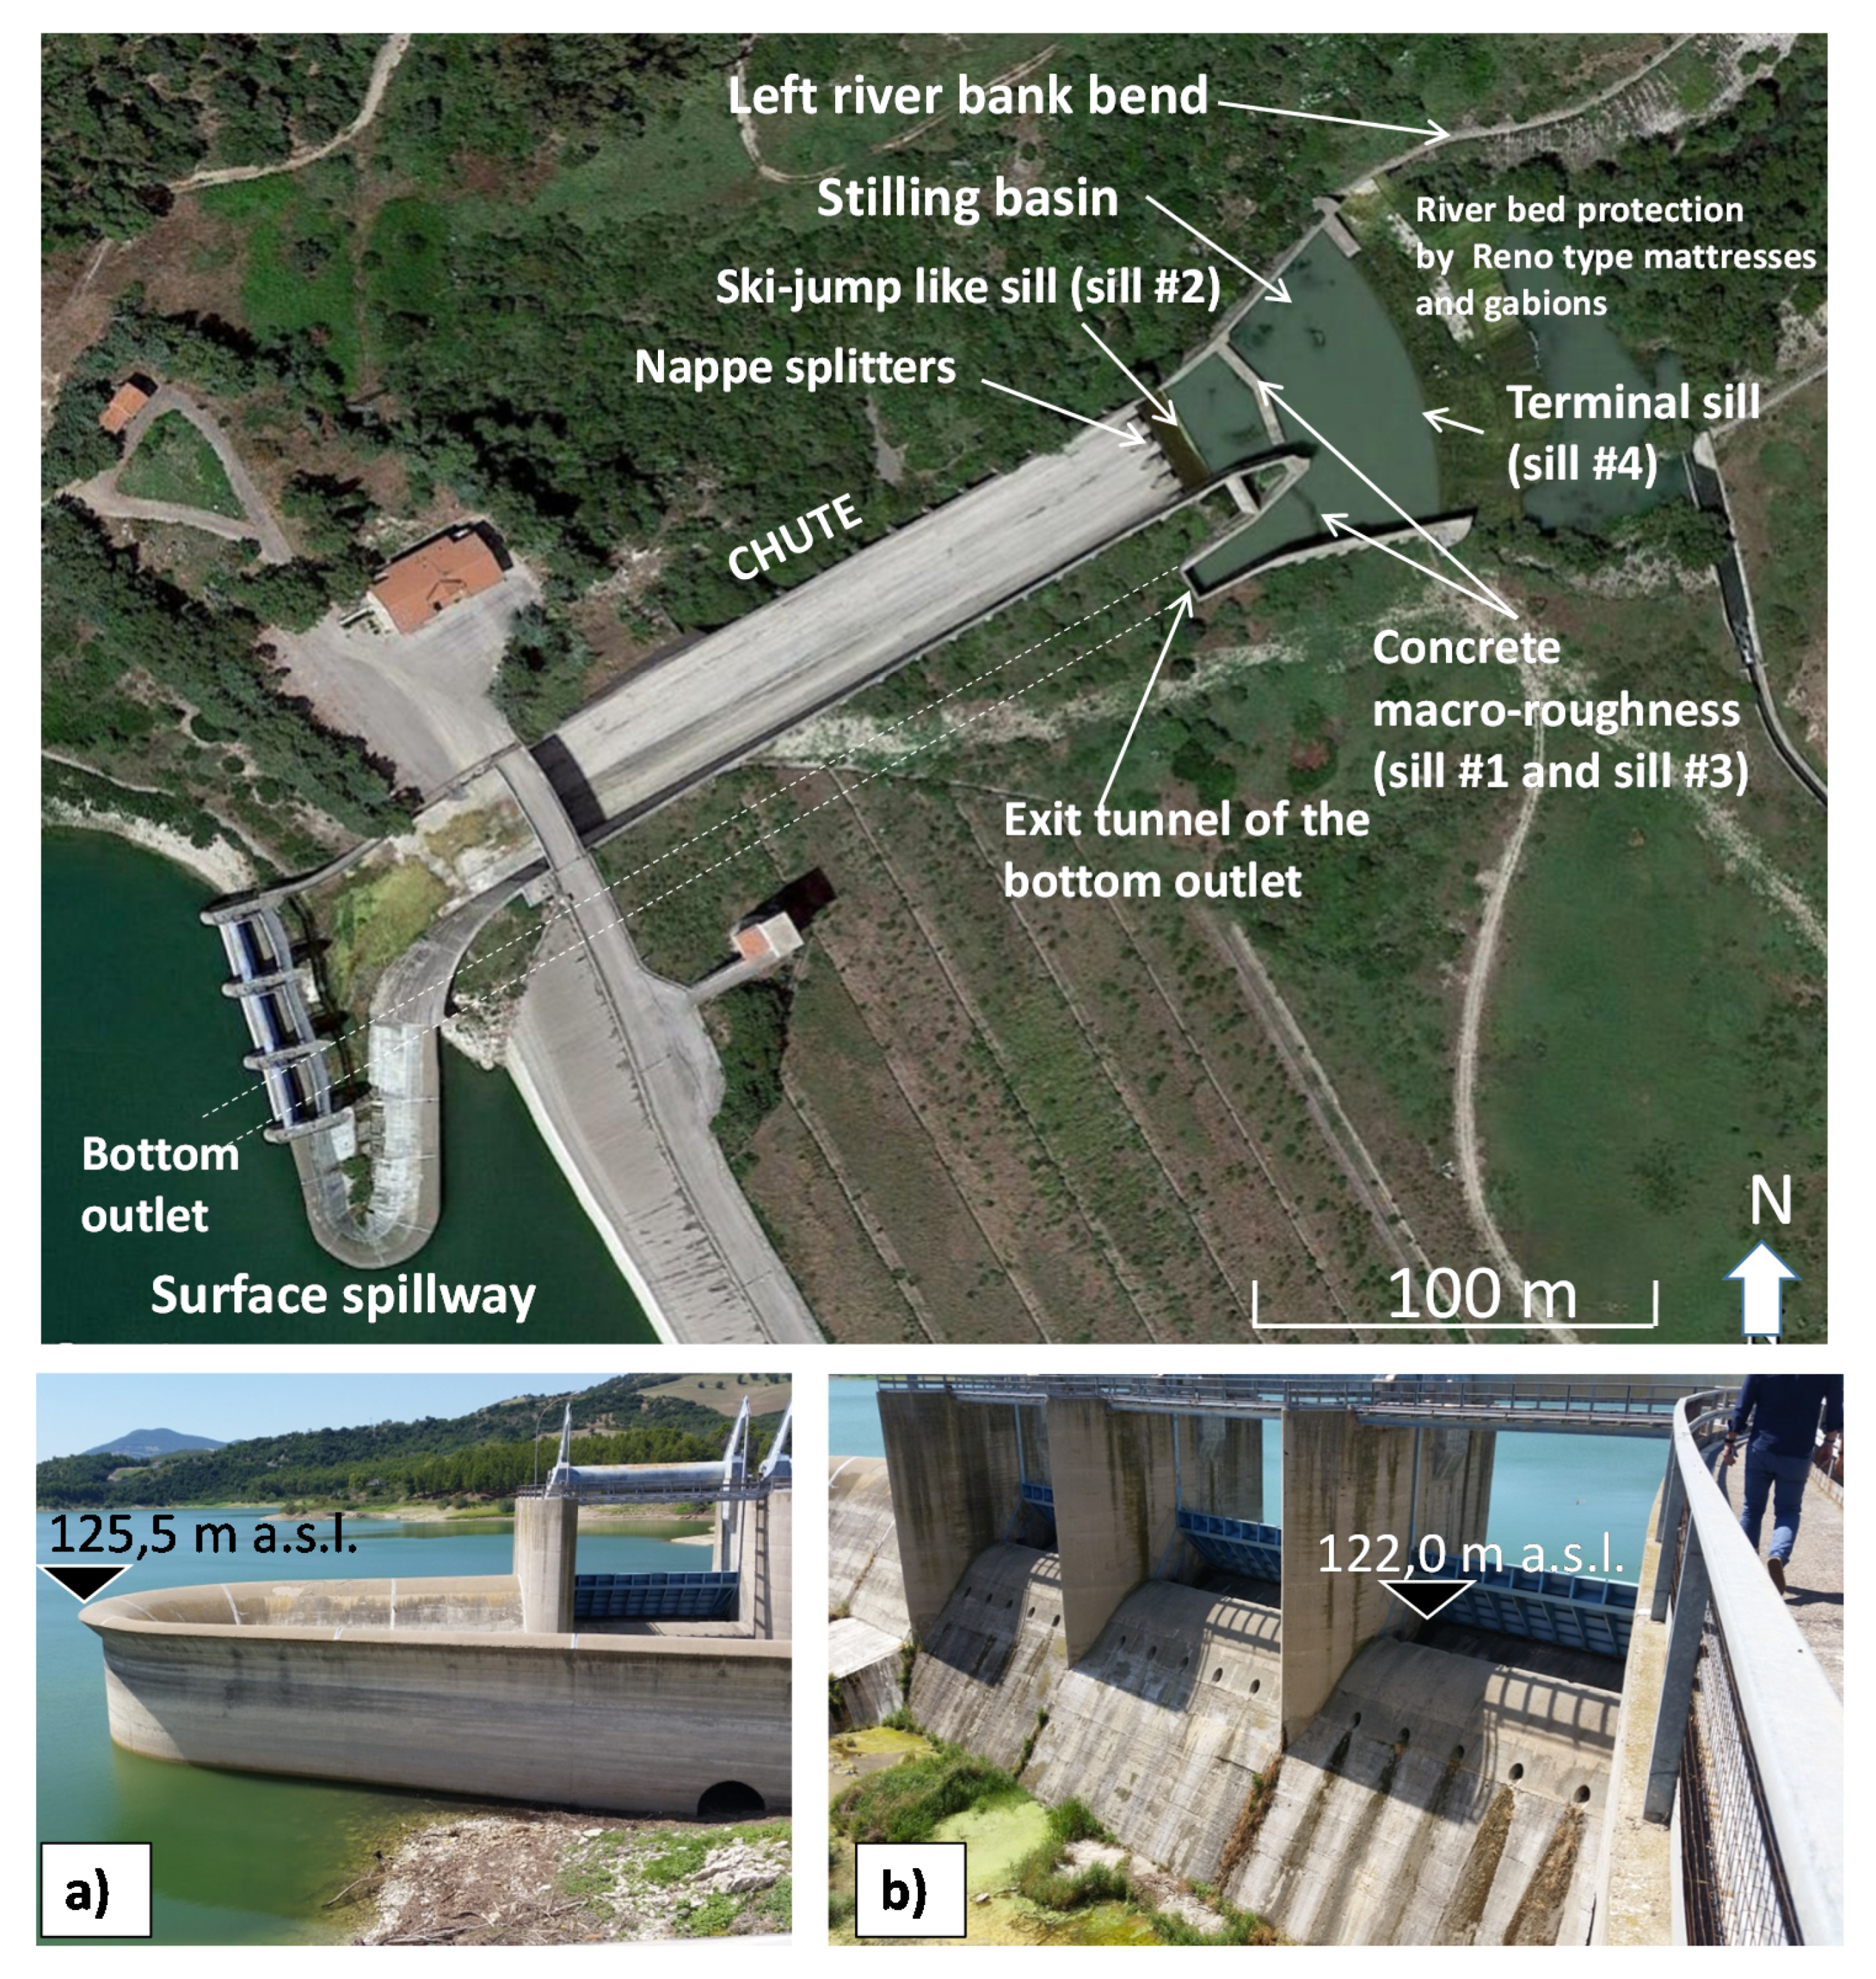
For flood release, the dam features a weir followed by a spillway conveying flood discharges into the stilling basin and the downstream river (Figure 2).
The surface spillway and the bottom outlet are used to prevent overtopping of the dam. Both of them convey water into the same stilling basin. The bottom outlet consists of a tunnel with an internal diameter of 7.2 m, equipped with two planar sliding gates 3.8 m wide and 4.7 m high.
The surface spillway consists of two overflow structures:
- an ungated ogee weir, 92 m long and with crest elevation at 125.5 m a.s.l. (Figure 2a);
- a gated weir with three 13 m wide openings, equipped with automatic flap gates with counterweights pivoted at the sill (Figure 2b); the lower and upper edges of the gates are placed at 122.0 m a.s.l. and 125.5 m a.s.l., respectively. The gate configurations are (1) open, reaching the elevation of 122.0 m a.s.l., or (2) closed, sharing the same elevation as the ogee weir. The gate drop takes place automatically and progressively as soon as the reservoir water level reaches an elevation of 125.5 m a.s.l.
The stilling basin features various components that aim to reduce the kinetic energy of the flood discharge (see Figure 2 and Figure 3):
- a macro-roughness concrete element at the downstream boundary of the bottom outlet (sill#1);
- nappe splitters, placed at the end of the chute;
- ski-jump like sill at the end of the chute (sill#2);
- a macro-roughness concrete element at the downstream boundary of the chute (sill#3);
- a stilling basin terminal sill (sill#4), smoothed towards the valley and raised at the left end by 2.8 m to avoid erosion phenomena of the left bank which could easily affect its stability.
Downstream of the stilling basin, the central area of the riverbed is protected with 0.3 m thick Reno type mattresses, delimited on the right and left banks by 1.0 m high gabions. This protection is deployed in the first 500 m of the riverbed downstream of the stilling basin, and it is followed by the natural waterway. It is worth to be noticed that the inspection of the upper picture in Figure 2 reveals significant vegetation in the riverbed that should be removed to ensure conveyance capacity of the downstream river.
The Liscione dam was affected between 24 and 25 January 2003 by a flood due to a serious rainfall event that caused various damages. The two weather stations the dam is equipped with, made it possible to quantify the rain intensity of the event and the inflow and outflow water discharges. The latter, equal to 830.0 m3/s, caused the maximum allowed water elevation into the reservoir, i.e., 125.5 m a.s.l., to be overcome. A return period between 30 and 50 years was associated with the discharge value. The event was the heaviest ever during the lifetime of the Liscione Dam so far. The event caused extensive damage both upstream and downstream of the stilling basin: failure and breakage of some concrete elements at the end of the chute on the right side of the river; damage and removal of gabions on both the left and right banks and deletion of the bottom protection in the central area of the riverbed where scour depth of the riverbed was found in the order of a few meters.
The damage suffered by the spillway due to the flood event motivated an in-depth analysis of the problem. Then, physical modeling was selected as the most appropriate tool to guide the designer in the definition of the works needed to ensure the stability of the riverbed just downstream of the spillway. As detailed in the following, the first experimental tests performed confirmed the riverbed scour observed at the prototype scale. It was also observed that the ski-jump like sill (sill#2, Figure 3) causing an initial jump makes the energy dissipation of sill#3 inefficient, reducing the ability of the tank to dissipate energy. The reduction in the dissipative efficiency of the basin was experimentally proven by comparing riverbed scour in the presence and absence of sill#3. In fact, in the absence of sill#3 the scour was observed to be lower if compared to the case with sill#3. Nevertheless, the jet, although reduced, was observed to be still present. It was therefore concluded that even if sill#3 was eliminated, the dissipation tank was undersized for the design water discharge. Then, the proposed protection of the downstream riverbed with Antifer blocks has been experimentally tested.
3. Experimental Set-Up and Scale Effects
To test the efficacy of the proposed protection system against scour phenomena, a detailed study of the hydraulic and kinematic phenomena is needed. Physical modeling is identified as a valuable tool to conduct this study [17]. However, although physical modeling has numerous advantages, it inevitably leads to model and scale effects, since not all physical conditions present in nature are reproducible on a laboratory scale. Furthermore geometric, kinematic, and dynamic similarities are impossible to obtain at the same time [18].
At the Laboratory of Hydraulic and Maritime Constructions of Sapienza University of Rome, a 1:60 scale physical model of the Liscione dam spillways and the downstream riverbed of the Biferno river has been built. The model is scaled according to the Froude number and fully-developed turbulent flow conditions have been reproduced at the model scale (Re > 10,000) [19]. The physical model allows the investigation of key hydrodynamical parameters, such as hydraulic levels, hydraulic jump location, and morphology of the scour pattern at the riverbed downstream of the stilling basin with and without protection achieved by the deployment of Antifer blocks with different packing densities. The ski-jump sill (sill#2) at the foot of the chute has been removed for some tests to evaluate its effects on the scour measured within the riverbed. Indeed, it is trivial to observe that the downstream scour pattern may be heavily influenced by the energy dissipation occurring in the stilling basin.
The evolution of the riverbed bottom is intimately related to both the hydrodynamics of the flow and the morphodynamical features of the riverbed material. Generally speaking, though the estimation of the characteristic grain size of the disgregated bottom is reliable enough, the scour observed at the model scale is expected to be higher than that occurring at the prototype scale. Indeed, the experimental reproduction of the scour relies on the assumption that the bottom is disgregated (related to the morphodynamics). Several empirical formulae are available to estimate the maximum scour depth (for a comprehensive review refer to [20]). There are differences between the different formulas, and they cannot be generalized. Moreover, semi-empirical formulations that consider the erosive potential of the material have been developed so far. The Comprehensive Scour Model [21] represents an attempt to reproduce the physical-mechanical processes involved in the scour formation taking into account the three phases, i.e., water, solid (rocky bottom), and air. However, the dissipation mechanisms in the stilling basin are not well known and tests on physical models are still required to observe such a complex phenomenon. Furthermore, the air entrainment of the impinging jet at the model scale is quite lower than at prototype conditions (related to the hydrodynamics). As outlined by many research studies (e.g., [22]) ski jump jets at prototype scale show a blackwater core with aerated fringes, and they are aerated at the impact location. Air entrainment is due to the interactions between entrained air bubbles and turbulent structures [23]. The air transport in physical models is known to be affected by scale effects because the flow turbulence (related to the turbulent structures and then to the Reynolds number) is underestimated, while surface tension (related to the air bubbles and then to the Weber number) is overestimated [21].
A further aspect to be accounted for when dealing with physical modeling is related to the roughness reproduced at the model scale. It is well known that hydraulic roughness at model scale can be hardly reproduced (i.e., [24,25,26]) if the Reynolds number is not high enough (directly related to the model-to-prototype length scale) and if the reproduced surfaces are not smooth enough (e.g., [19]). In order to solve, at least partially, this issue thin films (i.e., spray paint or putty) are usually applied directly to the model surfaces exposed to the water flow. It can be observed that a perfect similarity is not possible, then a preliminary experimental phase aimed to calibrate/validate the observation is usually carried out (see Section 5).
In order to select the correct scaling for the riverbed material with respect to the prototype condition, a discussion on sediment transport mechanisms along with the related scale effects is needed. Indeed, hydrodynamic forcing can move sediments along the bed (bedload) or can resuspend sediment particles into the water column that are then advected downstream by the fluid flow (suspended load). A mixed sediment transport regime can occur when bedload and suspended load coexist. It is crucial to reproduce the same sediment transport mechanism occurring at the prototype scale [27]. As suggested by many authors (e.g., [28]), the flow regime near the bed can be related to the grain size Reynolds number (also known as the grain shear Reynolds number) and the bed load initiation is related to the Shield number. On the other hand, suspended sediment distribution depends on the Rouse number [18]. Then, it can be argued that bedload dominated conditions are properly reproduced if both the grain size Reynolds number and the Shields number are conserved at model scale, i.e., if bedload sediment transport and sediment motion initiation are correctly reproduced. In this case, the sediment size has to be geometrically scaled down [27]. On the other hand, the Rouse number is not conserved and the suspended load is not reproduced correctly. For the case at hand, the main sediment transport mechanism is assumed to occur at the riverbed and then the characteristic diameter D50 is used for the scaling.
To summarize, for the case study, the experimental findings allow:
(1) for the quantification of the scour at the toe of the stilling basin and the erosion at the embankments on the left and right sides of the river for different discharges and configurations of the hydraulic structure;
(2) to get meaningful design guidance and efficacy assessment of different Antifer blocks arrangements with different packing densities, with the artificial elements shape and weight chosen after experimental tests carried out on quarry boulders with a mass greater than 10 tons (prototype scale).
The physical model is described by using prototype dimensions. The modeled area is characterized by a length of 650.0 m and a height of 63.5 m, from an elevation of 68.0 m a.s.l. up to 131.5 m a.s.l. The model is fed by a pumping station that collects water from two underground tanks to the upstream feeding tank that reproduces the modeled Lake Guardialfiera. The water inside the upstream tank flows over the gates at an elevation of 122.0 m a.s.l. and also from the ogee weir when the hydraulic level reaches an elevation of 125.5 m a.s.l. The reproduced chute conveys the water into the stilling basin and then into the first 150 m of the downstream riverbed adjacent to the basin itself. Water is eventually collected in the underground tanks. The hydraulics of the bottom outlet is not reproduced. Its influence in the downstream flow features is reproduced by feeding the bottom outlet directly from a further pumping station disconnected from the main one.
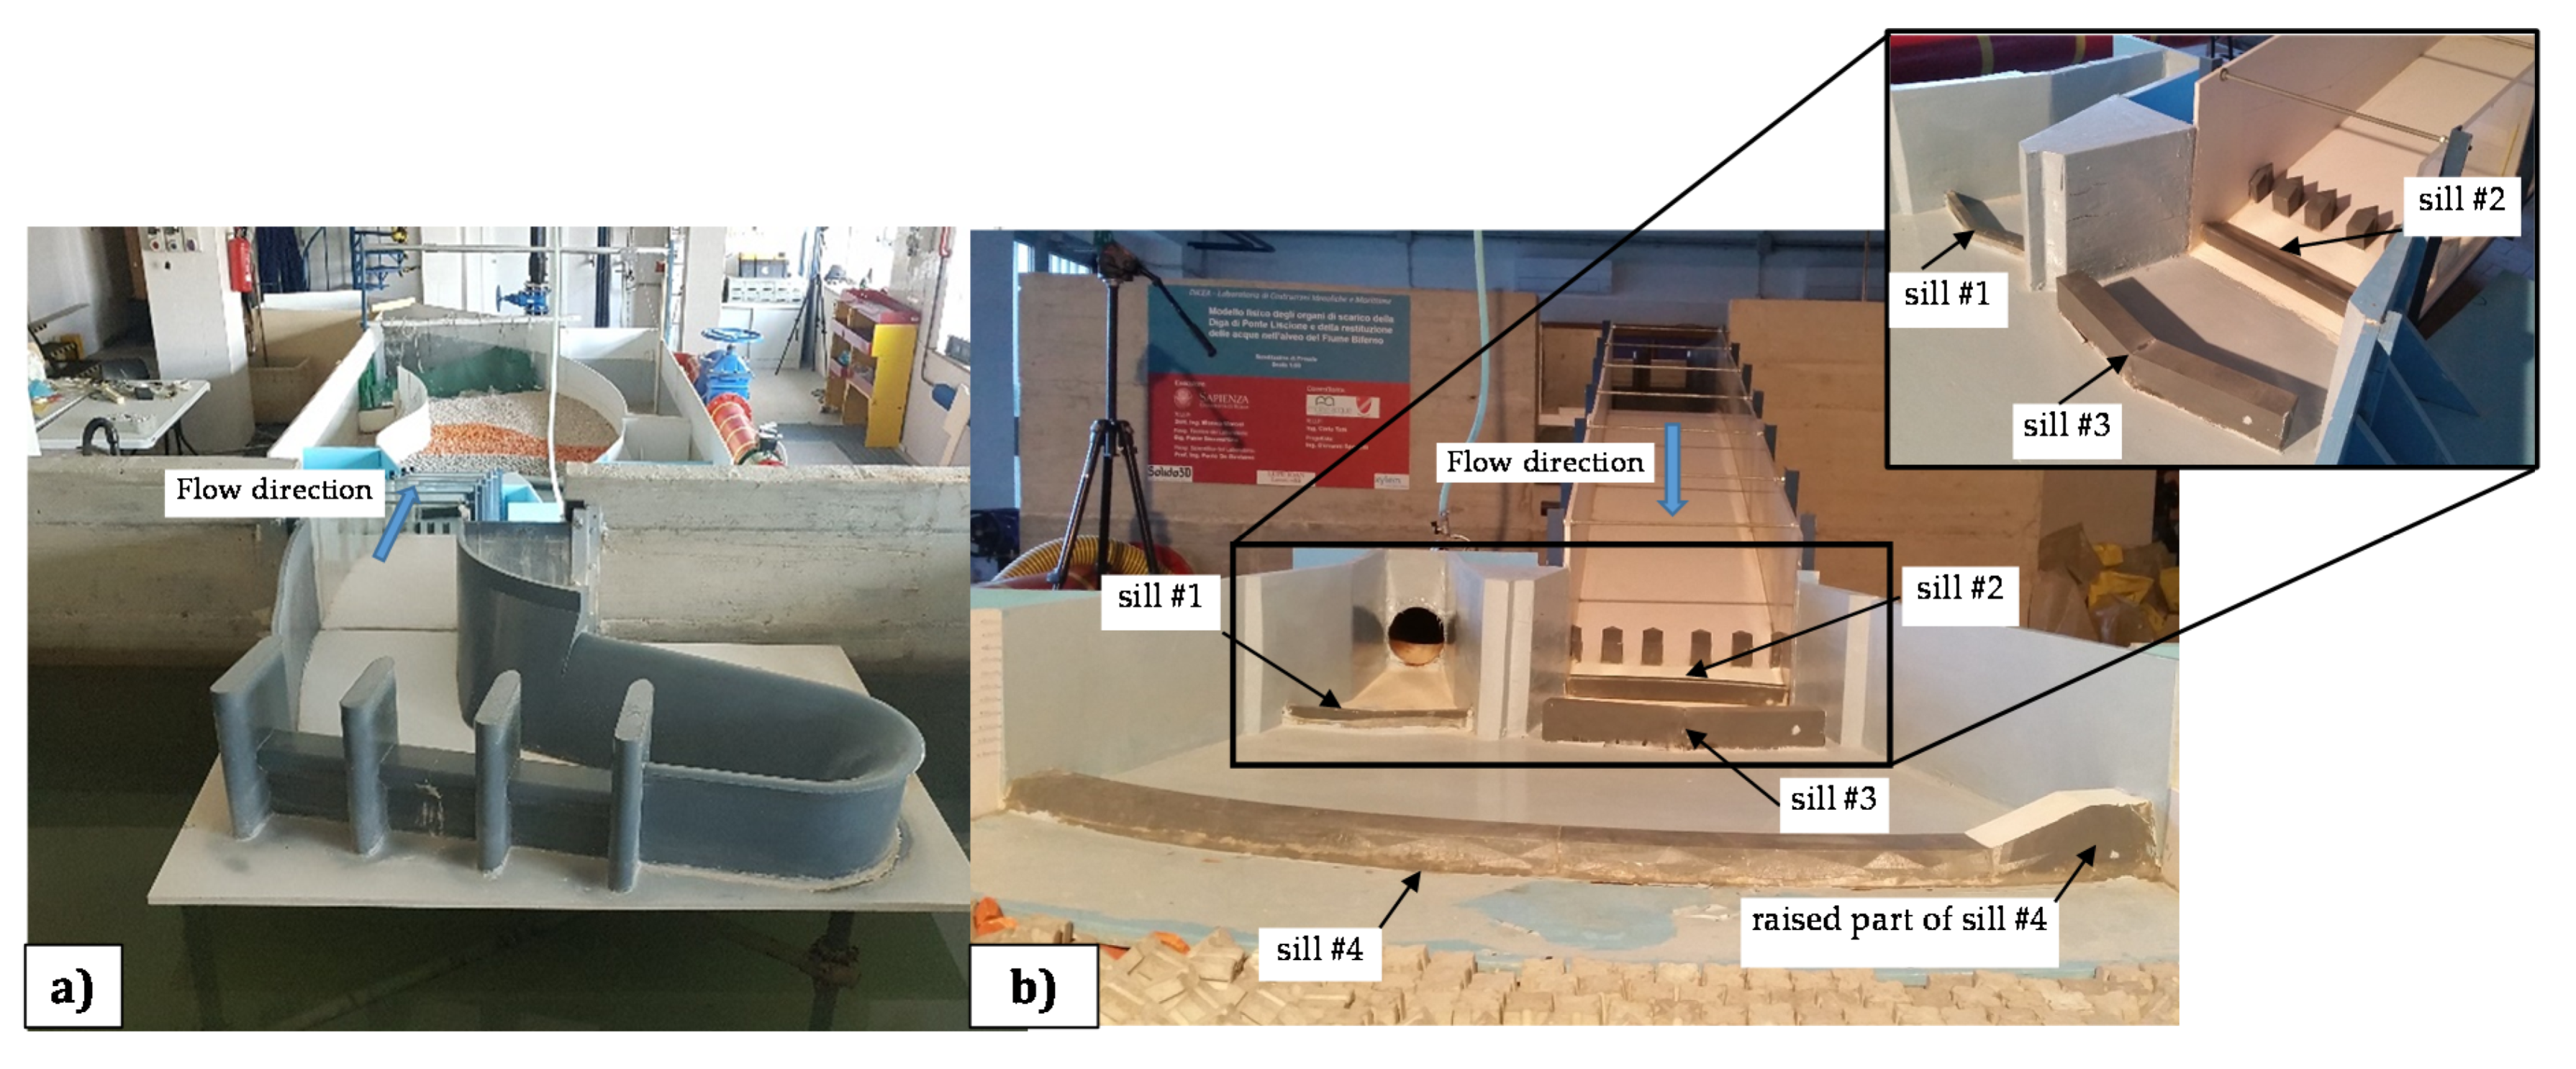
The components of the spillway, i.e., the three gates (in their lowered configuration), the ogee weir, the chute, the bottom outlet terminus, the sills, and the stilling basin, are shown in Figure 4.
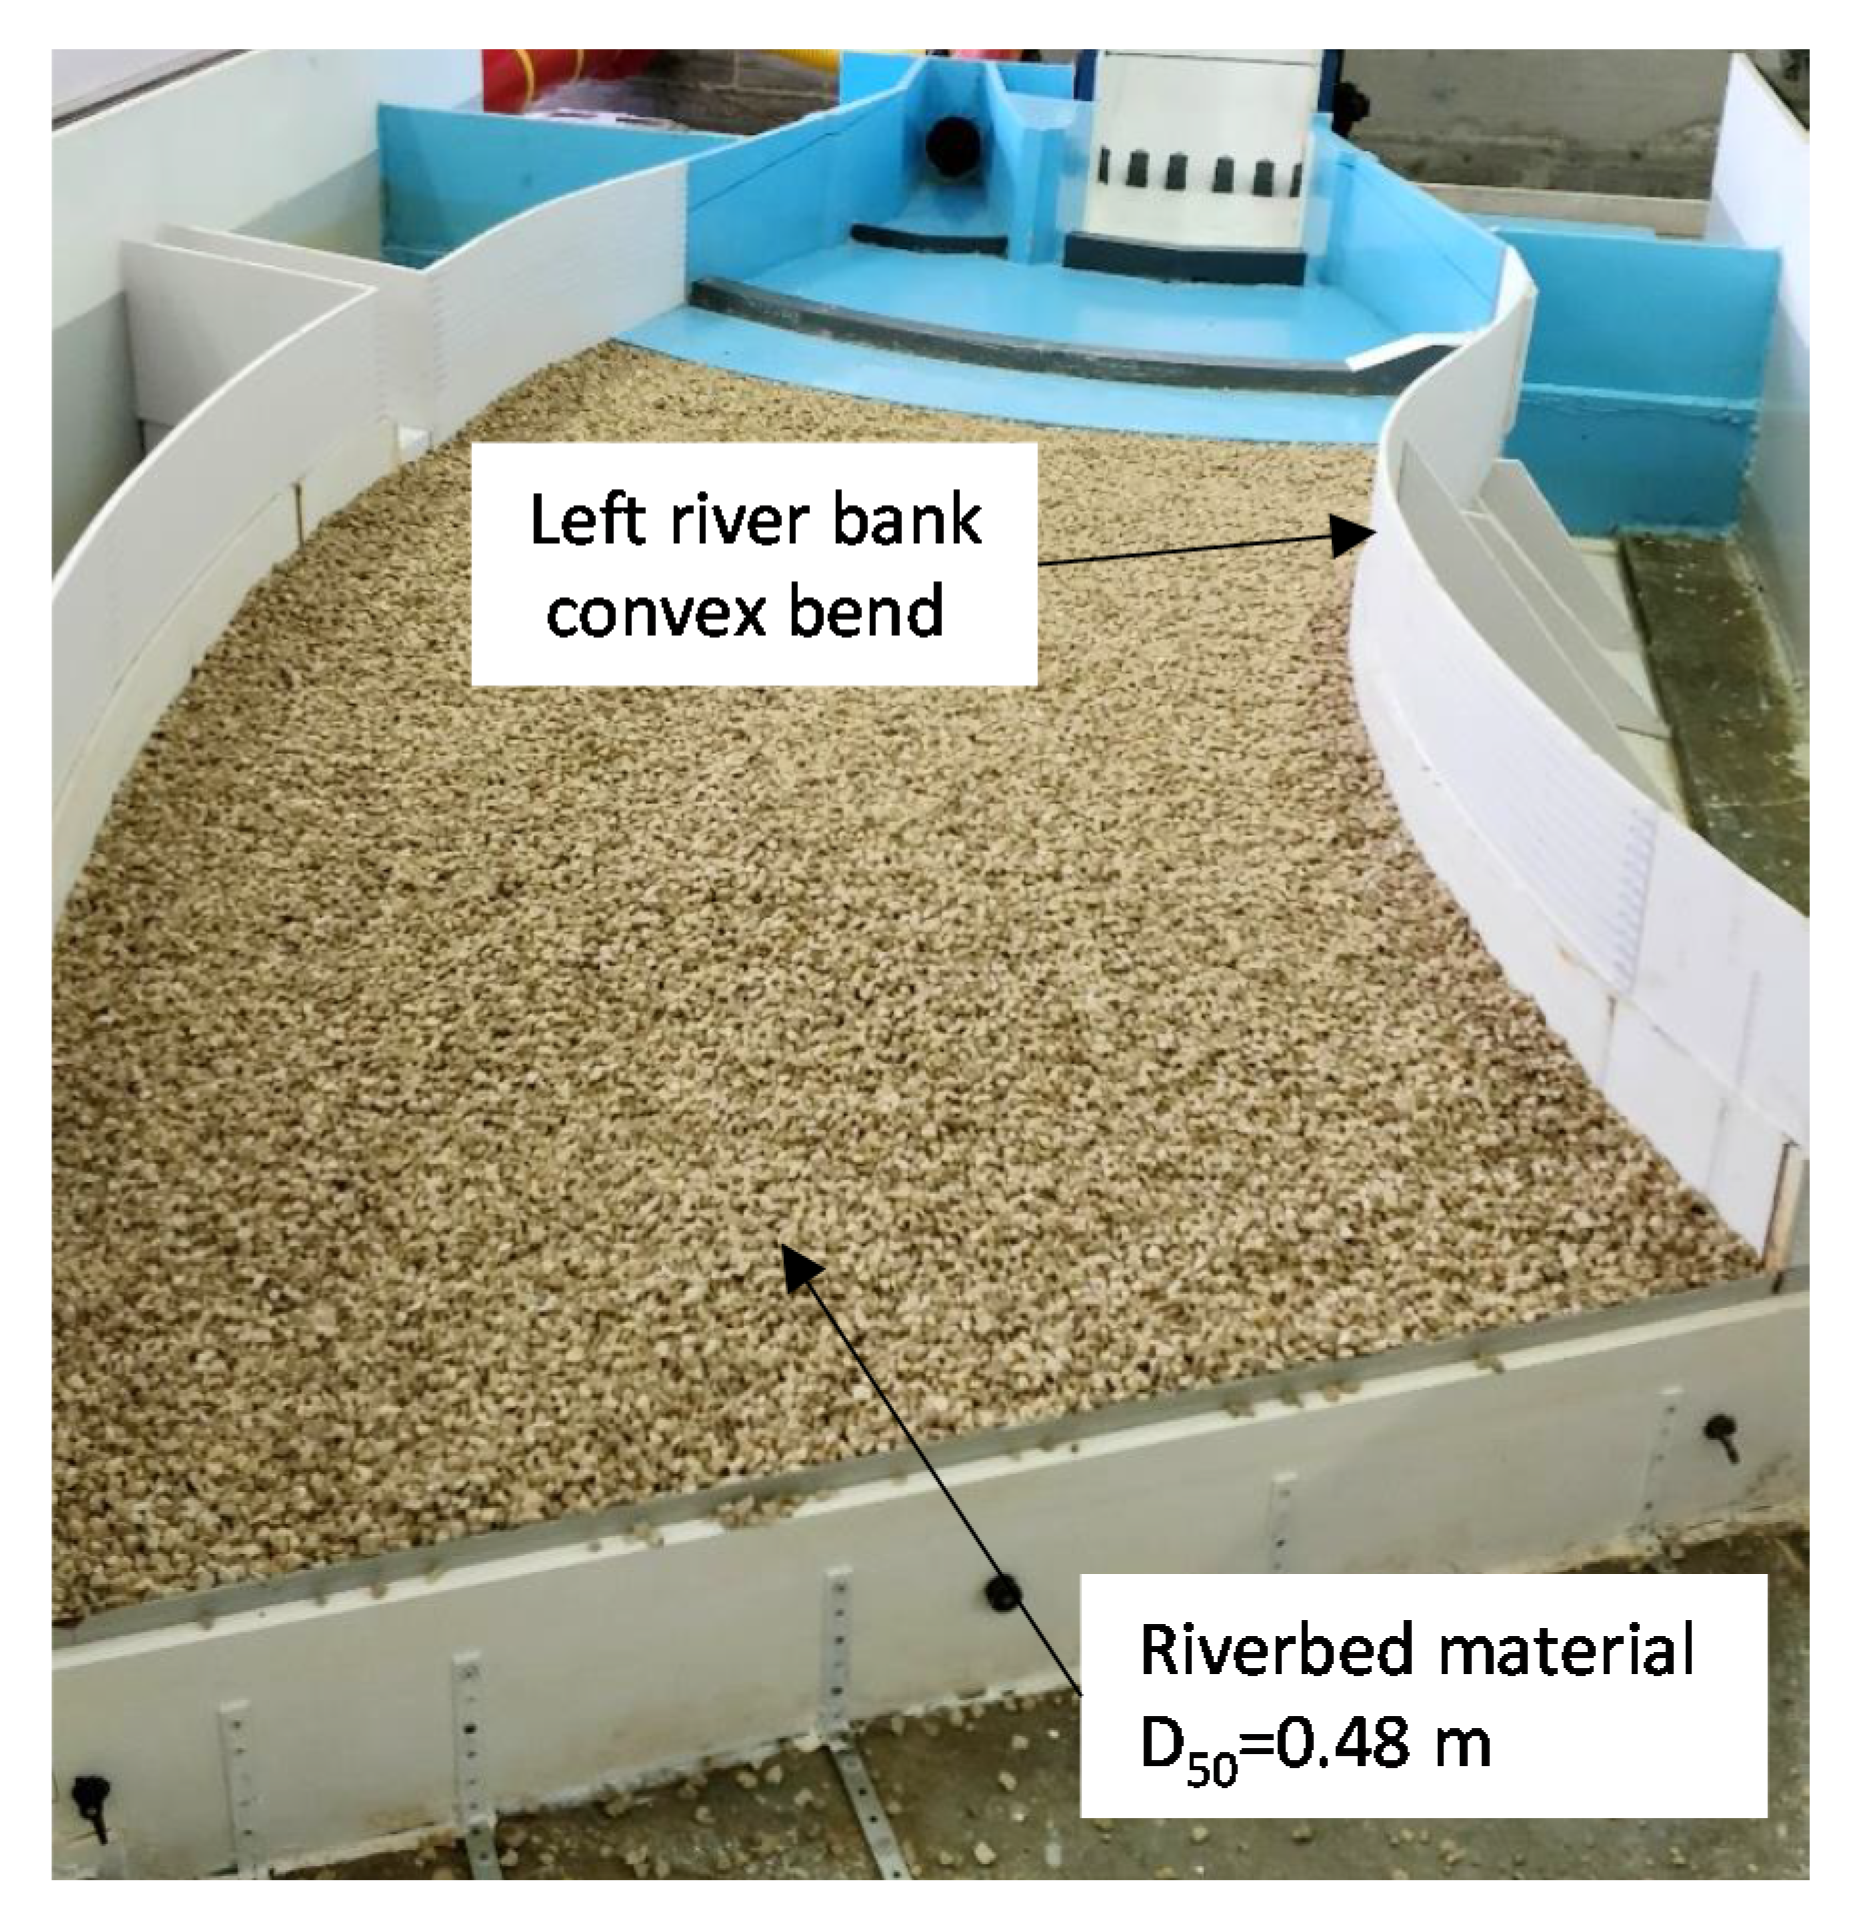
The stilling basin is equipped with the 4 sills described in Section 2 and shown in Figure 4. Sill#4 is configured with a greater height at the orographic left to better dissipate the energy, which in that area, due to the river bank convex bend (see Figure 2, Figure 3 and Figure 5), may lead to massive erosion.
The material used to reproduce the current configuration of the riverbed is medium size limestone gravel with a density of about 2600 kg/m3. It was characterized by a D50 (i.e., median diameter being D50 the diameter at the 50th percentile) of 8.0 × 10⁻³ m which corresponded to a D50 of 0.48 m in the prototype scale. The span of the particle size distribution, i.e., D90 − D10 (where D90 and D10 are the diameters at the 90th and 10th percentile, respectively), is 9.5 mm − 6.3 mm = 3.2 mm, whereas the relative span, i.e., (D90 − D10)/D50, is equal to 0.4, denoting a narrow distribution of the gravel particle dimensions. The porosity is estimated as 39%. It has to be stressed that the same shape factor [13] and density have been assumed for both the model and prototype scales, then the scaling based on the diameter is equivalent to the scaling based on mass (or weight). A 1.1 m3 volume of calcareous gravel, for a total mass of roughly 1700 kg, has been deployed in the model with a slope of 6‰ starting from a prototype elevation of 69.4 m a.s.l., which corresponds to the height of the downstream section of the concrete blocks protection. Figure 5 shows the stilling basin of the physical model and the downstream riverbed. This riverbed configuration has been employed for the first set of the physical model tests, corresponding to the current real layout.
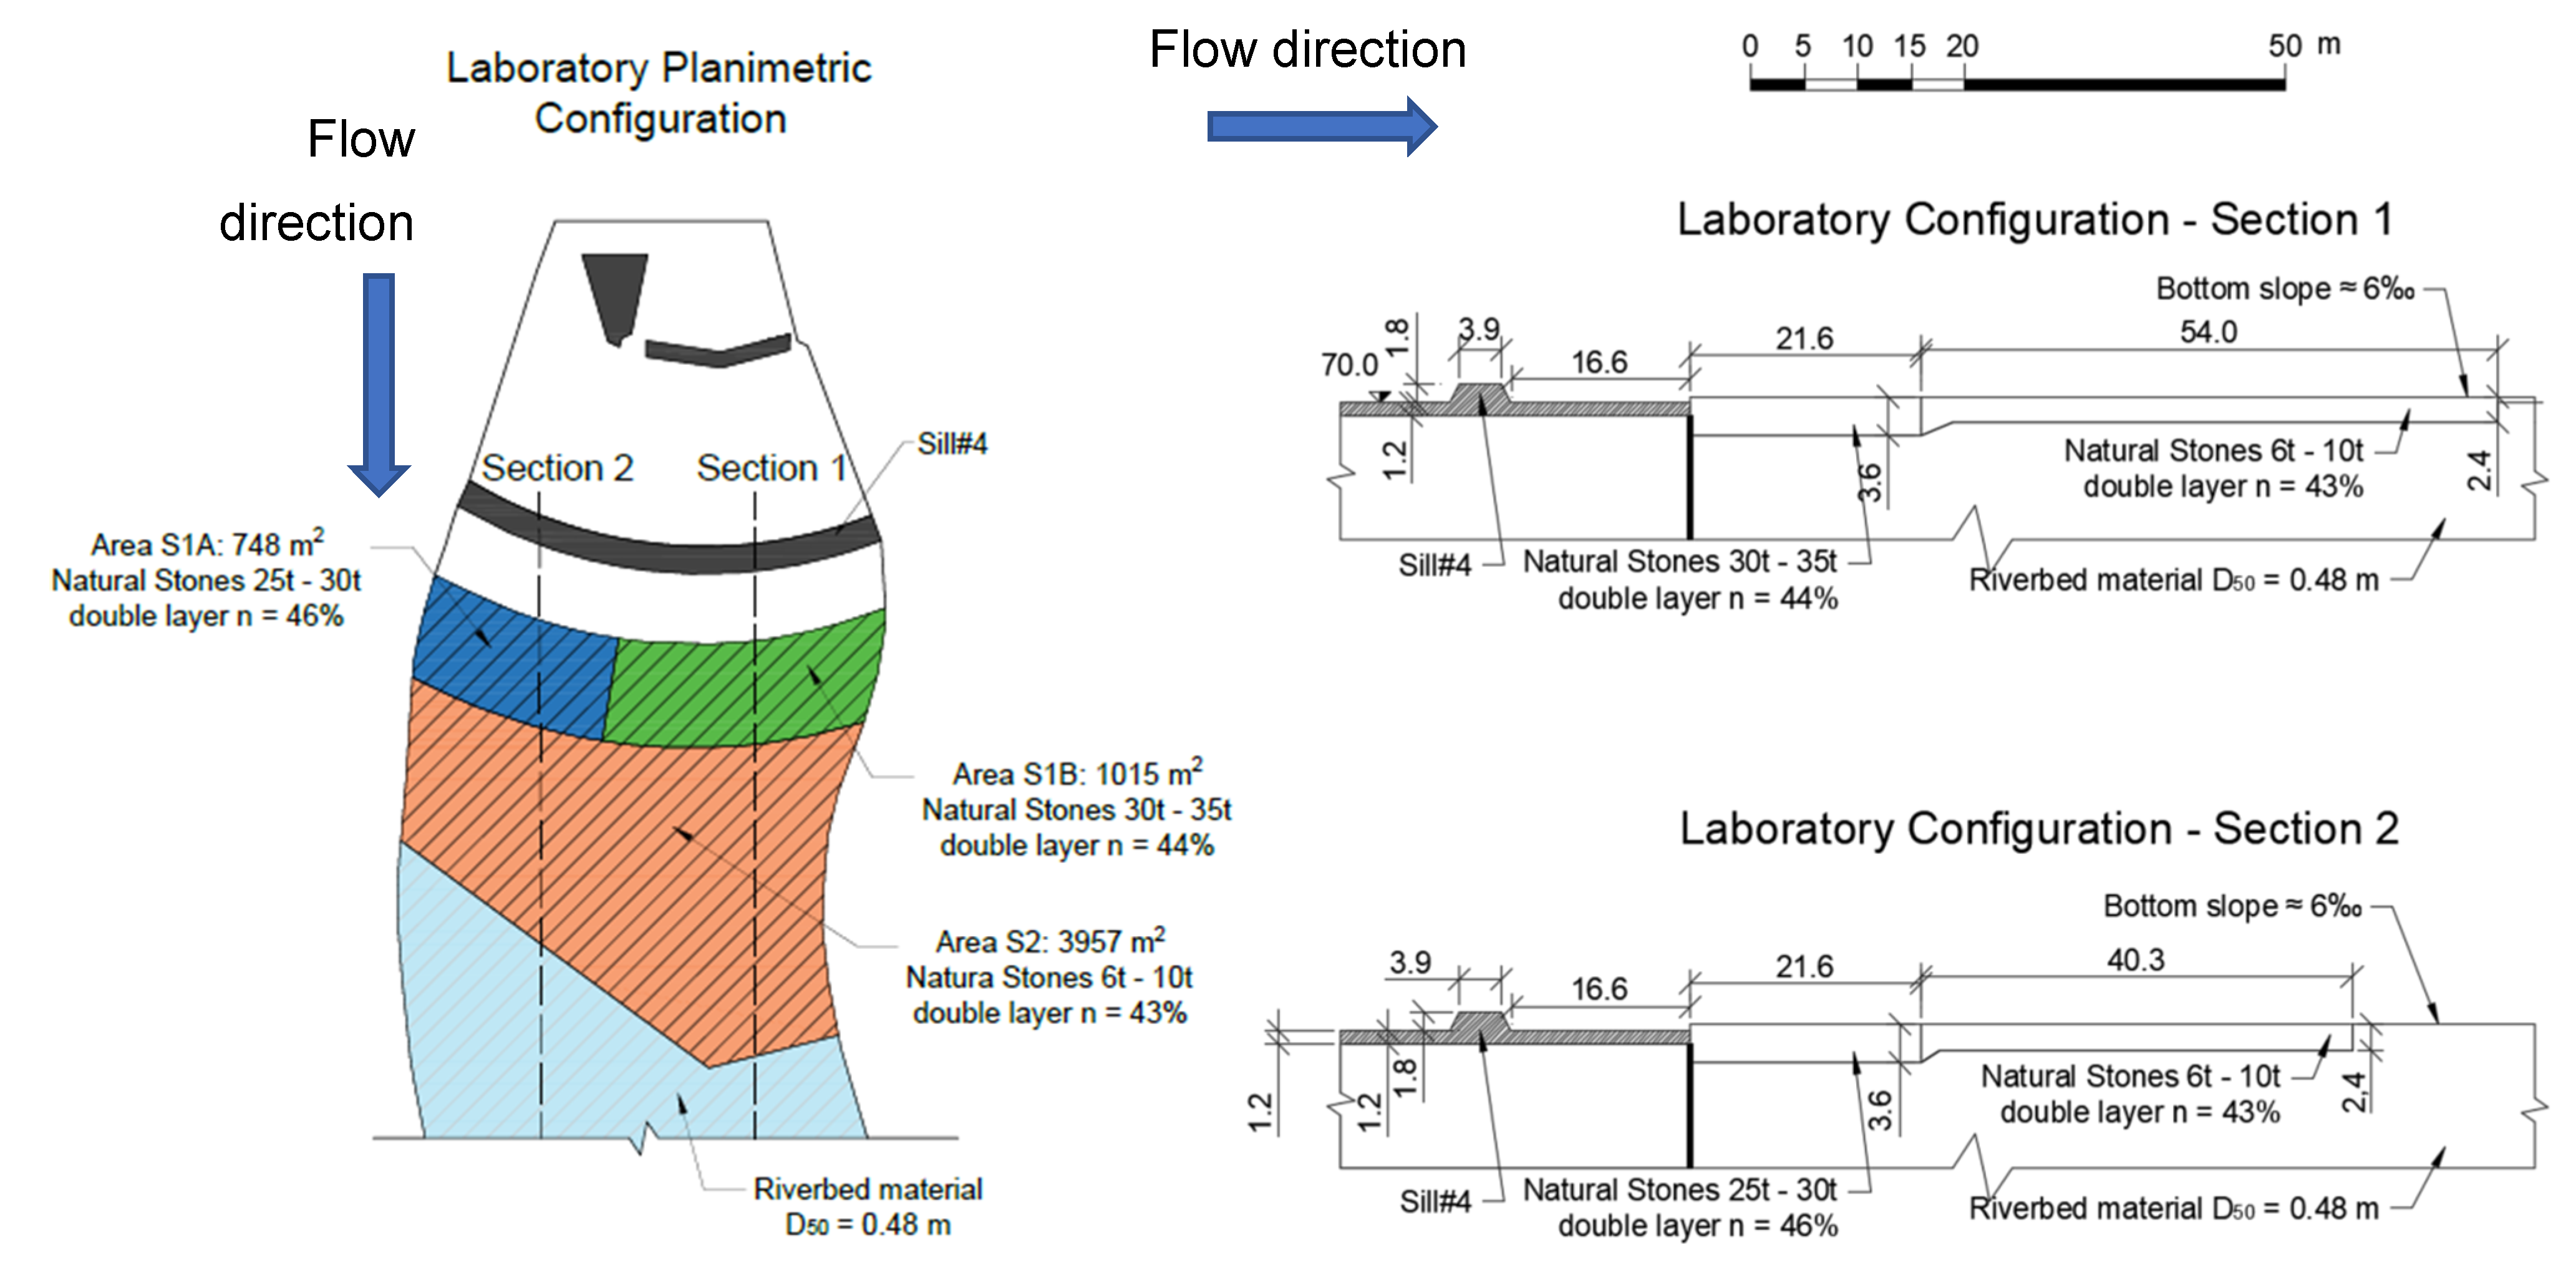
After the tests carried out on the current real layout, the protection of the riverbed downstream of the stilling basin has been modified by using natural rocks belonging to mass classes between 6.0 t and 35.0 t. The planimetric scheme of the modified bottom protection is shown in Figure 6. The dimensions shown in the figure are in prototype scale. Natural stones are arranged with a random placement forming a double layer protective cover. The riverbed surface to protect has been defined by analyzing the scour due to the highest investigated discharge value, 2250 m3/s with a return period equal to 1000 years, without removing the ski jump sill (sill#2).
Area S1 covers the right portion of the riverbed to be protected for a width of about 20.0 m. This area, as revealed by the experimental tests, is the one subjected to the greatest actions due to the current outflowing the hydraulic structure. The width of 20.0 m has been determined based on the results of the experimental tests focused on investigating the impact area of the jet impinging into the dissipation basin. The mass of the boulders to be used for the protection of Area S1 has been established experimentally by trials and errors as there is no applicable formula in the literature for their sizing. The area of impingement (Area S1B) is protected with stones of larger mass (30–35 t in the prototype scale) with respect to the adjacent one (Area S1A, stones of mass 20–25 t in the prototype scale) to reduce the overall costs.
The same approach is followed for designing Area S2, where the action of the jets is no longer present and therefore boulders lighter than those required for Area S1 are stable (mass of stones within the class 6–10 t). It should be noted that Area S2 also protects the convex part of the left bank (see Figure 5) of the riverbed where significant erosion phenomena have been detected experimentally.
Due to the remarkable roughness provided by the natural rocks, the results obtained with such configuration are excellent in terms of energy dissipation and reduced erosion of the riverbed downstream of the dam. Nevertheless, this type of protection is not reproducible at the prototype scale because natural stones, characterized by a mass greater than 10 t, cannot be quarried and transported.
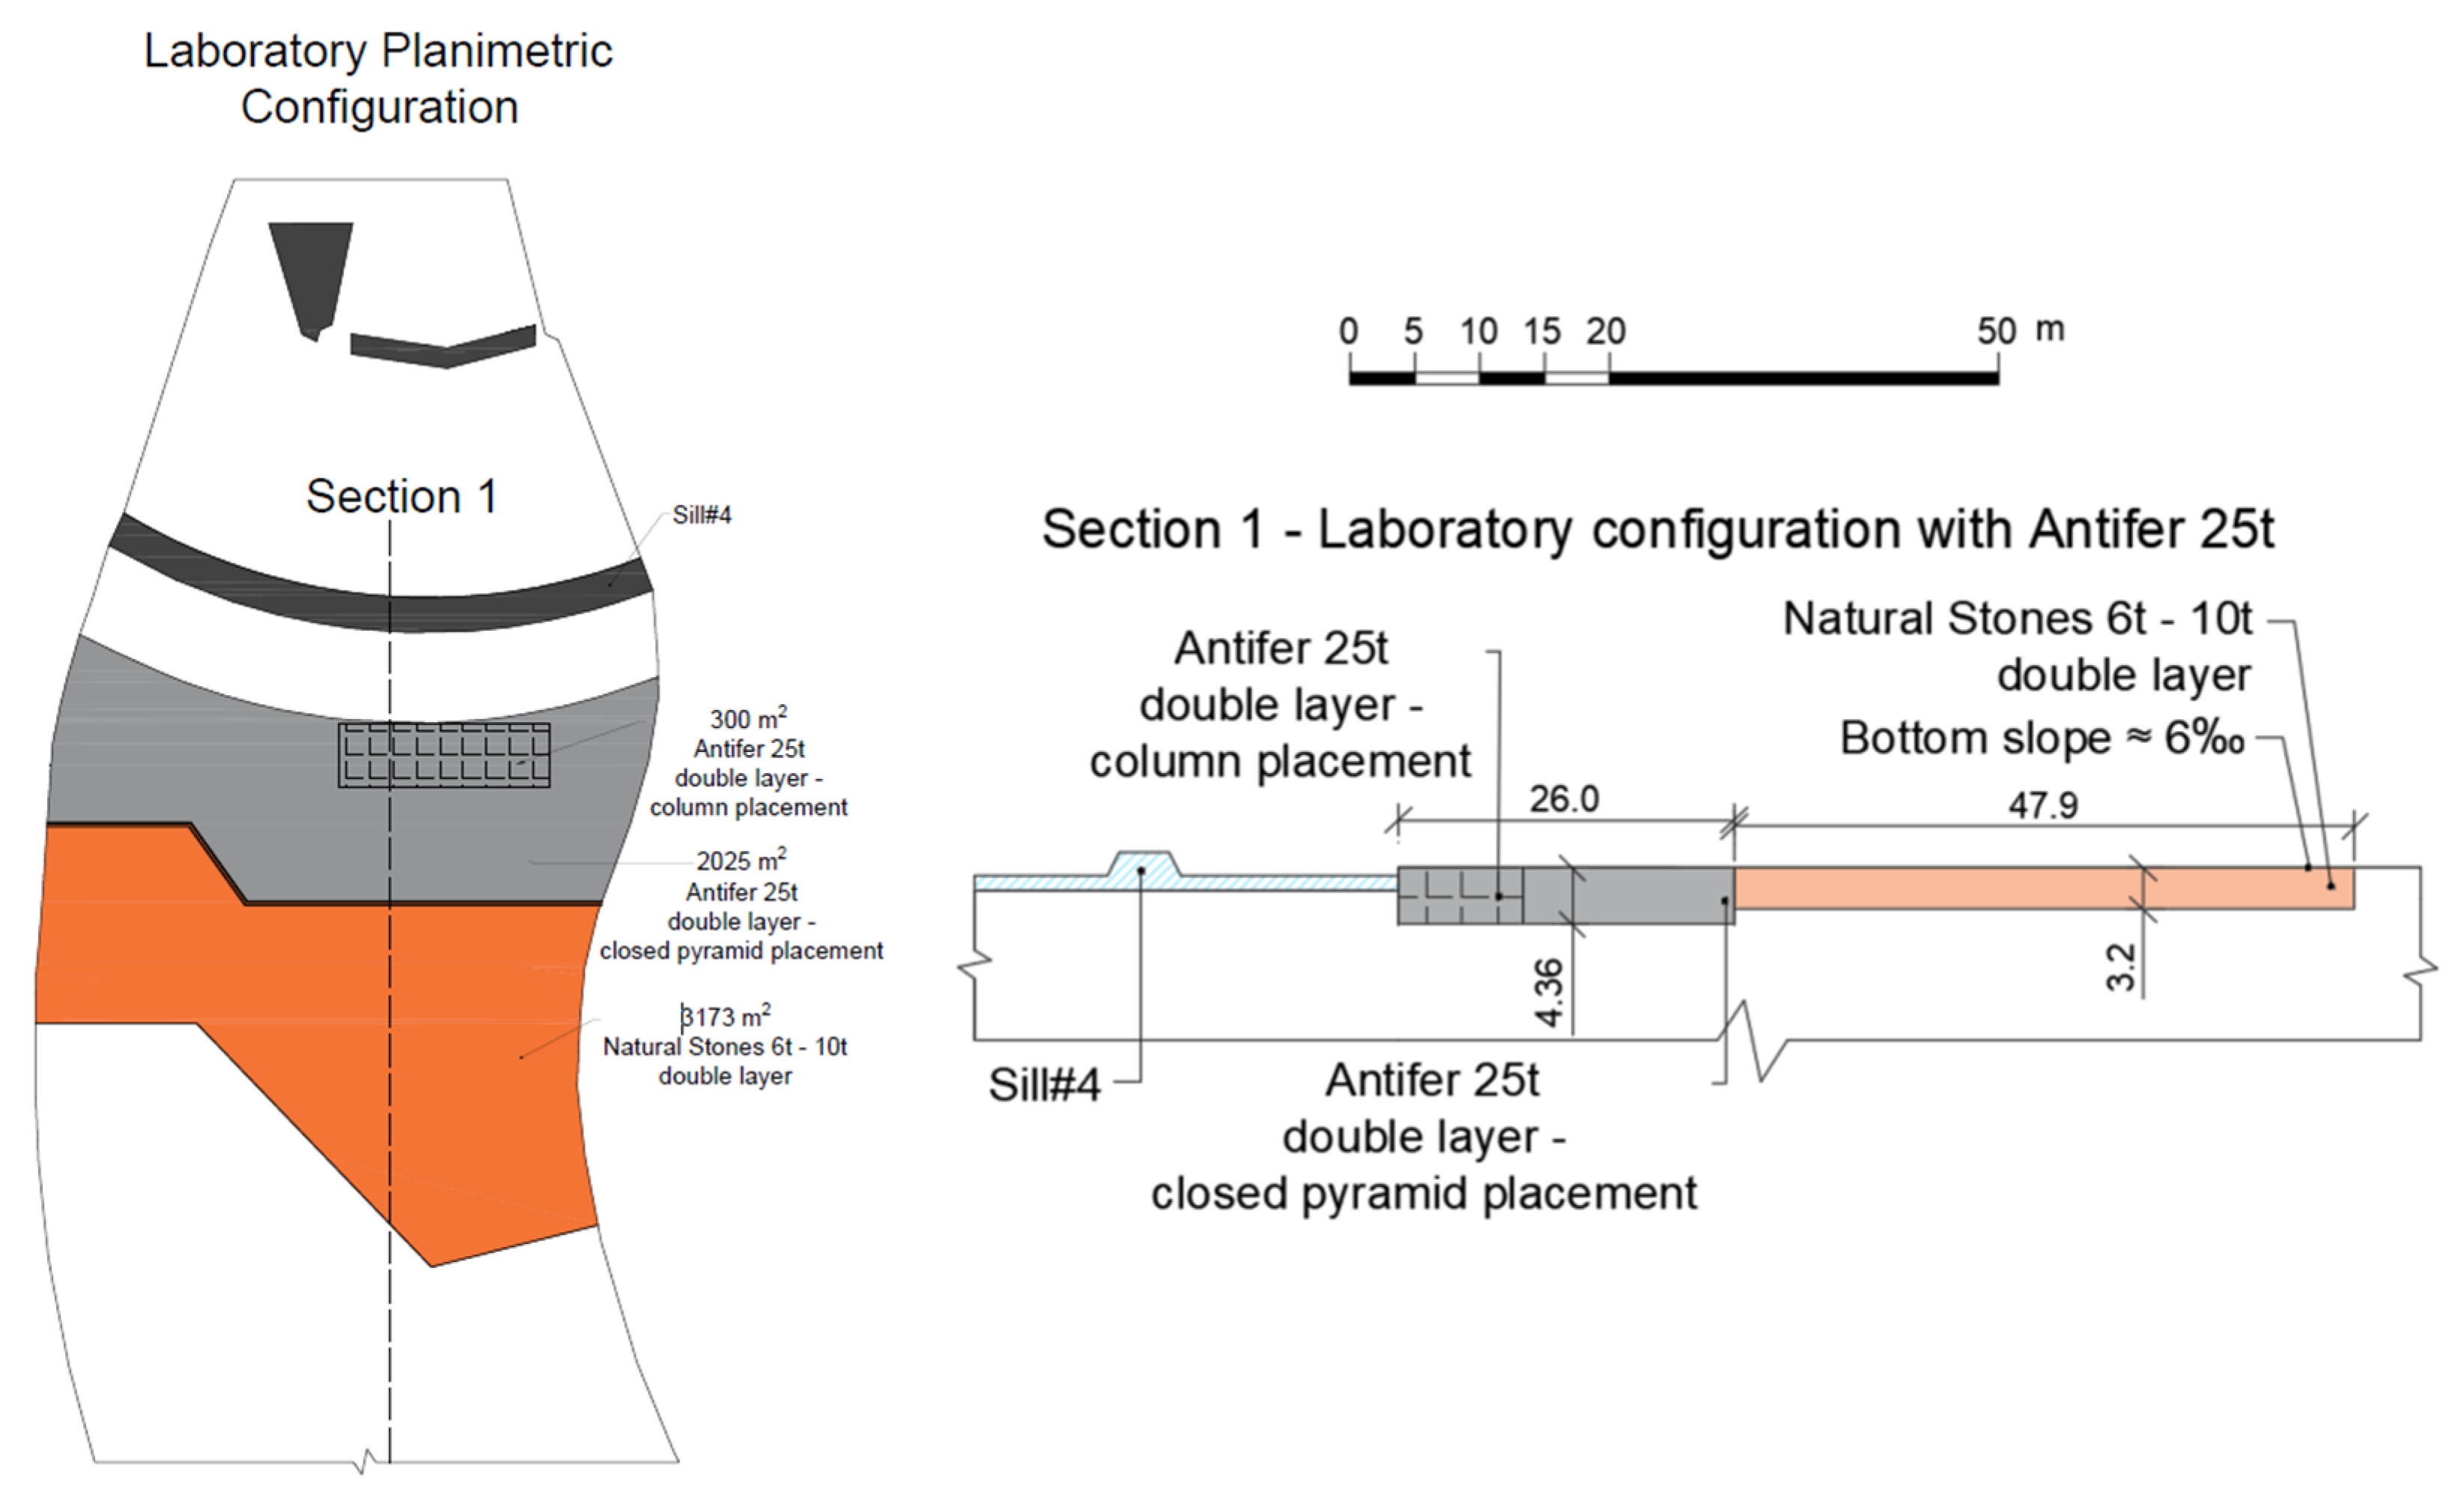
Therefore, the innovative solution proposed herein has been tested. It prescribes the use of artificial rocks named Antifer “equivalent” to the natural stones belonging to the maximum mass class (30.0 t–35.0 t). Antifer blocks are massive armor units usually employed in maritime works [10]. The scaling law to be applied has to be based upon the design criterion usually employed to relate the mass of the individual blocks to the wave load, expressed by Equation (1). To define the scaling law, i.e., to assure the same Izbash number at both model and prototype scale, the block size has to be geometrically scaled-down (given that the model is Froude scaled).
The Antifer blocks have been arranged according to the laboratory results reported in [29]. In fact, this typology of blocks is not patented and no guidelines have been developed for their placement, which strongly affects the feasibility of a project from an economical point of view. The designed planimetric layout is reported in Figure 7. Three different arrangements have been adopted, called by the authors “closed pyramid placement”, “column placement”, and “random placement”, respectively. The Antifer blocks have always been placed in double layers like natural rocks.
Two layouts have been studied, the first one characterized by the random placement and the second one by the closed pyramid placement. The key point of each configuration is the square filled area of Figure 7 (left panel). In this area of the reproduced protection, the Antifer blocks are characterized by the “column placement”. Around this area, the Antifer blocks are placed following the “closed pyramid placement” and the “random placement”, respectively. The arrangement layouts are shown in Figure 8.
Assuming (i) for the non reinforced concrete; (ii) for natural stones; (iii) for freshwater specific weight, (iv) for natural stones and (v) for the Antifer blocks, the ratio given by Equation (1) is equal to about 0.7. Then, given the weight of stable natural rocks selected on the basis of experimental results, the weight of stable Antifer blocks is estimated as kN (i.e., the mass of each block is roughly t).
4. D Reconstruction of the Scour Pattern and Experimental Scenarios
A Canon camera equipped with 18–55 mm lens set with a focal length of 18 mm has been used for acquiring the images employed to reconstruct the 3D surface of the riverbed after each test. The camera has been placed at a height of about 1.8 m for a ground resolution of 0.222 mm/pixel. Eight images have been taken moving the camera 30 cm apart in the direction transversal to the river flow. After that, the camera has been moved 20 cm ahead in the direction of the river flow and other eight images have been taken moving the camera of 30 cm. The procedure has been repeated up to the downstream boundary of the laboratory model to obtain a regular grid of 30 × 20 cm2 meshes (model scale). To allow the Agisoft Metashape software to create a more accurate Digital Elevation Model (hereinafter referred to as DEM), the images of the upstream part, including the stilling basin, have been taken according to a 15 × 10 cm2 mesh (model scale). Therefore, a total of 220 digital images have been acquired for each test. The standardization of the image acquisition procedure ensures a more effective comparison of different scenarios.
As previously mentioned, each test consists of two phases: the first one (Phase 0) represents the acquisition of the undisturbed riverbed; the second phase (Phase 1) consists of the photographic survey after the first 30 min (at model scale) of water supply, equivalent to about 3 h and 54 min in prototype scale. The difference between the DEMs at Phase 1 and Phase 0, hereinafter phase 0–1, provides the scour pattern due to the flow.
The Agisoft Metashape software has been used for the photogrammetric processing of the images and the estimation of the DEM. Agisoft Metashape is a stand-alone software for photogrammetric reconstruction from digital images. After importing the 220 photos of each phase into the software, they are aligned. Then a dense point cloud is created and the model calibration is performed. It consists of assigning to certain control points the coordinates in a local reference system. Six of these points are located on the plywood panel to the right of the stilling basin and are used to create the origin and the Oxyz reference frame, while one, located on the downstream sill, has the task of correctly aligning the digital model.
Then, a 3D mesh is generated through a triangulation process that precedes the creation of the DEM. A mean error of 0.36 m (at prototype scale) is estimated by measuring the elevation of some key points directly on the physical model by means of a high precision optical level meter and a laser distance meter.
For each test, the image analysis procedure devoted to the estimation of the scour pattern has been divided into three steps:
- execution of two image acquisition surveys carried out for phase 0 and phase 1;
- creation of a digital elevation model;
- graphic rendering of the scaled DEMs and the erosion/deposition map.
To simulate the scour pattern occurring just downstream of the stilling basin and, subsequently, to evaluate the effectiveness of the proposed protection system, experimental tests have been carried out with two different discharges by comparing the extent of the scour with and without the protection system for the same discharge value. The flow rates employed within the laboratory tests are:
- -
- Q1 = 830 m3/s, maximum flow rate discharged from the spillway during the event occurred in January 2003 (excluding the bottom outlet discharge contribution), characterizing a rainfall event with a return period between 30 and 50 years;
- -
- Q2 = 1450 m3/s corresponding to a return period of 200 years.
5. Results
In order to check the reliability of the results, a first set of experiments have been devoted to characterizing the hydraulic efficiency of the ogee spillway and to assess the reliability of the experimental results.
The discharge flowing through the model was varied, contextually measuring the water level within the upstream feeding tank that reproduces the modeled Lake Guardialfiera. Eighteen experiments were run with different values of the flow rate. The obtained stage-discharge rating curve was compared to the one used at the design stage. The comparison was satisfactory (maximum error roughly equal to 3%).
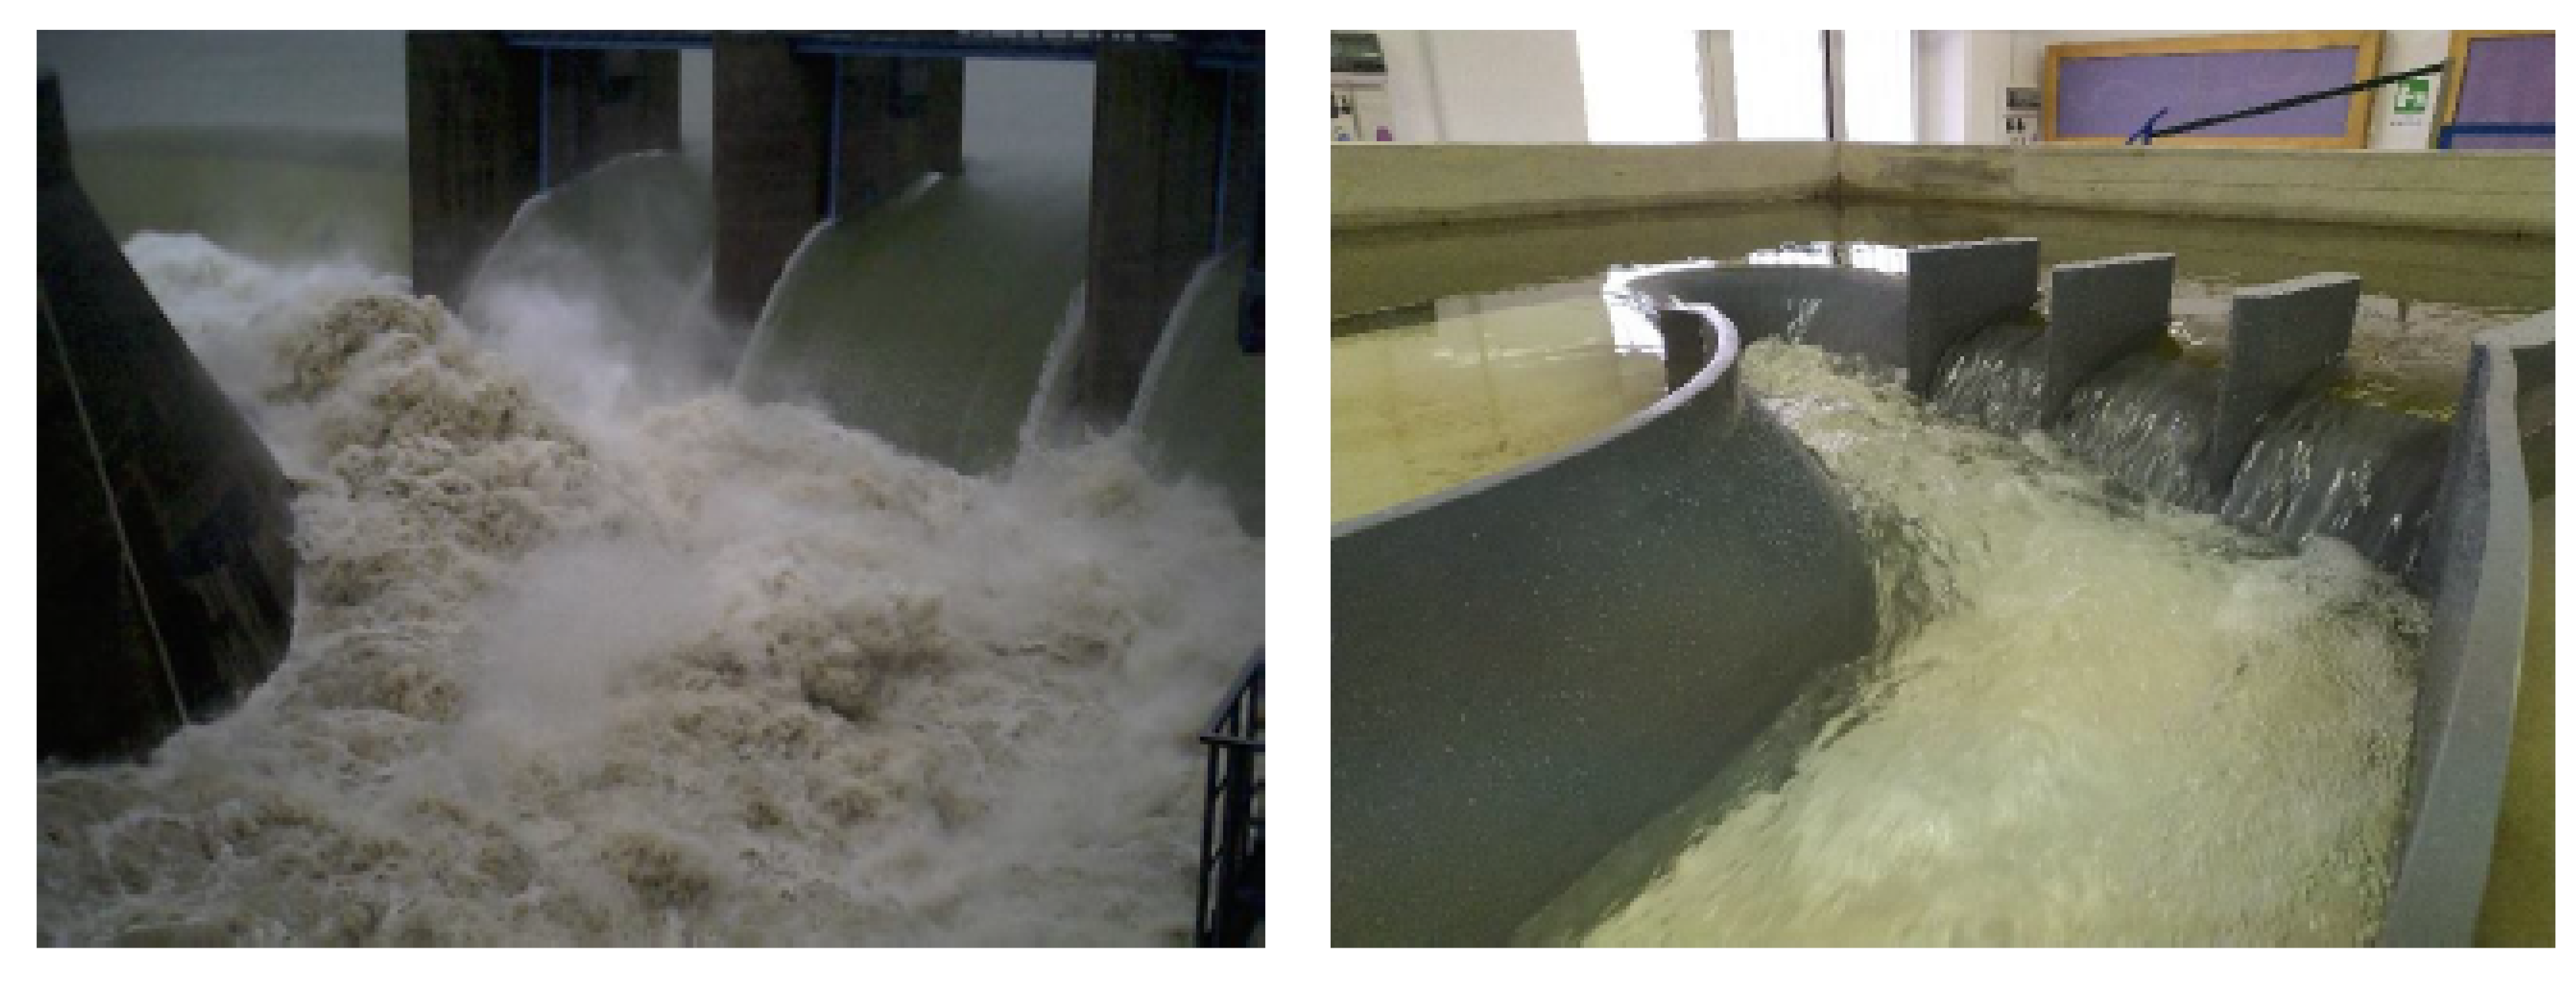
Figure 9 presents a further qualitative evaluation of the performance of the spillway compared to the prototype one. The figure compares the hydrodynamics that occurred during the flood event which has affected the Liscione dam between 24 and 25 January 2003 (image on the left-hand side) and the outcome of the laboratory experiment run with a discharge equal to 29.8 l/s, corresponding to the prototype value of 830.0 m3/s. Though the air entrainment at the prototype scale appears more evident, the similarity between the flow feature is rather clear.
Preliminary tests were performed also to select the most appropriate duration to reach a stable condition of the downstream riverbed, hence getting reliable results. Tentative duration of 1 h was then selected for the first trials. The tests were stopped every 15 min to gain insight on the bottom evolution. After 30 min (i.e., 3 h and 54 min) the bottom was observed to have reached a quite stable configuration. Then, the duration of each test of the experimental investigation has been selected as 30 min.
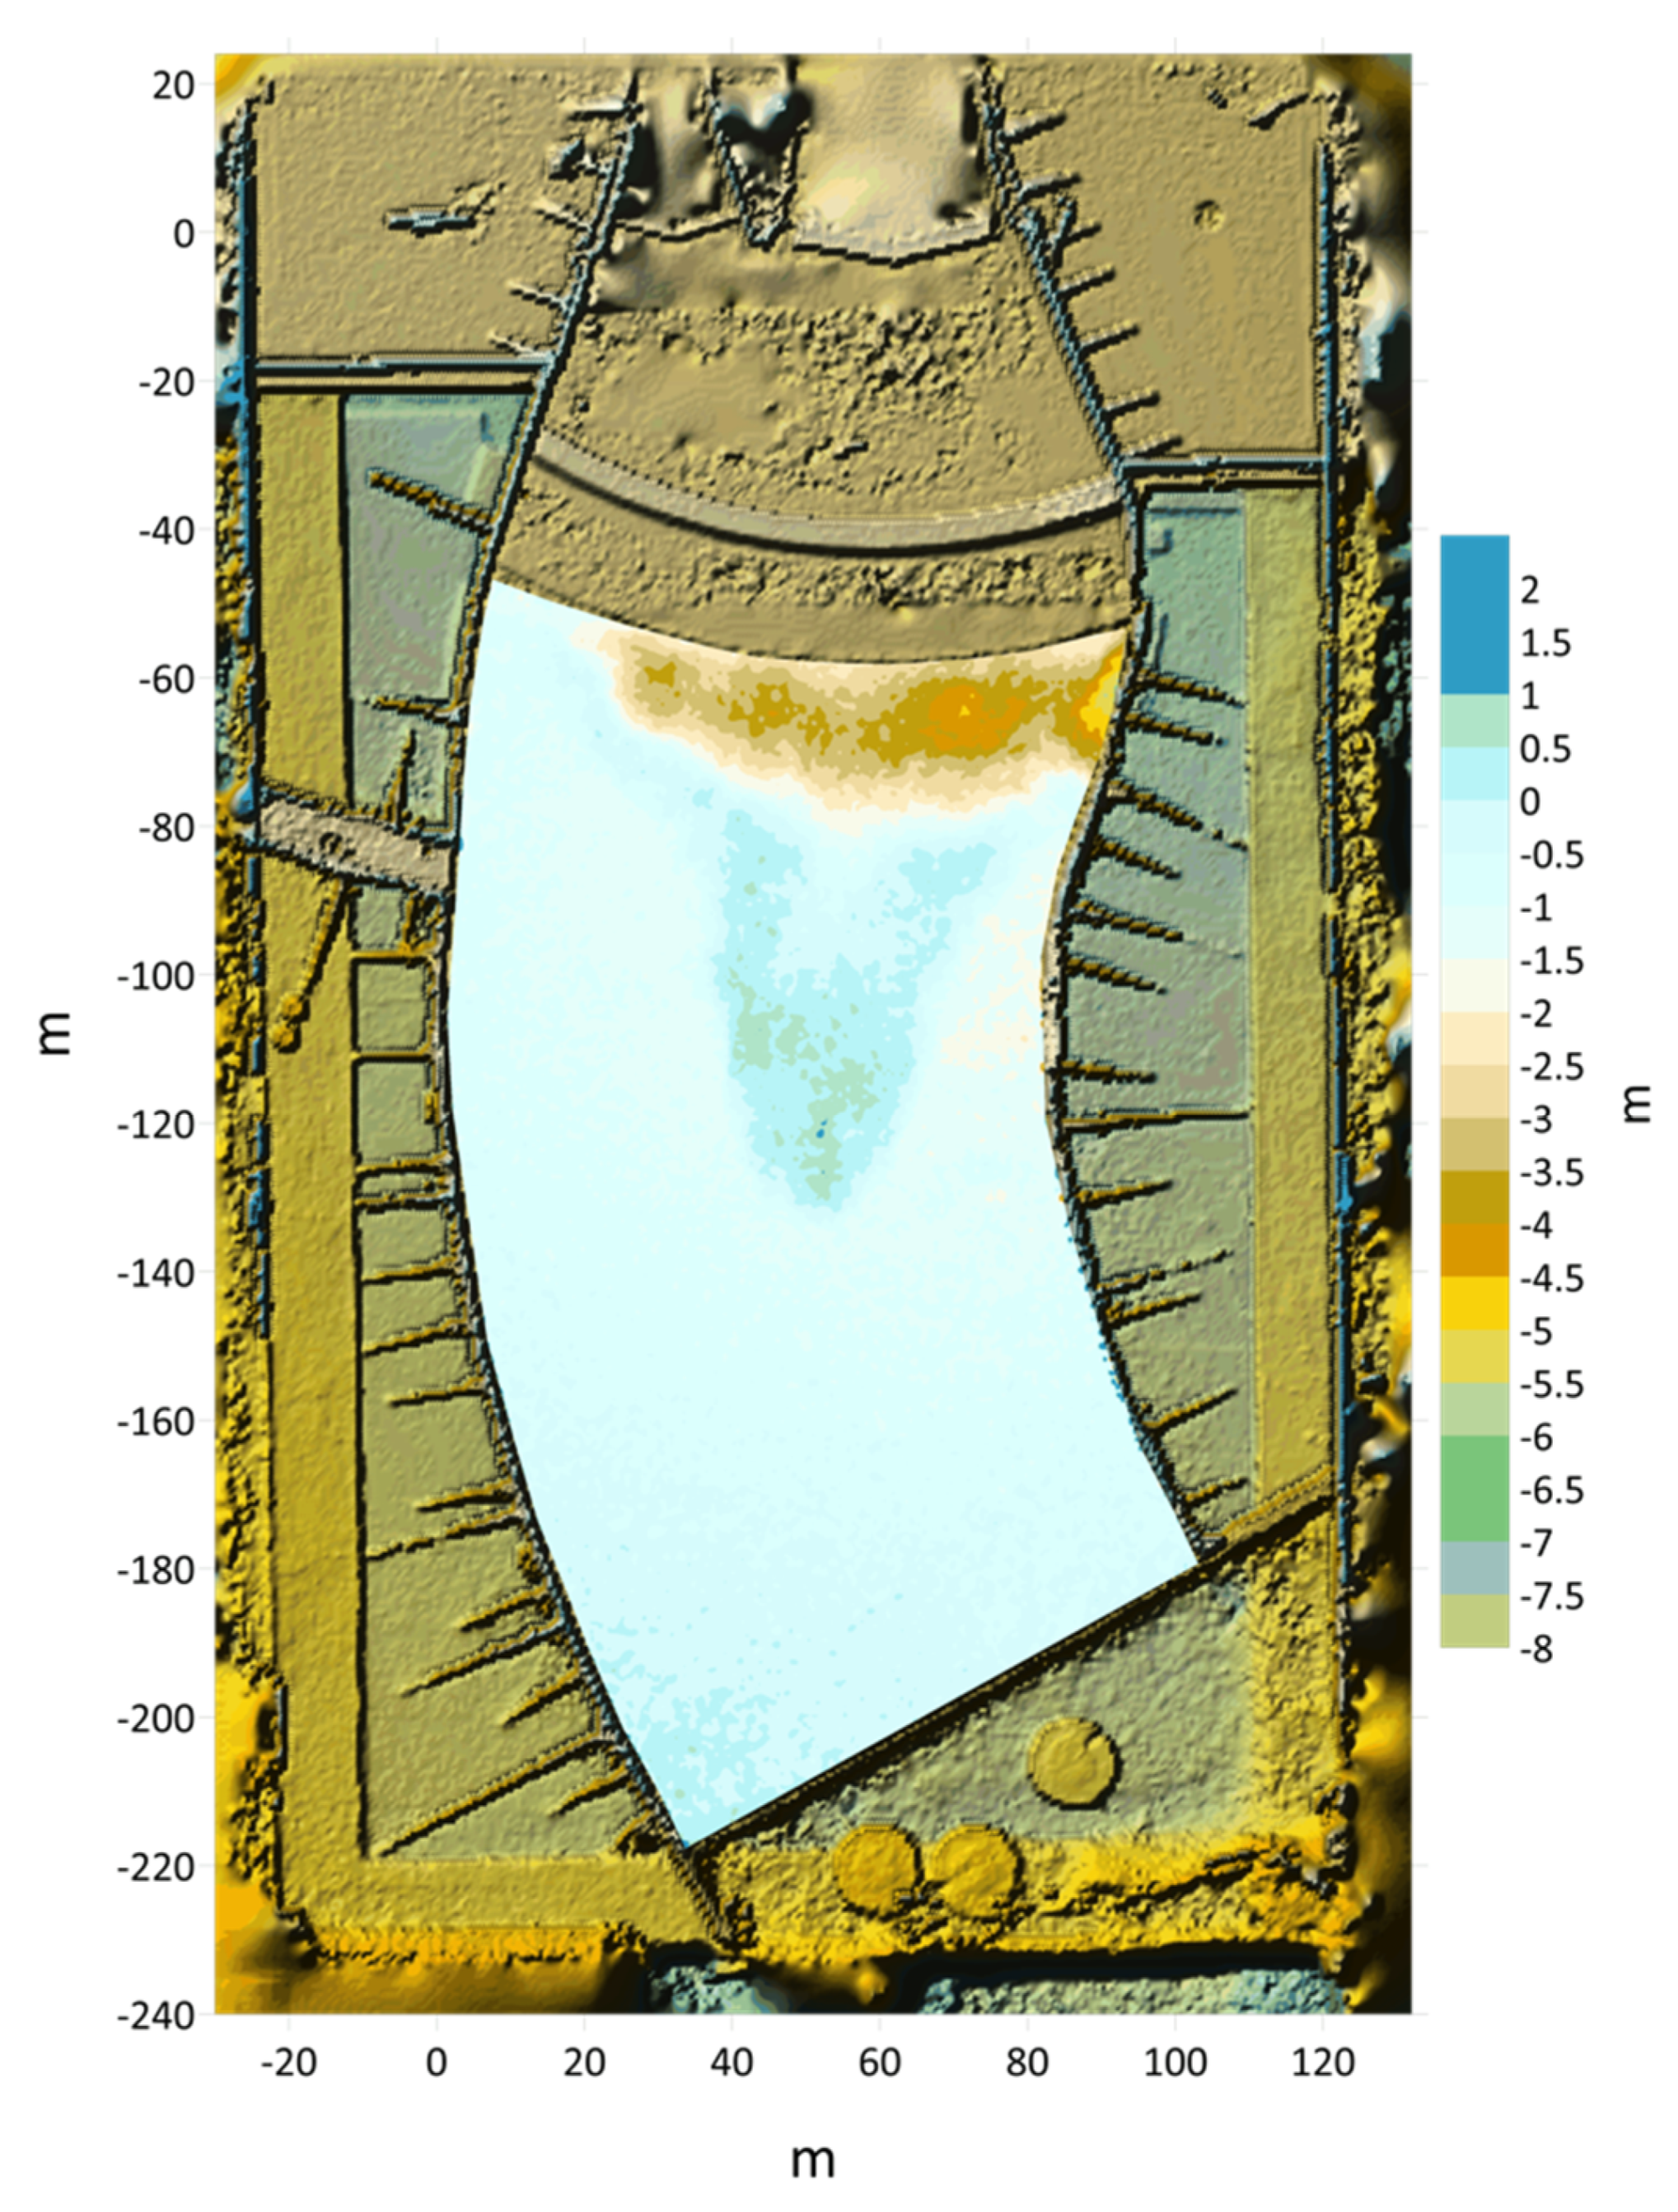
The first experimental test has been performed with the discharge that affected the Liscione dam in January 2003 (Test #1 of Table 1). The entire surface of the riverbed (see Figure 10) has suffered damages. Figure 10 highlights the erosion on the left bank, where a maximum scour of about 6.0 m is reached. The curvilinear shape of the riverbed left bank close to the stilling basin enhances the erosion phenomenon in that area. Furthermore, the raising part of sill #4 (in the stilling basin) is ineffective in reducing the scour close to the left bank. Though the discharge is the same, a direct comparison of the scour observed in the prototype and in the physical model for the January 2003 event is not feasible. In fact, both the right and the left banks are included in the laboratory model while the right bank wall collapsed during the mentioned flood event. Nevertheless, a recent survey carried out in July 2020 shows that erosion in the order of 2–3 m occurred downstream of the energy dissipator which is consistent with the experimental results. Furthermore, the damage and removal of gabions on the left bank experienced during the 2003 flood event are consistent with the flow features highlighted by the physical model which have produced a significant erosion in the same area.
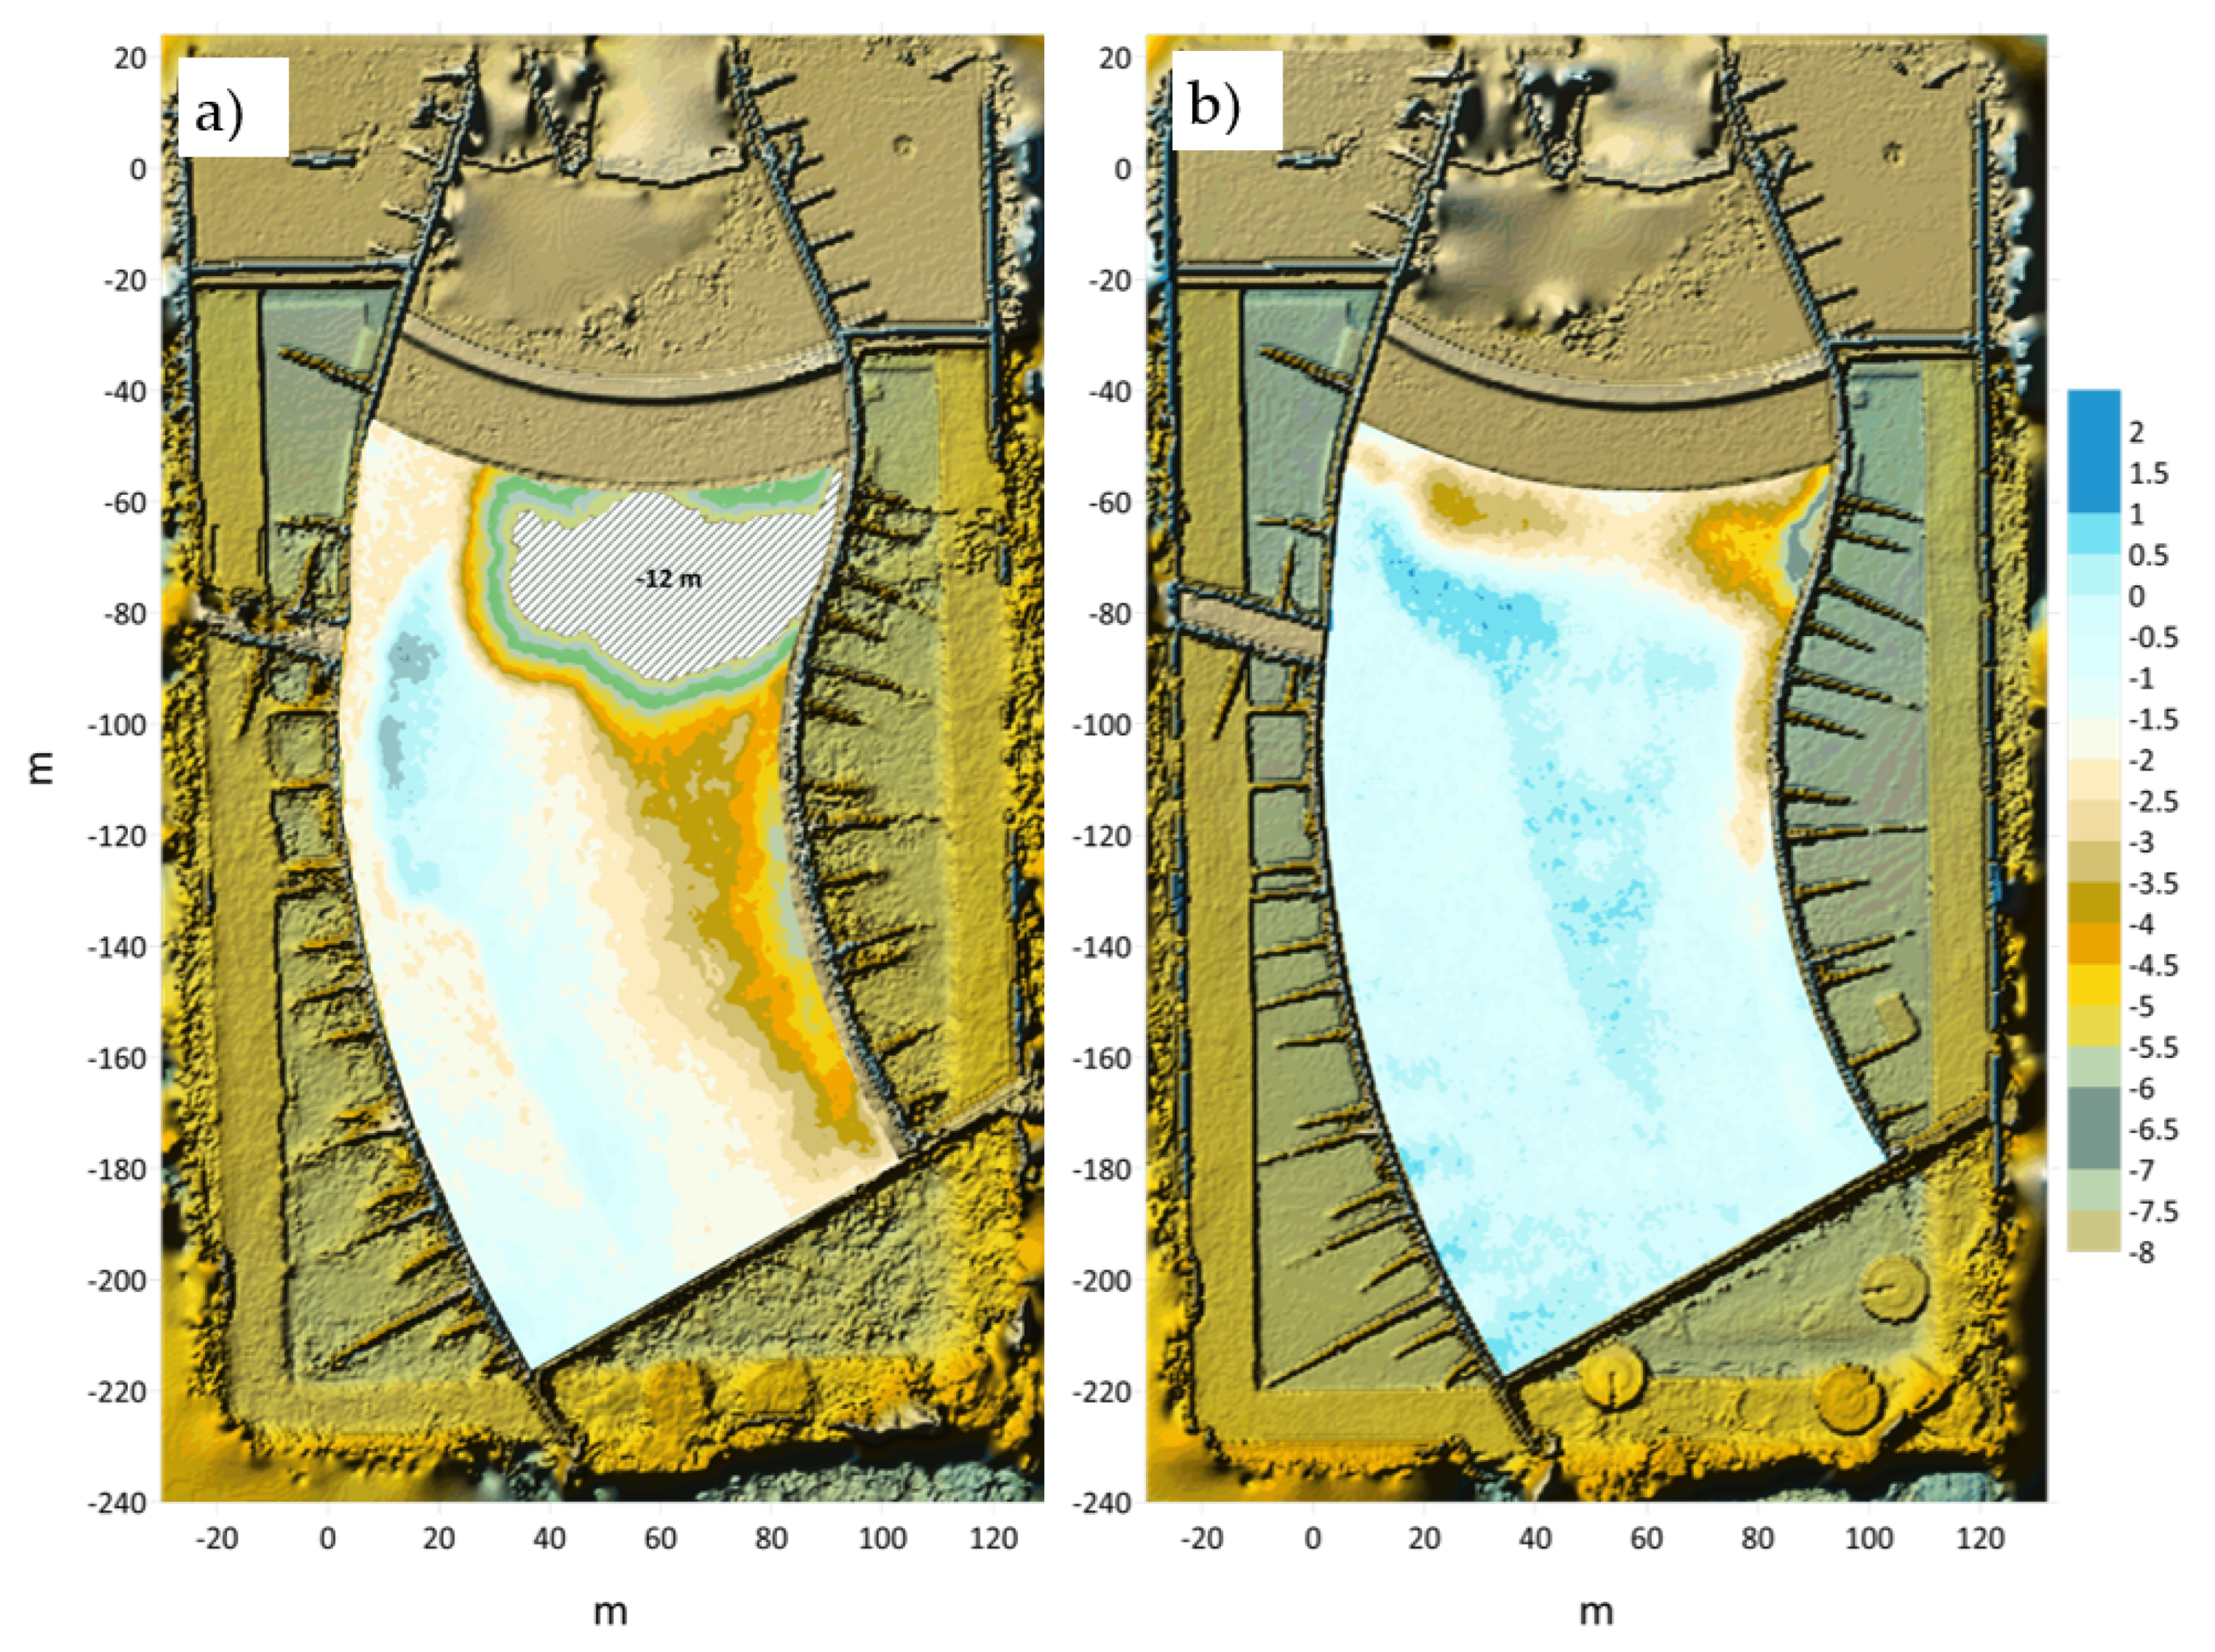
Figure 11 presents the results of Test #3a and Test #3b (Table 1). The discharge was equal to 1450 m3/s, characterized by a return period Tr equal to 200 years.
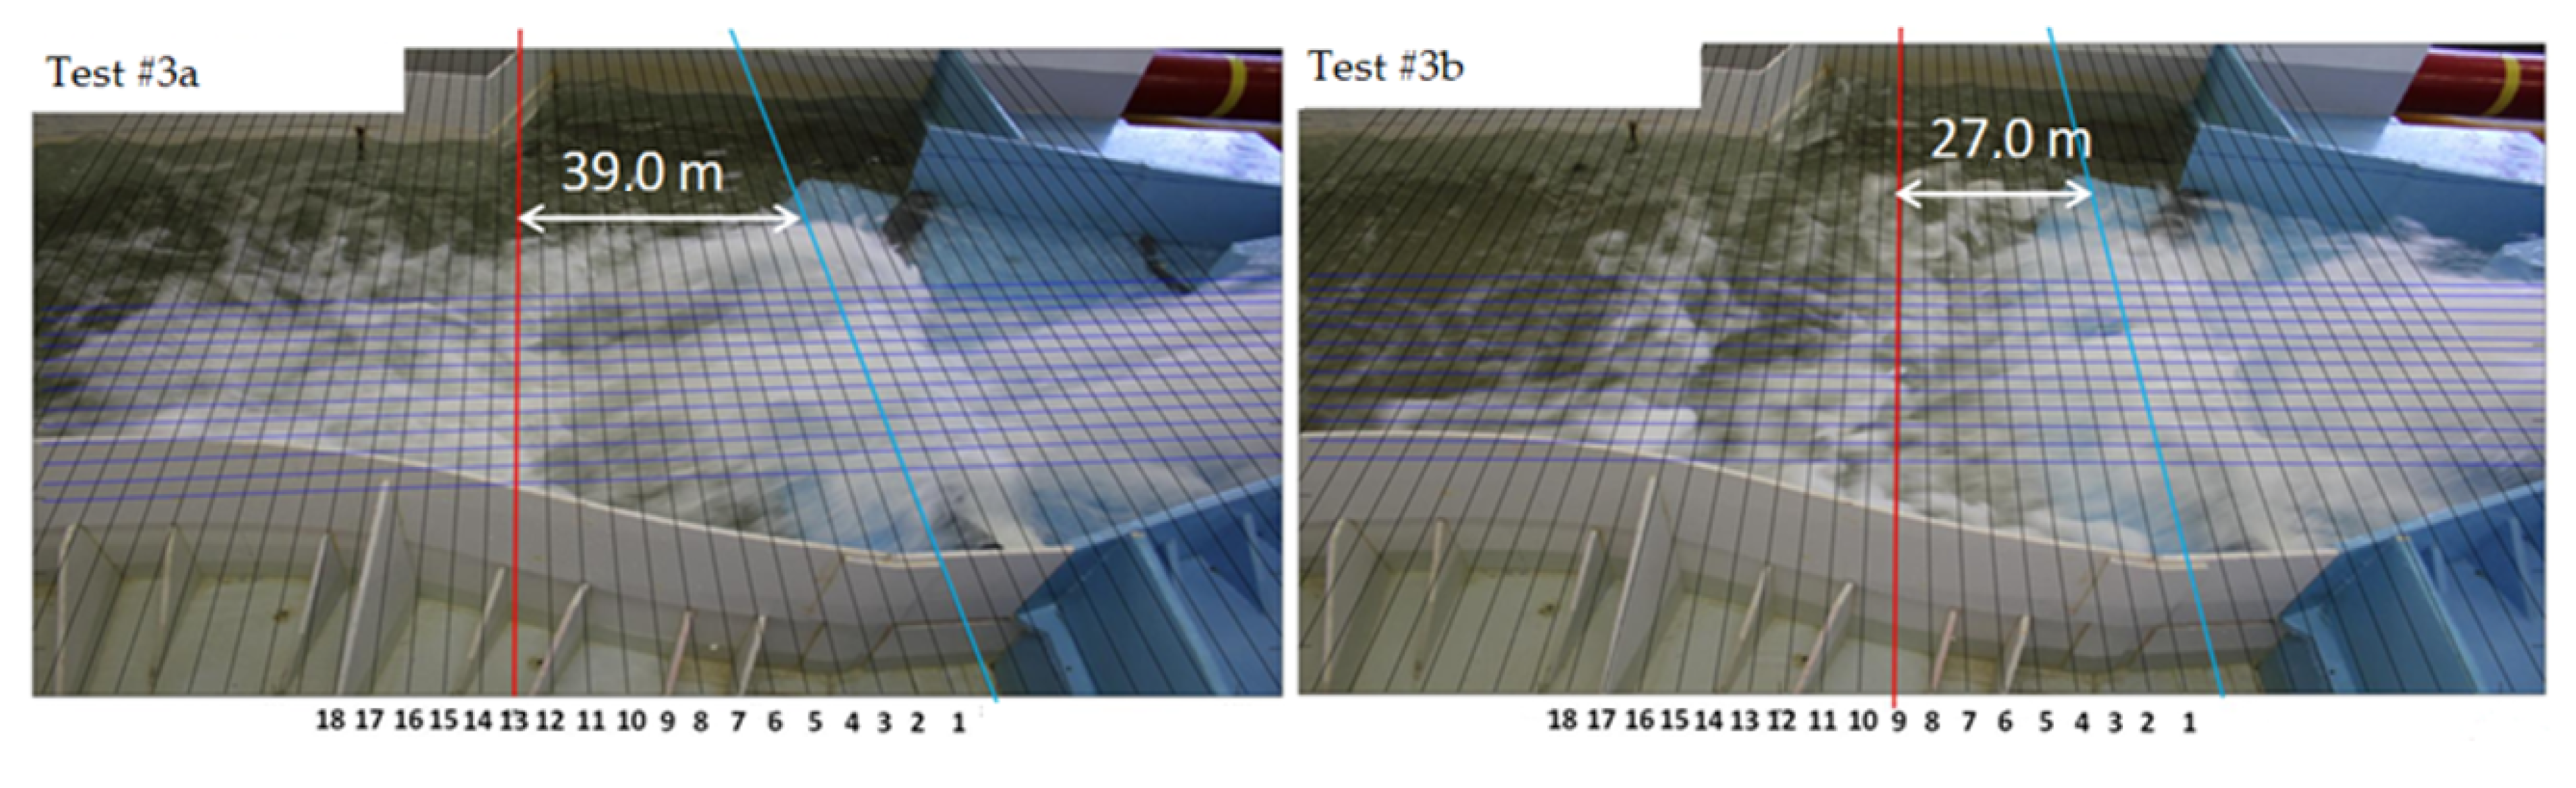
Figure 11a presents the results of the experiment with a discharge equal to 1450 m3/s and the ski jump like sill in place. The figure shows the significant erosion occurring on the left bank which produces a scour hole of about 10.0 m. Furthermore, the jet impacting the riverbed induces an erosion in the order of 12.0 m. This test has suggested the need for a deeper investigation on the effects of the ski jump sill on the flow circulation, in particular downstream of the stilling basin. An experiment has then been carried out for the same discharge without the sill (Test #3b). Figure 12 shows the images of the hydrodynamics in the stilling basin and in the riverbed downstream from the lateral view. In each image, a 5 × 5 cm2 mesh (model scale) corresponding to a 3 × 3 m2 mesh at prototype scale is overlapped to the area investigated. The blue line corresponds to the end of the exit sill while the red line defines the area of impact of the jet outflowing from the spillway chute. The comparison between the images clearly shows the effect of the ski jump sill removal which produces a decrease of the distance between the jet impact area and the stilling basin of roughly 12 m.
Figure 11b presents the erosion/deposition maps recorded for the experiment run at the same discharge as Tests #3a (1450 m3/s) and without ski jump sill. Remarkably, the removal of the sill produces a drastic reduction in the erosion phenomenon (see Figure 11a). Nevertheless, the area close to the left bank is still subject to a significant scour (about 8.0 m).
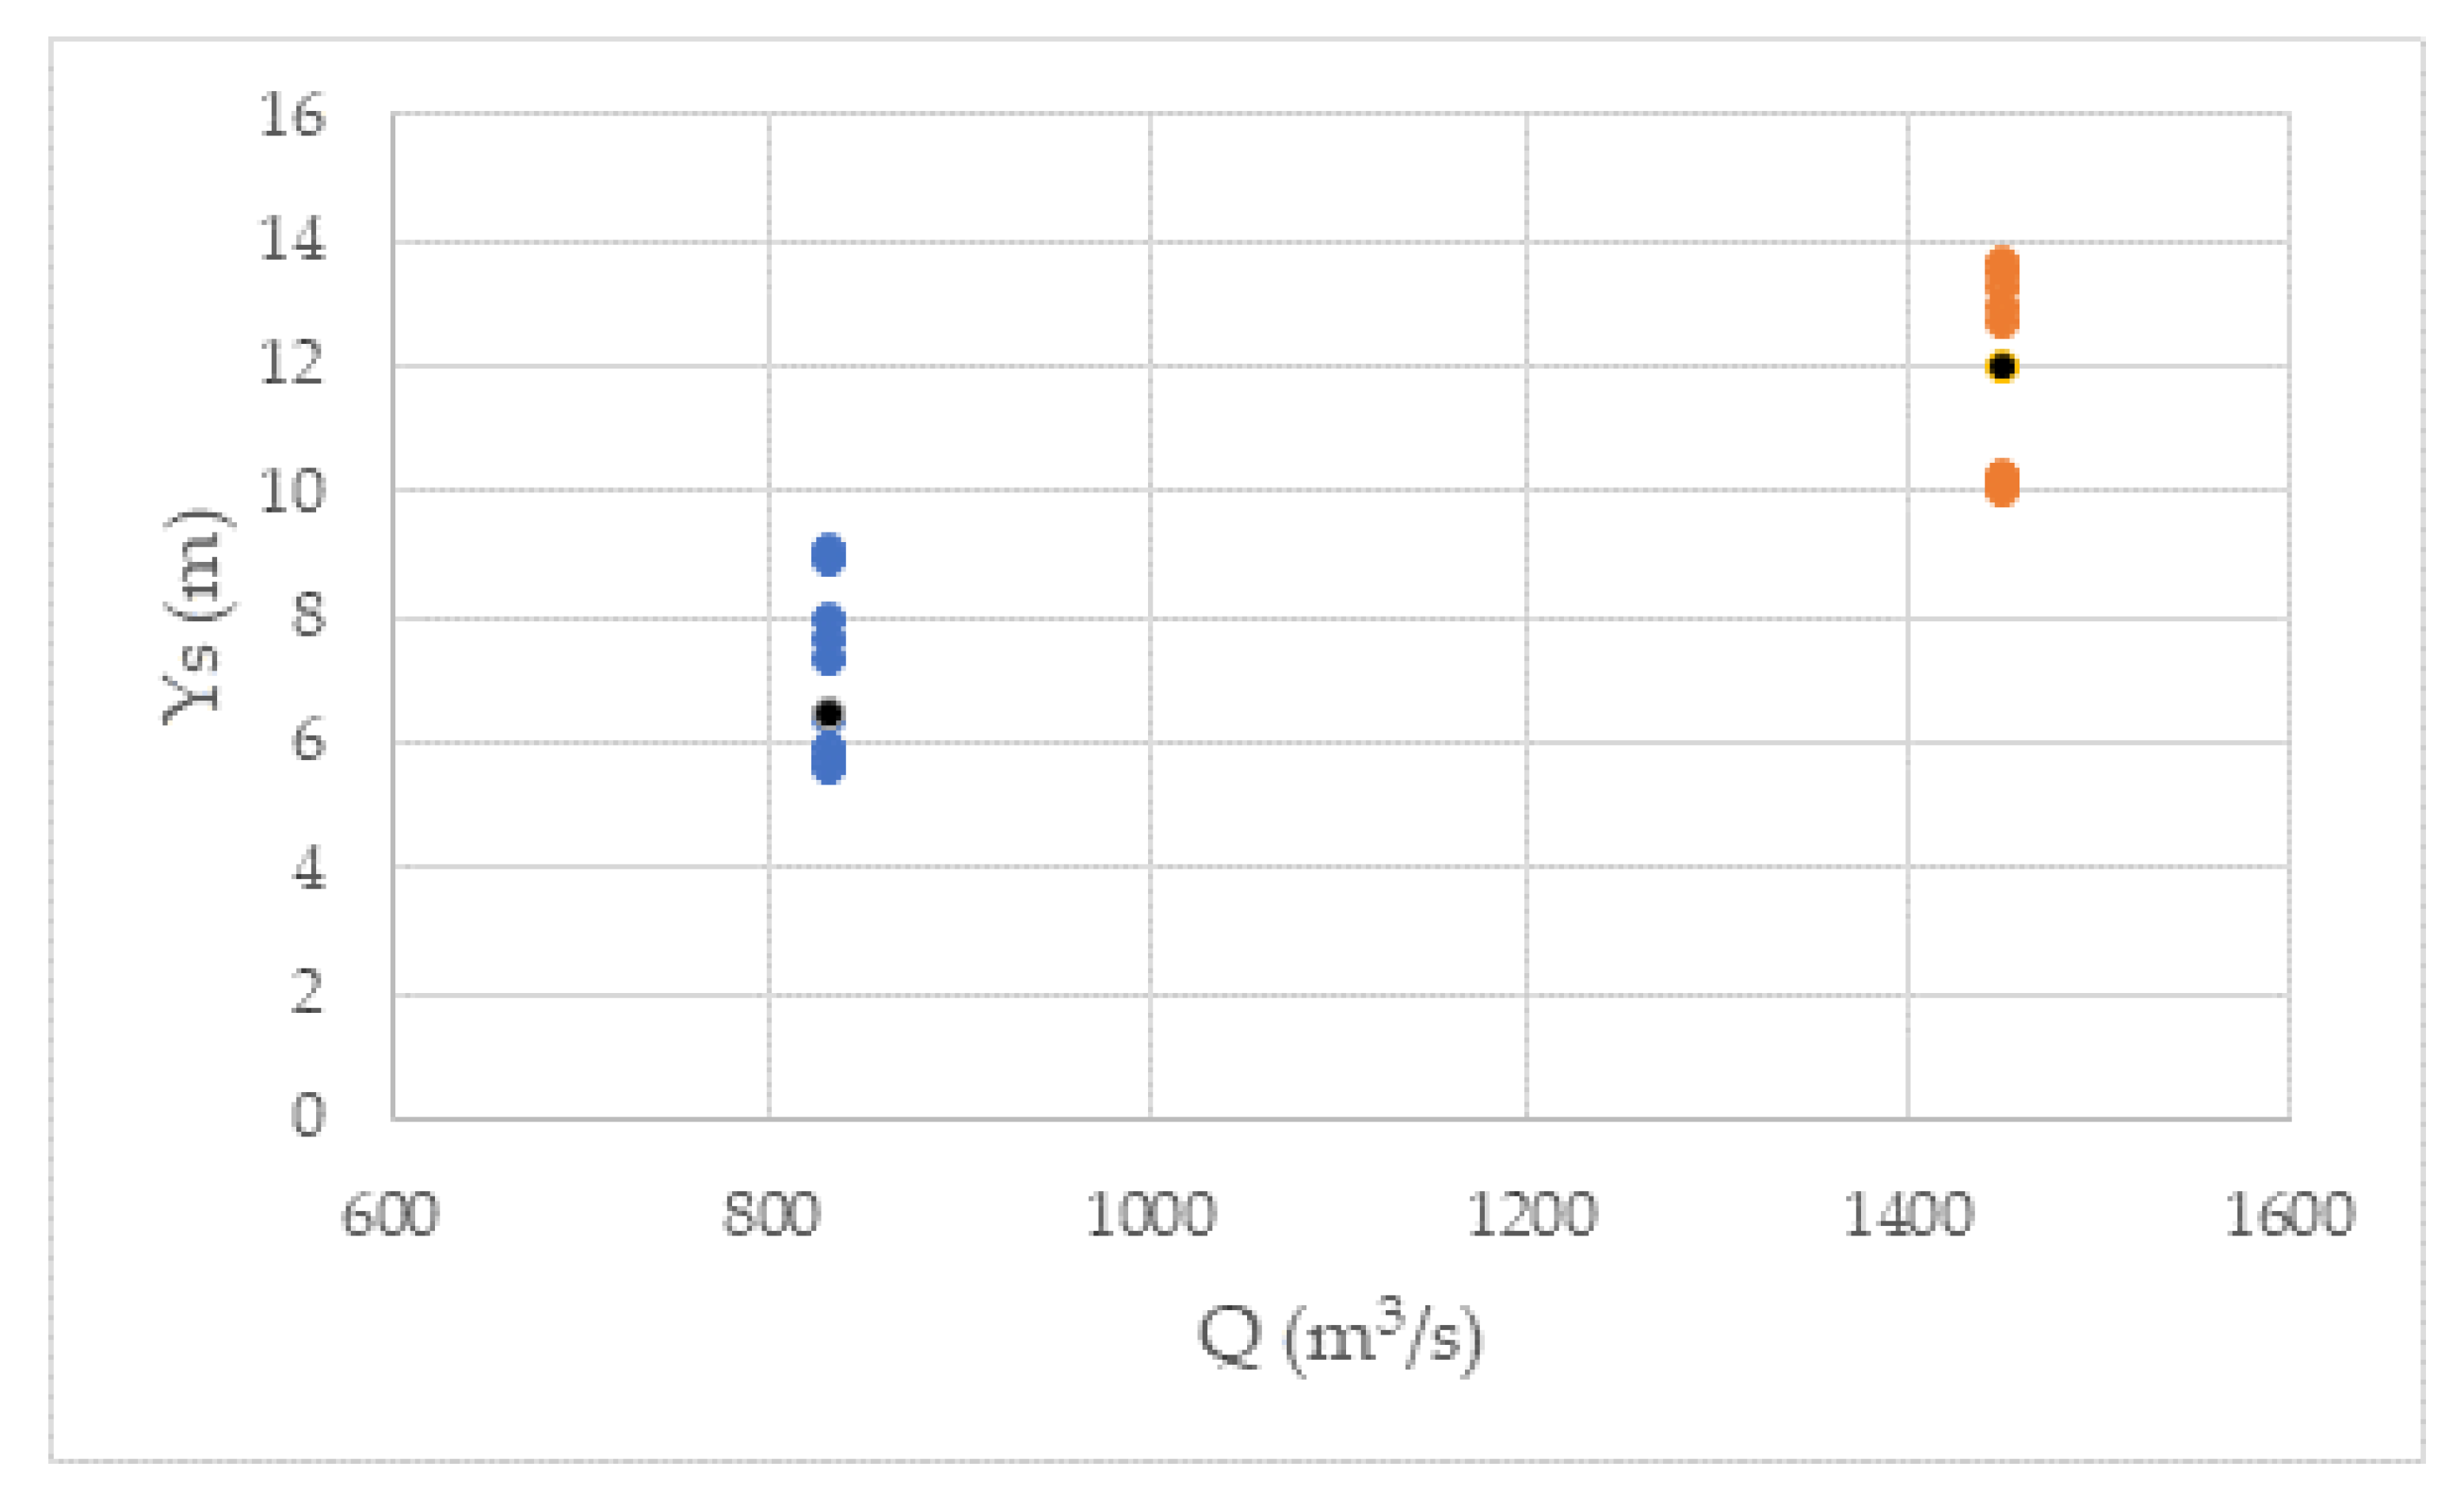
The general formula suggested by [30] has been used to determine the scour:
where Ys is the scour depth below the original bed, Y0 the tailwater depth, Q the flowrate, k an experimental coefficient, H the energy head, g the gravity acceleration, and Dm, D85, D90 the diameters at the 50th, 85th, and 90th percentile, respectively. Table 2 presents the set of coefficients adopted for the calculation.
A scour ranging between 5 m and 9 m (in prototype scale) has been calculated with the formula for the discharge equal to 830 m3/s (same as in the event of January 2003). For the higher discharge, i.e., 1450 m3/s, the scour ranges between 10 m and 14 m (in prototype scale). Scour values are displayed in Figure 13. Both results are consistent with the scour measured with the physical model.
The consistent values for the scour calculated with the empirical formulas and measured with the physical model confirm the need for an artificial protection area downstream of the stilling basin (described in Figure 10 and Figure 11).
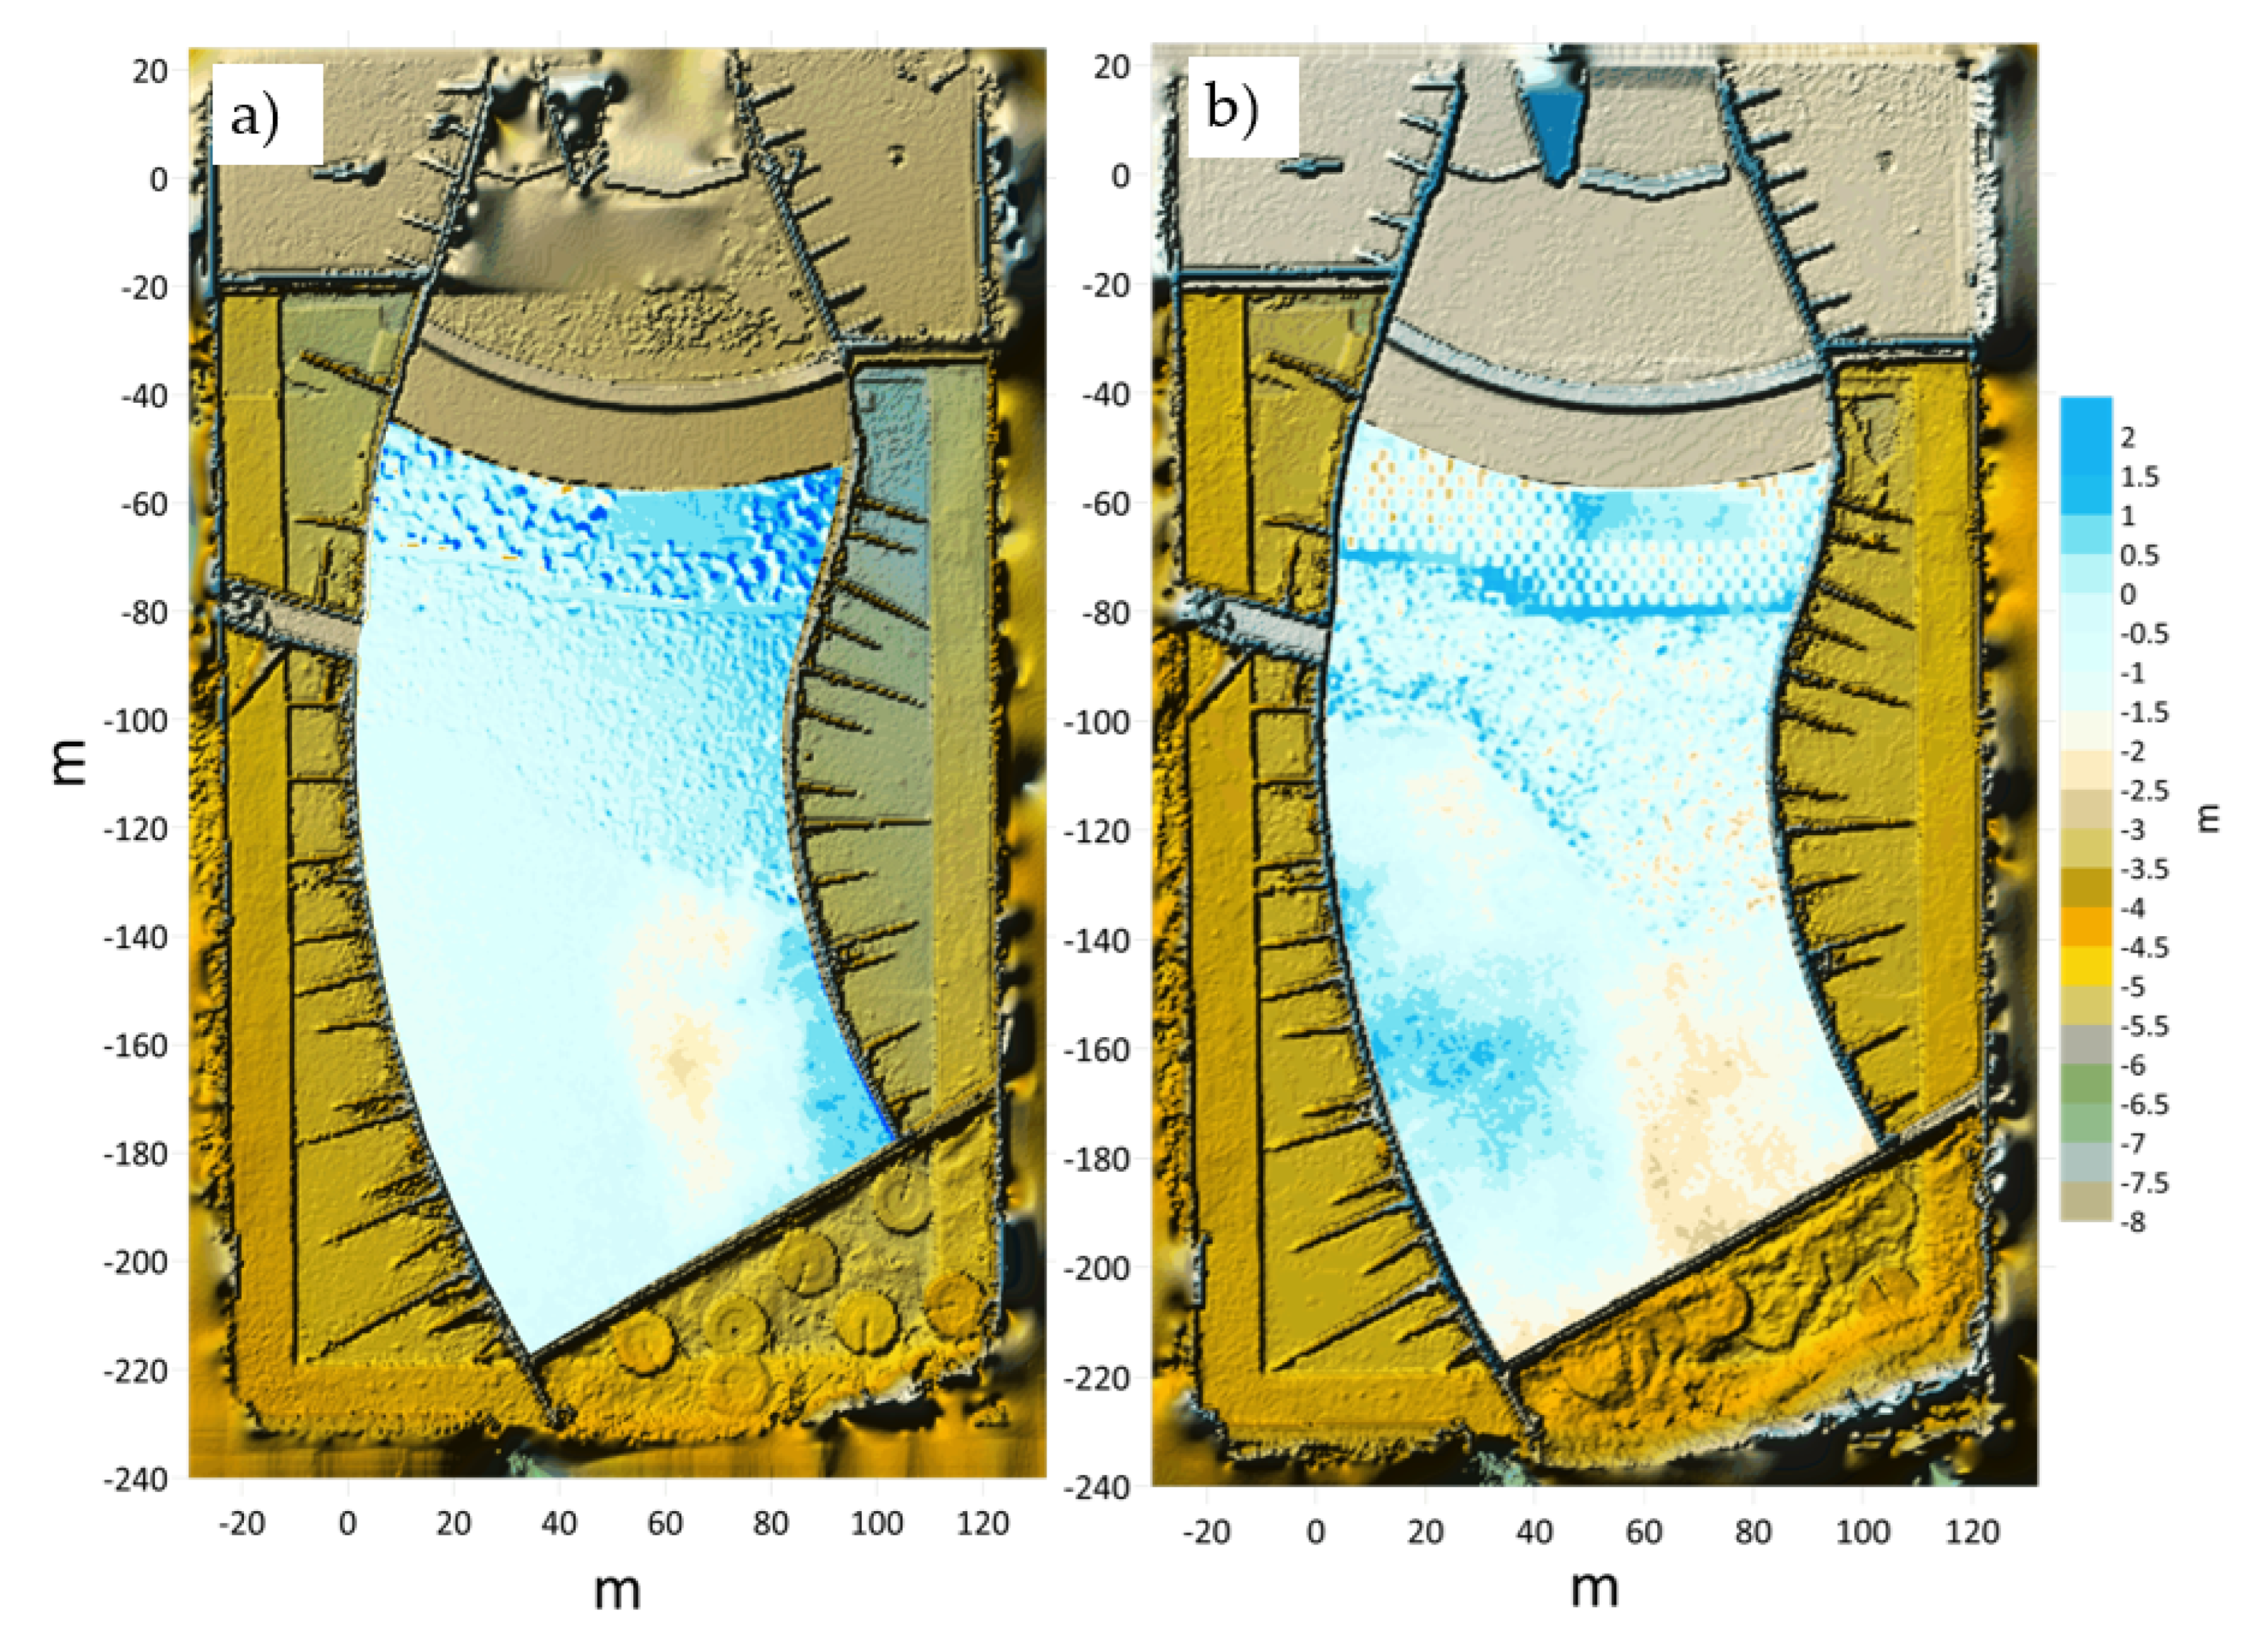
Figure 14 presents the erosion/deposition maps for the experiment run at a discharge equal to 830 m3/s and protection area downstream of the stilling basin realized with Antifer blocks arranged with random (Test #2a, Figure 14a) and closed pyramid (Test #2b, Figure 14b) configurations. As shown in the figures, both arrangements allow a drastic reduction of the observed erosion phenomenon.
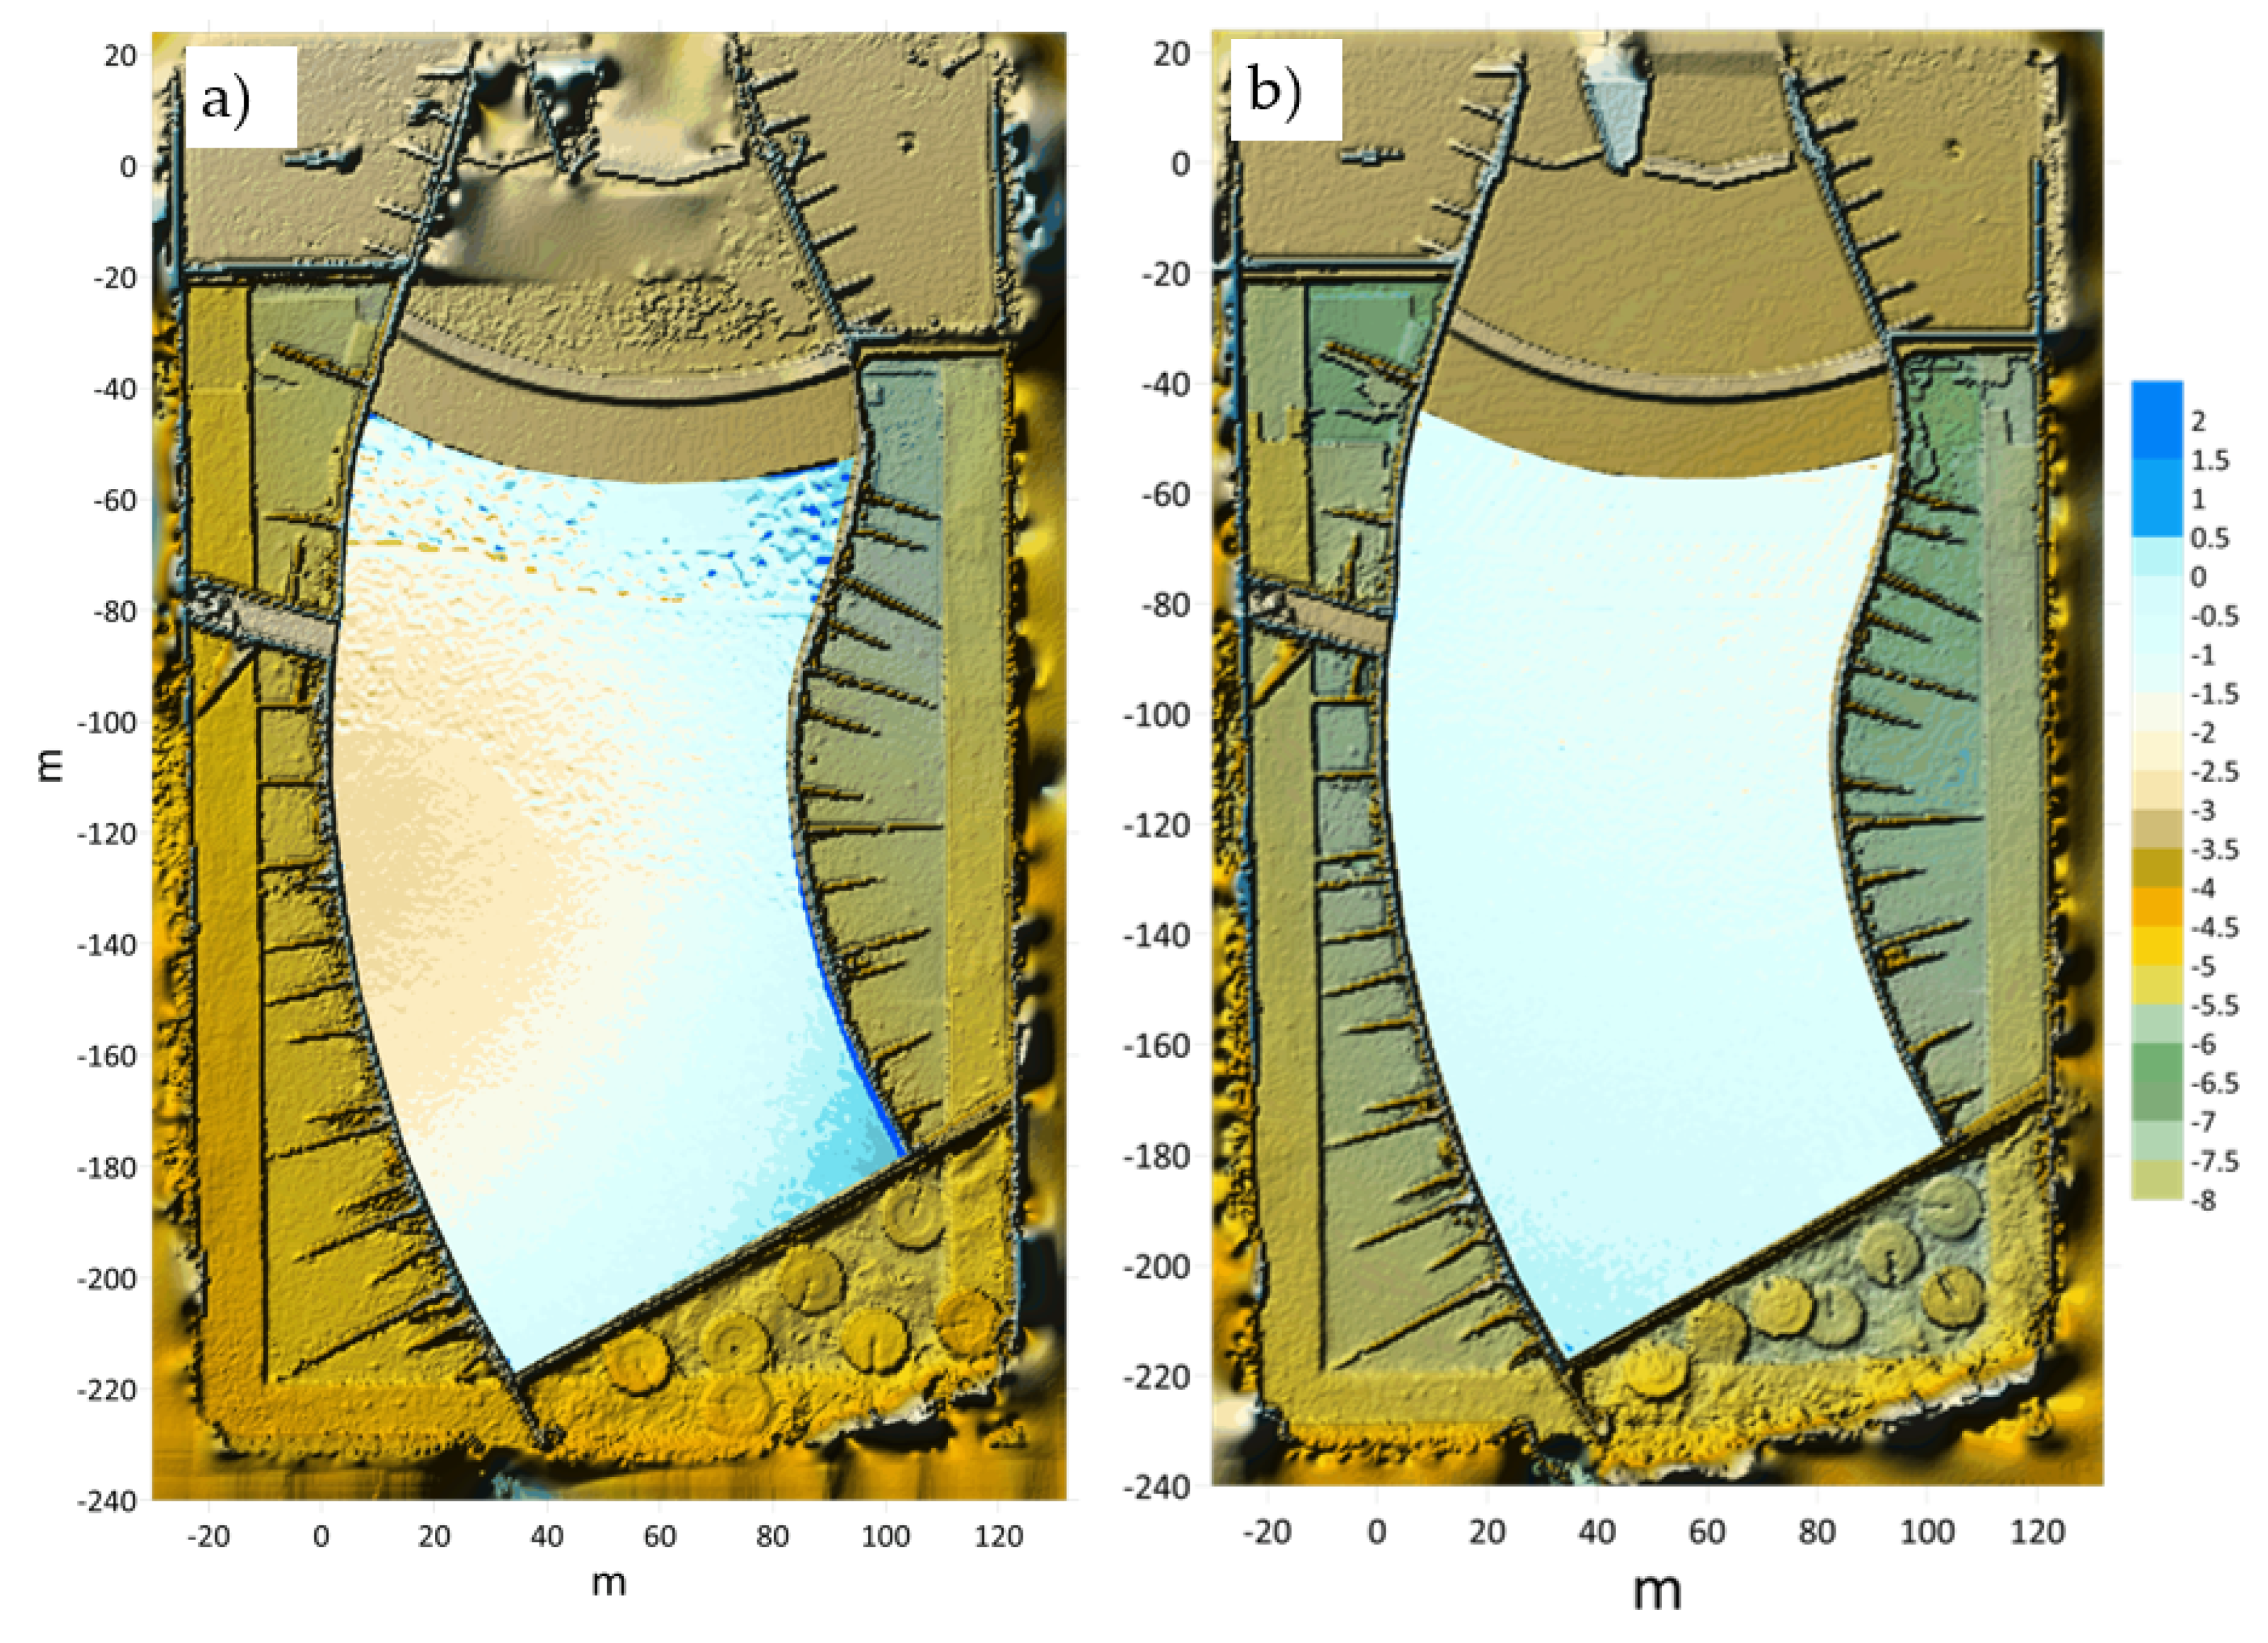
Two further tests have been run to verify the performance of the Antifer blocks at higher discharges. Figure 15 presents the results of Test #4a and Test #4b run at a discharge equal to 1450 m3/s and protection area downstream of the stilling basin realized with Antifer blocks arranged with random (Test #4a, Figure 15a) and closed pyramid (Test #4b, Figure 15b) configurations. An evident reduction of the erosion phenomenon is observed for both the Antifer arrangements compared to the results obtained for the same discharge, ski jump sill removed from the model, and no protection area realized downstream of the stilling basin (Test #3b, Figure 11b).
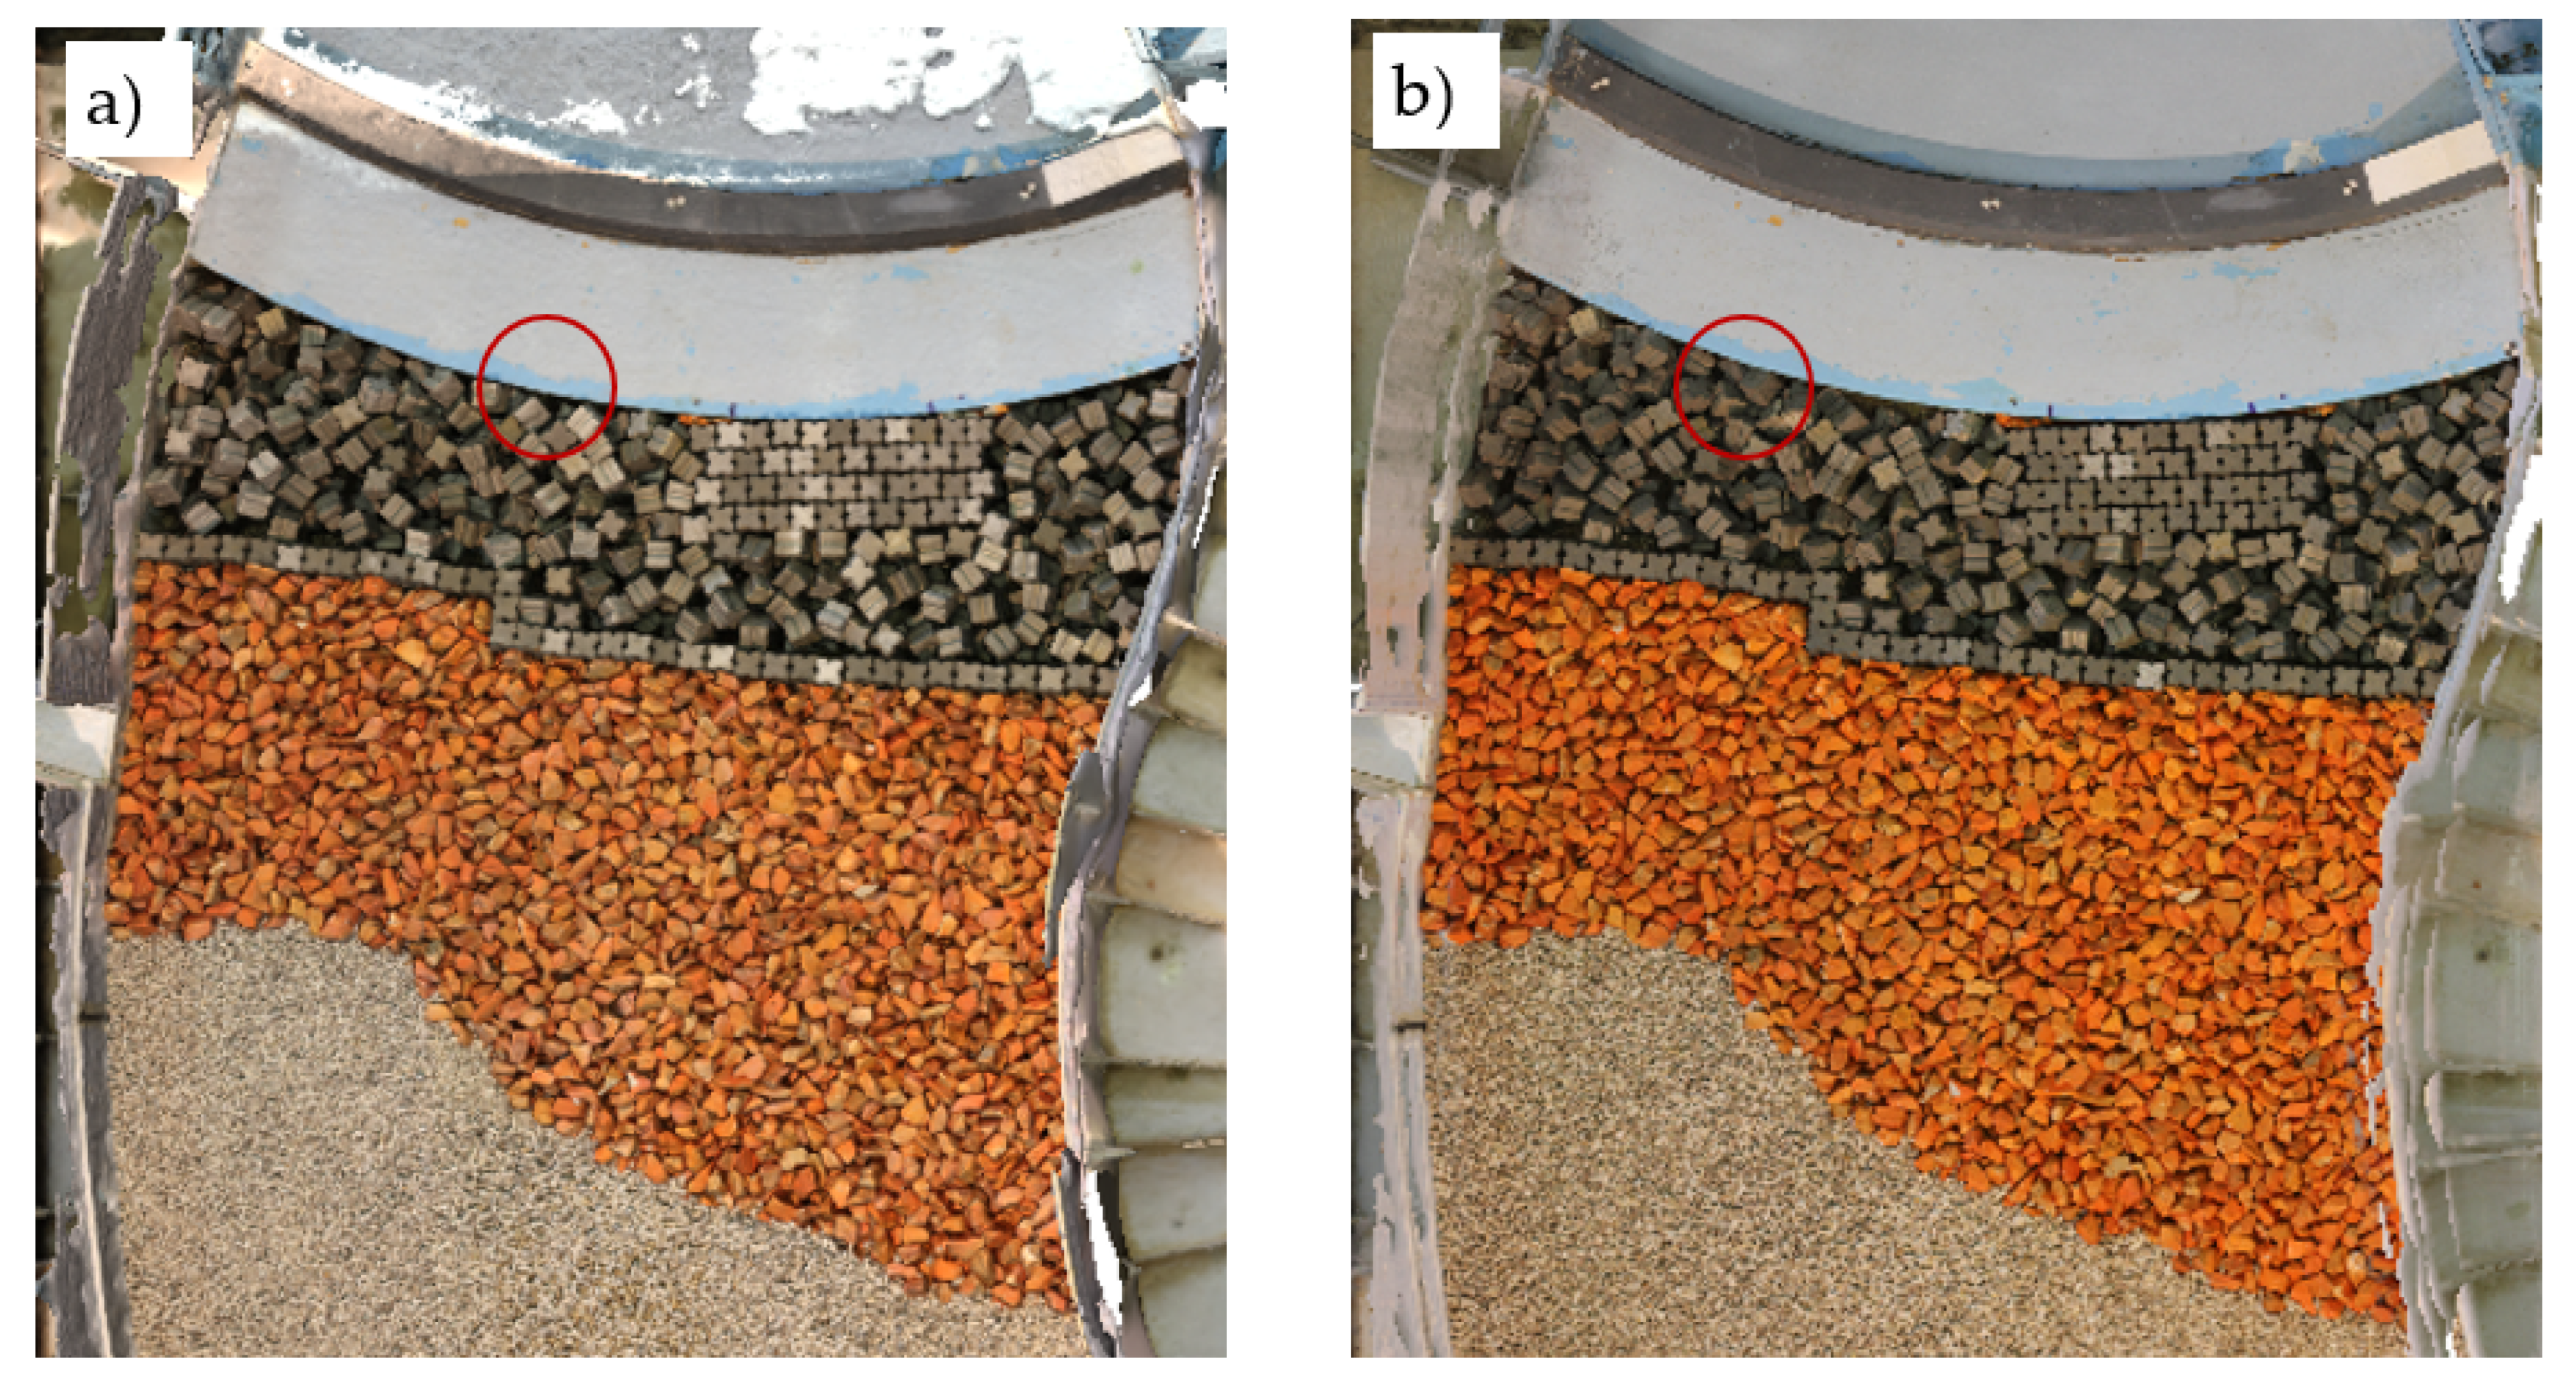
As far as it concerns the hydraulic stability of the Antifer blocks within the protection area, i.e., their resistance to rocking, settling, displacement, and sliding, a local displacement of the blocks has been observed at the end of Test #4a, i.e., for the random configuration. For this experiment, the maximum erosion/deposition detected in the protection area is in the order of 2.0 m, which is approximately the Antifer height. Figure 16 presents the images of the superficial protection layer at the beginning and the end of Test #4a. The artificial stones have been subject to rocking. It is worth mentioning that each test has been repeated three times to ensure consistency of the results. All the tests performed with the random arrangement have produced rocking of a few Antifer blocks in the area highlighted in Figure 16.
It is worth noting that the area characterized by the double-layer column placement is not subjected to any erosion/deposition phenomenon. Moreover, the downstream area protected with natural stones of mass 6.0–10.0 t (in prototype scale) is characterized by negligible changes after 30 min of experiment.
The main difference between the performance of the random configuration compared to the pyramid one is related to the effects of the flow on the riverbed downstream of the stilling basin. In the pyramid placement, the enhanced energy dissipation induced by the stone arrangement is lesser, compared to the dissipation induced by the random placement. This leads to a larger erosion area with small to negligible scour.
6. Concluding Remarks
This experimental study aims to test the use of Antifer blocks as effective protection of riverbeds downstream of outlet works. Basically, the proposed technique borrows the technical solutions used in the maritime field to create armors of rubble mound breakwaters subjected to breaking wave loads.
The results of the study described herein are intended to be useful when natural rocks cannot be employed due to their large stable weight. The proposed technique is an appropriate alternative to the modification of stilling basin configuration when scour phenomena are directly related to its undersizing. Indeed, such a kind of intervention usually needs diversion works. The proposed alternative represents a quickly-to-deploy technique that can be applied during summer months when water discharge is likely to be low, hence making it possible to work safely in the downstream river.
The case of the Liscione dam (Italy) has been used and experimentally tested as a case study to demonstrate the efficacy of the proposed technical solution. A first series of experimental tests was carried out to validate and calibrate the physical model and experimental observations confirmed the scour of the riverbed observed in the prototype which is linked to the undersizing of the stilling basin. The extent of the scour observed is potentially harmful to the basin as well as to the river banks. The preliminary tests further suggest that the main cause of the scour downstream of the stilling basin is represented by the significant jet-like flow outflowing from the spillway chute. Indeed, it is observed that the ski jump like sill located downstream of the surface spillway induces a surface jet making the downstream boundary of the stilling basin ineffective in the dissipation of flow energy. The dissipative efficiency of the stilling basin has been tested by removing the ski jump sill. The erosion appears significantly reduced without the sill, though the jet outflowing the surface spillways is always present. The experiments carried out on the physical models reproducing the protected riverbed have then been run removing the ski jump like sill. The proposed technique, based on the use of Antifer blocks, has been tested. The mass of the boulders has been selected by using a novel design criterion based on the stable natural rocks weight (experimentally found by trials and errors for the case at hand). The suggested protected area is divided into two parts: an area just downstream of the still basins, i.e., directly affected by the water jet, armored with heavy artificial boulders (prototype scale mass between 25.0 t and 35.0 t) arranged with a closed pyramid placement and an area far enough from the exit section of the dam where lighter natural rocks (prototype scale weight between 6.0 t and 10.0 t) are sufficient to avoid scour phenomena.
Experimental findings reveal that the proposed technique is quite effective in limiting the scour phenomenon and regular placements behave more stable than irregular placements with a similar packing density.
Author Contributions
Conceptualization, P.D.G. and M.D.R.; methodology, P.D.G., M.M., M.C., and M.D.R.; validation, P.D.G., M.C., M.M., and C.C.; investigation, C.C., M.C., and M.M.; data curation, M.C. and M.M.; writing—original draft preparation, M.C. and M.M.; funding acquisition, P.D.G. All authors have read and agreed to the published version of the manuscript.
Funding
This research was partially funded by Molise Acque under contract n. 28/09/2018.
Data Availability Statement
The data presented in this study are available on request from the corresponding author.
Acknowledgments
The authors wish to thank Molise Acque and Carlo Tatti for funding the present research. The authors wish to thank Fabio Capozzi for his support in the design of the tank and Gian Mario Beltrami Campagani for his useful suggestions concerning the design of Antifer blocks. The Authors wish also to thank Fabio Sammartino for his immeasurable contribution in building the laboratory model; Lucio Matergia (from L’Aquila University) for his help during the model realization; Gaia Pavesi, Eng. Lorenzo Benincasa Stagni, Dario Dotti, Simone Cignarella for their invaluable help during the model setup and experimental campaign.
Conflicts of Interest
The authors declare no conflict of interest. The funders had no role in the design of the study; in the collection, analyses, or interpretation of data; in the writing of the manuscript, or in the decision to publish the results.
References
- Di Risio, M.; Bruschi, A.; Lisi, I.; Pesarino, V.; Pasquali, D. Comparative analysis of coastal flooding vulnerability and hazard assessment at national scale. J. Mar. Sci. Eng. 2017, 5, 51. [Google Scholar] [CrossRef] [Green Version]
- De Bruijn, K.; Klijn, F.; Ölfert, A.; Penning-Rowsell, E.; Simm, J.; Wallis, M. Flood Risk Assessment and Flood Risk Management; An Introduction and Guidance Based on Experiences and Findings of FLOODsite (An EU-Funded Integrated Project); T29-09-01; FLOODsite Consortium: Wallingford, UK, 2009. [Google Scholar]
- Pachauri, R.K.; Allen, M.R.; Barros, V.R.; Broome, J.; Cramer, W.; Christ, R.; Church, J.A.; Clarke, L.; Dahe, Q.; Dasgupta, P.; et al. Climate Change 2014: Synthesis Report. Contribution of Working Groups I, II and III to the Fifth Assessment Report of the Intergovernmental Panel on Climate Change; IPCC: Geneva, Switzerland, 2014; p. 151. [Google Scholar]
- Moroni, M.; Porti, M.; Piro, P. Design of a Remote-Controlled Platform for Green Roof Plants Monitoring via Hyperspectral Sensors. Water 2019, 11, 1368. [Google Scholar] [CrossRef] [Green Version]
- Badas, M.G.; Rossi, R.; Garau, M. May a Standard VOF Numerical Simulation Adequately Complete Spillway Laboratory Measurements in an Operational Context? The Case of Sa Stria Dam. Water 2020, 12, 1606. [Google Scholar] [CrossRef]
- Yagci, O.; Kapdasli, S. Alternative placement technique for Antifer blocks used on breakwaters. Ocean Eng. 2003, 30, 1433–1451. [Google Scholar] [CrossRef]
- Celli, D.; Pasquali, D.; De Girolamo, P.; Di Risio, M. Effects of submerged berms on the stability of conventional rubble mound breakwaters. Coast. Eng. 2018, 136, 16–25. [Google Scholar] [CrossRef]
- Maquet, J.F. Port of Antifer (France). Design and Construction of Mounds for Breakwaters and Coastal Protection; Elsevier: Oxford, UK, 1985; pp. 696–703. [Google Scholar]
- Günbak, A.R. Antifer cubes on rubble mound breakwaters. In Proceedings of the COPED, Cape Town, South Africa, 1–8 December 1999. [Google Scholar]
- Coastal Engineering Research Center (US). Shore Protection Manual, 4th ed.; US Army Coastal Engineering Research Center: Vicksburg, MS, USA, 1984. [Google Scholar]
- Van der Meer, J.W. Stability of breakwater armour layers—Design formulae. Coast. Eng. 1987, 11, 219–239. [Google Scholar] [CrossRef]
- Izbash, S.V.; Khaldre, K.Y. Hydraulics of River Channel Closure; Butterworths: London, UK, 1970. [Google Scholar]
- CIRIA; CUR; CETMEF. The Rock Manual: The Use of Rock in Hydraulic Engineering. In Construction Industry Research and Information Association and Civieltechnisch CentrumUitvoering Research en Regelgeving (Netherlands) and Centre D’études Maritimes et Fluviales (France), 2nd ed.; CIRIA: London, UK, 2012; Volume 683. [Google Scholar]
- Maynord, S.T. Corps riprap design guidance for channel protection. River Coast. Shorel. Prot. 1995, 10, 41–52. [Google Scholar]
- Pilarczyk, K.W. Simplified Unification of Stability Formulae for Revetments under Current and Wave Attack; John Wiley and Sons: Chichester, UK, 1995; Volume 22, pp. 53–73. [Google Scholar]
- Escarameia, M. River and channel revetments. Des. Man. 1998, 20, 245. [Google Scholar]
- Begam, S.; Sen, D.; Dey, S. Moraine dam breach and glacial lake outburst flood generation by physical and numerical models. J. Hydrol. 2018, 563, 694–710. [Google Scholar] [CrossRef]
- Hughes, S.A. Physical Models and Laboratory Techniques in Coastal Engineering; World Scientific Publishing: Singapore, 1993; Volume 7, ISBN 9810215401. [Google Scholar]
- Heller, V. Scale effects in physical hydraulic engineering models. J. Hydraul. Res. 2011, 49, 293–306. [Google Scholar] [CrossRef]
- Castillo, L.G.; Carrillo, J. Comparison of methods to estimate the scour downstream of a ski jump. Int. J. Multiph. Flow 2017, 92, 171–180. [Google Scholar] [CrossRef]
- Duarte, R.; Pinheiro, A.; Schleiss, A. An enhanced physically based scour model for considering jet air entrainment. Engineering 2016, 2, 294–301. [Google Scholar] [CrossRef] [Green Version]
- Schmocker, L.; Pfister, M.; Hager, W.H.; Minor, H.E. Aeration characteristics of ski jump jets. J. Hydraul. Eng. 2008, 134, 90–97. [Google Scholar] [CrossRef]
- Chanson, H. Turbulent air-water flows in hydraulic structures: Dynamic similarity and scale effects. Environ. Fluid Mech. 2009, 9, 125–142. [Google Scholar] [CrossRef] [Green Version]
- Chanson, H. Hydraulics of Open Channel Flow. In An Introduction Basic Principles, Sediment Motion, Hydraulic Modelling, Design of Hydraulic Structures; Butterworth-Heinemann: Oxford, UK, 2004. [Google Scholar]
- Sammarco, P.; Di Risio, M. Effects of moored boats on the gradually varied free-surface profiles of river flows. J. Waterw. PortCoast. Ocean Eng. 2017, 143, 04016020. [Google Scholar] [CrossRef]
- Di Risio, M.; Sammarco, P. Effects of floaters on the free surface profiles of river flows. Environ. Fluid Mech. 2020, 20, 527–537. [Google Scholar] [CrossRef]
- Di Risio, M.; Lisi, I.; Beltrami, G.M.; De Girolamo, P. Physical modeling of the cross-shore short-term evolution of protected and unprotected beach nourishments. Ocean Eng. 2010, 37, 777–789. [Google Scholar] [CrossRef]
- Kamphuis, J.W. Physical Modeling. In Handbook of Coastal and Ocean Engineering; Herbich, J.B., Ed.; Gulf Publishing Company: Houston, TX, USA, 1991; Volume 2. [Google Scholar]
- Frens, A.B. The Impact of Placement Method on Antifer-Block Stability. Master’s Thesis, Delft University of Technology, Civil Engineering and Geosciences, Hydraulic Engineering, Delft, The Netherlands, 2007. [Google Scholar]
- Castillo, L.G.; Carrillo, J.M. Scour, velocities and pressures evaluations produced by spillway and outlets of dam. Water 2016, 8, 68. [Google Scholar] [CrossRef] [Green Version]
- Eggenberger, W. Die Kolkbildung Bei Einem Uberstromen und Bei Der Kombination Uberstromen-Unterstromen. Ph.D. Thesis, ETH Zürich, Zürich, Switzerland, 1943. (In German). [Google Scholar]
- Hartung, W. Die kolkbildung hinter uberstromten wehren im hinblick auf eine bewegliche sturzbettgestaltung. Wasserwirtshaft 1959, 49, 309–313. (In German) [Google Scholar]
- Chee, S.P.; Padiyar, P.V. Erosion at the base of flip buckets. Eng. J. Can. 1969, 52, 22–24. [Google Scholar]
- Martins, R. Contribution to the Knowledge on the Scour Action of Free Jets on Rocky River Beds. In Proceedings of the 11th Inter, Comm. on Large Dams, IIQ41, Madrid, Spain, 4–9 June 1973. [Google Scholar]
- Chian, M.W. Scour at downstream end of dams in Taiwan. Sediment Transp. 1973, 1, 1–10. [Google Scholar]
- Chee, S.P.; Kung, T. Piletas de derrubio autoformadas. In 6th Latin American Congress of the International Association for Hydraulic Research, Bogota, Columbia, Paper D. 1974; Volume 7. [Google Scholar]
- Martins, R. Scouring of rocky riverbeds by free-jet spillways. Int. Water Power Dam Constr. 1975, 27, 152–153. [Google Scholar]
- Machado, L.I. O Sistema de Dissipacao de Energia Proposto para a Barragem de Xingo. In Transactions of the International Symposium on the Layout of Dams in Narrow Gorges; ICOLD: Rio de Janeiro, Brazil, 1982. [Google Scholar]
- INCYTH-LHA. Estudio Sobre Modelo del Aliviadero de la Presa Casa de Piedra, Informe Final; DOH-044-03-82; Laboratorio de Hidráulica-Instituto Nacional del Agua: Ezeiza, Argentina, 1982. (In Spanish) [Google Scholar]
Figure 1.
The area investigated: geographical framework [Map data: Google].

Figure 2.
Upper panel: surface spillway, bottom outlet components and dissipating structures. Lower panel: surface spillway: (a) ungated ogee weir (free Creager type sill); (b) gated weir with three 13 m wide openings, equipped with automatic flap gates.
Figure 2.
Upper panel: surface spillway, bottom outlet components and dissipating structures. Lower panel: surface spillway: (a) ungated ogee weir (free Creager type sill); (b) gated weir with three 13 m wide openings, equipped with automatic flap gates.

Figure 3.
(a) Chute; (b) stilling basin; (c) terminal sill and river bed protection; (d) longitudinal section of the surface spillway, chute and stilling basin.
Figure 3.
(a) Chute; (b) stilling basin; (c) terminal sill and river bed protection; (d) longitudinal section of the surface spillway, chute and stilling basin.

Figure 4.
Laboratory model: (a) surface spillway; (b) chute, bottom outlet terminus, sills, and stilling basin.
Figure 4.
Laboratory model: (a) surface spillway; (b) chute, bottom outlet terminus, sills, and stilling basin.

Figure 5.
Riverbed configuration of the first set of the physical model tests performed, corresponding to the current real layout.
Figure 5.
Riverbed configuration of the first set of the physical model tests performed, corresponding to the current real layout.

Figure 6.
Scheme of the model in which the protection of the riverbed is realized with natural stones placed downstream of the stilling basin. Dimensions in prototype scale.
Figure 6.
Scheme of the model in which the protection of the riverbed is realized with natural stones placed downstream of the stilling basin. Dimensions in prototype scale.

Figure 7.
Scheme of the laboratory model in which the protection of the riverbed is realized with Antifer blocks (25 t in prototype scale) placed downstream of the stilling basin. Dimensions in prototype scale.
Figure 7.
Scheme of the laboratory model in which the protection of the riverbed is realized with Antifer blocks (25 t in prototype scale) placed downstream of the stilling basin. Dimensions in prototype scale.

Figure 8.
(a) Random placement and (b) closed pyramid placement of Antifer blocks.

Figure 9.
Comparison between the 2003 flow event (on the left) and the model scale reproduction (on the right).
Figure 9.
Comparison between the 2003 flow event (on the left) and the model scale reproduction (on the right).

Figure 10.
Erosion/deposition map (dimensions in meters) reconstructed processing images of Test #1; the discharge is equal to 830 m3/s (same as in the event of January 2003). The ski jump sill is in place during the experiment.
Figure 10.
Erosion/deposition map (dimensions in meters) reconstructed processing images of Test #1; the discharge is equal to 830 m3/s (same as in the event of January 2003). The ski jump sill is in place during the experiment.

Figure 11.
Erosion/deposition maps (dimensions in meters) reconstructed processing images of (a) Test #3a and (b) Test #3b; for both tests, the discharge was set to 1450 m3/s. The ski jump sill is in place during Test #3a (left-hand side panel) whereas it is removed during Test #3b (right-hand side panel).

Figure 12.
Hydrodynamics in the stilling basin and in the riverbed downstream from the lateral view for Test #3a (ski jump like sill in place) and Test #3b (ski jump like sill removed).
Figure 12.
Hydrodynamics in the stilling basin and in the riverbed downstream from the lateral view for Test #3a (ski jump like sill in place) and Test #3b (ski jump like sill removed).

Figure 13.
Scour calculated with (2) for discharge set to 830 m3/s and 1450 m3/s.

Figure 14.
Comparison between the erosion/deposition maps (dimensions in meters) reconstructed processing images of (a) Test #2a (left) and (b)Test #2b (right); for both tests, the discharge was set to 830 m3/s. The protection area has been realized employing Antifer blocks arranged with random (left-hand side panel) and closed pyramid (right-hand side panel) configurations.

Figure 15.
Comparison between the erosion/deposition maps (dimensions in meters) reconstructed processing images of (a) Test #4a and (b) Test #4b; for both tests the discharge was set to 1450 m3/s. The protection area has been realized employing Antifer blocks arranged with random (left-hand side panel) and closed pyramid (right-hand side panel) configurations.

Figure 16.
Comparison between the Antifer blocks location at the beginning and at the end of Test #4a. (a) Initial random placement configuration. (b) Antifer arrangement at the end of the experment. The local rotation of a few Antifer blocks is highlighted.
Figure 16.
Comparison between the Antifer blocks location at the beginning and at the end of Test #4a. (a) Initial random placement configuration. (b) Antifer arrangement at the end of the experment. The local rotation of a few Antifer blocks is highlighted.


Table 1.
Experimental test.
| Test # | Return Period Tr (Years) | Discharge(m3/s) | Sill#2 | “Column Placement” | “Random Placement” | “Closed Pyramid Placement” |
|---|---|---|---|---|---|---|
| 1 | 30–50 | 830 | Yes | No | No | No |
| 2a | 30–50 | 830 | No | Yes | Yes | No |
| 2b | 30–50 | 830 | No | Yes | No | Yes |
| 3a | 200 | 1450 | Yes | No | No | No |
| 3b | 200 | 1450 | No | No | No | No |
| 4a | 200 | 1450 | No | Yes | Yes | No |
| 4b | 200 | 1450 | No | Yes | No | Yes |
Table 2.
Coefficient adopted for the calculation of the scour with (2).
| k | a | b | c | e | f | h | i | |
|---|---|---|---|---|---|---|---|---|
| Eggenburger (1944) [31] | 1.440 | 0.60 | 0.5000 | 0 | 0 | 0 | 0 | 0.4000 |
| Hartung (1959) [32] | 1.400 | 0.64 | 0.3600 | 0 | 0 | 0 | 0.32 | 0 |
| Chee & Padiyar (1969) [33] | 2.126 | 0.67 | 0.1800 | 0 | 0 | 0.063 | 0 | 0 |
| Martins (1973) [34] | 1.500 | 0.60 | 0.0000 | 0 | 0 | 0 | 0 | 0 |
| Chian Min Wu (1973) [35] | 1.180 | 0.51 | 0.2350 | 0 | 0 | 0 | 0 | 0 |
| Chee & Kung (1974) [36] | 1.663 | 0.60 | 0.2000 | 0 | 0 | 0.100 | 0 | 0 |
| Martins (1975) [37] | 1.500 | 0.60 | 0.1000 | 0 | 0 | 0 | 0 | 0 |
| Machado (1980) [38] | 1.350 | 0.50 | 0.3145 | 0 | 0 | 0 | 0 | 0.0645 |
| INCYTH (1981) [39] | 1.413 | 0.50 | 0.2500 | 0 | 0 | 0 | 0 | 0 |
Publisher’s Note: MDPI stays neutral with regard to jurisdictional claims in published maps and institutional affiliations. |
© 2021 by the authors. Licensee MDPI, Basel, Switzerland. This article is an open access article distributed under the terms and conditions of the Creative Commons Attribution (CC BY) license (http://creativecommons.org/licenses/by/4.0/).
Share and Cite
MDPI and ACS Style
Castellino, M.; Moroni, M.; Cimorelli, C.; Di Risio, M.; De Girolamo, P. Riverbed Protection Downstream of an Undersized Stilling Basin by Means of Antifer Artificial Blocks. Water 2021, 13, 619. https://doi.org/10.3390/w13050619
AMA Style
Castellino M, Moroni M, Cimorelli C, Di Risio M, De Girolamo P. Riverbed Protection Downstream of an Undersized Stilling Basin by Means of Antifer Artificial Blocks. Water. 2021; 13(5):619. https://doi.org/10.3390/w13050619
Chicago/Turabian StyleCastellino, Myrta, Monica Moroni, Cosmo Cimorelli, Marcello Di Risio, and Paolo De Girolamo. 2021. "Riverbed Protection Downstream of an Undersized Stilling Basin by Means of Antifer Artificial Blocks" Water 13, no. 5: 619. https://doi.org/10.3390/w13050619
Note that from the first issue of 2016, this journal uses article numbers instead of page numbers. See further details here.