
Climatic Controls on Mean and Extreme Streamflow Changes Across the Permafrost Region of Canada


Watershed Hydrology and Ecology Research Division, Environment and Climate Change Canada, University of Victoria, 2472 Arbutus Rd., Victoria, BC V8N 1V8, Canada
*
Author to whom correspondence should be addressed.
Water 2021, 13(5), 626; https://doi.org/10.3390/w13050626
Submission received: 22 January 2021
/
Revised: 19 February 2021
/
Accepted: 23 February 2021
/
Published: 27 February 2021
(This article belongs to the Special Issue Hydrological Extremes in a Warming Climate: Nonstationarity, Uncertainties and Impacts)
Abstract
:Climatic change is affecting streamflow regimes of the permafrost region, altering mean and extreme streamflow conditions. In this study, we analyzed historical trends in annual mean flow (Qmean), minimum flow (Qmin), maximum flow (Qmax) and Qmax timing across 84 hydrometric stations in the permafrost region of Canada. Furthermore, we related streamflow trends with temperature and precipitation trends, and used a multiple linear regression (MLR) framework to evaluate climatic controls on streamflow components. The results revealed spatially varied trends across the region, with significantly increasing (at 10% level) Qmin for 43% of stations as the most prominent trend, and a relatively smaller number of stations with significant Qmean, Qmax and Qmax timing trends. Temperatures over both the cold and warm seasons showed significant warming for >70% of basin areas upstream of the hydrometric stations, while precipitation exhibited increases for >15% of the basins. Comparisons of the 1976 to 2005 basin-averaged climatological means of streamflow variables with precipitation and temperature revealed a positive correlation between Qmean and seasonal precipitation, and a negative correlation between Qmean and seasonal temperature. The basin-averaged streamflow, precipitation and temperature trends showed weak correlations that included a positive correlation between Qmin and October to March precipitation trends, and negative correlations of Qmax timing with October to March and April to September temperature trends. The MLR-based variable importance analysis revealed the dominant controls of precipitation on Qmean and Qmax, and temperature on Qmin. Overall, this study contributes towards an enhanced understanding of ongoing changes in streamflow regimes and their climatic controls across the Canadian permafrost region, which could be generalized for the broader pan-Arctic regions.
1. Introduction
The Arctic and subarctic regions of the world—mostly underlain by continuous/discontinuous permafrost—are affected by a range of extreme streamflow conditions, which include low to no flows in winter under ice-cover; spring floods due to river-ice breakup and snowmelt; snowmelt driven peak flows during spring/early summer; and in rare instances, rainfall driven peak flows in late summer. These extreme conditions are influenced by various climatological and landscape drivers and controls, and changes in these factors affect the magnitude, timing and duration of such events. Particularly, enhanced warming in the northern latitudes (which is almost twice the global average temperature increase [1,2,3]) and amplified poleward moisture transport to the region [4,5] (which propagates into increased precipitation) are affecting different components of the regional hydro-climatic systems. Prominent changes include reductions in the magnitude, duration and extent of snow cover [6,7,8], enhanced permafrost thaw [9,10] and changes in the snowfall–rainfall balance [11], all with the potential to alter the mean and extreme streamflow conditions across the permafrost region.
For instance, while warmer temperatures lead to an earlier snowmelt-driven peak flow [12,13], the magnitude of peak flow is mainly determined by the precipitation amount [14]. Furthermore, increased winter precipitation implies greater water input and larger snowpack storage in the basin, and thus, the potential for higher peak flows. In contrast, warmer temperatures tend to moderate peak flows by reducing the fraction of winter precipitation falling as snow and shortening the snow accumulation period [15]. On the other hand, spring rainfall and rain-on-snow events—which appear to be increasing in the recent years [16,17,18,19]—could enhance peak flow events. At the same time, permafrost degradation associated with the warming temperatures could lead to increases in subsurface flow pathways, soil moisture volume and groundwater recharge [20,21], which could lead to winter low flow increases. Additionally, permafrost thawing augments a basin’s water storage capacity, and could lead to decreases in the annual maximum discharge [22] as well as the maximum-to-minimum discharge ratio [23].
Changes in the mean streamflow state and extremes could make areas within permafrost region vulnerable. For instance, although current infrastructure in the permafrost region is limited, the development (e.g., hydroelectric water resources) is progressing at a rapid pace [24]. Thus, infrastructure design and operation need to take into account the changes in extremes. For instance, while increased low flow could augment the water supply in the winter, the potential increase in peak flow could make the built hydraulic structures inadequate, and result in more frequent and widespread flooding. Higher peak flows and flooding could also threaten infrastructure and operational services, such as mines, roads, railways, bridges and settlements located nearby [25].
Given these potential impacts, it is important to enhance our understanding of changes in streamflow regimes in the permafrost region beyond the magnitude and direction of trends. For instance, understanding the role of climatic drivers on streamflow changes could provide valuable insights, not only for process understanding, but also to diagnose future directions of change. In this context, while a number of previous studies have analyzed pan-Arctic wide streamflow trends [26,27,28], to our knowledge, neither the analyses of streamflow trends across the entire permafrost region of Canada nor evaluation of streamflow trends in relation to climatic drivers (i.e., precipitation and temperature) have been undertaken.
In this study, we address the aforementioned knowledge gaps first by analyzing trends in key streamflow variables across the continental-scale permafrost region of Canada. Secondly, we conduct a novel analysis of climatic controls on streamflow changes by relating spatial variability and trends in streamflow, air temperature and precipitation in a statistical framework. We also use a multiple linear regression framework (MLR) to evaluate the temporal relationships of seasonal precipitation and temperature with mean and extreme streamflow conditions for selected rivers. We focus on select streamflow variables including annual mean flow, minimum flow, and maximum flow and its timing, and assess the streamflow trends in the context of pan-Arctic wide trends. Further, we discuss the potential future changes in mean and extreme streamflow conditions.
2. Data and Methods
2.1. Streamflow Data
We used the permafrost database based on Heginbottom et al. [29] and published by Natural Resources Canada [30] as a base map, which consists of a number of permafrost zones (continuous, extensive, sporadic, isolated), for the selection of streamflow stations. We selected 83 hydrometric stations that lie within these zones from the Water Survey of Canada hydrometric station network [31], with the criteria of basin area > 2000 km2 and year-round observations. Additionally, a United States Geological Survey station (15356000 Yukon River at Eagle AK [32]) was included because only a limited number of years (1983 to 2017) of data are available for the corresponding station in the Canadian side (09ED001).
The selected hydrometric stations are unregulated (natural) except for the Mackenzie River affected by the upstream Peace River regulation, whose effect can be assumed relatively minor on selected three downstream mainstem stations [33]. We extracted four streamflow variables from the daily time series data: (i) annual mean flow (Qmean), (ii) annual minimum flow (Qmin), (iii) annual maximum flow (Qmax), and (iv) timing of annual maximum flow (Qmax timing). For each of the four streamflow variables, the stations with more than 40 years of records were first selected, out of which stations with >30% missing values were discarded. This left 83, 83, 79, and 78 stations for Qmax, Qmax timing, Qmin and Qmean, respectively. Additionally, the datasets cover different periods between 1945 and 2018, with missing values in different years, while some stationed have been discontinued. However, further constraining the station selection over a consistent period covering > 30 years of record would result in elimination of over a third of stations, and a lack of representative stations over some regions. Thus, as in the case of St. Jacques and Sauchyn [34], varying periods of records were used and trend analysis results provide a general direction of historical changes rather than changes over a specific time period.
2.2. Climate Data
We used two observation-based gridded climate data products consisting of the 1945 to 2012 Pacific Northwest North American meteorological (PNWNAmet) data [35] for western Canada and the 1950 to 2016 Natural Resources Canada meteorological (NRCANmet) data [36] for rest of Canada. Although NRCANmet is available for the entirety Canada, PNWNAmet was preferred for western Canada (where it is available) as it showed improved performance for climate means, extremes and variability compared to NRCANmet [35]. Both datasets consist of daily precipitation, maximum and minimum temperature, with spatial resolutions of ~7 km (0.0625 degrees) and ~10 km (0.0833 degrees) at 60 °N latitude, respectively, for PNWNAmet and NRCANmet. From the two datasets, basin-averaged precipitation and temperature were extracted using the National hydrometric network basin polygons [37] for the respective hydrometric stations. For comparison with the streamflow variables, the time periods of precipitation and temperature data were matched with the streamflow records of each station. Given the delayed snowmelt-driven streamflow response in the region, water years (October to September) were considered for all analyses.
2.3. Analyse
Trends in streamflow, precipitation and temperature variables were analyzed using the R “zyp” package [38] by employing a non-parametric Mann–Kendall test [39] with iterative pre-whitening [40]. The iterative pre-whitening method, employed to remove the effects of serial correlation, was used because it has been found to be robust in handling Type-I error and produce conservative estimates of p-values, thus limiting false trend detection [41]. Besides accounting for serial correlations for each variable and at each individual station, the effect of spatial correlation among stations (field significance) was evaluated by using the false discovery rate technique suggested by Wilks [42]. Results of the analyses are presented for 10% (p < 0.10) and 5% (p < 0.05) significance levels, with the former considered as the level of statistically significant trend, while the latter signifies a stronger trend.
We analyzed the spatial relationships amongst climatological means of the temperature, precipitation and streamflow variables as well as their trends using the Kendall’s τ correlation. This method was preferred to the more common Pearson correlation because Kendall’s τ uses a rank-based procedure, is more resistant to outliers, and measures all monotonic (linear and nonlinear) correlations [43]. All streamflow values and trend values were normalized by their respective drainage areas when comparing them with precipitation and temperature values/trends.
It should be noted that, in most cases, the drainage areas of most hydrometric stations extend beyond a particular permafrost zone, and in some cases, to the permafrost-free zone. Therefore, analyses specific to different permafrost zones were not undertaken. However, we considered trends for seven (out of 11) of the Water Survey of Canada’s drainage regions [37], which include: (3) Labrador, Northwestern Quebec; (4) Albany; (5) Nelson; (6) Arctic, Hudson Bay; (7) Upper Mackenzie; (8–9) Pacific and Yukon; and (10) Arctic, Lower Mackenzie and Queen. Region 8 has only one station and its results were combined with region 9.
For selected stations, we characterized temporal sensitivities of streamflow variables to climatic variables using the MLR framework. Precipitation, temperature and their interaction were considered as the driving variables and streamflow components were considered as the response variables, given by:
where β1, β2, β3 and β4 are the coefficients of MLR. ΔQ, ΔP and ΔT are the anomalies of streamflow, precipitation and temperature variables with respect to their mean values over the period 1976 to 2005, with ΔQ and ΔP considered as the percentage change and ΔT considered as the absolute change. ΔPΔT represents the interactions between precipitation and temperature. Lehner et al. [44] and Chegwidden et al. [45] used a similar concept in their evaluations using MLR models, although the latter did not use the interaction term. Further, we used the R “Caret” package [46] variable importance (VI) metric, which is based on the absolute t-statistic of each model coefficient, to assess the relative sensitivity of each input variable with respect to the output variable of the MLR model.
ΔQ = β1 + β2ΔP + β3ΔT + β4(ΔPΔT)
3. Results and Discussion
3.1. Spatial Variations of Streamflow Trends
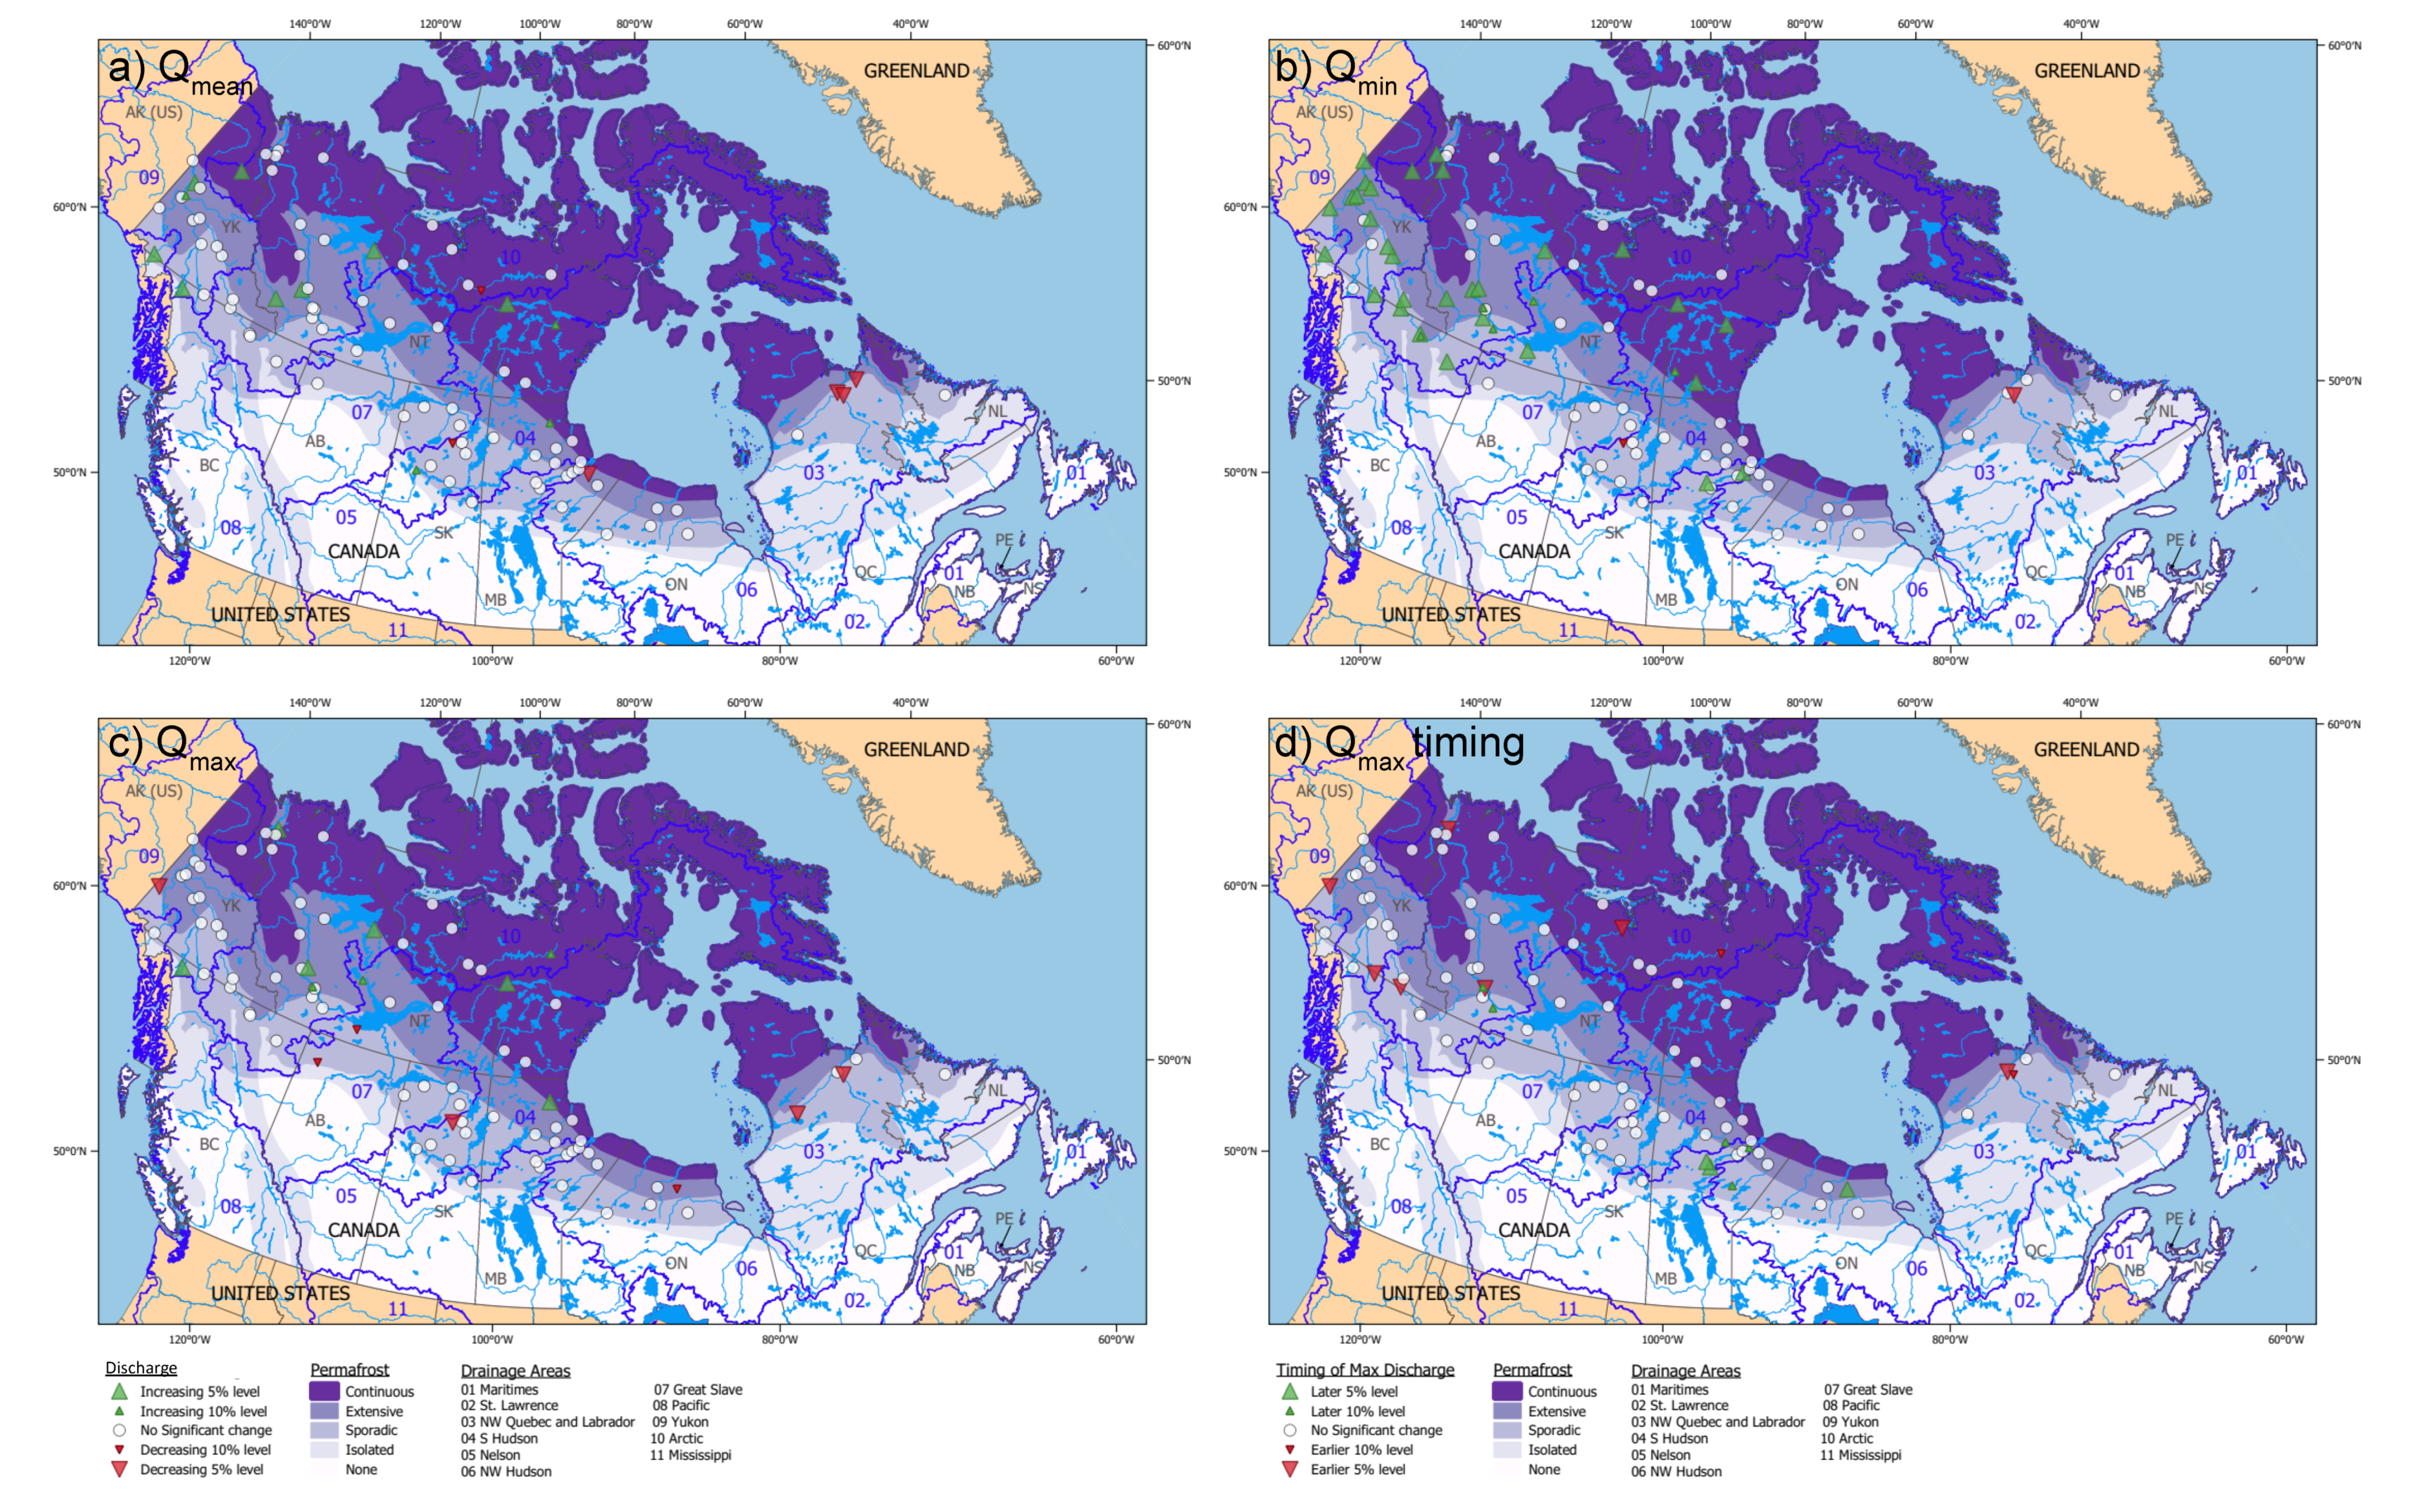
Figure 1 depicts the trends in Qmean, Qmin and Qmax along with the Qmax timing at 84 hydrometric stations across the permafrost region of Canada. The results generally corroborate with previous studies of six large Arctic flowing rivers (Appendix A Table A1), suggesting trends in the Canadian permafrost region are consistent with those across the pan-Arctic. Specifically, similar to the trends across the pan-Arctic, there are larger fractions of stations with increasing Qmean (62%) and Qmin (68%) trends than decreases, although some of the trends are not significant. The larger fraction of stations (44%) with significant increases (p < 0.10) in Qmin is also consistent with the previous studies. Overall, Qmin increases represent the most prominent trend in this study, with 38% of trends field significant (Table 1); thus, most trends are globally significant.
Most stations with increasing Qmean trends in this study are located in north-western Canada, while the southern and eastern regions show no trends, or even a few decreasing trends. Likewise, while there are few stations with significant trends in Qmax and Qmax timing in north-western Canada, the majority of stations in other regions show no significant trends. Furthermore, number of stations with field significant trends are even smaller, implying the lack of globally significant trends in these variables. This is especially the case for Qmax timing, for which none of the trends are field significant, thus, these trends are practically insignificant. Nevertheless, the effect of increasing Qmin is reflected in declining Qmax to Qmin ratios for some of the stations (Table 1). Specifically, 33 out of 79 stations exhibit significant downward trends, with field significant trends for 19 stations.
Considering the trends for the seven drainage regions of Canada, it can be seen that the bulk of the stations are located in western Canada, with only a limited number of stations in eastern Canada (Table 2). Given the limited number of stations, field significance testing was not done at the regional level. Considering the temporal trends, regions 8, 9 and 10 have larger fractions of stations with trends in Qmin and Qmax/Qmin, while regions 3, 4, 5, 6 and 7 have smaller fractions of stations with trends. Some of the trends in region 3 are opposite to other regions, e.g., while there are declining Qmean and Qmax trends in region 3, the declining trends are less prevalent in other regions. However, given the limited number of stations, generalization/extrapolation of patterns for these data-poor regions (regions 3 to 5) is considered problematic. There are also regional differences in western Canada; e.g., in the upper Mackenzie (region 7), there is a larger fraction of stations with increasing Qmin trends compared to the lower Mackenzie (region 10).
Regions 9 and 10 consist of the Yukon and Mackenzie rivers, respectively, along with their tributaries. The streamflow trends at the most downstream stations and upstream stations are generally consistent. Specifically, the significantly increasing Qmin trend in the Yukon Eagle station (1951 to 2018) is consistent with 9 out of 11 upstream stations. The Yukon Eagle station does not have significant trend in Qmean, Qmax and Qmax timing, which is in general agreement with the lack of trends in 8 (12), 10 (12) and 10 (12) upstream stations, respectively (numbers in the parentheses are the total number of stations). Similar results were obtained when comparing the 1973 to 2016 trends for the most downstream station on the Mackenzie River (Mackenzie River at Arctic Red River) with upstream stations. Specifically, the absence of significant trends in Qmean, Qmax and Qmax timing are in agreement with 14 (15), 14 (18) and 15 (18) upstream stations, respectively. However, the downstream station exhibits no significant trend in Qmin, while 11 (15) upstream stations show increasing trends. It is also noteworthy that for the Mackenzie River streamflow variables, the lack of significant trends over 1973 to 2016 are in agreement with Yang et al. [47] over 1973 to 2011. For the Yukon Eagle station, significant increases in Qmin and insignificant change in Qmax for the period 1951 to 2018 agree with Bennett et al. [48], in which the 1954/1964 to 2013 periods were used. However, insignificant change in the Yukon Eagle Qmean for the period 1951 to 2018 differs from the significant increasing trend for the period 1975 to 2016 according to Box et al. [27].
Given that the Qmin increase is the most prominent trend in this study, as well as other studies across the pan-Arctic (see Appendix A), an important question arises on its link to permafrost degradation. In this respect, while a majority of stations in the discontinuous permafrost zones in western Canada show increasing Qmin trends, only a few stations in the discontinuous permafrost zones in Saskatchewan, Manitoba and Ontario show increasing Qmin (Figure 1). Furthermore, Smith et al. [21] found greater Qmin increases in the non-permafrost zone than permafrost zone of Eurasia and speculated that decreased seasonal freezing of soils caused by warmer winters and/or deeper snowpack may be causing the Qmin increases. Such processes could also be contributing to Qmin increases in this study, and consequently, the decline of the Qmax-to-Qmin ratio.
3.2. Spatial Streamflow and Climatic Trends Relationships
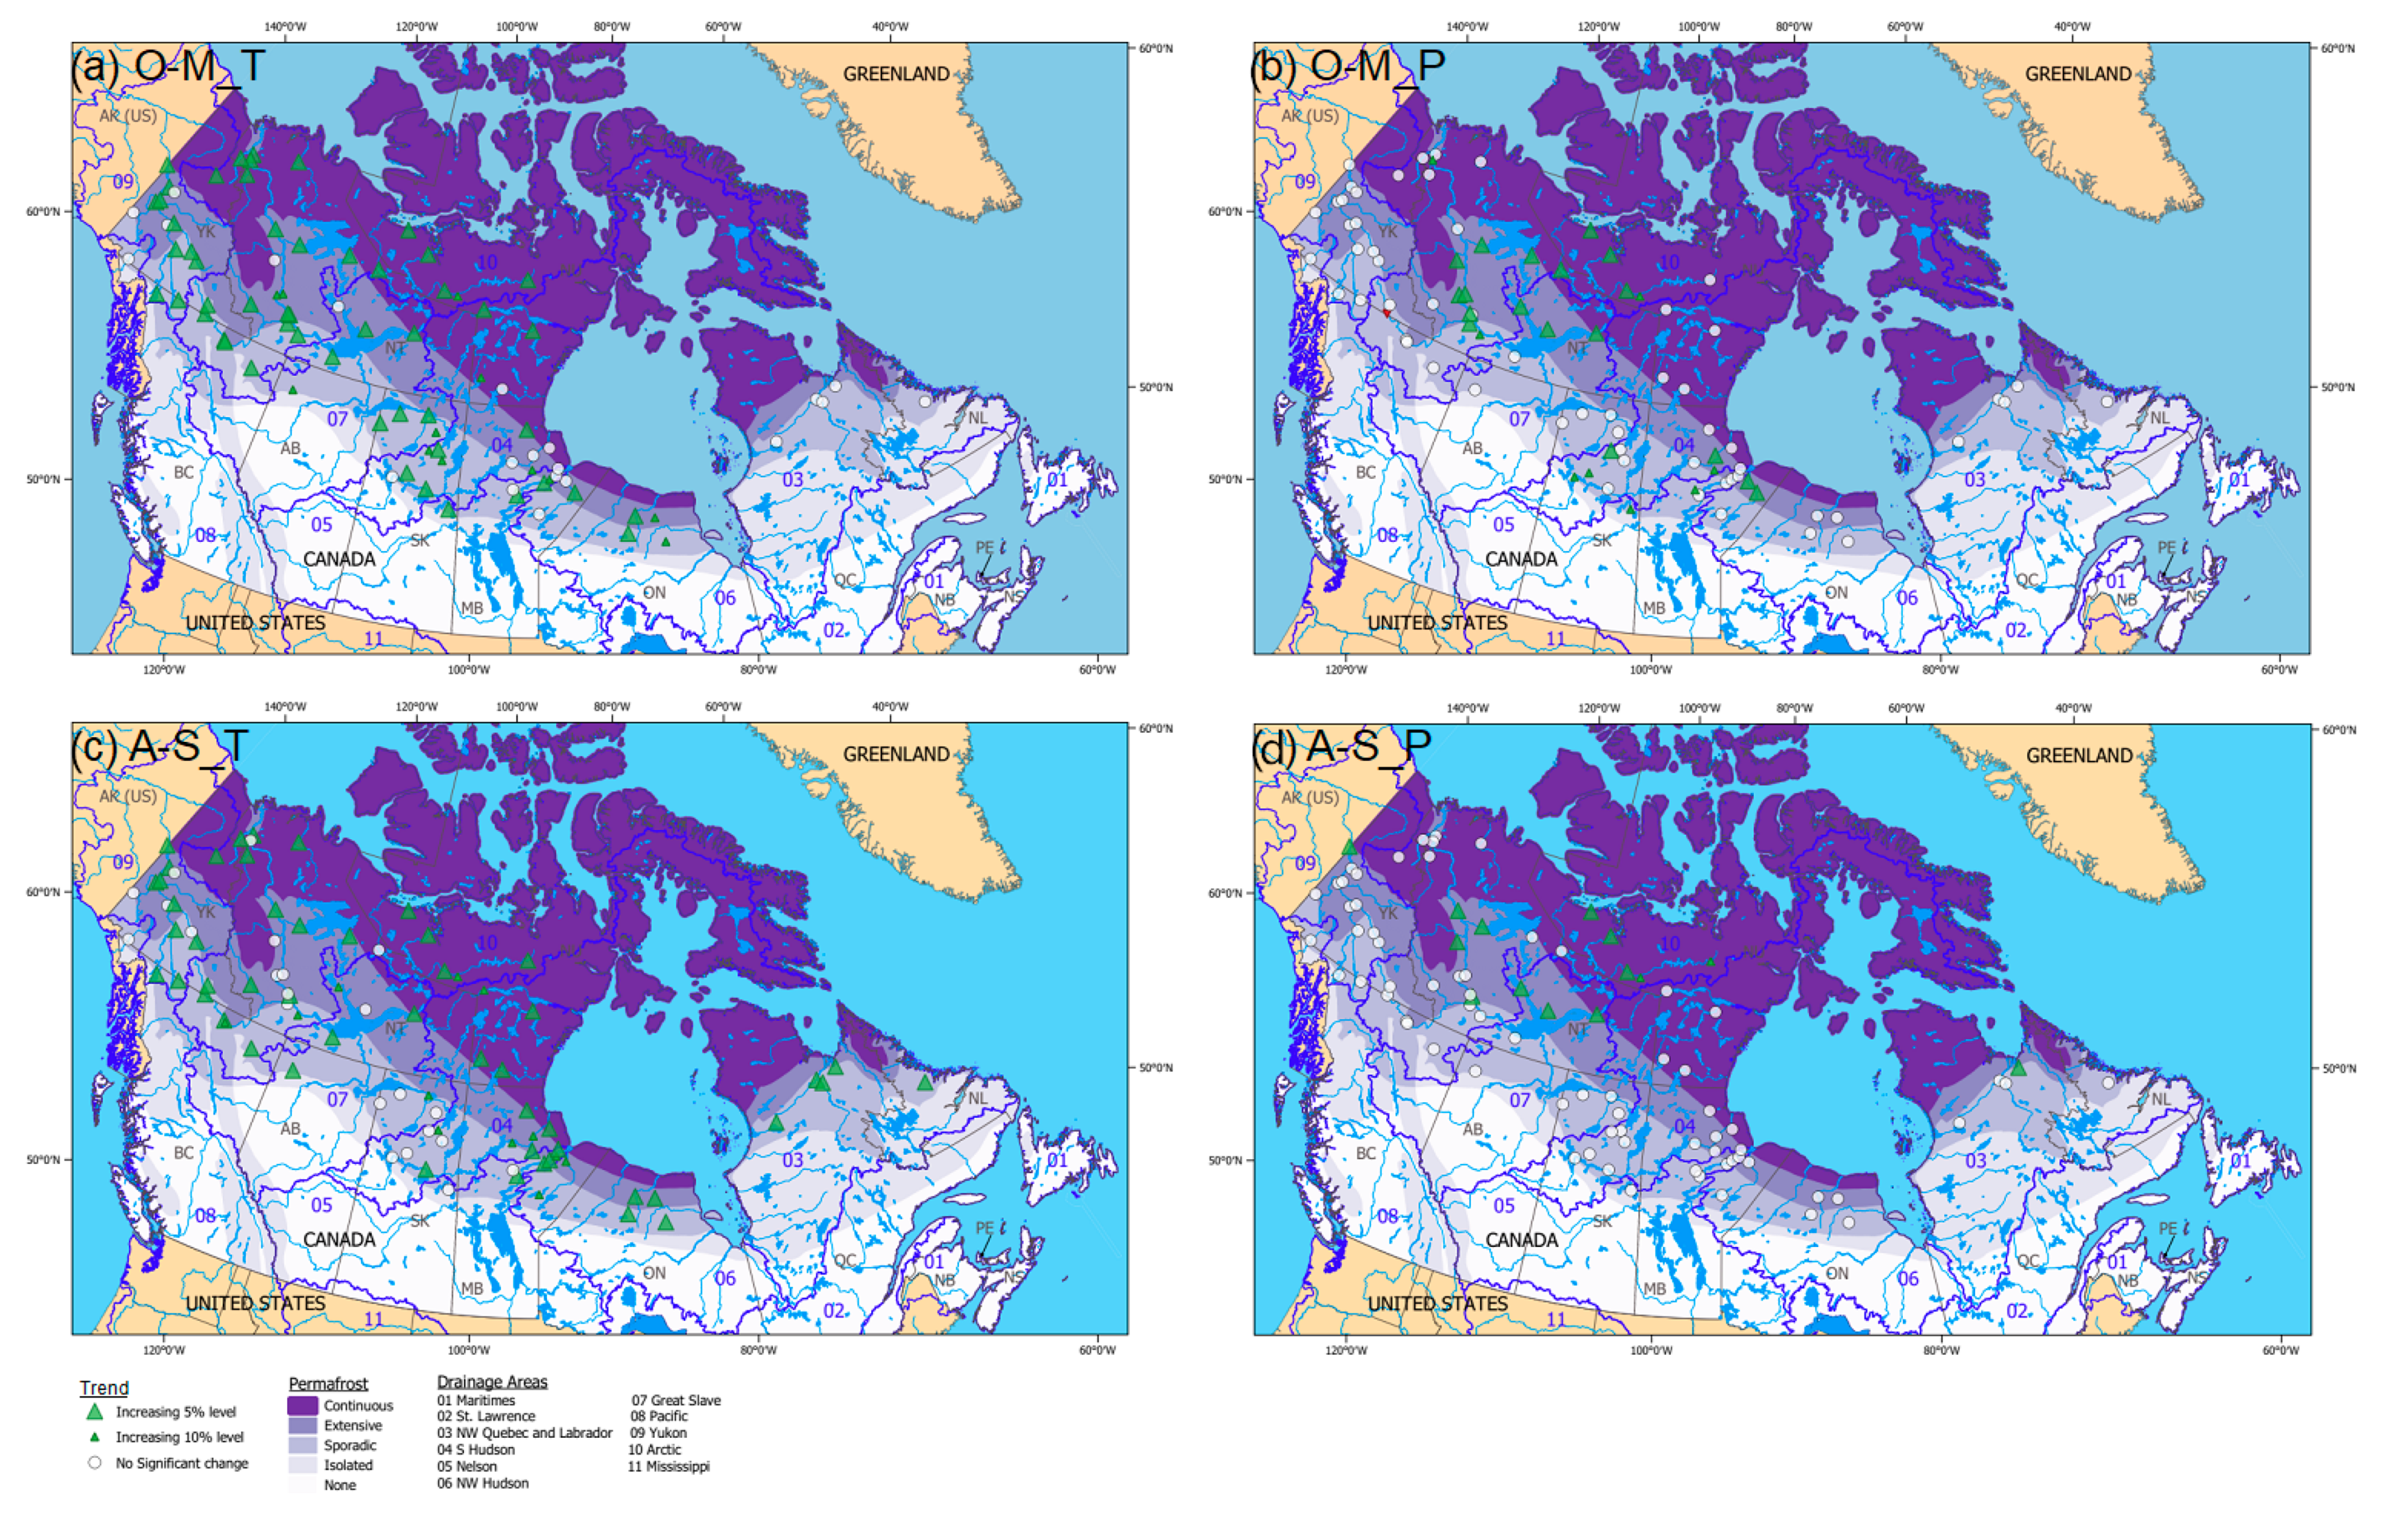
Figure 2 shows the results of the Mann–Kendall trend analyses for the cold season (October to March, i.e., O–M) and warm season (April to September, i.e., A–S) temperature (T) and precipitation (P), with both calculated as the basin-average values for the areas that drain to hydrometric stations. The results show distinct patterns in temperature and precipitation changes. While the majority of O–M_T and A–S_T show increasing trends for the entire permafrost region, a smaller fraction of O–M_P and A–S_P show increasing trends. The differences become more distinct when the trends for the seven regions are considered (Figure 2, Table 2). Specifically, while the stations with temperature increases are distributed across all regions, the bulk of stations with increasing precipitation trends are located in region 10 followed by region 7. Some stations in regions 5 and 6 also show an increasing trend in O–M_P.
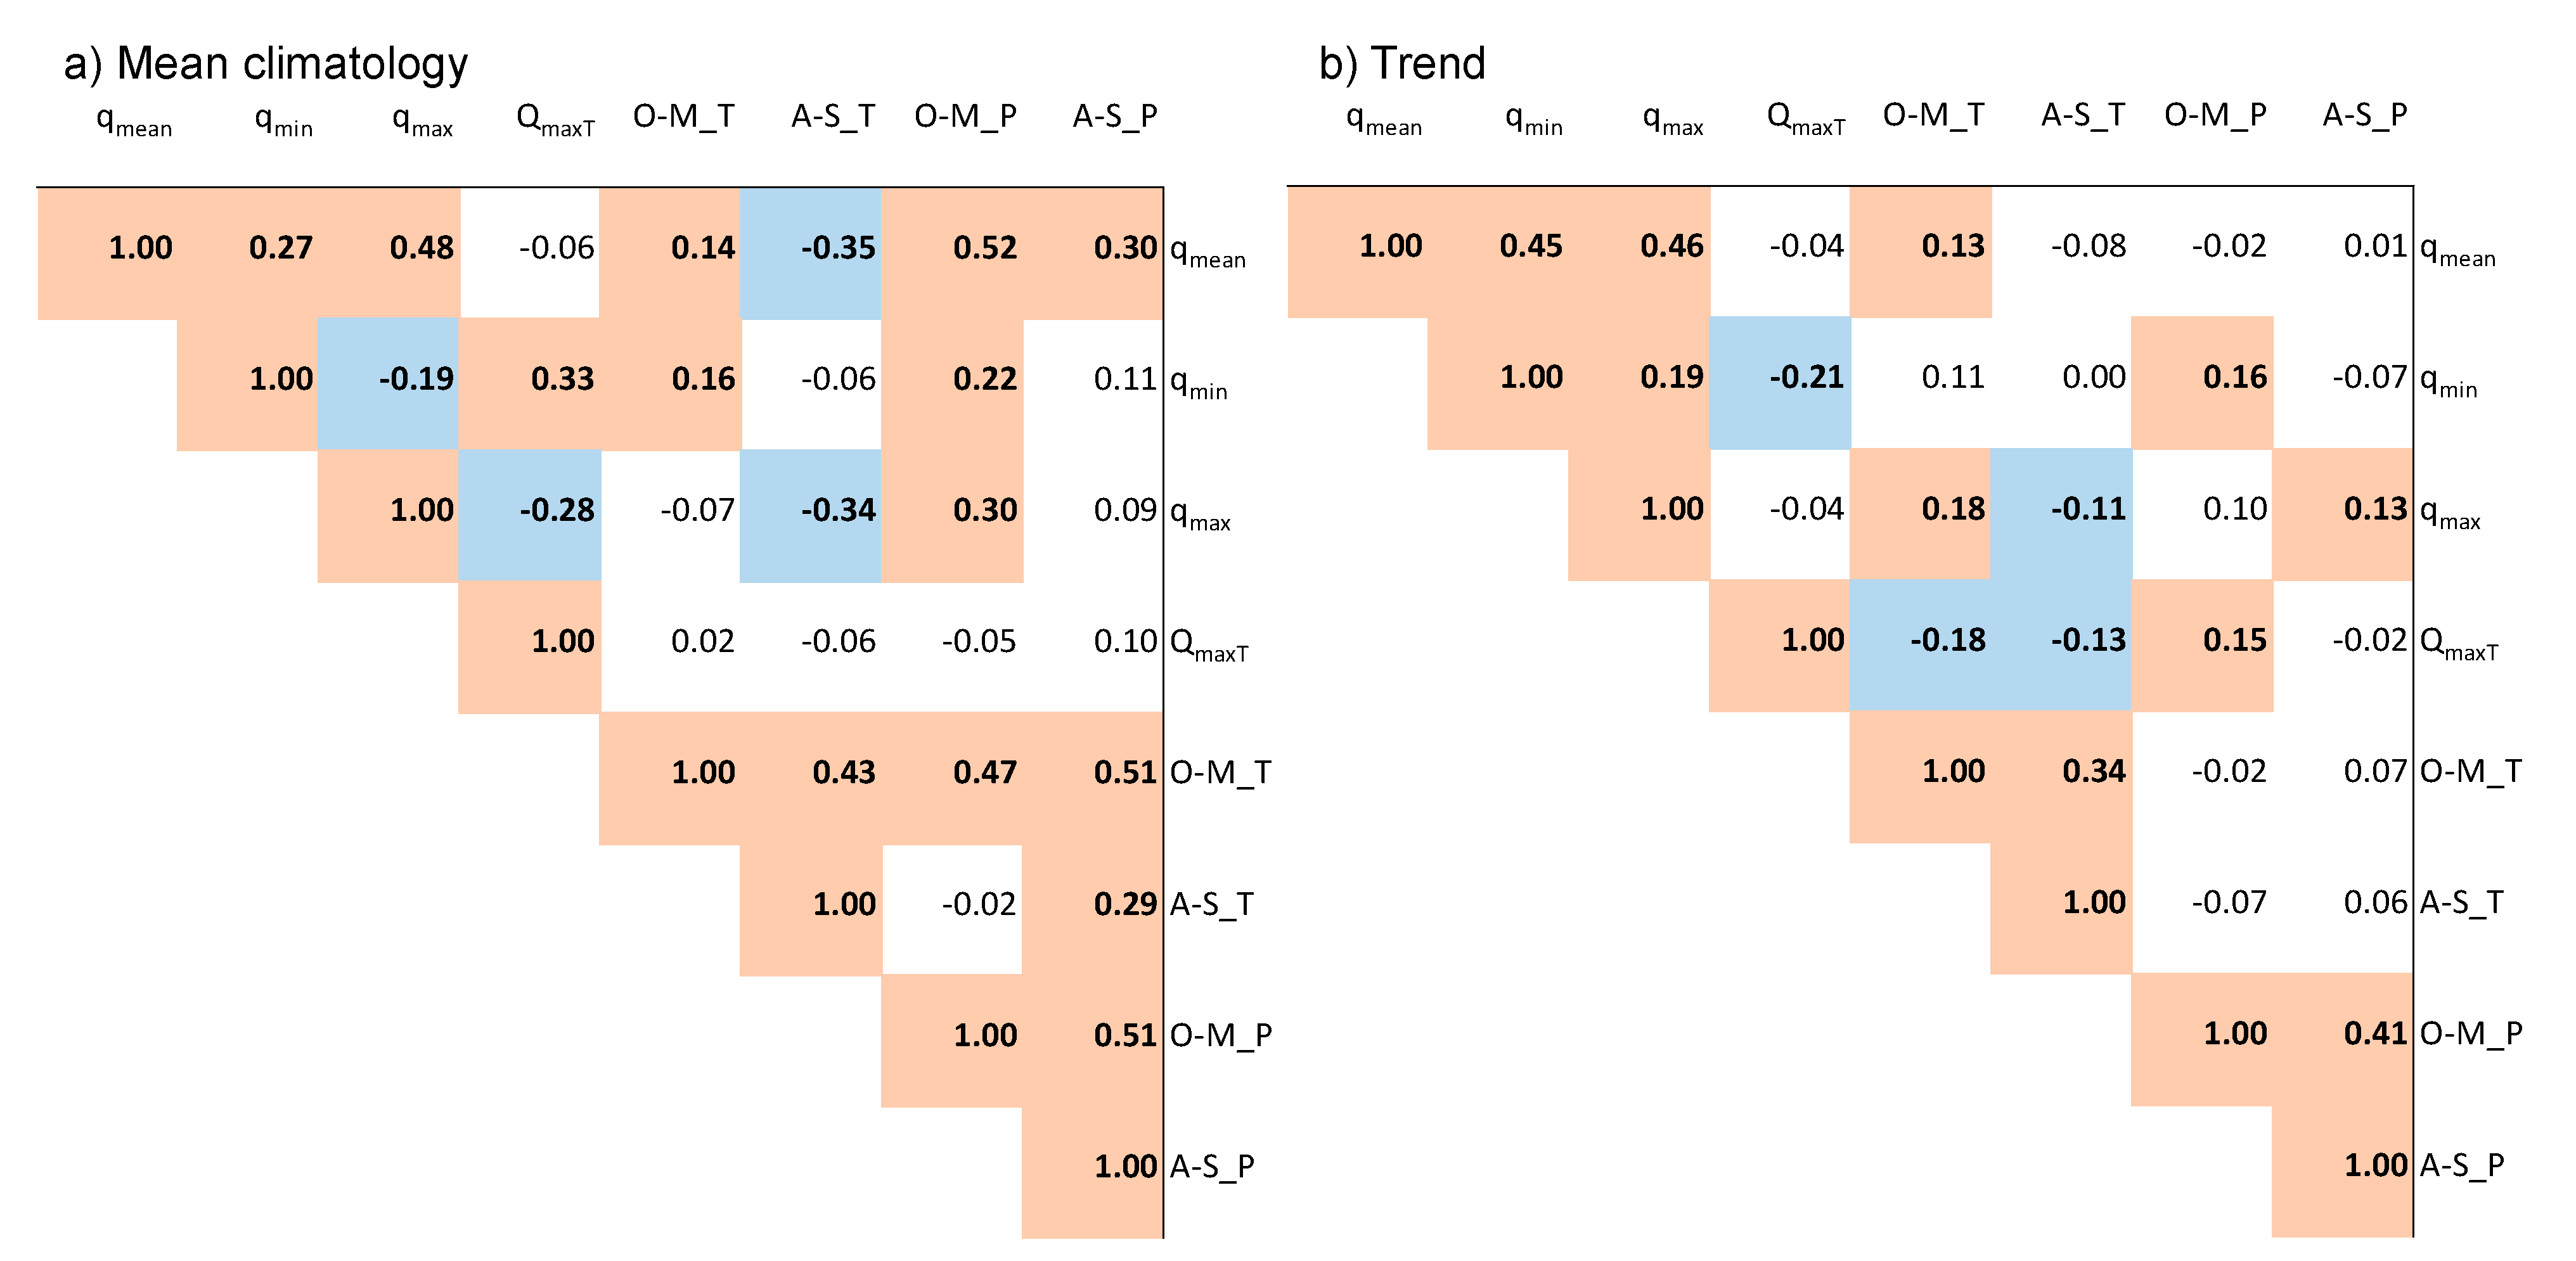
Next, we present correlations among the 1976 to 2005 climatological means of streamflow components and driving precipitation and temperature (Figure 3a), with Qmean, Qmin and Qmax values normalized by the basin areas (hereafter referred to as the qmean, qmin and qmax). The correlations specify the strength of spatial relationships, such as the significant positive correlations among qmean, qmin and qmax suggest that the basins with higher values in one flow component are also likely to have higher values in the other two components. Furthermore, as precipitation is the main driver of annual flow, qmean for the basins are positively correlated with both O–M_P and A–S_P. The negative correlation of qmean with A–S_T is likely due to higher evapotranspiration losses in warmer basins. qmax is negatively correlated with its timing, which is probably due to the wet-to-dry precipitation gradient, and warm-to-cold temperature gradient from south to north in the permafrost region [49]. Thus, the warmer southern basins are likely to produce higher qmax, and earlier timing than the colder northern basins. On the other hand, the negative correlation between qmin and qmax could be linked to snowpack and baseflow generation. For instance, the relatively colder basins are likely to have lower baseflow and larger snowpack than warmer basins with a similar precipitation amount, thus producing relatively smaller qmin and larger qmax in colder basins. Besides the spatial variability of precipitation and temperature, the seasonality also plays a role on streamflow responses. Specifically, the positive correlations of qmin and qmax with O–M_P are in line with the expectation that the basins with higher winter precipitation also produce higher flow rates. qmin also has a positive correlation with O–M_T. Therefore, the higher the winter temperature in the basin, the higher the low-flow response, likely due to higher rainfall-to-total-precipitation ratio and higher sub-surface flow. Furthermore, the negative correlation of qmax with A–S_T is likely related to spring snow accumulation and melt, which is constrained by spring temperature; thus, the higher the A–S_T, the earlier the snowmelt and the smaller the qmax. However, although warmer basins are generally expected to have earlier Qmax timings, there is no significant correlation between Qmax timing and A–S_T.
The correlations among streamflow and climate variable trend values (Sen’s slope) signify the relationships in the magnitude and direction of changes (Figure 3b). The correlogram reveals significant but mostly weak correlations (Kendall’s τ < 0.2) for some of the variables. The positive correlations amongst qmean, qmin and qmax trends imply that the increase in one of the streamflow variables is likely accompanied by increases in other variables, although the trends for individual stations may not always be significant. With reference to the driving variables, qmax and qmean trends show weak positive correlations with O–M_T trends. Such unidirectional flow and temperature trends appear counterintuitive, as an increased temperature can normally be expected to lead to decreased snowpack and consequently decreased flows. In this case, other factors that accompanied increasing temperature trends may have played a role, such as precipitation trends, although the correlations are not significant. The positive correlation of qmin with O–M_P trends indicate increasing low-flow with increasing winter precipitation. The significant negative correlations of Qmax timing trends with A-S_T and O–M_T trends are in line with the expectation of earlier timing with increasing temperature, which cause smaller snowpack and earlier snowmelt. Furthermore, the negative correlations between qmin and Qmax timing trends are likely linked to temperature and snowpack changes, because increasing winter temperatures lead to larger qmin and smaller snowpack, with earlier snowmelt leading to earlier Qmax timing. However, the expected linkage between qmin increases with temperature increases were not found to be significant.
Furthermore, a closer examination of the temperature, precipitation and streamflow changes reveals expected patterns. For instance, 31 of the 35 significantly increasing qmin trends coincide with the O–M_T increasing trend. However, only a few qmean and qmax results showed significant trends, and these trends do not always line up with the significant O–M_P and A–S_P trends. A number of factors affect the presence/absence of the relationships between streamflow and climate variable trends. Firstly, streamflow trends reflect the cumulative effects of precipitation, temperature and snow trends. Therefore, trends in one of the driving variables (temperature or precipitation) may not lead to trends in streamflow variables. Secondly, given the complex interactions between the climatic drivers, the trend values may not change monotonically for different variables, thus resulting in weak or no correlations with the streamflow trends.
There are also a number of sources of uncertainty that could lead to discrepancies and inconsistencies. A major source of uncertainty is the representativeness of the precipitation and temperature in the PNWMAmet and NRCanmet dataset, particularly due to the sparse station network in the high-latitude region [50]. Additionally, uncertainties arise from the quality of the observed discharge data, especially during the ice-covered low-flow period [51], as well as missing values in the discharge data. There are also inconsistencies in the length of the records. Given that some of the Qmin, Qmean, Qmax and Qmax timing records have gaps, the compared lengths are not always consistent with temperature and precipitation records. Nevertheless, the analyses of climatological means and trends of the driving and resultant variables generally provide physically plausible explanations.
3.3. Climatic Controls on Streamflow Variables
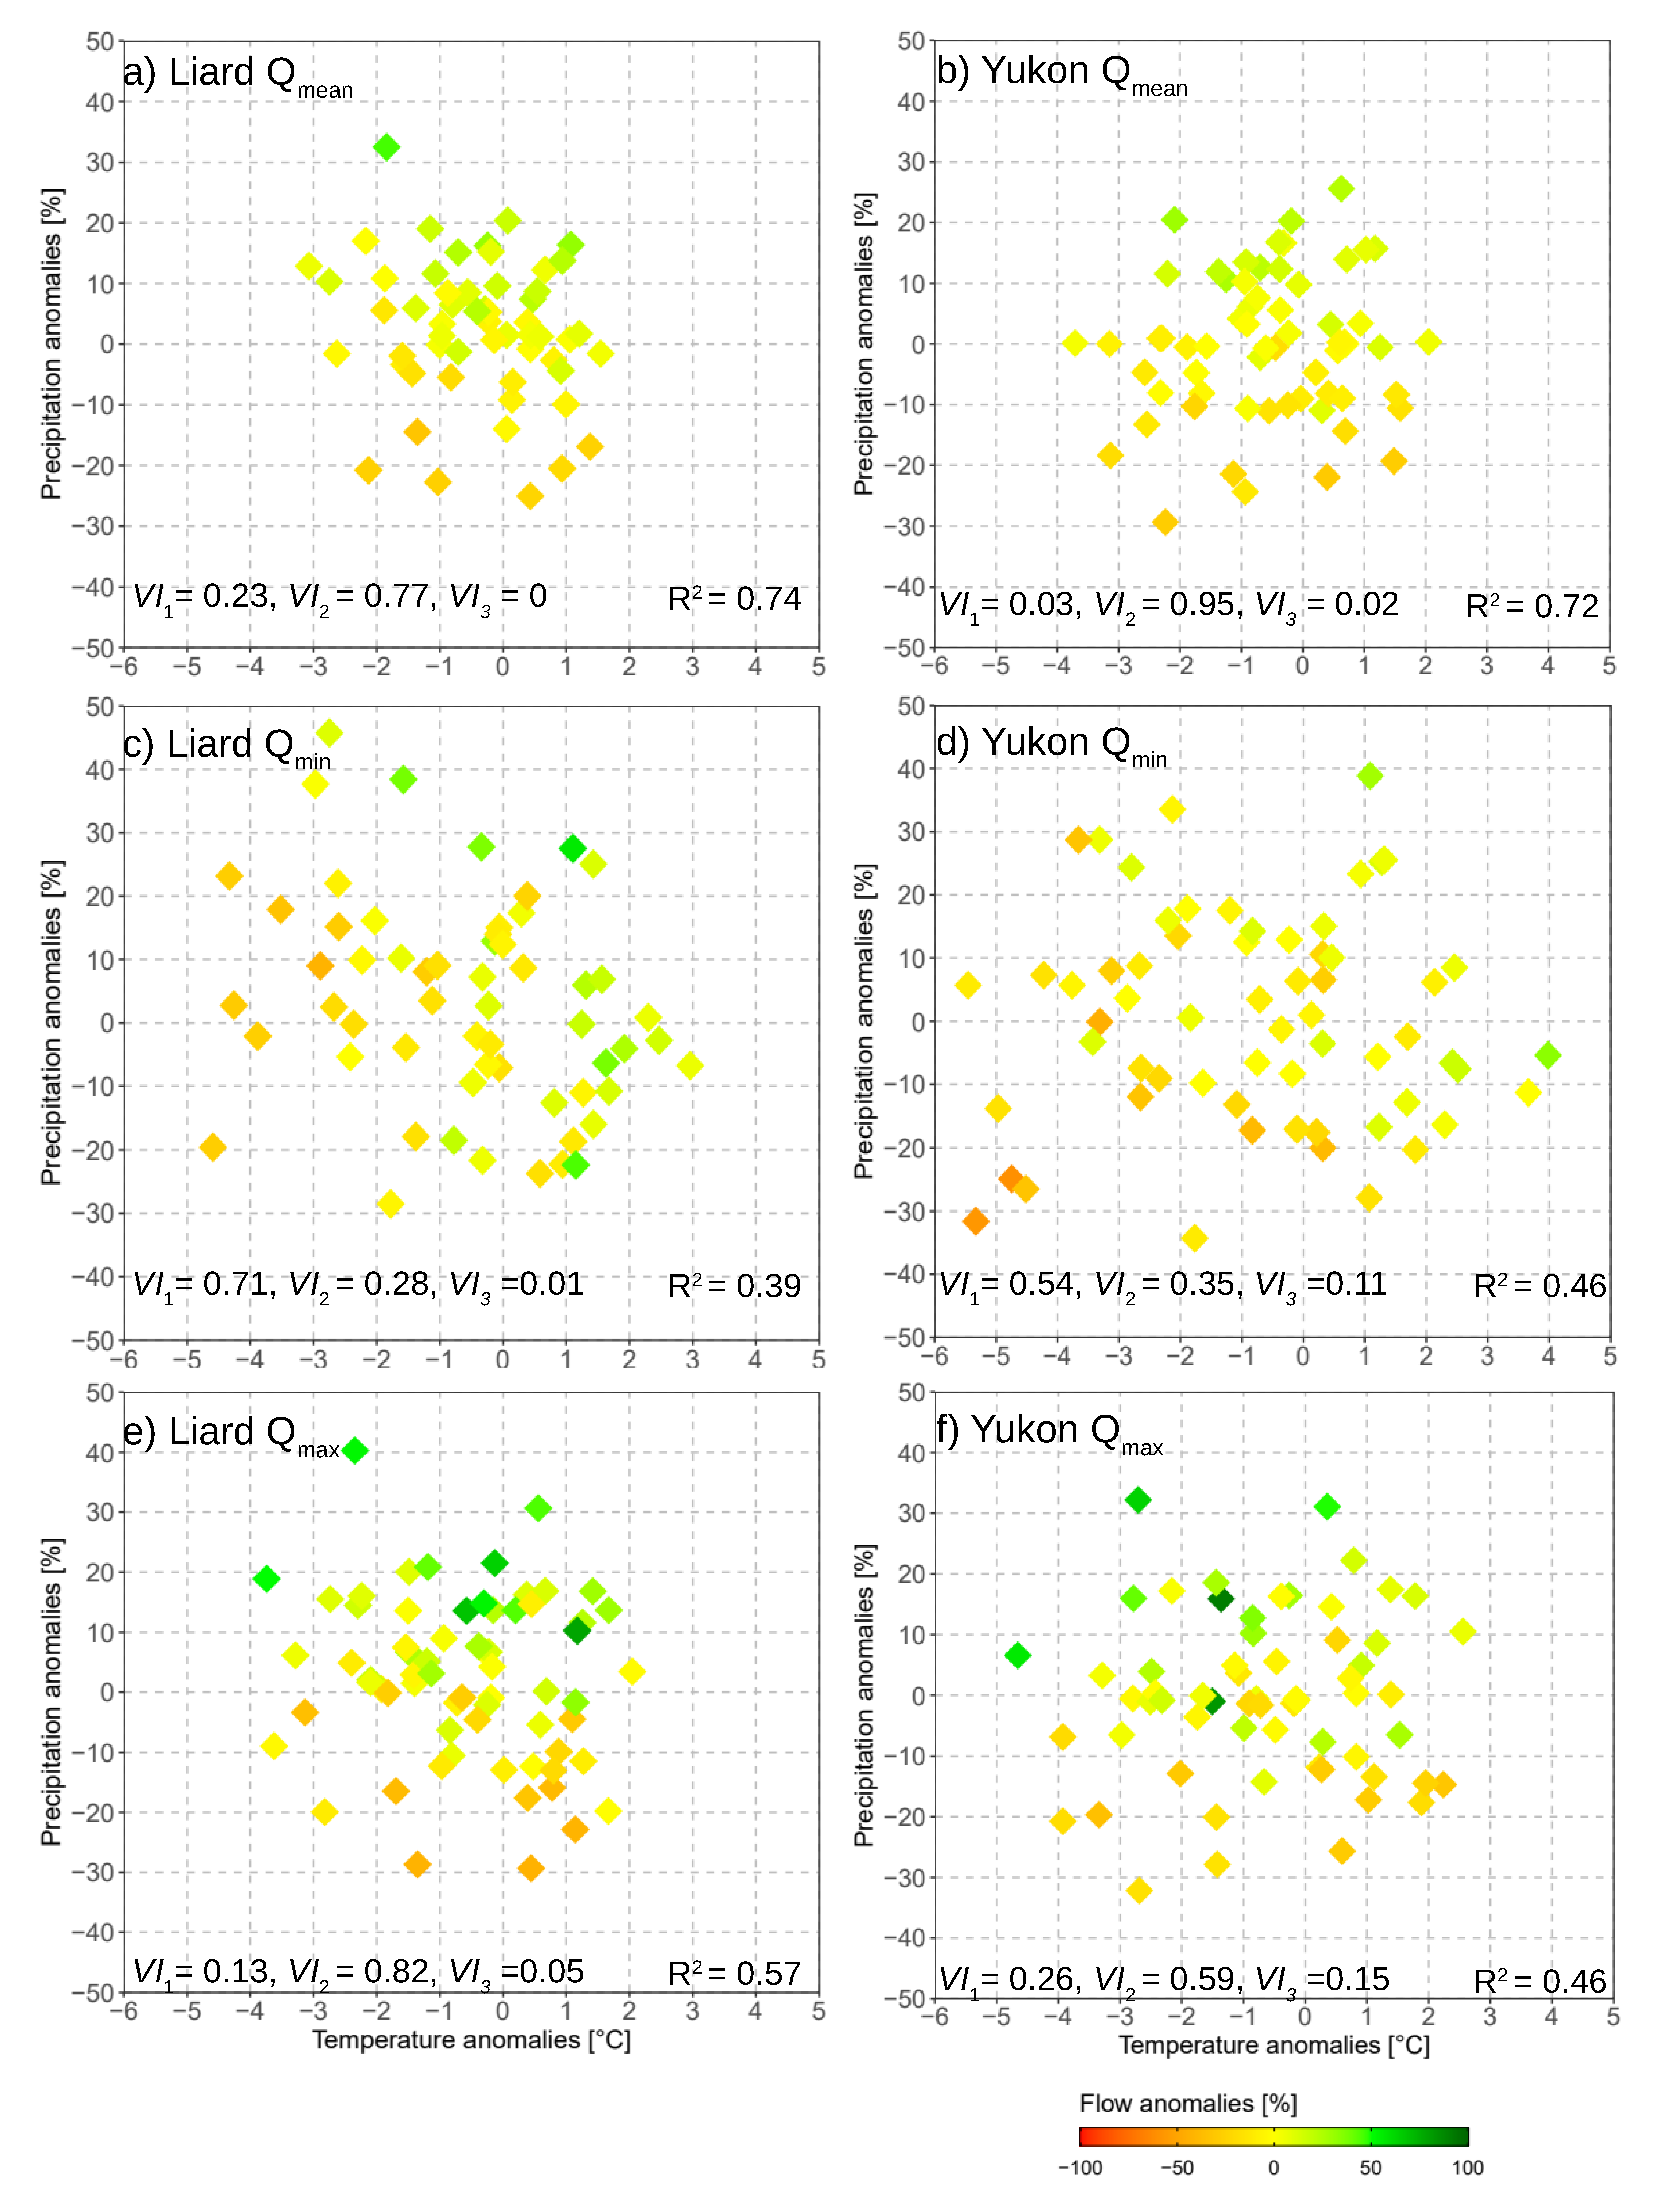
We focused our temporal analyses on stations with the longest available flow records, which included: (i) 1947 to 2012 (with few years of missing records in between) period for the Liard Upper Crossing (Liard-UC) and (ii) 1951 to 2012 (complete) period for the Yukon Eagle (Yukon-E), Alaska stations (Appendix A Figure A1). Note that the flow records were trimmed at the year 2012 to match the precipitation and temperature records in the PNWNAmet datasets. Both the Liard-UC and Yukon-E stations flow records have a significantly increasing Qmin trend (p < 0.05, Liard-UC: slope 5.1%/decade; Yukon-E: slope 4.1%/decade). Qmean and Qmax trends for both stations are not significant at p < 0.1. In the case of basin-averaged temperature, both A–S_T and O–M_T are increasing significantly (p < 0.05) for Liard-LC (decadal trends, A–S_T: 0.2 °C, O–M_T: 0.4 °C) and Yukon-E (decadal trends, A–S_T: 0.3 °C, O–M_T: 0.5 °C). There were no significant precipitation trends (for both A–S_P and O–M_P) for either basin.
The sensitivities of precipitation and temperature changes on Qmean, Qmin and Qmax anomalies relative to 1976 to 2005 together with the results of MLR analyses are shown in Figure 4. Note that Qmax timing results are not shown because of the overall lack of relationships with climatic drivers. The relative controls of precipitation and temperature on the three streamflow variables are depicted in terms of VI scores, with R2 summarizing the MLR model fits. We also explored different combinations of the precipitation and temperature seasons in the MLR model setup. The results that yielded the best R2 values were depicted, which included annual values (Ann_P and Ann_T) for Qmean, October to March values (O–M_P and O–M_T) for Qmin, and October to July (O–J_P and O–J_T) values for Qmax for both stations. These best combinations of months are in agreement with the analyses of climatic controls on these three streamflow variables using the historical and projected future temperature and precipitation for the Liard River basin [14]. The relative controls of temperature, precipitation and their interaction term are depicted by VI1, VI2 and VI3, respectively.
The MLR model results for Qmean indicate the dominant controls of Ann_P (VI2 > 0.75) for both basins (Figure 4a,b). While Ann_T has a small influence on Qmean for Liard-LC, its influence for Yukon-E is negligible. The controls of precipitation–temperature interactions on Qmean for the two basins are non-existent to negligible. Furthermore, as illustrated by the stratified patterns of Qmean anomalies relative to Ann_P anomalies, the sensitivities of Ann_P on Qmean are positive for both basins; i.e., the larger the Ann_P, the larger the Qmean. Overall, the model performance for Qmean is good for both basins (R2 > 0.7), i.e., Ann_P and Ann_T anomalies can explain over 70% of variance in Qmean anomalies.
In the case of Qmin, temperature plays a larger role, with VI1 for O–M_T > 0.5 for both basins. Precipitation has a smaller control, and the precipitation–temperature interaction has negligible to minor influence (Figure 4c,d). The higher temperature control on Qmin is also illustrated by stratified patterns along O–M_T axis, i.e., larger Qmin with higher O–M_T, especially in the case of Liard-LC basin. The MLR model predictability for Qmin as given by R2 range between 0.39 and 0.46; thus, the models can only explain <50% of the variance of Qmin. Nevertheless, the higher temperature control on low flow—which in this region is mainly contributed by baseflow from groundwater [52]—align with the expectation of higher groundwater recharge and subsurface flow and higher Qmin, as temperature increases [20].
In contrast to Qmin, precipitation has higher control (VI2 ≥ 0.59) on Qmax, especially in the case of Liard-LC. This is also illustrated by a stratified positive relationship between Qmax and O–J_P, i.e., higher Qmax for larger precipitation (Figure 4e,f). The temperature control on Qmax is ≤ 0.26, indicating the smaller role of O–J_T change on Qmax change. In this case also, the precipitation–temperature interaction plays a minor role on Qmax. The MLR model R2 range between 0.46 and 0.57, indicating a moderate predictability of Qmax with O–J_P and O–J_T.
Overall, the evaluation of precipitation and temperature controls on Qmean, Qmin and Qmax provide further insights into the effect of these variables on streamflow response. The dominant control of precipitation on Qmean and Qmax, and temperature on Qmin from this observation-based study is consistent with the modelling study that include historical and projected future simulations [14]. This provides some confidence in using the MLR model for diagnosing the future direction of streamflow change with respect to the projected precipitation and temperature changes. As such, future warming can be generally expected to lead to higher Qmin, while precipitation increase can be generally expected to lead to increased Qmean and Qmax. However, the MLR models, with the R2 predictability scores ranging between 0.39 and 0.74, have limited skills in explaining the variability of streamflow components. Furthermore, given the lack of physical representation, the MLR model is considered not suitable for extrapolation problems, such as projecting future changes. Nevertheless, the MLR-based VI analysis contributes to a process understanding with regard to dominant driving variables affecting streamflow responses.
4. Discussion on Future Changes in Extremes
The preceding investigation on the relationships of precipitation and temperature with Qmean, Qmin and Qmax, based on the historical climate, leads to a subsequent question about the potential future changes in these variables in the context of enhanced warming and increased precipitation across the pan-Arctic region [53]. A number of other factors are also associated with the higher temperature and precipitation are that directly or indirectly affect these streamflow variables. For instance, with warmer temperatures, there will be a reduction in the snowfall fraction and an increase in the rainfall fraction [11]. The changing precipitation phase could lead to an increased frequency and areal extent of rain-on-snow events [16,18,54]. Future projections of snow indicate a general decline in the snow cover extent [7,55] and highly variable maximum snow–water equivalent changes, with increases, decreases or no change depending on the region, and climate model used [7,56,57,58]. Furthermore, in response not only to warming, but also to changes in snow cover, which exerts a control on the underlying soil, Arctic permafrost is projected to undergo substantial degradation [59].
Given that the projected changes in temperature, precipitation, snow and permafrost are generally a continuation of historical trends, future changes in streamflow variables can be expected to follow the historical changes. For instance, previous global-scale or pan-Arctic-wide studies indicate future increases in Qmean and Qmin, and earlier Qmax timings [60,61,62]. Similar changes in Qmean and Qmin were also projected for the Liard River basin [14]. However, the potential future changes in Qmax over the northern region, which is conditional on the evolution of precipitation, temperature, snowpack and permafrost changes and their interactions, remain less clear. Nevertheless, there are indications of changes to the nonstationary streamflow extremes (i.e., alterations in return periods and return levels). For instance, Hirabayashi et al. [63] projected future increases in the frequencies of the historical 100-year return period floods for the Yenisei, Lena, Mackenzie and Yukon Rivers, and a decreased frequency for the Ob River.
Summer rainfall-driven peak flow events are also related to rainfall/snowfall balance, which are historically very rare in large Arctic rivers, and typically occur only in the small coastal catchments [64,65,66]. For instance, an extreme summer flood event occurred in the Upper Kuparuk River catchment (drainage area 142 km2) on the northern slope of Alaska in response to a 50-h, 80 mm rainfall event in July 1999, with the peak flow exceeding snowmelt peak discharge for 1993 to 2001 [64]. Additionally, a closer examination of the Yukon-E streamflow revealed occurrences of multiple summer peaks, with secondary peaks in late summers of 2010 and 2012 (not shown). Given that portions of the Yukon Basin are experiencing extensive melting of alpine glaciers and perennial snow fields [67,68], these summer peak flow events may have been influenced by glacier melt. In this respect, the projected glacier mass loss has the potential to modify the mean and extreme streamflow states of basins with glaciers across the pan-Arctic, including changes in the summer peak flows [69].
5. Summary and Conclusions
This study contributes towards understanding the historical changes in streamflow regimes and the role of climatic drivers on streamflow changes across the continental scale permafrost region of Canada. We analyzed historical trends in several streamflow components (i.e., Qmean, Qmin, Qmax and Qmax timing) across 84 streamflow stations in the permafrost region of Canada. Overall, the trends are generally consistent with previous studies across the pan-Arctic (Appendix A Table A1), with increasing Qmin for 43% of stations (p < 0.10) as the most prominent trend. Qmin trends are also field significant for 38% of stations, and the majority of the stations with Qmin increases are located in western Canada. Similar to previous studies (Appendix A Table A1), the number of stations with significant trends in Qmean, Qmax and Qmax timing are small, with increasing or decreasing trends of less than 15%, and even smaller fractions with field significant trends. Temperatures over the basins that drain to hydrometric stations show widespread increases, with significant trends in October to March and April to September temperatures for 80 and 71% of the basins, respectively; the majority of trends are field significant. Upward precipitation trends were obtained for some of the basins, especially for the months of October to March, with 27% of basins showing increases and 13% field significant.
The analysis of climatic controls (precipitation and temperature) provides key insights into their relationships with the streamflow changes. For instance, the Kendall’s τ correlations of the basin-averaged runoff with precipitation and temperature indicate weak to moderate associations, including positive correlations of qmean with O–M_P and A–S_P, and qmin with O–M_P and O–M_T. These associations reinforce the role of higher basin precipitation in producing higher runoffs. In contrast, the negative correlations of A–S_T with qmean and qmax is indicative of the temperature influence on evaporation, snow accumulation and melt; therefore, the higher the temperatures, the lower the runoffs. The correlations of streamflow trends with precipitation and temperature trends are usually weak, although directions of trends are generally in line with the expectation, i.e., the positive correlation between qmin and O–M_P trends, and the negative correlations between qmax timing and A–S_T and O–M_T trends.
The MLR-based variable importance analysis captured the sensitivity of climatic drivers on streamflow components and provided plausible explanations on driver-response relationships. The results revealed the dominant control of precipitation on Qmean and Qmax, with increasing wetness generally leading to higher discharge. On the other hand, the dominant temperature control on Qmin reinforces the impact of climate warming on increasing the Qmin trend, apparently by increasing the fraction of precipitation falling as rain and promoting subsurface flow with increasing temperature. Overall, the insights gained from this study, i.e., the effect of climatic drivers on streamflow changes, could be generalized for understanding streamflow changes across the permafrost region of the world. Furthermore, with a careful selection of climatic drivers, the methodologies used in this study could be applied to evaluate streamflow changes in the permafrost-free regions.
The historical streamflow trends and their relationships with climatic drivers lead to a subsequent question on future streamflow changes. In this respect, previous studies suggest future increases in Qmean, Qmin and earlier Qmax timings across the pan-Arctic [14,60,61,62], while the direction of Qmax—which depends on the interactions of precipitation, temperature and snow—remain uncertain for most regions. Furthermore, given that most of the impact studies over the northern region are large-scale studies, and not designed to represent the finer details of the streamflow extremes, there is a need to develop basin-scale hydrologic models by incorporating key processes (such as permafrost degradation) for an improved understanding of the ongoing and future hydrologic changes. Furthermore, there is a need to improve the ground-based streamflow observation network as well as leverage remotely sensed products to better evaluate and attribute the streamflow changes, especially in the areas with sparse coverage as identified in this study. Overall, the results of this study, including the enhanced understanding of ongoing streamflow changes and climatic controls affecting these changes, provide valuable insights into the hydrologic processes in the permafrost region of Canada and beyond.
Author Contributions
Conceptualization, R.R.S., D.Y., D.L.P. and Y.B.D.; data curation, analyses and figures, J.P. and R.R.S.; draft manuscript, R.R.S.; review and editing, D.Y., D.L.P., Y.B.D., J.P.; All authors have read and agreed to the published version of the manuscript.
Funding
This study was conducted with internal funding from Environment and Climate Change Canada.
Institutional Review Board Statement
Not applicable.
Informed Consent Statement
Not applicable.
Data Availability Statement
Streamflow data used in the study is available through the Government of Canada, Historical Hydrometric Data Archive, http://wateroffice.ec.gc.ca/ (accessed on 26 February 2021). Additional streamflow data for Yukon River at Eagle station is obtained from the United States Geological Survey, https://waterdata.usgs.gov/usa/nwis/uv?15356000 (accessed on 26 February 2021). Gridded precipitation and temperature data used in this study is available through the Pacific Climate Impacts Consortium data portal, https://data.pacificclimate.org/portal/gridded_observations/map/ (accessed on 26 February 2021).
Acknowledgments
We acknowledge Natural Resources Canada for permafrost database and Water Survey of Canada, Environment and Climate Canada, for hydrometric network basin polygons used in this study.
Conflicts of Interest
The authors declare no conflict of interest.
Appendix A. Review of streamflow trends for major Pan-Arctic Rivers
We compiled trends for Qmean, Qmin, Qmax and Qmax timing from previous studies (most recent study for each river) for six large Arctic flowing rivers that include the Kolyma, Lena, Yenisey and Ob rivers in Eurasia, and the Mackenzie and Yukon rivers in North America (Figure A1; Table A1). Also included are results for multiple stations within these basins, summarized as a count of stations with significant trends out of the total number of stations. Note that these published studies present trends for different time periods, thus reflecting the responses to different periods of long-term climate forcing (e.g., temperature and precipitation) and short-term variability (i.e., Arctic Oscillation, Pacific Decadal Oscillation and El Niño Southern Oscillation). Some of the compiled results are for different stations (upstream or downstream), and/or flow conditions (naturalized or observed), which could produce different trends. Furthermore, the studies use different trend analysis methods that could also cause differences on the reported results.
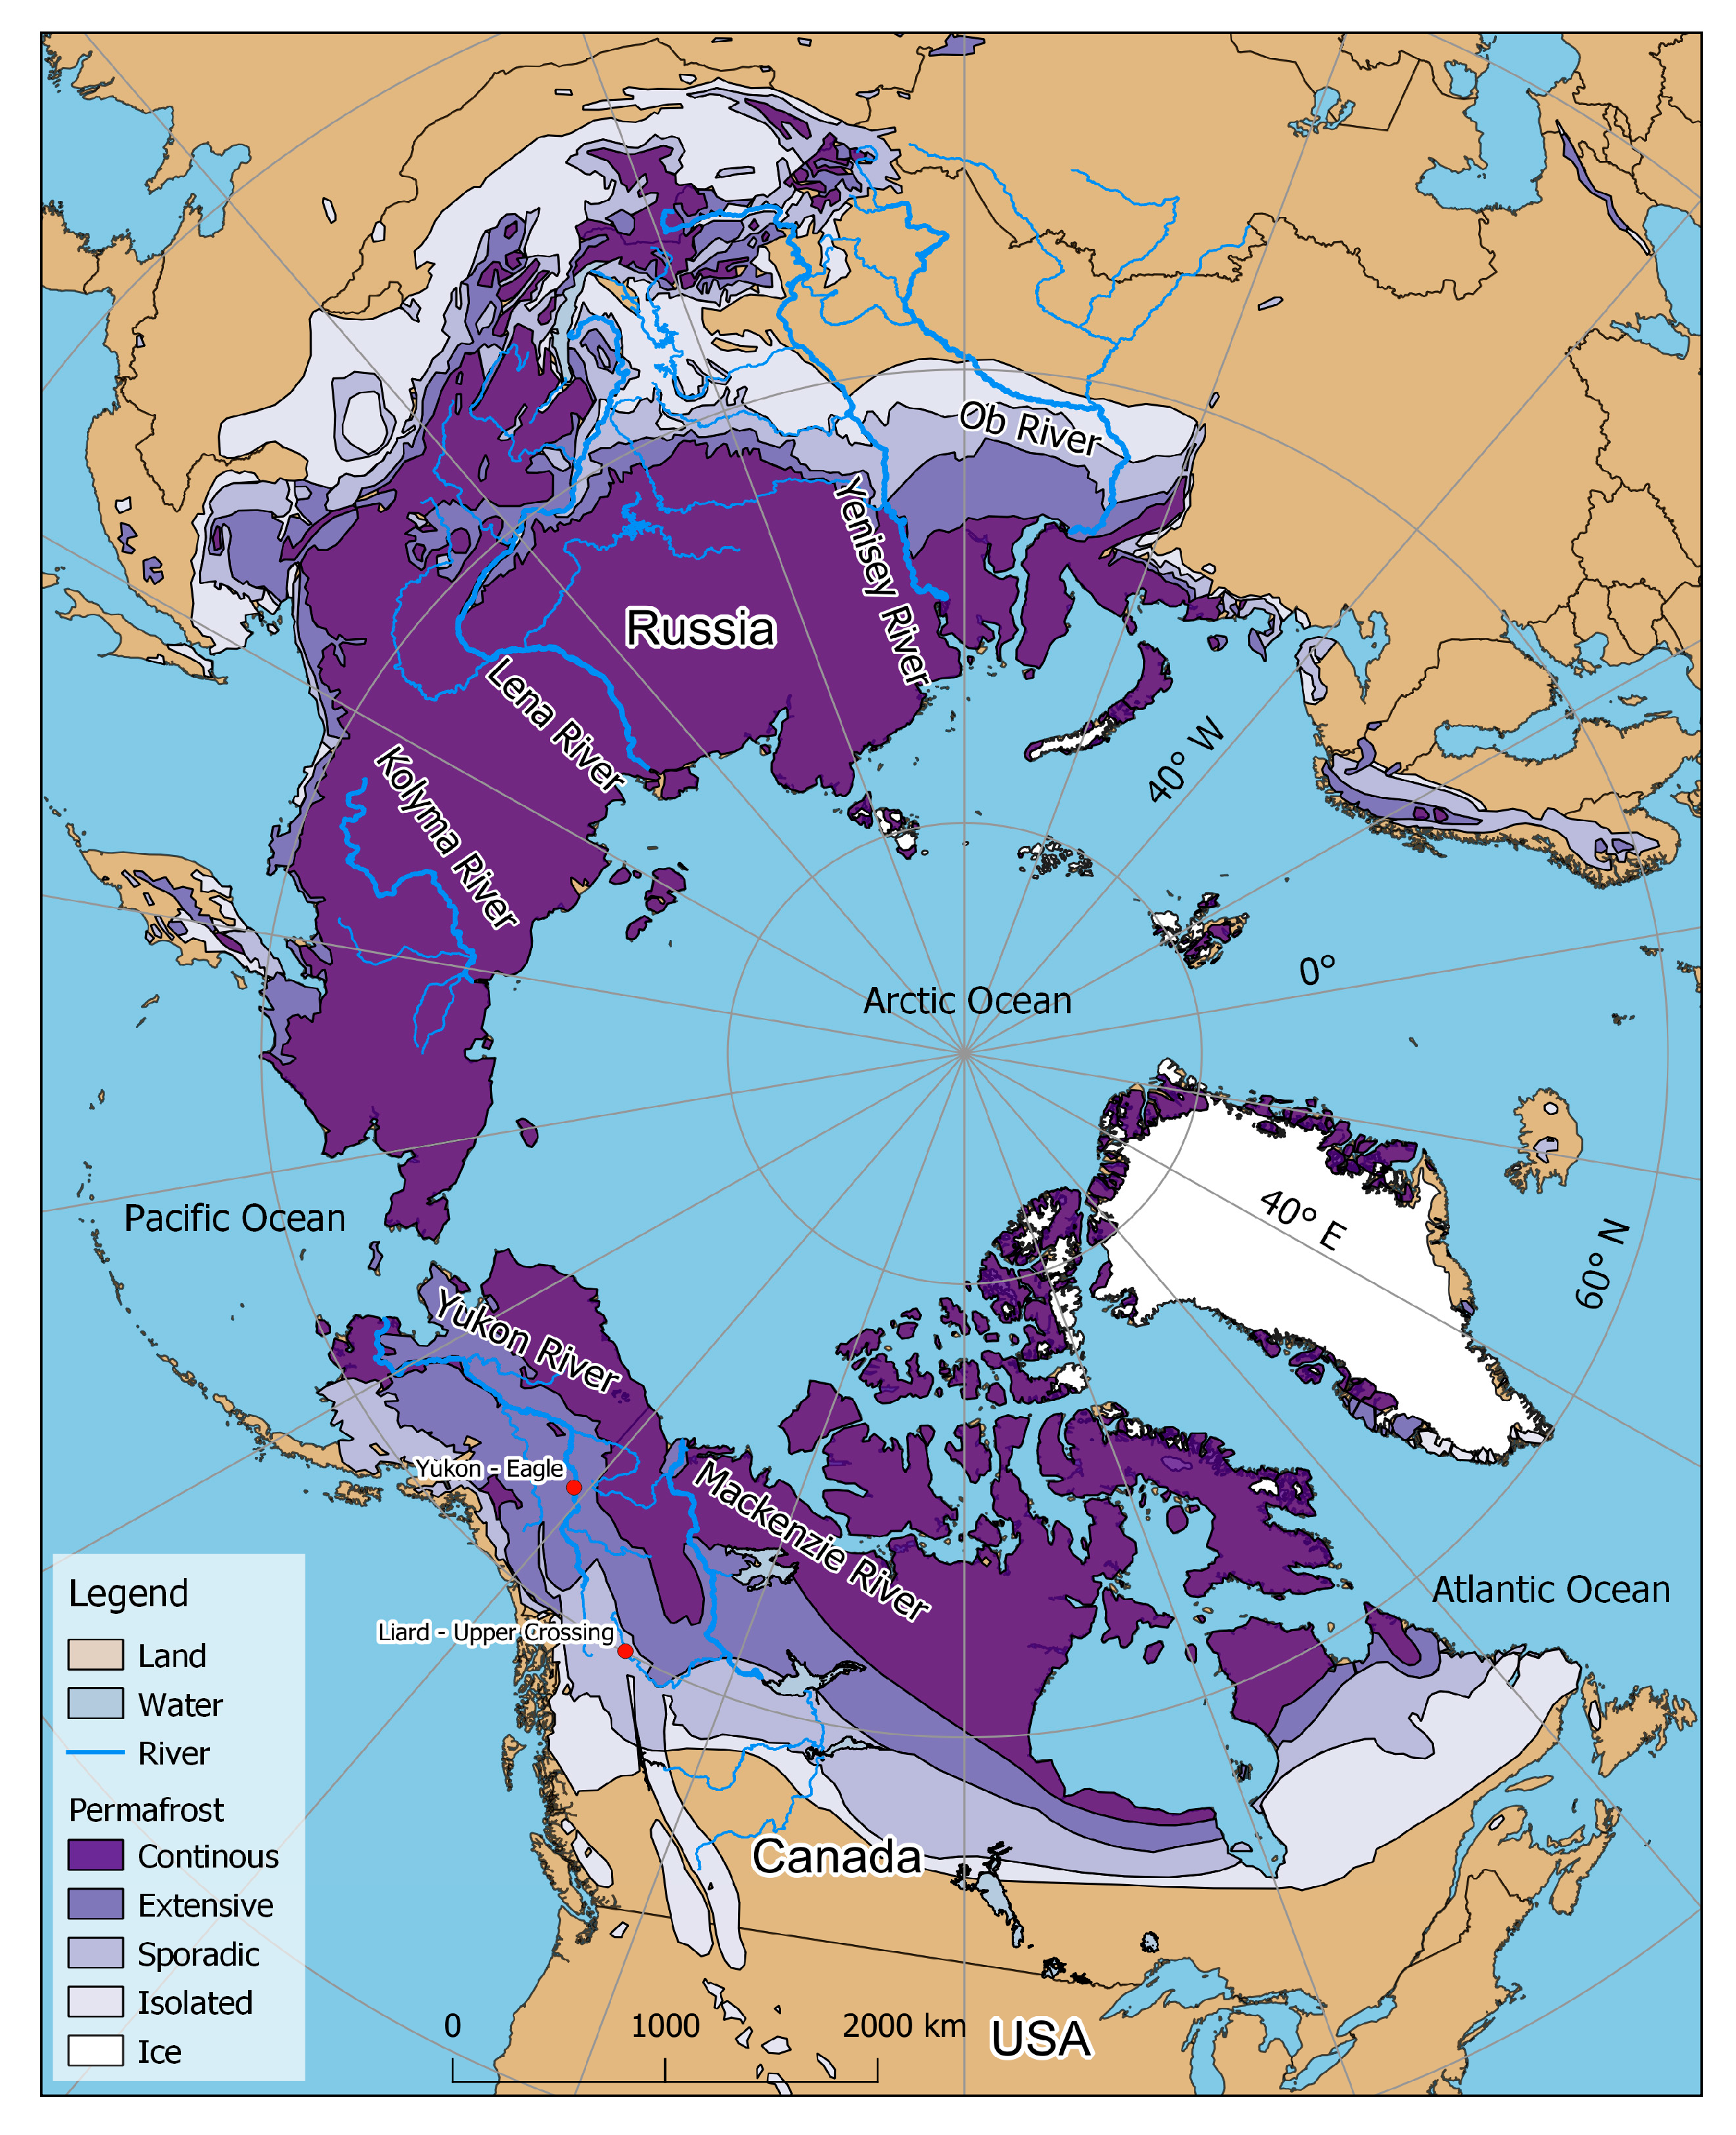
Figure A1.
Map showing the six large Arctic flowing rivers summarized in Table 1 (Kolyma, Lena, Yenisey, Ob, Mackenzie, and Yukon). Red dots indicate the location of two hydrometric stations: (1) Yukon River at Eagle (Yukon-E) and (2) Liard River at Upper Crossing (Liard-UC); for which detailed analyses of climatic controls on streamflow extremes were conducted.

The review of streamflow trends across the Pan-Arctic generally suggests consistent patterns. For instance, in the case of Qmean, most studies found an increasing trend or no trend (p < 0.05 or p < 0.10), with no study showing significantly decreasing trends. Furthermore, studies that considered aggregated discharge from several stations also found generally increasing discharges. For instance, Zhang et al. [4] found an increasing trend for the combined annual discharge from Lena, Yenisey and Ob Rivers from 1948 to 2008. Likewise, Durocher et al. [26] found a general increase in freshwater flow to the Arctic Ocean for the period 1975 to 2015, with the increase being more prominent in the Eurasian rivers than in the North American rivers. Ahmed et al. [28] found that the combined annual mean flow from the Mackenzie, Lena, Yenisey and Ob rivers to the Arctic Ocean has increased by 14% during in period 1980 to 2009. The increasing trends in Qmean are also consistent with the annual cold season and warm season precipitation increases across the Pan-Arctic [27].
From the few available studies on Qmin, the trends are mostly increasing, some of which are significant [21,70]. Additionally, winter (e.g., December to February or January to March) flows are also significantly increasing [28,34]. In the case of Qmax, the changes are mostly insignificant, except for the tributaries of the Yukon and Lena rivers, which show either increases or decreases [48,70]. However, besides hydro-climatic controls, other factors may contribute to these trends. For example, the increasing trend for the Lena River is also influenced by reservoir filling that reduced its outflows in the 1960s [71,72]. From the very few available studies, it appears that Qmax timings are shifting earlier [47,72] although the trends are generally not significant. Nevertheless, there is a general expectation of earlier Qmax timing, along with the earlier onset of snowmelt and earlier centroid of annual flow in a warmer climate [73].

Table A1.
Summary of previous studies on streamflow trends for major pan-Arctic Rivers.
| River/Region | Reference | Study Period | Trends | |||
|---|---|---|---|---|---|---|
| Qmean | Qmin | Qmax | Qmax Timing | |||
| Kolyma (Observed) | Box et al. [27] | 1971–2015 | ++1 (1) | |||
| Lena (Observed) | Box et al. [27] | 1971–2015 | ++1 (1) | |||
| Lena (Observed) | Ahmed et al. [28] | 1936–2009 | ++1 (1) annual volume | +NS10 (1) December–February volume | −− (1) | |
| Lena (multiple stations) | Tananaev et al. [70] | Varying periods between 1925–2013 | ++29 (100); −−2 (100) | ++30 (55); −−2 (55) | ++6 (105); −−3 (105) | |
| Lena + Eastern Siberia (multiple natural tributaries) | Smith et al. [21] | 1958–1989 | +46 (212); −17 (212) | |||
| Yenisey (Observed) | Box et al. [27] | 1971–2015 | +NS10 (1) | |||
| Yenisey (Observed) | Ahmed et al. [28] | 1980–2009 | ++1 (1) annual volume | ++1 (1) December–February volume | −NS10 (1) | |
| Ob (Observed) | Box et al. [27] | 1971–2015 | −NS10 (1) | |||
| Ob (Observed) | Ahmed et al. [28] | 1936–2009 | +NS10 (1) annual volume | ++1 (1) December–February volume | +NS10 (1) | |
| Mackenzie | Box et al. [27] | 1973–2015 | +NS10 (1) | |||
| Mackenzie | Yang et al. [47] | 1973–2011 | +NS10 (1) | +NS10 (1) | −NS10 (1) | −NS10 (1) |
| Mackenzie and tributaries | St. Jacques and Sauchyn [34] | Varying periods between 1939–2007 | +9 (23) | +20 (23) January–March mean flow | ||
| Yukon | Box et al. [27] | 1975–2016 | ++1 (1) | |||
| Yukon (Canadian Portion) | Déry et al. [74] | 1964–2013 | +NS05 (1) | |||
| Yukon and other rivers in Alaska | Bennett et al. [48] | 1954/1964–2013 | +3 (8) | −3 (8) | ||
++ (−−) indicate increasing (decreasing) trends at 5% significance level; + (−) indicate increasing (decreasing) trends at 10% significance level. NS05 and NS10 signify no significant trends at the 5% and 10% significance levels, respectively. Blank cells mean no analysis for that variable is performed in the cited study. The numbers in the trend columns are the number of stations with statistically significant trends (out of total number of stations).
References
- Serreze, M.C.; Barry, R.G. Processes and impacts of Arctic amplification: A research synthesis. Glob. Planet. Chang. 2011, 77, 85–96. [Google Scholar] [CrossRef]
- Cohen, J.; Screen, J.A.; Furtado, J.C.; Barlow, M.; Whittleston, D.; Coumou, D.; Francis, J.; Dethloff, K.; Entekhabi, D.; Overland, J.; et al. Recent Arctic amplification and extreme mid-latitude weather. Nat. Geosci. 2014, 7, 627–637. [Google Scholar] [CrossRef] [Green Version]
- Zhang, X.; Flato, G.; Kirchmeier-Young, M.; Vincent, L.; Wan, H.; Wang, X.; Rong, R.; Fyfe, J.; Li, G.; Kharin, V.V. Changes in temperature and precipitation across Canada; Chapter 4. In Canada’s Changing Climate Report; Bush, E., Lemmen, D.S., Eds.; Government of Canada: Ottawa, ON, Canada, 2019; pp. 112–193. [Google Scholar]
- Zhang, X.; He, J.; Zhang, J.; Polyakov, I.; Gerdes, R.; Inoue, J.; Wu, P. Enhanced poleward moisture transport and amplified northern high-latitude wetting trend. Nat. Clim. Chang. 2012, 3, 47–51. [Google Scholar] [CrossRef]
- Vihma, T.A.; Screen, J.; Tjernström, M.; Newton, B.W.; Zhang, X.; Popova, V.; Deser, C.; Holland, M.M.; Prowse, T.D. The atmospheric role in the Arctic water cycle: A review on processes, past and future changes, and their impacts. J. Geophys. Res. Biogeosciences 2016, 121, 586–620. [Google Scholar] [CrossRef] [Green Version]
- Derksen, C.; Brown, R.; Mudryk, L.; Luojus, K. Arctic: Terrestrial Snow. State of the Climate in 2014. Bull. Am. Meteorol. Soc. 2015, 96, 133–135. [Google Scholar]
- Mudryk, L.R.; Derksen, C.; Howell, S.; Laliberté, F.; Thackeray, C.; Sospedra-Alfonso, R.; Vionnet, V.; Kushner, P.J.; Brown, R. Canadian snow and sea ice: Historical trends and projections. Cryosphere 2018, 12, 1157–1176. [Google Scholar] [CrossRef] [Green Version]
- Derksen, C.; Burgess, D.; Duguay, C.; Howell, S.; Murdyk, L.; Smith, S.; Thackeray, C.; Kirchmeier-Young, M. Changes in snow, ice, and permafrost across Canada. In Changes in Snow, Ice, and Permafrost across Canada; Bush, E., Lemmen, D.S., Eds.; Government of Canada: Ottawa, ON, Canada, 2019; pp. 194–260. [Google Scholar]
- Romanovsky, V.E.; Smith, S.L.; Christiansen, H.H. Permafrost thermal state in the polar Northern Hemisphere during the international polar year 2007-2009: A synthesis. Permafr. Periglac. Process. 2010, 21, 106–116. [Google Scholar] [CrossRef] [Green Version]
- Grosse, G.; Goetz, S.; McGuire, A.D.E.; Romanovsky, V.; Schuur, E.A.G. Changing permafrost in a warming world and feedbacks to the Earth system. Environ. Res. Lett. 2016, 11, 040201. [Google Scholar] [CrossRef]
- Bintanja, R.; Andry, R.B.O. Towards a rain-dominated Arctic. Nat. Clim. Chang. 2017, 7, 263–267. [Google Scholar] [CrossRef]
- Barnett, T.P.; Adam, J.C.; Lettenmaier, D.P. Potential impacts of a warming climate on water availability in snow-dominated regions. Nat. Cell Biol. 2005, 438, 303–309. [Google Scholar] [CrossRef]
- Barnett, T.P.; Pierce, D.W.; Hidalgo, H.G.; Bonfils, C.; Santer, B.D.; Das, T.; Bala, G.; Wood, A.W.; Nozawa, T.; Mirin, A.A.; et al. Human-Induced Changes in the Hydrology of the Western United States. Science 2008, 319, 1080–1083. [Google Scholar] [CrossRef] [PubMed] [Green Version]
- Shrestha, R.R.; Cannon, A.J.; Schnorbus, M.A.; Alford, H. Climatic Controls on Future Hydrologic Changes in a Subarctic River Basin in Canada. J. Hydrometeorol. 2019, 20, 1757–1778. [Google Scholar] [CrossRef]
- Shrestha, R.R.; Cannon, A.J.; Schnorbus, M.A.; Zwiers, F.W. Projecting future nonstationary extreme streamflow for the Fraser River, Canada. Clim. Chang. 2017, 145, 289–303. [Google Scholar] [CrossRef]
- Rennert, K.J.; Roe, G.; Putkonen, J.; Bitz, C.M. Soil Thermal and Ecological Impacts of Rain on Snow Events in the Circumpolar Arctic. J. Clim. 2009, 22, 2302–2315. [Google Scholar] [CrossRef]
- Liston, G.E.; Hiemstra, C.A. The Changing Cryosphere: Pan-Arctic Snow Trends (1979–2009). J. Clim. 2011, 24, 5691–5712. [Google Scholar] [CrossRef]
- Hansen, B.B.; Isaksen, K.; Benestad, R.E.; Kohler, J.; Pedersen, Å.Ø.; Loe, L.E.; Coulson, S.J.; Larsen, J.O.; Varpe, Ø. Warmer and wetter winters: Characteristics and implications of an extreme weather event in the High Arctic. Environ. Res. Lett. 2014, 9, 114021. [Google Scholar] [CrossRef]
- Bokhorst, S.; Pedersen, S.H.; Brucker, L.; Anisimov, O.; Bjerke, J.W.; Brown, R.D.; Ehrich, D.; Essery, R.L.H.; Heilig, A.; Ingvander, S.; et al. Changing Arctic snow cover: A review of recent developments and assessment of future needs for observations, modelling, and impacts. Ambio 2016, 45, 516–537. [Google Scholar] [CrossRef] [Green Version]
- Bense, V.F.; Ferguson, G.; Kooi, H. Evolution of shallow groundwater flow systems in areas of degrading permafrost. Geophys. Res. Lett. 2009, 36. [Google Scholar] [CrossRef] [Green Version]
- Smith, L.C.; Pavelsky, T.M.; Macdonald, G.M.; Shiklomanov, A.I.; Lammers, R.B. Rising minimum daily flows in northern Eurasian rivers: A growing influence of groundwater in the high-latitude hydrologic cycle. J. Geophys. Res. Space Phys. 2007, 112. [Google Scholar] [CrossRef] [Green Version]
- Matti, B.; Dahlke, H.E.; Lyon, S.W. On the variability of cold region flooding. J. Hydrol. 2016, 534, 669–679. [Google Scholar] [CrossRef] [Green Version]
- Ye, B.; Yang, D.; Zhang, Z.; Kane, D.L. Variation of hydrological regime with permafrost coverage over Lena Basin in Siberia. J. Geophys. Res. Space Phys. 2009, 114. [Google Scholar] [CrossRef] [Green Version]
- Cherry, J.E.; Knapp, C.; Trainor, S.; Ray, A.J.; Tedesche, M.; Walker, S. Planning for climate change impacts on hydropower in the Far North. Hydrol. Earth Syst. Sci. 2017, 21, 133–151. [Google Scholar] [CrossRef] [Green Version]
- Instanes, A.; Kokorev, V.; Janowicz, R.; Bruland, O.; Sand, K.; Prowse, T. Changes to freshwater systems affecting Arctic infrastructure and natural resources. J. Geophys. Res. Biogeosci. 2016, 121, 567–585. [Google Scholar] [CrossRef] [Green Version]
- Durocher, M.; Requena, A.I.; Burn, D.H.; Pellerin, J. Analysis of trends in annual streamflow to the Arctic Ocean. Hydrol. Process. 2019, 33, 1143–1151. [Google Scholar] [CrossRef]
- Box, J.; Colgan, W.T.; Christensen, T.R.; Schmidt, N.M.; Lund, M.; Parmentier, F.-J.W.; Brown, R.; Bhatt, U.S.; Euskirchen, E.S.; Romanovsky, V.E.; et al. Key indicators of Arctic climate change: 1971–2017. Environ. Res. Lett. 2019, 14, 045010. [Google Scholar] [CrossRef]
- Ahmed, R.; Prowse, T.; Dibike, Y.; Bonsal, B.; O’Neil, H. Recent Trends in Freshwater Influx to the Arctic Ocean from Four Major Arctic-Draining Rivers. Water 2020, 12, 1189. [Google Scholar] [CrossRef] [Green Version]
- Heginbottom, J.A.; Dubreuil, M.A.; Harker, P.A. Canada—Permafrost, National Atlas of Canada, National Atlas Information Service; Natural Resources Canada, MCR: Ottawa, ON, Canada, 1995; p. 4177. [Google Scholar]
- Natural Resources Canada Index of Permafrost Database. Available online: https://ftp.maps.canada.ca/pub/nrcan_rncan/archive/vector/geology/Permafrost/ (accessed on 16 February 2021).
- Water Survey of Canada Water Level and Flow - Environment Canada. Available online: https://wateroffice.ec.gc.ca/ (accessed on 16 February 2021).
- United States Geological Survey USGS Current Conditions for USGS 15356000 YUKON R AT EAGLE AK. Available online: https://waterdata.usgs.gov/usa/nwis/uv?15356000 (accessed on 16 February 2021).
- De Rham, L.P.; Prowse, T.D.; Beltaos, S.; Lacroix, M.P. Assessment of annual high-water events for the Mackenzie River basin, Canada. Hydrol. Process. 2008, 22, 3864–3880. [Google Scholar] [CrossRef]
- Jacques, J.-M.S.; Sauchyn, D.J. Increasing winter baseflow and mean annual streamflow from possible permafrost thawing in the Northwest Territories, Canada. Geophys. Res. Lett. 2009, 36. [Google Scholar] [CrossRef]
- Werner, A.T.; Schnorbus, M.A.; Shrestha, R.R.; Cannon, A.J.; Zwiers, F.W.; Dayon, G.; Anslow, F. A long-term, temporally consistent, gridded daily meteorological dataset for northwestern North America. Sci. Data 2019, 6, 180299. [Google Scholar] [CrossRef] [Green Version]
- Hutchinson, M.F.; McKenney, D.W.; Lawrence, K.; Pedlar, J.H.; Hopkinson, R.F.; Milewska, E.; Papadopol, P. Development and Testing of Canada-Wide Interpolated Spatial Models of Daily Minimum–Maximum Temperature and Precipitation for 1961–2003. J. Appl. Meteorol. Clim. 2009, 48, 725–741. [Google Scholar] [CrossRef]
- Environment and Climate Change Canada National Hydrometric Network Basin Polygons-Open Government Portal. Available online: https://open.canada.ca/data/en/dataset/0c121878-ac23-46f5-95df-eb9960753375 (accessed on 16 February 2021).
- Bronaugh, D.; Werner, A. Zyp: Zhang + Yue-Pilon Trends Package. 2019. Available online: https://cran.r-project.org/web/packages/zyp/zyp.pdf. (accessed on 27 February 2021).
- Kendall, M.G. Rank Correlation Methods; Charles Griffin: London, UK, 1955. [Google Scholar]
- Zhang, X.; Zwiers, F.W. Comment on “Applicability of prewhitening to eliminate the influence of serial correlation on the Mann-Kendall test” by Sheng Yue and Chun Yuan Wang. Water Resour. Res. 2004, 40, 03805. [Google Scholar] [CrossRef] [Green Version]
- Bürger, G. On trend detection. Hydrol. Process. 2017, 31, 4039–4042. [Google Scholar] [CrossRef]
- Wilks, D.S. On “Field Significance” and the False Discovery Rate. J. Appl. Meteorol. Clim. 2006, 45, 1181–1189. [Google Scholar] [CrossRef]
- Helsel, D.R.; Hirsch, R.M. Statistical Methods in Water Resources; US Geological Survey: Reston, VA, USA, 2002; Volume 323. [Google Scholar]
- Lehner, F.; Wood, A.W.; Vano, J.A.; Lawrence, D.M.; Clark, M.P.; Mankin, J.S. The potential to reduce uncertainty in regional runoff projections from climate models. Nat. Clim. Chang. 2019, 9, 926–933. [Google Scholar] [CrossRef]
- Chegwidden, O.S.; Rupp, D.E.; Nijssen, B. Climate change alters flood magnitudes and mechanisms in climatically-diverse headwaters across the northwestern United States. Environ. Res. Lett. 2020, 15, 094048. [Google Scholar] [CrossRef]
- Kuhn, M.; Wing, J.; Weston, S.; Williams, A.; Keefer, C.; Engelhardt, A.; Cooper, T.; Mayer, Z.; Kenkel, B. Caret: Classification and Regression Training. 2018. Available online: https://ui.adsabs.harvard.edu/abs/2015ascl.soft05003K/abstract (accessed on 26 February 2021).
- Yang, D.; Shi, X.; Marsh, P.D. Variability and extreme of Mackenzie River daily discharge during 1973–2011. Quat. Int. 2015, 380–381, 159–168. [Google Scholar] [CrossRef]
- Bennett, K.; Cannon, A.; Hinzman, L. Historical trends and extremes in boreal Alaska river basins. J. Hydrol. 2015, 527, 590–607. [Google Scholar] [CrossRef]
- Yang, D.; Shrestha, R.R.; Park, H. Heat Flux from 15 Canadian Northern Rivers Draining to Arctic Ocean and Hudson/James Bay. Glob. Planet. Chang. under review.
- Mekis, É.; Vincent, L.A. An Overview of the Second Generation Adjusted Daily Precipitation Dataset for Trend Analysis in Canada. Atmosphere-Ocean. 2011, 49, 163–177. [Google Scholar] [CrossRef] [Green Version]
- Hamilton, S. Sources of Uncertainty in Canadian Low Flow Hydrometric Data. Can. Water Resour. J. / Rev. Can. des ressources hydriques 2008, 33, 125–136. [Google Scholar] [CrossRef] [Green Version]
- Woo, M.-K.; Thorne, R. Winter Flows in the Mackenzie Drainage System. Arct. 2014, 67, 238–256. [Google Scholar] [CrossRef] [Green Version]
- IPCC. Annex I: Atlas of Global and Regional Climate Projections. In Climate Change 2013; Van Oldenborgh, G.J., Collins, M., Arblaster, J., Christensen, J.H., Marotzke, J., Power, S.B., Rummukainen, M., Zhou, T., Stocker, T., Qin, D., Eds.; Cambridge University Press: Cambridge, UK; New York, NY, USA, 2013; pp. 1311–1393. [Google Scholar]
- Jeong, D.I.; Sushama, L. Rain-on-snow events over North America based on two Canadian regional climate models. Clim. Dyn. 2017, 50, 303–316. [Google Scholar] [CrossRef] [Green Version]
- Mudryk, L.; Santolaria-Otín, M.; Krinner, G.; Ménégoz, M.; Derksen, C.; Brutel-Vuilmet, C.; Brady, M.; Essery, R. Historical Northern Hemisphere snow cover trends and projected changes in the CMIP6 multi-model ensemble. Cryosphere 2020, 14, 2495–2514. [Google Scholar] [CrossRef]
- Callaghan, T.V.; Johansson, M.; Brown, R.D.; Groisman, P.Y.; Labba, N.; Radionov, V.; Barry, R.G.; Bulygina, O.N.; Essery, R.L.H.; Frolov, D.M.; et al. The Changing Face of Arctic Snow Cover: A Synthesis of Observed and Projected Changes. Ambio 2011, 40, 17–31. [Google Scholar] [CrossRef] [Green Version]
- Diffenbaugh, N.S.; Scherer, M.; Ashfaq, M. Response of snow-dependent hydrologic extremes to continued global warming. Nat. Clim. Chang. 2012, 3, 379–384. [Google Scholar] [CrossRef] [PubMed] [Green Version]
- Shrestha, R.R.; Bonsal, B.R.; Bonnyman, J.M.; Cannon, A.J.; Najafi, M.R. Heterogeneous snowpack response and snow drought occurrence across river basins of northwestern North America under 1.0 °C to 4.0 °C global warming. Clim. Chang. 2021, 164, 1–21. [Google Scholar] [CrossRef]
- Collins, M.; Knutti, R.; Arblaster, J.; Dufresne, J.; Fichefet, T.; Friedlingstein, P.; Gao, X.; Gutowski, W.; Johns, T.; Krinner, G.; et al. Long-term Climate Change: Projections, Commitments and Irreversibility. In Climate Change 2013: The Physical Science Basis. Contribution of Working Group I to the Fifth Assessment Report of the Intergovernmental Panel on Climate Change; Stocker, T., Qin, D., Plattner, G., Tignor, M., Allen, S., Boschung, J., Nauels, A., Xia, Y., Bex, V., Midgley, P., Eds.; Cambridge University Press: Cambridge, UK, 2013; pp. 1029–1136. [Google Scholar]
- Koirala, S.; Yeh, P.J.-F.; Hirabayashi, Y.; Kanae, S.; Oki, T. Global-scale land surface hydrologic modeling with the representation of water table dynamics. J. Geophys. Res. Atmos. 2014, 119, 75–89. [Google Scholar] [CrossRef]
- Schewe, J.; Heinke, J.; Gerten, D.; Haddeland, I.; Arnell, N.W.; Clark, D.B.; Dankers, R.; Eisner, S.; Fekete, B.M.; Colón-González, F.J.; et al. Multimodel assessment of water scarcity under climate change. Proc. Natl. Acad. Sci. USA 2014, 111, 3245–3250. [Google Scholar] [CrossRef] [PubMed] [Green Version]
- Bring, A.; Shiklomanov, A.; Lammers, R.B. Pan-Arctic river discharge: Prioritizing monitoring of future climate change hot spots. Earth’s Futur. 2017, 5, 72–92. [Google Scholar] [CrossRef]
- Hirabayashi, Y.; Mahendran, R.; Koirala, S.; Konoshima, L.; Yamazaki, D.; Watanabe, S.; Kim, H.; Kanae, S. Global flood risk under climate change. Nat. Clim. Chang. 2013, 3, 816–821. [Google Scholar] [CrossRef]
- Kane, D.L.; McNamara, J.P.; Yang, D.; Olsson, P.Q.; Gieck, R.E. An Extreme Rainfall/Runoff Event in Arctic Alaska. J. Hydrometeorol. 2003, 4, 1220–1228. [Google Scholar] [CrossRef] [Green Version]
- Kane, D.L.; Hinzman, L.D.; Gieck, R.E.; McNamara, J.P.; Youcha, E.K.; Oatley, J.A. Contrasting extreme runoff events in areas of continuous permafrost, Arctic Alaska. Hydrol. Res. 2008, 39, 287–298. [Google Scholar] [CrossRef]
- Dugan, H.A.; Lamoureux, S.F.; Lafrenière, M.J.; Lewis, T. Hydrological and sediment yield response to summer rainfall in a small high Arctic watershed. Hydrol. Process. 2009, 23, 1514–1526. [Google Scholar] [CrossRef]
- Striegl, R.G.; Dornblaser, M.M.; Aiken, G.R.; Wickland, K.P.; Raymond, P.A. Carbon export and cycling by the Yukon, Tanana, and Porcupine rivers, Alaska, 2001-2005. Water Resour. Res. 2007, 43. [Google Scholar] [CrossRef] [Green Version]
- Aiken, G.R.; Spencer, R.G.M.; Striegl, R.G.; Schuster, P.F.; Raymond, P.A. Influences of glacier melt and permafrost thaw on the age of dissolved organic carbon in the Yukon River basin. Glob. Biogeochem. Cycles 2014, 28, 525–537. [Google Scholar] [CrossRef]
- Bliss, A.; Hock, R.; Radić, V. Global response of glacier runoff to twenty-first century climate change. J. Geophys. Res. Earth Surf. 2014, 119, 717–730. [Google Scholar] [CrossRef]
- Tananaev, N.I.; Makarieva, O.M.; Lebedeva, L.S. Trends in annual and extreme flows in the Lena River basin, Northern Eurasia. Geophys. Res. Lett. 2016, 43, 10–764. [Google Scholar] [CrossRef]
- Yang, D.; Ye, B.; Kane, D.L. Streamflow changes over Siberian Yenisei River Basin. J. Hydrol. 2004, 296, 59–80. [Google Scholar] [CrossRef]
- Shiklomanov, A.I.; Lammers, R.B.; Rawlins, M.A.; Smith, L.C.; Pavelsky, T.M. Temporal and spatial variations in maximum river discharge from a new Russian data set. J. Geophys. Res. Space Phys. 2007, 112. [Google Scholar] [CrossRef]
- Tan, A.; Adam, J.C.; Lettenmaier, D.P. Change in spring snowmelt timing in Eurasian Arctic rivers. J. Geophys. Res. Space Phys. 2011, 116. [Google Scholar] [CrossRef] [Green Version]
- Déry, S.J.; Stadnyk, T.A.; Macdonald, M.K.; Gauli-Sharma, B. Recent trends and variability in river discharge across northern Canada. Hydrol. Earth Syst. Sci. 2016, 20, 4801–4818. [Google Scholar] [CrossRef] [Green Version]
Figure 1.
Historical trends in streamflow variables for the permafrost region of Canada: (a) Mean flow (Qmean); (b) Minimum flow (Qmin); (c) maximum flow (Qmax) and (d) Qmax timing. Significant increasing and decreasing trends at 5% and 10% levels are shown.
Figure 1.
Historical trends in streamflow variables for the permafrost region of Canada: (a) Mean flow (Qmean); (b) Minimum flow (Qmin); (c) maximum flow (Qmax) and (d) Qmax timing. Significant increasing and decreasing trends at 5% and 10% levels are shown.

Figure 2.
Historical trends in basin-averaged temperature and precipitation for the permafrost region of Canada: (a) October–March mean temperature (O–M_T); (b) October–March total precipitation (O–M_P); (c) April–September mean temperature (A–S_T); (d) April–September total precipitation (A–S_P). Significant increasing and decreasing trends at 5 and 10% levels are shown.

Figure 3.
Correlogram of climatic and streamflow variables: (a) 1976 to 2005 mean climatology; (b) trends for available period. Both climatic and streamflow variables are averaged over the basins. The numbers on the plots are Kendall’s τ correlations, with significant correlations (p < 0.1) indicated by bold numbers.

Figure 4.
Sensitivity plots of streamflow anomalies against annual/seasonal temperature (°C) and precipitation (%) anomalies with respect to 1976–2005 period. Illustrated results for Liard and Yukon Rivers include: (a,b) Qmean against Ann_T and Ann_P; (c,d) Qmin against October to March temperature (O–M_T) and precipitation (O–M_P); and (e,f) Qmax against October–June temperature (O–J_T) and precipitation (O–J_P) anomalies.

Table 1.
Number of stations with significant trends (p < 0.1) using the Mann–Kendall test with iterative pre-whitening, and the number of field significant trends with false detection rate method.
Table 1.
Number of stations with significant trends (p < 0.1) using the Mann–Kendall test with iterative pre-whitening, and the number of field significant trends with false detection rate method.
| Variable | Significant Increasing/Decreasing Trends/Total Stations | Field significant Increasing/Decreasing Trends/Total Stations |
|---|---|---|
| Qmean | 12/5/79 | 6/0/79 |
| Qmin | 35/2/79 | 30/1/79 |
| Qmax | 9/7/83 | 3/1/83 |
| Qmax timing | 8/7/83 | 0/0/83 |
| Qmax/Qmin | 2/33/79 | 1/19/79 |
| O–M_T | 67/0/84 | 63/0/84 |
| A–S_T | 60/0/84 | 55/0/84 |
| O–M_P | 23/3/84 | 11/0/84 |
| A–S_P | 13/1/84 | 2/0/84 |
Table 2.
Number of stations in seven regions with significant trends (p < 0.1) using the Mann–Kendall test with iterative pre-whitening. Summarized trends include significant increasing/ decreasing trends/ total stations.
Table 2.
Number of stations in seven regions with significant trends (p < 0.1) using the Mann–Kendall test with iterative pre-whitening. Summarized trends include significant increasing/ decreasing trends/ total stations.
| Variable | Region 3 | Region 4 | Region 5 | Region 6 | Region 7 | Region 8 & 9 | Region 10 |
|---|---|---|---|---|---|---|---|
| Qmean | 0/3/5 | 0/0/5 | 0/0/6 | 4/1/15 | 0/0/9 | 4/0/14 | 2/1/25 |
| Qmin | 0/1/5 | 0/0/6 | 2/0/7 | 4/1/15 | 2/0/9 | 11/0/13 | 14/1/24 |
| Qmax | 0/2/5 | 0/1/5 | 0/0/7 | 2/1/15 | 1/2/9 | 1/1/14 | 4/1/28 |
| Qmax timing | 0/0/5 | 2/0/5 | 3/0/7 | 1/0/15 | 0/0/9 | 0/2/14 | 2/5/28 |
| Qmax/Qmin | 1/3/5 | 0/0/6 | 0/2/7 | 1/1/15 | 0/6/9 | 0/10/13 | 2/9/24 |
| O–M_T | 4/0/5 | 4/0/6 | 4/0/7 | 10/0/15 | 8/0/9 | 10/0/14 | 27/0/28 |
| A–S_T | 3/0/5 | 6/0/6 | 5/0/7 | 11/0/15 | 5/0/9 | 9/0/14 | 21/0/28 |
| O–M_P | 0/0/5 | 1/0/6 | 2/0/7 | 5/0/15 | 3/0/9 | 0/0/14 | 12/3/28 |
| A–S_P | 0/0/5 | 0/0/6 | 0/0/7 | 0/0/15 | 3/0/9 | 0/0/14 | 10/1/28 |
Seven regions are defined according to the Water Survey of Canada drainage regions, which include: (3) Labrador, Northwestern Quebec; (4) Albany; (5) Nelson; (6) Arctic, Hudson Bay; (7) Upper Mackenzie; (8) and (9) Pacific and Yukon; and (10) Arctic, Lower Mackenzie and Queen.
Publisher’s Note: MDPI stays neutral with regard to jurisdictional claims in published maps and institutional affiliations. |
© 2021 by the authors. Licensee MDPI, Basel, Switzerland. This article is an open access article distributed under the terms and conditions of the Creative Commons Attribution (CC BY) license (http://creativecommons.org/licenses/by/4.0/).
Share and Cite
MDPI and ACS Style
Shrestha, R.R.; Pesklevits, J.; Yang, D.; Peters, D.L.; Dibike, Y.B. Climatic Controls on Mean and Extreme Streamflow Changes Across the Permafrost Region of Canada. Water 2021, 13, 626. https://doi.org/10.3390/w13050626
AMA Style
Shrestha RR, Pesklevits J, Yang D, Peters DL, Dibike YB. Climatic Controls on Mean and Extreme Streamflow Changes Across the Permafrost Region of Canada. Water. 2021; 13(5):626. https://doi.org/10.3390/w13050626
Chicago/Turabian StyleShrestha, Rajesh R., Jennifer Pesklevits, Daqing Yang, Daniel L. Peters, and Yonas B. Dibike. 2021. "Climatic Controls on Mean and Extreme Streamflow Changes Across the Permafrost Region of Canada" Water 13, no. 5: 626. https://doi.org/10.3390/w13050626
Note that from the first issue of 2016, this journal uses article numbers instead of page numbers. See further details here.