
Geosmin and 2-MIB Removal by Full-Scale Drinking Water Treatment Processes in the Republic of Korea


1
Department of Environmental & Energy Engineering, Suwon University, 17 Wauan-gil, Bongdam-eup, Hwaseong-si 18323, Korea
2
Pioneer Team Research Institute, GS Engineering &Construction, 33, Jong-ro, Jongro-gu, Seoul 03159, Korea
*
Author to whom correspondence should be addressed.
Water 2021, 13(5), 628; https://doi.org/10.3390/w13050628
Submission received: 9 January 2021
/
Revised: 11 February 2021
/
Accepted: 22 February 2021
/
Published: 27 February 2021
(This article belongs to the Section Wastewater Treatment and Reuse)
Abstract
:Due to climate change, population growth, industrialization, urbanization, and water contamination, it is becoming more difficult to secure and supply clean and safe drinking water. One of the challenges many water utilities often face is the taste and odor (T&O) problem in drinking water treatment plants, mostly associated with geosmin and 2-MIB. These representative T&O compounds are mainly produced by the metabolism of blue-green algae (cyanobacteria), especially in summer. In this study, the correlation between algae blooms and T&O compounds was identified in the intake and raw water of a large-scale water treatment plant in the Republic of Korea. The removal efficiency of geosmin and 2-MIB by each treatment process was intensively evaluated. According to the obtained results, ozonation and granular activated carbon (GAC) adsorption were more effective for removing the troublesome compounds compared to other water treatment processes, such as coagulation/flocculation, filtration, and chlorination. Because of their seasonal concentration variation and different removal rates, optimal operation methods need to be developed and implemented for drinking water treatment plants to solve the T&O problems.

1. Introduction
Water utilities often encounter taste and odor (T&O) problems associated with geosmin (trans-1, 10-dimethyl-trans-9-decalol) and 2-MIB (2-methylisoborneol), which has been identified as a major taste and odor-causing compound in drinking water produced from surface water [1,2,3,4]. These T&O compounds are naturally produced during the activities of many aquatic microorganisms, mainly the metabolism of the cyanobacteria known by several different names, including “blue-green algae,” “blue-greens,” and “Cyanophyta.” They have a strong earthy, musty, moldy taste, and odor, which can be detected by the human nose at very low concentrations, such as 5 to 10 parts per trillion (ng/L) [1,5,6,7]. Earthy and musty odors are one of the most frequently reported complaints to water utilities, especially in the algae bloom period [8]. The unpleasant taste and odor caused by geosmin and 2-MIB may cause consumers to lose confidence in the safety of the drinking water supplied. Consequently, the fear of drinking contaminated water, as well as the consumers’ esthetic concerns may reduce water consumption [9]. Although there is currently no regulation for these two compounds in the Republic of Korea, the Korean government has set 20 ng/L as a maximum allowable limit (MAL) or a maximum contaminant level goal (MCLG) of geosmin and 2-MIB. Moreover, water utilities are required to monitor their concentrations according to seasonal variations in major drinking water sources. When the concentration of geosmin or 2-MIB exceeds the MAL (or MCLG), a daily analysis must be conducted until the concentration is below 10 ng/L [10].
Many studies reported that the occurrences of T&O compounds are very difficult to predict and removal by conventional water treatment processes, such as coagulation, sedimentation, and filtration is difficult; only advanced water treatment processes including oxidation, activated carbon adsorption, nanofiltration (NF), and reverse osmosis (RO) can remove them effectively [10,11,12,13]. Chlorine and chlorine dioxide can sometimes be used to treat some types of T&O compounds, but they are not effective for removing geosmin and 2-MIB. In addition, they can produce disinfection byproducts, such as trihalomethanes (THMs) and halo acetic acids (HAAs) [10]. Ozone (O3) can be used as an alternative oxidant owing to its strong oxidation capacity [4,7]. However, it can also facilitate the formation of disinfection byproducts, such as bromate and aldehydes. Moreover, this oxidation process is relatively expensive and complex [9]. Other advanced oxidation technologies, such as ozone and ultraviolet (UV) with H2O2 (or TiO2), can be considered as an alternative method for removing geosmin and 2-MIB [8,14]. Activated carbon adsorption with powdered activated carbon (PAC) and granular activated carbon (GAC) have been known to successfully remove the T&O compounds below the threshold concentration level [8,9]. PAC is often used to manage seasonal T&O problems. However, the removal efficiency for geosmin and 2-MIB is less than that of other contaminants in water. In addition, when raw water has a large amount of natural organic matter (NOM) derived from the decay of plants and animals, the PAC removal capacity of the T&O compounds can be reduced. This is because NOMs compete with the T&O compounds for the adsorption sites in the activated carbon [3,11,15]. The large dosage of PAC required during an algae bloom period makes it economically impractical, especially for large water utilities. Because of the removal inefficiency, byproduct formation potential, and high capital and operational costs of the advanced treatment technologies mentioned above, a suitable technology or process for drinking water treatment plants to effectively and efficiently manage the T&O problems while supplying clean and safe drinking water at low water tariffs is needed.
This study was conducted to determine the geosmin and 2-MIB correlation with the growth of total algae, cyanobacteria, and chlorophyll-a in the intake water and evaluate the removal efficiencies of unit processes of a large-scale water treatment plant located in D city, Republic of Korea. Suitable and effective solutions among the current treatment processes for removing geosmin and 2-MIB were determined, and the seasonal effects on the removal efficiency of the contaminants were investigated. Besides the T&O compounds, other water qualities, such as turbidity, suspended solids, total dissolved solids, and KMnO4 consumption, were monitored and analyzed.
2. Materials and Methods
2.1. Drinking Water Treatment Processes and Sampling Methods
A drinking water treatment plant located in D city, Republic of Korea, has 700,000 m3/d of treatment capacity (450,000 m3/d of the average operation rate, 64%; 0.42 kWh/m3 of the average energy consumption rate). It consists of a raw water pumping station, receiving wells (for stabilizing raw water and injecting powered activated carbon and chlorine), preozonation (for generating ozone gas bubbles to destroy disease-causing microorganisms and algae), chemical injection and mixing basins (for injecting alum for coagulating particles), flocculation and settling basins (for forming large setting particles to be settled out and removed), sand filtration (for removing small particles by filtration), postozonation (for converting nonbiodegradable substances to biodegradable ones), activated carbon adsorption (for adsorbing and eliminating dissolved organic substances), clear wells (for storing the treated water and disinfecting it with chlorine), and a water supply pumping station. Table 1 presents the process design and operation information. The sampling points of this study are presented in the drinking water treatment processes shown in Figure 1. During the study period from September 2015 to July 2017, sampling was conducted seventy-two times. Each sample was collected using an auto sampler (Hach AS 950 portable auto sampler) for 4 to 24 h.
2.2. Analysis
The water quality of samples from each stage of treatment was characterized for dissolved oxygen (DO), pH, conductivity, temperature, turbidity, KMnO4 consumption, total organic carbon (TOC), dissolved organic carbon (DOC), chlorophyll-a, algae cell number, geosmin, and 2-MIB. The DO was measured using a DO meter (YSI 51B and 58). A multipurpose water quality analyzer (YSI 550, Yellow Springs, OH, USA) was used to measure pH, conductivity, and water temperature, whereas turbidity was quantified using a Hach turbidimeter (2011A, HACH, Loveland, CO, USA). KMnO4 consumption and suspended solids were quantified following the standard methods for the examination of water and wastewater [16]. TOC was analyzed using a Shimadzu total organic carbon analyzer (TOC)-VCSH (Kyoto, Japan), whereas DOC was measured using a sample filtrated through Whatman GF/C 0.45 μm filters in accordance with the TOC analysis method. For chlorophyll-a, samples were filtered through Whatman GF/F filters and then chlorophyll-a extracted with acetone (9 + 1) was stored in a refrigerator (4 °C) for 24 h. After centrifugation (500 × g, 20 min), the concentrations were calculated using the following equation:
where V1: supernatant (L), V2: filtered sample (L), X1: OD663 − OD750, X2: OD645 − OD750, X3: OD630 − OD750, OD663: optical density at 663 nm, OD750: optical density at 750 nm, OD645: optical density at 645 nm, OD630: Optical density at 630 nm. OD was measured using a UV spectrophotometer (Shimadzu UV-1201, Kyoto, Japan) [16]. To count total algae and cyanobacteria cells (cells/mL), an optical microscope (ZEISS, Model Axioskop 40) was used. Phytoplankton samples fixed with Lugol’s solution were allowed to settle for more than 3 d, and then the supernatant was removed and concentrated to 1/10. After identifying the algal species, the number of cells was evenly dispersed in a 1 mL counting chamber—Sedgwick–Rafter chamber, and then the number of cells was counted using a high-magnification optical microscope (Model Axioskop 40, Carl Zeiss, Germany) [17]. Geosmin and 2-MIB were quantified using gas-chromatographic mass spectrometric detection (GC/MSD) after pretreatment via stir bar sorptive extraction which adsorbs geosmin and MIB on a coated stirring rod (TwisterTM, Gerstel, Müllheim a/d Ruhr, Germany) and separates them in water [18]. Table 2 shows the analytical conditions of the GC/MSD.
Chlorophyll-a (mg/m3) = (11.64X1 − 2.16X2 + 0.01X3) × V1/V2
3. Results and Discussion
3.1. Analysis of Algae, Geosmin, and 2-MIB in Intake Water
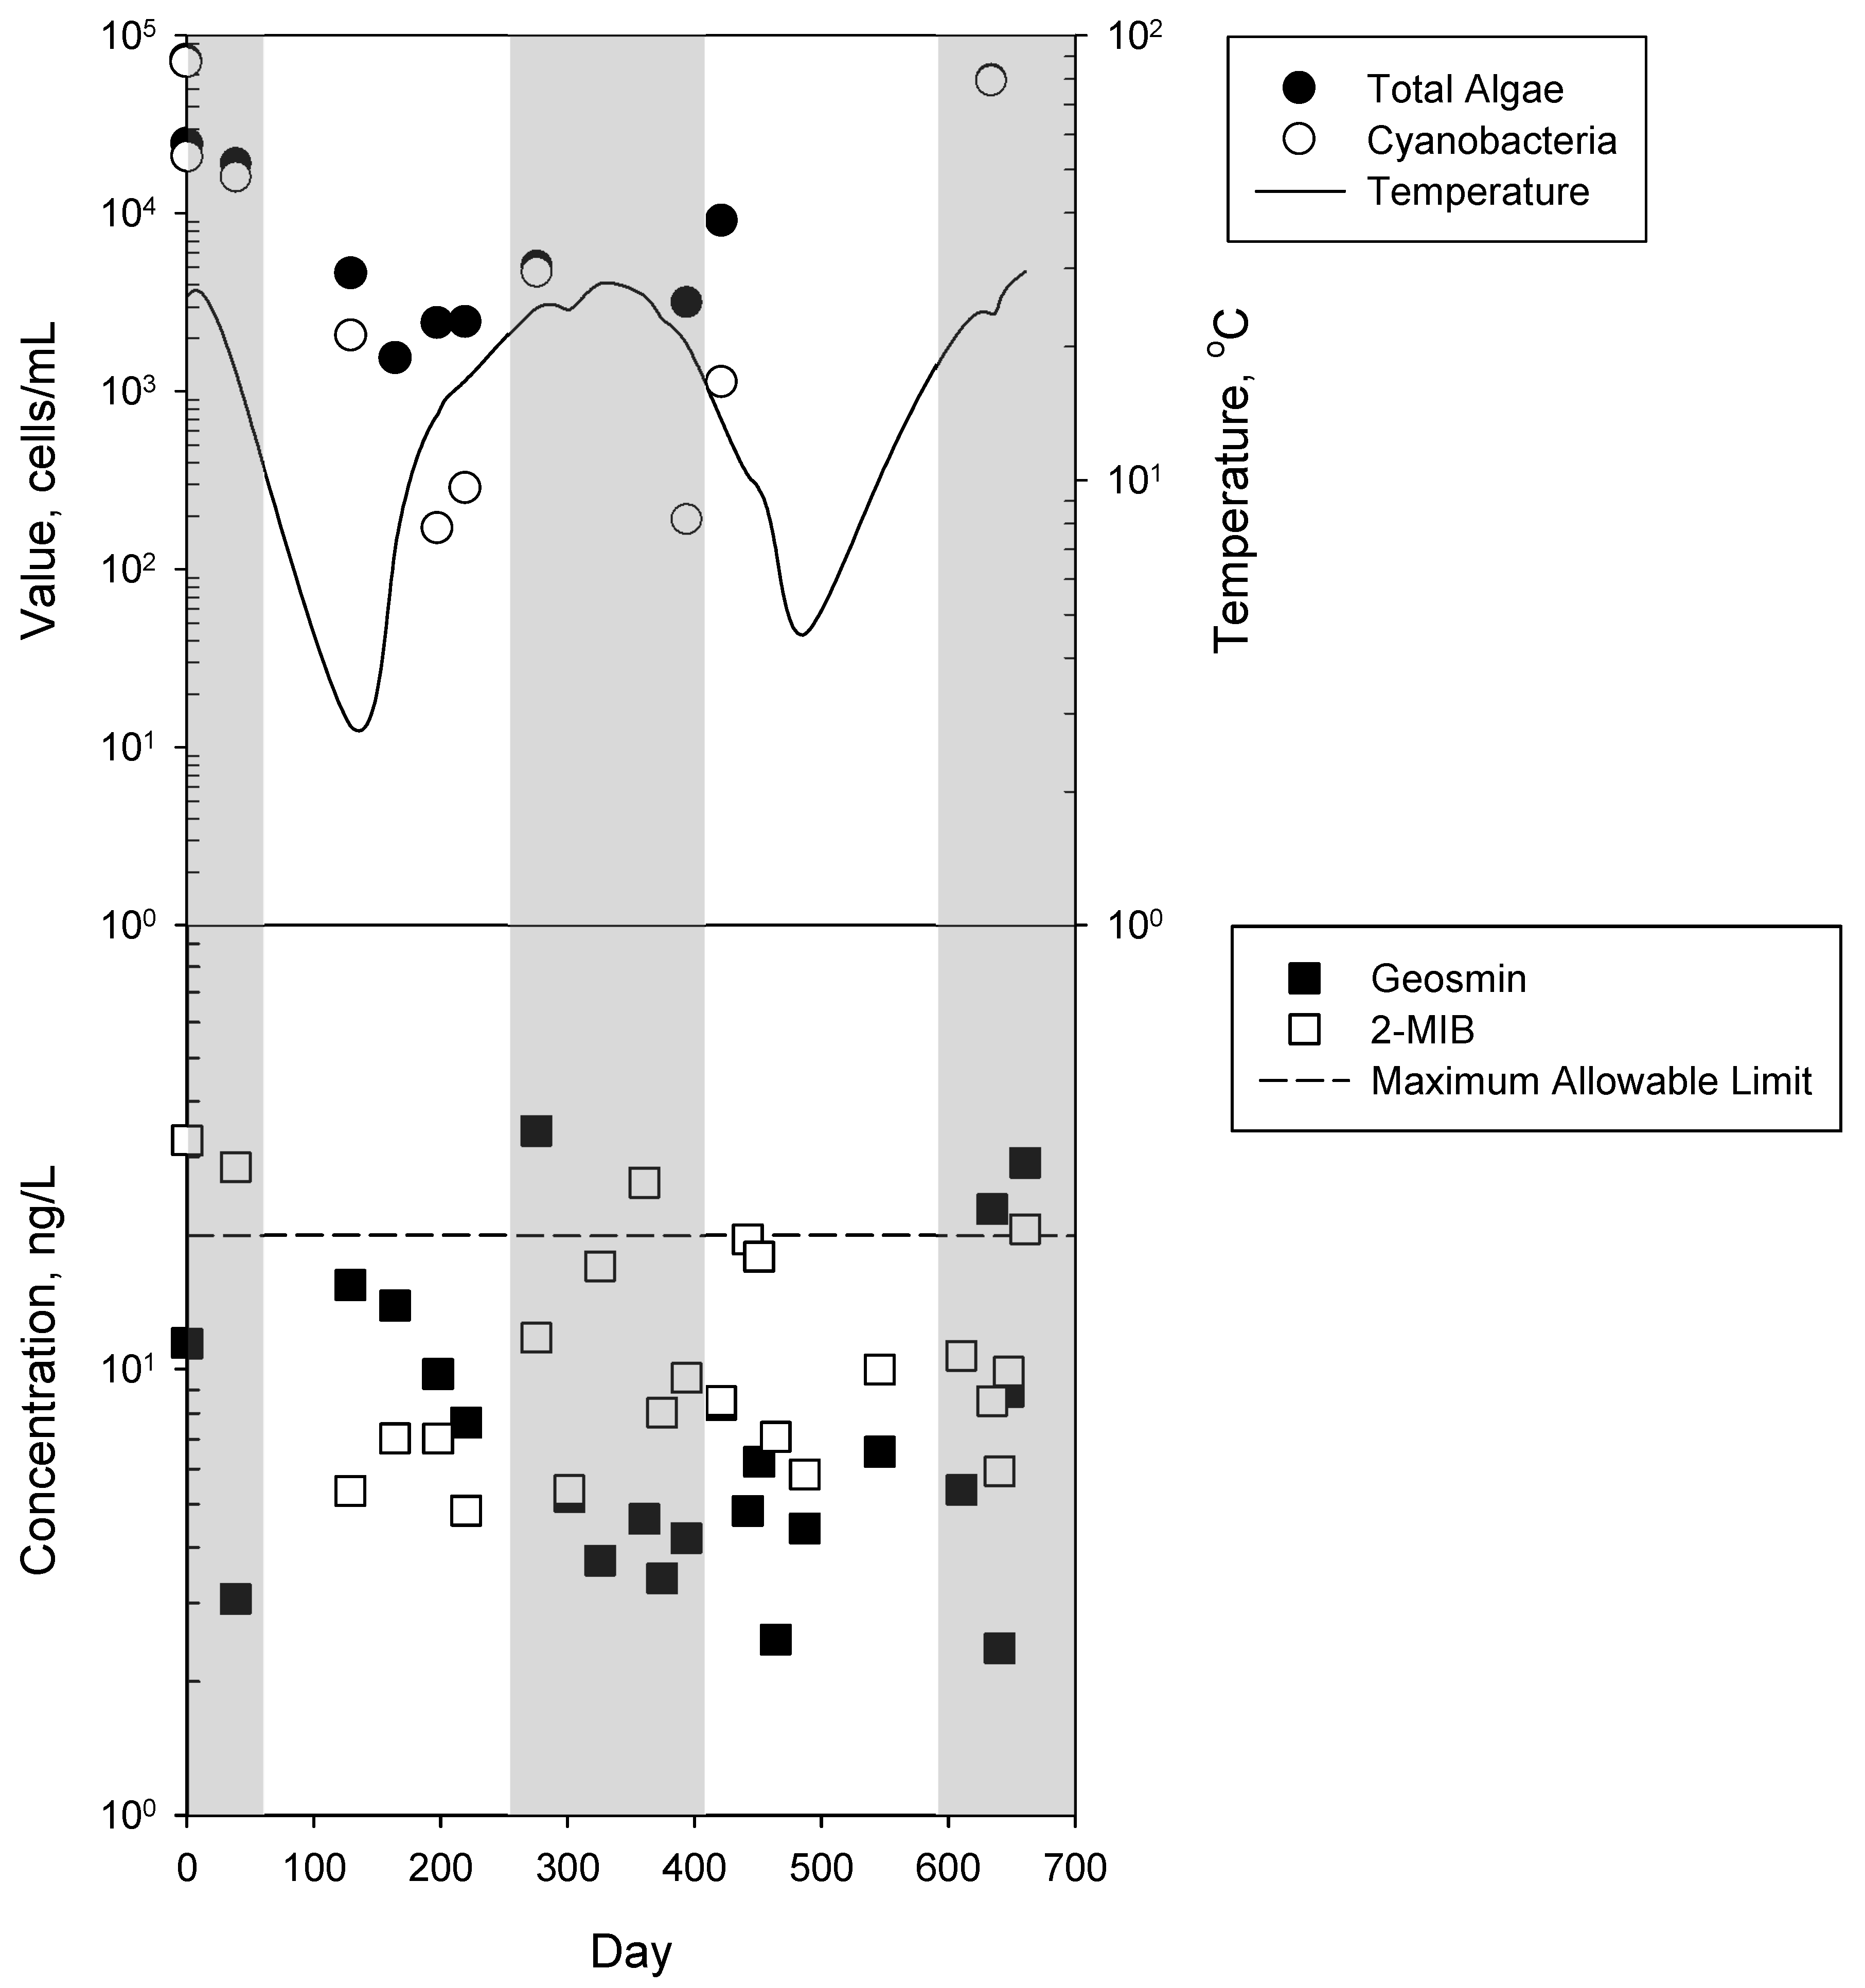
Geosmin and 2-MIB, the representative taste and odor compounds, are produced mostly by cyanobacteria. They occur naturally, and their concentrations increase during the algae bloom period. Since 1998, the Republic of Korea has operated an algae forecast system to determine algal outbreaks based on monitored algae cell numbers or concentrations, such as total algae, cyanobacteria, and chlorophyll-a in major water sources. The number of cyanobacteria cells is used as an indirect monitoring parameter of the release level of geosmin and 2-MIB in a drinking water source. In this study, the total algae and cyanobacteria in the intake water of a large-scale water treatment plant were monitored and analyzed from September 2015 to July 2017 (660 d) to determine their correlations with the occurrence of geosmin and 2-MIB. Figure 2 presents the numbers of total algae and cyanobacteria cells and the concentrations of geosmin and 2-MIB in the intake water during the study period. According to the analyzed data (Table 3), the average numbers of total algae and cyanobacteria cells were 18,075 and 15,411 cells/mL, respectively. The average values estimated in the algae bloom period (from May to October) were 29,840 and 27,656 cells/mL, which were 7.5 and 38.6 times higher than those (3956 cells/mL of total algae and 717 cells/mL of cyanobacteria) in the other period (November to April). The difference in cell numbers might be caused by the increased water temperature in summer (June to September) when it is more suitable for algae growth [19]. Besides, it was observed that the difference in the cell numbers between total algae and cyanobacteria increased as temperature decreased. According to the correlation analysis of the parameters (the correlation values were 0.52 to 1, and P values were less than 0.01), it was found the total algae and cyanobacteria had a strong relationship. Furthermore, 2-MIB is more correlated to cyanobacteria and temperature compared with geosmin. Most cyanobacteria, a major source of geosmin and 2-MIB, are known to bloom quickly when the water temperature is high, higher than 20 °C for example, but some can grow at cold temperatures of less than 8 °C [20]. As anticipated, a similar occurrence trend of geosmin and 2-MIB was observed. The average concentrations of these compounds were 10.7 and 15.0 μg/L in the algae bloom period, and these values were approximately 35 and 60% higher than those in the other period. Some of the analyzed concentrations in the monitored period were higher than 20 ng/L of the maximum allowable limit in the Republic of Korea. In addition to total algae, cyanobacteria, and the T&O compounds, the chlorophyll-a concentration was also analyzed, but its trend in concentration change was not always similar to that of geosmin and 2-MIB. Possibly, when the chlorophyll-a concentration increased, geosmin and 2-MIB were not immediately released into the water but existed in the cells for a certain period. Therefore, it is necessary to evaluate the number of total algae and cyanobacteria cells rather than the chlorophyll-a concentration in intake water to effectively manage the taste and odor compounds, especially in summer.
3.2. Effect of Returned Water and Preozonation
In Figure 1, the raw water supplied from the intake system is blended with the returned water, the which primary source is sand filtration backwash water. The influent water supplied to the receiving wells is a mixture of the raw and returned water, and the flow ratio of the returned water to the influent water is mostly less than 10% (7.7% of an average flow ratio). Therefore, the influent water quality can be changed depending on the flow ratio of the raw and returned water and their water qualities. The average values of turbidity and suspended solids (SS) in the raw water were 11.72 nephelometric turbidity unit (NTU) and 6.93 mg/L. By blending the raw water with the returned water, the influent water quality values decreased to 8.39 NTU and 4.31 mg/L, which were a 28.4 and 37.8% reduction, respectively. However, the other water qualities of the influent water—KMnO4 consumption, and total dissolved solids (TDS)—did not change significantly (to less than 10%). The KMnO4 consumption increased from 5.96 to 6.07 mg/L, and the TDS concentration decreased from 179.4 to 176.8 mg/L, which were not any meaningful changes.
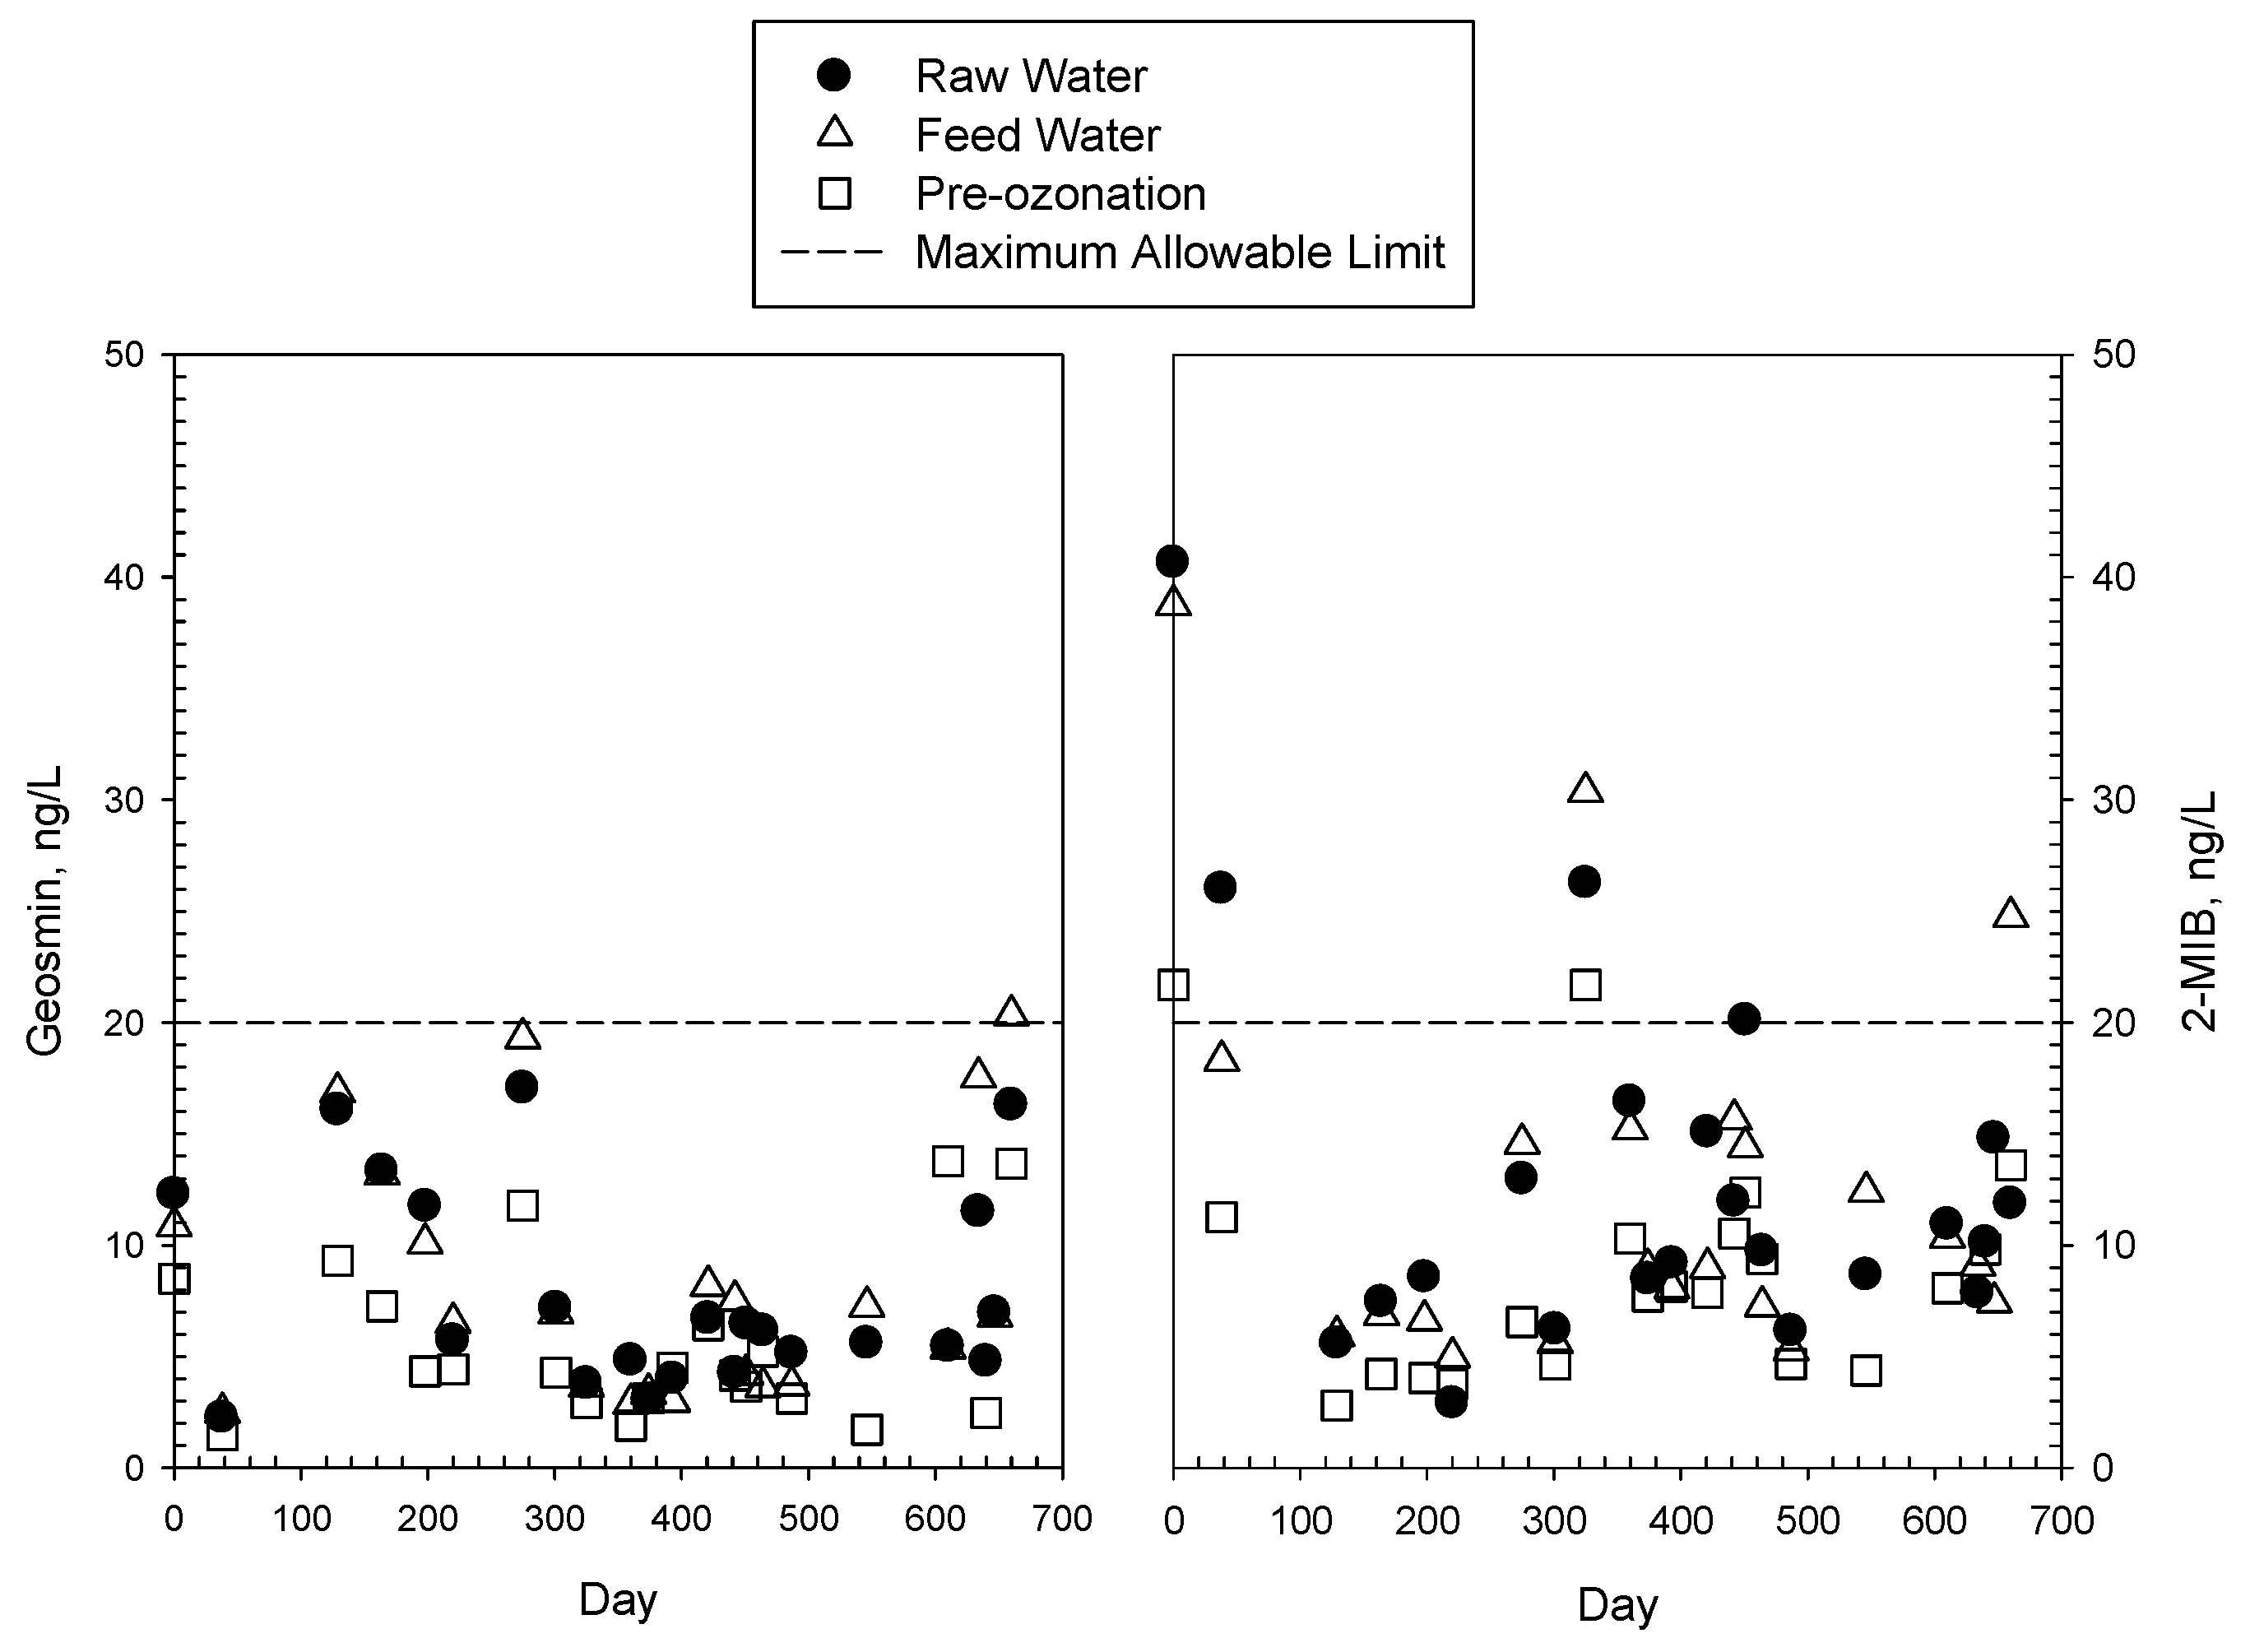
Figure 3 and Table 4 present the concentration change of geosmin and 2-MIB by blending the raw water with the returned water along with the preozonation process. It was observed that the average concentrations of geosmin and 2-MIB were not significantly affected by the returned water. The geosmin concentration slightly increased from 7.9 to 8.4 ng/L, but the 2-MIB concentration decreased from 13.0 to 12.7 ng/L, which difference was less than the detection limit (1–2 ng/L). Their concentration changes were 6.4% for geosmin and 1.8% for 2-MIB. The preozonation facility of the drinking water treatment plant began operation in 2015, and 1.2 mg/L of ozone was generally injected into the influent water. During the algae bloom period, the ozone injection dose was increased to 1.5 mg/L to effectively manage the water quality deterioration. The preozonation facility had a reaction tank without a precipitation basin. Therefore, the water quality was affected mainly by ozone characteristics (i.e., ozone oxidizing power). The average values of turbidity and SS slightly increased (from 8.39 to 8.87 NTU for turbidity and from 4.31 to 4.64 mg/L for SS). However, the concentrations of KMnO4 consumption and TDS decreased (from 6.07 to 4.54 mg/L for KMnO4 consumption; from 176.8 to 171.4 mg/L for TDS). The change in the water quality was −25.2% to +7.7%. As for geosmin and 2-MIB, the percentages of their concentration reduction were higher than other quality parameters: 32.7% (from 8.4 to 5.6 μg/L) for geosmin and 29.8% (from 12.7 to 8.9 μg/L) for 2-MIB. Furthermore, there was a seasonal difference in their removal efficiency. During the algae bloom period, the concentration of geosmin and of 2-MIB was reduced by 31.1 and 37.6%, respectively. The removal efficiencies without algae bloom slightly increased to 34.7% for geosmin and 40.0% for 2-MIB. However, unlike the general removal trend of geosmin and 2-MIB, it was observed that the concentrations of the T&O compounds and turbidity were slightly increased by preozonation in a few sampling dates. The lower treatment efficiency of preozonation on contaminant removal might have been induced by the damage of the cellular surface of the algae by ozonation, leading to a release of cell contents. In addition, excessive oxidation might cause an increase in turbidity [21]. Consequently, careful preozonation is required to effectively remove geosmin and 2-MIB.
3.3. Effect of Coagulation/Flocculation and Chlorination
Coagulation and flocculation are known to be effective in removing algae. Moreover, they have a minimal impact on the subsequent treatment processes, minimizing the release of geosmin and 2-MIB from cell destruction [22]. The average removal efficiencies of turbidity and SS were significantly increased by coagulation and flocculation. The turbidity decreased from 8.87 to 0.89 NTU, and the SS concentration decreased from 4.64 to 1.24 mg/L, which were a 90.0 and 73.2% removal efficiency, respectively. The average concentration of KMnO4 consumption decreased from 4.54 to 2.73 mg/L with 40.0% removal efficiency. However, the average TDS concentration slightly increased from 171.4 to 182.3 mg/L. It is also necessary to remove most of the algae from the settling basins to minimize their impact on filtration. The average concentration of chlorophyll-a decreased significantly from 1.93 to 0.24 μg/L (87.4% reduction). Moreover, the removal efficiencies of total algae in the algae bloom and nonbloom periods were 93.5 and 97.4%, respectively. The remaining algae producing T&O compounds were mostly cyanobacteria. However, unlike the high algae removal efficiency by this process, the average concentrations of geosmin and 2-MIB slightly increased from 5.6 to 5.9 ng/L and from 8.9 to 10.0 ng/L, respectively (Table 4). Figure 4 presents the effect of coagulation/flocculation and midchlorination processes on the geosmin and 2-MIB removal. The geosmin concentrations after the setting basin were 5.9 and 4.6 ng/L, respectively, in the algae bloom and nonbloom periods. For the coagulation/flocculation process, the geosmin concentration increased by 15.1% in the algae bloom period, but its concentration decreased by 5.6% in the nonbloom period. Unlike geosmin, the concentration of 2-MIB increased by 4.7% in the algae bloom period and increased by 13.9% in the nonbloom period. A conventional coagulation and flocculation process can remove turbidity and NOM, and it is also very effective for the removal of algae cells. However, this process is ineffective for removing dissolved geosmin and 2-MIB [15]. It was observed that midchlorination (0.57 to 0.78 mg/L) did not have any significant impact on geosmin and 2-MIB, resulting in less than 1% of their concentration change. Oxidation with chlorine and chlorine dioxide has been reported as an ineffective method for removing geosmin and 2-MIB [10,23].
3.4. Effect of Filtration, Postozonation, and Activated Carbon
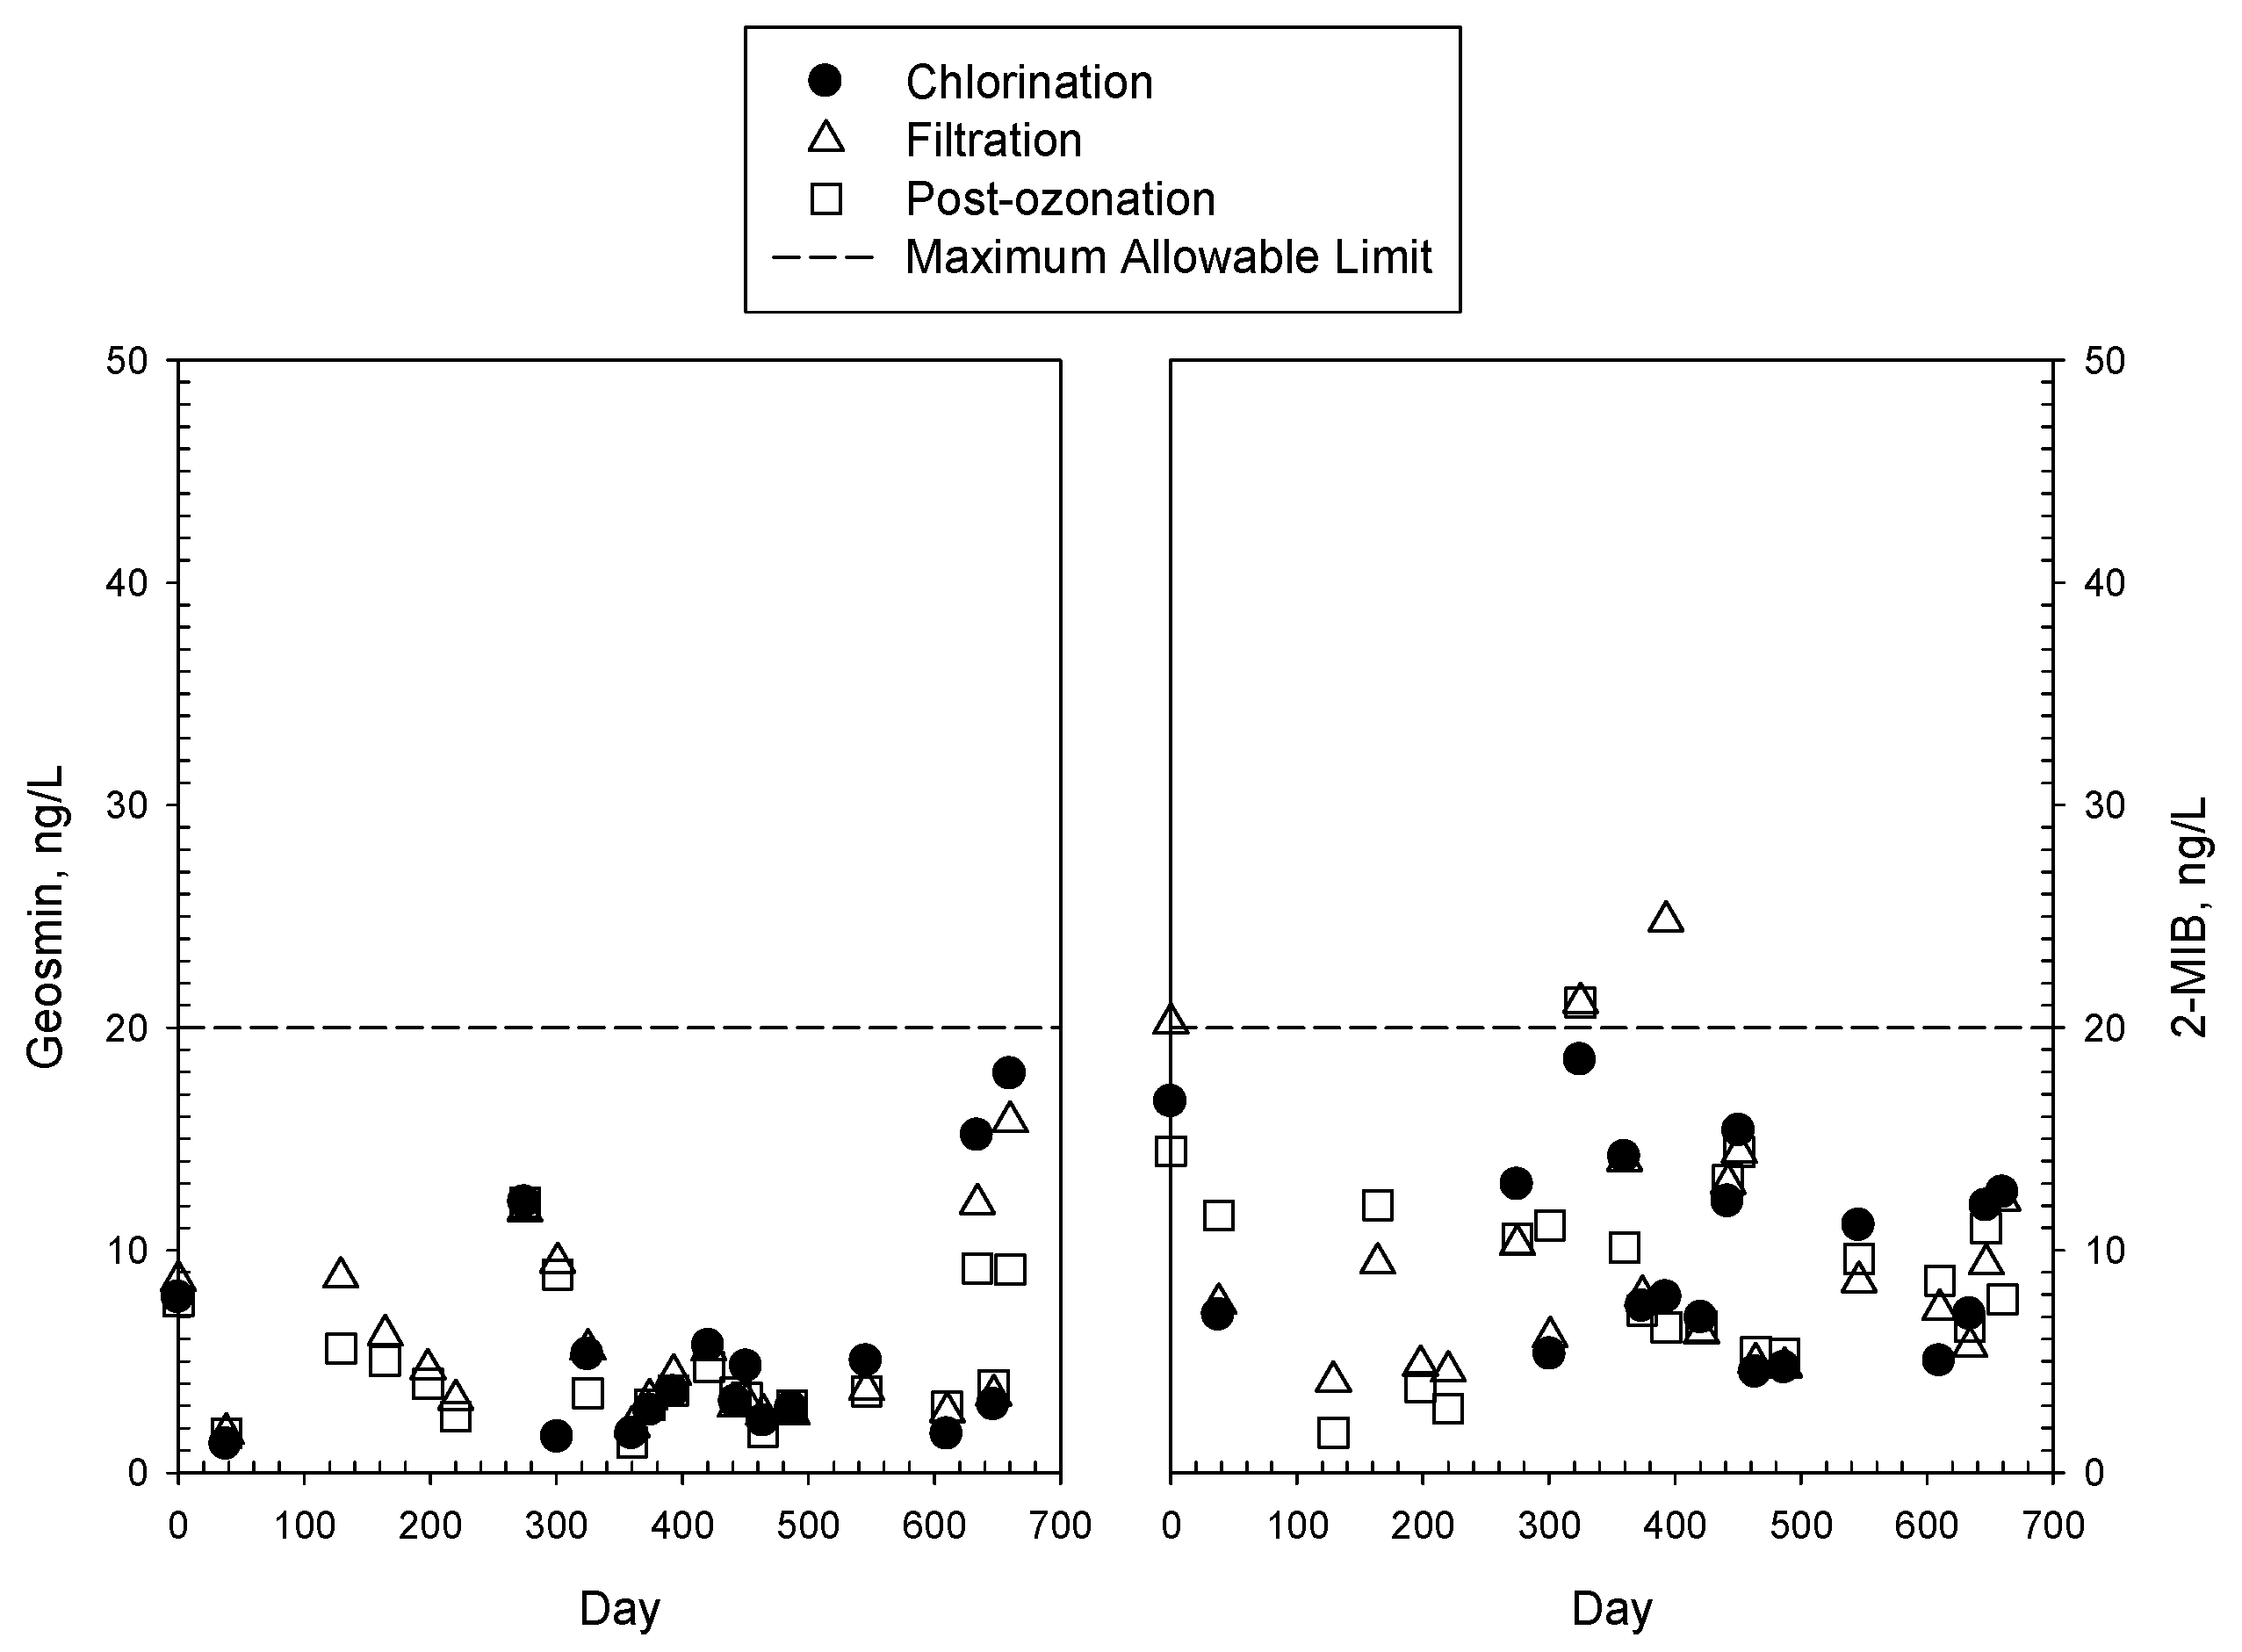
Filtration is considered an essential process in drinking water treatment plants. However, it is reported that geosmin and 2-MIB are extremely resistant to removal via coagulation/flocculation, sedimentation, and filtration [5,10]. The removal efficiencies of the water quality parameters, geosmin, and 2-MIB were evaluated. The average removal efficiencies of turbidity and SS by the filtration process were 31.0 and 39.6%, resulting in 0.48 NTU and 0.37 mg/L, respectively. However, the concentrations of KMnO4 consumption and TDS did not change significantly, with an average difference of less than 2%. It was observed that the average concentration of chlorophyll-a was further reduced from 0.30 to 0.23 μg/L (15.6% reduction) by filtration. However, the geosmin and 2-MIB concentrations did not change significantly, with average value changes of +0.1 and −1.1%, respectively, as presented in Figure 5 and Table 4. This was similar to previous studies, showing that the conventional filtration process did not effectively remove the T&O compounds [10,11].
The postozonation process followed the filtration process to further improve water quality. However, this process did not have a significant impact on turbidity, SS, KMnO4 consumption, TDS, and chlorophyll-a. Turbidity decreased by 5%, and SS, KMnO4, TDS, and chlorophyll-a increased by 9.8, 6.7, 1.3, and 8.8%, respectively. However, the impact of the postozonation process on removing the T&O compounds was more significant, as presented in Figure 5 and Table 4. The concentrations were further decreased to 4.8 ng/L for geosmin and 9.2 ng/L for 2-MIB with 15.9 and 8.9% removal efficiency. Ozonation can be used as an effective method for removing geosmin and 2-MIB because O3 acts as a strong oxidant to remove them. The main mechanism is oxidation by the hydroxyl radicals generated [11,24,25].
Postozonation was followed by the adsorption of GAC, which is one of the best available water treatment technologies for removing organic contaminants, including geosmin and 2-MIB [10]. Moreover, there is a synergistic effect on the removal of geosmin and 2-MIB when oxidation is applied along with activated carbon adsorption [26]. The concentrations of SS and KMnO4 consumption were further decreased by activated carbon adsorption, and their removal efficiencies were 27.9 and 19.9%, respectively. However, other water qualities such as turbidity and TDS were not significantly affected by activated carbon adsorption, with less than 5% removal efficiency. The concentration of chlorophyll-a also slightly increased from 0.21 μg/L to 0.24 μg/L after the GAC adsorption process. As presented in Figure 6 and Table 4, the concentrations of geosmin and 2-MIB were further decreased by the GAC adsorption process, with 32.1 and 28.1% removal efficiency, respectively. It has been reported that the GAC removal efficiency for geosmin is higher than that of 2-MIB because geosmin is more readily physically adsorbed onto activated carbon than 2-MIB [26]. As reported in the other studies, biofilm formation on GAC also enhanced the removal efficiencies of geosmin and 2-MIB, resulting from their biodegradation by BAC (Biological Activated Carbon) [27]. The effect of the biodegradation by BAC on the removal of the T&O compounds and the influencing factors (e.g., water quality, ozone dose, temperature, etc.) were not intensively investigated in this study. The final average concentrations of geosmin and 2-MIB in clear wells were 4.5 and 9.1 ng/L, which are below the 20 ng/L MCLG in the Republic of Korea. However, the concentrations were slightly increased by postchlorination. It may be necessary to further study how postchlorination increases the concentrations of geosmin and 2-MIB removal.
3.5. Effect of Unit Treatment Processes, and Operation Periods and Times
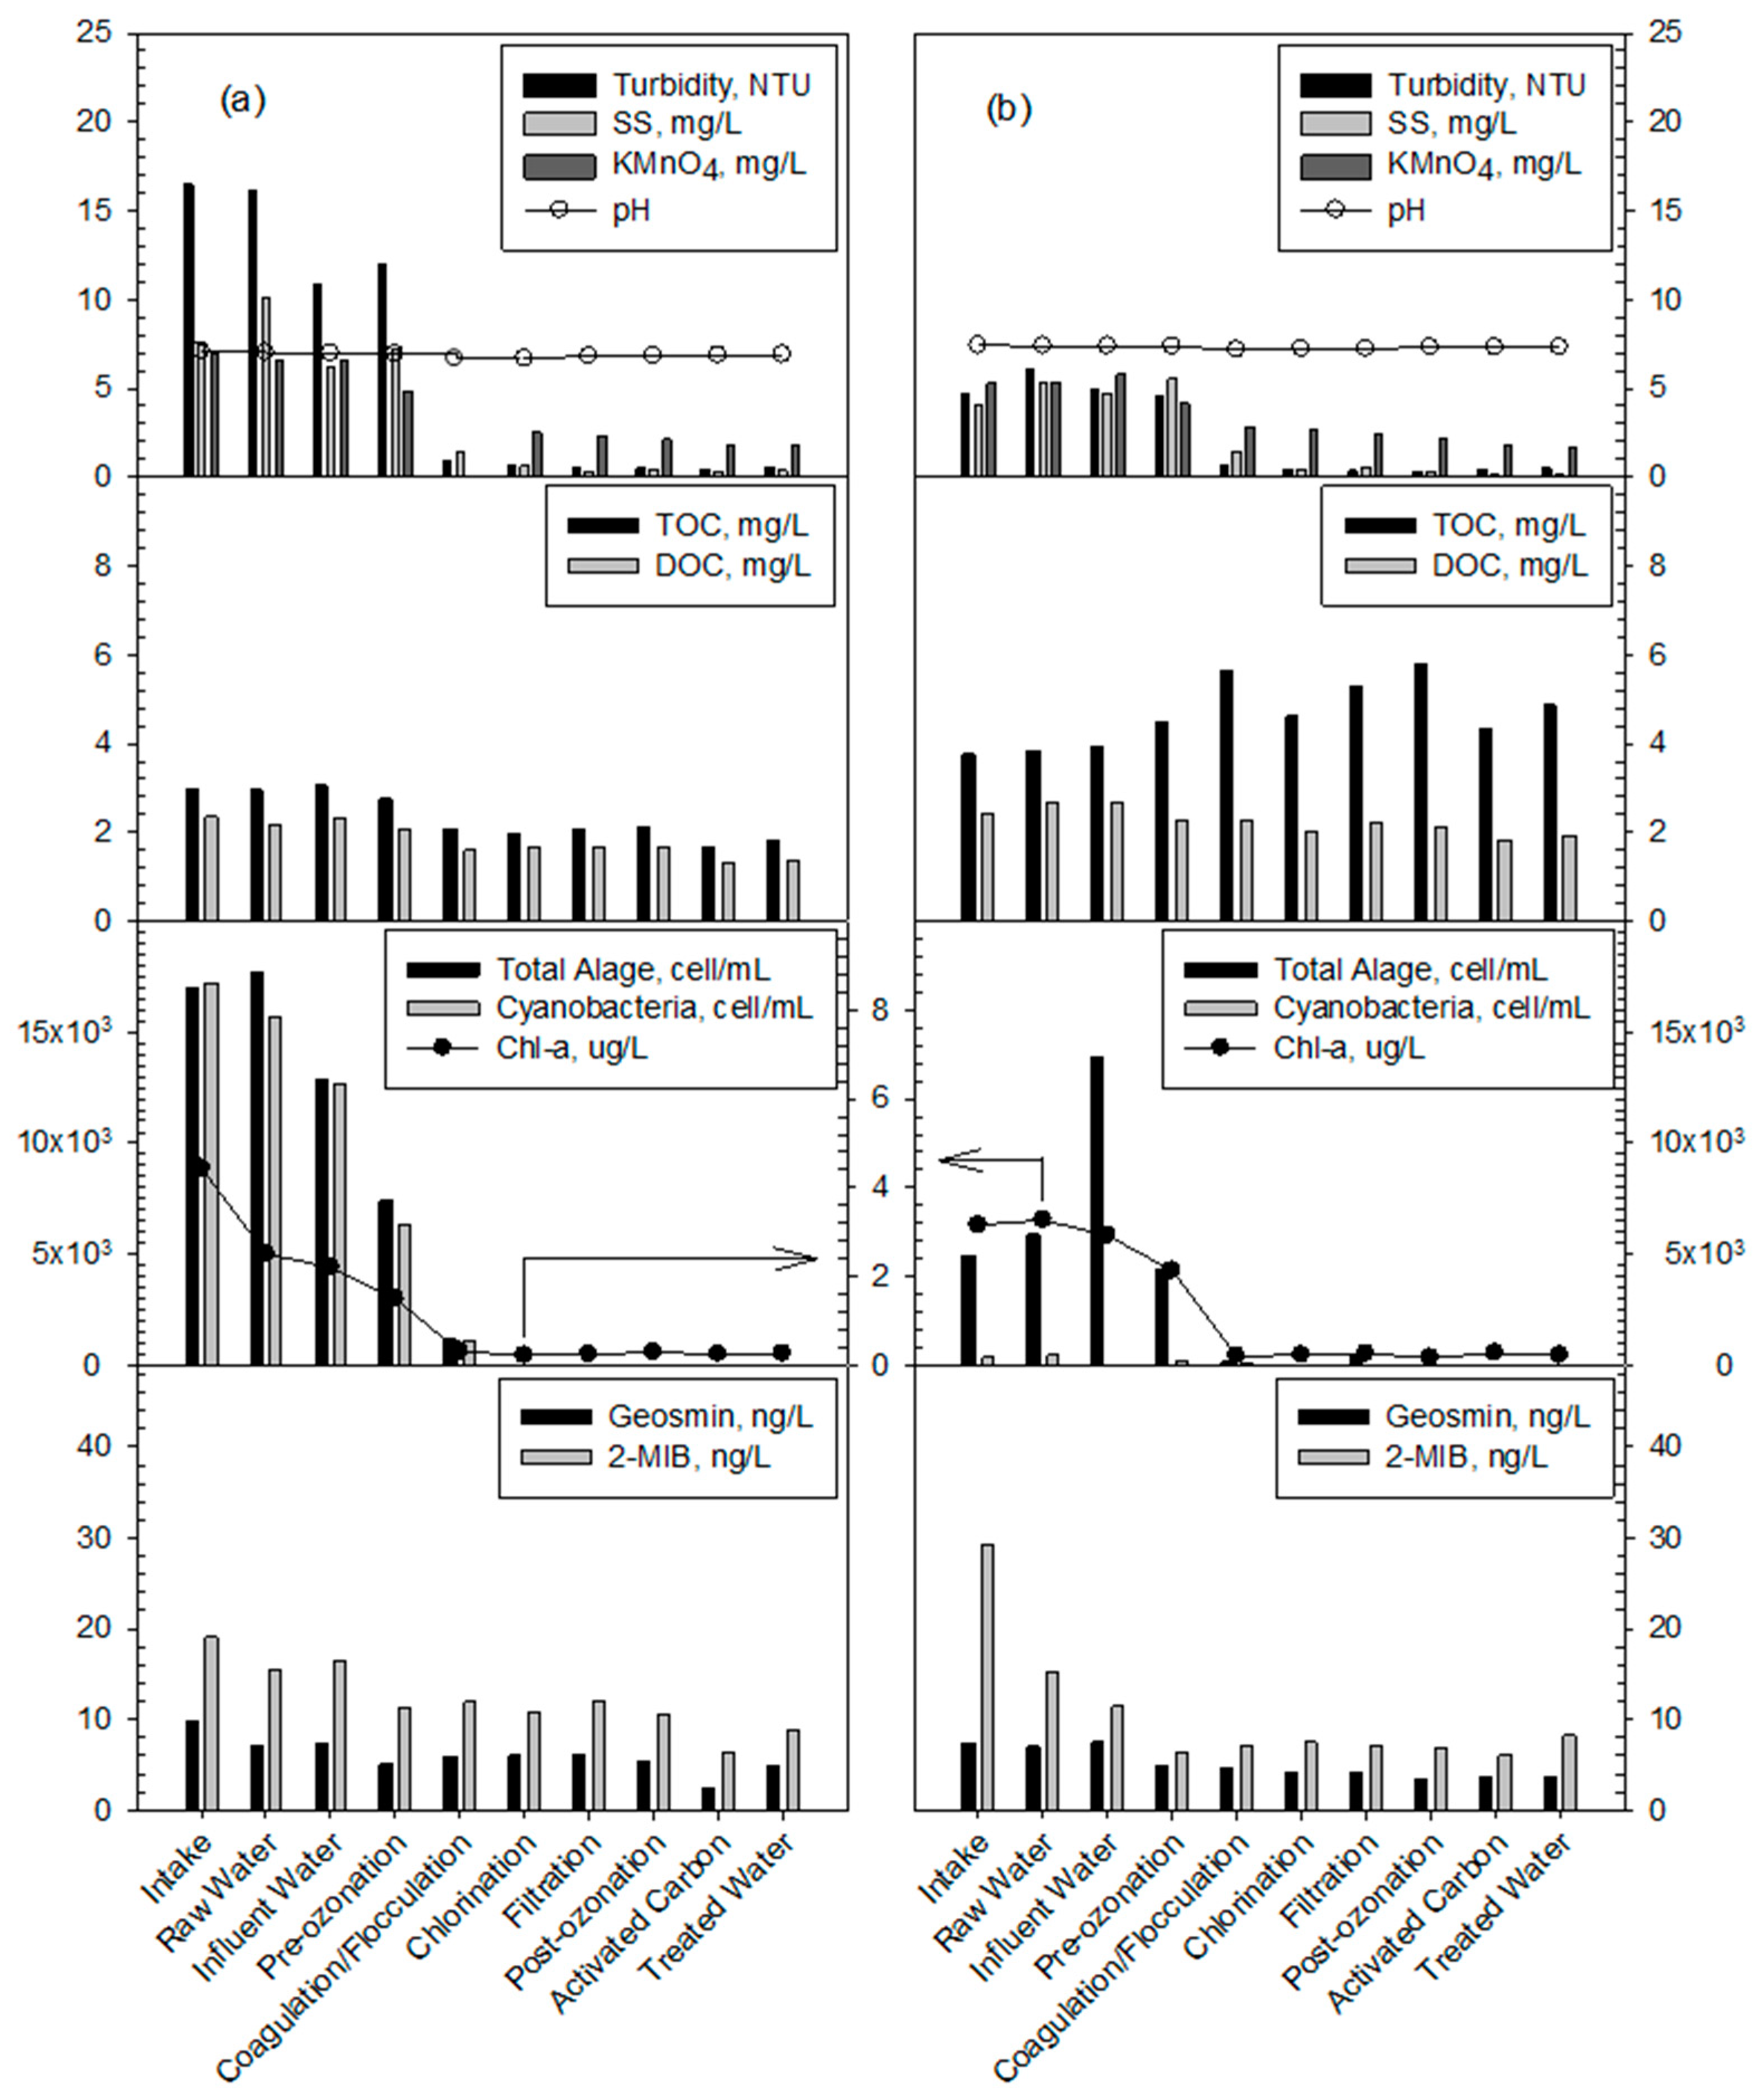
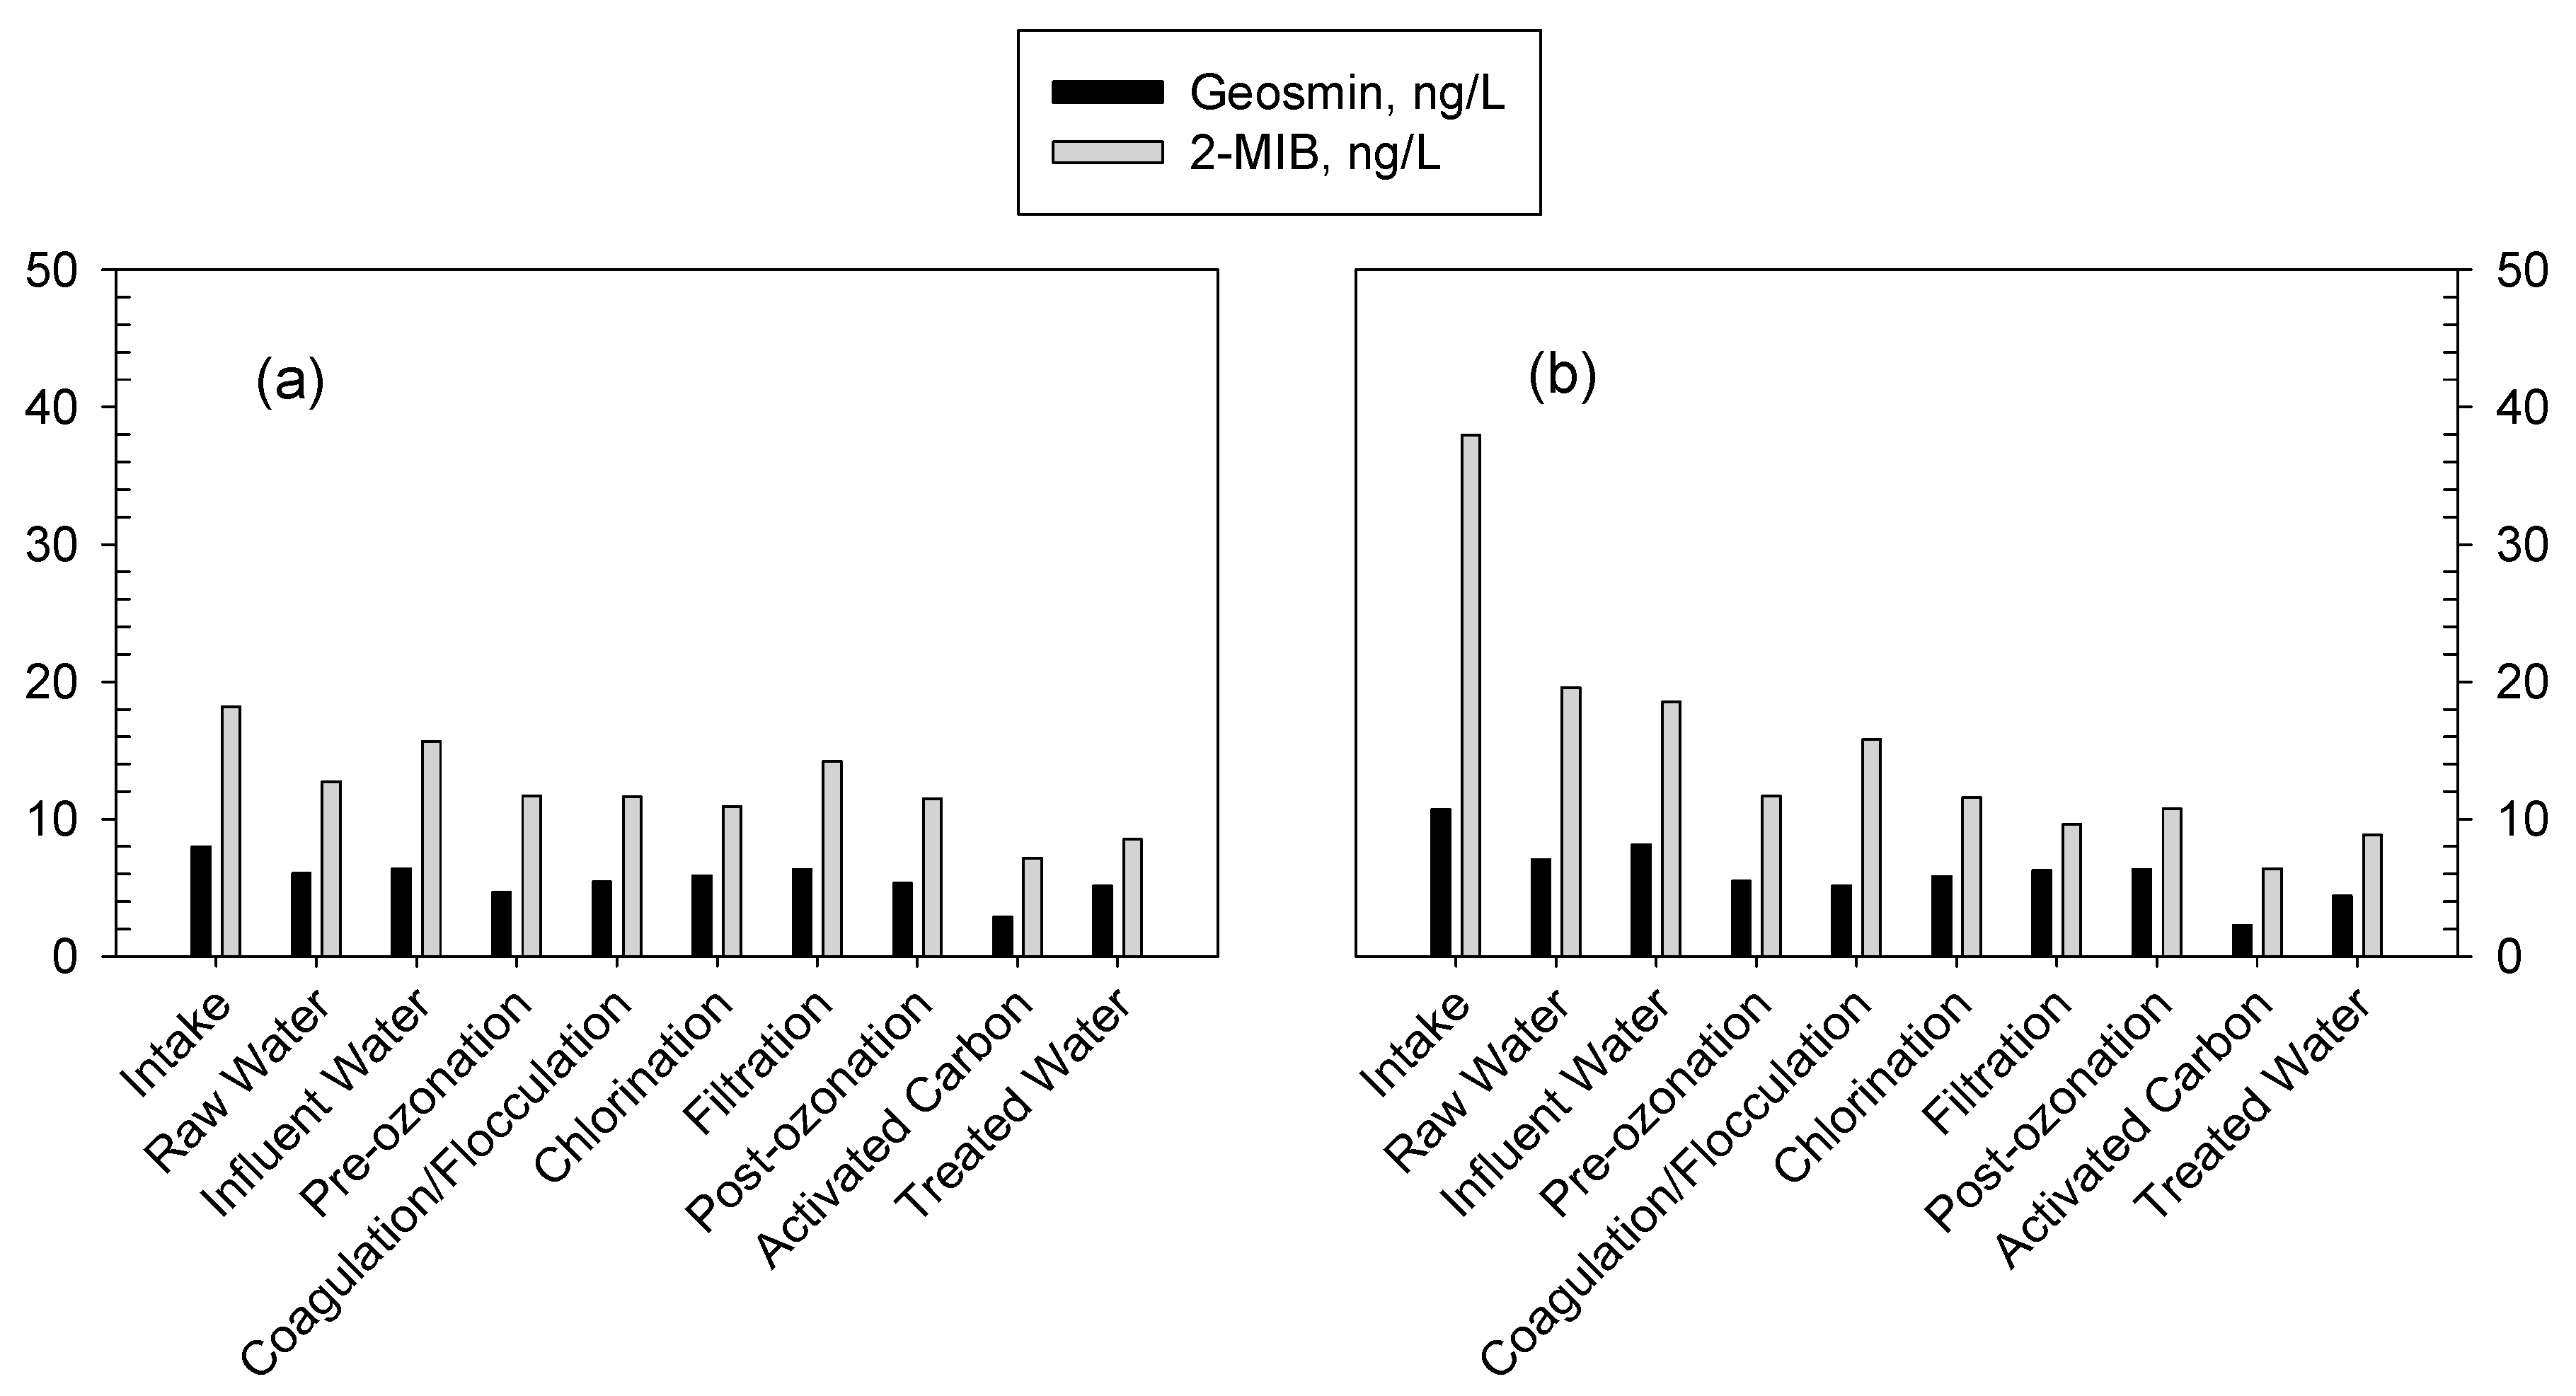
Figure 7 presents the water treatment efficiency of each unit process in the algae bloom and nonbloom periods. The pH of water in the algae bloom and nonbloom periods was 6.89 and 7.30, respectively. According to the obtained results, coagulation/flocculation was the most effective process for turbidity, SS, and KMnO4 consumption in both periods. The final treatment efficiencies of turbidity, SS, and KMnO4 consumption were 96.6, 96.1, and 72.6%, during the algae bloom period, and their treatment efficiencies were slightly decreased to 91.6, 95.8, and 68.9%, respectively, in the other periods. The removal rates of TOC and DOC by the coagulation/flocculation and GAC processes were relatively high compared to the other treatments. However, their concentrations were not significantly decreased through the entire water treatment process, with 38.8 and 37.6% of the final removal efficiency in the algae bloom period, respectively. Moreover, their removal efficiencies were worse in the other periods. The results might be induced by the different operational conditions of the treatment processes, but the specific reasons were not investigated in this study. The total algae, cyanobacteria and chlorophyll-a were mostly removed by the preozonation and coagulation/flocculation processes in both periods. The most effective processes for removing geosmin and 2-MIB were pre- and postozonation and GAC in the algae bloom period. However, high removal efficiencies of postozonation and GAC were not observed in the algae nonbloom period. Therefore, different water treatment processes are required to manage geosmin and 2-MID effectively depending on the raw water quality and conditions.
The difference in the removal efficiencies of geosmin and 2-MIB during day and night periods were also investigated during the algae bloom period, and the obtained results are presented in Figure 8. Similar to the analysis results of their removal efficiency by unit treatment processes (Figure 7), GAC was the most effective removal process, followed by preozonation in both periods. It was observed that the night-time removal efficiencies of geosmin and 2-MIB were 65.5 and 142.4% higher than those performed during day-time.
4. Conclusions
For the effective management of the T&O compounds, geosmin and 2-MIB, it is necessary to periodically monitor the number of cyanobacteria cells in the intake and raw water of a drinking water treatment plant because of the correlation of their occurrence, especially in summer when their cell number and concentrations are relatively high. Because of the strong oxidation capacity of preozonation, this process very effective, removing more than 30% of the T&O compounds. However, the application of excessive ozonation can have a negative impact on the removal efficiency of the water qualities. A similar negative effect was observed during oxidation with chlorine. As many previous studies have proven, the coagulation/flocculation and filtration processes were not useful for removing geosmin and 2-MIB, although they are the most critical processes for treating other water contaminants. Postozonation was found to further remove geosmin and 2-MIB by 9 to 16%, respectively. Finally, GAC lowered the concentration by 28 to 32%, respectively, in the drinking water treatment plant studied. It was observed that the GAC removal efficiency was better for geosmin than 2-MIB because of their different adsorption characteristics. Although advanced water treatment processes, such as ozonation and activated carbon adsorption, are costly methods in terms of their capital and operation costs, water utilities need to be applied to minimize the customer complaints related to the T&O compounds. Adjusting the drinking water production rate for day and night times might be another solution to reduce the concentration of geosmin and 2-MIB in the final product water.
Author Contributions
Investigation K.T.K.; writing—original draft, K.T.K. and Y.-G.P.; writing—review & editing, K.T.K. & Y.-G.P. All authors have read and agreed to the published version of the manuscript.
Funding
This research was funded by the Korea Environmental Industry & Technology Institute (KEITI) through the Aquatic Ecosystem Conservation Research Program, funded by Korea Ministry of Environment (MOE) (2020003030006).
Institutional Review Board Statement
Not applicable.
Informed Consent Statement
Not applicable.
Data Availability Statement
Not applicable.
Acknowledgments
This work was supported by the Korea Environmental Industry & Technology Institute (KEITI) through the Aquatic Ecosystem Conservation Research Program, funded by Korea Ministry of Environment (MOE) (2020003030006).
Conflicts of Interest
The authors declare no conflict of interest.
References
- Perkins, R.G.; Slavin, E.I.; Andrade, T.M.C.; Blenkinsopp, C.; Pearson, P.; Froggatt, T.; Godwin, G.; Parslow, J.; Hurley, S.; Luckwell, R.; et al. Managing taste and odour metabolite production in drinking water reservoirs: The importance of ammonium as a key nutrient trigger. J. Environ. Manag. 2019, 244, 276–284. [Google Scholar] [CrossRef] [PubMed]
- Kim, C.; Lee, S.I.; Hwang, S.; Cho, M.; Kim, H.; Noh, S.H. Removal of geosmin and 2-methylisoboneol (2-MIB) by membrane system combined with powdered activated carbon (PAC) for drinking water treatment. J. Water Process Eng. 2014, 4, 91–98. [Google Scholar] [CrossRef]
- Yu, J.; Yang, F.C.; Hung, W.N.; Liu, C.L.; Yang, M.; Lin, T.F. Prediction of powdered activated carbon doses for 2-MIB removal in drinking water treatment using a simplified HSDM approach. Chemosphere 2016, 156, 374–382. [Google Scholar] [CrossRef] [PubMed]
- Chen, S.; Dong, B.; Gao, K.; Li, T. Pilot study on advanced treatment of geosmin and 2-MIB with O3/GAC. Water Supply 2019, 19, 1253–1263. [Google Scholar] [CrossRef]
- Chong, S.; Lee, H.; An, K. Predicting taste and odor compounds in a shallow reservoir using a three–dimensional hydrodynamic ecological model. Water 2018, 10, 1396. [Google Scholar] [CrossRef] [Green Version]
- Smith, V.H.; Sieber-Denlinger, J.; deNoyelles, F.; Campbell, S.; Pan, S.; Randtke, S.J.; Blain, G.T.; Strasser, V.A. Managing taste and odor problems in a eutrophic drinking water reservoir. Lake Reserv. Manag. 2002, 18, 319–323. [Google Scholar] [CrossRef] [Green Version]
- Yuan, B.; Xu, D.; Li, F.; Fu, M. Removal efficiency and possible pathway of odor compounds (2-methylisoborneol and geosmin) by ozonation. Sep. Purif. Technol. 2013, 117, 53–58. [Google Scholar] [CrossRef]
- Rosenfeldt, E.J.; Melcher, B.; Linden, K.G. UV and UV/H2O2 treatment of methylisoborneol (MIB) and geosmin in water. J. Water Supply Res. Technol. AQUA 2005, 54, 423–434. [Google Scholar] [CrossRef]
- Bruce, D.; Westerhoff, P.; Brawley-Chesworth, A. Removal of 2-methylisoborneol and geosmin in surface water treatment plants in Arizona. J. Water Supply Res. Technol. AQUA 2002, 51, 183–198. [Google Scholar] [CrossRef]
- Seo, J.W.; Kim, Y.S.; Kim, K.B.; Kim, M.C.; Park, S.H.; Koo, J.Y. Removal characteristics of geosmin by advanced water treatment processes: A case study around the Han River, Republic of Korea. Desalin. Water Treat. 2019, 157, 177–194. [Google Scholar] [CrossRef]
- Srinivasan, R.; Sorial, G.A. Treatment of taste and odor causing compounds 2-methyl isoborneol and geosmin in drinking water: A critical review. J. Environ. Sci. 2011, 23, 1–13. [Google Scholar] [CrossRef]
- Zamyadi, A.; Henderson, R.K.; Newton, K.; Capelo-Neto, J.; Newcombe, G. Assessment of the water treatment process’s empirical model predictions for the management of aesthetic and health risks associated with cyanobacteria. Water 2018, 10, 590. [Google Scholar] [CrossRef] [Green Version]
- Yu, Y.; Choi, Y.H.; Kim, D.J.; Kwon, S.; Kim, C. Rejection property of geosmin and 2-Methylisoborneol (MIB) with high concentration level at multi stage nanofiltration (NF) membrane system. J. Korean Soc. Water Wastew. 2014, 28, 397–409. [Google Scholar] [CrossRef] [Green Version]
- Park, G.; Yu, M.; Koo, J.-Y.; Joe, W.H.; Kim, H. Oxidation of geosmin and MIB in water using O3/H2O2: Kinetic evaluation. Water Supply 2006, 6, 63–69. [Google Scholar] [CrossRef]
- Cook, D.; Newcombe, G. Can we predict the removal of MIB and geosmin with PAC by using water quality parameters? Water Supply 2004, 4, 221–226. [Google Scholar] [CrossRef]
- APHA AWA-WEF. Standard Methods for the Examination of Water and Wastewater, 21st ed.; American Public Health Association: Washington, DC, USA, 2005. [Google Scholar]
- Karlson, B.; Anderson, C.; Coyne, K.; Sellner, K.; Anderson, D. Designing an observing system for early detection of harmful algal blooms. In Harmful Algal Blooms (HABs) and Desalination: A Guide to Impacts, Monitoring, and Management; Intergovernmental Oceanographic Commission: Paris, France, 2017. [Google Scholar]
- Lee, H.-J.; Kang, L.-S. Analysis of geosmin and 2-MIB in water by stir bar sorptive extraction (SBSE) and GC/MS. J. Korean Soc. Environ. Eng. 2009, 31, 64–69. [Google Scholar]
- Parinet, J.; Rodriguez, M.J.; Sérodes, J.B. Modelling geosmin concentrations in three sources of raw water in Quebec, Canada. Environ. Monit. Assess. 2013, 185, 95–111. [Google Scholar] [CrossRef] [PubMed]
- You, K.; Byeon, M.; Youn, S.; Hwang, S.; Rhew, D. Growth characteristics of blue-green algae (anabaena spiroides) causing tastes and odors in the north-han river, Korea. Korean J. Ecol. Environ. 2013, 46, 135–144. [Google Scholar] [CrossRef]
- Lee, J.D.; Lee, M.S.; Shin, W.S.; Kim, Y.; Choi, S.J. Removal of freshwater diatoms (Synedra acus and Stephanodiscus sp.) by preozonation and addition of polyamine coagulant-aid. Korean J. Chem. Eng. 2005, 22, 682–686. [Google Scholar] [CrossRef]
- Abrha, Y.W.; Kye, H.; Kwon, M.; Lee, D.; Kim, K.; Jung, Y.; Ahn, Y.; Kang, J. Removal of algae, and taste and odor compounds by a combination of plant-mineral composite (pmc) coagulant with uv-aops: Laboratory and pilot scale studies. Appl. Sci. 2018, 8, 1502. [Google Scholar] [CrossRef] [Green Version]
- Glaze, W.H.; Schep, R.; Chauncey, W.; Ruth, E.C.; Zarnoch, J.J.; Aieta, E.M.; Tate, C.H.; McGuire, M.J. Evaluating oxidants for the removal of model taste and odor compounds from a municipal water supply. J. Am. Water Works Assoc. 1990, 82, 79–84. [Google Scholar] [CrossRef]
- Qi, F.; Xu, B.; Chen, Z.; Ma, J.; Sun, D.; Zhang, L. Efficiency and products investigations on the ozonation of 2-methylisoborneol in drinking water. Water Environ. Res. 2009, 81, 2411–2419. [Google Scholar] [CrossRef] [PubMed]
- Ho, L.; Newcombe, G.; Croué, J.P. Influence of the character of NOM on the ozonation of MIB and geosmin. Water Res. 2002, 36, 511–518. [Google Scholar] [CrossRef]
- Ham, Y.W.; Ju, Y.G.; Oh, H.K.; Lee, B.W.; Kim, H.K.; Kim, D.G.; Hong, S.K. Evaluation of removal characteristics of taste and odor causing compounds and organic matters using ozone/granular activated carbon(o3/gac) process. J. Korean Soc. Water Wastew. 2012, 26, 237–247. [Google Scholar] [CrossRef] [Green Version]
- Zamyadi, A.; Henderson, R.; Stuetz, R.; Hofmann, R.; Ho, L.; Newcombe, G. Fate of geosmin and 2-methylisoborneol in full-scale water treatment plants. Water Res. 2015, 83, 171–183. [Google Scholar] [CrossRef] [PubMed]
Figure 1.
Schematic of the water treatment processes and sampling locations (S).

Figure 2.
Temporal correlation patterns of geosmin and 2-methylisoborneol (2-MIB) with total algae and cyanobacteria in intake water (the gray period is from May to October).
Figure 2.
Temporal correlation patterns of geosmin and 2-methylisoborneol (2-MIB) with total algae and cyanobacteria in intake water (the gray period is from May to October).

Figure 3.
Concentrations of geosmin and 2-MIB affected by the returned water and the preozonation processes.
Figure 3.
Concentrations of geosmin and 2-MIB affected by the returned water and the preozonation processes.

Figure 4.
Concentrations of geosmin and 2-MIB affected by the coagulation/flocculation and chlorination processes.
Figure 4.
Concentrations of geosmin and 2-MIB affected by the coagulation/flocculation and chlorination processes.

Figure 5.
Concentrations of geosmin and 2-MIB affected by the filtration and postozonation processes.
Figure 5.
Concentrations of geosmin and 2-MIB affected by the filtration and postozonation processes.

Figure 6.
Concentrations of geosmin and 2-MIB affected by the granular activated carbon (GAC) process.
Figure 6.
Concentrations of geosmin and 2-MIB affected by the granular activated carbon (GAC) process.

Figure 7.
Water quality change affected by unit treatment processes in different operation periods. (a) Algae bloom period and (b) algae nonbloom period. SS and KMnO4 represent suspended solids and KMnO4 consumption, respectively.
Figure 7.
Water quality change affected by unit treatment processes in different operation periods. (a) Algae bloom period and (b) algae nonbloom period. SS and KMnO4 represent suspended solids and KMnO4 consumption, respectively.

Figure 8.
Water quality change affected by unit treatment processes at different operation times. (a) day-time and (b) night-time.
Figure 8.
Water quality change affected by unit treatment processes at different operation times. (a) day-time and (b) night-time.


Table 1.
Facility design and operation information.
| Facility | Size (m) | Design | Operation |
|---|---|---|---|
| Receiving Well | 2 basins (22 × 40 × 6) | 17.3 min | - |
| Preozonation | 1 basins (10 × 9.4 × 6) | 2.4 min | Dose (mg/L): 0.30–1.20; Contact time (min): 3.6 (Average); pH: 6.6–7.7; Temperature (°C): 3.0–27.6 |
| Coagulation/ Flocculation | 16 basins (18 × 15 × 4.5) | 31.8 min | PAC (mg/L): 25.0–60.0; Contact time (min): 5.6 (Coagulation), 71.9 (Flocculation); G (1/sec): 22.0–31.6 (Coagulation), 3.7–9.8 (Flocculation); pH: 6.3–7.6; Temperature (°C): 3.0–27.4 |
| Settling basin | 16 basins (18 × 80 × 4.5) | 170 min (2.83 h) | Retention time (h): 3–4; Velocity (m/s): 0.012 (Average) |
| Sand filtration | 48 basins (9.7 × 12) | 158 m/d | Filtration type: gravity; Rate of filtration (m/d): 74.1 (Average); Depth of filter bed (cm): 97–108; Duration of filtration cycle (h): 48; Sequence of backwashing: air (1.5 min) -> air + water (5.5 min) -> water (7.0 min); Size of sand (mm): 1.07 (Average) |
| Postozonation | 4 basins (10 × 9.4 × 6) | 10 min | Dose (mg/L): 0.40–1.20; Contact time (min): 3.6 min (Average); pH: 6.6–7.6, Temperature (°C): 4.0–27.0 |
| Activated carbon adsorption | 2 basins (8 × 12.5 × 2.5) | 10 min (6 m/h) | GAC type: gravity; Linear velocity (m/h): 10.4 (Average); GAC replacement cycle (y): 3 |
| Clear Well | 2 basins (40 × 85) | - | - |
Table 2.
Analytical conditions of the gas-chromatographic mass spectrometric detection (GC/MSD).
| GC (6890N, Agilent, Santa Clara, CA, USA) |
| Colum: HP-5MS, 30 m (L) × 0.25 mm (D) × 0.25 um (film thickness) |
| Oven Temperature: Initial Temperature. 50 °C, Hold 1.6 min, |
| 1st rate 20 °C to 10 °C, 2nd rate 10 °C to 140 °C, 3rd rate 5 °C to 160 °C |
| MSD (5973N, Agilent, Santa Clara, CA, USA) |
| SIM mode |
| Selected ion: geosmin (111, 112, 125), 2-MIB (95, 108) |
Table 3.
The statistical data of total algae, cyanobacteria, geosmin, and 2-MIB in intake water.
| Parameters | Average | Median | S.D. | Min | Max | Skewness |
|---|---|---|---|---|---|---|
| Total Algae | 18,075 | 5019 | 22,926 | 1513 | 71,720 | 1.7 |
| Cyanobacteria | 15,411 | 3328 | 23,880 | 168 | 69,650 | 1.6 |
| Geosmin | 9.5 | 6.2 | 8.4 | 2.4 | 34.3 | 1.9 |
| 2-methylisoborneol (2-MIB) | 12.5 | 9.6 | 7.9 | 4.8 | 32.6 | 1.3 |
Table 4.
The statistical data of the geosmin and 2-MIB concentrations affected by treatment processes.
Table 4.
The statistical data of the geosmin and 2-MIB concentrations affected by treatment processes.
| Parameters | Average | Median | S.D. | Min | Max | Skewness | |
|---|---|---|---|---|---|---|---|
| Geosmin | Raw Water | 7.9 | 6.2 | 4.4 | 2.3 | 17.1 | 0.9 |
| Influent Water | 8.4 | 6.9 | 5.5 | 2.5 | 20.3 | 1.0 | |
| Preozonation | 5.6 | 4.3 | 3.7 | 1.5 | 13.8 | 1.1 | |
| Coagulation/Flocculation | 5.9 | 4.5 | 3.8 | 2.0 | 16.7 | 1.5 | |
| Chlorination | 5.4 | 3.4 | 4.7 | 1.3 | 17.9 | 1.6 | |
| Filtration | 5.7 | 4.1 | 3.7 | 1.8 | 15.8 | 1.3 | |
| Postozonation | 4.8 | 3.7 | 2.8 | 1.4 | 12.1 | 1.2 | |
| Activated Carbon | 3.2 | 3.0 | 2.1 | 0.4 | 9.1 | 1.1 | |
| Treated Water | 4.5 | 3.8 | 2.7 | 0.9 | 12.9 | 1.4 | |
| 2-MIB | Raw Water | 13.0 | 10.1 | 8.3 | 2.9 | 40.7 | 1.9 |
| Influent Water | 12.7 | 9.1 | 8.5 | 5.0 | 38.8 | 1.8 | |
| Preozonation | 8.9 | 8.1 | 5.1 | 2.8 | 21.7 | 1.3 | |
| Coagulation/Flocculation | 10.0 | 8.3 | 5.2 | 4.2 | 21.0 | 0.8 | |
| Chlorination | 10.1 | 9.5 | 4.3 | 4.5 | 18.5 | 0.4 | |
| Filtration | 10.1 | 8.3 | 5.7 | 4.1 | 24.8 | 1.3 | |
| Postozonation | 9.2 | 9.1 | 4.3 | 1.8 | 21.1 | 0.7 | |
| Activated Carbon | 6.6 | 5.6 | 3.5 | 2.0 | 17.5 | 1.6 | |
| Treated Water | 9.1 | 6.8 | 6.3 | 3.4 | 31.3 | 2.4 | |
Publisher’s Note: MDPI stays neutral with regard to jurisdictional claims in published maps and institutional affiliations. |
© 2021 by the authors. Licensee MDPI, Basel, Switzerland. This article is an open access article distributed under the terms and conditions of the Creative Commons Attribution (CC BY) license (http://creativecommons.org/licenses/by/4.0/).
Share and Cite
MDPI and ACS Style
Kim, K.T.; Park, Y.-G. Geosmin and 2-MIB Removal by Full-Scale Drinking Water Treatment Processes in the Republic of Korea. Water 2021, 13, 628. https://doi.org/10.3390/w13050628
AMA Style
Kim KT, Park Y-G. Geosmin and 2-MIB Removal by Full-Scale Drinking Water Treatment Processes in the Republic of Korea. Water. 2021; 13(5):628. https://doi.org/10.3390/w13050628
Chicago/Turabian StyleKim, Keug Tae, and Yong-Gyun Park. 2021. "Geosmin and 2-MIB Removal by Full-Scale Drinking Water Treatment Processes in the Republic of Korea" Water 13, no. 5: 628. https://doi.org/10.3390/w13050628
Note that from the first issue of 2016, this journal uses article numbers instead of page numbers. See further details here.