
Quantitative Prediction of Outburst Flood Hazard of the Zhouqu “8.8” Debris Flow-Barrier Dam in Western China

1
MOE Key Laboratory of Western China’s Environmental Systems, School of Earth Sciences, Lanzhou University, Lanzhou 730000, China
2
Technology & Innovation Centre for Environmental Geology and Geohazards Prevention, School of Earth Sciences, Lanzhou University, Lanzhou 730000, China
3
Academy of Disaster Reduction and Emergency Management, Faculty of Geographical Science, Beijing Normal University, Beijing 100875, China
4
College of Earth and Environmental Sciences, Lanzhou University, Lanzhou 730000, China
*
Author to whom correspondence should be addressed.
Water 2021, 13(5), 639; https://doi.org/10.3390/w13050639
Submission received: 29 December 2020
/
Revised: 19 February 2021
/
Accepted: 22 February 2021
/
Published: 27 February 2021
(This article belongs to the Special Issue New Multi-Hazard Risk Assessment Methods for Extreme Rainfall Events)
Abstract
:In recent years, the intensified influences of global climate change and human activities have increased the frequency of large-scale debris flow disasters. As a result, main river channels often become blocked, thus forming a disaster chain of rivers dammed by debris flow followed by outburst flooding. In order to quickly and easily reveal the dynamic process of a debris flow dam breach, and quantitatively predict the outburst flood hazard, this study takes the Zhouqu “8.8” debris flow barrier dam in Western China as an example. Based on a stability assessment, China Institute of Water Resources and Hydropower Research’s Dam Breach Slope (DBS-IWHR), China Institute of Water Resources and Hydropower Research’s Dam Breach (DB-IWHR), and Hydrologic Engineering Center’s River Analysis System (HEC-RAS) were integrated to simulate the development of dam breach, breach flood, and outburst flood evolution, respectively, under different scenarios. The simulated peak discharge flow of the actual spillway was 317.15 m3/s, which was consistent with the actual discharge of 316 m3/s. The results under different scenarios showed that, with the increased inflow of the barrier lake, the erosion rate of the dam increased, the peak discharge of the dam break flood increased, the peak arrival time shortened, and the downstream flooding area increased. These findings could provide scientific support for risk management and emergency decision-making with respect to barrier dam failure.
1. Introduction
In recent years, large scale debris flows have occurred frequently in mountainous areas as a result of strong earthquakes, extreme rainfall, and increased human activities. These debris flows often block main river channels and form a multi-hazard chain of rivers dammed by debris flow followed by outburst flooding, which has caused huge losses of life and property worldwide [1,2,3,4,5,6]. In particular, under the complex geological and climatic conditions of the Qinghai-Tibetan Plateau, events have included the rivers dammed by the 2020 Danba debris flow and the 2019 Yarlung Tsangpo debris flow [7,8]. Debris flow dams are mostly formed by the accumulation of loose materials, and are much less stable than artificial dams; once debris flow dams breach, they may cause more serious flood disasters downstream. Therefore, rapid evaluation of their stability and the risk of dam failure is particularly important for the emergency response and mitigation of the hazard chain induced by debris flows.
The Bailong River basin is in the confluence zone of the Loess Plateau, the Qingha-Tibetan Plateau, and the Sichuan Basin. It has strong tectonic activities and is one of the four regions that suffer the most from geological hazards in China [9,10]. Debris flow disasters occur frequently in the Bailong River basin, which has the characteristics of “every earthquake is inevitable, and prolonged rain disasters” [11]. Based on the latest survey, there are 1008 debris flow valleys in the Bailong River basin. More than 100 of these are large debris flows that pose a high risk of damming rivers. In 2010, a huge mudslide in Zhouqu blocked the Bailong River. The mudslide inundated 1/3 of the main city, and led to 1765 deaths and a great loss of property. Key issues in the emergency response and risk management of the river damming debris-flow hazard chain are whether a barrier dam is stable and the extent of the impact of an outburst flood caused by a dam breach. Therefore, there is an urgent need to quantitatively predict the dynamic evolution process of dam breaches and the subsequent outburst flood under different scenarios within a short time period for the purpose of emergency decision making.
Barrier dams and related dam break flood disasters are common all over the world, such as in China [12], Italy [13], and Central Asia [14]. Therefore, many scholars have conducted relevant research on debris flow barrier dams. The research on debris flow barrier dams is mainly divided into model experiments and numerical model studies. Researchers have conducted model experiments by reducing the barrier dam to a certain scale [15]. Dang et al. [16] used the debris flow blockage event in Tibet as a generalized model to carry out overtop failure experiments for debris flow barrier dams, and studied the process of debris flow barrier dam failure by changing the dam’s body parameters and the hydraulic parameters of the main trench. Li et al. [17] used scale paper and cameras to record the formation, development, and change process of failure under different conditions for the main factors influencing dam breaks. These studies have all contributed to the study of debris flow barrier dams, but due to the difficulty of model experiments, numerical simulations have become a more important method in the study of debris flow [18]. With the widespread use of computers, researchers have carried out a large number of quantitative studies on the numerical modeling of dam breaks and outburst flood evolution, which mainly includes parameter-based models and physical process-based models [19]. For example, Singh et al. [20] analyzed 20 dam-break cases and made a quantitative assessment of the width of the failure for the first time. Chen et al. [21] proposed a hyperbolic model of soil erosion and successfully applied it to the failure analysis of the Tangjiashan barrier dam. Fu et al. [22] developed a simulation model of the overtopping outburst process of a dam based on the physical mechanism. On the basis of the research on the process of barrier dam breakage, scholars have conducted in-depth research into the flood flow of dam failures. Xu and Zhang [23], Thornton [24], and Hooshyaripor [25] respectively established different forms of relational expressions for predicting dam-break flood flow. Numerous mature numerical models have been applied to simulate barrier dam breaks. These studies and models provide an important reference for the quantitative study of debris flow dam failure. However, these studies either focus on the simulation of the dam break process or on dam break flood. Limited quantitative studies based on numerical models have been undertaken regarding the complete debris flow-dam breach-outburst flood process. There are few rapid quantitative evaluation methods for the risk of outburst floods due to dam breaks caused by debris flows.
The occurrence of many major natural disasters is often accompanied by the occurrence of other disasters, and the losses are not caused by a certain kind of disaster, but by the chain reaction of multiple disasters and their complex interactions in time and space. Therefore, the problem of the disaster chain has gradually become a major issue in disaster science [26,27]. In the study of debris flow disaster chain, there are few rapid quantitative evaluation methods for determining the risk of outburst floods due to dam breaks caused by debris flows. Many models, such as Hydrologic Engineering Center’s River Analysis System (HEC-RAS) [28], a modelling system for River and Channels (MIKE 11) [29], and InfoWorks RS (ISIS) [30] are used in the simulation of flood evolution. These models provide the possibility for flood evolution simulation after a dam break. Li [31] used the calculation method of the single reservoir dam break model, one-dimensional flood evolution calculation theory and reservoir flood regulation calculation principle to establish a numerical calculation model for the continuous failure of cascade earth-rock dams. Chen et al. [7] established a numerical modeling method for the dam breach–outburst flood disaster chain through the Dam Breach Analysis (DABA) model and one-dimensional Saint-Venant equations, and successfully applied it to the Gyalha landslide dam on Yarlung Tsangpo. Fan et al. [32,33] established a comprehensive numerical modeling method for the landslide-dam breach-flood disaster chain through Massflow, the DABA, and HEC-RAS models, and successfully applied it to the Baige landslide of the Jinsha River. These studies provide an important basis for the risk evaluation of outburst flooding due to debris flow dam breaks. However, numerical simulation requires more detailed hydraulic parameters for a barrier dam, and the calculation process is relatively complicated. Some numerical models are time-consuming. Choosing appropriate models that can quickly evaluate dam stability and predict the extent of outburst flooding, and establishing a rapid risk assessment method have important practical significance in emergency response to similar chain disasters. Based on the previous works, it is possible to establish a fast and simple model group for evaluating the debris flow weir dam break-flood disaster chain. The recently developed China Institute of Water Resources and Hydropower Research’s Dam Breach (DB-IWHR) spreadsheet can calculate the discharge hydrograph of dam breaks. The China Institute of Water Resources and Hydropower Research’s Dam Breach Slope (DBS-IWHR) worksheet is used to simulate the horizontal expansion of the failure. The combined dam failure analysis method using these two models is physically representative, numerically friendly, and less sensitive to the input parameters [34,35,36,37]. DB-IWHR requires only a few input parameters and the straight-forward numerical algorithm allows almost instant calculations, where field engineers can perform a dam breach analysis along with a sensitivity study of a target case within 1 h in DB-IWHR, which includes a tutorial [34]. Some scholars have used DB-IWHR to achieve good results in the inversion analysis of barrier dam events such as Yigong [35], Hongshiyan [36], Xiaogangjian [37], et cetera, and carried out more accurate predictions when the Baige barrier lake incident occurred in 2018 [38]. The results of DB-IWHR can be input into HEC-RAS to simulate the evolution of floods. The combination of these three models can quickly predict the hazards of dam-break flood disasters. In order to evaluate the failure of debris flow dam-outburst flood hazard chain under different scenarios in the Bailong River basin and establish a method for the rapid evaluation of the risk associated with this hazard chain, this study takes the Zhouqu “8.8” debris flow hazard chain as an example. We achieve this using the DBS-IWHR, DB-IWHR, and HEC-RAS multi-model. This study could provide a relevant reference for the emergency response, risk assessment, and management of debris flow-dam breach-outburst flood hazard chain events in the Bailong River basin and similar areas.
2. Study Area and the Zhouqu Debris Flow
2.1. Overview of Zhouqu
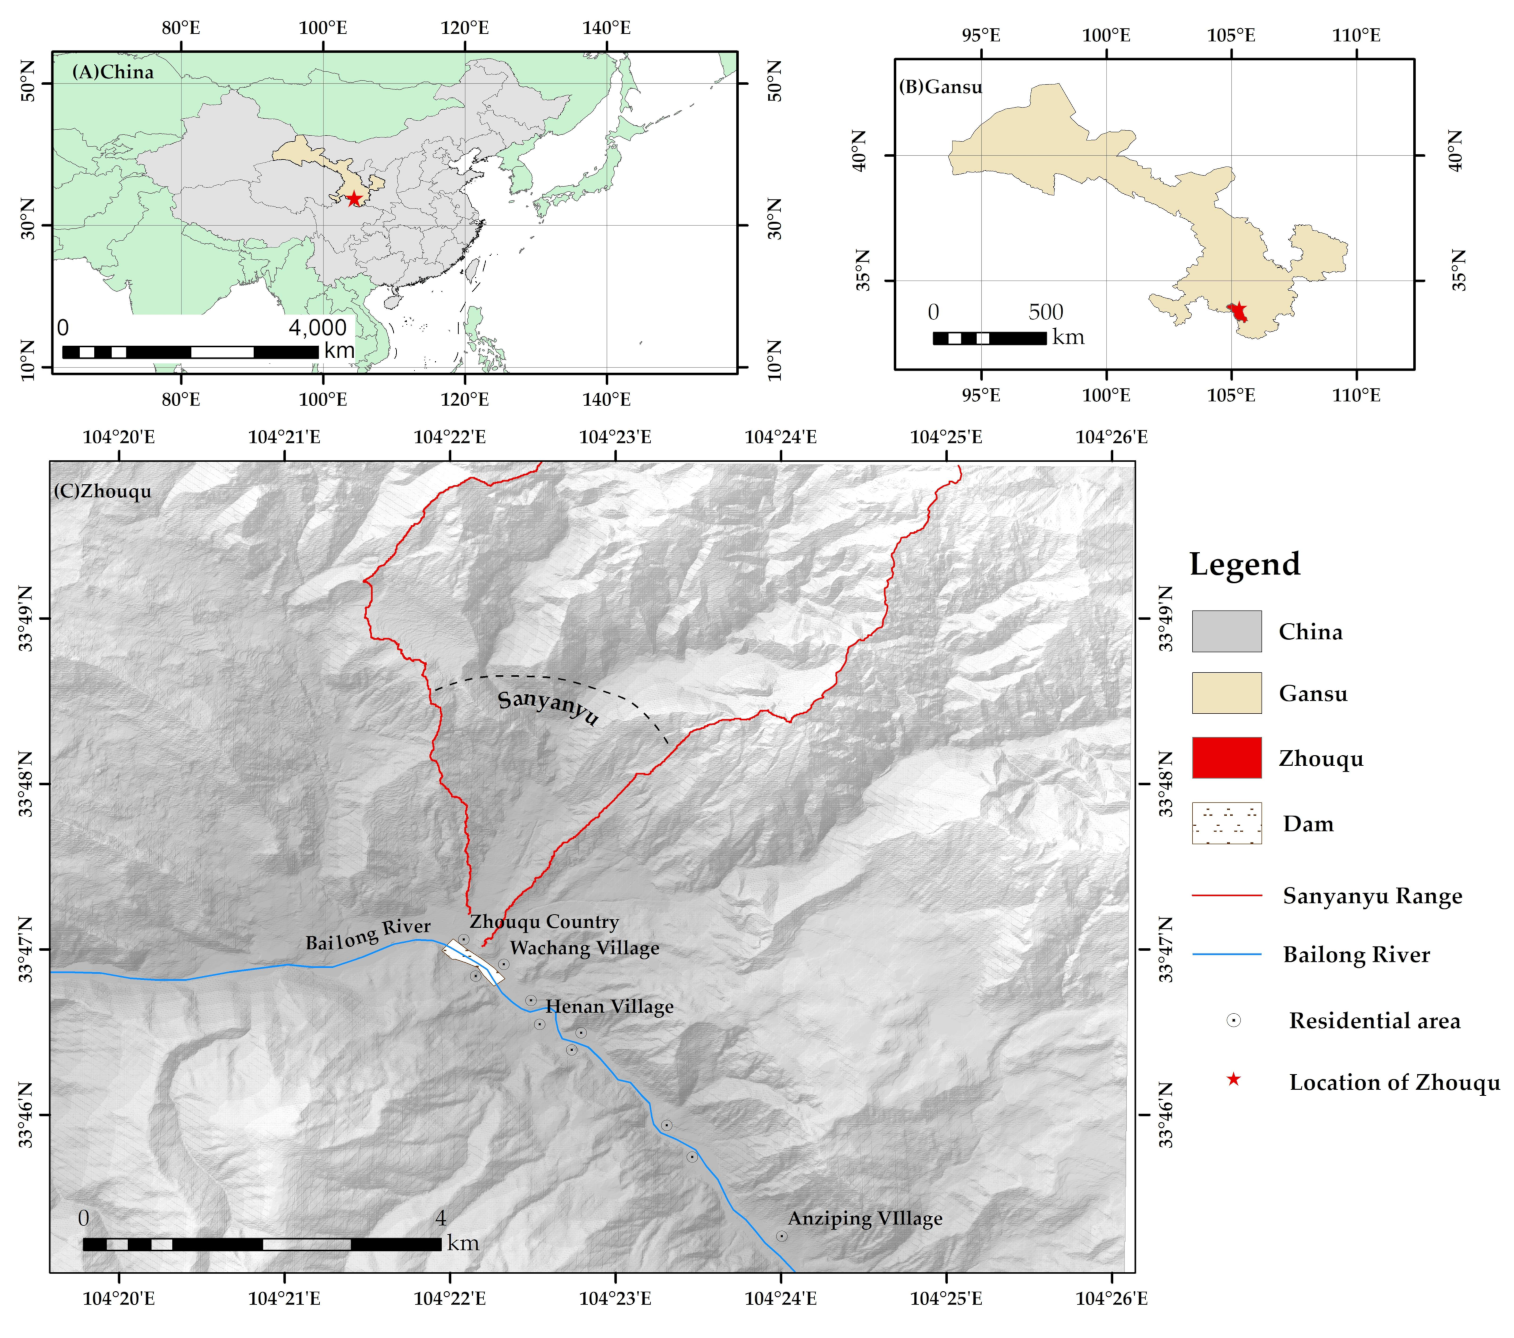
Sanyanyu and Luojiayu are in Zhouqu County, on the north bank of the Bailong River. Sanyanyu consists of Dayanyugou and Xiaoyanyugou, with a drainage area of approximately 24 km2. The Luojiayu Valley covers an area of 15.8 km2, and the main channel is ~7.9 km long [39]. Under the effects of earthquakes and weathering, the rocks in the catchment are fractured, and many landslides and collapses have provided a large amount of loose solid deposits for debris flows. Precipitation in the area is concentrated from June to September, and the average annual rainfall is 435.8 mm. Rainfall occurs in the form of continuous rain and heavy rain. There are many valleys and steep terrain in the basin, which is very prone to the formation of debris flows [40]. The study area is shown in Figure 1. The scene of Zhouqu after the debris flow is shown in Figure 2.
2.2. Overview of the Bailong River
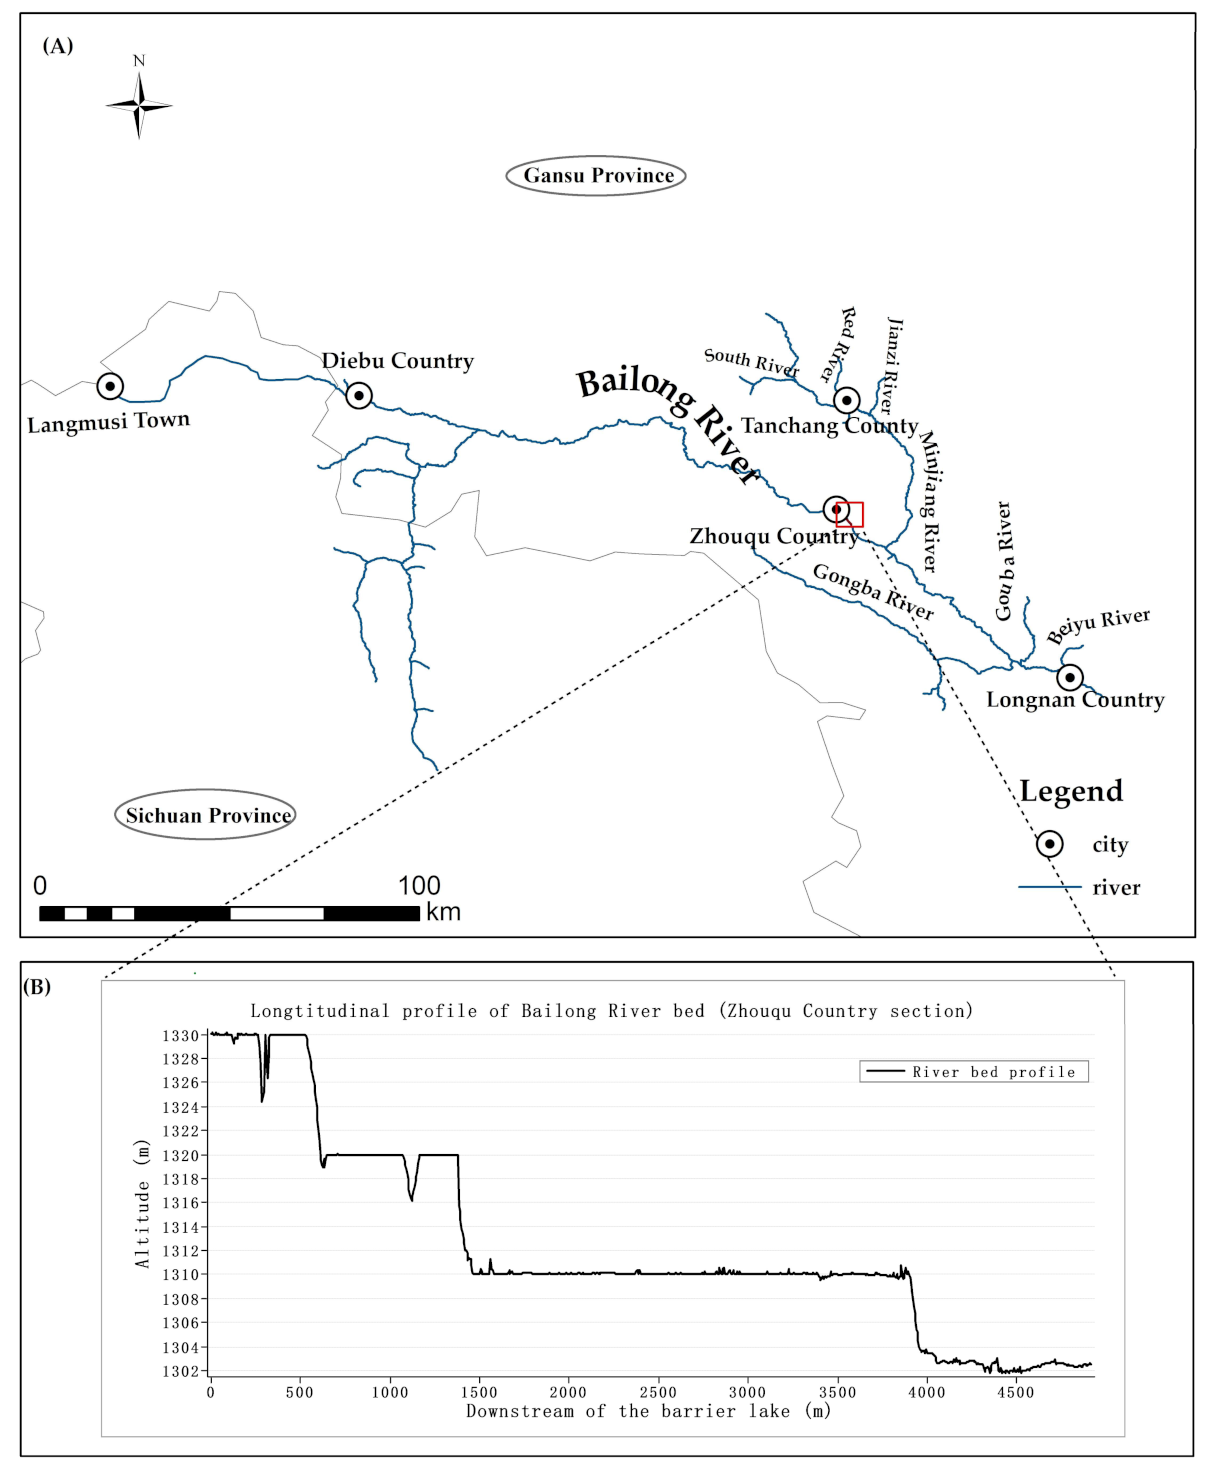
The Bailong River is a secondary tributary of the Yangtze River and is a primary tributary of the Jialing River. It originates from Langmusi at the junction of Luqu County in Gansu Province and Ruoergai County in Sichuan Province. It flows through seven counties in Gansu Province and Sichuan Province, and finally merges into the Jialing River at Guangyuan City, Sichuan Province. The Bailong River has a total length of about 570 km, a drainage area of 32,972 km2, a river drop of 2780 m, and an average gradient of 48‰ [41]. The water system diagram of Bailong River is shown in the Figure 3. The Bailong River bed has large fluctuations, and the longitudinal profile of the river bed in Zhouqu County is also shown in Figure 3.
2.3. Zhouqu “8.8” Debris Flow and Barrier Lake
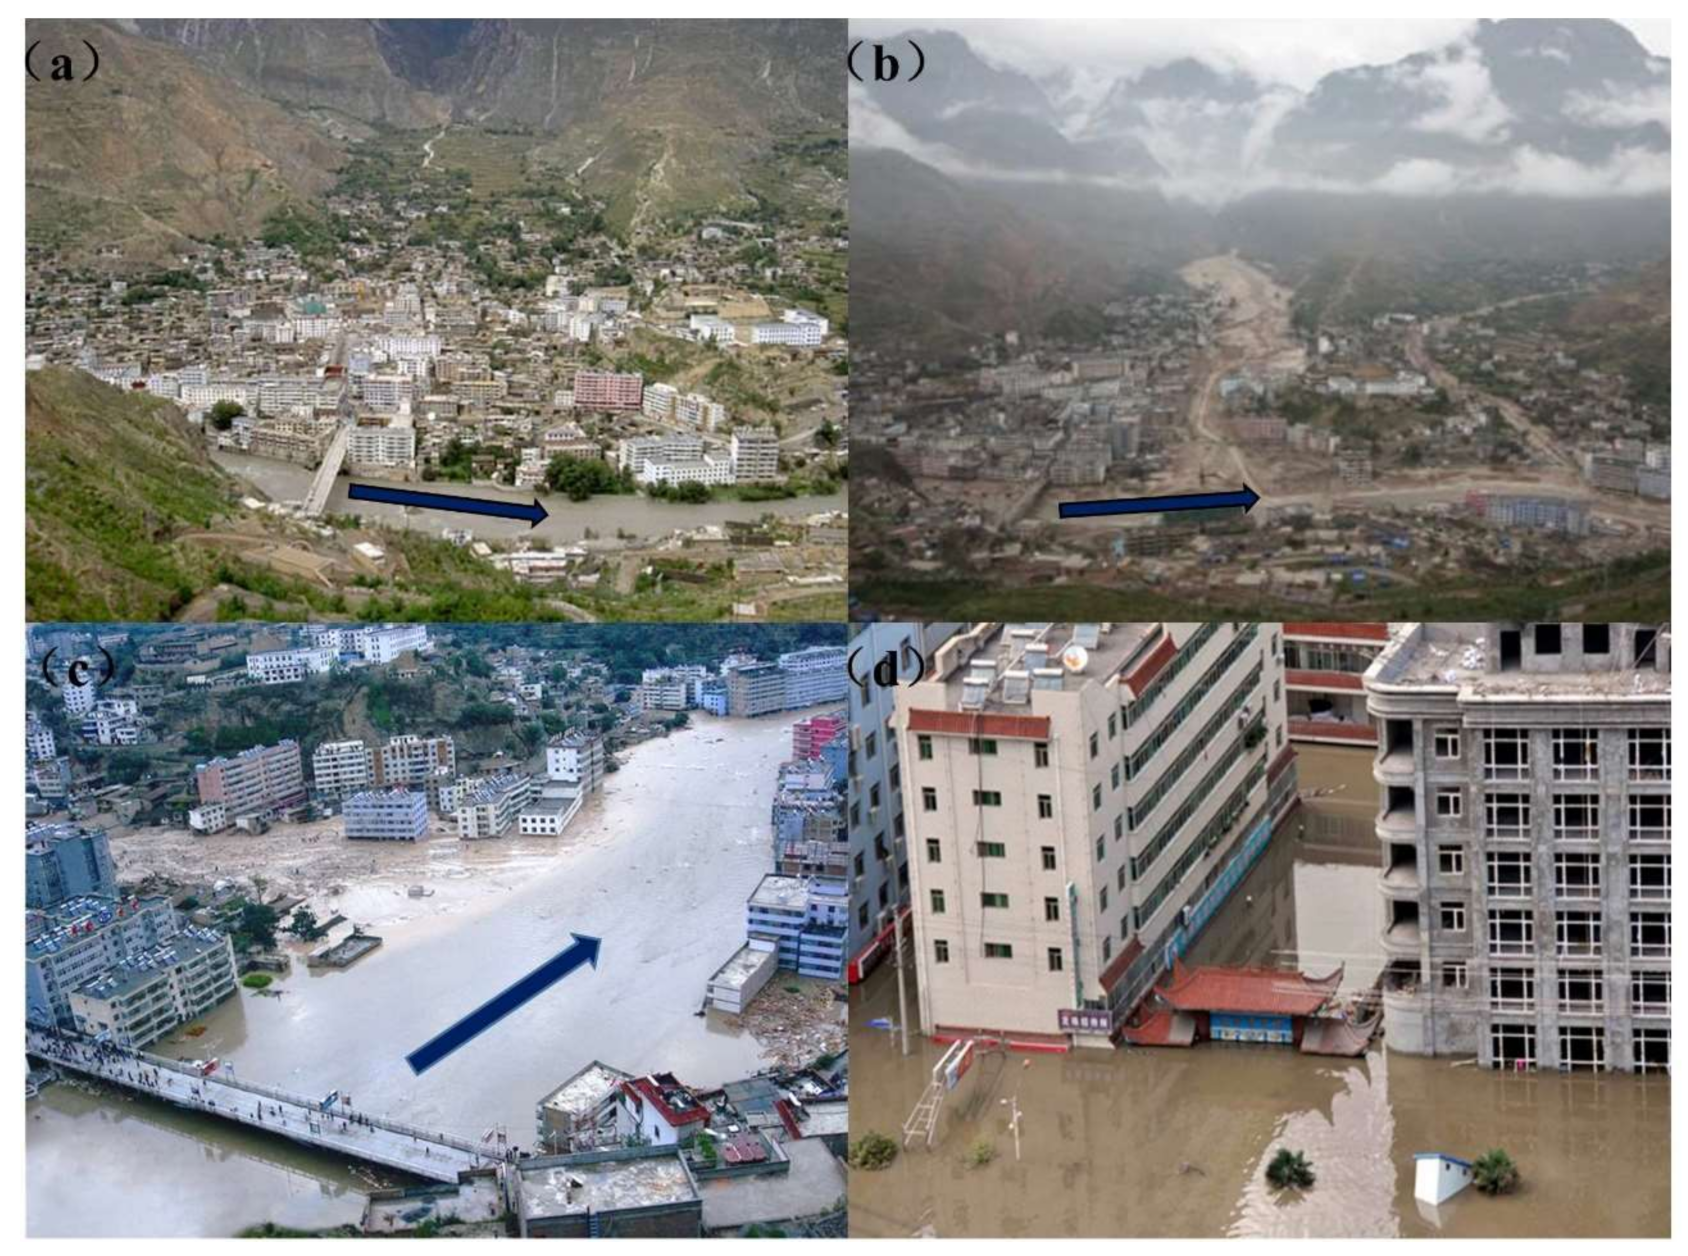
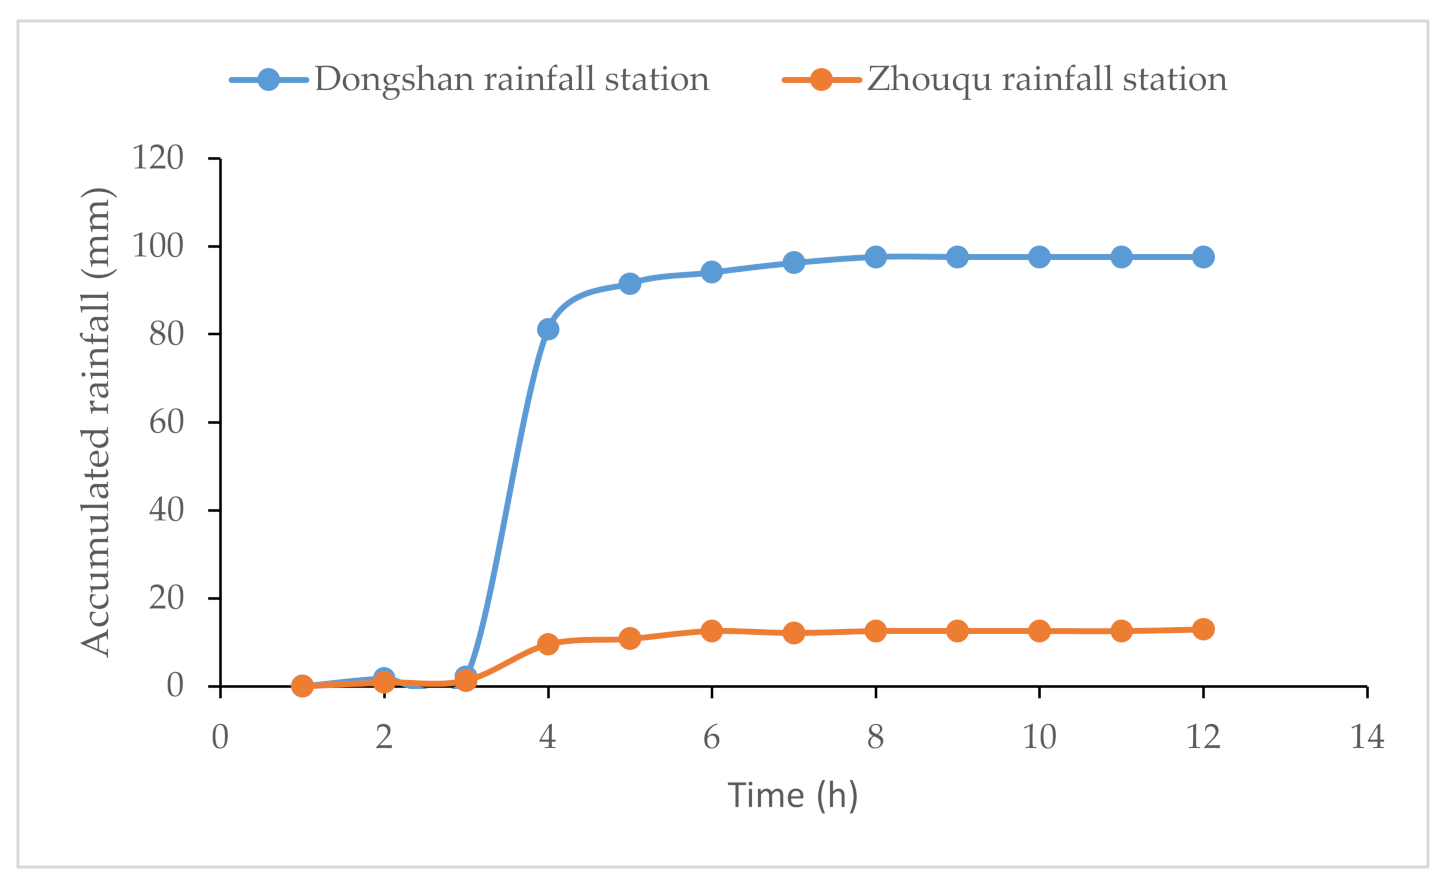
On 7 August 2010, a mega torrential mudslide was induced by rainstorms in the Sanyanyu and Luojiayu valleys of Zhouqu in Western China. Data from the rainfall station in Dongshan Town showed that the accumulated rainfall reached 77.6 mm (Figure 4). A large amount of loose solid material in the channel was initiated under the erosion of surface rainfall runoff, and gradually formed a viscous debris flow. The debris flow rushed out of the channel and poured into the Bailong River, thus forming a barrier dam and completely blocking the river. The consequential backwater flooded nearly 1/3 of Zhouqu County. The multi-disaster chain event caused 1765 deaths and a tremendous loss of property (Figure 2). The water storage capacity of the barrier lake formed by the Zhouqu debris flow was 150 × 104 m3. The barrier dam was approximately 1.5 km long, 100–120 m wide, approximately 9 m high, and had a sedimentation volume of ~1.4 × 10⁶ m3 [42]. Authorized departments evacuated 19,400 people from dangerous areas along the Bailong River.
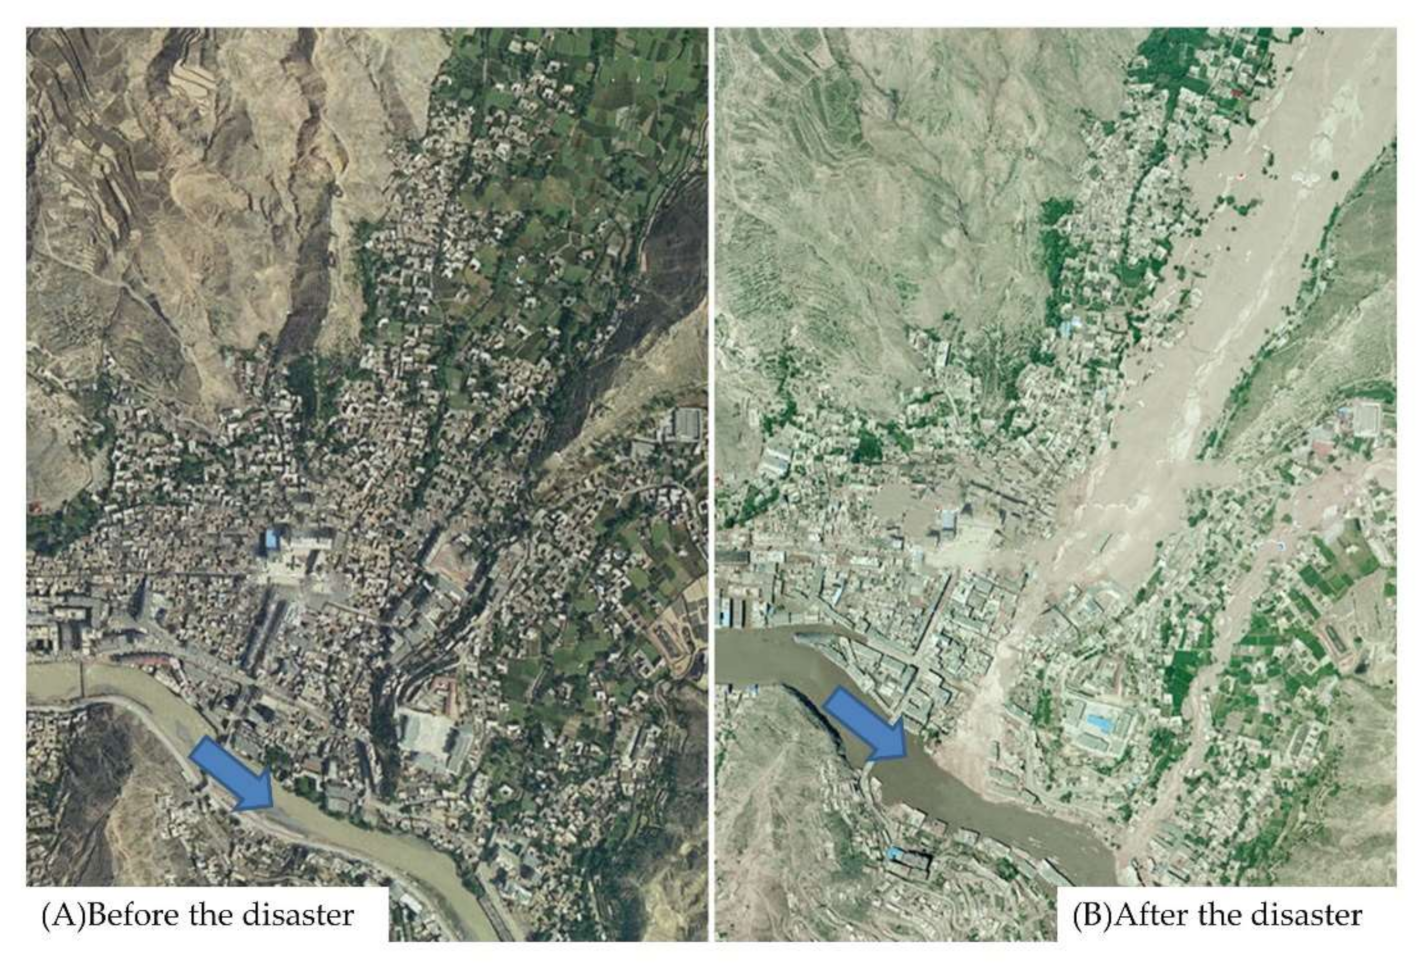
In order to eliminate the risk of outburst floods, relevant departments adopted a combination of excavation and explosion measures to carry out the emergency disposal project of the debris flow dam. In addition, to eliminate the blockage of the upstream section of the dam body and decrease the water level upstream, a drainage channel with a trapezoidal basic cross section was designed with a bottom width of 20 m, depth of 4 m, longitudinal slope of 3‰, and side slope of 1:1.5. Finally, excavation on 30 August formed a spillway with a length of ~1.2 km, width of ~60 m, and depth of 8–9 m. The peak discharge of the flood was 316 m3/s [43]. Satellite images of the barrier lake before and after the disaster are shown in Figure 5.
3. Data and Methods
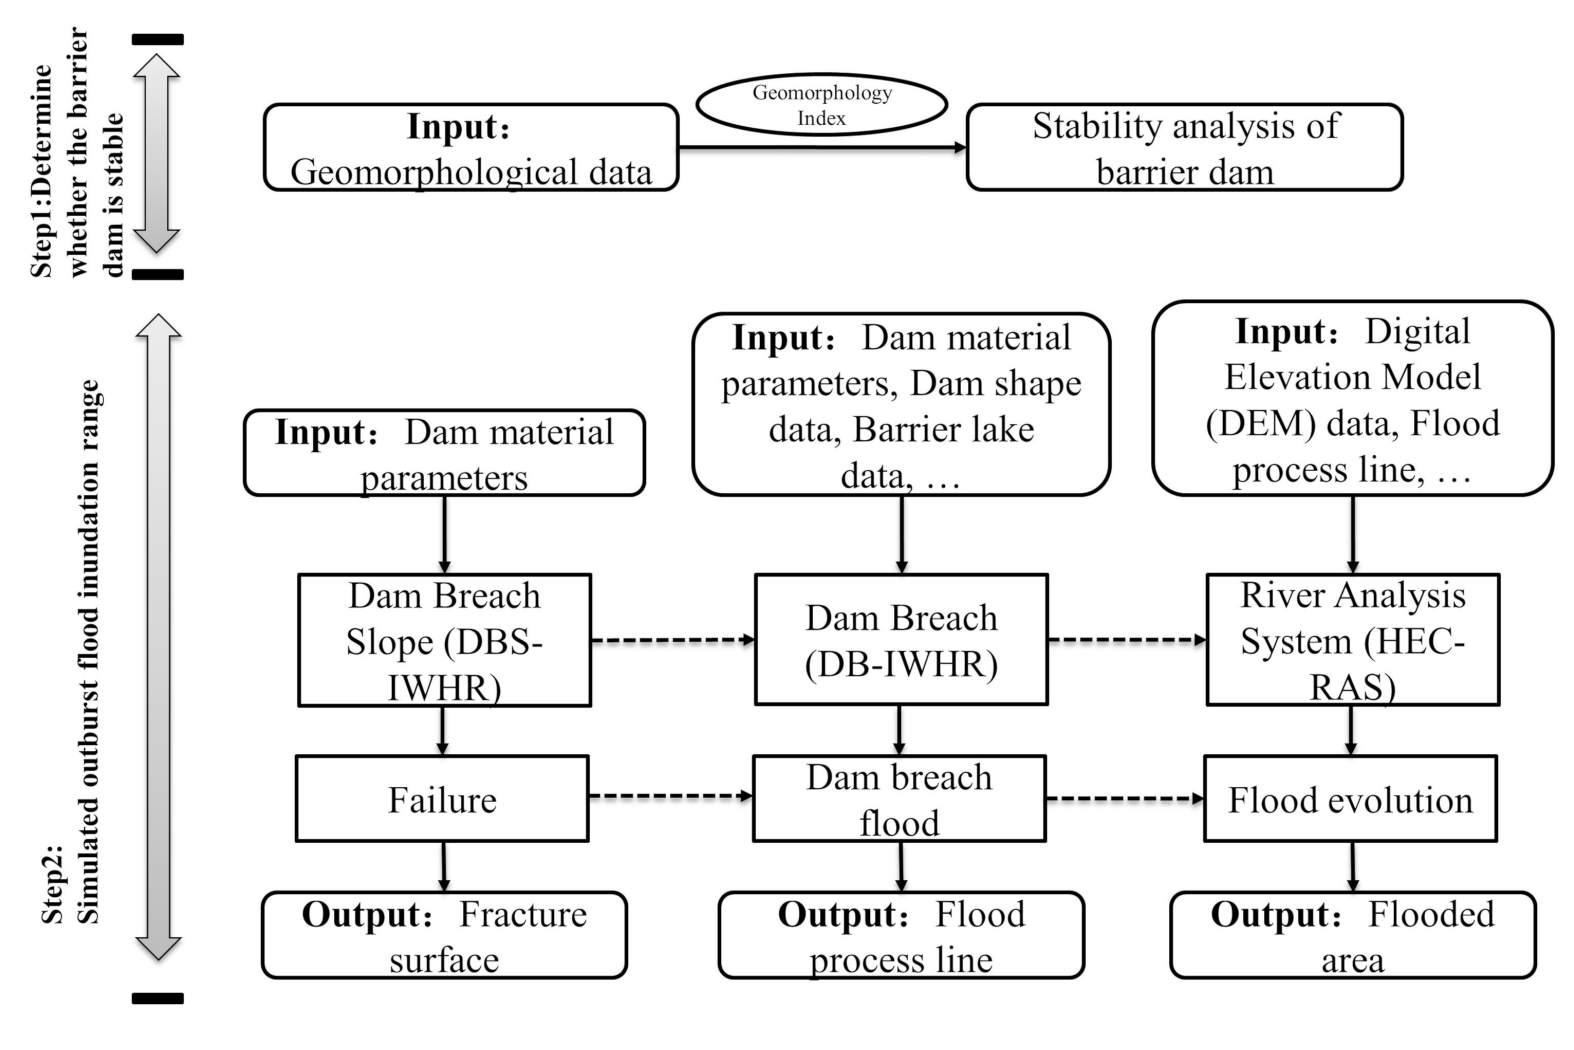
We conducted a comprehensive analysis on the main concerns regarding debris flow blocking the Bailong River: (i) Is the dam body stable? (ii) What is the scope of the outburst flood? First, the geomorphological index method was used to quickly and conveniently judge the stability of the dam. Second, to understand the extent of the impact of the outburst flood once the dam body breaks, the DBS-IWHR failure calculation software was used to simulate the development process of the failure during the dam break. The burst flood analysis software DB-IWHR was used to perform the dam-break flood simulation, and the result of DB-IWHR was input into HEC-RAS software to simulate the evolution of the flood after the dam break. Finally, the inundation range of the flood was obtained. Based on the inundation area, combined with population data over the kilometer grid is was possible to estimate the number of people affected by the disaster, the percentage of the number of people affected by the disaster in the area is used to estimate the economic loss. A flowchart of the entire study is shown in Figure 6. The data used are listed in Table 1 [42,44].
3.1. Barrier Dam Stability Analysis
Geomorphological indices are commonly used to evaluate the stability of barrier dams [45,46,47,48]. Although these offer a fast and simple approach, when used alone, they cannot consider the detailed physical mechanical processes; hence, there is a certain degree of uncertainty. Therefore, this study used multiple geomorphological indices to analyze the stability of the barrier dam in the study area. The main geomorphological indices include the blockage index (BI), morphological obstruction index (MOI), and hydromorphological dam stability index (HDSI). Among them, the blockage index [49] is a geomorphic index that is applicable to a wide range of uses. The latter two are new geomorphic indices proposed by Tacconi Stefanelli [50], which are more reliable and have uncertainty domains that are significantly reduced in comparison to previous geomorphic indices. The formulas for the three geomorphological indices and the ranges of various existing domains are shown in Table 2.
3.2. Simulation of Barrier Dam Break
The discharge of the Bailong River varies greatly during the rainy season. It has a direct impact on the process of barrier dam failure, and the disaster range and extent of the outburst flood. In order to quantitatively evaluate the dam break process and the disaster-causing scope of the flood under different conditions in the upstream region of the Bailong River, we designed three types of inflows: (i) the average monthly runoff from the Zhouqu section of the Bailong River [51], (ii) the peak flow of a flood over 20 years [52], and (iii) the peak flow of a flood over 50 years [52]. The spillway is the most common method to discharge floods and relieve the threat of barrier lakes. The design of the spillway size is a key issue in the emergency response of river blockage disasters. Therefore, we performed a spillway simulation under different geometrical scenarios (Table 3) to analyze the range in which the discharge flood of different spillways may be submerged.
3.2.1. Simulation of the Breach Development Process Using DBS-IWHR
DBS-IWHR is a program written by Zuyu Chen’s research team, and is based on the Excel platform and uses the Visual Basic (VB) language to simulate the development of a breach. This program uses the widely accepted sliding surface analysis method for geotechnical engineering: the simplified Bishop method for calculating the lateral collapse of a breach. Barrier dams are scoured by rivers and undergo longitudinal undercutting and lateral expansion. As the undercutting depth increases, the safety factor of the breached slope will gradually decrease until it reaches a critical value, when the slope will become unstable and a landslide will occur, thus increasing the breach width. Detailed information on each slip surface of the breach can be obtained through software calculation [53,54].
3.2.2. Simulation of the Dam-Break Flood Using DB-IWHR
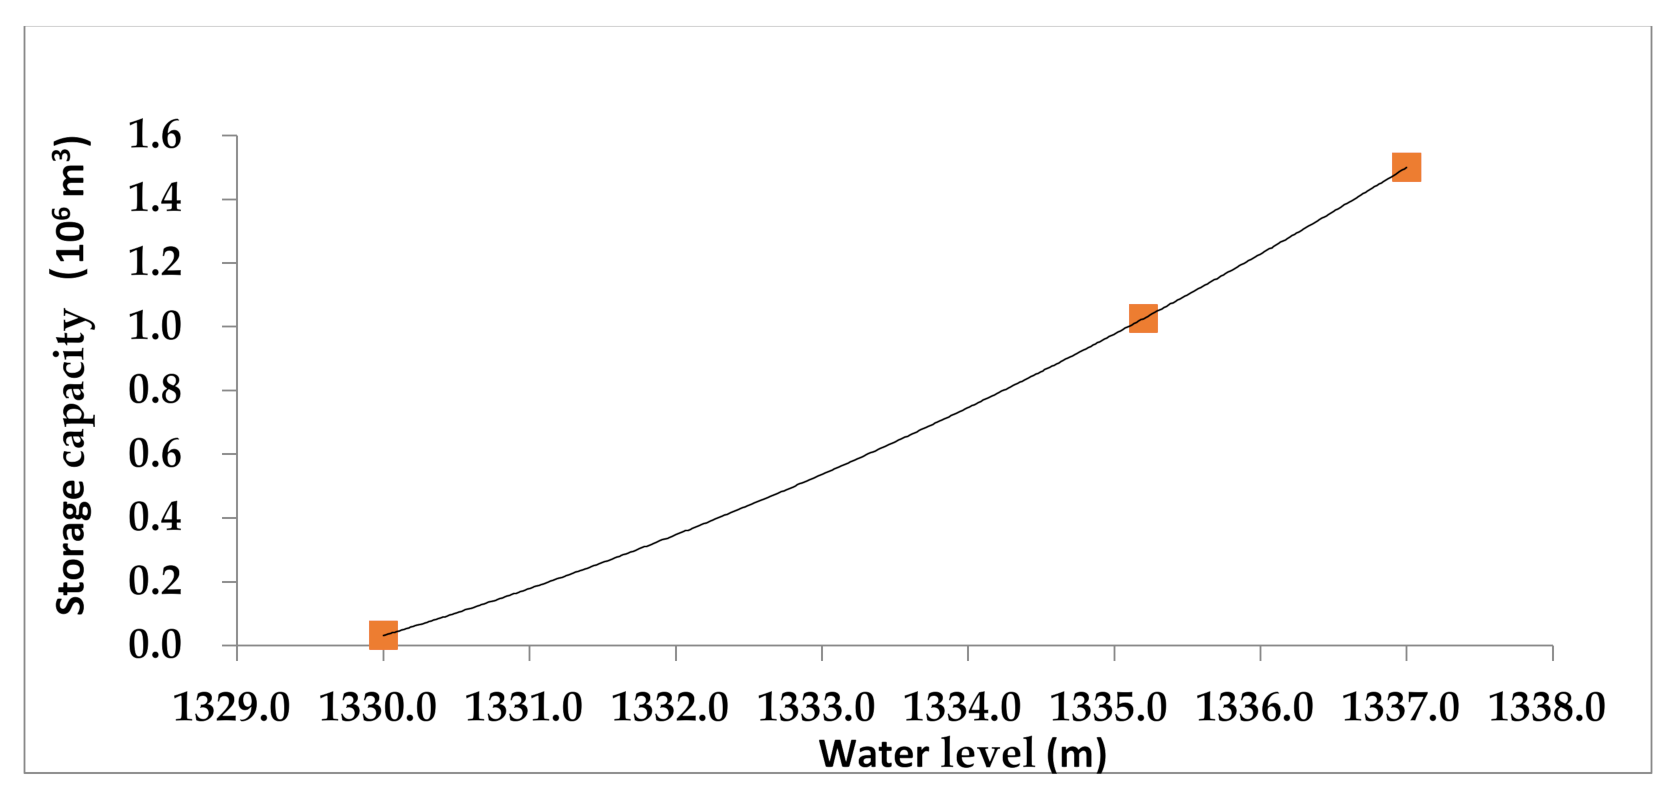
DB-IWHR is an electronic calculation table of the dam-break flood process line and was independently developed by Zuyu Chen’s research team. Using an Excel interface in combination with VB for applications, DB-IWHR is a mathematical parameter model based on physical mechanisms. Its main principles can be divided into three parts: (1) according to the water balance principle, the flow rate of the breach is determined by the loss of reservoir capacity per unit time; (2) the innovatively proposed breach erosion rate as the hyperbolic scour model; and (3) the slope stability principle is introduced to calculate the breach widening. The main function of this program is to predict the flood process line of dam failure during the dam break process through the flow depth, shear stress, dam material, and other attributes [53,54,55]. The DB-IWHR software comes with a fitting formula for the water level storage capacity curve of the barrier lake. The fitting formula is as follows:
where W is the storage capacity, H is the water level, Hr is the dead water level.
Only the water level and storage capacity data of the three control points of the barrier lake can be fitted to the water level storage curve of the barrier lake, and used to obtain the curve coefficients for subsequent calculations. In this study, three control points were obtained through the Digital Elevation Model (DEM) data and the corresponding water level storage capacity curve was fitted as shown in Figure 7.
3.2.3. Simulating the Evolution of the Dam-Break Flood Using HEC-RAS
For the flood evolution simulation, we used the HEC-RAS software developed by the Hydrological Engineering Center of the United States Army Corps of Engineers. The HEC-RAS software can calculate the flood evolution of one-dimensional and two-dimensional constant flow and unsteady flow. The calculation of the unsteady flow by the HEC-RAS software is based on the momentum conservation equation, namely the Saint-Venant equations for unsteady flow. When simulating the flood evolution of unsteady flow in a river channel, the four-point implicit difference iterative calculation is mainly performed by the equation. The output results of HEC-RAS are mainly flood depth, mean velocity, and energy per section downstream [28].
3.3. Assessment of the Affected Population and Economic Loss
The population data uses the 2010 China-wide population data produced by Fu et al. [56] in 2014, with a resolution of 1 km. The economic data of the Zhouqu area uses data from the 2011 Statistical Yearbook.
This article assumes that in the cell grid, excluding the river part, the population is evenly distributed, and the proportion of the submerged area in the area is the population disaster rate of the cell grid. The estimation method for the affected population is as follows:
where P is the affected population in the flooded area, n is the number of 1 km grid cells covered by the flooded area, ai is the population of the corresponding grid, Si is the flooded area in the corresponding grid, and Ri is the area of the corresponding grid excluding the river.
This research mainly calculates the indirect economic loss, that is, the loss of production capacity in the simulation area caused by the flood disaster. The economic production capacity of Zhouqu in 2011 is used as its production capacity, and the proportion of the affected population to the total population of the administrative unit is used as the disaster rate to calculate the indirect economic loss. The estimation method in this study is as follows:
where L is the economic loss, E is the production capacity of the simulation area, P is the affected population in the flooded area, and A is the total population of the simulation area.
4. Results
4.1. Barrier Dam Stability Analysis
Using a geomorphological index to evaluate the stability of a barrier dam is an effective method for making a preliminary assessment of its evolution. Table 4 shows the results of the three geomorphological indices used for the Zhouqu “8.8” debris flow dam.
The resultant blockage index was within the unstable domain, thus indicating that the barrier dam is unstable. The result of the morphological obstacle index was within the uncertainty domain (i.e., 3.83 < MOI < 4.60). The hydromorphological dam stability index was also within the unstable domain. Based on these results, the Zhouqu “8.8” debris flow barrier dam was considered to be unstable.
Some researchers [44] have calculated the safety factor of the barrier dam under different conditions. According to the results of previous studies [44], the safety factor after the formation of the barrier dam is 1.08, with the safety factor decreasing as the upstream water level rises. The existing results also verify the results of the geomorphological index method. Furthermore, according to related studies [57,58], the main cause of dam failure is overtopping. Therefore, according to the geomorphological index and safety factor, the dam is unstable.
4.2. Verification of the Simulation Results of Barrier Dam Outburst Flood
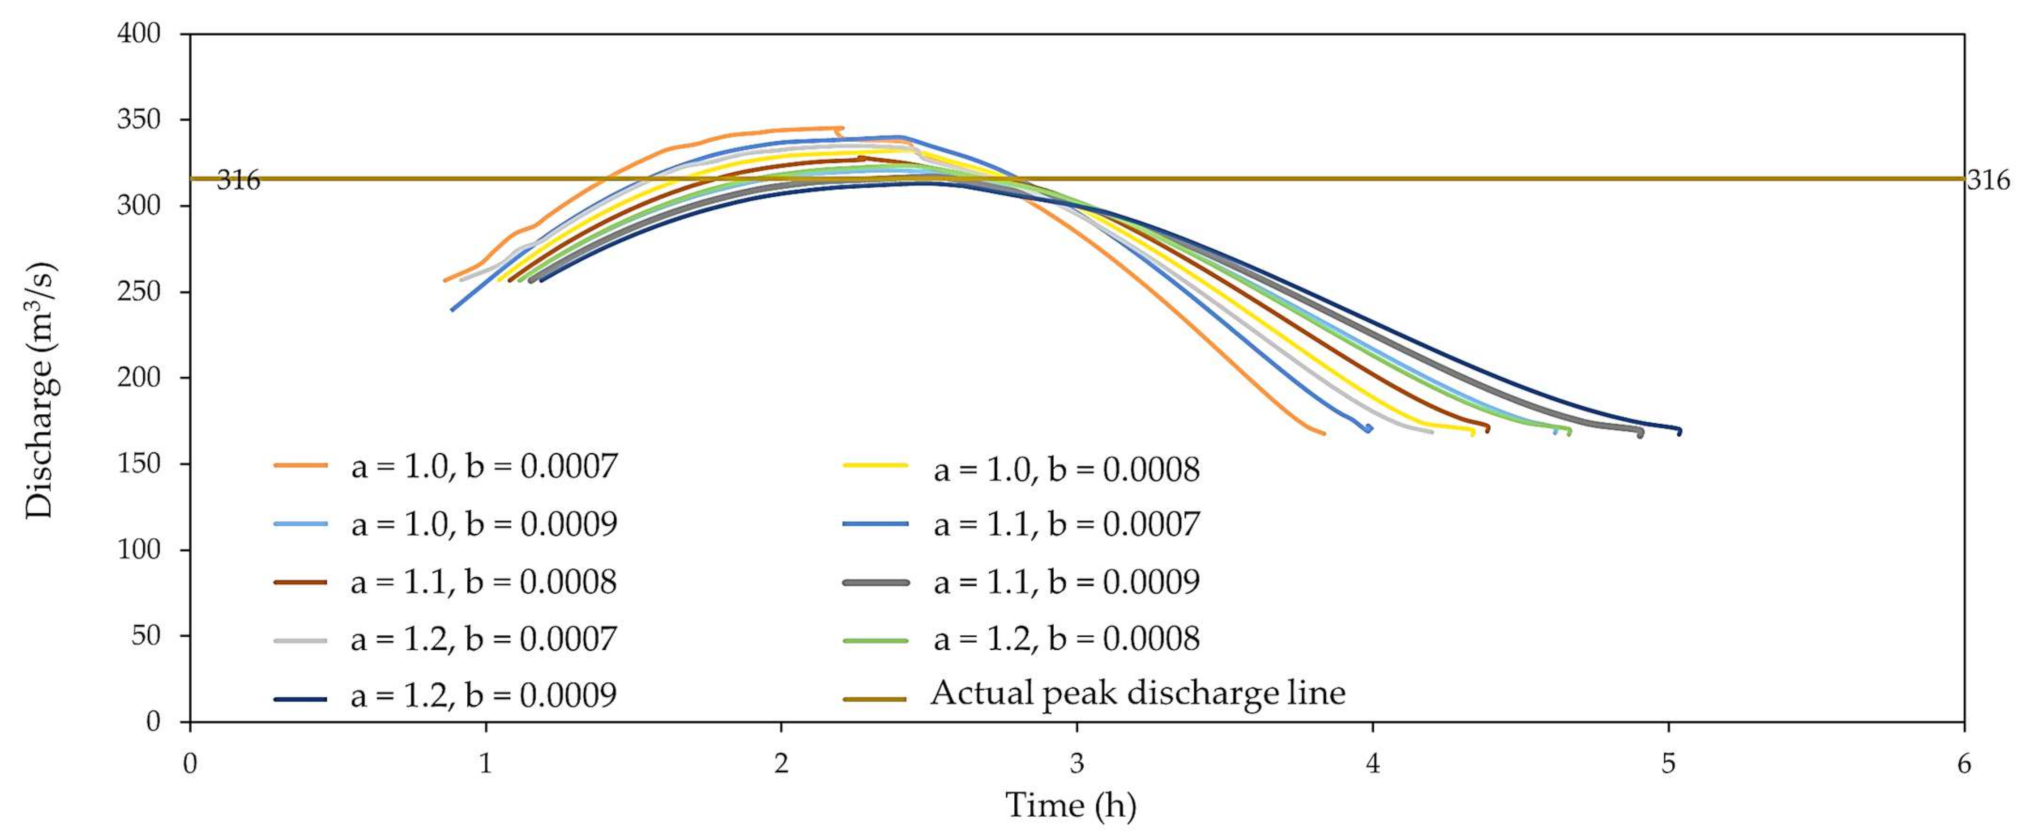
Model validation is a prerequisite for simulating the flood disaster process of barrier dam failure under different scenarios. This study verified the model by simulating flood discharge under an actual scenario. According to the comparison between the DB-IWHR simulation results and the actual data, the accuracy of the model was verified. According to a flow curve presented in a related study [59], when the spillway discharges flood water, the upstream inflow would be ~170 m3/s and the storage capacity of the barrier lake would be approximately 700,000 m3. The water level storage capacity curve of the barrier lake is shown in Figure 7, and could be converted to a water level of ~1334 m. In order to calibrate the model parameters to make the results more accurate, we simulated the results under different parameters for comparison. For the erosion coefficients reflecting soil erosion resistance in the software, a = 1.1 and b = 0.0007 are the default parameters. According to the recommended range of the model, the values are 1.0, 1.1, and 1.2, and the b values are 0.0007, 0.0008, and 0.0009. The simulation results are displayed in Figure 8.
Through the comparison of the simulation results of the DB-IWHR program, it can be seen that the simulation results are closest to the actual situation when a = 1.1 and b = 0.0009, giving a peak discharge of 317.15 m3/s. while the actual flood peak discharge was 316 m3/s. The simulation result was, therefore, only 0.36% larger than the measured data. This indicates that the simulation results could support the quantitative evaluation of the dam-break flood.
4.3. Simulation of the Flood Disaster Process under Different Scenarios
4.3.1. Simulation of Breach Development under Different Scenarios
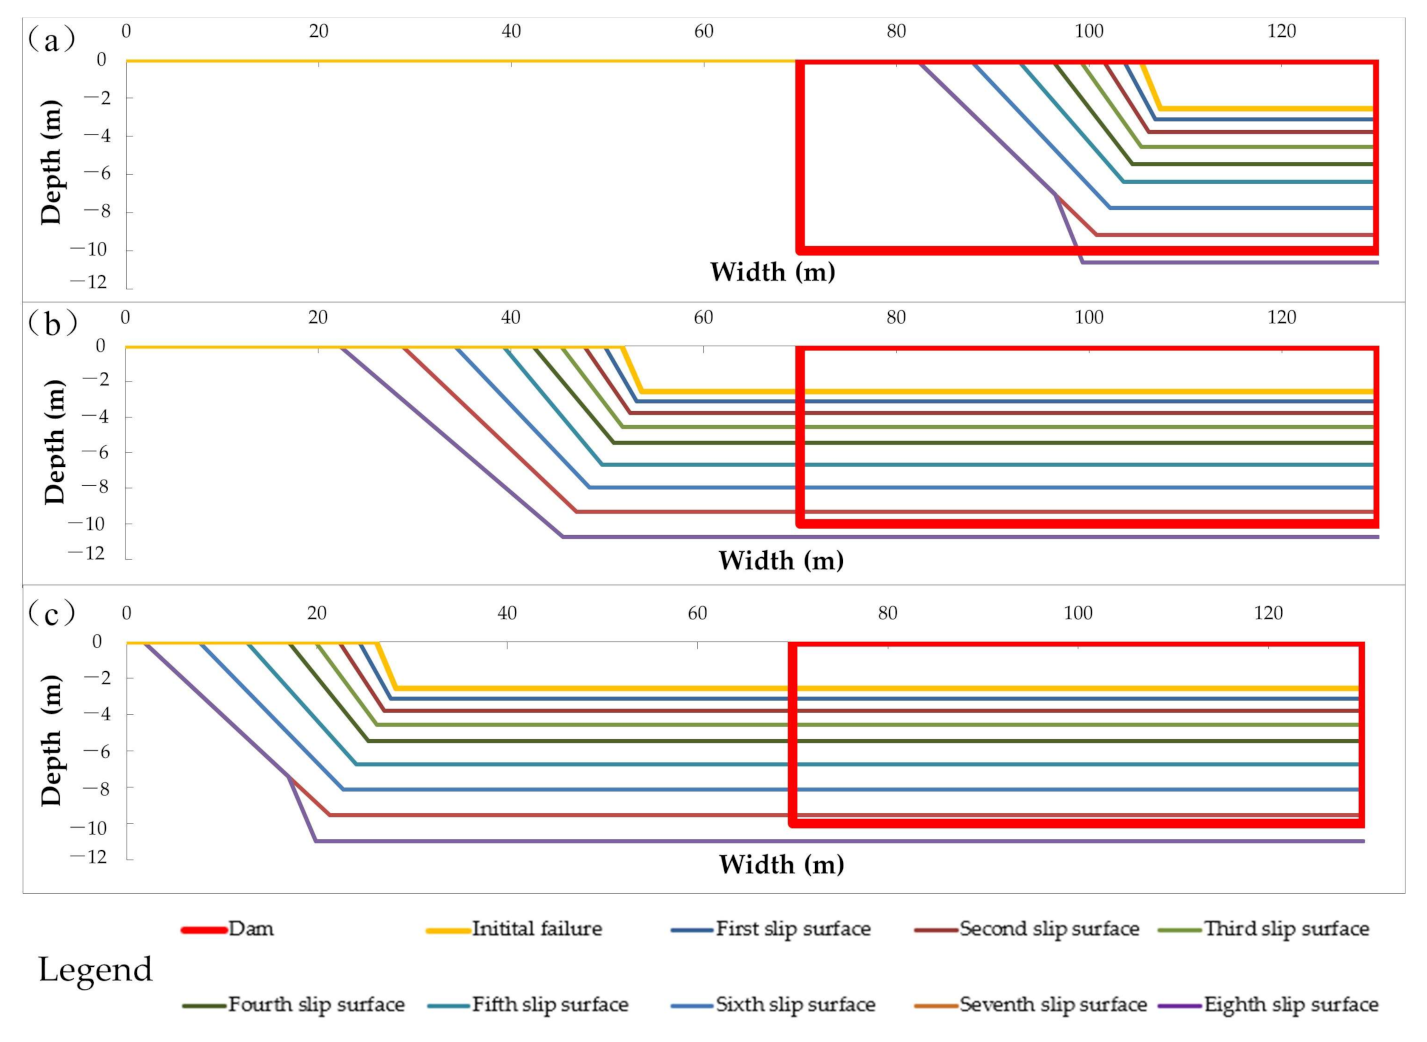
The simulation of the development of a breach is the first step in the simulation of a dam break. The simulation of the flood that forms after the dam break can only be performed after the development process of the breach is determined. The DBS-IWHR model was used to simulate the development of the failure in the case of a natural breach. We used three scenarios (S1–S3 in Table 3), the simulation results of which are shown in Figure 9.
In scenario 1, the slope experienced eight episodes of instabilities after the formation of the breach, and the slope was cut down to the bottom of the dam. The widths of the initial breaches calculated in scenarios 2 and 3 were 152.82 m and 203.4 m, respectively. The width of the Zhouqu “8.8” debris flow dam is known to be 100–120 m [42] because the land material on both sides of the dam body is different to that of the dam body, although the actual side erosion may be different. This study used simplified processing. In the subsequent calculations, the initial breach width of the two scenarios was set to 120 m, and the undercut erosion still used calculated data. A comparison of the results indicates that the erosion rate of the dam body gradually increased as the inflow of the barrier lake increased.
4.3.2. Dam-Break Flood Simulation under Different Scenarios
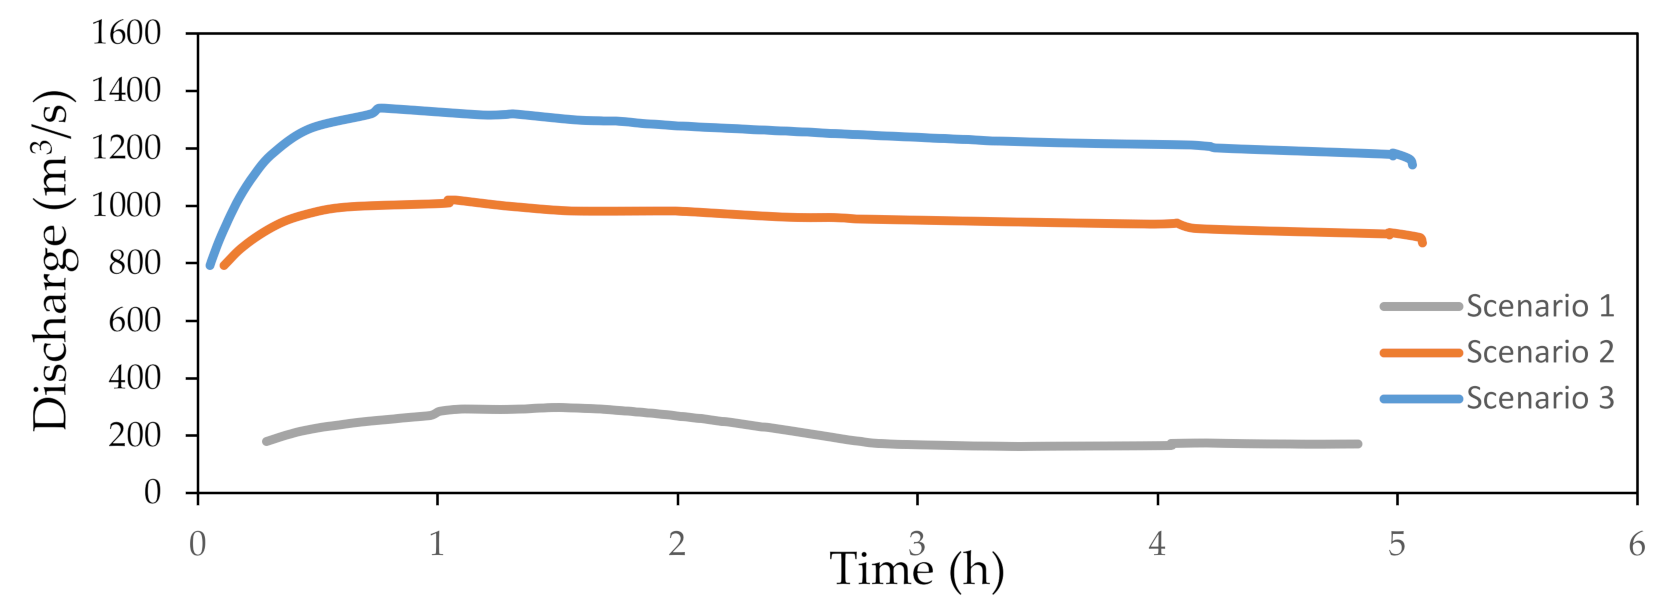
In the analysis of the risk of a barrier dam failure, it is very important to evaluate whether the resultant flood would pose a threat to local residents. The three different scenarios in this study were designed to evaluate the hazards of dam-break floods under different upstream inflow conditions. Figure 10 presents the flow curves of floods formed after the barrier dam breaks under the three scenarios. Table 5 shows the main data of the dam-break flood under the three scenarios.
By comparing scenarios 1 and 2, it can be seen that when the inflow of the barrier lake increased by 506%, the peak discharge of the dam-break flood increased by 243%, while the arrival time of the flood peak reduced by 31%. A comparison of scenarios 1 and 3 reveals that, when the inflow of the barrier lake increased by 707%, the peak flow of the dam break flood increased by 350%, while the arrival time of the flood peak reduced by 50%. With the increase in the inflow of the barrier lake, the peak discharge increased, but the peak arrival time decreased. In scenarios 2 and 3, the flood peak discharge of the dam break flood exceeded the flood control standard of the Zhouqu area at that time (i.e., 897 m3/s) [43]. Considering that August is the main flood season in the Zhouqu area, there is the possibility of heavy rainfall; hence, the Zhouqu “8.8” debris flow dam would present a flood disaster risk after breaking. Therefore, it is necessary to construct a spillway to drain the barrier lake to remove the danger in time.
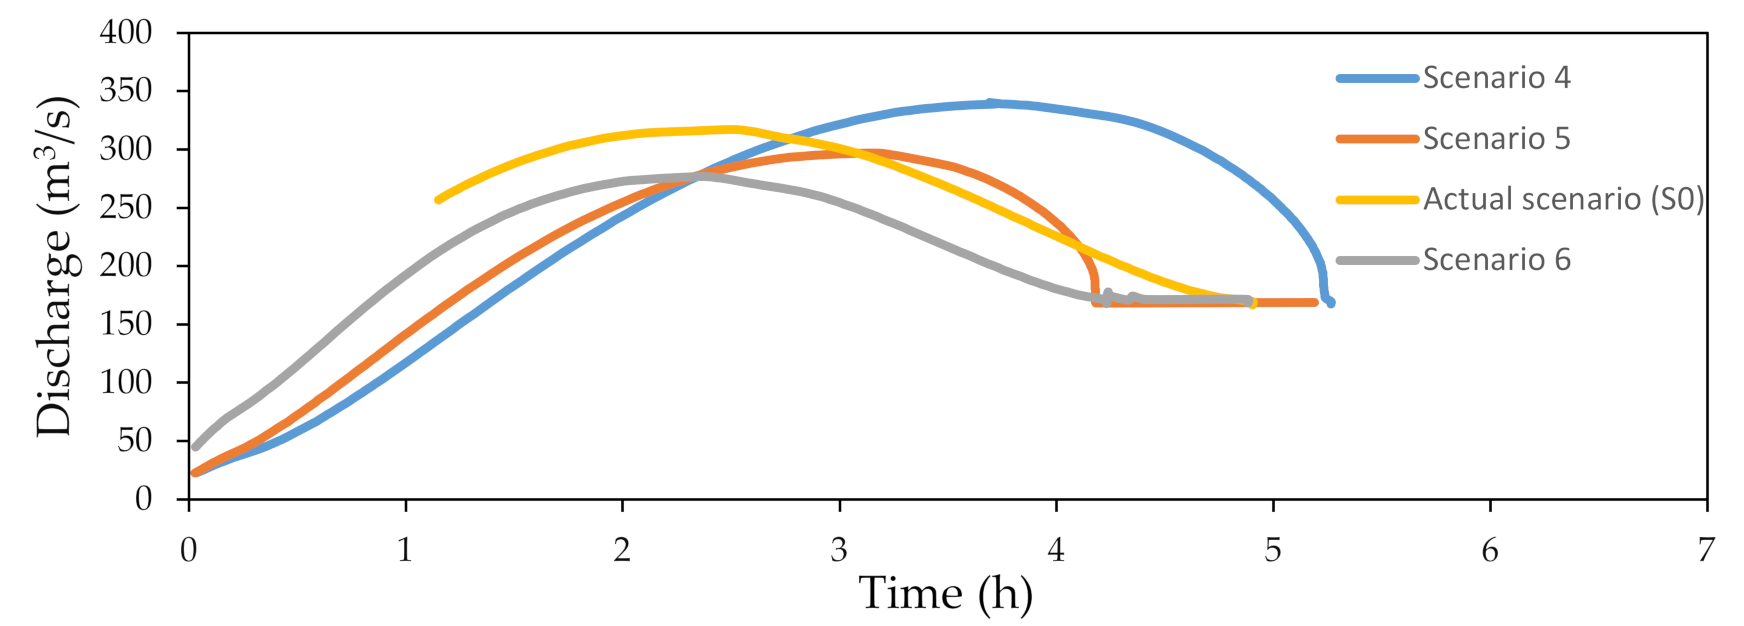
In order to explore the effects that different spillways can achieve, we attempted to determine the best spillway design based on three spillway sizes in scenarios 4, 5, and 6 (Table 3). The designed inflow and water level of the barrier lake under these three scenarios were consistent with the actual flood discharge situation for the purpose of comparison. A comparison of the flood flow process lines produced by scenarios 4, 5, and 6 is shown in Figure 11. Table 6 lists the peak flow of the discharge under the three scenarios and the actual situation.
The simulation results of four different spillway sizes indicate that the shallower the spillway of the same width, the greater the peak discharge and the longer the discharge time. Similarly, the narrower the spillway of the same depth, the greater the peak flood discharge and the longer the discharge time.
4.3.3. Flood Evolution Simulation under Different Scenarios
The flow curve of the dam-break flood obtained from the DB-IWHR was input to the HEC-RAS model to simulate the evolution of the downstream flood. The Zhouqu “8.8” debris flow barrier dam formed near a densely populated area. When the dam breaks, it will have a huge impact on the residents downstream of the dam.
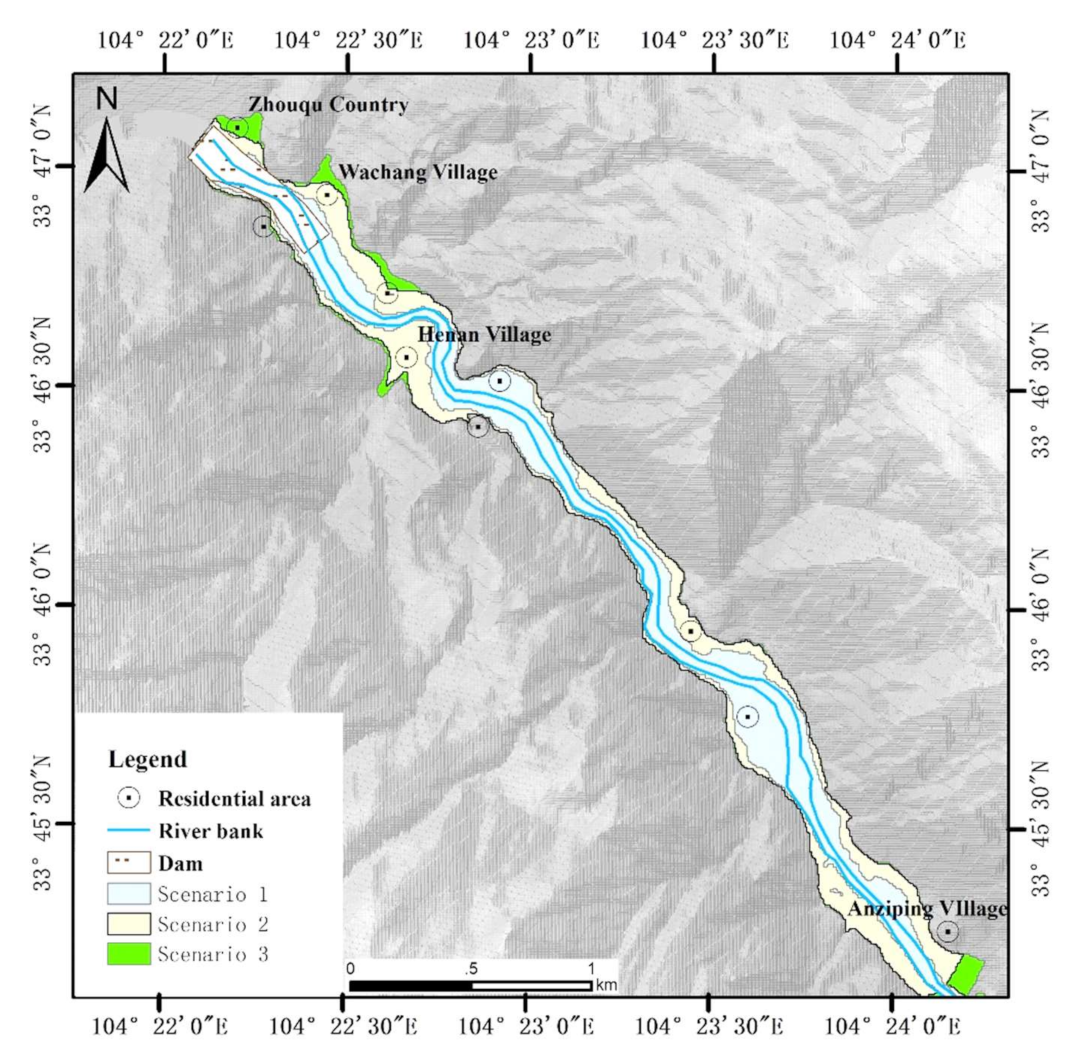
For the simulation of scenarios 1, 2, and 3, the impact range of the flood caused by the failure of the barrier dam under different upstream inflow conditions was obtained to determine the potential disaster area in order to evacuate residents in the risk area in advance. The results are shown in Figure 12 and Table 7.
It can be seen from the results (Figure 12 and Table 7) that, under scenarios 2 and 3, all residential areas near the lower reaches of Zhouqu County would be affected. Even in scenario 1, some residential areas would be flooded. When the upstream inflow increased by 506%, the flooded area within 5 km downstream of the barrier dam increased by 106%, whereas this was 128% when the upstream inflow increased by 707%. Thus, it can be inferred that when the barrier dam breaks, the outburst flood will pose great danger to the people of Zhouqu, and the risk of flooding will increase rapidly with an increase discharge of upstream water.
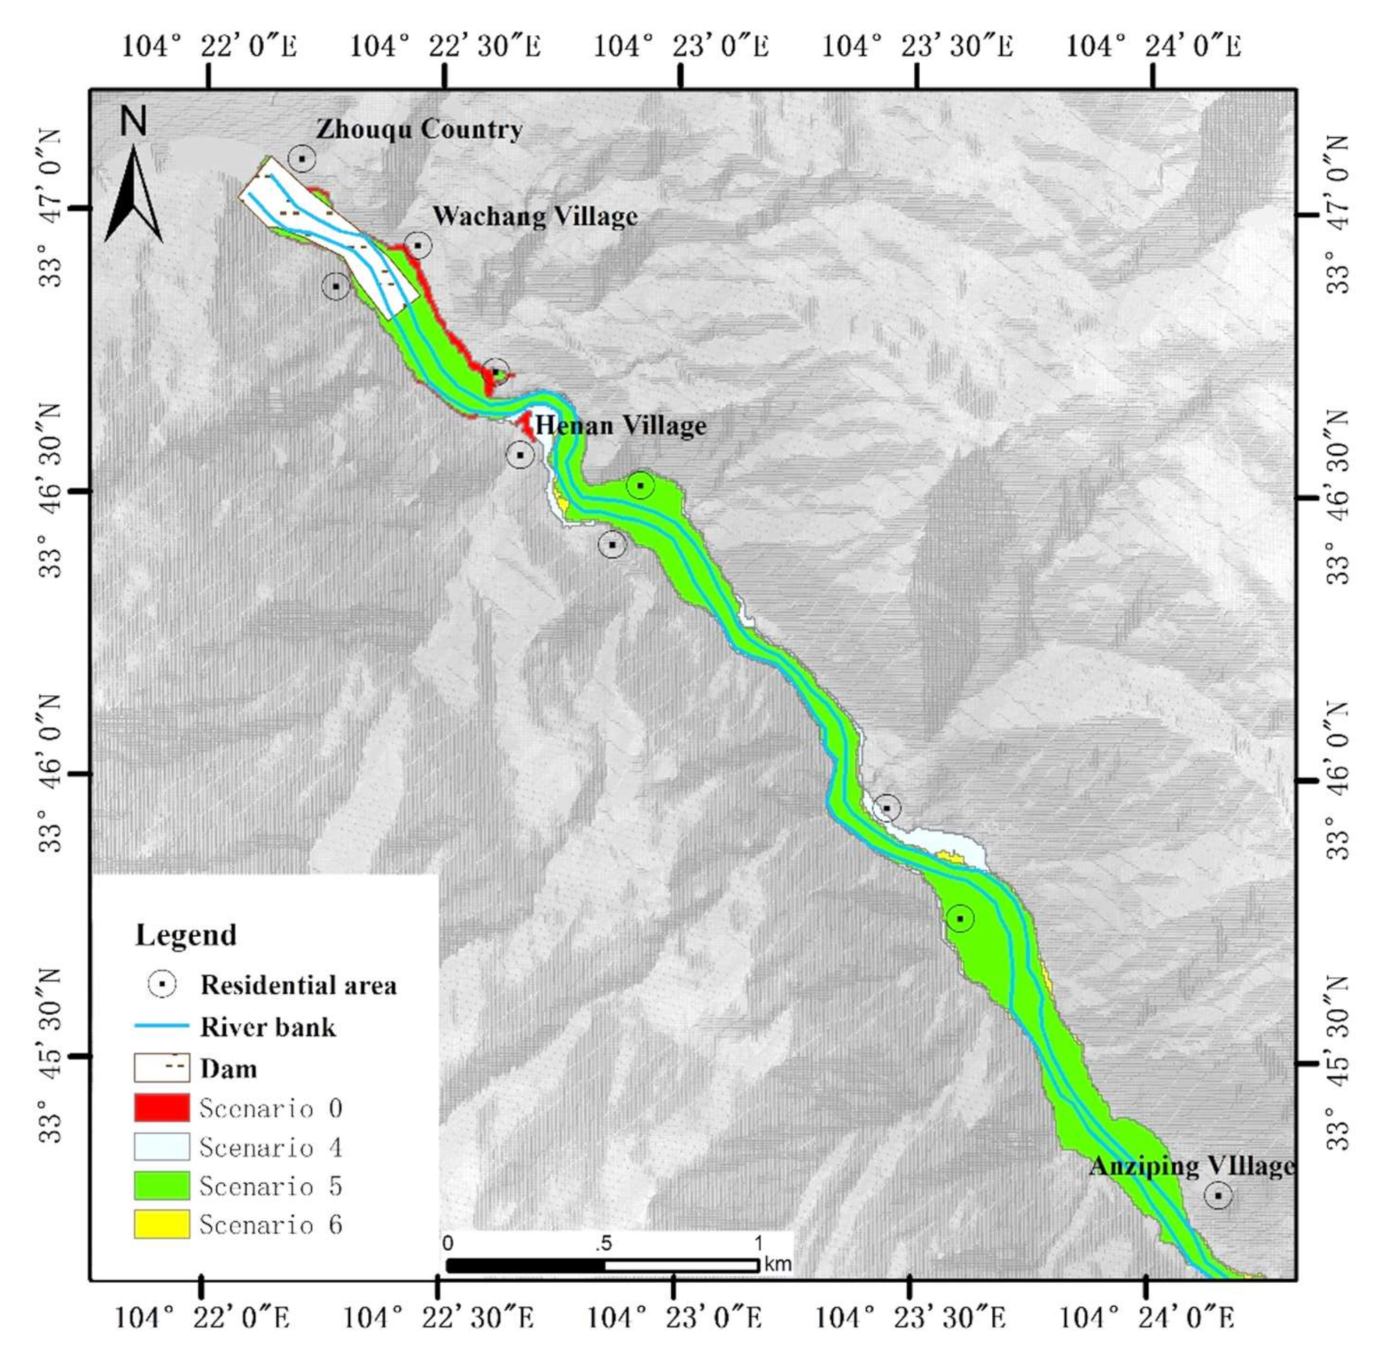
For the simulations of scenarios 4, 5, and 6, we obtained the influence range of the discharge flood downstream under different spillway sizes. Consequently, the simulation results can guide the design of the spillway size, which is helpful for evacuating residents in risk areas before flood discharge. The results are shown in Figure 13 and Table 8.
The results (Figure 13 and Table 8) indicate that man-made damage to the dam and the spillway construction will inevitably cause floods, thus causing the inundation of parts of the downstream area. A comparison of the results reveals that, if the size of the spillway is increased appropriately within a certain range, the downstream flooding area would be reduced.
4.4. Disaster-Affected Population and Economic Losses under Different Scenarios
Taking the 5 km downstream of the barrier dam as an example, the inundation area is within the scope of Chengguan Town in Zhouqu County. Therefore, the total number of people in the simulation area is the total number of people in Chengguan Town in 2011, and the economic production capacity is taken as the gross product of Chengguan Town in 2011, that is, the total number of people is 23,858, and the production capacity is 31,158 million yuan. The calculated results are shown in Table 9.
The results show that under Scenarios 1, 2, and 3, as the upstream inflow of water increases, the impact of the dam break on the downstream area will also increase. When the upstream inflow increases by 506%, the affected population and indirect economic losses within 5 km downstream of the barrier dam will increase by 65.7%; when the upstream inflow increases by 707%, the affected population and indirect economic losses within 5 km downstream of the barrier dam will increase by 90.2%.
5. Discussion
The results presented an analysis of the stability of the Zhouqu “8.8” debris flow dam and reconstructed the entire process of the dam break and outburst flood disaster. According to the evaluation results of the three geomorphological indices, the Zhouqu “8.8” debris flow dam was inferred to be an unstable dam with a high risk of failure. This result has been verified by the existing safety factor. However, compared with the safety factor method, the geomorphology index requires fewer parameters and is easier to obtain, so the geomorphology index method is more suitable for emergency situations. In order to evaluate the possible disasters caused by dam failure under different situations, we simulated different scenarios and formulated a complete debris flow blocking river-outburst flood disaster chain simulation process for the development of the breach, dam-break flood, and flood evolution. By simulating the flood caused by the dam break and the inundation range of the flood under different upstream water conditions, the range of the possible impact of the dam break was estimated. These findings are useful for decision makers to formulate personnel evacuation routes and determine the method of property transfer. In the design of the spillway for the “8.8” debris flow dam, it is necessary not only to ensure that the peak discharge during the flood discharge process is within the flood control standard, but also to gradually expand the flow cross section by using the hydraulic scour ability to accelerate the discharge [43]. The simulation results of different spillway sizes can provide a reference for the relevant departments responsible for the spillway design.
A comparison of the simulation results under different scenarios showed that, as the upstream water inflow increased, the erosion rate of the dam body accelerated, the flow of the dam break flood gradually increased, and the arrival time of the flood peak was gradually reduced. When the inflow of the barrier lake increased by 506%, the peak discharge of the dam-break flood increased by 243%, while the arrival time of the flood peak reduced by 31%. When the inflow of the barrier lake increased by 707%, the peak discharge of the dam-break flood increased by 350%, while the arrival time of the flood peak reduced by 50%. The increase in the peak discharge and shortening of the peak arrival time would increase the flood risk. Hence, if the inflow of the barrier lake increases, the flood that would form after the dam break would be larger and more urgent, thereby greatly increasing the flood risk. The simulation of the flood inundation range quantitatively revealed the danger of flooding. When the inflow of the barrier lake increased by 506%, the inundation area of the flood within 5 km downstream of the barrier dam increased by 106%, whereas this was 128% when the inflow of the barrier lake increased by 707%. Combining the inundation area of the flood and the population economic data of Zhouqu can intuitively express the impact of the dam-break flood disaster on the downstream residents, and evaluate the potential risks. When the inflow of the barrier lake increases by 506%, the affected population and indirect economic loss within 5 km downstream of the barrier dam will increase by 65.7%, and when the upstream inflow increases by 707%, the affected population and indirect economic loss within 5 km downstream of the barrier dam will increase by 90.2%. Therefore, the results indicate that the hazard of a dam-break flood would increase rapidly with an increased inflow.
For the simulation of different spillway sizes, under the same upstream inflow, increasing the spillway size appropriately could reduce the peak flood discharge and reduce the submerged area downstream. However, increasing the spillway size would mean that it would not be conducive to narrowing the river bed to form a scouring along the way. Therefore, the design of the spillway size is very important for flood discharge and river channel dredging. According to the flood evolution simulation results of different spillway sizes, suitable discharge channels can be determined.
The key to the dam failure risk analysis system established in this study is to use the combined geomorphological index method to judge dam stability, and to simulate and predict the possible impact of disasters through multi-model coupling. The advantage of the geomorphological index method is that it can quickly determine the stability of a barrier dam. In addition, the multi-model coupling method can quickly reconstruct the entire process of debris flow barrier dam failure and the resultant flood disaster. DBS-IWHR simulates the failure expansion process caused by slope instability. The accurate simulation of failure development is a very difficult to achieve, and the simplified Bishop method adopted by DBS-IWHR is the widely accepted sliding surface analysis method in geotechnical engineering. In practical applications, DBS-IWHR simplifies the circular slip surface to the straight slip surface, which makes the calculations more convenient and faster under the condition of less influence on accuracy [35]. Moreover, DB-IWHR has a high accuracy for simulating the actual spillway discharge flood. The flood evolution simulation of HEC-RAS offers an intuitive display of the disaster area caused by a dam-break flood. The advantage of the failure risk analysis system used in this study is that the calculation is simple, the simulation accuracy is high, and the results can be obtained relatively quickly in an emergency state, which is very important.
6. Conclusions
The Zhouqu debris flow was used as an example in this work to assess dam stability based on the geomorphological index method. Different models (DBS-IWHR, DB-IWHR, and HEC-RAS) were coupled to simulate dam failure, and to quantitatively analyze the influences of river discharge and spillway size on the dam failure process and scope of the flood disaster. A comprehensive analysis of the failure risk of the Zhouqu “8.8” debris flow dam was realized. The main conclusions are as follows:
(1) The results of the three geomorphological indices indicated that the Zhouqu “8.8” debris flow dam is unstable.
(2) The simulated peak discharge flow of the actual spillway was 317.15 m3/s, which was basically consistent with the actual discharge of 316 m3/s. The model coupling system revealed that, when the inflow of the barrier lake increased by 506% and 707%, the dam-break peak discharge increased by 243% and 350%, respectively, the peak arrival time decreased by 31% and 50%, respectively, and the submerged area increased by 106% and 128%, respectively, and the affected population and indirect economic losses increased by 65.7% and 90.2%, respectively. Under the same upstream inflow, increasing the spillway size appropriately could reduce the peak flood discharge and reduce the submerged area downstream; however, it is not conducive to dredging and restoring the river channel.
(3) This study comprehensively reconstructed the entire process of the failure of debris flow dam-outburst floods disaster chain from the evolution process of barrier dam failure and outburst flooding, and established a rapid quantitative evaluation and analysis system for the risk of such disasters. Taking Zhouqu as an example, the results indicated the instability of the dam body and the magnitude of the impact of an outburst flood. The established risk analysis system for barrier dam failure and flooding provide reference for emergency response, decision making, and risk management relating to the disaster chain of debris flows blocking rivers in the Bailong River basin and similar areas.
Author Contributions
H.Y. and G.C. designed this study, performed the main analysis, and wrote the paper; Y.C. was mainly involved in the discussion; J.J. contributed to the revising of the manuscript; W.S. contributed significantly to the field investigation. All authors have read and agreed to the published version of the manuscript.
Funding
This study was jointly supported by the National Key Research and Development Program of China (Grant No. 2017YFC1501005), the National Natural Science Foundation of China (Grant Nos. 41702292 and 42007232), the Science and Technology Major Project of Gansu Province (Grant No. 19ZD2FA002), the Featured Demonstration Project of Sea Wisdom Plan of Gansu Province (Grant No. GSHZ 2020-02) and the Fundamental Research Funds for the Central Universities (Grant No. lzujbky-2020-kb49).
Institutional Review Board Statement
Not applicable.
Informed Consent Statement
Not applicable.
Data Availability Statement
Not applicable.
Acknowledgments
We would like to acknowledge Shiqiang Bian and Yunpeng Yang for their help in the data processing and field investigation.
Conflicts of Interest
The authors declare no conflict of interest.
References
- Tang, Y.; Li, J.; Li, R.; Qu, J.; Zeng, Y. The risk assessment for Sanyanyu debris flow, Zhouqu. Northwest. Geol. 2011, 44, 80–86. (In Chinese) [Google Scholar]
- Zhuang, J.; Ge, Y.; Chen, X. Assessment of river block probability by debris flow along Dujiangyan-Wenchuan highway after Wenchuan earthquake. J. Eng. Geol. 2012, 20, 195–203. (In Chinese) [Google Scholar]
- Zhang, Y.; Chen, X.; You, Y.; Li, K. Activity characteristics and disaster control of Xiaojia gully debris flow after Wenchuan earthquake. Water Soil Conserv. Bull. 2014, 34, 284–289. (In Chinese) [Google Scholar]
- Dowling, C.A.; Santi, P.M. Debris flows and their toll on human life: A global analysis of debris-flow fatalities from 1950 to 2011. Nat. Hazard. 2014, 71, 203–227. [Google Scholar] [CrossRef]
- Pasuto, A.; Soldati, M. An integrated approach for hazard assessment and mitigation of debris flows in the Italian Dolomites. Geomorphology 2003, 61, 59–70. [Google Scholar] [CrossRef]
- Chen, H.X.; Zhang, L.M. EDDA 1.0: Integrated simulation of debris flow erosion, deposition and property changes. Geosci. Model. Develop. 2015, 8, 829–844. [Google Scholar] [CrossRef] [Green Version]
- Chen, C.; Zhang, L.; Xiao, T.; He, J. Barrier lake bursting and flood routing in the Yarlung Tsangpo Grand Canyon in October 2018. J. Hydrol. 2019, 58, 124603. [Google Scholar] [CrossRef]
- Tong, L.; Tu, J.; Pei, L.; Guo, Z.; Zheng, X.; Fan, J.; Zhong, C.; Liu, C.; Wang, S.; He, P.; et al. Preliminary discussion of the frequently debris flow events in Sedongpu basin at Gyalaperi peak, Yarlung Zangbo River. J. Eng. Geol. 2018, 26, 1552–1561. (In Chinese) [Google Scholar]
- Meng, X.; Chen, G.; Guo, P.; Xiong, M.; Wasowski, J. Research of landslides and debris flows in Bailong River basin: Progress and prospect. Marine Geol. Quatern. Geol. 2013, 33, 1–15. (In Chinese) [Google Scholar] [CrossRef]
- Xie, Y.; Qi, S.; Zhang, Y.; Gong, J.; Chen, G. Evaluation of the hazard scale for the main ecological risk sources in the Bailong River wastershed. J. Lanzhou Univ. 2016, 52, 634–638, 643. (In Chinese) [Google Scholar]
- Zhao, Y. Study on the Regularity of Debris Flow Distribution and Influence Factors in Bailong River Basin. Master’s Thesis, Lanzhou University, Lanzhou, China, 2013. (In Chinese). [Google Scholar]
- Cui, P. Advances in debris flow prevention in China. Sci. Soil Water Conserv. 2009, 7, 7–13, 31. (In Chinese) [Google Scholar]
- Tacconi Stefanelli, C.; Catani, F.; Casagli, N. Geomorphological investigations on landslide dams. Geoenviron. Disasters 2015, 2, 1–15. [Google Scholar] [CrossRef] [Green Version]
- Evans, S.G.; Hermanns, R.L.; Strom, A.; Scarascia Mugnozza, G. Natural and Artificial Rockslide Dams; Springer Science & Business Media: Berlin, Germany, 2011. [Google Scholar]
- Cao, C. Experimental Study on the Breaching Processes of Debris Flow Dams. Master’s Thesis, University of Chinese Academy of Sciences, Beijing, China, 2020. (In Chinese). [Google Scholar]
- Dang, C.; Cheng, Z.; Liu, J. Model test of debris-flow dam break. J. Catastrophol. 2008, 23, 15–19, 26. (In Chinese) [Google Scholar]
- Li, J.; Huang, J.; Luo, L. Experimental Study on Influence Factors for Burst Rate of Barrier Dams. Yellow River 2012, 34, 8–11. (In Chinese) [Google Scholar]
- Hu, K.; Cui, P.; Tian, M.; Yang, H. A review of the debris flow dynamic models and numerical simulation. J. Hydraul. Eng. 2012, 43, 79–84. (In Chinese) [Google Scholar]
- Cao, C.; Chen, H.; Robin, N. Review on barrier dam of debris flow. Yangtze River 2020, 51, 36–41. (In Chinese) [Google Scholar]
- Singh, V.P.; Scarlatos, P.D. Analysis of Gradual Earth-Dam Failure. J. Hydraul. Eng. 1988, 114, 21–42. [Google Scholar] [CrossRef]
- Chen, Z.; Ma, L.; Yu, S.; Chen, S.; Zhou, X.; Sun, P.; Li, X. Back Analysis of the Draining Process of the Tangjiashan Barrier Lake. J. Hydraul. Eng. 2014, 141, 05014011. [Google Scholar] [CrossRef]
- Fu, X.; Liu, F.; Ma, H.; Wang, G. Physically based simulation of the breaching of the Tangjiashan Quake Lake. J. Tsinghua Univ. 2010, 50, 1910–1914. (In Chinese) [Google Scholar]
- Xu, Y.; Zhang, L. Breaching parameters for earth and rockfill dams. J. Geotech. Geoenviron. Eng. 2009, 135, 1957–1970. [Google Scholar] [CrossRef]
- Thornton, C.I.; Pierce, M.W.; Abt, S.R. Enhanced predictions for peak outflow from breached embankment dams. J. Hydrol. Eng. 2011, 16, 81–88. [Google Scholar] [CrossRef]
- Hooshyaripor, F.; Tahershamsi, A.; Golian, S. Application of copula method and neural networks for predicting peak outflow from breached embankments. J. Hydro-Environ. Res. 2014, 8, 292–303. [Google Scholar] [CrossRef]
- IPCC. A Special Report of Working Groups I and II of the Intergovernmental Panel on Climate Change; Cambridge University Press: Cambridge, UK, 2012; pp. 1–19. [Google Scholar]
- Ha, S.; Zhang, J.; Tong, S.; Li, S. Progress and prospect of the research on disaster chain. J. Catastroph. 2016, 31, 131–138. (In Chinese) [Google Scholar]
- Hydrologic Engineering Center. HEC-RAS: River Analysis System User’s Manual; Version 5.0; Army Corps of Engineers: Davis, CA, USA, 2016. [Google Scholar]
- DHI Water Environment. A Modelling System for Rivers and Channels User Guide; MIKE Documentation; DHI Group: New York, NY, USA, 2012. [Google Scholar]
- Liu, L.; Xu, Z. Hydro-dynamical simulation of flood in the Taihu basin. J. Beijing Normal Univ. 2012, 48, 530–536. (In Chinese) [Google Scholar]
- Li, Q. Numerical Simulation of Cascade Earth-Rock Dam Breach. Master’s Thesis, Zhengzhou University, Zhengzhou, China, 2017. (In Chinese). [Google Scholar]
- Fan, X.; Xu, Q.; Alonso-Rodriguez, A.; Subramanian, S.S.; Li, W.; Zheng, G.; Dong, X.; Huang, R. Successive landsliding and damming of the Jinsha River in eastern Tibet, China: Prime investigation, early warning, and emergency response. Landslides 2019, 16, 1003–1020. [Google Scholar] [CrossRef]
- Fan, X.; Fan, Y.; Subramanian, S.S.; Xu, Q.; Feng, Z.; Mavrouli, O.; Peng, M.; Ouyang, C.J.; Jansen, J.D.; Huang, R. Prediction of a multi-hazard chain by an integrated numerical simulation approach: The Baige landslide, Jinsha River, China. Landslides 2019, 17, 147–164. [Google Scholar] [CrossRef]
- Chen, Z.; Ping, Z.; Wang, N.; Yu, S.; Chen, S. An approach to quick and easy evaluation of the dam breach flood. Sci. China 2019, 62, 1773–1782. [Google Scholar] [CrossRef]
- Wang, L.; Chen, Z.; Wang, N.; Sun, P.; Yu, S.; Li, S.; Du, X. Modeling lateral enlargement in dam breaches using slope stability analysis based on circular slip mode. Eng. Geol. 2016, 209, 70–81. [Google Scholar] [CrossRef]
- Zhou, X.; Chen, Z.; Yu, S.; Wang, L.; Deng, G.; Sha, P.; Li, S. Risk analysis and emergency actions for Hongshiyan Barrier Lake. Nat. Hazard. 2015, 79, 1933–1959. [Google Scholar] [CrossRef]
- Chen, S.; Chen, Z.; Tao, R.; Yu, S.; Xu, W.; Zhou, X.; Zhou, Z. Emergency response and back analysis of the failures of earthquake triggered cascade landslide dams on the Mianyuan River, China. Nat. Hazard. Rev. 2018, 19, 05018005. [Google Scholar] [CrossRef]
- Cai, Y.; Cheng, H.; Wu, S.; Yang, Q.; Wang, L.; Luan, Y.; Chen, Z. Breaches of the Baige barrier Lake: Emergency response and dam breach flood. Sci. China Technol. Sci. 2020, 63, 571–584. [Google Scholar] [CrossRef]
- Wang, J.; Li, G.; Yao, C. Prevention measures for debris flow disaster in Luojiayu of Zhouqu country. Gansu Geol. 2012, 21, 37–42. (In Chinese) [Google Scholar]
- Zhang, N. Study on Formation Mchanism and Comprehensive Prevention of Debris Flow Disasters in Sanyanyu Valley, Zhouqu. Ph.D. Thesis, China University of Geosciences, Wuhan, China, 2018. (In Chinese). [Google Scholar]
- Guo, P. The Formation Mechanism of Debris Flow in Bailong River Basin. Ph.D. Thesis, Lanzhou University, Lanzhou, China, 2015. (In Chinese). [Google Scholar]
- Tao, R.; Tian, W. Construction technology of emergency dredging and emergency dredging of river of the Bailong River barrier lake in Zhouqu, Gansu. Sichuan Water Power 2011, 30, 1–8. (In Chinese) [Google Scholar]
- Liu, N. Disaster reduction project management on barrier risk eliminating and emergency dredging of Bailong. Chinese Eng. Sci. 2011, 13, 25–30, 55. (In Chinese) [Google Scholar]
- Wang, W.; Hu, Z. Stability analysis of Zhouqu mudslide dam and emergency plan study. Water Power 2019, 45, 33–35. (In Chinese) [Google Scholar]
- Stefanelli, C.T.; Segoni, S.; Casagli, N.; Catani, F. Geomorphological Analysis for Landslide Dams; CRC Press-Balkema: Leiden, The Netherlands, 2016; pp. 1883–1887. [Google Scholar]
- Stefanelli, C.T.; Vilímek, V.; Emmer, A.; Catani, F. Morphological analysis and features of the landslide dams in the Cordillera Blanca, Peru. Landslides 2018, 15, 507–521. [Google Scholar] [CrossRef] [Green Version]
- Ermini, L.; Casagli, N. Prediction of the behaviour of landslide dams using a geomorphological dimensionless index. Earth Surf. Process. Landf. 2003, 28, 31–47. [Google Scholar] [CrossRef]
- Braun, A.; Cuomo, S.; Petrosino, S.; Wang, X.; Zhang, L. Numerical SPH analysis of debris flow run-out and related river damming scenarios for a local case study in SW China. Landslides 2018, 15, 535–550. [Google Scholar] [CrossRef]
- Swanson, F.J.; Oyagi, N.; Tominaga, M. Landslide dams in Japan. In Landslide Dams: Processes Risk and Mitigation; Geotechnical Special Publication; Schuster, R.L., Ed.; American Society of Civil Engineering: New York, NY, USA, 1986; Volume 3, pp. 131–145. [Google Scholar]
- Stefanelli, C.T.; Segoni, S.; Casagli, N.; Catani, F. Geomorphic indexing of landslide dams evolution. Eng. Geol. 2016, 208, 1–10. [Google Scholar] [CrossRef] [Green Version]
- Wang, Z. Technical Practice of Emergency Removal and Flood Control Engineering Construction of Bailong River Barrier Channel in Zhouqu. Water Plan. Design 2013, 2, 52–54, 74. (In Chinese) [Google Scholar]
- Liu, N.; Yang, Q.; Chen, Z. Barrier Lake Risk Treatment; Changjiang Publishing House: Wuhan, China, 2016; pp. 362–364. (In Chinese) [Google Scholar]
- Zhao, Y. Dam Breaking Flood Analysis and Evolution Method Based on DB-IWHR and HEC-RAS Model. Master’s Thesis, Xi’an University of Technology, Xian, China, 2019. (In Chinese). [Google Scholar]
- Li, X.; Chen, Z. Comparison of two models for back analysis of dam breach of Tangjiashan Barrier Lake. Adv. Sci. Technol. Water Resour. 2017, 37, 20–26. (In Chinese) [Google Scholar]
- Chen, Z.; Chen, S.; Wang, L.; Zhang, Q. Analysis of earth-rock dam break flood: Theory and calculation program. Hydro Sci. Cold Zone Eng. 2019, 2, 12–19. (In Chinese) [Google Scholar]
- Fu, J.; Jiang, D.; Huang, Y. China’s kilometer grid population distribution dataset. Acta Geogr. Sin. 2014, 69, 41–44. [Google Scholar]
- Costa, J.E.; Schuster, R.L. The formation and failure of natural dam. Geol. Soc. Am. Bull. 1988, 100, 1054–1068. [Google Scholar] [CrossRef]
- Chai, H.; Liu, H.; Zhang, Z. New Progress of the study of landside damming and its environment effects. Geol. Sci. Technol. Inf. 2000, 19, 87–90. (In Chinese) [Google Scholar]
- Peng, W.; Guan, X. Emergency monitoring and calculation of storage capacity of Zhouqu debris flow barrier lake. Yangtze River 2011, 42, 38–41. (In Chinese) [Google Scholar]
Figure 1.
Location of the study area: (A) location of Gansu Province in China; (B) map of Gansu Province with the location of Zhouqu County; (C) topographic map of Zhouqu County.
Figure 1.
Location of the study area: (A) location of Gansu Province in China; (B) map of Gansu Province with the location of Zhouqu County; (C) topographic map of Zhouqu County.

Figure 2.
Zhouqu “8.8” debris flow: (a) before the disaster, (b) after the disaster, (c) and (d) flood scenes of Zhouqu (photograph credit: Internet).
Figure 2.
Zhouqu “8.8” debris flow: (a) before the disaster, (b) after the disaster, (c) and (d) flood scenes of Zhouqu (photograph credit: Internet).

Figure 3.
(A) Bailong River Water System Map (partial area); (B) Longitudinal profile of Bailong River bed (Zhouqu County Section).
Figure 3.
(A) Bailong River Water System Map (partial area); (B) Longitudinal profile of Bailong River bed (Zhouqu County Section).

Figure 4.
Precipitation leading up to Zhouqu debris flow as measured at Dongshan and Zhouqu rainfall station.
Figure 4.
Precipitation leading up to Zhouqu debris flow as measured at Dongshan and Zhouqu rainfall station.

Figure 5.
Satellite images of the barrier lake before and after the disaster: (A) Before the disaster; (B) after the disaster (photograph credit: National Geomatics Center of China).
Figure 5.
Satellite images of the barrier lake before and after the disaster: (A) Before the disaster; (B) after the disaster (photograph credit: National Geomatics Center of China).

Figure 6.
Analysis flow chart of barrier dam failure. DBS-IWHR and DB-IWHR are the abbreviations of China Institute of Water Resources and Hydropower Research’s Dam Breach Slope and China Institute of Water Resources and Hydropower Research’s Dam Breach, respectively. HEC-RAS represents Hydrologic Engineering Center’s River Analysis System. DEM stands for Digital Elevation Model.

Figure 7.
Barrier lake water level versus storage capacity.

Figure 8.
Simulated flow curve for the actual situation (S0) under different indices.

Figure 9.
Slip surface during the development of the breach under three scenarios: (a) scenario 1; (b) scenario 2; (c) scenario 3.
Figure 9.
Slip surface during the development of the breach under three scenarios: (a) scenario 1; (b) scenario 2; (c) scenario 3.

Figure 10.
Dam-break flood flow curve under scenarios 1, 2, and 3.

Figure 11.
Flow curve of scenarios 4, 5, and 6, and the actual scenario (S0).

Figure 12.
Flooding range map for scenarios 1, 2, and 3.

Figure 13.
Inundation range of floods under different spillways.


Table 1.
Geometric and material parameters of the barrier dam in the study area a).
| Dam Stability | Dam Volume, V1 (m3) | Upstream Catchment Area Ab (km2) | Dam Width, Wv (m) | Gradient of River Bed, S |
| 1,400,000 [42] | 10,162.3086 | 120 [42] | 0.0153 | |
| Dam break | Friction angle (°) | Cohesion (kPa) | Dry density (kN/m3) | Saturation density (kN/m3) |
| 12 [44] | 10 [44] | 23 | 26.5 [44] | |
| Outburst flood | Initial reservoir water level H0 (m) | Initial storage capacity, (m3) | Comprehensive flow coefficient, C | Ratio of tailwater, m |
| 1337 | 1,500,000 | 1.43 | 0.8 | |
| Erosion coefficient a | Erosion coefficient b | |||
| 1.1 | 0.0009 | |||
Table 2.
Geomorphic index evaluation methods.
| Geomorphology Index | Formula | Stable Domain | Uncertainty Domain | Unstable Domain |
|---|---|---|---|---|
| Blockage Index | >5.68 | 3.00–5.68 | <3.00 | |
| Morphological Obstruction Index | >4.60 | 3.00–4.60 | <3.00 | |
| Hydromorphological Dam Stability Index | >7.44 | 5.74–7.44 | <5.74 |
Table 3.
Designed scenarios b).
| Upstream Water (m3/s) | Bottom Width of Spillway (m) | Depth of Spillway (m) | |
|---|---|---|---|
| Actual scenario (S0) | 170 | 20 | 4 |
| Scenario 1 (S1) | 140 | / | / |
| Scenario 2 (S2) | 849 | / | / |
| Scenario 3 (S3) | 1130 | / | / |
| Scenario 4 (S4) | 170 | 10 | 4 |
| Scenario 5 (S5) | 170 | 10 | 7 |
| Scenario 6 (S6) | 170 | 20 | 7 |
b) The symbol “/” means no spillway.
Table 4.
Geomorphological indices results.
| Geomorphology Index | Result | Corresponding Domain of Existence |
|---|---|---|
| Blockage Index | 2.14 | Unstable domain |
| Morphological Obstruction Index | 4.06 | Uncertainty domain |
| Hydromorphological Dam Stability Index | 3.96 | Unstable domain |
Table 5.
Main simulation results of scenarios 1, 2, and 3.
| Scenarios | Peak Flow of Dam-Break Flood (m3/s) | Flood Peak Arrival Time (h) |
|---|---|---|
| Scenario 1 | 297.85 | 1.51 |
| Scenario 2 | 1020.67 | 1.04 |
| Scenario 3 | 1339.52 | 0.75 |
Table 6.
Peak discharges of scenarios 4, 5, and 6, and the actual situation (S0).
| Scenarios | Peak Discharge Flood (m3/s) |
|---|---|
| Scenario 4 | 340.11 |
| Scenario 5 | 297.13 |
| Scenario 6 | 276.77 |
| Actual scenario (S0) | 317.15 |
Table 7.
Submerged area of scenarios 1, 2, and 3.
| Scenarios | Submerged Area Within 5 Kilometers Downstream of the Barrier Dam (km2) |
|---|---|
| Scenario 1 | 0.3932 |
| Scenario 2 | 0.8100 |
| Scenario 3 | 0.8974 |
Table 8.
Submerged area of scenarios 0, 4, 5, and 6.
| Scenarios | Submerged Area Within 5 Kilometers Downstream of the Barrier Dam (km2) |
|---|---|
| Scenario 0 | 0.4267 |
| Scenario 4 | 0.4416 |
| Scenario 5 | 0.4005 |
| Scenario 6 | 0.4065 |
Table 9.
Disaster-affected population and economic losses under different scenarios.
| Scenarios | The Affected Population in the Submerged Area 5 km Downstream of the Barrier Dam | The Economic Losses in the Submerged Area 5 km Downstream of the Barrier Dam (Thousand Yuan) |
|---|---|---|
| 1 | 432 | 564 |
| 2 | 716 | 935 |
| 3 | 822 | 1073 |
Publisher’s Note: MDPI stays neutral with regard to jurisdictional claims in published maps and institutional affiliations. |
© 2021 by the authors. Licensee MDPI, Basel, Switzerland. This article is an open access article distributed under the terms and conditions of the Creative Commons Attribution (CC BY) license (http://creativecommons.org/licenses/by/4.0/).
Share and Cite
MDPI and ACS Style
Yang, H.; Chen, G.; Chong, Y.; Jin, J.; Shi, W. Quantitative Prediction of Outburst Flood Hazard of the Zhouqu “8.8” Debris Flow-Barrier Dam in Western China. Water 2021, 13, 639. https://doi.org/10.3390/w13050639
AMA Style
Yang H, Chen G, Chong Y, Jin J, Shi W. Quantitative Prediction of Outburst Flood Hazard of the Zhouqu “8.8” Debris Flow-Barrier Dam in Western China. Water. 2021; 13(5):639. https://doi.org/10.3390/w13050639
Chicago/Turabian StyleYang, Heyi, Guan Chen, Yan Chong, Jiacheng Jin, and Wei Shi. 2021. "Quantitative Prediction of Outburst Flood Hazard of the Zhouqu “8.8” Debris Flow-Barrier Dam in Western China" Water 13, no. 5: 639. https://doi.org/10.3390/w13050639
Note that from the first issue of 2016, this journal uses article numbers instead of page numbers. See further details here.