
The Drought Variability Based on Continuous Days without Available Precipitation in Guizhou Province, Southwest China
by
N.X. Qin
1,2, 
J.N. Wang
1,2,*,
Y. Hong
3,
Q.Q. Lu
1,2,
J.L. Huang
1,2,
M.H. Liu
1,2 and
L. Gao
4,5,* 1
Key Laboratory of Beibu Gulf Environment Change and Resources Use, Ministry of Education, Nanning Normal University, Nanning 530001, China
2
School of Geosciences and Planning, Nanning Normal University, Nanning 530001, China
3
School of Civil Engineering and Environmental Science, University of Oklahoma, Norman, OK 73019-3072, USA
4
State Key Laboratory of Internet of Things for Smart City and Department of Civil and Environmental Engineering, University of Macau, Macau 999078, China
5
Center for Ocean Research in Hong Kong and Macau (CORE), Macau 999078, China
*
Authors to whom correspondence should be addressed.
Water 2021, 13(5), 660; https://doi.org/10.3390/w13050660
Submission received: 9 January 2021
/
Revised: 4 February 2021
/
Accepted: 5 February 2021
/
Published: 28 February 2021
(This article belongs to the Special Issue Management of Hydro-Meteorological Hazards)
Abstract
:Detecting the characteristics and variability of droughts is of crucial importance. In this study, Guizhou Province in China is selected as the target area, and the dataset there covering daily precipitation and drought records from 1960 to 2016 is adopted. The spatial and temporal differences in yearly and seasonal Dnp (the drought indicator of continuous days without available precipitation) values and longest Dnp as well as their trends are examined. Then the Dnp values and droughts are classified into different categories, and the relationships between Dnp and droughts are revealed. There was a steep increasing trend in yearly Dnp with a rate of 6 d/10a, and the Mann–Kendall (MK) value was estimated to be 5.05 in the past 56 years. The seasonal Dnp values showed significant increasing trends. Yearly and seasonal Dnp varied significantly in the space domain. There were slight increases in yearly and four seasonal longest Dnp values in the time domain. Although the increases in the spring and summer were not significant, heavy droughts tended to occur at this time. As to the Dnp values corresponding to different levels of droughts, there was only a decrease in mild drought, while there were significant increases in mild, moderate, and heavy droughts. The mild droughts increased significantly in summer, and the moderate droughts increased significantly in spring. Different levels of Dnp also varied in the spatial domain. The elevation effect is not obvious in Guizhou province.
1. Introduction
Under a changing climate, both the frequency and intensity of extreme weather events are increasing substantially worldwide, posing high risks to people’s safety and social sustainability. Among the losses caused by various meteorological disasters, the losses caused by drought make up a large proportion [1]. Due to its high frequency, long duration, and wide range, drought disaster may cause huge losses to the agricultural production and social economy [2]. It may even force people to temporarily reduce dependency on local resources or to relocate to a different location [3,4]. Therefore, it has been receiving world-wide attention, and much research has been conducted on droughts from different continents [5,6,7,8,9,10], including basic scientific research [11], drought identification [12], drought indicators [13,14], drought monitoring [13], drought planning, and prediction and mitigation [15], as well as studies on how to mitigate drought [16] and assessment [17].
The root cause of drought is little precipitation for a long time and/or increased evapotranspiration [9]. However, identifying or quantifying drought hazards is not that easy, due to the diverse spatial and temporal distribution and the demand placed on water supply by human-used systems [18]. In general, the drought conditions are usually measured or assessed through drought indicators [19], which are developed as the most fundamental components to quantitatively measure drought characteristics, such as severity and spatial extent [20,21]. Due to the differences in climatic and geographical environment, it is hard to adopt an identical indicator in different areas. Therefore, many indexes for assessing droughts are proposed, such as Standardized Precipitation Index (SPI), Streamflow Drought Index (SDI), and Normalized Vegetation Supply Water Index (NVSWI), which can also be synthesized into a single indicator [13,14].
Guizhou province is selected as the target area, and the drought indicator of continuous days without available precipitation (Dnp) is adopted to detect the drought changes. Guizhou province has abundant rainfall, but the distribution is extremely uneven in the time and space domains. In addition, Guizhou has special karst landform structure. Due to the thin soil layer and the poor vegetation in a karst region [22], the water cannot easily be stored where the ecological environment is vulnerable without effective precipitation for a long period. In addition, the rising temperature [23,24] is also recognized as one of the main factors causing drought disaster in the southwest of China. For example, the severe droughts during 2006 and 2009–2010 were caused by decreases in the precipitation and anomalous high temperatures, leading to drastic decreases of soil moisture. Other factors, such as the karst topography, the uneven distribution of water resources, the effects of warming, and anthropogenic impacts in the region, will also aggravate the droughts [25,26]. Global climatic change may also lead to further aggravation of droughts. Under a warming climate, the precipitation in Guizhou was predicted to be decreasing slightly, while the temperature is increasing significantly [23]. Extreme weather events, such as drought and flood, occurred frequently in recent years [25,27]. The high temperature is one of the root causes of drought in the region [24]. The region is becoming warmer and drier in general [25,27,28]. Therefore, it is essential to detect how it has altered the temporal distribution of precipitation, which has led to the changes of days without effective precipitation. Studying the characteristics of droughts from different aspects is of great significance for further understanding of drought and timely designation of drought and mitigation measures. Droughts can be inferred from daily precipitation [21], which has been identified as a local standard method for estimating drought in Guizhou province [29]. The continuous days without available precipitation (Dnp) refer to the number of days when the precipitation is less than the critical value of the effective precipitation. This index combines the factors of precipitation and precipitation days and is positively correlated to the duration and intensity of a regional drought event [30,31,32,33,34].
In this study, a dataset covering daily precipitation and drought records from 1960 to 2016 is adopted. The objectives of this study are as follows: (1) to examine the spatial and temporal differences in yearly and seasonal Dnp values and the changes during the past 60 years; (2) to detect the temporal and spatial variability of longest Dnp from the point of drought events, as well as the possible impact thereof; (3) to classify the Dnp values and droughts into different categories and reveal the relationships between Dnp and droughts; and (4) to discuss the relationship between Dnp and elevation.
2. Study Area and Data Resources
2.1. Study Area
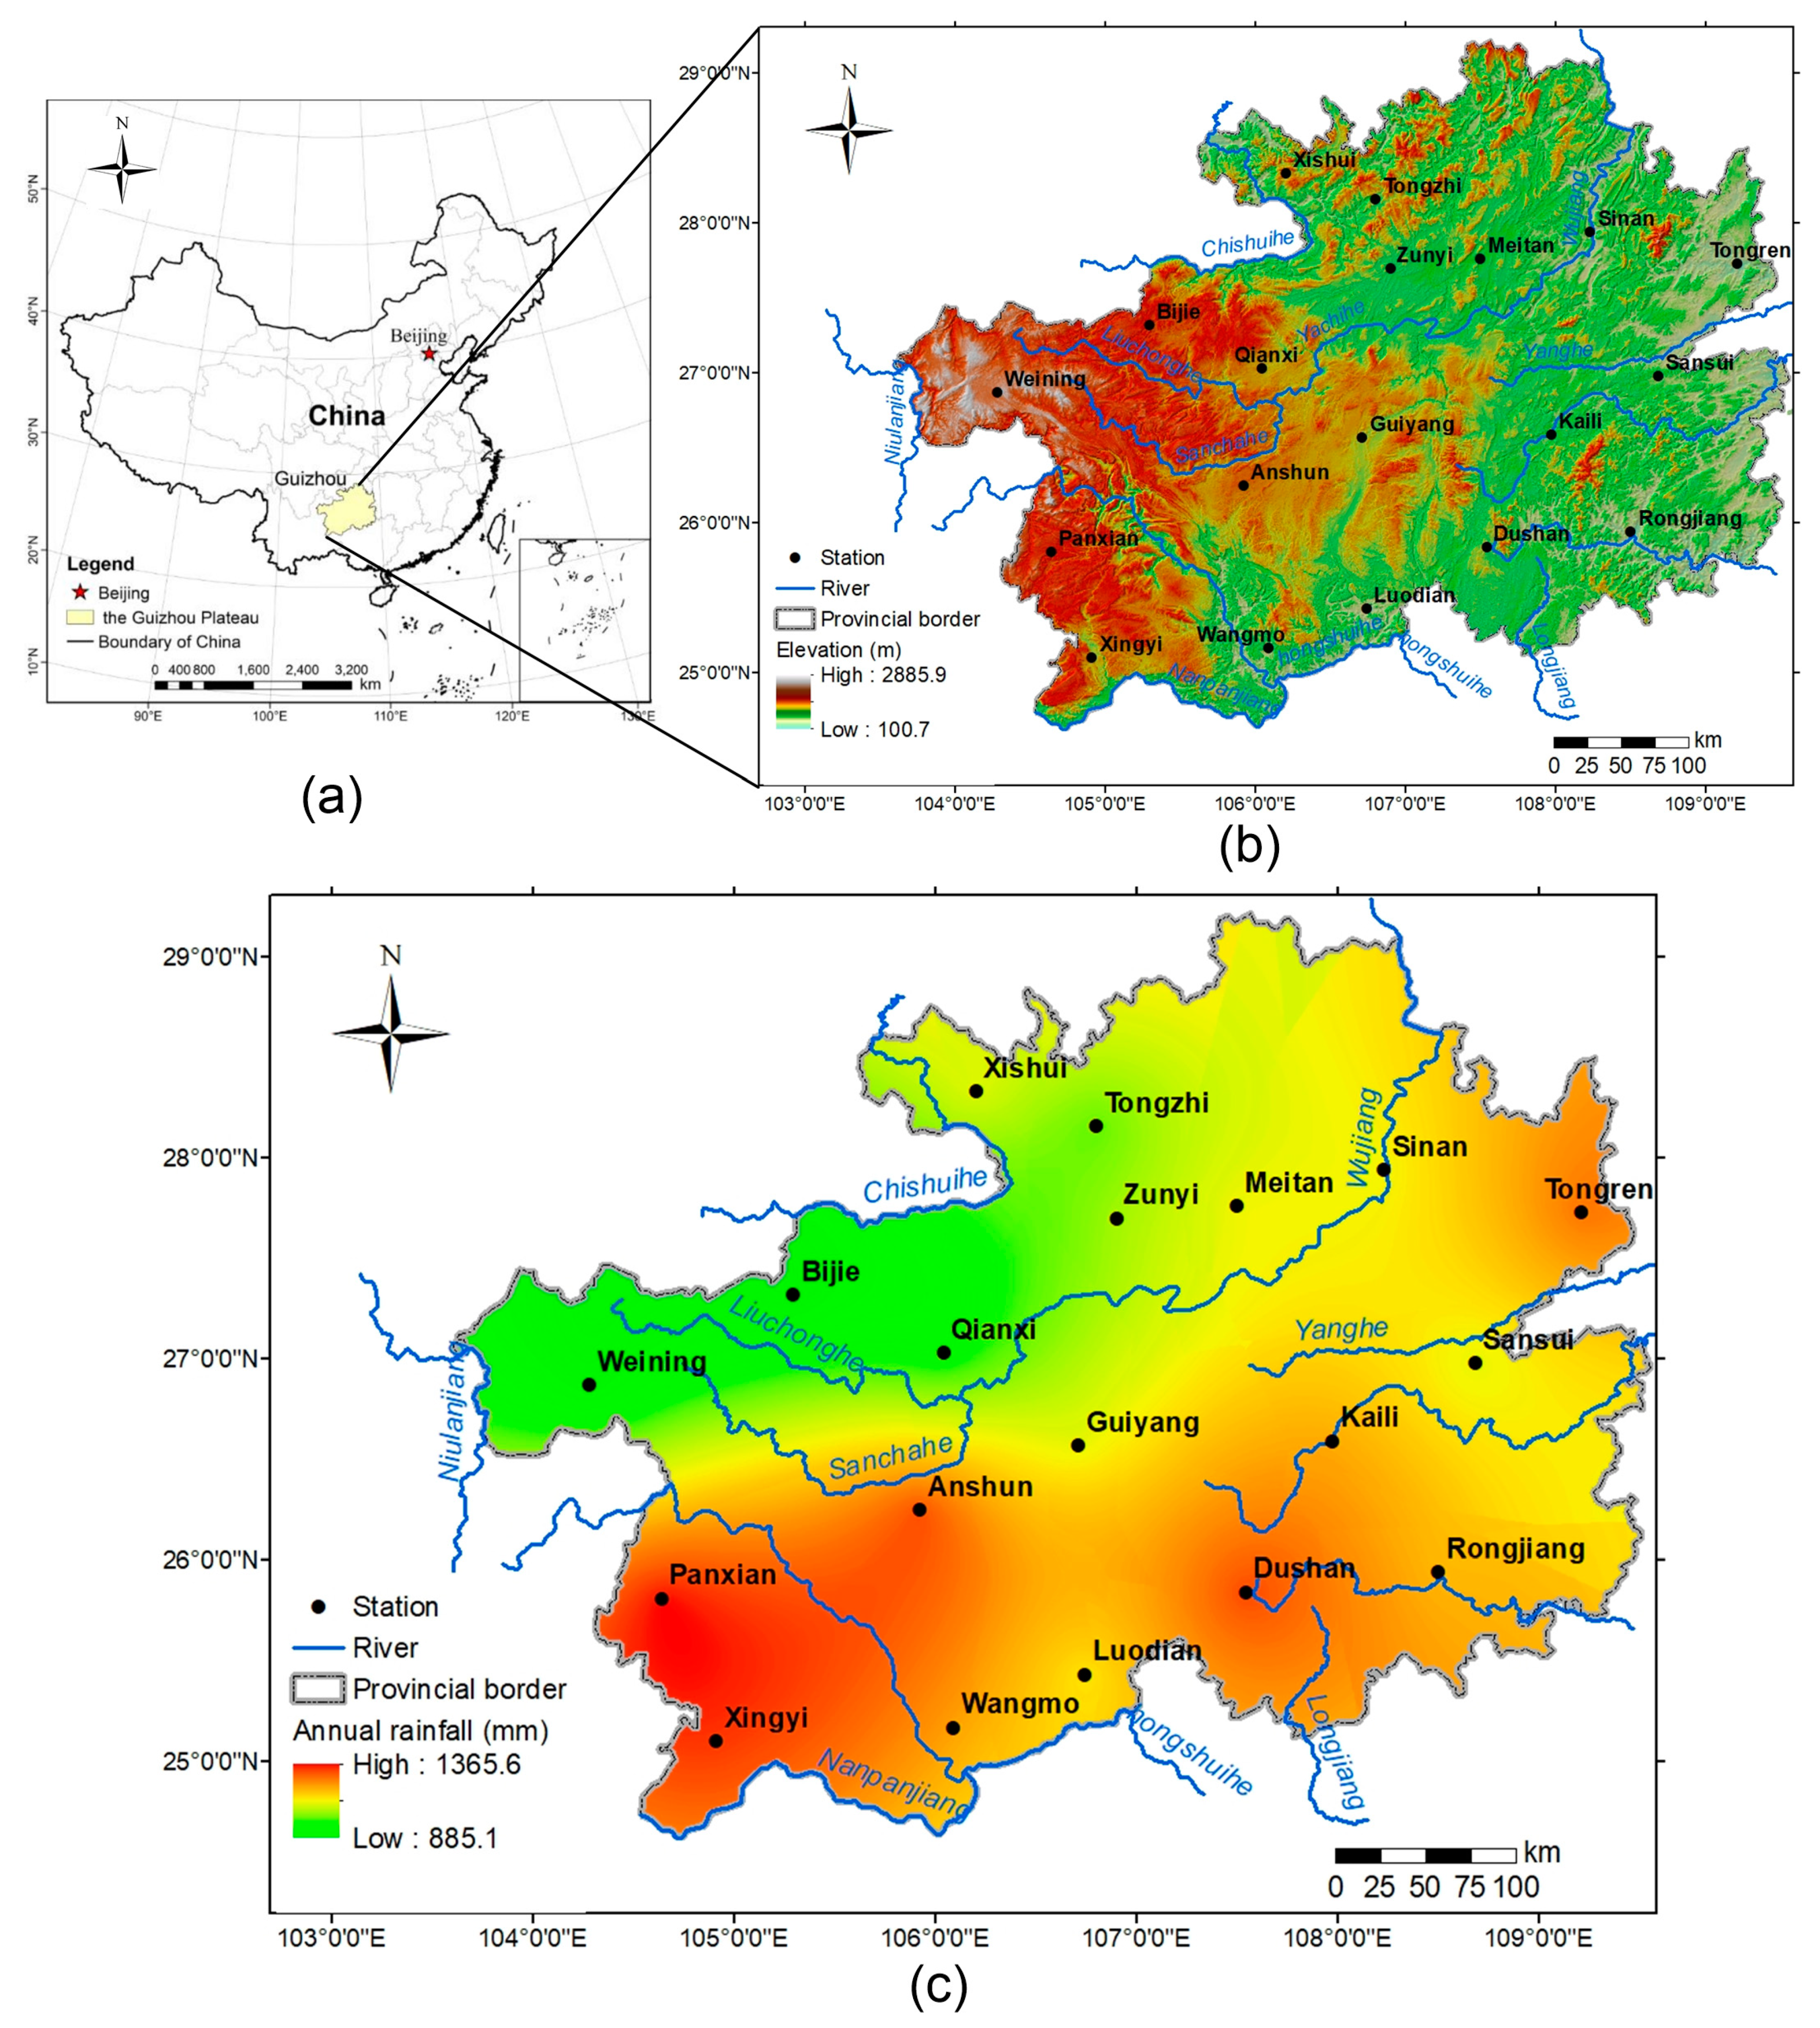
Guizhou province lies on the eastern Yunnan-Guizhou Plateau of Southwest China, which is bordered by the Qinghai-Tibet Plateau. It covers an area of about 176,200 square kilometers, spinning more than 560 km from east to west and about 515 km from north to south. In general, Guizhou province is mainly composed of plateau, canyon, and mountains, with an average elevation of about 1000 m. The terrain is in general high in the west and low in the east (in Figure 1). A total of 73% of Guizhou is karst landform. Guizhou has long been restricted by its rough topography and capricious weather, and it was recognized as an isolated place with wild and barren. However, with the continuous improvement of infrastructure, such as transportation, it has been becoming an important land transportation hub and playing a pivotal role in China in recent years.
Guizhou enjoys a unique geographical environment with low latitude and high altitude. It has the mild and humid subtropical monsoon climate, with annual average temperature of roughly 10 to 20 °C. The rainfall is plentiful, with an annual average of 900 to 1500 mm, but quite uniform, with a trend decreasing toward the north and west. There is great spatial variability in climate. Four seasons can be found in one mountain at the same time, and different climates are distributed within ten miles. In addition, the weather is changeable. Different hazards including droughts, heat waves, hailstorms, and freeze disasters occur frequently. The inter-annual and inter-decadal variability of precipitation is very large [6], posing high risks to social and economic development and agricultural production. In recent years, the drought events in the region have increased year by year with an increasing affected area and intensities. In particular, there were 26 serious droughts in Guizhou province during 1960–2016. The frequency of extreme drought events increases quickly, with a frequency of 10 such events since 2000 [25,35]. The droughts caused huge damage and loss to industrial and agricultural production every year, which affect the urbanization and social sustainability in Guizhou seriously.
2.2. Data Resources
The precipitation data was provided by the National Meteorological Administration of China. The rain gauge network in Guizhou comprises 19 stations. The installation location of the 19 rain gauges was well designed (as shown in Figure 1), which were expected to represent the spatial variations of rainfall in Guizhou. Though the rain gauges have been maintained well, there were still some missing data during 1951–1959. Therefore, the network finally yielded a set of daily precipitation data from 19 rain gauges covering the period from 01 January 1960 to 31 December 2016 in this study. These rain gauges are maintained according to the standard methods of the National Meteorological Administration of China. Three quality control methods have been applied to ensure the data quality before they can be released, including climate limit value inspection, station extreme value inspection, and internal consistency inspection. The collected data were organized, classified, analyzed, and interpreted using statistical techniques.
In this study, Dnp is defined as continuous days without available precipitation or precipitation amount <0.1 mm in one day (24 h) for a station [36]. To be specific, if there was no continuous precipitation or the precipitation amount was less than 0.1 mm in a day (24 h), the occurrence of no effective precipitation was counted for 1 day. Similarly, if there was no continuous precipitation or the precipitation amount was less than 0.1 mm in two days (48 h), it was quantified as no effective precipitation for 2 day. The yearly and seasonal mean values of Dnp were calculated, and then further divided into four categories to detect the drought trends, which were no drought (1–5 d), mild drought (6–10 d), moderate drought (11–15 d), and heavy drought (>16 d). The maximum value of consecutive dry days with precipitation below 0.1 mm during the study period at a certain station is denoted as the longest Dnp (LDnp), which is also considered as the longest dry spell or longest consecutive dry days.
3. Methodologies
3.1. Nonparametric Mann–Kendall (MK) Trend Detection Test
The nonparametric Mann–Kendall (MK) trend test has been widely used to assess the significance of monotonic trends in climatological [37,38], meteorological, and hydrological data time series [39,40], which is recommended by the World Meteorological Organization. To avoid serial auto-correlation complications, MK’s test is applied on a monthly scale. This implies that the over-year correlation between the data of the same month is assumed to be negligible. The test statistic Z, at a certain station in a certain month, is calculated by following formula [41,42,43]:
where
where
where x is the variable, i; j is the synth of the time series with length of n; {Xi| i = 1, 2, …, n − 1}; {Xj| j = i + 1, i + 2, …, n}; n is the sample size; the statistical S is the value of the standard normal distribution with a probability of exceedance of√(Var(S))/2, when n ≥ 8, with the mean and the variance as follows:
where t is the extent of any given tie (length of consecutive equal values).
In particular, the MK test provides a trend statistic (Z) indicating the monotonic increasing (positive Z values) or decreasing (negative Z) trend. If the value of the Z statistic is non-significant at a given alpha level, the absence of a trend in the time series can be inferred.
In addition to identifying whether a trend exists, we also used a linear trend analysis method to determine the magnitude of a trend. The trend magnitude β, an estimator developed by Hirsch based on Sen [41,43], can be defined as follows:
where, 1 < i < j < n. β is the median over all possible combination of pairs for the whole dataset [41]. A positive value of β indicates an “upward trend”, i.e., increasing with time, whereas a negative value of β indicates a “downward trend”, i.e., decreasing with time [42]. n is the length of the dataset, or the number of years in the dataset [43,44].
3.2. Inverse Distance Weighting (IDW)
The inverse distance weighting (IDW) [45,46,47]. method can be used to interpolate scatter data into a smooth raster surface. The raster cell values are calculated by averaging the values of station data in the vicinity of each cell. The closer an observation is to the point of estimate, the higher its influence. Such influence is based on a weighted average (wi) of the station values. IDW interpolation is computed as
where N is the number of locations used to perform the interpolation, and wi(l) = 1/d (l, si) is the weight given to feature of the i-th location. d (l, si) is commonly computed as the Euclidean distance between locations l and si in 2D geographic space.
3.3. The Relationship Analysis
The relationships between the days of droughts and elevation are studied by scatter plot, regression analysis, and coefficient of determination (R2) based on excel software.
4. Results and Discussion
4.1. Temporal and Spatial Variation of Yearly Dnp
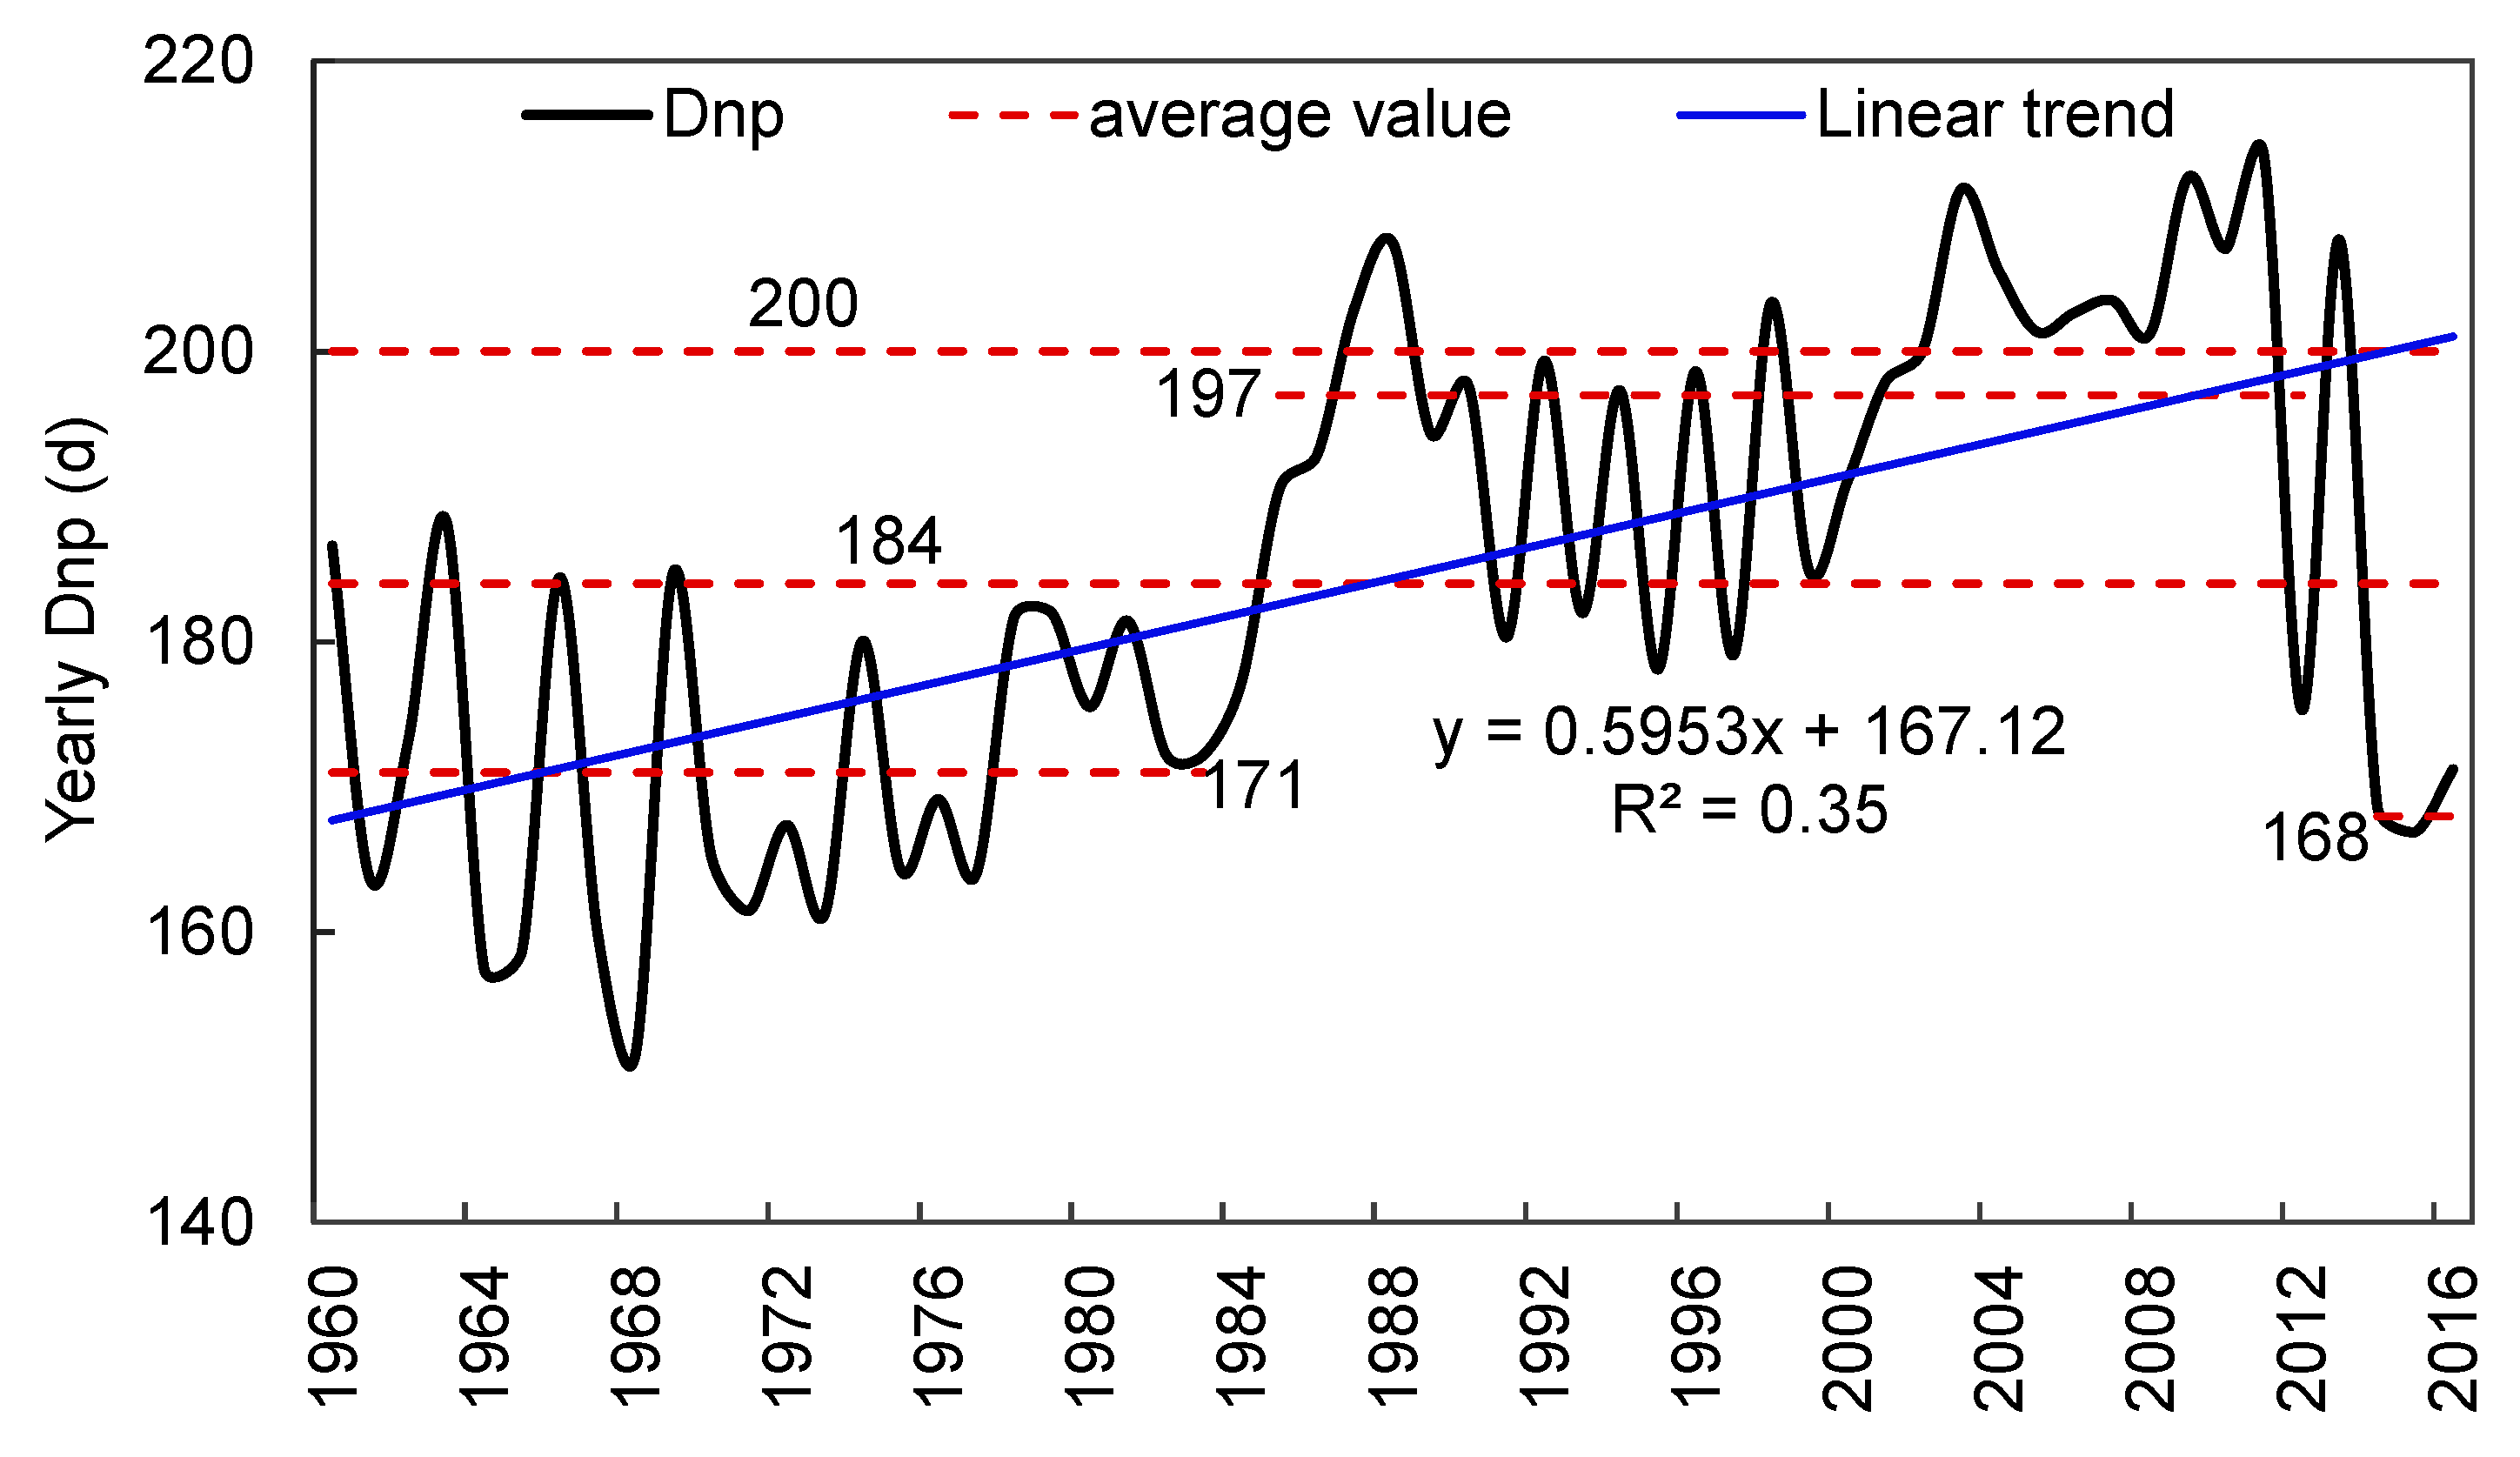
Figure 2 and Table 1 show the temporal and spatial distribution of yearly Dnp. There was a sharp increase in yearly Dnp with a rate of 6 d/10a during the past 60 years. The increasing trend had a 99% confidence, and the MK value was 5.05 with three distinctive stages. The total number of average Dnp was 184 days during 1960–2016 (Figure 2). The annual average Dnp values were 171, 197, and 168 days during 1961–1983, 1984–2013, and 2014–2016, respectively. In general, the two-stage anomalies of 1961–1983 and 2014–2016 were negative, while the anomaly of 1984–2013 was positive. The maximum difference among the three stages was up to 29 days. There was a total of 14 years with an annual average Dnp of more than 200 d/a, which all occurred after 1985. Among them, there were 11 years with an annual average Dnp of more than 200 d/a since 2000. The findings are consistent with previous studies on the spatial and temporal characteristics of precipitation in Guizhou province [48], which indicated that precipitation decreased since the 1960s, especially since the start of the 21st century.
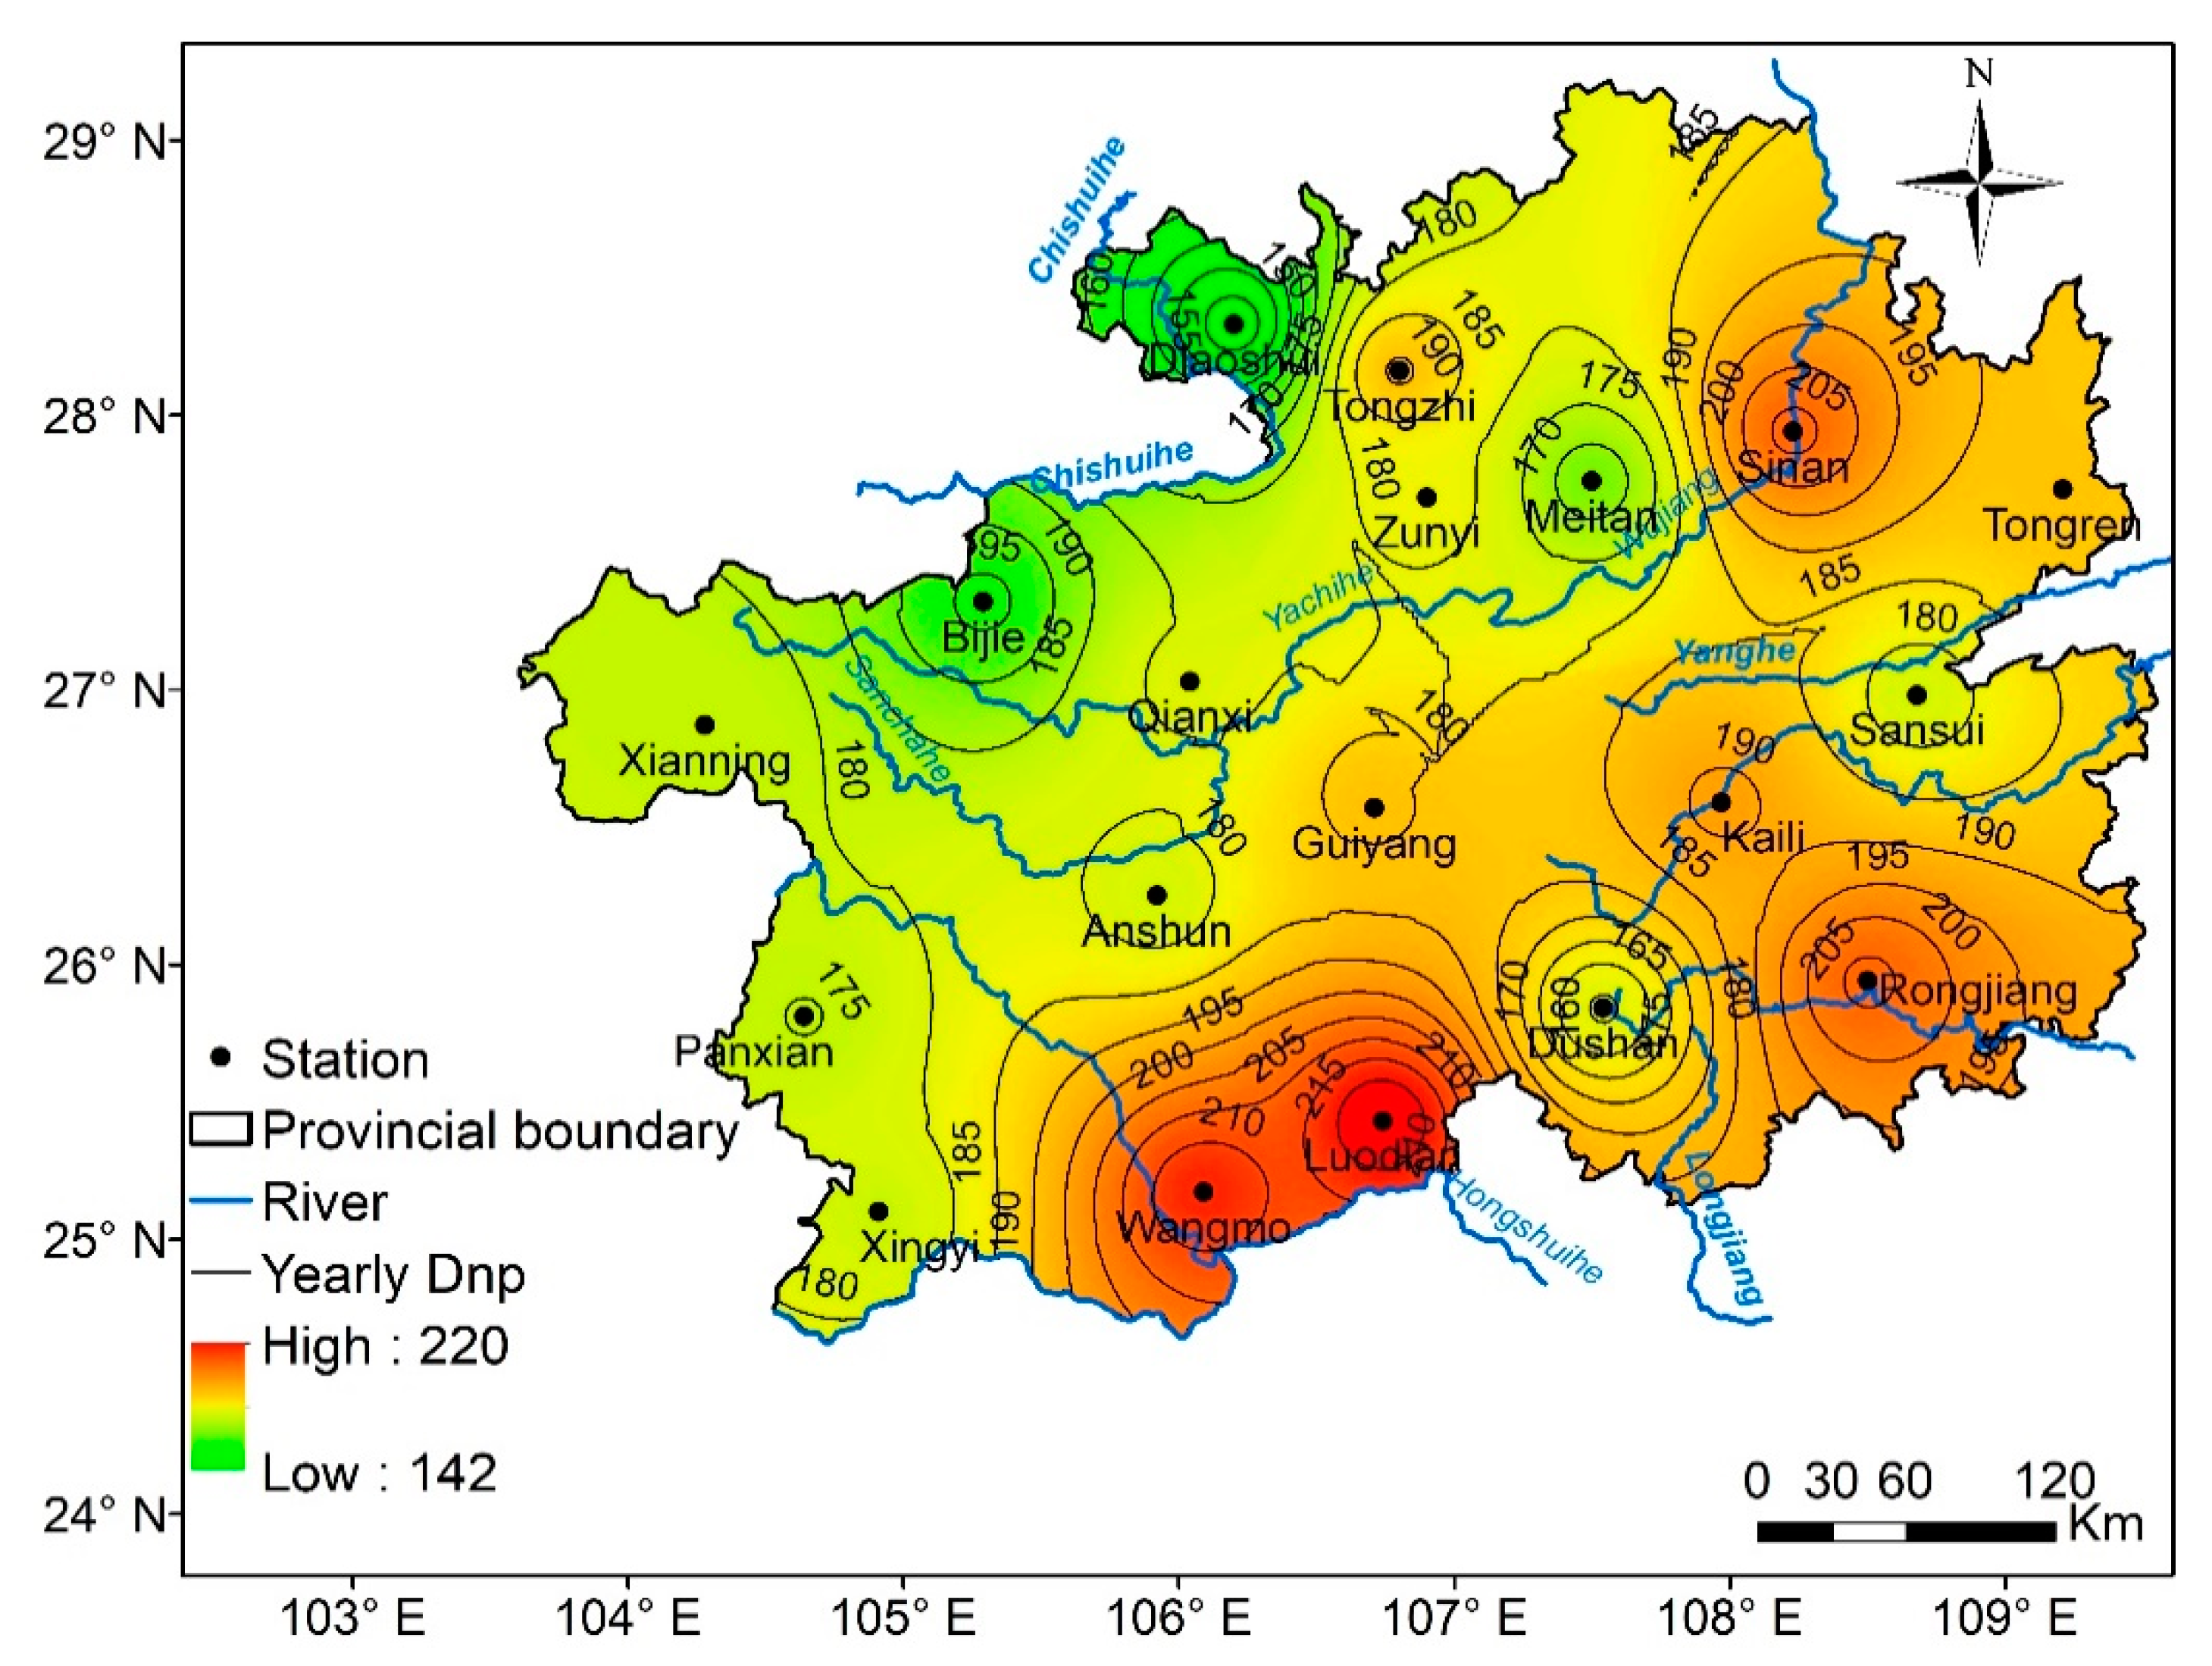
More detailed information of how average Dnp vary from one weather station to another could be inferred from the spatial distributions of trends at the stations (Figure 3). In general, Dnp value is large in the southeast while is low in the northwest, and Guiyang-Xingyi is in the transition zone. To be specific, the south corner (Wangmo and Luodian) has the largest values, followed by southeast corner (Rongjiang) and northeast corner (Sinan). Smaller values (less than 160 d) were found in the north (Bijie and Xishui), where there are mountainous areas. The mountainous areas (Bijie-Xianning and Xishui-Tongzhi) are recognized as less rainy areas; while the low-lying areas in Southwestern, Southeastern and Northeastern Guizhou are rainy areas. The spatial distribution of yearly Dnp could not be represented by that of the rainy or less-rainy areas in Guizhou province. This finding is consistent with the previous study [49], which indicated that there was more rainfall in the south than that in the north, while there were less precipitation days in the south than in the north in Guizhou province. This finding is consistent with the previous study [50], which indicated that there was more rainfall in the south than in the north, while there were less precipitation days in the south than in the north in Guizhou province.
4.2. Temporal and Spatial Variation of Seasonal Dnp
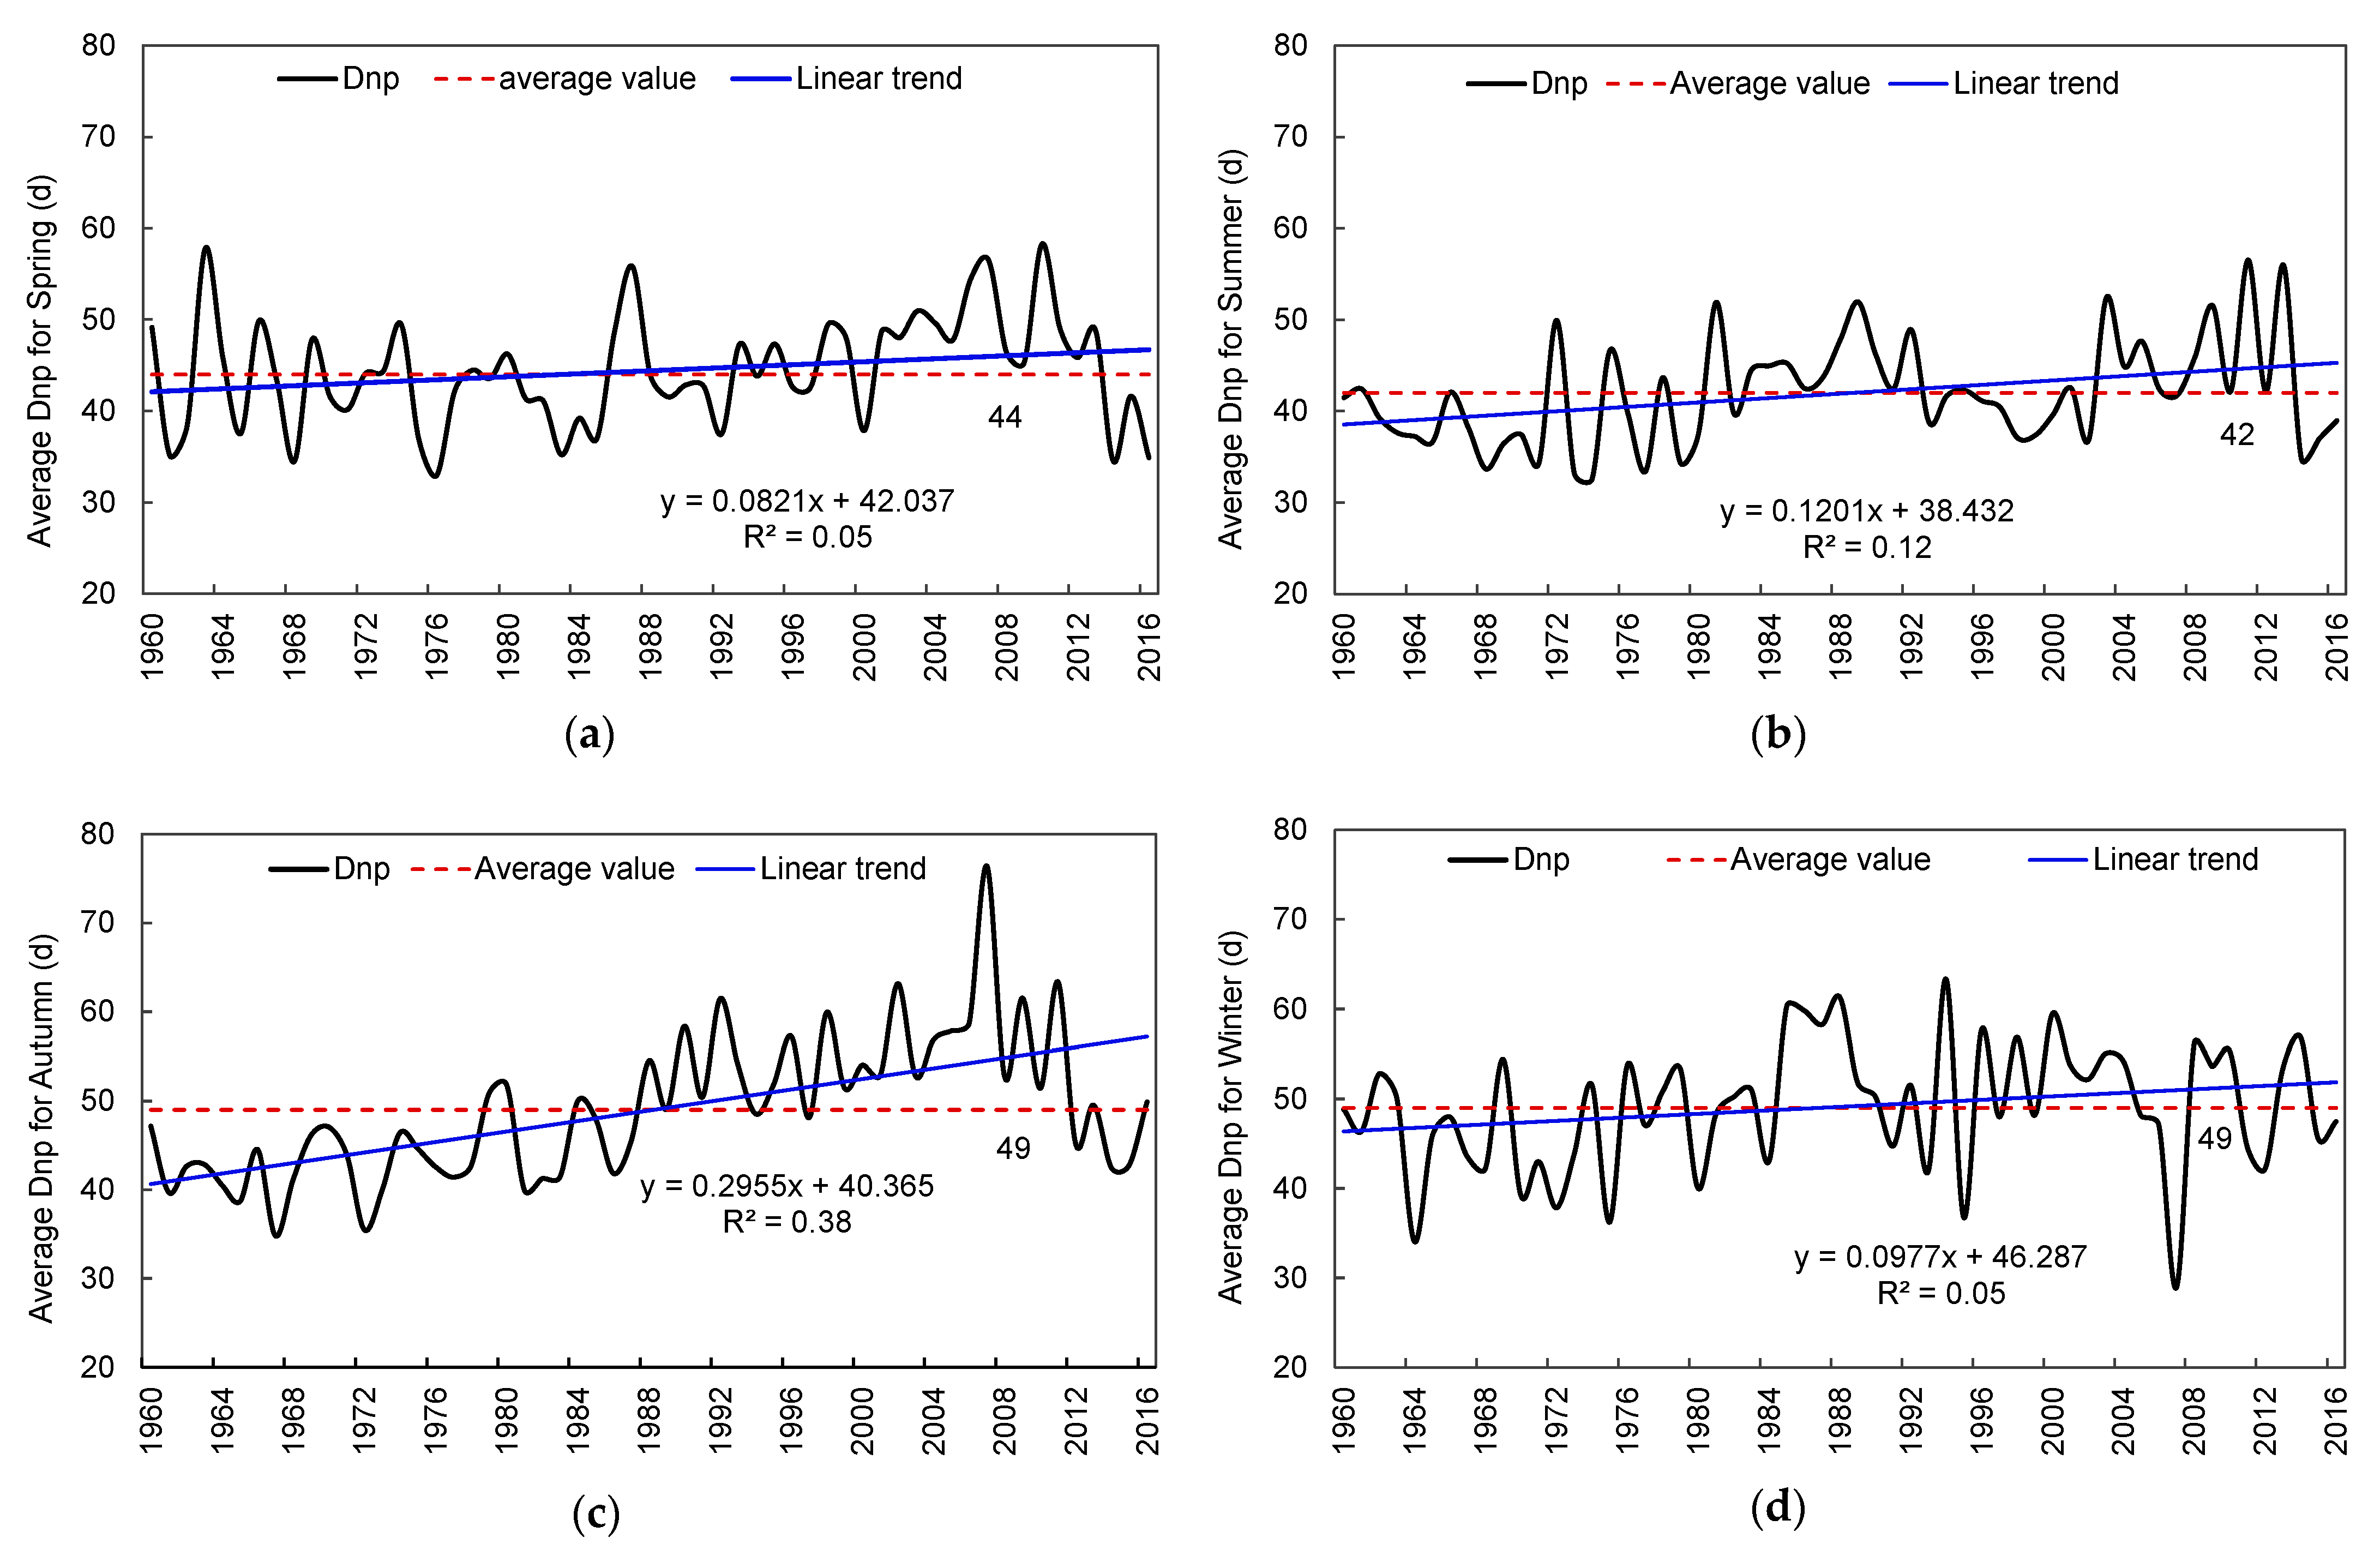
All the four seasonal average Dnp increased significantly, with the rates of 0.82, 1.2, 2.96, and 0.98 d/10a and the MK values of 1.92, 2.13, 5.04, and 1.78 for Spring, Summer, Autumn, and Winter, respectively (in Figure 4 and Table 1). The average numbers of Dnp in the four seasons are relatively close to each other. The average number of Dnp in summer is the smallest, with a value of 42 days, followed by the one in spring (44 days). The average number of Dnp in autumn and winter was 49 days. But there were obvious internal differences in each season. The shortest Dnp is 33, 33, 35, and 35 days, the longest Dnp is 58, 57, 76, and 63 days in spring, summer, autumn, and winter, respectively. During 1960–2016, there were 9, 7, 26, and 29 years with the Dnp exceeding 50 days in the four seasons, respectively. Among them, there were 5, 4, 14, and 10 years with the Dnp exceeding 50 days in spring, summer, autumn, and winter, respectively, since 2000s. There is an obvious increase in the Dnp exceeding 50 days in all the four seasons (Table 2). The Dnp with large numbers mainly occurred in autumn and winter. But the occurrences of Dnp in spring and summer cannot be ignored, as the crops are sown in spring and grown in summer in this region. No effective precipitation in the long term can seriously affect agricultural production.
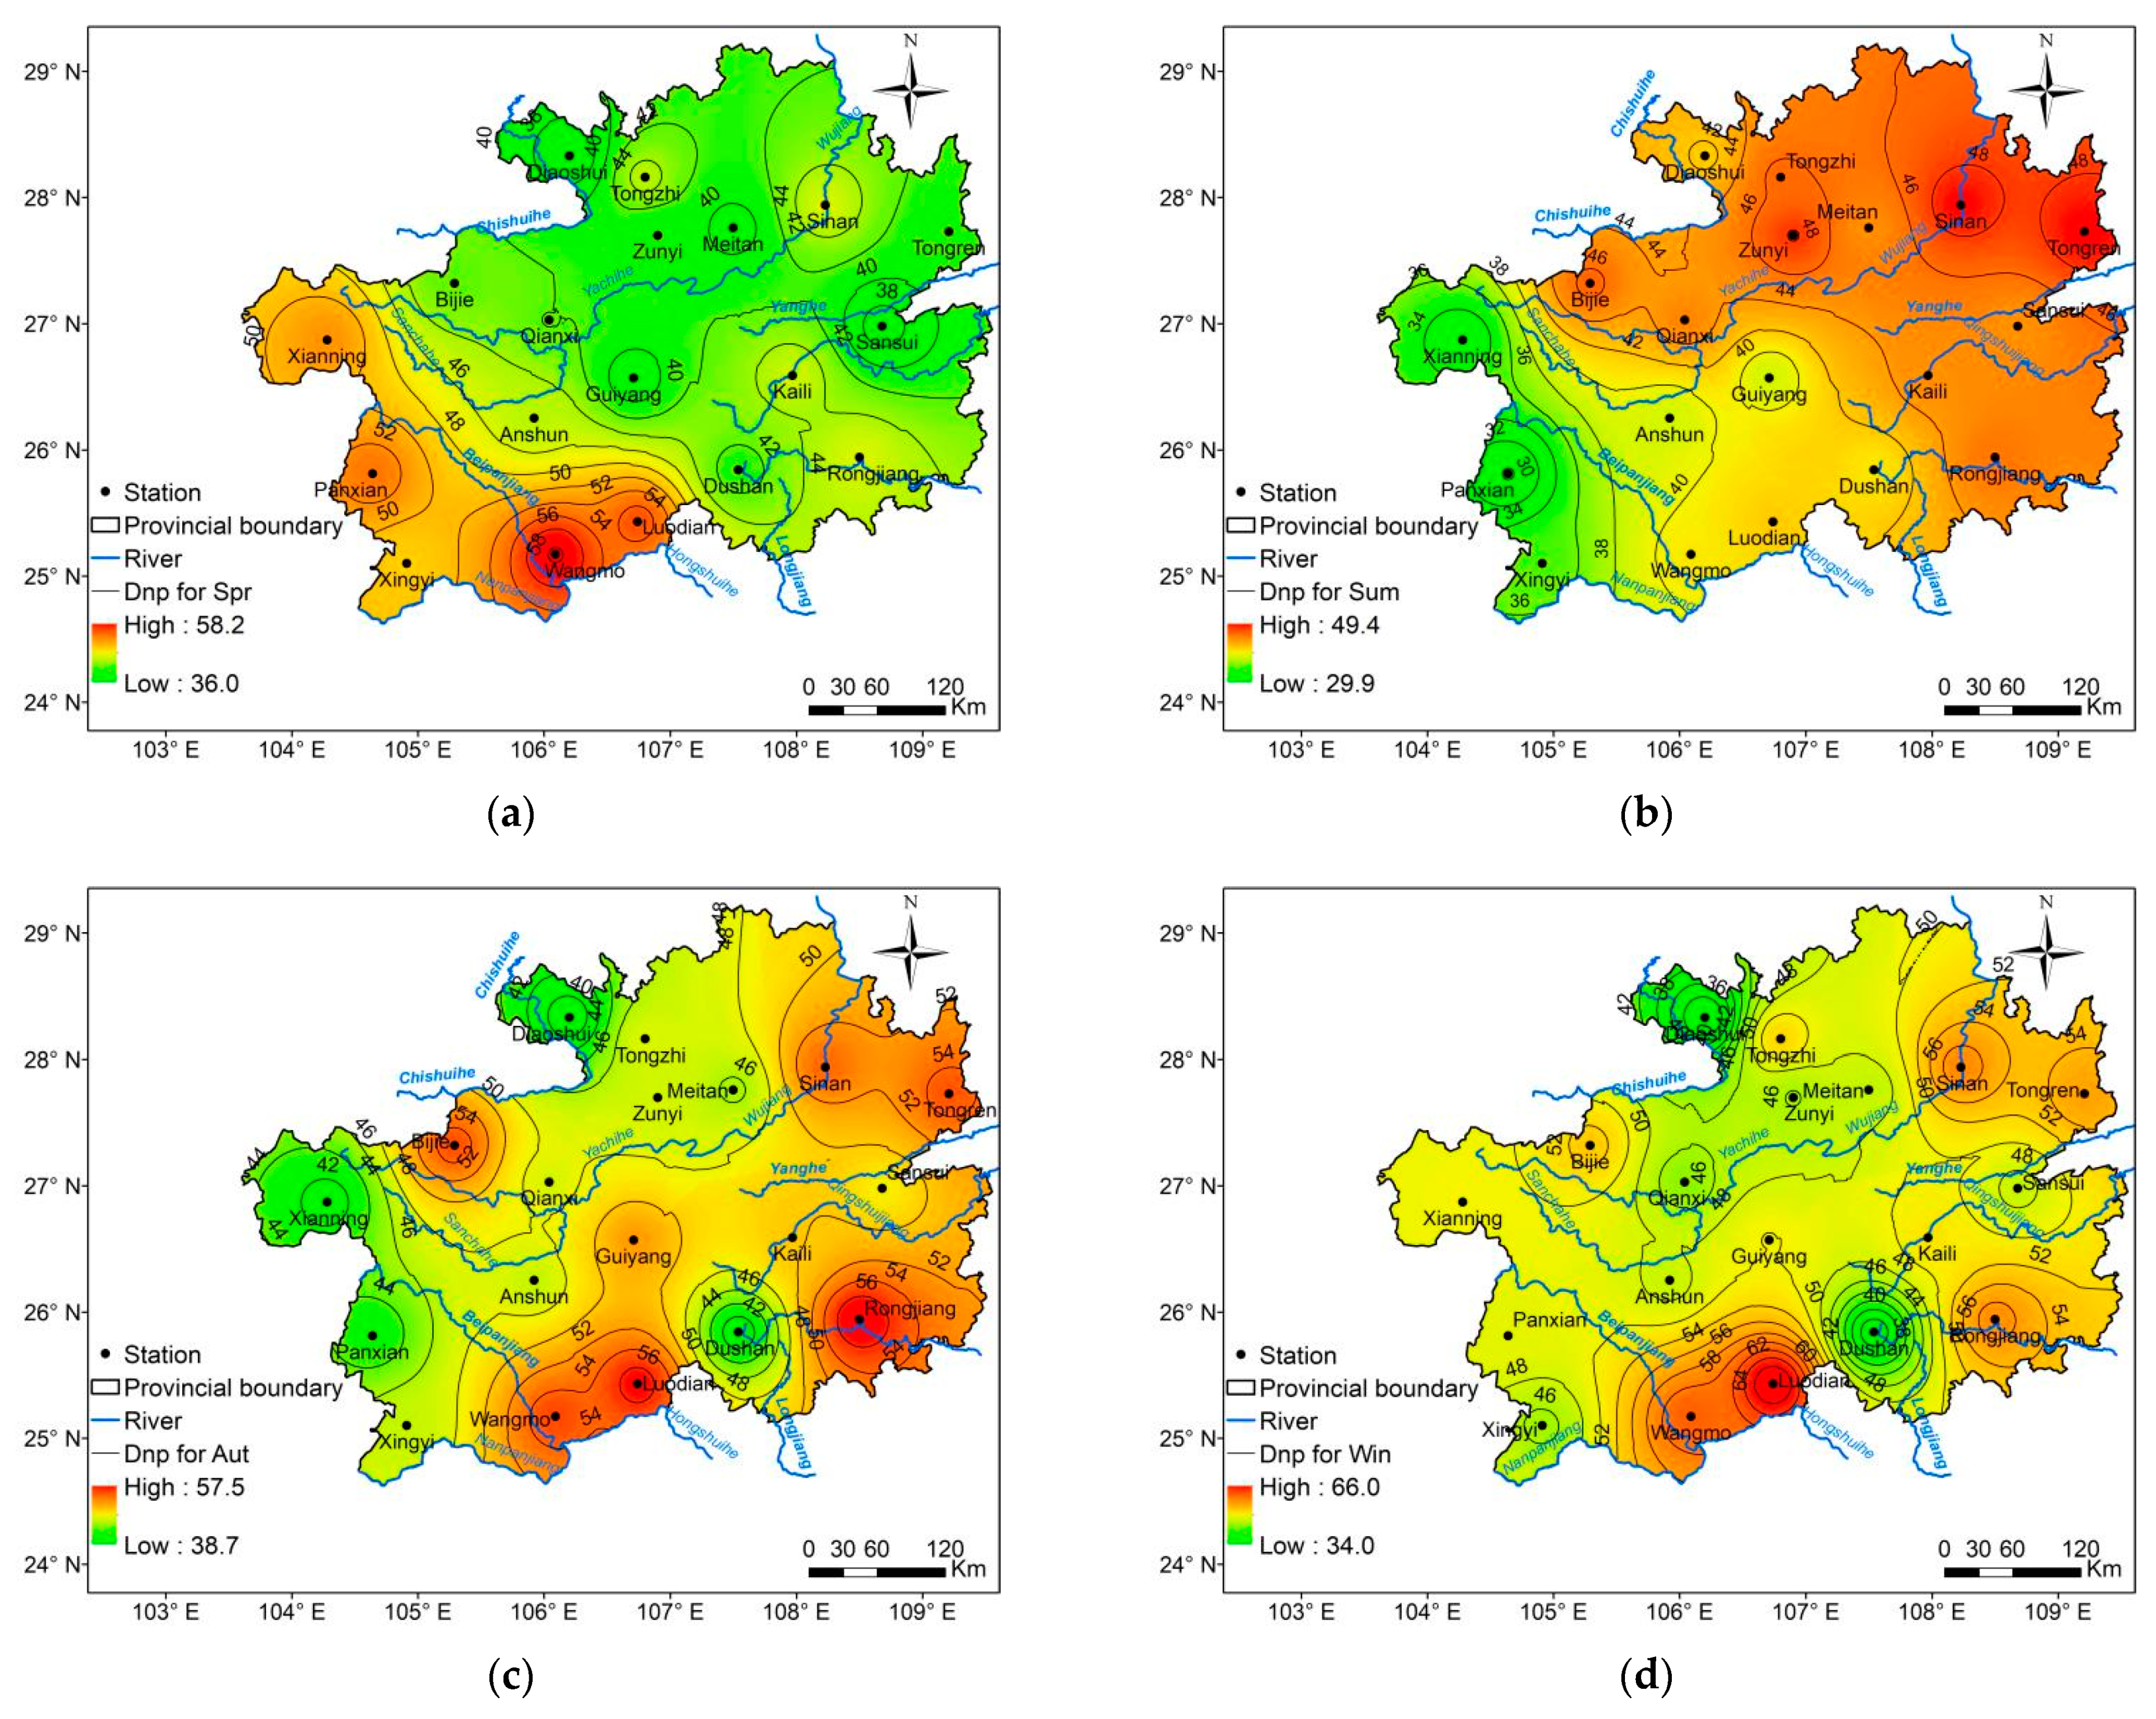
The variable “number of Dnp” exhibited different spatial patterns in different seasons. In spring, the average number of Dnp, in general, decreased from southwest to northeast. The lowest number of Dnp occurred in the Xishui area. The distribution of Dnp in summer was just opposite to that in spring, which increased from southwest to northeast. The low-value areas appeared in western parts of Guizhou, such as Panxian, Xingyi, and Xianning areas. The distributions of Dnp in autumn and winter were almost identical, which did not exhibit an obvious trend over entire Guizhou. The southwestern part (Wangmo and Luodian) is at the foot of the mountains, where the Dnp values were not large in summer, while those were quite large in the other three seasons. The distributions at Xishui in the northern part and the Dushan in southern part were just opposite to those at Wangmo and Luodian. There are low-value centers in the spring, autumn, and winter (Figure 5).
4.3. Temporal and Spatial Variation of Annual Longest Dnp
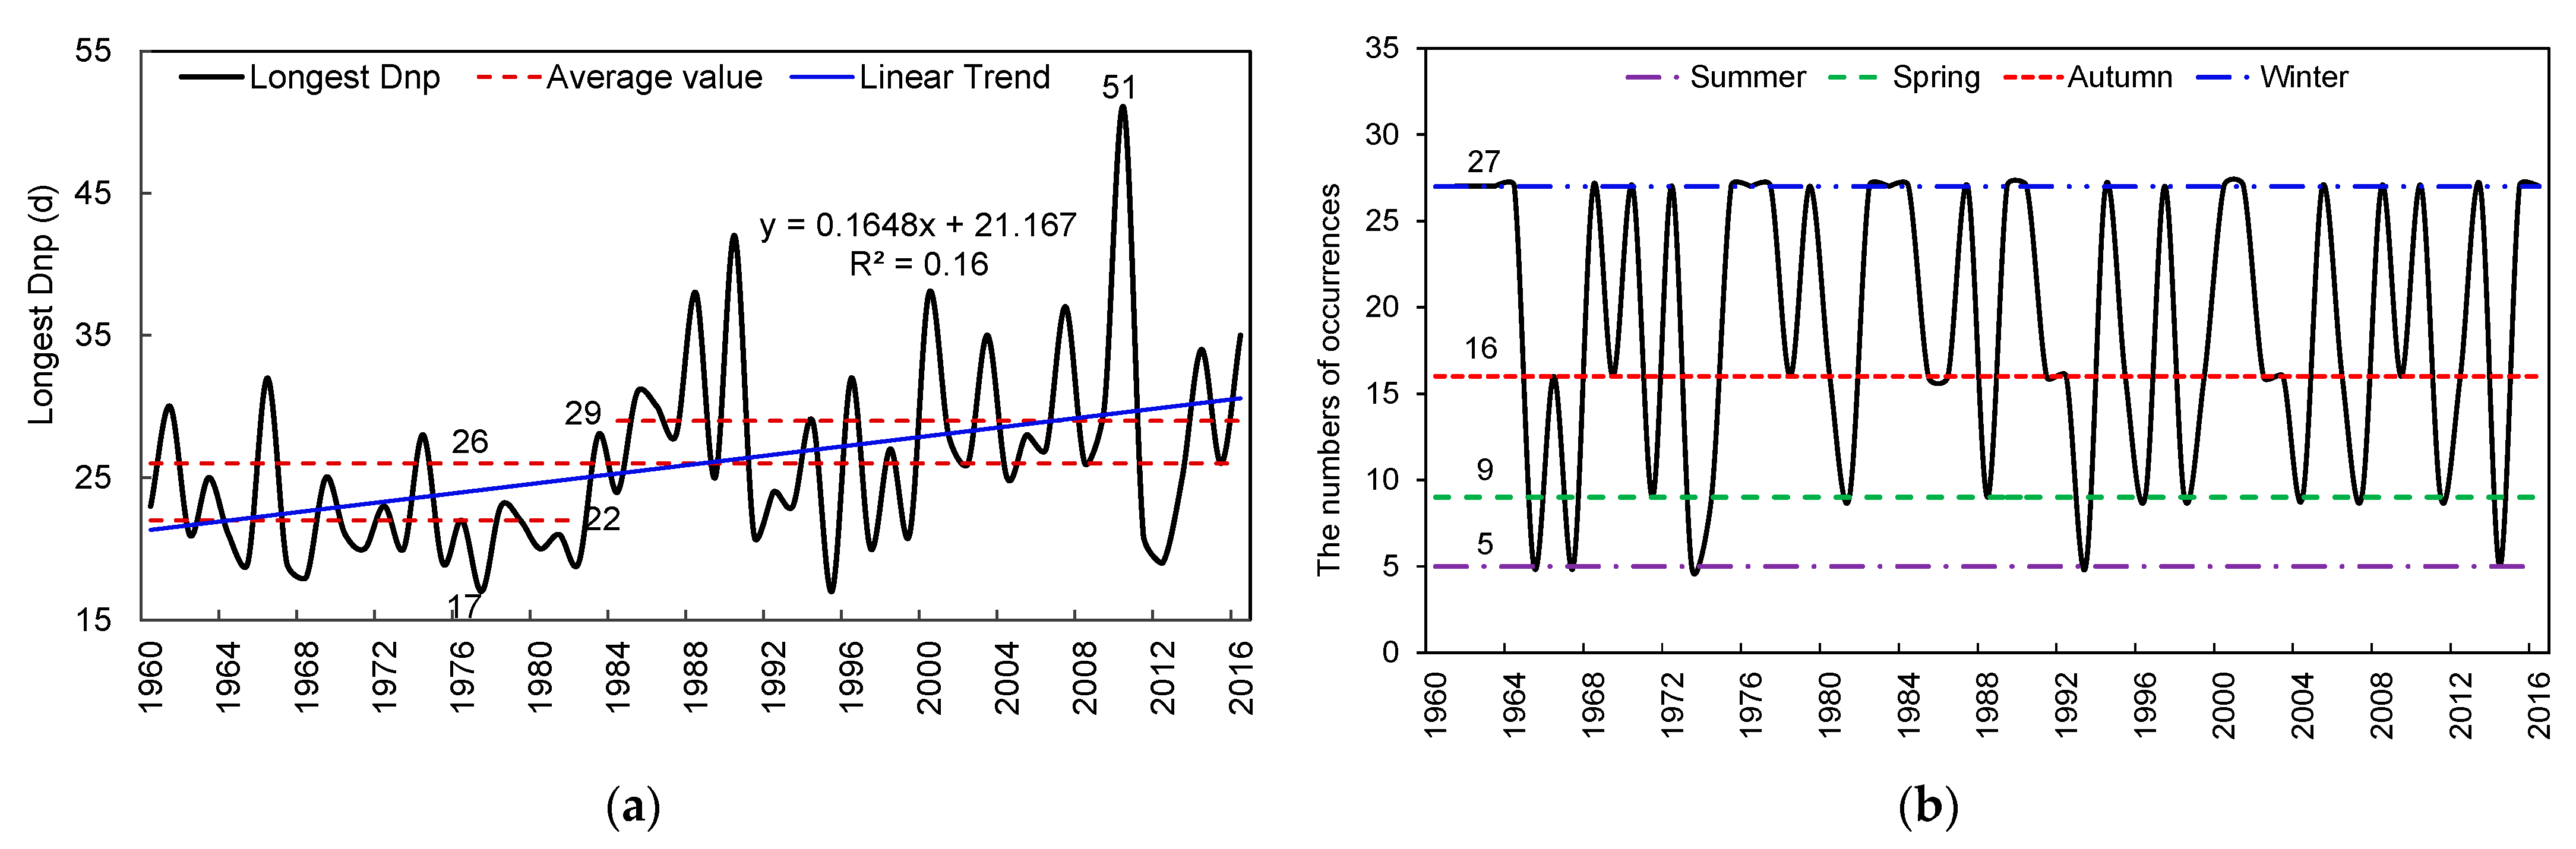
The longest Dnp in Guizhou province showed a slight increase trend with the rate of 1.6 d/decade. The average period of the longest Dnp in 1960–2016 was 26 days. The longest period was up to 51 days, while the shortest Dnp was only 17 days. There were 25 years with the average period exceeding 26 days from 1960–2016. Furthermore, the longest continuous non-effective precipitation days period was differentiated into two stages at a juncture of 1982. There was a stepwise rising trend in the two stages (Figure 6a). In the previous time interval, from 1960 to 1982, the average was 22 days, while the average in the latter time interval from 1983 to 2016 was 29 days. For the seasons and frequencies of the longest period of consecutive days without effective precipitation during 1960–2016, there were 27 times, 16 times, 9 times, and 5 times in the winter, fall, spring, and precipitation-rich summer (Figure 6b).
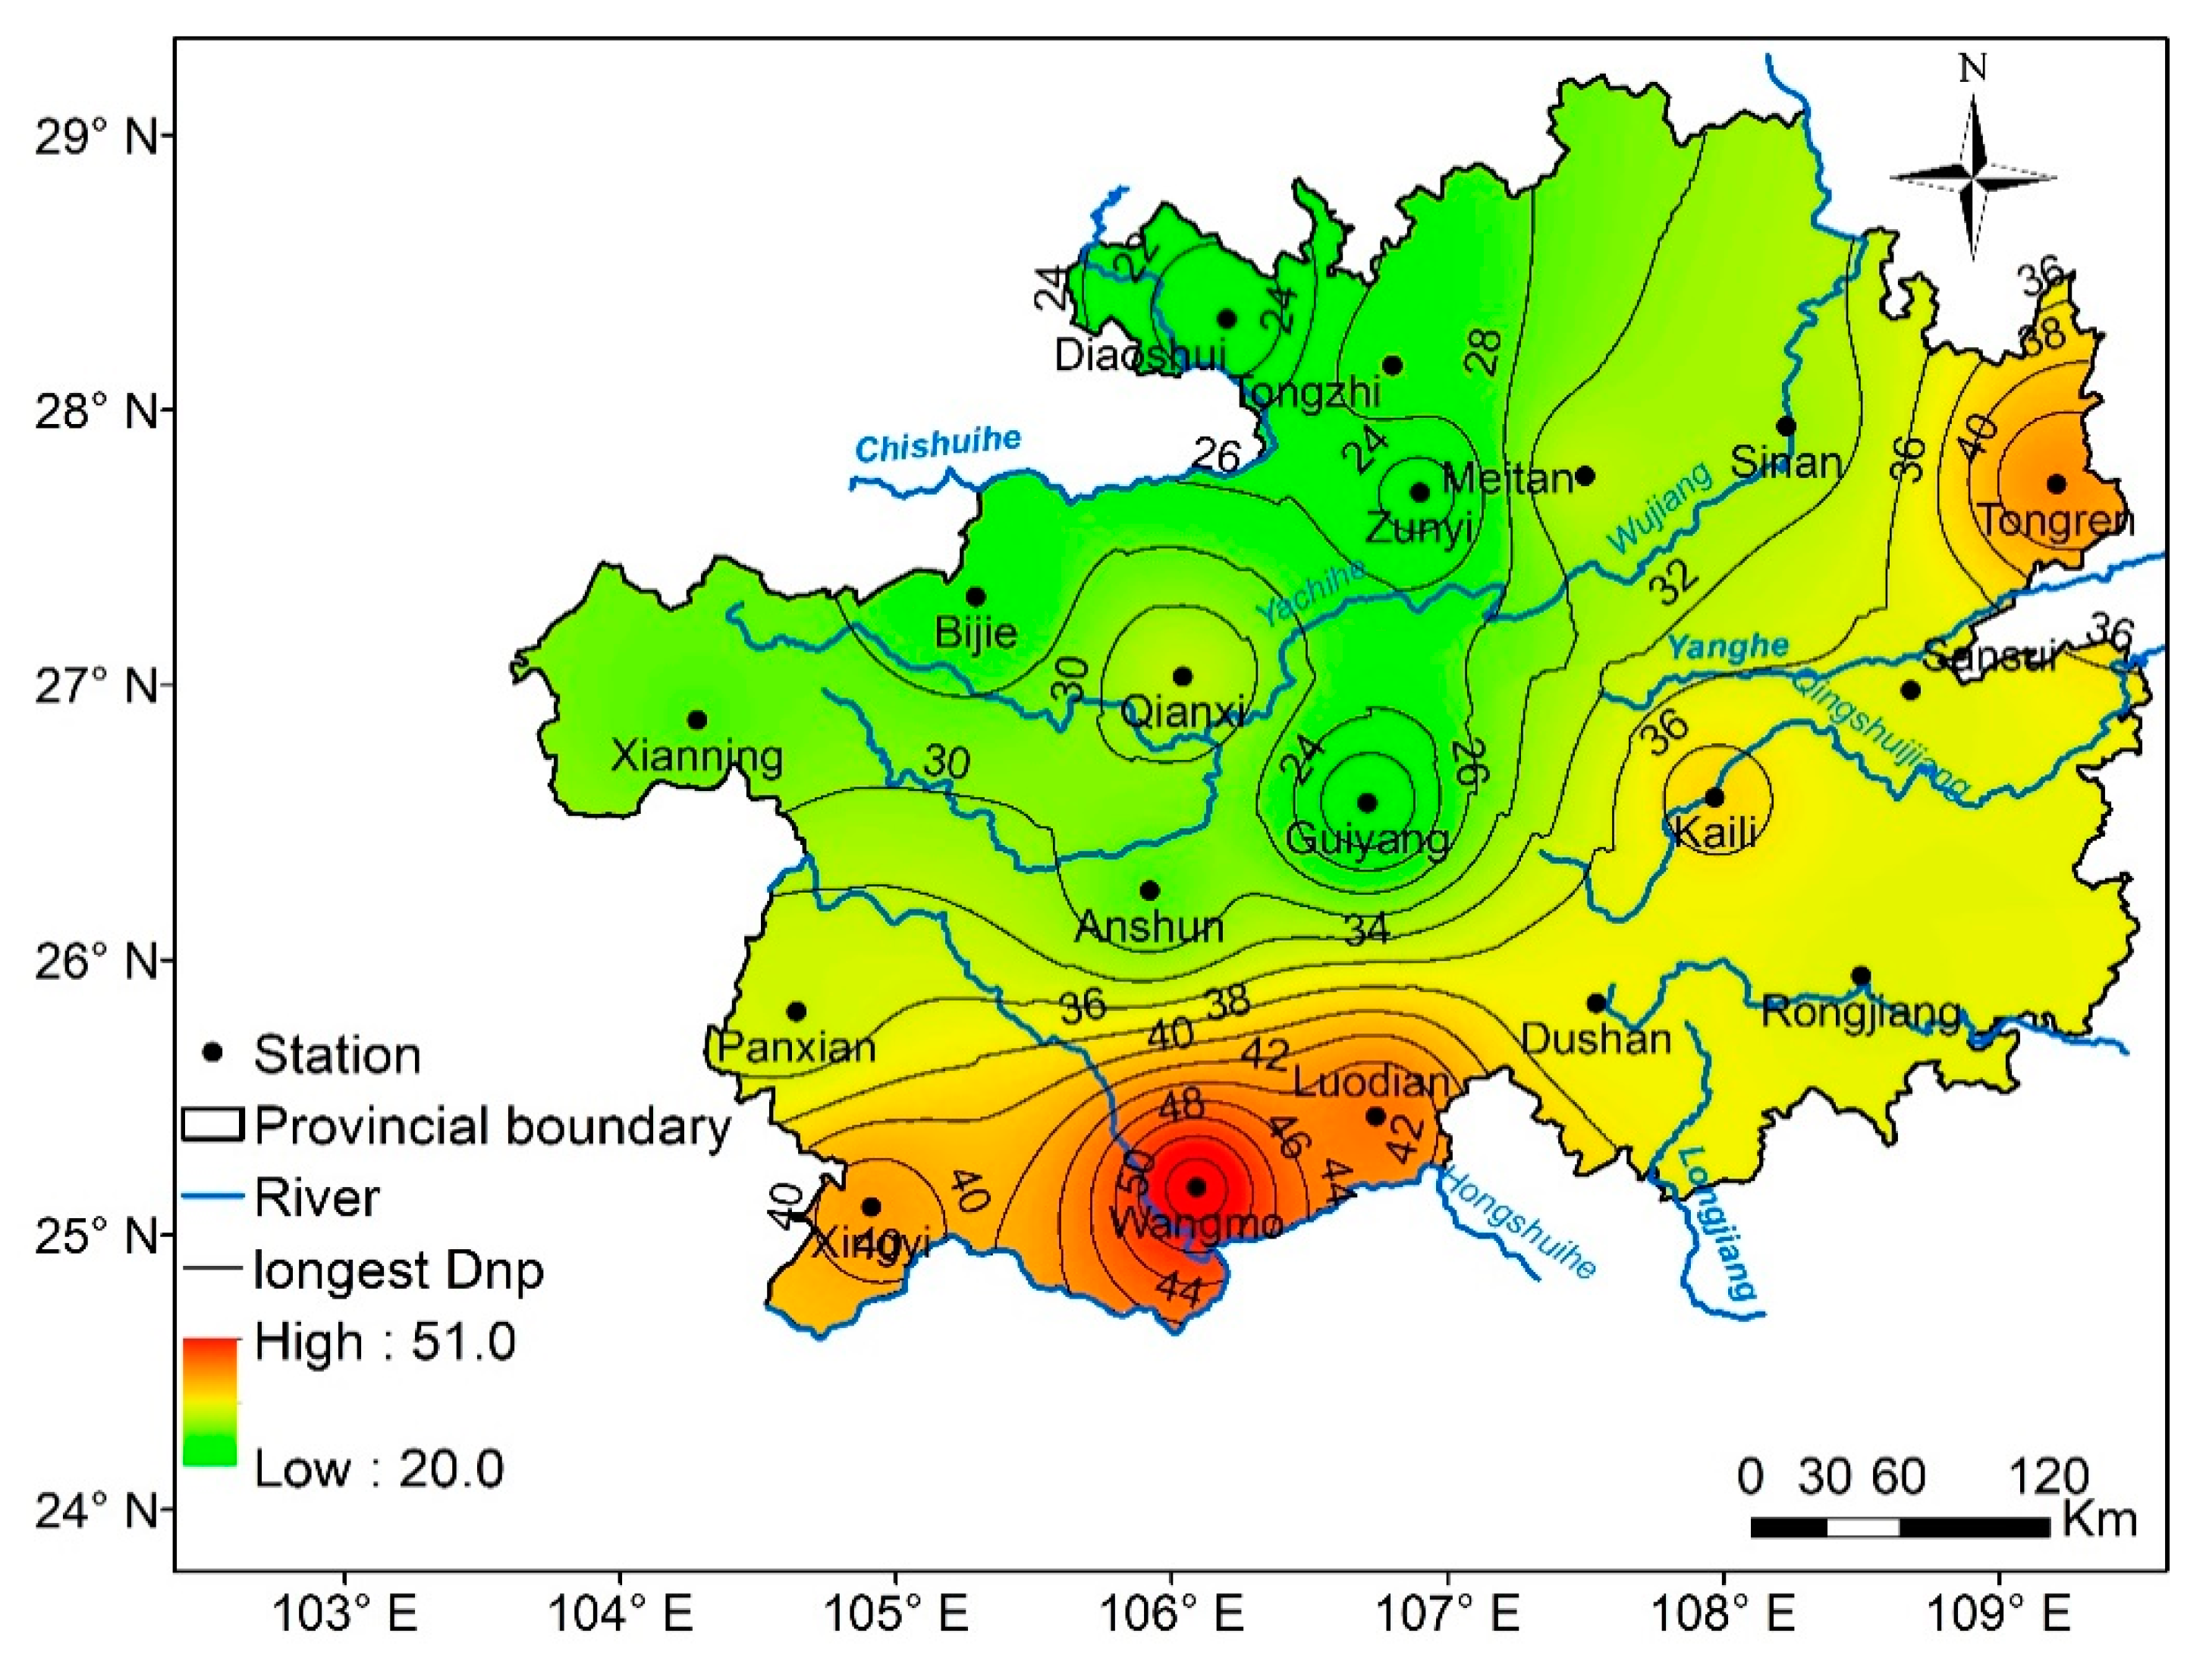
For the spatial distribution of the longest Dnp, the maximum number of days without continuous precipitation was 51 days in the southeast (Wangmo). In general, the numbers of longest Dnp were smaller in the northeast, while larger in the southwest. To the north of the Wujiang River, the longest Dnp were all less than 30 days. The minimum Dnp was in Xishui with the number of 20 days. The southern part of Guizhou was the largest concentrated area with the longest number of Dnp (Figure 7).
On the decadal scale, there were longest Dnp twice in 1960s with an average of 27 days each time; 5 times in 1980s with an average period of also 27 days each time; 3 times in 1990s with an average of 32 days; since 2000s, there was 9 times, with an average of 35.6 days; the average period was up to 37 days each time since 2010s. As to the occurrence time, the longest Dnp start time was mainly in February (in winter), March (in spring, growing season) with 7 times, and October–November (in autumn, harvest time) with 6 times. There was no longest Dnp found during May–June (Table 3). The aggravation of drought had seriously affected agricultural production during these two periods. According to data, the seasonal distribution of drought tends to be severe, and it will become drier in winter and spring in China, affecting crop growth and restricting agricultural production [24,50], especially in southwestern China, where 24% of agricultural areas are affected by drought [51,52]. In Northeast China, drought is accompanied by the spring maize growth period, and long-term drought will make it impossible to recover the physiological functions and yield of maize [53]. In Ethiopia, seasonal droughts have severely affected the production of corn and sorghum [54]; in Afghanistan, this species is now more pronounced. Drought often occurs during the growing season of rice and corn. In the southwestern region of the country, drought affects the growth of wheat [55].
4.4. Temporal and Spatial Variation of Seasonal Longest Dnp
For the longest Dnp of the four seasons, the increasing trend of other seasons was not obvious except for the slight increase trend in autumn and winter with the rates 1.78 d/10a and 1.09 d/10a, respectively (Figure 8). Overall, in the case of spring, although the longest Dnp changed little, only maximum values appeared in several years, and the longest Dnp was up to 51 days in 2010, with a resulting drought that has been referred to as the worst in a century in southwestern China. For the summer, the longest Dnp change of summer is similar to that of spring, and except for individual years, the overall fluctuations were not large. The longest Dnp in 1966 was 32 days, leading to more serious drought in Guizhou province.
Compared with Dnp values in spring and summer, those in fall and winter fluctuated much more. The longest Dnp values were 42 days in autumn and 38 days in winter, while the shortest Dnp were 11 days in autumn and 11 days in winter, respectively. For the Dnp values exceeding 30 days, most of them appeared since 1980. There were 5 times in autumn since 1980s and 7 times in winter since the 1980s among the total number of 8. As to the longest Dnp that were longer than 30 days and have occurred since 2000, there were 2 in spring (out of a total of 2, hence both since 2000); 2 in autumn (among a total of 5); and 4 in winter (among a total of 8). The droughts in Guizhou province have intensified since the 1980s, and the more obvious increasing trend of droughts in the 21st century have tended to aggravate harm to people in Guizhou. This finding is consistent with the previous research [24]. The increase in the spring and summer season was not that obvious. Once large values of Dnp occur in spring or summer, which will do severe harm to the crops, causing irreparable damage to agricultural production. For example, a large drought event happened in 2009–2010 in which 73 counties in Guizhou province suffered extra-severe to extreme drought, and the direct economic losses due to this disaster were up to 13.999 billion Chinese Yuan. The spatial distribution of the 2009–2010 southwestern drought was similar to that of the longest Dnp.
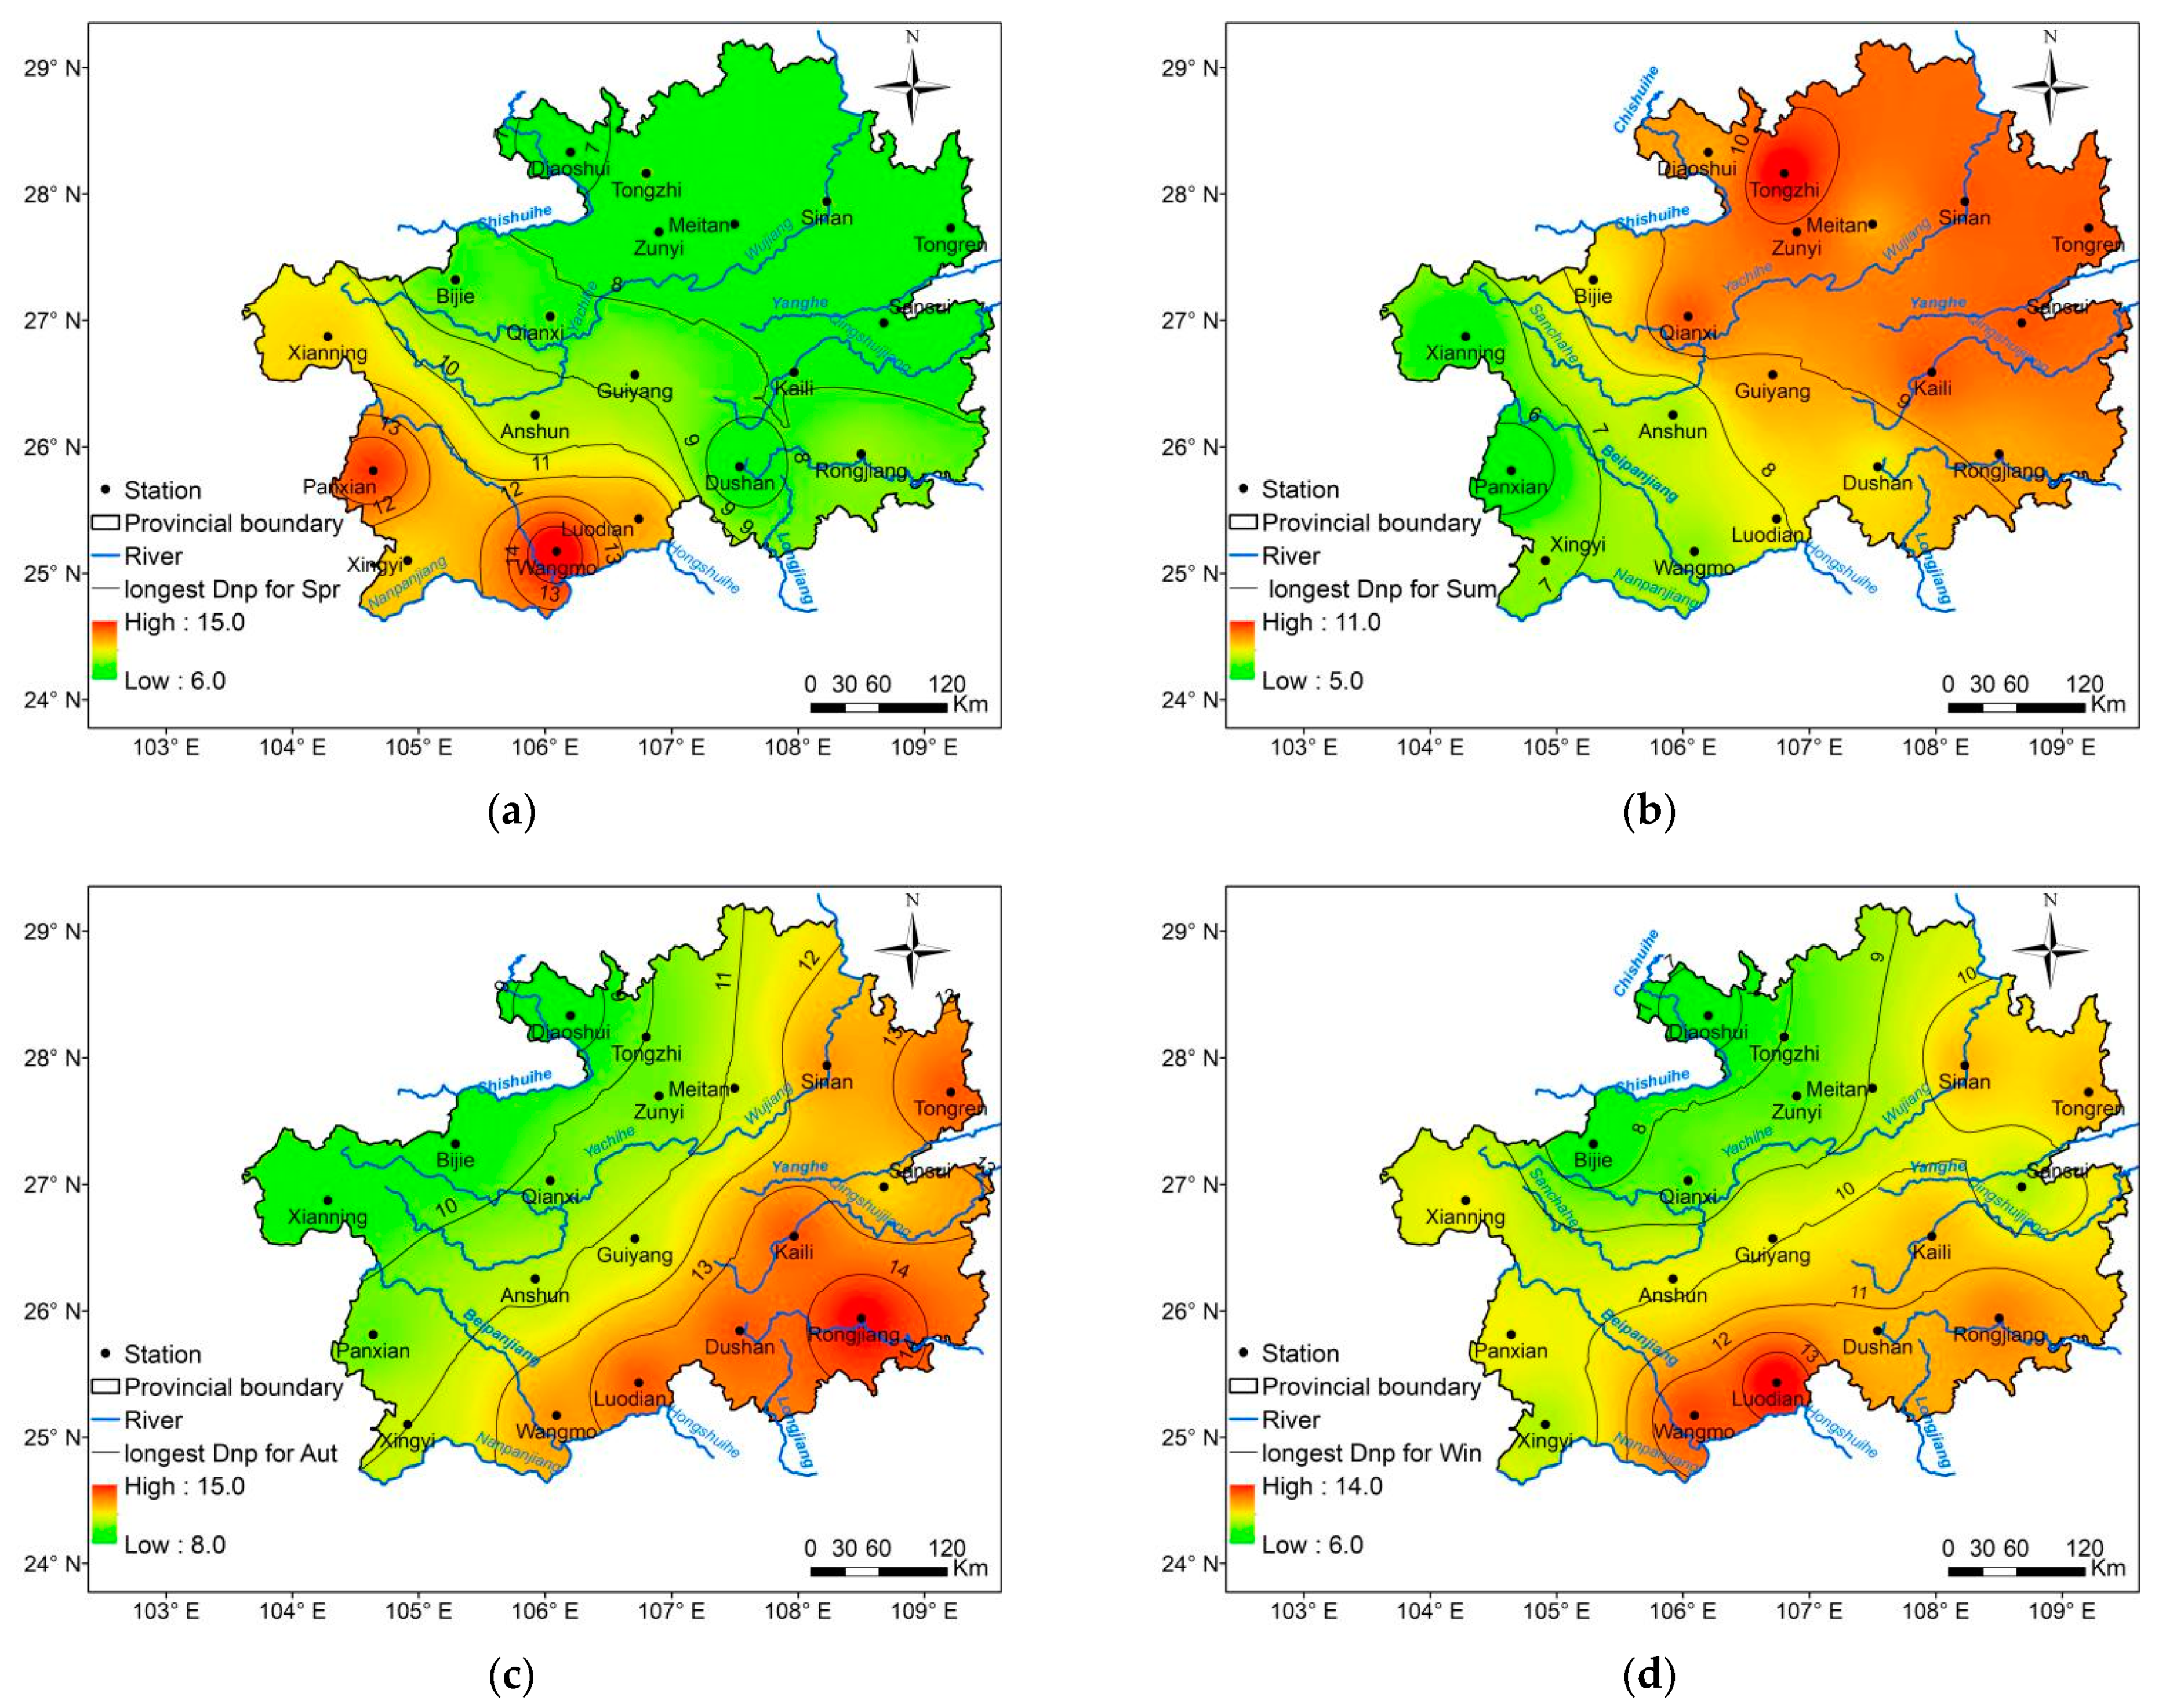
Figure 9 shows spatial distributions of average longest Dnp in Guizhou province during different seasons. In general, there were obvious spatial variations. During spring, more than half of the area had average longest Dnp of less than 8 days, and the Dnp were declining from southwest (Wangmo and Panxian) to northeast. While the Dnp distribution in summer was just opposite to that in spring. More than half of the areas had average longest Dnp of more than 8 days, and the area with low Dnp value was only distributed in a small part of the west. The spatial distribution of Dnp in autumn and winter were in general similar. In autumn, the high values centered in the southeast (Rongjiang) and northeast (Tongren), declining from southeast to the northwest. In the winter, the values of Dnp were slightly smaller than those in autumn, and the center was in southern (Luodian) Guizhou province.
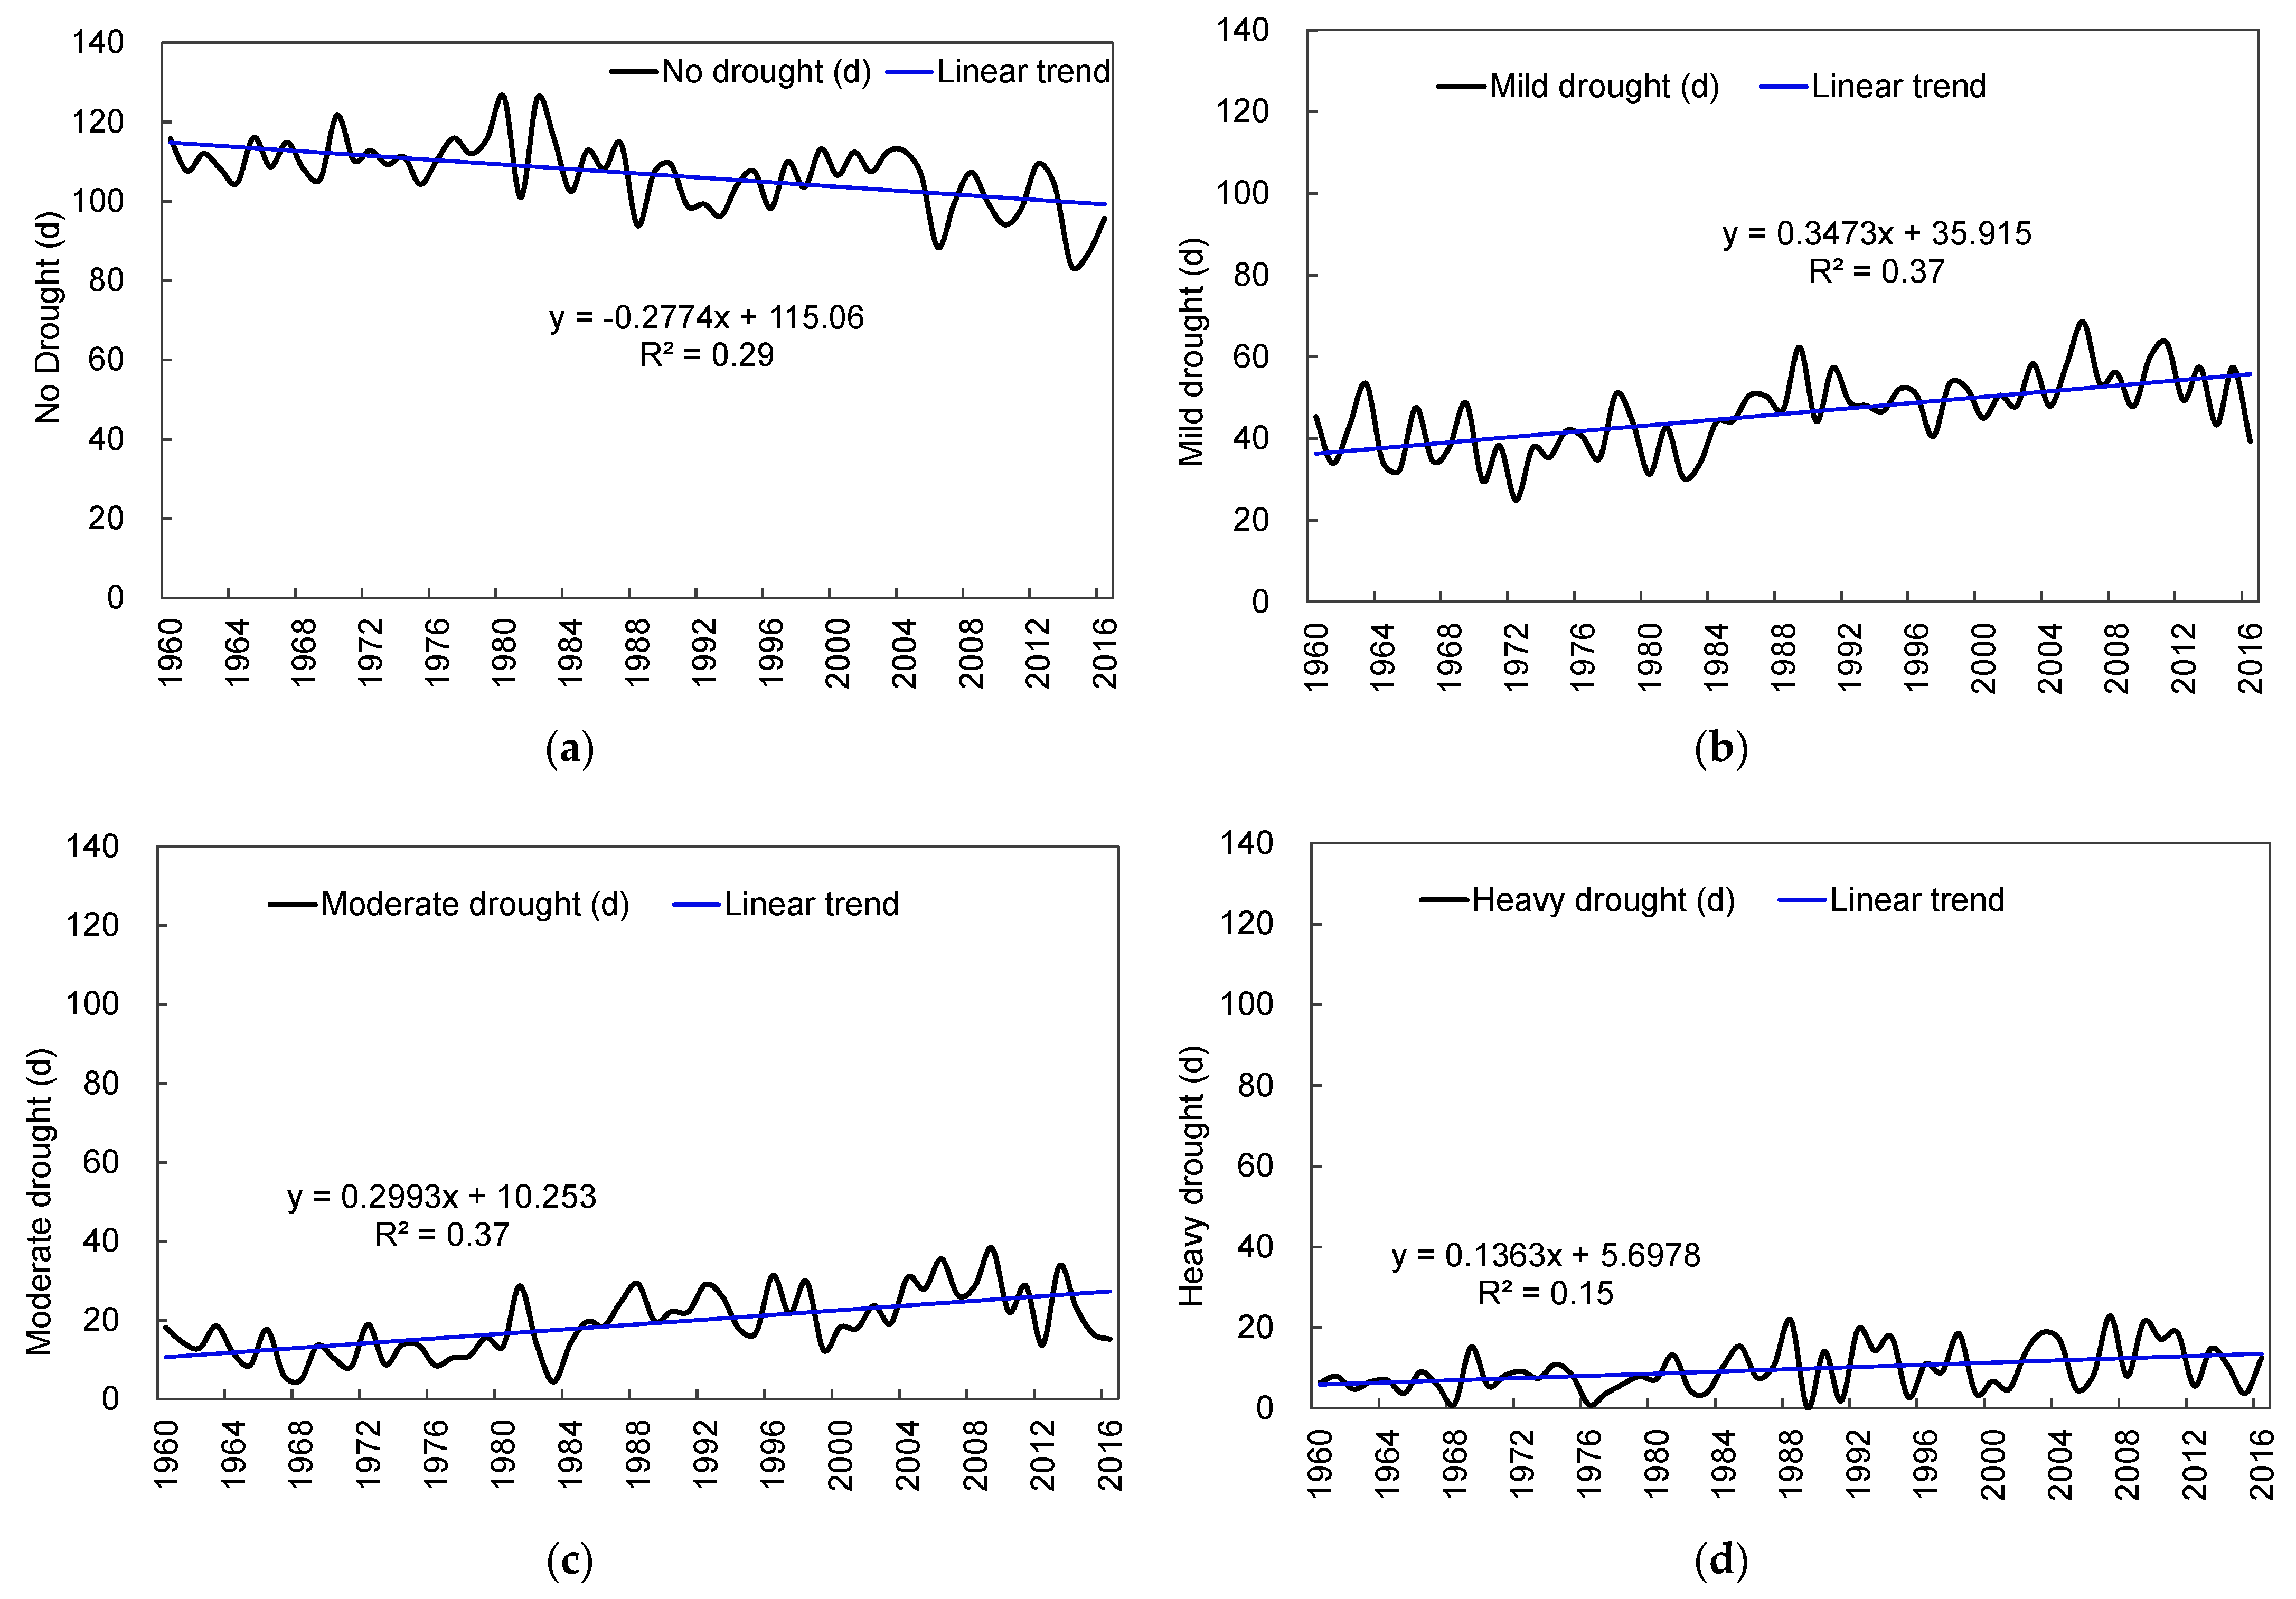
4.5. Variation Trend of Drought Based on Dnp Classification
Based on the classification of longest Dnp, the trends of four types of droughts have been derived. The trend of no drought slightly decreased by 2.8 d/10a, while mild, moderate, and heavy droughts slightly increased by 3.47, 2.99, and 1.36 d/10a, respectively, in Guizhou (Figure 10). There were increases in mild, medium, and heavy droughts, which was consistent with the increasing trends of yearly Dnp (Figure 2), seasonally average Dnp (Figure 5), the longest Dnp (Figure 6), and seasonally longest Dnp (Figure 8). In particular, the increases in the longest Dnp might be the leading cause of the increasing heavy droughts. To be specific, mild droughts were observed in summer, and a significant increasing trend in moderate drought was also inspected in spring (Table 1).
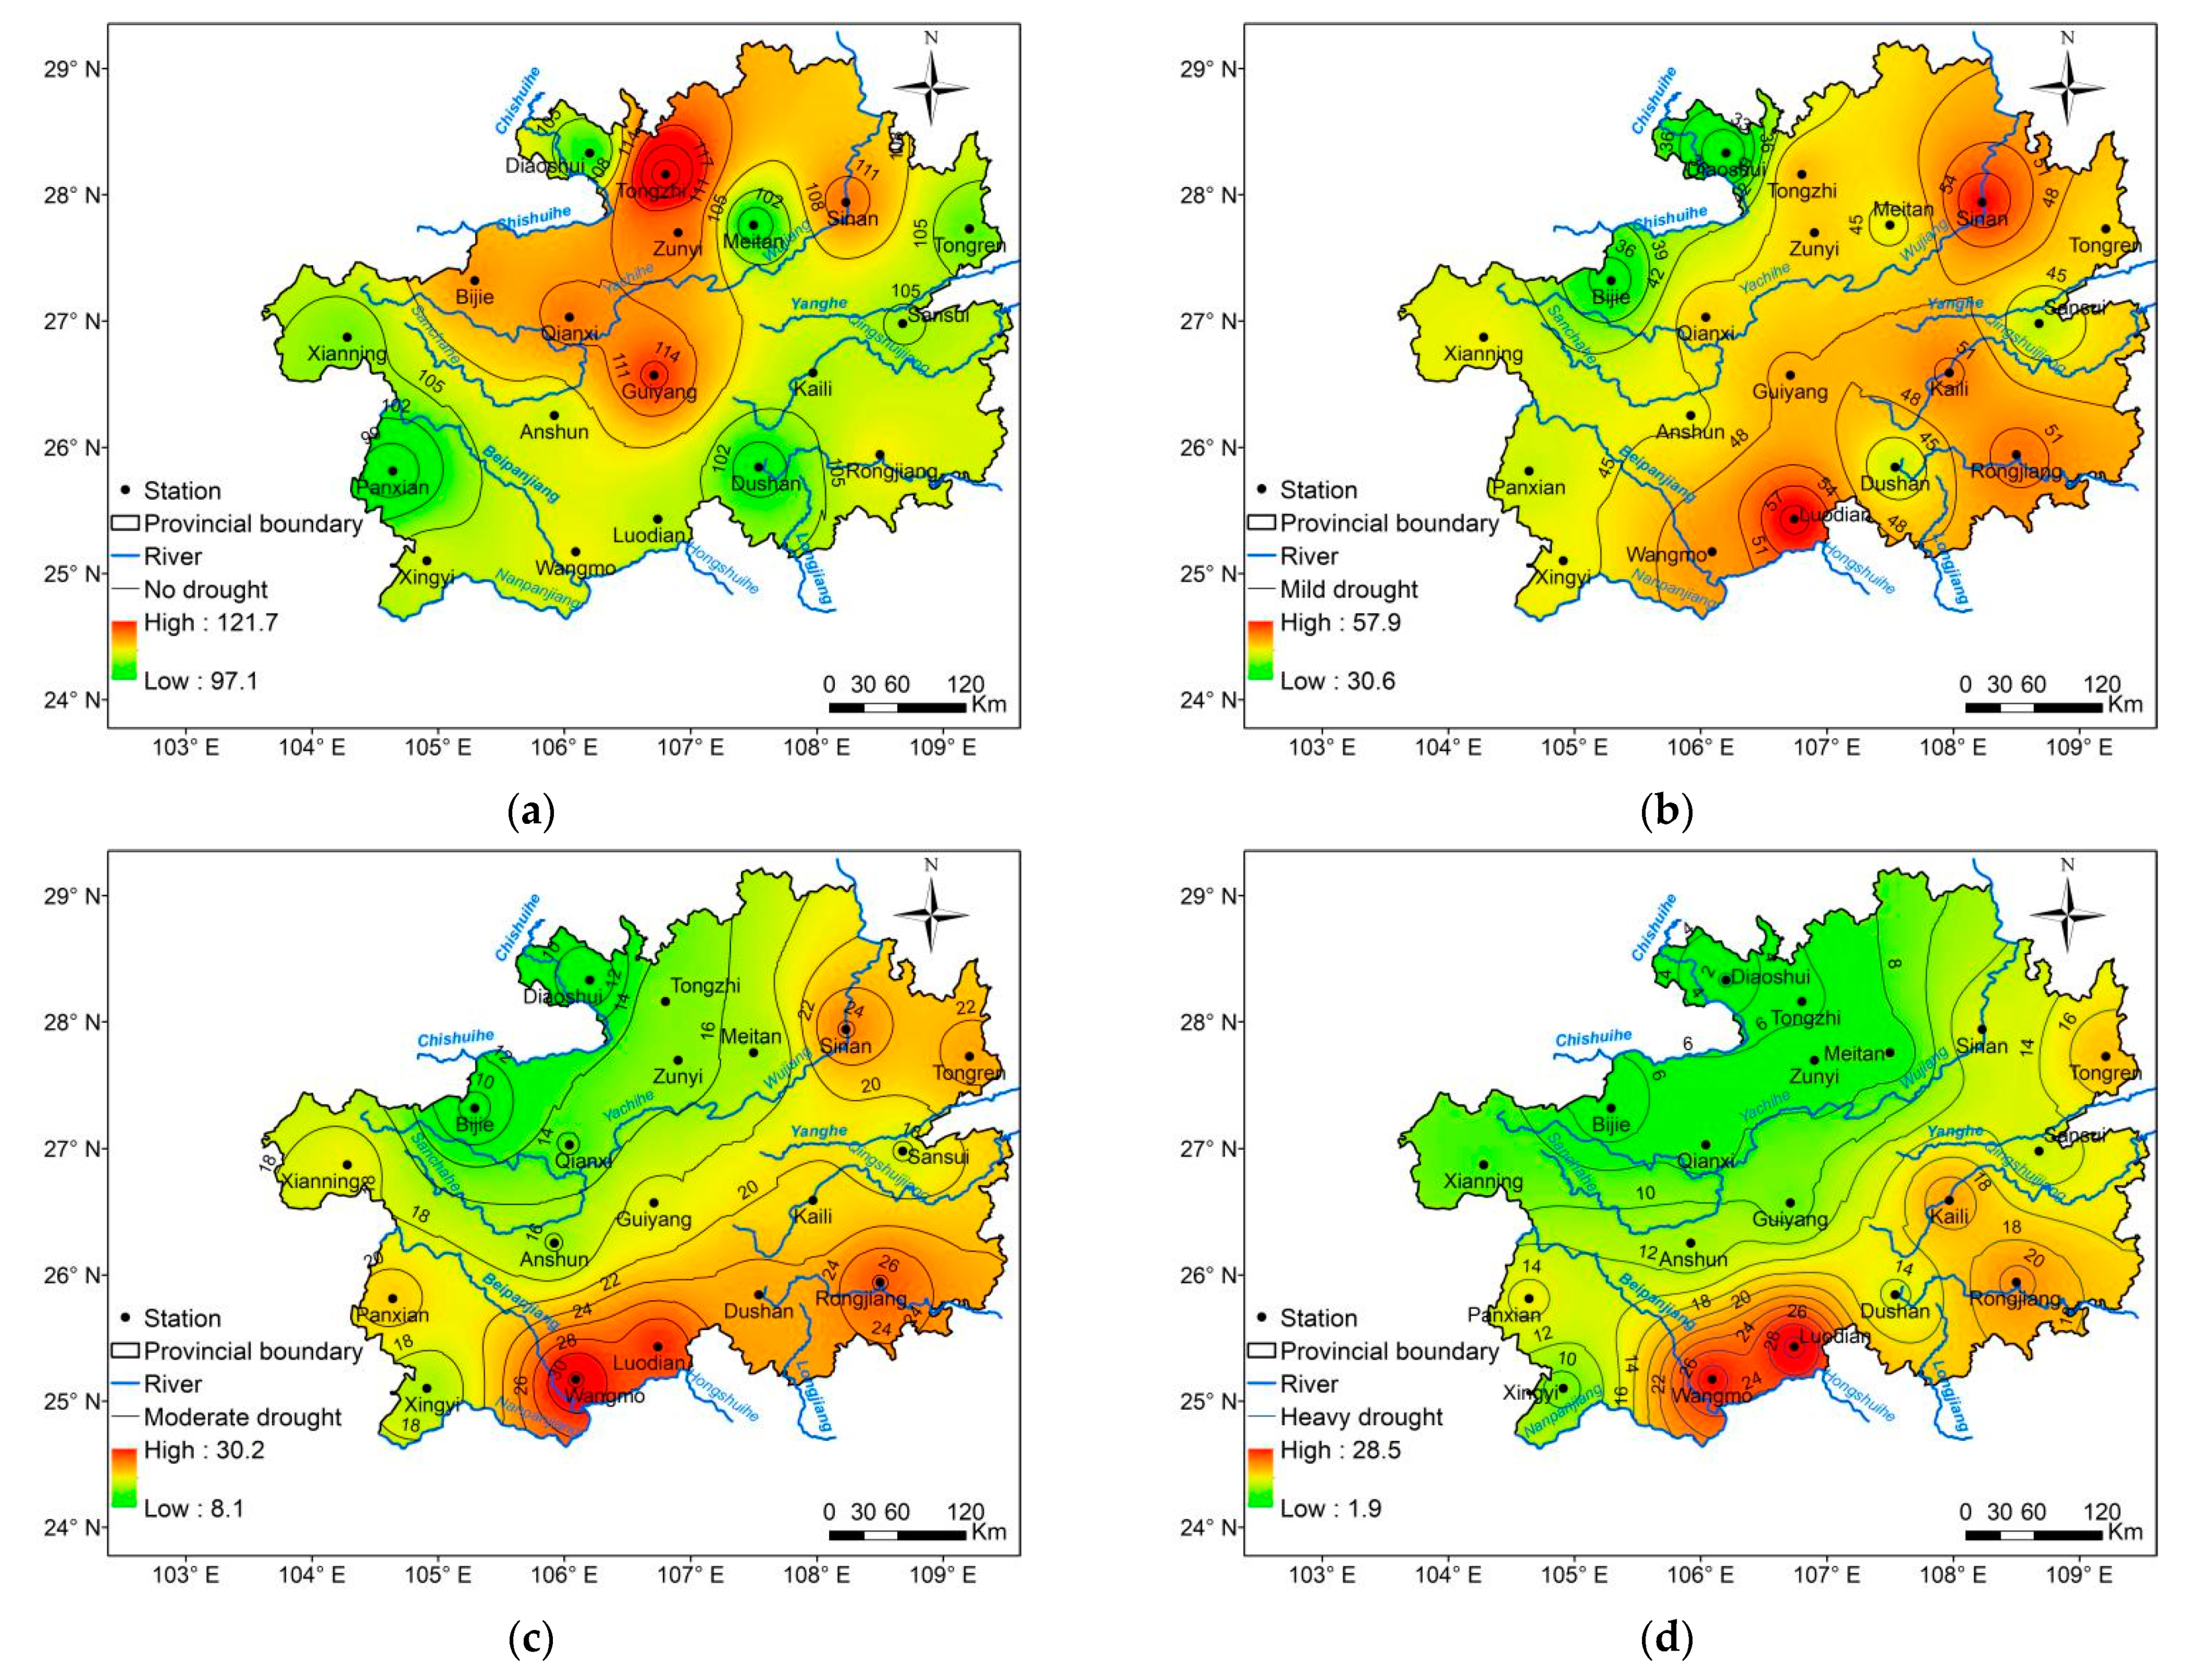
The spatial variations of the four levels of droughts were also obvious, as indicated in Figure 11. The no droughts were concentrated in the northern and central parts of Guizhou province. The mild droughts were in general uniform in the spatial domain, ranging from 30.6 to 57.9 d. The spatial distribution of moderate droughts and heavy droughts were similar, which were characterized by large Dnp values in southwestern (Wangmo, Luodian, and Rongjiang) Guizhou, and followed by the northeast (Tongren). The Dnp values of moderate and heavy droughts decreased from southeast to northwest.
4.6. The Relationship between Dnp and Elevation
The terrain in Guizhou is hilly, with mountainous area accounting for 92.5% of the total. Precipitation is greatly affected by terrain, leading to three rainy centers and three less rain centers in Guizhou province. The three rainy centers, which are located in the northward channel of the southwest warm-humid airflow, are (i) the western windward slopes of the Miaoling Mountain area (Xingyi-Anshun area); (ii) the windward slopes of the eastern Miaoling Mountain area (Duyun-Dushan area), and (iii) the windward slopes of the Wuling Mountains area (Tongren-Songtao area). The three less-rain centers are located in the leeward slopes of the Wumeng mountain area (Xianning-Hezhang-Bijie area), the Daozhen-Zheng’an-Tongzhi area on the leeward slope in northwest side of the Dalou mountain area, and the Shibing-Zhenyuan area in the Wuyanghe river Basin. Due to high altitude, the climate also varies dramatically in the vertical direction. “Four seasons” could exist in a mountain, and different climates could be found within ten miles in Guizhou province. Hence, it is essential to detect the relationships between the elevation and the related indicators of Dnp (Average Dnp and Long days of Dnp in yearly and seasonal scale, and different levels of Dnp).
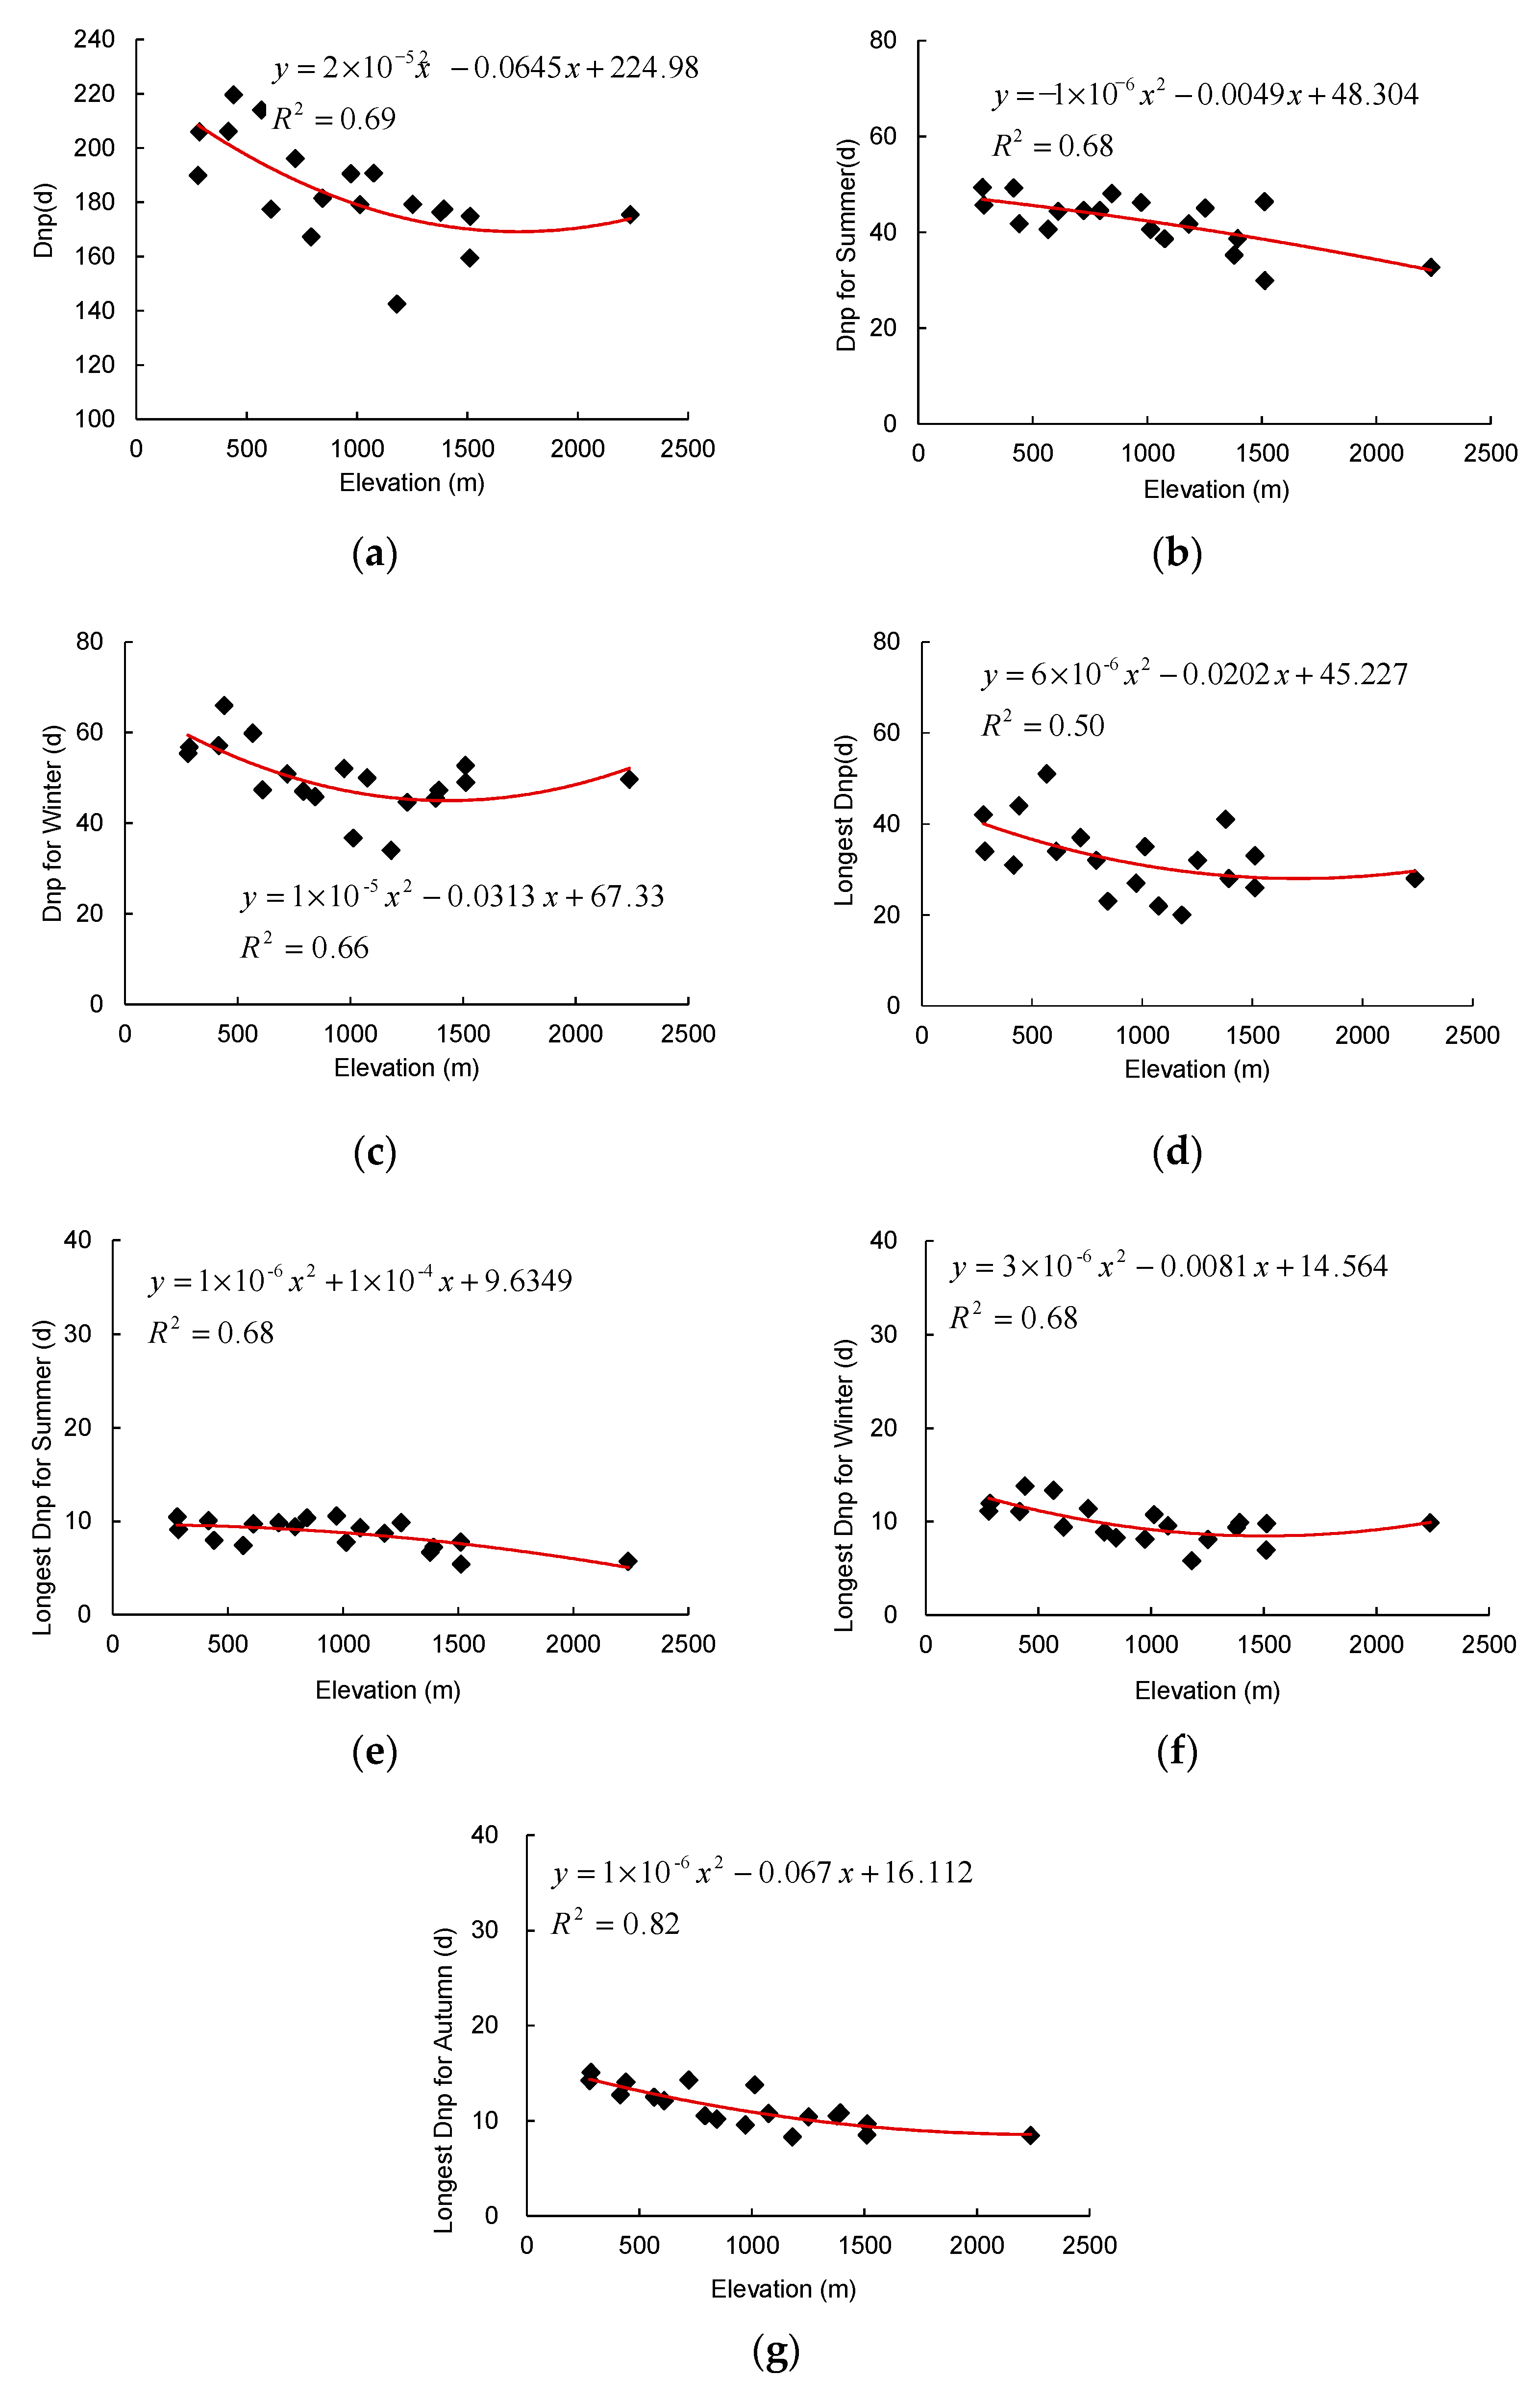
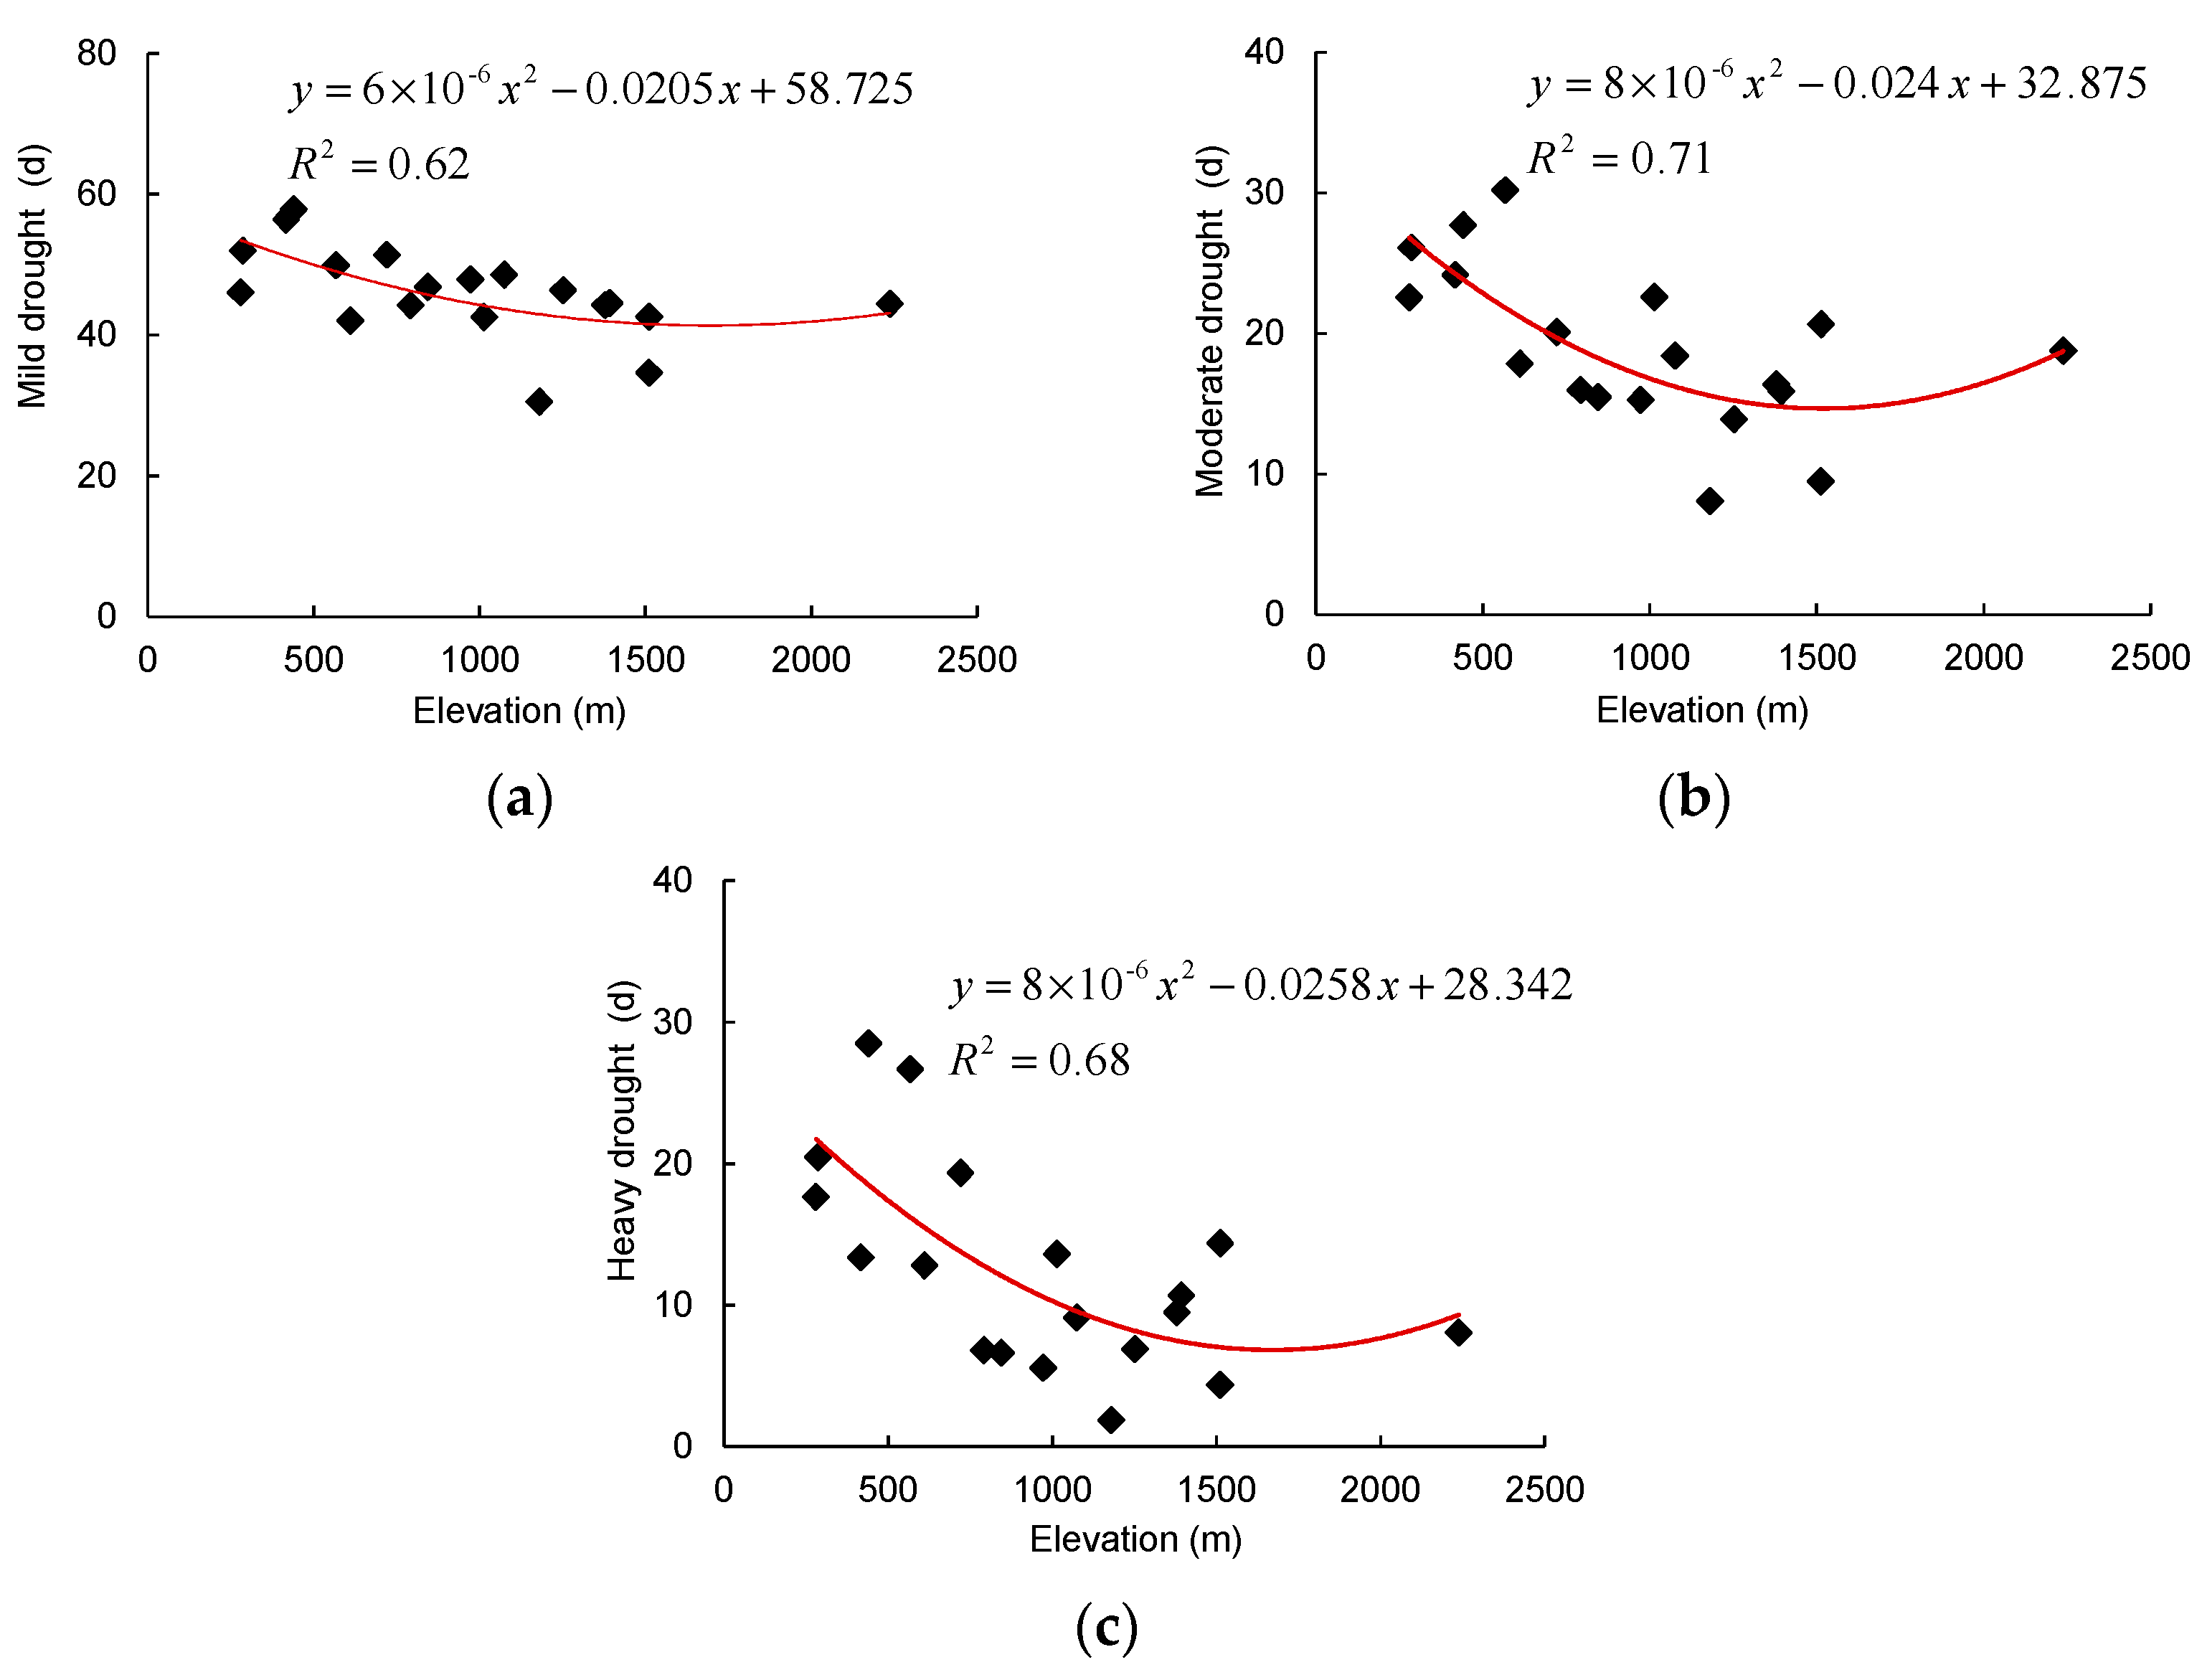
Figure 12 shows the correlations of Dnp and longest Dnp (d) versus elevation with fitting curves with the correlation coefficients. The Dnp related indicators are significantly negatively correlated with elevation. To be specific, the Dnp trends decreased significantly with elevation, and the correlation coefficients were between 0.5 and 0.82 based on polynomial regression analysis. Particularly, as shown in Figure 13, the correlation coefficients between Dnp, different levels of Dnp, and elevation were between 0.6 and 0.7.
The moisture in Guizhou mainly comes from southwest monsoon in summer, and the rainy season is in general from May to October. The rainy season of Guizhou starts at spring and ends at autumn every year, though the beginning and end of the rainy season are quite different in each year. Sometimes the rainy season comes early, and sometimes it ends late. Furthermore, the rainy days in spring and autumn varied significantly, but there is more moderate to heavy rainfall in summer and less rainfall in winter. Therefore, there are close correlations between Dnp and elevation in summer and winter with relatively large correlation coefficients, while there are less immediate correlations in spring and autumn. The longest Dnp were also affected by elevation, especially in summer, winter, and autumn. The correlation between the longest Dnp and elevation in spring was not close, because the longest Dnp in spring was concentrated in only a small part of the western part. Similarly, for the correlation between different levels of Dnp and elevation, only the correlation coefficient of no drought is not clear, the reason may be that the no drought of Dnp is mainly concentrated in central and northern regions where the terrain is relatively flat. Therefore, although many studies highlighted the strong control of orography on precipitation spatial distribution in mountainous areas, the elevation effect is not obvious. This is due to the complex combination of factors, which can influence the precipitation process [56,57], for example, soil production, land degradation, and sustainable land management [58,59].
The reduction of precipitation, the continuous expansion of the reduced area and the increase of Dnp, have made the future drought situation in this region become more severe, leading to great challenges in water resources management and planning. In fact, insufficient water is the root cause of drought. The indicator of the continuous days without available precipitation (Dnp) is adopted in this study to analyze the changes of drought in Guizhou province, which has been used to characterize precipitation. This method was used to evaluate the crop drought is south China [60], which was proved to be efficient. This method, however, might be subject to uncertainties since it fails in taking account of the crop water requirement and seasonal variations, which should be considered in the future work.
5. Conclusions
In this study, a daily rainfall database during 1960–2016 from 19 rain gauges stations has been compiled for Guizhou province in Southwest China. The spatial and temporal variations of yearly and seasonal Dnp and longest Dnp have been analyzed; the Dnp values and droughts have been classified into different categories; and the relationships between Dnp and droughts have been revealed. Special attention has also been paid to discuss the relationship between Dnp and elevation. The conclusions are as given below:
(1) A steep increasing trend of yearly Dnp has been observed. The seasonal Dnp shows significant increasing trends. Yearly and seasonal Dnp varies significantly in the space domain. The values of yearly Dnp in the south are larger than those in the north, and those in the east are larger than those in the west. The spatial distributions vary in different seasons. High values center on the western part in spring, while high values appear in the eastern part in summer. The distributions in autumn and winter are similar and almost identical to the annual distribution.
(2) There are slight increases in yearly and four seasonal longest Dnp values. The increase in the spring and summer season is not significant, heavy droughts tend to occur at this same time. Because spring is the season of crop planting, summer season is the key season for crop growth, it would have a high negative impact on the crop if severe drought happens.
(3) There is only decrease in no drought, while there is significant increase in the other three levels of droughts. The mild droughts increase significantly in summer, and the moderate droughts increase significantly in spring. Different levels of Dnp also vary in the spatial domain. The no drought concentrates in the northern and central parts, while the other three levels of Dnp are mainly in eastern and southern parts.
(4) The elevation effect on precipitation is not obvious in Guizhou province. The Dnp trend decreases in general as the elevation increases.
(5) This method, however, might be subject to uncertainties since it fails to take account of the crop water requirement and seasonal variations, which should be considered in future work.
Author Contributions
Conceptualization, N.X.Q. and L.G.; methodology, N.X.Q., J.N.W., Q.Q.L., J.L.H. and M.H.L.; validation, N.X.Q., J.N.W. and Y.H.; formal analysis, L.G.; investigation, N.X.Q. and J.N.W.; resources, Y.H.; data curation, L.G.; writing—original draft preparation, N.X.Q.; writing—review and editing, L.G.; visualization, N.X.Q., Q.Q.L., J.L.H., M.H.L. and L.G.; supervision, L.G.; project administration, N.X.Q. and L.G.; funding acquisition, N.X.Q. and L.G. All authors have read and agreed to the published version of the manuscript.
Funding
This research was funded by National Natural Science Foundation of China (Grant No.41461007). This paper is financially supported by the Science and Technology Development Fund, Macau SAR (File no.: SKL-IOTSC-2021-2023, 0030/2020/A1, and 0021/2020/ASC), UM Research Grant (File no.: SRG2019-00193-IOTSC, and MYRG2020-00072-IOTSC) and CORE(EF017/IOTSC-GL/2020/HKUST). CORE is a joint research center for ocean research between QNLM and HKUST.
Institutional Review Board Statement
Not applicable.
Informed Consent Statement
Informed consent was obtained from all subjects involved in the study.
Data Availability Statement
The data in this study subject to third party restrictions. The data that support the findings of this study are available from the National Climate Centre in Beijing, China. Restrictions apply to the availability of these data, which were used under license for this study. Data are available at https://data.cma.cn/en (accessed on 9 January 2021) with the permission of National Climate Centre in Beijing, China.
Acknowledgments
We would like to thank the National Climate Centre in Beijing, China, for providing climate data.
Conflicts of Interest
The authors declare no conflict of interest.
References
- Dai, A. Drought under global warming: A review. Wiley Interdiscip. Rev. Clim. Chang. 2011, 2, 45–65. [Google Scholar] [CrossRef] [Green Version]
- Kelley, C.P.; Mohtadi, S.; Cane, M.A.; Seager, R.; Kushnir, Y. Climate change in the Fertile Crescent and implications of the recent Syrian drought. Proc. Natl. Acad. Sci. USA 2015, 112, 3241–3246. [Google Scholar] [CrossRef] [PubMed] [Green Version]
- Black, R.; Adger, W.N.; Arnell, N.W.; Dercon, S.; Geddes, A.; Thomas, D. The effect of environmental change on human migration. Glob. Environ. Chang. 2011, 21, S3–S11. [Google Scholar] [CrossRef]
- McLeman, R.A. Settlement abandonment in the context of global environmental change. Glob. Environ. Chang. 2011, 21, 108–120. [Google Scholar] [CrossRef]
- Wang, W.; Zhu, Y.; Xu, R.; Liu, J. Drought severity change in China during 1961–2012 indicated by SPI and SPEI. Nat. Hazards 2015, 75, 2437–2451. [Google Scholar] [CrossRef]
- Chen, X.; Xu, J.; Lei, H. Spatial and temporal distribution characteristics of drought and its regional response to climate change in Guizhou province. J. Irrig. Drain. 2015, 34, 72–81. (In Chinese) [Google Scholar]
- Mathew, B.; Benjamin, Z.; Shlomit, P.A. Review of drought in the Middle East and Southwest Asia. J. Clim. 2016, 29, 8547–8574. [Google Scholar]
- Richard, R.; Heim, J.R. A comparison of the early twenty-first century drought in the United States to the 1930s and 1950s drought episodes. Bull. Am. Meteorol. Soc. 2017, 12, 2570–2592. [Google Scholar]
- Achite, M.; Buttafuoco, G.; Toubal, K.A.; Lucà, F. Precipitation spatial variability and dry areas temporal stability for different elevation classes in the Macta basin (Algeria). Environ. Earth Sci. 2017, 76, 458. [Google Scholar] [CrossRef]
- Mohmmed, A.; Zhang, K.; Kabenge, M.; Keesstra, S.; Cerdà, A.; Reuben, M.; Elbashier, M.A.A.; Dalson, T.; Ali, A.A.S. Analysis of drought and vulnerability in the North Darfur region of Sudan. Land Degrad. Dev. 2018, 29, 4424–4438. [Google Scholar] [CrossRef]
- Hazbavi, Z.; Baartman, J.E.; Nunes, J.P.; Keesstra, S.D.; Sadeghi, S.H. Changeability of reliability, resilience and vulnerability indicators with respect to drought patterns. Ecol. Indic. 2018, 87, 196–208. [Google Scholar] [CrossRef]
- Sun, R.Q. Review of drought definition and its indicators. Disaster 1994, 9, 1722. [Google Scholar]
- Zhou, X.; Zhang, Q.; Wang, Y.; Gao, G. Drought indices and operational drought monitoring in the U.S.A. and China. Meteorol. Mon. 2005, 31, 6–9. [Google Scholar]
- Li, B.Z.; Zhou, G.S. Advance in the study on drought index. Acta Ecol. Sin. 2014, 34, 1043–1052. [Google Scholar]
- Zou, R.; Chen, J. Review on the research progress of drought forecasting. Disaster 2005, 20, 112–116. [Google Scholar]
- Kalantari, Z.; Ferreira, C.S.S.; Keesstra, S.; Destouni, G. Nature-based solutions for flood-drought risk mitigation in vulnerable urbanizing parts of East-Africa. Curr. Opin. Environ. Sci. Health 2018, 5, 73–78. [Google Scholar] [CrossRef]
- MOhmmed, A.; Li, J.; Elaru, J.; Elbashier, M.M.; Keesstra, S.; Artemi, C.; Martin, K.; Reuben, M.; Teffera, Z. Assessing drought vulnerability and adaptation among farmers in Gadaref region, Eastern Sudan. Land Use Policy 2018, 70, 402–413. [Google Scholar] [CrossRef] [Green Version]
- Dalezios, N.R.; Blanta, A.; Spyropoulos, N.V. Assessment of remotely sensed drought features in vulnerable agriculture. Nat. Hazards Earth Syst. Sci. 2012, 12, 3139–3150. [Google Scholar] [CrossRef] [Green Version]
- Wang, H.J.; Chen, Y.N.; Pan, Y.P.; Chen, Z.S.; Ren, Z.G. Assessment of candidate distributions for SPI/SPEI and sensitivity of drought to climatic variables in China. Int. J. Climatol. 2019, 39, 4392–4412. [Google Scholar] [CrossRef]
- Yao, N.; Li, Y.; Lei, T.J.; Peng, L.L. Drought evolution, severity and trends in mainland China over 1961–2013. Sci. Total Environ. 2018, 616–617, 73–89. [Google Scholar] [CrossRef]
- Liu, L.H.; Zhai, P.M.; Zheng, Z.G.; Liu, X.L.; Chen, T. Temporal and spatial variations of the drought in the warm half year over Northern China. Prog. Geogr. 2011, 30, 1380–1386. [Google Scholar]
- Lan, X.L.; Sun, H.L.; Xu, Y.F. The space-time pattern of vegetation NPP and its response to climate change in Guizhou province. Anhui Agri. Sci. Bull. 2020, 26, 162–166. (In Chinese) [Google Scholar]
- Ye, X.J. Spatial and Temporal Characteristics of Climate Change in Guizhou in Recent 30 Years. Anhui Agric. Sci. Bull. 2018, 24, 132–192. (In Chinese) [Google Scholar]
- Liao, L.F.; Yang, F.Y.; Zhang, D.H.; Zuo, J. Characteristics analysis of the summer drought in Guizhou under the background of climate change. Mid-Low Latit. Mt. Meteorol. 2019, 43, 29–33. (In Chinese) [Google Scholar]
- Han, L.Y.; Zhang, Q.; Yao, Y.B.; Li, Y.P.; Jia, J.Y.; Wang, J. Characteristics and origins of drought disasters in Southwest China in nearly 60 years. Acta Geogr. Sin. 2014, 69, 632–639. (In Chinese) [Google Scholar]
- Luo, Y.; Tian, M.Q.; Wu, H.L.; Wang, M.C.; Zhang, J. Analysis of the spatial and time distribution and climate of agricultural drought in Guzhou. Jiling Agric. 2019, 108–111. (In Chinese) [Google Scholar] [CrossRef]
- Yao, Z.L. The characteristics of climate change in the temperature of Zunyi City in the past 50 years. Guizhou Meteorol. 2001, 25, 16–18. (In Chinese) [Google Scholar]
- Zhang, Y.R.; Zhou, Z.F.; Yan, L.H. On climate change characteristics of the typical ecologically vulnerable karst area in the recent 25 years. J. Anhui Normal Univ. (Nat. Sci.) 2015, 38, 474–478. (In Chinese) [Google Scholar]
- Guizhou Quality and Technology Supervision Bureau. The Drought Standards in Guizhou Province; Standards Press of China: Beijing, China, 2006. (In Chinese) [Google Scholar]
- Dracup, J.A.; Lee, K.S.; Paulson, E.G. On the definition of droughts. Water Resour. Res. 1980, 16, 297–303. [Google Scholar] [CrossRef]
- Gong, D.Y.; Wang, J.A.; Han, H. Trends of summer dry spells in china during the late twentieth century. Meteorol. Atmos. Phys. 2005, 88, 203–214. [Google Scholar] [CrossRef]
- Lana, X.; Burguefio, A.M.D.; Martínez, S.C. Statistical distributions and sampling strategies for the analysis of extreme dry spells in catalonia (NE Spain). J. Hydrol. 2006, 324, 94–114. [Google Scholar] [CrossRef]
- Nastos, P.T.; Zerefos, C.S. Spatial and temporal variability of consecutive dry and wet days in Greece. Atmos. Res. 2009, 94, 616–628. [Google Scholar] [CrossRef]
- Qin, N.X.; Wang, J.N.; Gao, L.; Hong, Y.; Huang, J.L.; Lu, Q.Q. Observed trends of different rainfall intensities and the associated spatiotemporal variations during 1958–2016 in Guangxi. China. Int. J. Climatol. 2020, 41, 2896–2912. [Google Scholar] [CrossRef]
- Shen, D.; Shang, C.; Fang, X.; Xu, J. Spatial-temporal characteristics of drought duration and drought severity in Guizhou. J. Arid Land Res. Environ. 2016, 30, 138–143. (In Chinese) [Google Scholar]
- Wang, Z.; Qin, J.; Chen, X. Variations in longest consecutive dry days in dry season in the Dongjiang River Basin. Geogr. Res. 2011, 30, 1693–1701. [Google Scholar]
- Mann, H.B. Rank Correlation Methods Nonparametric test against trend. Econometrica 1945, 13, 245–259. [Google Scholar] [CrossRef]
- Kendall, M.G. Rank Correlation Methods, 4th ed.; Charles; Griffin: London, UK, 1975; Available online: https://www.researchgate.net/publication/264959683_Rank_Correlation_Methods (accessed on 9 January 2021).
- Helsel, D.R.; Hirsch, R.M.; Ryberg, K.R.; Archfield, S.A.; Gilroy, E.J. Statistical Methods in Water Resources: U.S. Geological Survey Techniques and Methods; 2020; Book 4; Chapter A3; 458p, Available online: https://doi.org/10.3133/tm4a3 (accessed on 9 January 2021).
- Sen, Z. Trend identification simulation and application. J. Hydrol. Eng. 2014, 19, 635–642. [Google Scholar] [CrossRef]
- Hirsch, R.M.; Slack, J.R.; Smith, R.A. Techniques of trend analysis for monthly water quality data. Water Resour. Res. 1982, 18, 107–121. [Google Scholar] [CrossRef] [Green Version]
- Xu, Z.; Li, J.Y.; Liu, C.M. Long-term trend analysis for major climate variables in the Yellow River basin. Hydrol. Process. 2007, 21, 1935–1948. [Google Scholar] [CrossRef]
- Fu, G.B.; Charles, S.P.; Yu, J.J.; Liu, C.M. Decadal climatic variability, trends, and future scenarios for the north china plain. J. Clim. 2009, 22, 2111–2123. [Google Scholar] [CrossRef]
- Sen, P.K. Estimates of the regression coefficient based on Kendall’s tau. J. Am. Stat. Assoc. 1968, 63, 1379–1389. [Google Scholar] [CrossRef]
- Qin, N.X.; Chen, X.; Fu, G.B.; Zhai, J.Q.; Xue, X.W. Precipitation and temperature trends for the southwest china: 1960–2007. Hydrol. Process. 2010, 24, 3733–3744. [Google Scholar] [CrossRef]
- Shepard, D. A two-dimensional interpolation function for irregularly-spaced data. In Proceedings of the 1968 23rd ACM National Conference, New York, NY, USA, 27–29 August 1968; ACM: New York, NY, USA, 1968; pp. 517–524. [Google Scholar]
- Kurtzman, D.; Kadmon, R. Mapping of temperature variables in israel: A comparison of different interpolation methods. Clim. Res. 1999, 13, 33–43. [Google Scholar] [CrossRef] [Green Version]
- Guizhou Institute of Water Conservancy Research. Evaluation of Drought Disaster and Drought Relief Work in Guizhou Province from 2009 to 2010; The Yellow River Water Conservancy Press: Zhengzhou, China, 2012; Available online: https://www.jarhu.com/book-368688.html (accessed on 9 January 2021). (In Chinese)
- Zhang, Y.; Ma, S.; Yan, L. Variation Characteristics of Precipitation Events in Guizhou Province in Recent 55 Years. J. Yangtze River Sci. Res. Inst. 2017, 34, 40–44. [Google Scholar]
- Guo, X.L.; Yang, Y.; Li, Z.S.; You, L.Z.; Zeng, C.; Cao, J.; Hong, Y. Drought Trend Analysis Based on the Standardized Precipitation–Evapotranspiration Index Using NASA’s Earth Exchange Global Daily Downscaled Projections, High Spatial Resolution Coupled Model Intercomparison Project Phase 5 Projections, and Assessment of Potential Impacts on China’s Crop Yield in the 21st Century. Water. 2019, 11, 2455. [Google Scholar] [CrossRef] [Green Version]
- Zeng, Z.Q.; Wu, W.X.; Li, Z.L.; Zhou, Y.; Guo, Y.H.; Huang, H. Agricultural Drought Risk Assessment in Southwest China. Water. 2019, 11, 1064. [Google Scholar] [CrossRef] [Green Version]
- Xiao, L.Y.; Chen, X.; Zhang, R.R.; Zhang, Z.C. Spatiotemporal evolution of droughts and their teleconnections with large-scale climate indices over guizhou province in southwest china. Water 2019, 11, 2104. [Google Scholar] [CrossRef] [Green Version]
- Jiang, P.; Cai, F.; Zhao, Z.Q.; Meng, Y.; Gao, L.Y.; Zhao, T.H. Physiological and dry matter characteristics of spring maize in northeast china under drought stress. Water 2018, 10, 1561. [Google Scholar] [CrossRef] [Green Version]
- Dawd, T.; Venkatesh, U.; Ghazal, M.E.; Annette, H.; Stephen, E.O. Long-term drought trends in ethiopia with implications for dryland agriculture. Water 2019, 11, 2571. [Google Scholar]
- Ishanch, Q.; Shiru, M.S.; Sharafati, A.; Ahmed, K.; Wang, X. Seasonal drought pattern changes due to climate variability: Case study in afghanistan. Water 2019, 11, 1096. [Google Scholar] [CrossRef] [Green Version]
- Keesstra, S.D.; Bouma, J.; Wallinga, J.; Tittonell, P.; Smith, P.; Smith, P.; Cerdà, A.; Montanarella, L.; Quinton, J.N.; Pachepsky, Y.; et al. The significance of soils and soil science towards realization of the United Nations Sustainable Development Goals. Soil 2016, 2, 111–128. [Google Scholar] [CrossRef] [Green Version]
- Buttafuoco, G.; Lucà, F. Accounting for elevation and distance to the nearest coastline in geostatistical mapping of average annual precipitation. Environ. Earth Sci. 2020, 79, 149. [Google Scholar] [CrossRef]
- Keesstra, S.; Mol, G.; de Leeuw, J.; Okx, J.; Molenaar, C.; de Cleen, M.; Visser, S. Soil-related sustainable development goals: Four concepts to make land degradation neutrality and restoration work. Land 2018, 7, 133. [Google Scholar] [CrossRef] [Green Version]
- Visser, S.; Keesstra, S.; Maas, G.; De Cleen, M. Soil as a Basis to Create Enabling Conditions for Transitions Towards Sustainable Land Management as a Key to Achieve the SDGs by 2030. Sustainability 2019, 11, 6792. [Google Scholar] [CrossRef] [Green Version]
- Huang, W.H.; Sui, Y.; Yang, X.G.; Dai, S.W.; Qu, H.H.; Li, M.S. Spatio-temporal characteristics of crop drought in southern China based on drought index of continuous days without available precipitation. Trans. Chin. Soc. Agric. Eng. 2014, 30, 125–135. [Google Scholar]
Figure 1.
(a) The location of study area, (b) the topography, and (c) the distribution of annual rainfall in Guizhou.
Figure 1.
(a) The location of study area, (b) the topography, and (c) the distribution of annual rainfall in Guizhou.

Figure 2.
The spatial distribution of meteorological stations in Guizhou.

Figure 3.
The spatial distribution of yearly Dnp (the drought indicator of continuous days without available precipitation).
Figure 3.
The spatial distribution of yearly Dnp (the drought indicator of continuous days without available precipitation).

Figure 4.
The temporal changes of seasonally average Dnp in (a) spring, (b) summer, (c) autumn, (d) winter.
Figure 4.
The temporal changes of seasonally average Dnp in (a) spring, (b) summer, (c) autumn, (d) winter.

Figure 5.
The spatial variations of seasonally average Dnp in (a) spring, (b) summer, (c) autumn, (d) winter.
Figure 5.
The spatial variations of seasonally average Dnp in (a) spring, (b) summer, (c) autumn, (d) winter.

Figure 6.
(a) Temporal variation of longest Dnp and (b) occurrences.

Figure 7.
The spatial distribution of longest Dnp.

Figure 8.
The temporal changes of seasonally longest Dnp in (a) spring, (b) summer, (c) autumn, (d) winter.
Figure 8.
The temporal changes of seasonally longest Dnp in (a) spring, (b) summer, (c) autumn, (d) winter.

Figure 9.
The spatial variations of average longest Dnp in (a) spring, (b) summer, (c) autumn, (d) winter.
Figure 9.
The spatial variations of average longest Dnp in (a) spring, (b) summer, (c) autumn, (d) winter.

Figure 10.
The temporal changes of (a) no drought, (b) mild drought, (c) moderate drought, (d) heavy drought.
Figure 10.
The temporal changes of (a) no drought, (b) mild drought, (c) moderate drought, (d) heavy drought.

Figure 11.
The spatial variations of (a) no drought, (b) mild drought, (c) moderate drought, (d) heavy drought.
Figure 11.
The spatial variations of (a) no drought, (b) mild drought, (c) moderate drought, (d) heavy drought.

Figure 12.
(a) Dnp, (b) Dnp in summer, (c) Dnp in winter, (d) longest Dnp, (e) longest Dnp in summer, (f) longest Dnp in winter, (g) longest Dnp in autumn versus elevation.
Figure 12.
(a) Dnp, (b) Dnp in summer, (c) Dnp in winter, (d) longest Dnp, (e) longest Dnp in summer, (f) longest Dnp in winter, (g) longest Dnp in autumn versus elevation.

Figure 13.
Relationship between (a) mild drought, (b) moderate drought, (c) heavy drought and elevation.
Figure 13.
Relationship between (a) mild drought, (b) moderate drought, (c) heavy drought and elevation.


Table 1.
MK values for different classifications of Dnp.
| Items | MK Value | Items | MK Value |
|---|---|---|---|
| Annual Mean Dnp | 5.05 | Annual days with slight drought | 4.82 |
| Mean Dnp in spring | 1.92 | Slight drought in spring | 0.83 |
| Mean Dnp in summer | 2.13 | Slight drought in summer | 2.30 |
| Mean Dnp in autumn | 5.04 | Slight drought in autumn | 3.75 |
| Mean Dnp in winter | 1.78 | Slight drought in winter | 2.42 |
| Longest Dnp | 2.98 | Annual days with moderate drought | 4.74 |
| Longest period in spring | 0.42 | Moderate drought in spring | 1.94 |
| Longest period in summer | 0.48 | Moderate drought in summer | 0.94 |
| Longest period in autumn | 3.29 | Moderate drought in autumn | 4.63 |
| Longest period in winter | 2.32 | Moderate drought in winter | 2.69 |
| Annual days with no drought | −3.84 | Annual days with heavy drought | 2.64 |
| No drought in spring | 0.13 | Heavy drought in spring | 0.69 |
| No drought in summer | 0.55 | Heavy drought in summer | 0.56 |
| No drought in autumn | −3.98 | Heavy drought in autumn | 3.20 |
| No drought in winter | −5.02 | Heavy drought in winter | 1.84 |
Table 2.
Changes of seasonally mean Dnp.
| The Minimum Dnp (d) | The Longest Dnp (d) | More than 50d (a) | 60s (a) | 70s (a) | 80s (a) | 90s (a) | Since 2000s (a) | |
|---|---|---|---|---|---|---|---|---|
| Spring | 33 | 58 | 9 | 2 | - | 2 | - | 5 |
| Summer | 33 | 57 | 7 | - | 1 | 2 | - | 4 |
| Autumn | 35 | 76 | 26 | - | 1 | 3 | 8 | 14 |
| Winter | 35 | 63 | 29 | 3 | 4 | 7 | 5 | 10 |
Table 3.
Longest Dnp at each station.
| Station | Dates | Decades | Average Days | Months | Seasons | Days |
|---|---|---|---|---|---|---|
| Guiyang | 28 February 1966 to 11 March 1966 | 1960s | 27 | February–March | Winter, Spring | 22 |
| Qixi | 16 July 1966 to 16 August 1966 | 1960s | July–August | Summer | 32 | |
| Guiyang | 21 November 1983 to 13 December 1983 | 1980s | 27 | November–December | Winter | 22 |
| Meitan | 24 October 1988 to 25 November 1988 | 1980s | October–November | Autumn | 32 | |
| Sinan | 25 October 1988 to 25 November 1988 | 1980s | October–November | Autumn | 31 | |
| Weining | 20 November 1983 to 18 December 1983 | 1980s | November–December | Autumn, Winter | 28 | |
| Zunyi | 20 November 1983 to 13 December 1983 | 1980s | November–December | Autumn, Winter | 23 | |
| Sanhui | 10 August 1990 to 13 September 1990 | 1990s | 32 | August–September | Summer, Autumn | 34 |
| Tongren | 09 August 1990 to 20 September 1990 | 1990s | August–September | Summer, Autumn | 42 | |
| Xishui | 23 July 1992 to 12 August 1992 | 1990s | July–August | Summer | 20 | |
| Bijie | 05 August 2002 to 20 September 2002 | 2000s | 35.6 (37 for 2010s) | August–September | Summer, Autumn | 26 |
| Kaili | 29 October 2007 to 05 December 2007 | 2000s | October–December | Autumn, Winter | 37 | |
| Rongjiang | 31 September 2007 to 02 November 2007 | 2000s | September–November | Summer, Autumn | 34 | |
| Anshun | 08 February 2010 to 07 March 2010 | 2010s | February–March | Winter, Spring | 28 | |
| Dushan | 13 September 2016 to 18 October 2016 | 2010s | September–October | Summer, Autumn | 35 | |
| Luodian | 18 February 2010 to 03 April 2010 | 2010s | February–April | Winter, Spring | 44 | |
| Panxian | 22 February 2010 to 27 March 2010 | 2010s | February–March | Winter, Spring | 33 | |
| Tongzhi | 05 February 2010 to 03 March 2010 | 2010s | February–March | Winter, Spring | 27 | |
| Wangmo | 06 February 2010 to 29 March 2010 | 2010s | February–March | Winter, Spring | 51 | |
| Xingyi | 18 February 2010 to 31 March 2010 | 2010s | February–March | Winter, Spring | 41 |
Publisher’s Note: MDPI stays neutral with regard to jurisdictional claims in published maps and institutional affiliations. |
© 2021 by the authors. Licensee MDPI, Basel, Switzerland. This article is an open access article distributed under the terms and conditions of the Creative Commons Attribution (CC BY) license (http://creativecommons.org/licenses/by/4.0/).
Share and Cite
MDPI and ACS Style
Qin, N.X.; Wang, J.N.; Hong, Y.; Lu, Q.Q.; Huang, J.L.; Liu, M.H.; Gao, L. The Drought Variability Based on Continuous Days without Available Precipitation in Guizhou Province, Southwest China. Water 2021, 13, 660. https://doi.org/10.3390/w13050660
AMA Style
Qin NX, Wang JN, Hong Y, Lu QQ, Huang JL, Liu MH, Gao L. The Drought Variability Based on Continuous Days without Available Precipitation in Guizhou Province, Southwest China. Water. 2021; 13(5):660. https://doi.org/10.3390/w13050660
Chicago/Turabian StyleQin, N.X., J.N. Wang, Y. Hong, Q.Q. Lu, J.L. Huang, M.H. Liu, and L. Gao. 2021. "The Drought Variability Based on Continuous Days without Available Precipitation in Guizhou Province, Southwest China" Water 13, no. 5: 660. https://doi.org/10.3390/w13050660
Note that from the first issue of 2016, this journal uses article numbers instead of page numbers. See further details here.