
Variation in Seasonal Precipitation over Gaza (Palestine) and Its Sensitivity to Teleconnection Patterns


Division of Sustainable Development, College of Science and Engineering, Hamad Bin Khalifa University, Qatar Foundation, P.O. Box, Doha 34110, Qatar
*
Authors to whom correspondence should be addressed.
Water 2021, 13(5), 667; https://doi.org/10.3390/w13050667
Submission received: 21 January 2021
/
Revised: 19 February 2021
/
Accepted: 25 February 2021
/
Published: 1 March 2021
(This article belongs to the Special Issue Climatic Trends and Impacts of Global Change in Europe and in the Mediterranean Basin)
Abstract
:The seasonal precipitation (SP) trend and its sensitivity to teleconnection patterns over the East Mediterranean (EM) region remain inconsistent. Based on rainfall records during 1974–2016 at seven meteorological stations in the Gaza region, this study aims to (1) analyze the observed SP trend over the Gaza region, and (2) examine the SP sensitivity to climate indices. Pearson and Spearman correlations between climate indices and SP in the current and following years were calculated, and the seasonal period (particular month) with the highest correlation was identified. Results show that the climate indices, with greater impact on SP over the Gaza region in the autumn and spring, were in the order; El Niño-Southern Oscillation (ENSO) > East Atlantic/Western Russia (EAWR) > North Atlantic Oscillation (NAO) > Arctic Oscillation (AO). The indices’ impact was minimal in the winter precipitation. ENSO types’ correlations (Southern Oscillation Index-SOI and Niño 3.4) were moderate and significant at α = 0.05. Rainfall at most stations positively correlates with AO and EAWR in spring and autumn. During the study period, warm phases of ENSO (i.e., El Niño) intensified autumn precipitation. Simultaneously with warm phases of EAWR or AO, more influence on autumn precipitation is exerted. Cold phases of ENSO (i.e., La Niña) have an adverse impact compared to El Niño. EAWR co-variation was evident only with the ENSO. Regarding AO, a non-meaningful action was noticed during the neutral phases of ENSO and EAWR. The findings of this study help understand and predict the seasonal trend of precipitation over the Gaza region. This is essential to set up climate change mitigation and adaptation strategies in the EM region.
1. Introduction
Understanding precipitation changes is fundamental to mitigate its risk and various adaptation measures, especially in developing countries. The latter have high population densities, limited water resources, and poor infrastructures, making them vulnerable to precipitation changes. Extremes in precipitation affect social and economic development and may result in lives losses [1]. It also affects crop yield and regional economic systems negatively [2]. Their current implications are alarming for scientists and decision-makers. The Eastern Mediterranean (EM) is a “hotspot” region, strongly projected to future warming and drying. It is exceptionally vulnerable to anomalies in precipitation extremes [3]. Barlow, et al. [4] and Kaniewski, et al. [2] forecasted severe floods during the rainy season and longevity in the drought season in the EM region. The present economic and political challenges exacerbate this issue.
There is still a discrepancy in the change in seasonal precipitation (SP) over the EM region [4]. Kelley, et al. [5] observed a decreasing trend in rainfall over the Mediterranean after 1950. Shohami, et al. [6] found a non-significant decreasing trend in precipitation over the region during 1964–2003. The change varied between 1 and 20 mm decade−1. Similarly, Alpert, et al. [7] noticed a dominant decreasing trend in the A2 scenario over the EM after 1960. Another study from Steinberger and Gazit-Yaari [8] showed a non-significant decreasing trend, 6 mm decade−1, in rainfall during 1960–1990 over the EM. In contrary to the previous, other studies documented a growing trend in rainfall over the EM region. Kafle and Bruins [9] found a non-significant positive trend, 6–21 mm decade−1, during 1970–2002 in 12 meteorological stations in the same region. Ziv, et al. [10] noticed a negligible trend in the Gaza region vicinity. Ajjur and Riffi [11] examined the trends in 11 extreme precipitation indices in the Gaza region. Most indices increased after the 1980s. Total precipitation, for example, has risen over two periods 1985–2004 and 2009–2016. The source of variations in the extreme precipitation metrics in [11] is still unknown. These variations seem to be organized in coherent temporal patterns that suggest two options. First, the trend is the consequence of some very wet outlier years that occurred towards the end of the study period and could be attributed to extreme events, which are obvious from max 1- and 5-day precipitation values. Second, the trend is related to other aspects of teleconnection patterns.
There is no agreement on how teleconnection patterns such as the North Atlantic Oscillation (NAO), El Niño-Southern Oscillation (ENSO), Arctic Oscillation (AO), and the East Atlantic/Western Russia (EAWR) contribute in SP over EM region. The relationship between these climate indices and the EM rainfall over the course of seasons is not clear. For example, studies linked the precipitation over EM with the NAO [5,12], the ENSO [4,13], and the EAWR [14]. Cullen, et al. [12] demonstrated that the NAO affects winter rains in the Middle East region. Eshel and Farrell [15] considered that the NAO modules precipitation over the EM region. Kelley, et al. [5] suggested that the Mediterranean winter precipitation decreased due to a positive trend in NAO during 1960–2000. Krichak, et al. [16] observed a reduction of precipitation over the EM when the NAO and the EAWR are both positive. Conversely, Krichak, et al. [17] linked wet (dry) winters in the EM region with positive (negative) EAWR. Black [14] found no correlated variation between NAO and EAWR indices. The correlation between the NAO and the EAWR during winter was 0.12 (non-significant). She showed enhancement of winter precipitation during European circulation regimes. Furthermore, Ben-Gai, et al. [18] and Ziv, et al. [19] found a poor relationship between the NAO/ENSO and precipitation. Donat, et al. [13] found that the NAO and ENSO are less influencing precipitation extremes in the Arab region.
There are some uncertainties associated with SP’s projection over the EM region. Using regional climate simulations, Önol and Semazzi [20] reported a significant decreasing trend in winter precipitation (December, January, February) for some Middle East countries. By the end-21st century, the reduction in the A2 scenario will reach 23.7% in Israel and 29% in Jordan, Lebanon, and Syria. Peleg, et al. [21] obtained similar results using four models in the 5th Coupled Model Intercomparison Project Phase (CMIP5). Peleg and co-workers forecasted a 10–22% decreasing trend in precipitation in the north of Israel by the mid-21st century. Similarly, 23 models participating in the CMIP5 agreed that total precipitation would decrease by 20–35% in the EM region [22]. This is consistent with the prediction of Krichak, et al. [23], suggesting a decline in winter rainfall (up to 20%) in the EM region by the end-21st century. According to Evans [24], a significant drop in rainfall rate (1–3 mm year−1) until the turn of the 22nd century should be expected. Similarly, Terink, et al. [25] suggested a declining trend in rainfall in the Gaza region until the mid-21st century. Contrastingly, Alpert, et al. [7] forecasted an increasing trend in precipitation over the south and central Israel. The trend in A2 and B2 scenarios indicated extreme events as well as drier and wetter conditions in the upcoming years. Using a regional model, Hochman, et al. [26] have predicted an increasing trend in winter and spring precipitation (~40% under the Representative Concentration Pathway RCP4.5 scenario) in southern Israel. Together, these studies suggest no agreement regarding the trend of SP in the EM region or its sensitivity to teleconnection patterns. Another motivation for current research is that SP over the Gaza region is a local subject of attention. Since 2008, changes in precipitation have resulted in severe floods and droughts. Flash floods caused fatalities, injuries, and substantial losses in homes and infrastructures.
Consequently, the United Nations Development Program gave the highest level of priority to flood contingency plans and measures, but few actions were taken. For instance, floods caused one fatality and three injuries in January 2013 [1], four deaths, and nine injuries on 6–10 January 2015 [27]. Additionally, floods destroyed more than 217 and 650 homes in 2010 and 2013, respectively [1]. The Gaza region losses due to floods progressively increased over time. About 2000 homes were flooded on 8–9 December 2019 [28]. UNRWA-OCHA [29] stated that every fourth person in the Gaza region lives in flood-prone areas. Regrettably, floodwater is not utilized either, in agriculture, although it makes abundant freshwater available. Seasonal drought is frequent in the region [11]. There is a need to recharge the aquifer in the Gaza region, which is the primary source of water. The longevity of the drought season, along with the high groundwater abstraction, have severely over-exploited the aquifer [30]. As such, climate change consequences (mainly rainfall changes) become disastrous, and the ecological environment of the Gaza region is more fragile [31].
This study clears the discrepancy in the Gaza SP by (1) analyzing the observed trend of SP in the Gaza region between 1974 and 2016, and (2) examining its sensitivity to the principal modes of climate variability, particularly the NAO, ENSO, AO, and EAWR. The findings of this study help understand and predict the seasonal trend of precipitation over the EM region. This is essential to set up mitigation and adaptation plans to avert the negative impacts of flooding and droughts.
1.1. Study Area
The Gaza region is a coastal land (31°13′–31°35′ N, 34°13′–34°34′ E), which has an area of 365 km2 (Figure 1). The total population is 2.1 million inhabitants, with an average density of 5750 individuals per km2. The surface elevation varies between 93 m above mean sea level (amsl) in the southeastern areas to msl (0 m) in the western part. The mean annual temperature in the Gaza region is 25 °C [32]. According to Köppen-Geiger climate classification, the Gaza region is classified mainly into semi-arid (BSh class) in the middle and southern parts, and temperate with dry summer (Csa class) in the northern region. The small southern part lies under hot-desert (BWh) climate type [33]. Generally, the northern parts receive more rain than the south. During the study period, the annual average rainfall value was 404 mm in the northern region, where it was 230 mm in the southern region. The four seasons are defined in the Gaza region as Spring (March, April, and May-MAM); Summer (June, July, and August-JJA); Autumn (September, October, and November-SON); and Winter (December, and January and February into the following year-DJF).
1.2. Water Scarcity
The dramatic situation of water resources in Gaza makes it vital to understand the reasons behind this situation. Previous literature considered Gaza water scarcity with engineering methods [11,34]; however, attention should be drawn to a discursive analysis that helps understand the causes of the water scarcity problem and how to solve it [35,36,37]. The current dominant discourse of water scarcity in Gaza includes two narratives: insufficient water resources and lack of fund. The insufficiency narrative emphasizes that Gaza is a small region with a very high population density and minimal water resources (see study area description-Section 1.1). This narrative also includes the negative impact of climate change on water resources [11]. The second narrative (lack of fund) indicates that the water scarcity problems did not receive adequate fund. The non-governmental organizations (NGOs), the primary source of funds for water resources projects, did not implement major projects solving the water scarcity problem like large desalination plants and managed aquifer recharge systems. Further research is needed to investigate these two narratives and explore the discursive construction of Gaza water scarcity. This becomes essential to ensure that all Gazans have access to water, as stated by the sixth indicator in the UN Sustainable Development Goals (SDGs). It is assumed that water crisis discourses such as water security and water, energy, and food security (WEF) nexus are linked to the SDG6 (Sustainable Development Goal 6). Implementing the SDG6 indicator could have unplanned practical consequences for fragile environments such as Gaza [38].
2. Data and Methods
2.1. Data
There are 12 rain gauge stations recording daily precipitation since 1974 in the Gaza region. Precipitation data at these stations were processed through an appropriate methodology to ensure its homogeneity and quality. An R package software, RHtests_dlyPrcp [39], was used to test the homogeneity. Additionally, a two-step quality control test was applied as follows: (a) rainfall records have to be comprehensive, and observations collected over more than a day should be less than 5% of rainy days. (b) Following Zhou, et al. [40] approach in Yangtze River extreme precipitation analysis in China, (b) outliers’, which surpass five-folds the study period’s standard deviation, should be less than 5% of all records. Among the 12 rain gauge stations, only seven stations passed the homogeneity and quality tests. As reported by the Palestinian Ministry of Agriculture, the selected seven stations had no systematic changes in their location or measurement methods during the study period. Only data at the elected stations were further manipulated as follows: (a) accumulated records were distributed similarly between days, and (b) outliers were substituted by the maximum value during the study period. Figure 1 shows the selected stations used in the study. These stations lay in two climate classes (Csa and BSh). The altitude at these stations ranges between 7 and 71 m amsl. The latitude and longitude coordinates and Thiessen weight are shown in Table 1.
2.2. Methods
Several statistical and analysis parameters, including the mean (µ), maximum (max), and minimum (min), were computed to understand the characteristics of SP in the Gaza region. Further, the linear least square method and Mann Kendall test were used to detect and evaluate the variation in SP during 1974–2016. The Linear least square method shows the trend of SP, and the Mann Kendall method assesses the direction and significance of this trend. Mann Kendall is a non-parametric statistical method, which does not require a specific distribution of parameters [41]. When Mann Kendall Z value is positive, then the trend is increasing, and vice versa. Significant values of Z must exceed 1.96 (1.645) at 5% (10%) significant level. There might be autocorrelation in small time series (sample size < 50), which increases the probability that the Mann Kendall test will yield a significant trend [42]. Therefore, we applied a prewhitening test to remove any potential effect of serial correlation in SP prior to the Mann Kendall test. No autocorrelation was found in the SP trend at any station. These methods, linear least square, prewhitening, and Mann Kendall, are widely used to analyze rainfall data within time series [6,10,42,43,44,45,46].
Climate indices
This research examined the relationships between several global teleconnection patterns (NAO, ENSO, AO, and EAWR) and the SP over the Gaza region. NAO is a major weather pattern in the North Atlantic Ocean that affects winter precipitation in the northern hemisphere [47]. The NAO index is obtained by the difference in the normalized pressure between Azores (Portugal) and Reykjavik/Stykkisholmur (Iceland) [47]. ENSO is a coupled ocean-atmosphere pattern in the tropical Pacific Ocean, which is considered as the most dominant phenomenon affecting much of the tropics, subtropics, and beyond. There are two extreme opposite phases of the ENSO cycle, which are the warm phase (El Niño) and the cold phase (La Niña). We used two indices to characterize the ENSO types: the Southern Oscillation Index (SOI) [48], and the Niño 3.4 [49]. The SOI is measured by the difference in standardized pressure between Tahiti (central South Pacific Ocean) and Darwin (Australia) [48]. El Niño phase generally corresponds to the negative values of SOI, whereas the positive values indicate the La Niña phase. Niño 3.4 is a prominent index, defined by the average equatorial Sea Surface Temperature (SST) across the central equatorial Pacific (5° S–5° N, 170° W–120° W) [49]. The AO is a weather leading principle phenomenon at the Arctic poles north of 20 degrees latitude [50]. EAWR is a prominent teleconnection pattern that affects Eurasia throughout the year. EAWR index is determined by the pressure difference over the East Atlantic and the North Caspian Sea [51]. Details on the climate indices are available in our data source, the National Oceanographic and Atmospheric Administration (NOAA). The NAO, SOI, Niño 3.4, and AO data are available at https://www.psl.noaa.gov/gcos_wgsp/Timeseries (accessed on 25 May 2020), while the EAWR data are available at https://www.cpc.ncep.noaa.gov/data/teledoc/telecontents.shtml (accessed on 25 May 2020).
During 1974–2016, the monthly values of NAO index ranged between –4.7 (December 1996) and 5.26 (February 1997), SOI index ranged between −3.46 (February 1983) and 3.02 (April 2011), Niño 3.4 index ranged between −2.18 (November 1988) and 2.57 (November 2015), AO index ranged between −4.26 (February 2010) and 3.5 (January 1993), and EAWR ranged between −3.30 (August 2016) and 2.72 (February 1998). To classify them, we considered three main classes of each index, as shown in Table 2. Several studies [52,53] adopted similar classifications.
The Pearson linear correlation and Spearman correlation coefficients between monthly NAO, SOI, Niño 3.4, AO, and EAWR indices, and the SP values over the Gaza region were computed. Pearson correlation tests the linear relationship between variables, whereas Spearman correlation shows the monotonic relationship between two ranked variables. Spearman correlation is a non-parametric test. Both correlation methods are widely used to detect regional rainfall teleconnection with climate indices [10,43,45,52,54,55].
As the global indices may affect SP in the current (0-year) and following (1-year ahead) year [54], then Pearson and Spearman correlation coefficients (r) between SP and monthly climate indices in the current and following years were calculated. The correlation was classified as weak if the absolute r value is between (0.10 and 0.29), moderate (0.30–0.50), and strong (> 0.50). Values between –0.10 and 0.10 indicated no correlation. Further, the Student’s t-test was performed at a significance level (α = 5%). We considered a as the null hypothesis, which means that there is no correlation (r = 0) between climate indices and the SP. On the other hand, the alternative hypothesis is satisfied, and a correlation exists (r ≠ 0) between climate indices and SP, when. We further identified the month, which has the highest correlation with SP. This month is assumed to have the greatest effect on SP. The time series of each climate index in this month were categorized into different groups, as shown in Table 2. Finally, we computed the anomalies in the seasons in each year to see the overall impact of climate indices on SP. Understanding how SP changes with the classification of global patterns can help forecast future change.
3. Results
3.1. Spatial and Temporal Analysis of SP
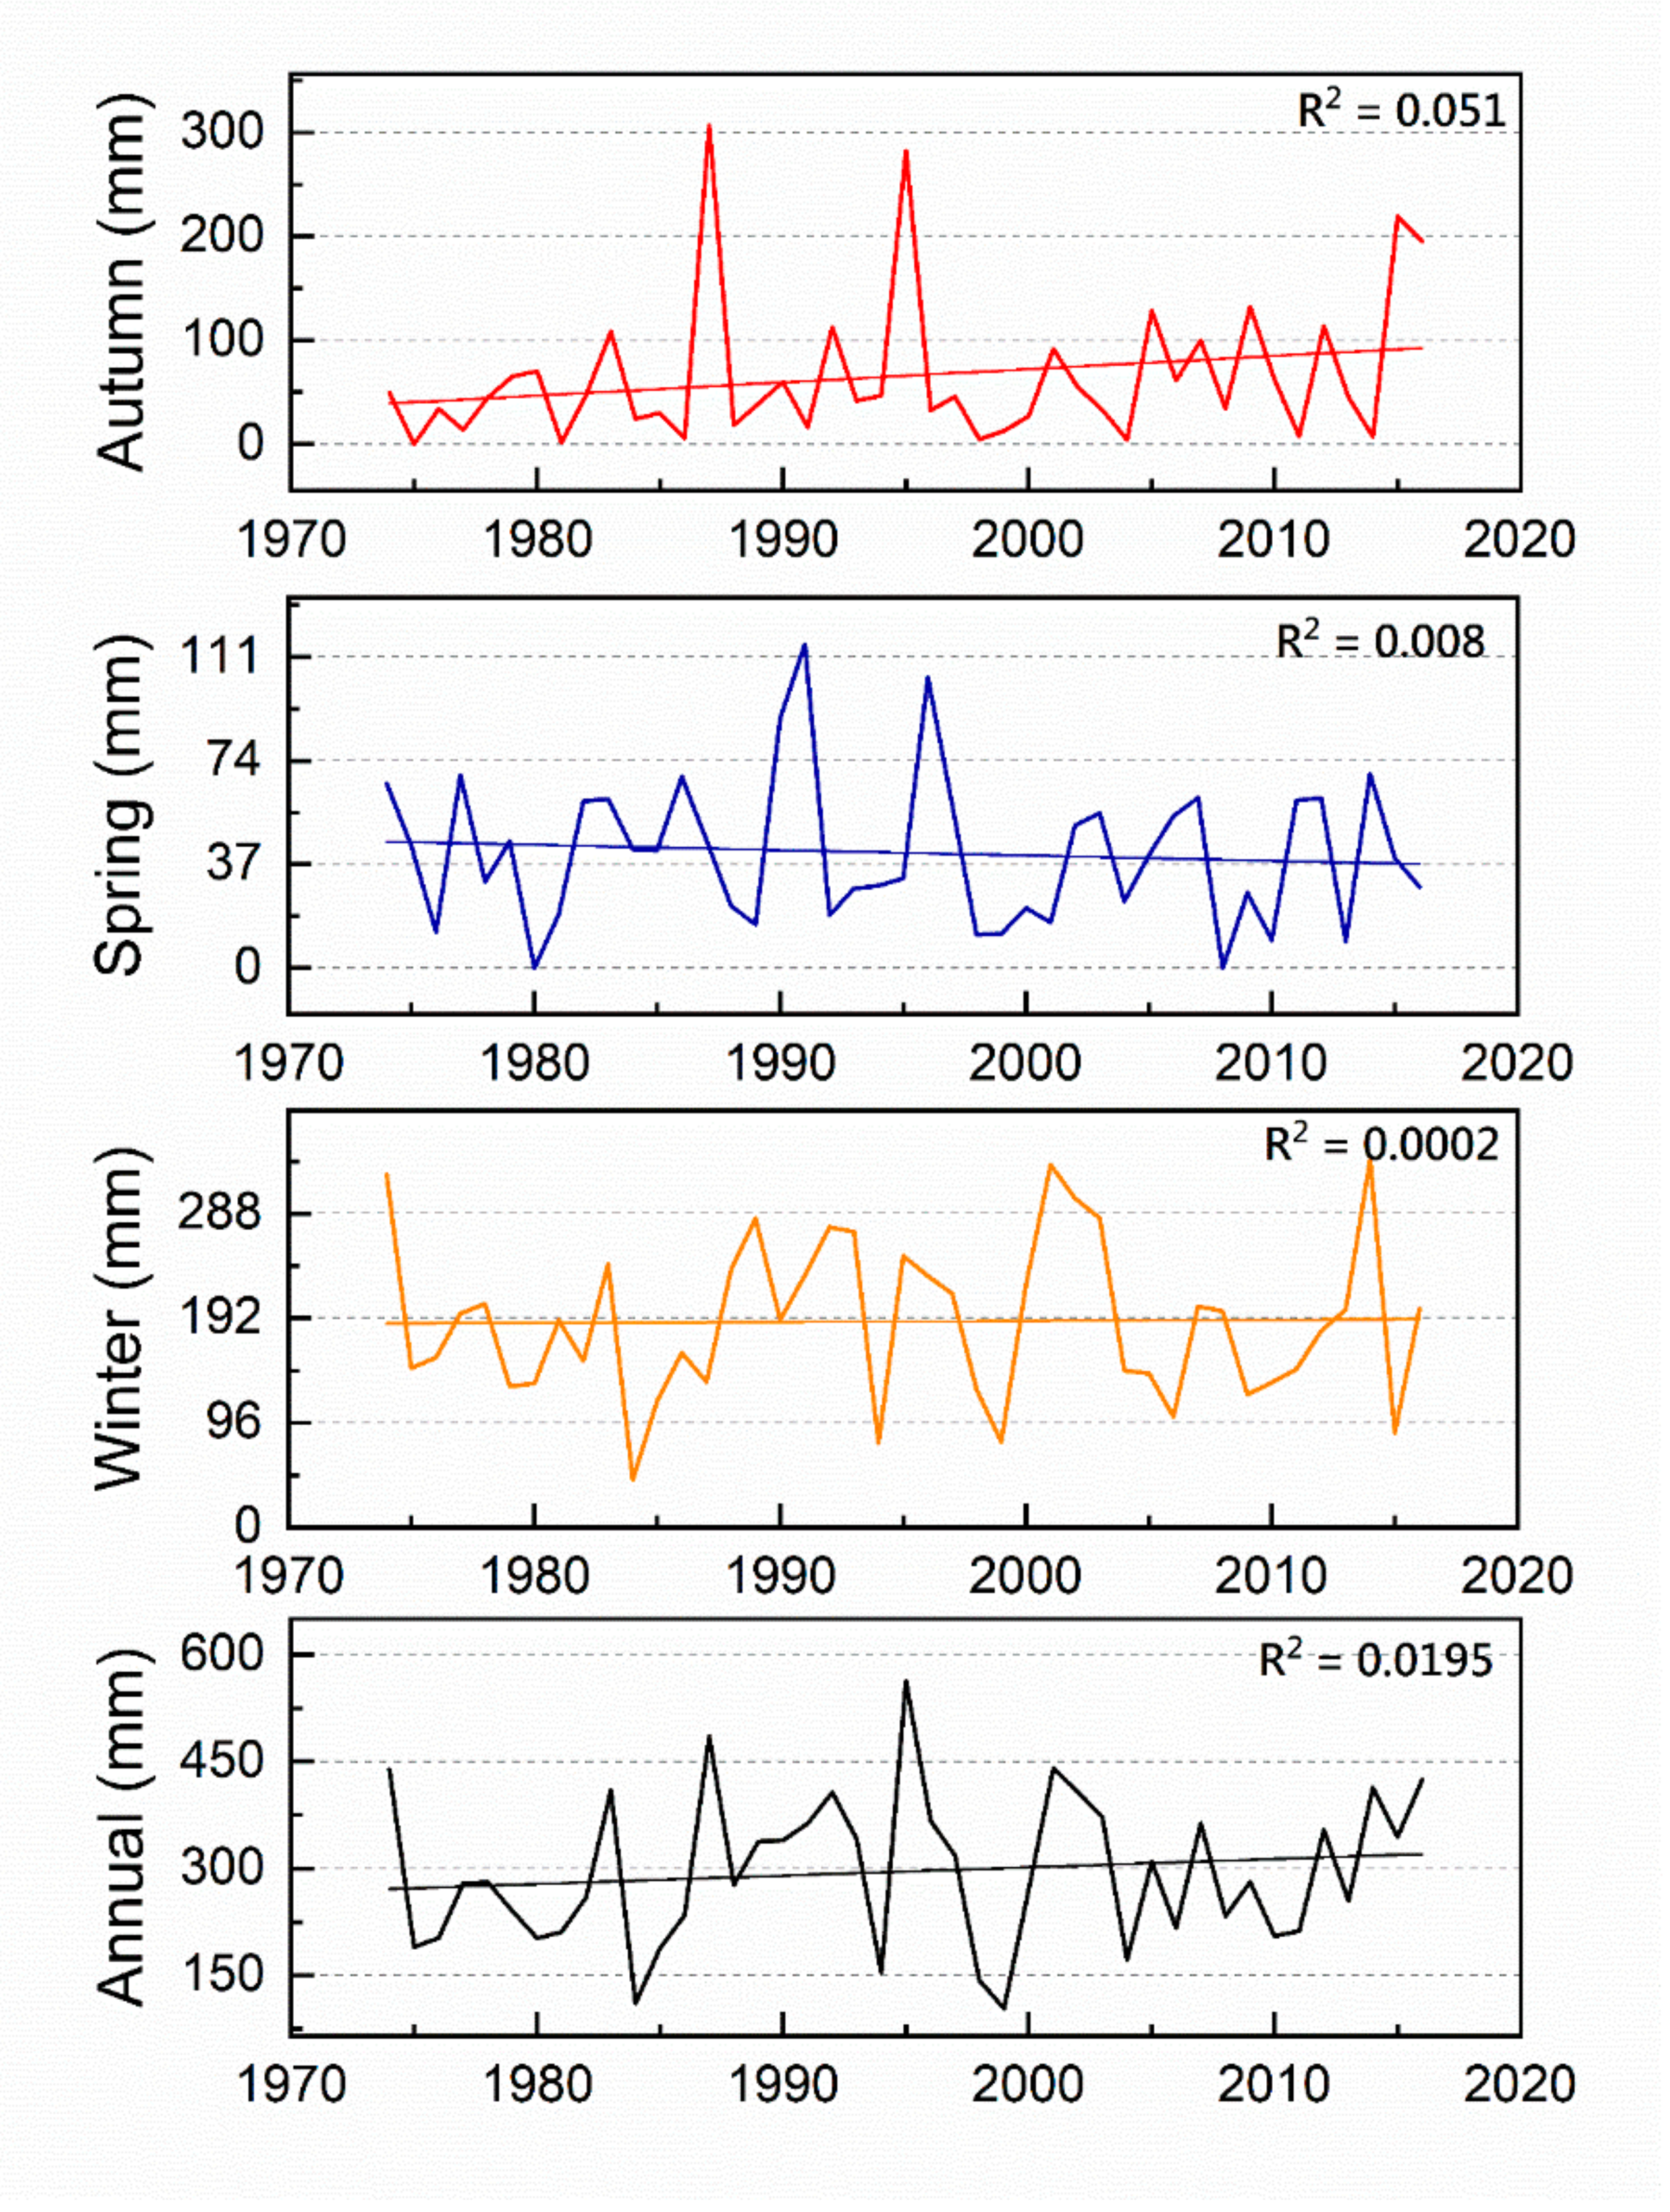
Figure 2 shows the average trend of autumn, spring, winter, and annual precipitation in the Gaza region between 1974 and 2016, whereas Table 3 presents a statistical analysis of these trends. Despite the small area of the Gaza region, SP varied temporally and spatially. This is due to the coastal transitioning between the temperate, semi-arid, and arid climates.
Several years have experienced no considerable rainfall in the autumn and spring. For example, in all stations, no rain fell in autumn (1975) and spring (1980 and 2008). On average, no rain (≤ 8 mm) fell in autumn in seven years (1975, 1981, 1986, 1998, 2004, 2011, and 2014). As shown in Table 3, the mean precipitation in autumn was 65.9 mm, while the maximum precipitation was 306.5 mm in 1987. The autumn precipitation at all stations showed an increasing trend, which was significant at α = 0.05 in Remal and Nuseirat stations. Autumn precipitation increased for the study period (43 years), at the rate of 1.27 mm year−1 (close to being significant at α = 0.10). Spring rains were negligible (less than 13 mm) in 1976, 1980, 1998, 2008, 2010, and 2013. It is noticeable that half of these were within the last decade of the study period. The mean precipitation in the spring was 41.1 mm. The maximum precipitation was 115.5 mm in 1991. The trend of spring precipitation decreased non-significantly in all stations (except Remal) at a rate of −0.19 mm year−1. In the winter, precipitation varied, on average, between 43.8 mm in 1984 and 337.1 mm in 2014, with a mean value of 188.9 mm. The precipitation increased in Remal, Khan-Yunes, and Rafah stations, whereas it decreased in other stations. Although insignificant, there was a general increase in precipitation at the rate of 0.08 mm year−1. The winter and autumn significantly contributed to the annual precipitation with up to 64% and 22%, respectively. Only about 13% was recorded in the spring. There was no precipitation in the summer. Annual rainfall reached its maximum (minimum) value of 563 (103.4) mm in 1995 (1999).
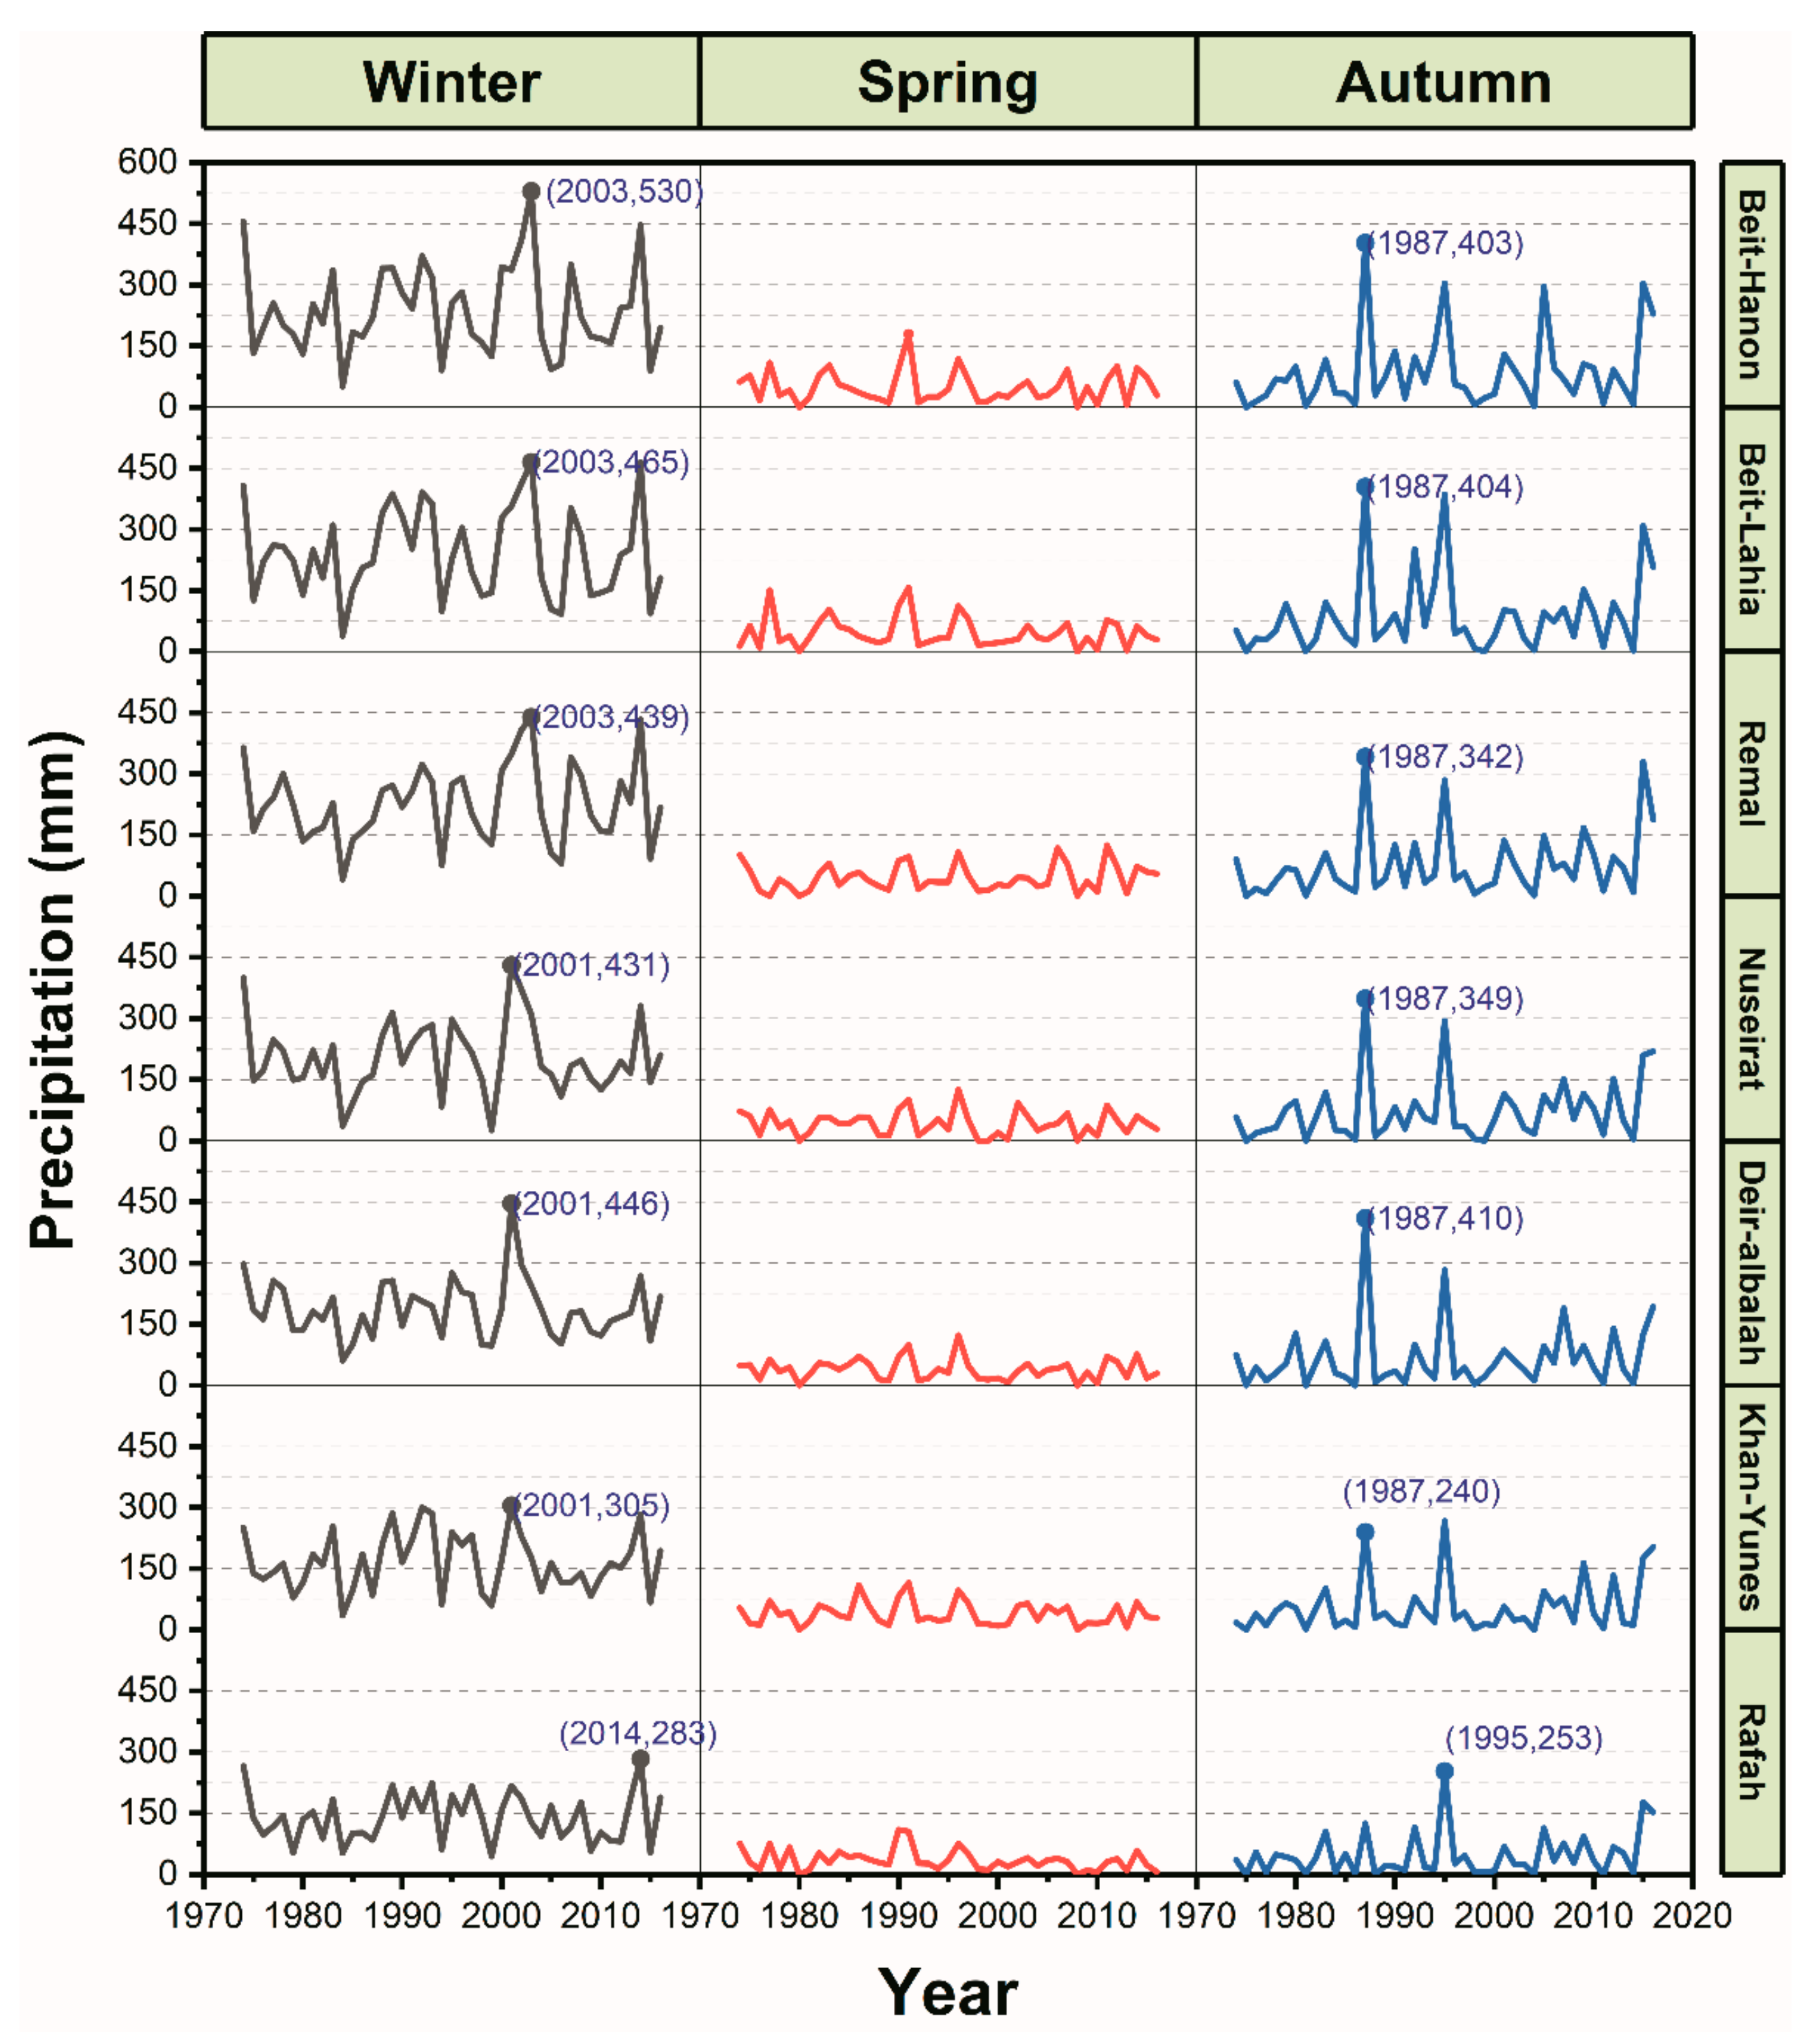
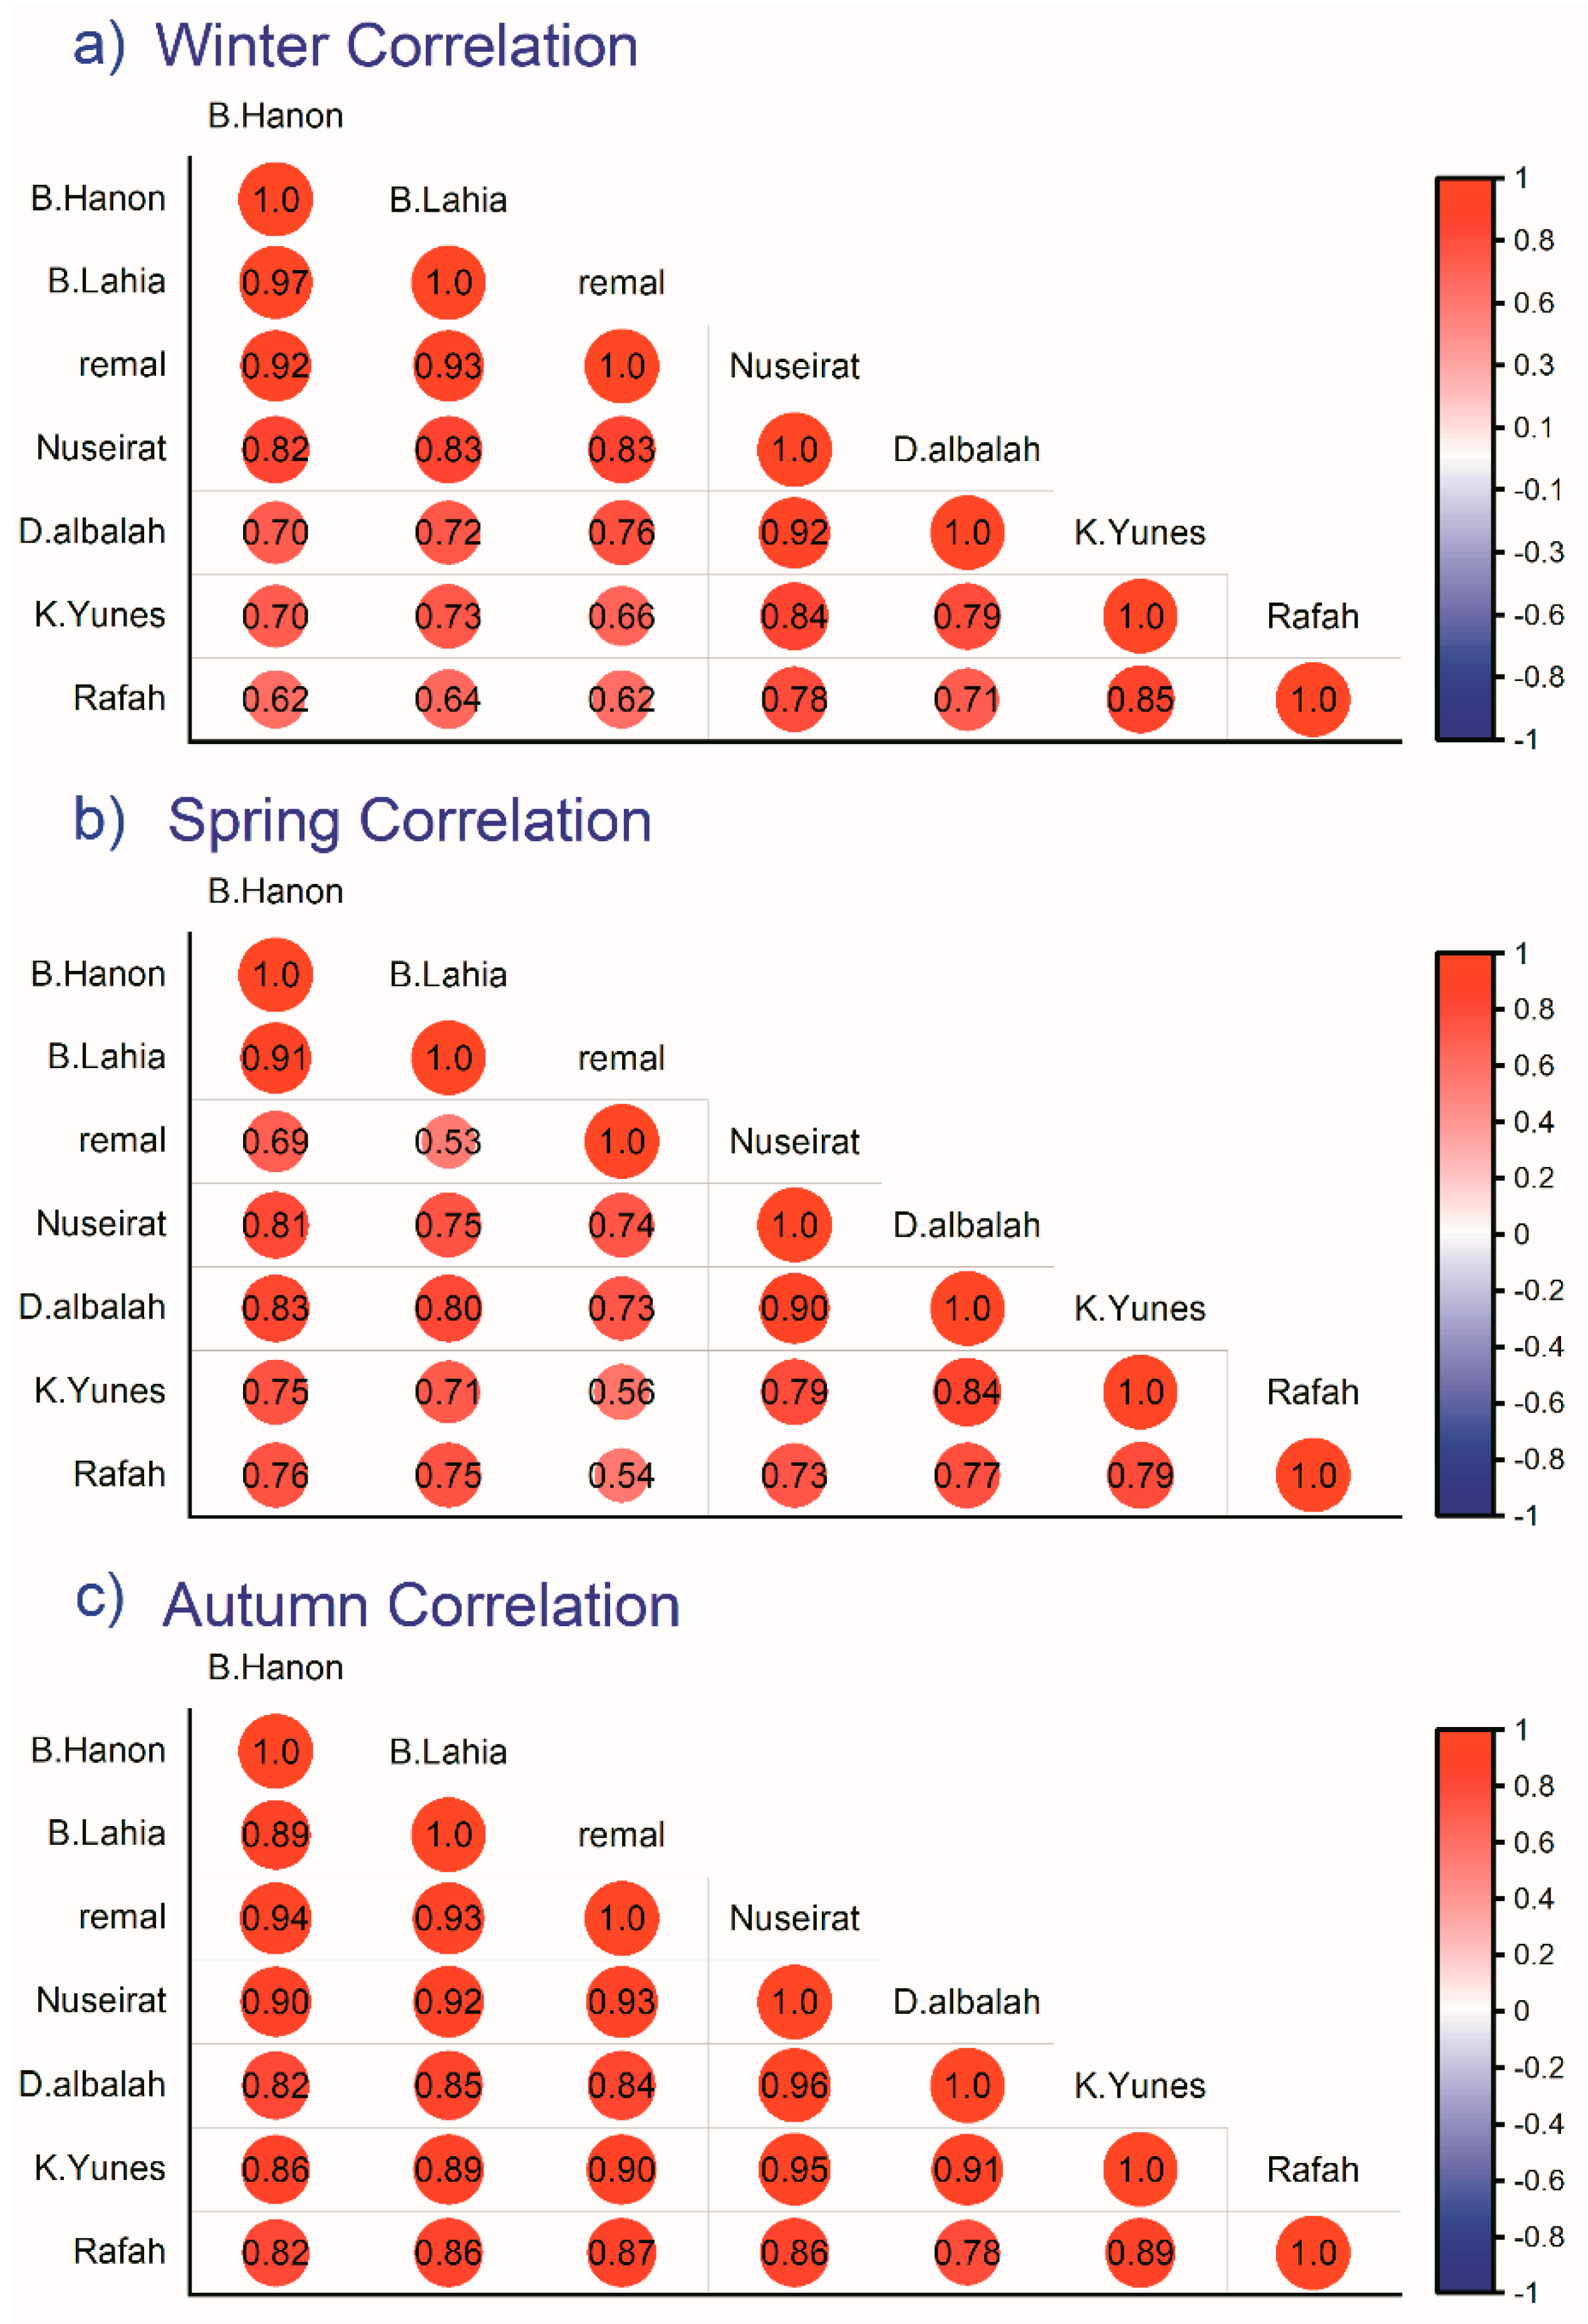
Figure 3 depicts how SP varied spatially in the seven stations. There is a general reduction in SP from the northern stations to the southern ones. The highest value of the winter shower was 530 mm at Beit-Hanon station in 2003. The values at other stations were close, to some extent. However, winter precipitation at southern stations (Khan-Yunes and Rafah) were much lower. The maximum winter precipitation at Khan-Yunes was 305 mm in 2001, and at Rafah was 283 mm in 2014. Apart from northern stations, spring rainfall did not exceed 125 mm. In 1991, the maximum spring precipitation fell to 179 mm and 157 mm at Beit-Hanon and Beit-Lahia stations, respectively. At no specific period, the spring precipitation was high at all stations. The highest records hit the Gaza region in 2011 at Remal station, 1996 at Nuseirat and Deir-Elbalah stations, 1991 at Khan-Yunes station, and in 1990 at Rafah station. In autumn, the max precipitation was 409.5 mm at Deir-Elbalah station in 1987. Low values of autumn rainfall were found at Khan-Yunes (293.6 mm in 1987) and Rafah (252.5 mm in 1995). It can be concluded that there is a spatial difference in the distribution of SP over Gaza. To investigate the coherence in SP variability in space, we calculated the correlations among winter, spring, and summer precipitation at all stations. Figure A1 in the Appendix A shows that there is a strong correlation between all SP at stations in the northern and middle parts. Whereas correlations between SP at stations in the southern region (Rafah and khan-yunes) and other stations were only strong in autumn.
3.2. Correlation Between Climate Indices and SP
All Pearson linear and Spearman correlation analysis showed that the results are somewhat close. However, several correlations were detected only by one method and not the other. To explore all data patterns and include all possible relationships, we considered the highest value (positive or negative) between both correlations.
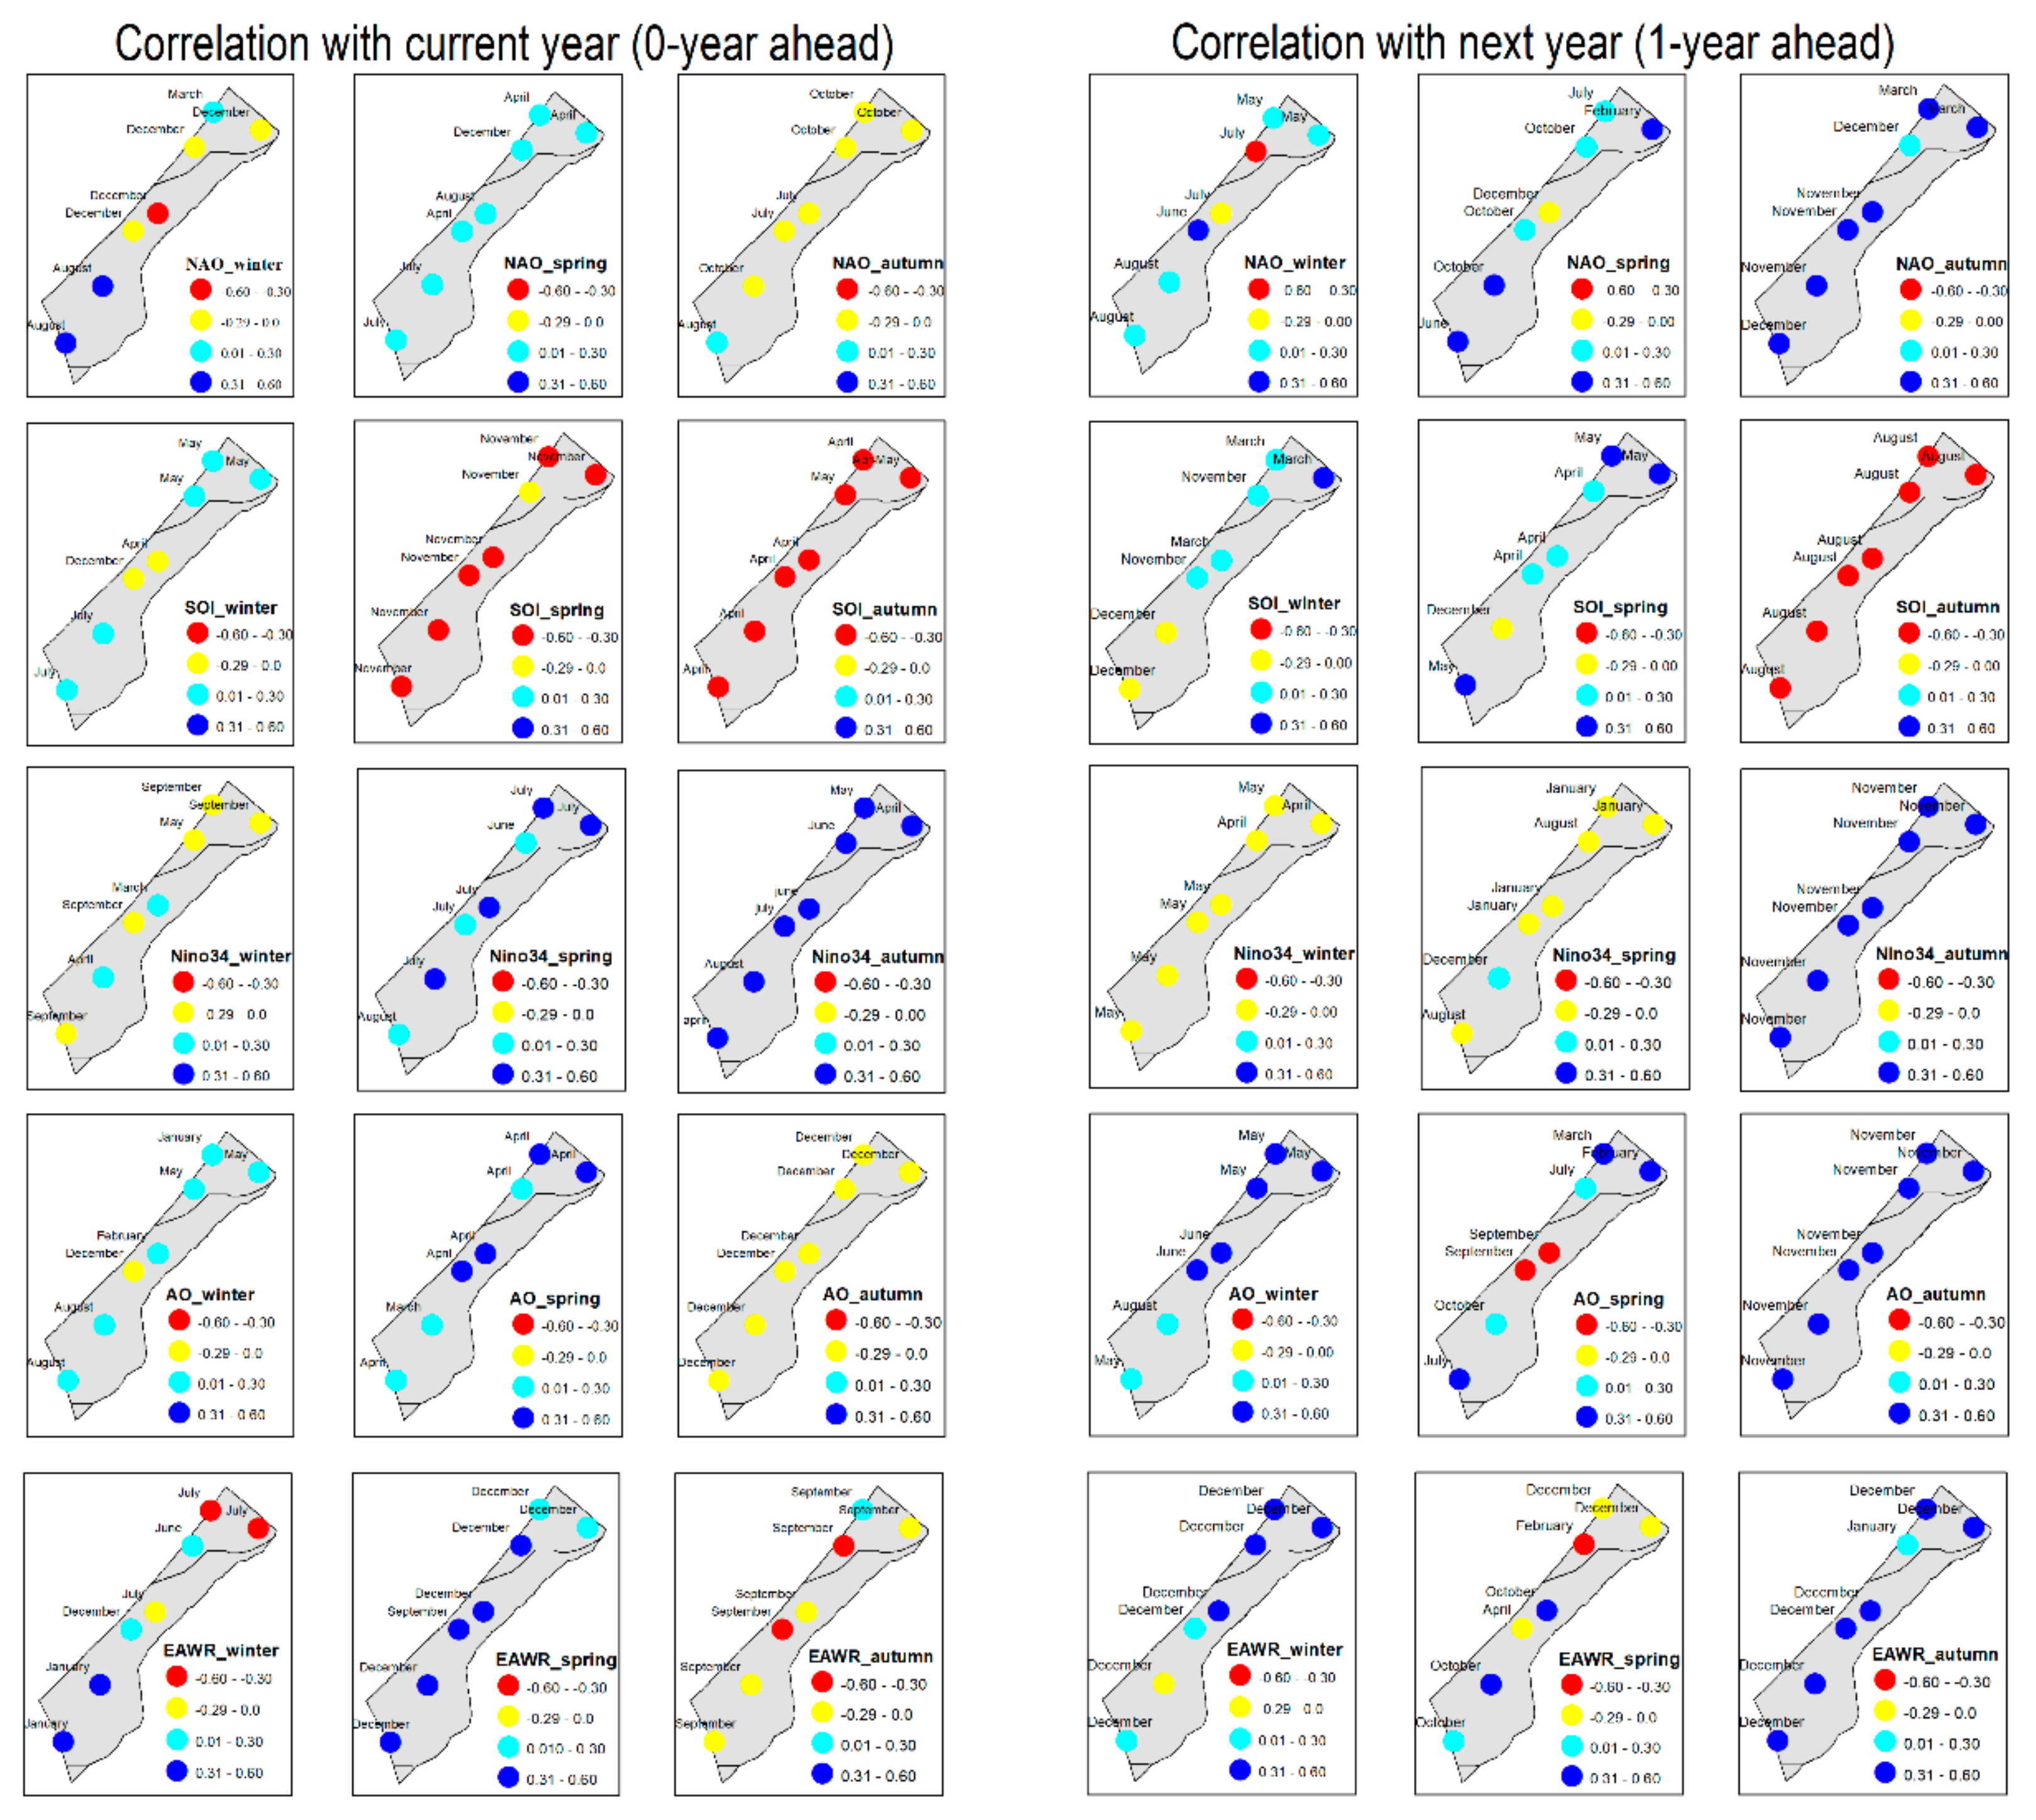
Figure 4 displays the correlation values between SP and the NAO, SOI, Niño 3.4, AO, EAWR in the current and following years. It also presents the month where each climate index has the highest impact on SP at each station (labels). A range of correlations were observed with climate indices and the three seasons; NAO correlations ranged between −0.324 (with winter) and 0.47 (with autumn), SOI correlations ranged between −0.574 (with spring) and 0.38 (with autumn), Niño 3.4 correlations ranged between −0.30 (with winter) and 0.53 (with autumn), AO correlations ranged between −0.35 (with spring) and 0.49 (with autumn), and EAWR correlations ranged between −0.35 (with winter) and 0.41 (with autumn). All correlations exceeding 0.30 were significant at α = 0.05. The weakest impact of climate indices was on the winter precipitation in general. The most important climate indices, in order of higher impact on SP in the Gaza region, were SOI, Niño 3.4, EAWR, NAO, and AO. The effect of such indices was for the spring and autumn precipitation. Their correlations were weak with winter precipitation.
According to the NAO, moderate correlations, 0.31 and 0.36, were found in the current winter at two stations only (i.e., Khan-Yunes and Rafah) in August. Other stations showed weak negative correlations. Similarly, correlations for the following year were also weak. In spring, the correlation was mostly positive and weak (0.11–0.35) in both years. This relationship turns to negative (between −0.28 and -0.10) in autumn at all stations, except Rafah correlation was positive. However, comparison with the following year showed that, at 86% of the stations, there was a significant positive correlation between autumn precipitation and NAO (the correlation was between 0.31 and 0.47), raising the possibility of a good relationship with NAO (only in autumn). We can conclude that NAO is less (high) affecting winter and spring (autumn) precipitation over the Gaza region.
No significant correlation was found for the SOI in winter. Correlations were weak and non-meaningful in the current and following years. This implies a negligible impact of SOI on winter precipitation. In spring and autumn, the relationship was evident and significant. Spring precipitation has a moderate negative correlation with SOI in November at all stations (except Remal, the relation was weak). Similar strong correlations were observed when comparing autumn precipitation and SOI in April and May (for the current year) and August (next year). Apart from the Remal station, the present year correlation varied between −0.57 and −0.30 and −0.42 and −0.30 in spring and autumn, respectively. SOI correlation with SP was the most significant among other indices, in general.
Similar to SOI, Niño 3.4 correlation was very weak and non-meaningful in the winter. It varied between −0.25 and 0.17 in the current and following years. In contrast, a strong relationship seems to be with spring and autumn precipitation. All stations showed relatively-strong positive correlations (0.40–0.53) between autumn precipitation and Niño 3.4. Similar results were observed between spring precipitation and Niño 3.4 in July at 57% of the stations. Other stations showed weak relationships. The correlation with the Niño 3.4 was more evident than the SOI in autumn; however, the SOI correlation is clearer in spring.
The analysis showed no substantial impact of AO on spring precipitation over the Gaza region. Only a positive moderate correlation was between spring precipitation and AO in April at four stations (Beit-Hanon, Beit-Lahia, Nuseirat, and Deir-albalah). Other stations showed weak positive trends. Winter correlation was more evident in the following year. The AO demonstrates a significant positive relationship in all stations except the southern part. In autumn, the correlations were negative at all stations. However, these correlations were weak (value ≤ −0.29) in the current year. It turns to positive and rises to 0.49 in autumn in the following year. This indicates that the positive phase of AO may increase autumn precipitation in the Gaza region.
Results showed no meaningful relationship between winter precipitation and EAWR. The correlation in the current (following) year varied between −0.35 (0.39) at the northern part and 0.4 (−0.27) at the southern part. The impact of EAWR on spring precipitation was more substantial than AO. In spring, all stations showed positive correlations, which were significant at five stations (70% of the stations) in the current year. The relationship with other parts was weak (≤ 0.30). The month of the EAWR with the highest correlation was December. In autumn, the relationship was mainly weak and negative (moderate and positive) in the current (next) year.
To investigate the overall impact of climate indices on SP in Gaza, the three indices with the highest impact on SP (i.e., SOI, EAWR, and AO) were selected and categorized according to Table 2. We considered SOI to measure ENSO events’ intensity, as its impact was more evident in general. Table 4 shows how these categories had varied during the study period. It also presents the anomalies (increase or decrease) in each season. The anomalies were computed as the total variations in precipitation in each season from its long-term (1974–2016) average value. The average precipitation in seasons is presented in Table 3. Results showed that each climate index, or ensemble of two/three climate indices, has its unique impact on spring and autumn precipitation. Anomalies in winter precipitation were not relevant to climate indices categories. Possible conclusions are:
- The active and very active El Niño phases can intensify autumn precipitation significantly in the Gaza region. Its impact on winter and spring precipitation was not telling. Autumn precipitation increased by 64% in 1983, and 95% in 2005. Additionally, during the active and very active El Niño phases, the warm periods of the EAWR/AO exert more influence on the Gaza region, and the change becomes much more substantial. For instance, during warm EAWR, autumn precipitation increased by 365% in 1987. During warm AO, autumn precipitation increased by 328% in 1995. Autumn precipitation had tripled in 2016 (very active El Niño and warm EAWR and AO).
- On the other hand, the Gaza region encountered a substantial decrease in autumn precipitation during the active and very active La Niña phases. Spring precipitation might also decrease. For instance, autumn precipitation decreased by 25% in 1974, 100% in 1975, and 55% in 1985. The decrease was typically similar during the cold phases of the EAWR/AO. In 1989 (very active La Niña and cold EAWR), spring (autumn) precipitation decreased by 62% (41%). Similarly, the decline in spring (autumn) precipitation was 48% (59%) in 2000. Both AO and EAWR were in cold phases in 1999, which caused a drop of 70% (81%) in spring (autumn) precipitation.
- During the neutral phases of EAWR and SOI, AO has a negligible impact on spring and autumn precipitation in the Gaza region. The cold phases of AO decreased autumn precipitation by 97% in 1981, 91% in 1986, and 50% in 2003. Nevertheless, cold AO intensified autumn precipitation by 39% in 2001. In spring, cold AO caused a decline of 53% (61%) in 1981 (2001). However, a dominant rise was noticed in 1986 (66%) and 2003 (34%). Similarly, the warm phases of AO increased autumn precipitation by 73% in 2012; however, it decreased autumn precipitation by 89% in 2014. Its impact was also minimal in 1979.
- A quite a few changes, especially during the last two decades, still uninterpretable. For example, active La Niña increased spring (autumn) precipitation by 32% (101%) in 2006 (2009). Also, very active La Niña and cold EAWR lead to notable growth in spring precipitation (45%) in 2011. Still, previous inferences (1–3) are highly projected.
4. Summary and Discussion
This study analyzed rainfall records at seven meteorological stations over the Gaza region to examine the observed trend of SP during 1974–2016 and to investigate its sensitivity to the principal modes of climate variability, particularly the NAO, SOI, Niño 3.4, AO, and EAWR. The results may serve as good indicators for the trend of SP over the EM region.
During 1974–2016, 64% of all precipitation fell in winter, 22% fell in autumn, and 13% fell in spring. Mann Kendall’s analysis showed that annual precipitation had increased at all stations, which does not agree (until now) with climate projections in adjacent areas [23,24]. Only Remal station recorded a significant trend at α =0.10 (Z = 1.88). Based on Pearson linear and Spearman non-parametric correlations, the SOI, Niño 3.4, EAWR, NAO, and AO have the most significant impact on spring and autumn precipitation, respectively. All correlations varied between −0.574 and 0.52. The weakest result of the climate indices was in winter, which supports previous literature [56,57], suggesting that winter precipitation is caused by the Red sea trough and mid-latitude cyclones. The study shows that NAO has a negligible impact on SP compared to the ENSO and EAWR, which agrees with previous works in the EM region [10,19]. However, other studies such as [14,58] stated that positive NAO enhances precipitation in the region. The correlation between NAO and autumn precipitation (in the next year) fills this gap. All stations (except Remal) have significant positive correlations with autumn precipitation (Figure 4). There is no specific month where NAO has the highest impact on autumn precipitation. However, correlations of other indices are clear within particular months. For instance, spring precipitation was correlated to the SOI in November, Niño 3.4 in July, AO in April, and to the EAWR in December. Autumn precipitation was best correlated to the Niño 3.4 and AO in November (next year) and to the EAWR in December (next year).
The presented analysis shows a significant negative relationship between SOI and autumn (spring) precipitation at all (86% of the) stations. It also shows a significant positive correlation between Niño 3.4 and autumn precipitation at all stations. This demonstrates a meaningful relationship between spring and autumn precipitation and ENSO, which is consistent with previous research [13,59]. However, there is a discrepancy with [18,19], who concluded a low correlation with ENSO. This refers partially to the differences in the study period and the spotted index. For example, Price, et al. [59] found a high correlation between 1975 and 1995, while Ziv, et al. [19] found a low correlation between 1950 and 2002. Price, et al. [59] studied the Niño 3 index; however, Ziv, et al. [19] studied southern oscillation. This research examined the correlation between SOI and Niño 3.4 between 1974 and 2016. One should find the appropriate index, which best represents the ENSO in his/her region. The correlation with different indices may lead to different results. Although previous research in the Mediterranean region [13,60] showed that SST indices are less relevant to present the ENSO, our findings prove that SST indices such as Niño 3.4 can also expose the ENSO impact in the EM region. The Niño 3.4 produced slightly stronger correlations than the SOI do in autumn. This indicates the multifaced, complicated and dynamic nature of the ENSO phenomenon and, hence, the necessity to include several different indices when studying its impact on rainfall.
For the EAWR, 70% (86%) of the Gaza stations showed significant positive correlations with spring (autumn) precipitation in the current (following) year. During the study period, warm phases of EAWR increased autumn precipitation up to 365%, whereas cold phases decreased spring and autumn rainfall up to 62%. All warm (cold) phases of EAWR were in El Niño (La Niña) years. On the contrary, warm phases of EAWR were distributed in positive and negative NAO (not shown), which agrees with Black [14], who reported a 57% chance of EAWR positivity when NAO is positive. In other words, the warm EAWR and ENSO were more likely than warm EAWR and warm NAO, demonstrating that warm EAWR works together with El Niño to increase precipitation in the Gaza region. In contrast, cold EAWR works together with La Niña to decrease precipitation in the Gaza region. EAWR co-variation is apparent with the ENSO, not with the NAO.
The present inconsistency of SP sensitivity to global teleconnection patterns in the Mediterranean region is attributed mostly to the study’s scale, time period, data limitation and data source. In this study, 43 years might not be sufficient to tell the whole story in the Gaza region. Observing different and more extended time periods can lead to more definite conclusions. In many cases, time-dependent teleconnection climate indices are non-stationary [4,14,60]. Prominent teleconnection patterns such as the NAO, EAWR may also indirectly affect other circulations within a long-time scale. Black [14] confirmed that positive NAO could affect European circulation regimes, which increase winter precipitation over Israel. In addition, previous works acquired data from different sources. Black [14],Xoplaki, et al. [60] used rainfall observations at meteorological stations, whereas Ziv, et al. [19],Saeed and Almazroui [58] used reanalysis data. Others used both sources [16,17]. Given the lack of meteorological stations over the region, uncertainty is highly expected in reanalysis data compared with rain gauge data. Zittis [61] concluded a wide variation, over the Mediterranean region, between monthly precipitation parameters when obtained from different observational datasets (rain gauge and satellite information). A simple look at Ziv, et al. [19] study supports this idea firmly. The authors extracted ten extremely driest/wettest seasons during 1950–2002 from the archive of the cooperating reanalysis project between the National Center for Environmental Prediction and the National Center for Atmospheric Research Reanalysis (NCEP/NCAR). Among these seasons, five dry and six wet years are after 1974 (the onset of our study period). Comparison with records at the Gaza stations showed a big difference. However, during 1974–2002, two out of the five driest winters (i.e., 1996 and 1991) are wetter than 66% of all winters in the Gaza region. Similarly, one out of the six wettest winters (i.e., 1980) is drier than 76% of all winters in the Gaza. This implies that reanalysis data might not be the optimum source to investigate the trend of SP in the EM region, characterized by spatial complexity.
This study highlights the importance of forecasting future changes in SP. Downscaling from Global Circulation Models (GCMs) is a key concern because of the coarse spatial resolution. This resolution hinders the GCMs’ ability to identify local weather conditions in small areas such as Gaza. Improvements are apparent in the GCMs. However, most of them still having large horizontal resolutions. Due to the present uncertainty in the EM region (see introduction part) and the pressing need for forecasting SP in Gaza, further research is highly recommended, and there is a potential for using stochastic rainfall generators to investigate the trend of SP under climate change at the finest hydrological scales [62,63]. The study also sheds light on assessing the impact of SP changes on a regional scale. It is recognized that the correlation measures the dependence (co-variability) of given variables, which does not indicate that there is a causal link between variables. The associated uncertainty should be considered, and better correlations of SP can be obtained with regional circulation indices [64]. The occurrence of periodicity in SP over the region should also be a subject of attention [65]. Still, being a developing area with minimal water resources, the proposed changes in SP over the Gaza region will mostly have principal consequences on the hydrological budget. Examples from adjacent countries such as Lebanon demonstrate the occurrence of these consequences [66]. Possible areas of effect in Gaza are irrigation demand, groundwater resources, the economy, and social development.
Author Contributions
Conceptualization, Methodology, Analysis and Writing—first draft preparation, S.B.A.; Review and Editing, S.G.A.-G. and S.B.A. All authors have read and agreed to the published version of the manuscript.
Funding
This work was made possible through a PhD scholarship from Hamad Bin Khalifa University (HBKU) under Qatar Foundation (QF) to Salah Ajjur. The Qatar National Library funded the APC. The findings reported herein are solely those of the authors.
Institutional Review Board Statement
Not applicable.
Informed Consent Statement
Not applicable.
Data Availability Statement
All data, models, and code generated or used during the study appear in the submitted article.
Acknowledgments
The authors would like to thank the Palestinian Water Authority for providing daily rainfall records. The authors also thank the National Oceanic and Atmospheric Administration (NOAA) for making available the climate indices data.
Conflicts of Interest
The authors declare no conflict of interest.
Appendix A
Figure A1.
The correlation of seasonal precipitation between Gaza stations.

References
- Hawajri, O. Natural disasters and complex humanitarian emergencies in the occupied Palestinian territories. Emerg. Disaster Rep. 2016, 3, 2340–9932. [Google Scholar]
- Kaniewski, D.; Van Campo, E.; Weiss, H. Drought is a recurring challenge in the Middle East. Proc. Natl. Acad. Sci. USA 2012, 109, 3862–3867. [Google Scholar] [CrossRef] [PubMed] [Green Version]
- Mathbout, S.; Lopez-Bustins, J.A.; Royé, D.; Martin-Vide, J.; Bech, J.; Rodrigo, F.S. Observed changes in daily precipitation extremes at annual timescale over the eastern mediterranean during 1961–2012. Pure Appl. Geophys. 2017, 175, 3875–3890. [Google Scholar] [CrossRef]
- Barlow, M.; Zaitchik, B.F.; Paz, S.; Black, E.; Evans, J.P.; Hoell, A. A review of drought in the Middle East and Southwest Asia. J. Clim. 2016, 29, 8547–8574. [Google Scholar] [CrossRef]
- Kelley, C.; Ting, M.; Seager, R.; Kushnir, Y. The relative contributions of radiative forcing and internal climate variability to the late 20th Century winter drying of the Mediterranean region. Clim. Dyn. 2011, 38, 2001–2015. [Google Scholar] [CrossRef] [Green Version]
- Shohami, D.; Dayan, U.; Morin, E. Warming and drying of the eastern Mediterranean: Additional evidence from trend analysis. J. Geophys. Res. Space Phys. 2011, 116. [Google Scholar] [CrossRef]
- Alpert, P.; Krichak, S.; Shafir, H.; Haim, D.; Osetinsky, I. Climatic trends to extremes employing regional modeling and statistical interpretation over the E. Mediterranean. Glob. Planet. Chang. 2008, 63, 163–170. [Google Scholar] [CrossRef]
- Steinberger, E.H.; Gazit-Yaari, N. Recent changes in the spatial distribution of annual precipitation in Israel. J. Clim. 1996, 9, 3328–3336. [Google Scholar] [CrossRef] [Green Version]
- Kafle, H.K.; Bruins, H.J. Climatic trends in Israel 1970–2002: Warmer and increasing aridity inland. Clim. Chang. 2009, 96, 63–77. [Google Scholar] [CrossRef]
- Ziv, B.; Saaroni, H.; Pargament, R.; Harpaz, T.; Alpert, P. Trends in rainfall regime over Israel, 1975–2010, and their relationship to large-scale variability. Reg. Environ. Chang. 2013, 14, 1751–1764. [Google Scholar] [CrossRef]
- Ajjur, S.B.; Riffi, M.I. Analysis of the observed trends in daily extreme precipitation indices in Gaza Strip during 1974–2016. Int. J. Clim. 2020, 40, 6189–6200. [Google Scholar] [CrossRef]
- Cullen, H.M.; Kaplan, A.; Arkin, P.A.; Demenocal, P.B. Impact of the North Atlantic Oscillation on Middle Eastern climate and streamflow. Clim. Chang. 2002, 55, 315–338. [Google Scholar] [CrossRef]
- Donat, M.G.; Peterson, T.C.; Brunet, M.; King, A.D.; Almazroui, M.; Kolli, R.K.; Boucherf, D.; Al-Mulla, A.Y.; Nour, A.Y.; Aly, A.A.; et al. Changes in extreme temperature and precipitation in the Arab region: Long-term trends and variability related to ENSO and NAO. Int. J. Climatol. 2014, 34, 581–592. [Google Scholar] [CrossRef]
- Black, E. The influence of the North Atlantic Oscillation and European circulation regimes on the daily to interannual variability of winter precipitation in Israel. Int. J. Clim. 2011, 32, 1654–1664. [Google Scholar] [CrossRef]
- Eshel, G.; Farrell, B.F. Thermodynamics of Eastern Mediterranean rainfall variability. J. Atmos. Sci. 2001, 58, 87–92. [Google Scholar] [CrossRef]
- Krichak, S.O.; Kishcha, P.; Alpert, P. Decadal trends of main Eurasian oscillations and the Eastern Mediterranean precipitation. Theor. Appl. Clim. 2002, 72, 209–220. [Google Scholar] [CrossRef]
- Krichak, S.O.; Tsidulko, M.; Alpert, P. Monthly synoptic patterns associated with Wet/Dry conditions in the Eastern Mediterranean. Theor. Appl. Clim. 2000, 65, 215–229. [Google Scholar] [CrossRef]
- Ben-Gai, T.; Bitan, A.; Manes, A.; Alpert, P.; Kushnir, Y. Temperature and surface pressure anomalies in Israel and the North Atlantic Oscillation. Theor. Appl. Clim. 2001, 69, 171–177. [Google Scholar] [CrossRef]
- Ziv, B.; Dayan, U.; Kushnir, Y.; Roth, C.; Enzel, Y. Regional and global atmospheric patterns governing rainfall in the southern Levant. Int. J. Clim. 2006, 26, 55–73. [Google Scholar] [CrossRef]
- Önol, B.; Semazzi, F.H.M. Regionalization of climate change simulations over the Eastern Mediterranean. J. Clim. 2009, 22, 1944–1961. [Google Scholar] [CrossRef]
- Peleg, N.; Bartov, M.; Morin, E. CMIP5-predicted climate shifts over the East Mediterranean: Implications for the transition region between Mediterranean and semi-arid climates. Int. J. Clim. 2015, 35, 2144–2153. [Google Scholar] [CrossRef]
- Samuels, R.; Hochman, A.; Baharad, A.; Givati, A.; Levi, Y.; Yosef, Y.; Saaroni, H.; Ziv, B.; Harpaz, T.; Alpert, P. Evaluation and projection of extreme precipitation indices in the Eastern Mediterranean based on CMIP5 multi-model ensemble. Int. J. Clim. 2018, 38, 2280–2297. [Google Scholar] [CrossRef]
- Krichak, S.O.; Alpert, P.; Bassat, K.; Kunin, P. The surface climatology of the eastern Mediterranean region obtained in a three-member ensemble climate change simulation experiment. Adv. Geosci. 2007, 12, 67–80. [Google Scholar] [CrossRef] [Green Version]
- Evans, J.P. 21st century climate change in the Middle East. Clim. Chang. 2008, 92, 417–432. [Google Scholar] [CrossRef]
- Terink, W.; Immerzeel, W.W.; Droogers, P. Climate change projections of precipitation and reference evapotranspiration for the Middle East and Northern Africa until 2050. Int. J. Clim. 2013, 33, 3055–3072. [Google Scholar] [CrossRef]
- Hochman, A.; Mercogliano, P.; Alpert, P.; Saaroni, H.; Bucchignani, E. High-resolution projection of climate change and extremity over Israel using COSMO-CLM. Int. J. Clim. 2018, 38, 5095–5106. [Google Scholar] [CrossRef]
- UNRWA-OCHA. United Nations Office for the Coordination of Humanitarian Affairs-Occupied Palestinian Territory. Available online: https://www.ochaopt.org/content/winter-weather-results-casualties-flooding-and-additional-displacement-gaza-strip (accessed on 25 May 2020).
- UNRWA-OCHA. United Nations Office for the Coordination of Humanitarian Affairs. Humanitarian Bulletin Occupied Palestinian Territory. Available online: https://www.ochaopt.org/content/monthly-humanitarian-bulletin-november (accessed on 25 May 2020).
- UNRWA-OCHA. United Nations Office for the Coordination of Humanitarian Affairs. Humanitarian Bulletin Occupied Palestinian Territory. Available online: https://www.ochaopt.org/content/poor-infrastructure-and-lack-funding-put-over-560000-people-risk-flooding-gaza-strip (accessed on 25 May 2020).
- Ajjur, S.B.; Mogheir, Y.K. Identification of intrinsic suitable sites in Gaza Strip for the application of artificial groundwater recharge using a geographic information system multicriteria decision analysis. J. Multi-Criteria Decis. Anal. 2020, 27, 255–265. [Google Scholar] [CrossRef]
- Mason, M.; Zeitoun, M.; Mimi, Z. Compounding vulnerability: Impacts of climate change on Palestinians in Gaza and the West Bank. J. Palest. Stud. 2012, 41, 38–53. [Google Scholar] [CrossRef]
- United Nation Environment Programme UNEP. Desk Study on the Environment in the Occupied Palestinian Territories; United Nation Environment Programme UNEP: Geneva, Switzerland, 2003. [Google Scholar]
- Peel, M.C.; Finlayson, B.L.; McMahon, T.A. Updated world map of the Köppen-Geiger climate classification. Hydrol. Earth Syst. Sci. 2007, 11, 1633–1644. [Google Scholar] [CrossRef] [Green Version]
- Ajjur, S.B.; Mogheir, Y.K. Flood hazard mapping using a multi-criteria decision analysis and GIS (case study Gaza Governorate, Palestine). Arab. J. Geosci. 2020, 13, 44. [Google Scholar] [CrossRef]
- Hussein, H. Lifting the veil: Unpacking the discourse of water scarcity in Jordan. Environ. Sci. Policy 2018, 89, 385–392. [Google Scholar] [CrossRef]
- Hussein, H. Politics of the dead sea canal: A historical review of the evolving discourses, interests, and plans. Water Int. 2017, 42, 527–542. [Google Scholar] [CrossRef]
- Hussein, H. Whose “reality”? Discourses and hydropolitics along the Yarmouk River. Contemp. Levant 2017, 2, 103–115. [Google Scholar] [CrossRef]
- Hussein, H.; Menga, F.; Greco, F. Monitoring transboundary water cooperation in SDG 6.5.2: How a critical hydropolitics approach can spot inequitable outcomes. Sustainability 2018, 10, 3640. [Google Scholar] [CrossRef] [Green Version]
- Wang, X.; Yang, F. RH Tests-dlyPrcp User Manual. Available online: http://etccdi.pacificclimate.org/RHtest/RHtests_dlyPrcp_UserManual_10Dec2014.pdf (accessed on 10 December 2020).
- Zhou, B.; Liang, C.; Zhao, P.; Dai, Q. Analysis of precipitation extremes in the source region of the yangtze river during 1960–2016. Water 2018, 10, 1691. [Google Scholar] [CrossRef] [Green Version]
- Kendall, M.G. Rank Correlation Methods, 4th ed.; Charles Griffin & Company: London, UK, 1970. [Google Scholar]
- Bayazit, M.; Önöz, B. To prewhiten or not to prewhiten in trend analysis? Hydrol. Sci. J. 2007, 52, 611–624. [Google Scholar] [CrossRef]
- Canchala, T.; Cerón, W.L.; Francés, F.; Carvajal-Escobar, Y.; Andreoli, R.V.; Kayano, M.T.; Alfonso-Morales, W.; Caicedo-Bravo, E.; De Souza, R.A.F. Streamflow variability in Colombian Pacific Basins and their teleconnections with climate indices. Water 2020, 12, 526. [Google Scholar] [CrossRef] [Green Version]
- Ni, N.; Zhang, H. A study of precipitation patterns through stochastic ordering. Water 2020, 12, 351. [Google Scholar] [CrossRef] [Green Version]
- Yuan, F.; Liu, J.; Berndtsson, R.; Hao, Z.; Cao, Q.; Wang, H.; Du, Y.; An, D. Changes in Precipitation extremes over the source region of the yellow river and its relationship with teleconnection patterns. Water 2020, 12, 978. [Google Scholar] [CrossRef] [Green Version]
- Zhang, R.; Xu, Z.; Zuo, D.; Ban, C. Hydro-meteorological trends in the Yarlung Zangbo River Basin and possible associations with large-scale circulation. Water 2020, 12, 144. [Google Scholar] [CrossRef] [Green Version]
- Hurrell, J.W.; Kushnir, Y.; Ottersen, G.; Visbeck, M. An Overview of the North Atlantic Oscillation. In Geophysical Monograph Series; American Geophysical Union (AGU): Washington, DC, USA, 2003; Volume 134, pp. 1–35. [Google Scholar]
- Allan, R.J.; Nicholls, N.; Jones, P.D.; Butterworth, I.J. A further extension of the Tahiti-Darwin SOI, Early ENSO events and darwin pressure. J. Clim. 1991, 4, 743–749. [Google Scholar] [CrossRef]
- Rayner, N.A.; Parker, D.E.; Horton, E.B.; Folland, C.K.; Alexander, L.V.; Rowell, D.P.; Kent, E.C.; Kaplan, A.L. Global analyses of sea surface temperature, sea ice, and night marine air temperature since the late nineteenth century. J. Geophys. Res. Space Phys. 2003, 108. [Google Scholar] [CrossRef]
- Higgins, R.W.; Leetmaa, A.; Kousky, V.E. Relationships between climate variability and winter temperature extremes in the United States. J. Clim. 2002, 15, 1555–1572. [Google Scholar] [CrossRef] [Green Version]
- Barnston, A.G.; Livezey, R.E. Classification, seasonality and persistence of low-frequency atmospheric circulation patterns. Mon. Weather Rev. 1987, 115, 1083–1126. [Google Scholar] [CrossRef]
- Dehghani, M.; Salehi, S.; Mosavi, A.; Nabipour, N.; Shamshirband, S.; Ghamisi, P. Spatial analysis of seasonal precipitation over Iran: Co-variation with climate indices. ISPRS Int. J. Geo-Inf. 2020, 9, 73. [Google Scholar] [CrossRef] [Green Version]
- Saghafian, B.; Haghnegahdar, A.; Dehghani, M. Effect of ENSO on annual maximum floods and volume over threshold in the southwestern region of Iran. Hydrol. Sci. J. 2017, 62, 1039–1049. [Google Scholar] [CrossRef]
- Xiao, M.; Zhang, Q.; Singh, V.P. Influences of ENSO, NAO, IOD and PDO on seasonal precipitation regimes in the Yangtze River basin, China. Int. J. Clim. 2015, 35, 3556–3567. [Google Scholar] [CrossRef]
- Stojanovic, M.; Liberato, M.L.; Sorí, R.; Vázquez, M.; Phan-Van, T.; Duongvan, H.; Cong, T.H.; Nguyen, P.N.B.; Nieto, R.; Gimeno, L. Trends and extremes of drought episodes in Vietnam sub-regions during 1980–2017 at different timescales. Water 2020, 12, 813. [Google Scholar] [CrossRef] [Green Version]
- Krichak, S.O.; Tsidulko, M.; Alpert, P. 2 November 1994, severe storms in the southeastern Mediterranean. Atmos. Res. 2000, 53, 45–62. [Google Scholar] [CrossRef]
- Ziv, B.; Dayan, U.; Sharon, D. A mid-winter, tropical extreme flood-producing storm in southern Israel: Synoptic scale analysis. Theor. Appl. Clim. 2004, 88, 53–63. [Google Scholar] [CrossRef]
- Saeed, S.; Almazroui, M. Impacts of mid-latitude circulation on winter precipitation over the Arabian Peninsula. Clim. Dyn. 2019, 53, 5253–5264. [Google Scholar] [CrossRef]
- Price, C.; Stone, L.; Huppert, A.; Rajagopalan, B.; Alpert, P. A possible link between El Niño and precipitation in Israel. Geophys. Res. Lett. 1998, 25, 3963–3966. [Google Scholar] [CrossRef]
- Xoplaki, E.; González-Rouco, J.F.; Luterbacher, J.; Wanner, H. Wet season Mediterranean precipitation variability: Influence of large-scale dynamics and trends. Clim. Dyn. 2004, 23, 63–78. [Google Scholar] [CrossRef] [Green Version]
- Zittis, G. Observed rainfall trends and precipitation uncertainty in the vicinity of the Mediterranean, Middle East and North Africa. Theor. Appl. Clim. 2018, 134, 1207–1230. [Google Scholar] [CrossRef]
- De Luca, D.L.; Petroselli, A.; Galasso, L. A transient stochastic rainfall generator for climate changes analysis at hydrological scales in Central Italy. Atmosphere 2020, 11, 1292. [Google Scholar] [CrossRef]
- Burton, A.; Fowler, H.; Blenkinsop, S.; Kilsby, C. Downscaling transient climate change using a Neyman–scott rectangular Pulses stochastic rainfall model. J. Hydrol. 2010, 381, 18–32. [Google Scholar] [CrossRef]
- Twardosz, R.; Kossowska-Cezak, U. Winter air temperature in Warsaw depending on the NAO index and the regional circulation. Q. J. Hung. Meteorol. Serv. 2020, 124, 97–111. [Google Scholar] [CrossRef]
- Walanus, A.; Cebulska, M.; Twardosz, R. Long-term variability pattern of monthly and annual atmospheric precipitation in the polish carpathian mountains and their Foreland (1881–2018). Pure Appl. Geophys. 2021, 178, 633–650. [Google Scholar] [CrossRef]
- Riachi, R. Beyond Rehashed Policies: Lebanon Must Tackle its Water Crisis Head-on. The Lebanese Center for Policy Studies. Available online: https://www.lcps-lebanon.org/featuredArticle.php?id=27 (accessed on 10 December 2020).
Figure 1.
Location map of Gaza, climate classes according to Köppen-Geiger climate classification and meteorological stations.
Figure 1.
Location map of Gaza, climate classes according to Köppen-Geiger climate classification and meteorological stations.

Figure 2.
The average seasonal and annual rainfall trends in Gaza between 1974 and 2016. The straight line represents the linear trend.
Figure 2.
The average seasonal and annual rainfall trends in Gaza between 1974 and 2016. The straight line represents the linear trend.

Figure 3.
Seasonal precipitation at seven meteorological stations in Gaza during 1974–2016.

Figure 4.
The correlation between the seasonal precipitation over Gaza and the NAO, SOI, Niño 3.4, AO, and EAWR. The left (right) panel shows the correlation with the current (next) year. Labels at the meteorological stations indicate the month, which has the highest correlation with SP.
Figure 4.
The correlation between the seasonal precipitation over Gaza and the NAO, SOI, Niño 3.4, AO, and EAWR. The left (right) panel shows the correlation with the current (next) year. Labels at the meteorological stations indicate the month, which has the highest correlation with SP.


Table 1.
Meteorological stations in Gaza and climate classes according to Köppen-Geiger climate classification.
Table 1.
Meteorological stations in Gaza and climate classes according to Köppen-Geiger climate classification.
| Station Name | Latitude_N | Longitude_E | Altitude_m | Climate Class | Thiessen Weight (–) |
|---|---|---|---|---|---|
| Beit-Hanon | 31°32′30″ | 34°32′24″ | 62 | Csa (dry temperate) | 0.097 |
| Beit-Lahia | 31°33′51″ | 34°28′10″ | 7 | 0.057 | |
| Remal | 31°31′09″ | 34°26′33″ | 30 | 0.156 | |
| Nuseirat | 31°26′08″ | 34°23′19″ | 23 | BSha (semi-arid) | 0.128 |
| Deir-Elbalah | 31°24′47″ | 34°21′11″ | 32 | 0.105 | |
| Khan-Yunes | 31°20′35″ | 34°18′30″ | 43 | 0.275 | |
| Rafah | 31°16′16″ | 34°15′16″ | 71 | 0.181 |
Table 2.
The classification of NAO, SOI, Niño 3.4, AO, and EAWR indices.
| Indices Range | NAO | SOI | Niño 3.4 | AO | EAWR |
|---|---|---|---|---|---|
| I ≤ −2 | Cold | Very active El Niño | Warm | Cold | Cold |
| −2 < I ≤ −1 | Active El Niño | ||||
| −1 < I ≤ 1 | Neutral | Neutral | Neutral | Neutral | Neutral |
| 1 < I ≤ 2 | Warm | Active La Niña | Cold | Warm | Warm |
| I ≥ 2 | very active La Niña |
I is the value of each climate index
Table 3.
The average long-term (1974–2016) seasonal and annual precipitation trends in Gaza based on linear regression and Mann Kendall test.
Table 3.
The average long-term (1974–2016) seasonal and annual precipitation trends in Gaza based on linear regression and Mann Kendall test.
| Season | Mean (µ) | Max | Min | Average Trenda (Linear Slope) | MK Testa (Z) | Percentage of Stations with | |
|---|---|---|---|---|---|---|---|
| Positive Trend | Negative Trend | ||||||
| Winter | 188.9 | 337.1 | 43.8 | 0.08 | 0.02 | 43% | 57% |
| Spring | 41.1 | 115.5 | 0 | −0.19 | −0.55 | 14% | 86% |
| Summer | - | - | - | - | - | - | - |
| Autumn | 65.9 | 306.5 | 0 | 1.27 | 1.63 | 100% (28%) | - |
| Annual | 295.8 | 563 | 103.4 | 1.17 | 1.15 | 100 | - |
Percentage in parentheses indicates stations with significant trends at α = 0.05.
Table 4.
The classification of climate indices and total changes in seasonal precipitation between 1974 and 2016.
Table 4.
The classification of climate indices and total changes in seasonal precipitation between 1974 and 2016.
| Year | SOI | EAWR | AO | Variation from the Long-Term (1974–2016) Average | ||
|---|---|---|---|---|---|---|
| Winter | Spring | Autumn | ||||
| 1974 | active La Niña | Neutral | Neutral | +71% | +60% | −25% |
| 1975 | active La Niña | Neutral | Neutral | −23% | +6% | −100% |
| 1976 | Neutral | Neutral | Neutral | −16% | −69% | −49% |
| 1977 | active El Niño | Neutral | Neutral | +4% | +67% | −79% |
| 1978 | Neutral | Neutral | Neutral | +9% | −25% | −32% |
| 1979 | Neutral | Neutral | Warm | −31% | +10% | −1% |
| 1980 | active El Niño | Neutral | Neutral | −30% | - | +6% |
| 1981 | Neutral | Neutral | Cool | - | −53% | −97% |
| 1982 | Neutral | Neutral | Neutral | −19% | +45% | −28% |
| 1983 | active El Niño | Neutral | Neutral | +28% | +47% | +64% |
| 1984 | Neutral | Neutral | Neutral | −77% | +3% | −63% |
| 1985 | active La Niña | Neutral | Neutral | −39% | +2% | −55% |
| 1986 | Neutral | Neutral | Cool | −15% | +66% | −91% |
| 1987 | Very active El Niño | Warm | Neutral | −29% | +11% | +365% |
| 1988 | Neutral | Neutral | Neutral | +25% | −46% | −72% |
| 1989 | very active La Niña | Cool | Neutral | +50% | −62% | −41% |
| 1990 | Neutral | Neutral | Neutral | +1% | +117% | −9% |
| 1991 | active El Niño | Neutral | Neutral | +22% | +181% | −75% |
| 1992 | Very active El Niño | Warm | Neutral | +46% | −54% | +71% |
| 1993 | Very active El Niño | Warm | Neutral | +44% | −31% | −37% |
| 1994 | Very active El Niño | Warm | Neutral | −59% | −29% | −29% |
| 1995 | active El Niño | Neutral | Warm | +32% | −22% | +328% |
| 1996 | Neutral | Neutral | Neutral | +22% | +152% | −50% |
| 1997 | active El Niño | Neutral | Neutral | +13% | +41% | −30% |
| 1998 | Very active El Niño | Warm | Neutral | −33% | −71% | −93% |
| 1999 | very active La Niña | Cool | Cool | −58% | −70% | −81% |
| 2000 | active La Niña | Cool | Neutral | +18% | −48% | −59% |
| 2001 | Neutral | Neutral | Cool | +76% | −61% | +39% |
| 2002 | Neutral | Neutral | Neutral | +60% | +24% | −17% |
| 2003 | Neutral | Neutral | Cool | +50% | +34% | −50% |
| 2004 | active El Niño | warm | Neutral | −24% | −42% | −94% |
| 2005 | active El Niño | Neutral | Neutral | −25% | −2% | +95% |
| 2006 | active La Niña | Neutral | Neutral | −46% | +32% | −7% |
| 2007 | Neutral | Neutral | Neutral | +7% | +48% | +52% |
| 2008 | Neutral | Neutral | Neutral | +5% | - | −47% |
| 2009 | active La Niña | Neutral | Neutral | −35% | −35% | +101% |
| 2010 | active La Niña | Cool | Neutral | −30% | −84% | −6% |
| 2011 | very active La Niña | Cool | Neutral | −23% | +45% | −89% |
| 2012 | Neutral | Neutral | Warm | −5% | +47% | +73% |
| 2013 | Neutral | Neutral | Neutral | +6% | −77% | −31% |
| 2014 | Neutral | Neutral | Warm | +79% | +68% | −89% |
| 2015 | Neutral | Neutral | Neutral | −54% | −5% | +232% |
| 2016 | Very active El Niño | Warm | Warm | +6% | −29% | +196% |
Publisher’s Note: MDPI stays neutral with regard to jurisdictional claims in published maps and institutional affiliations. |
© 2021 by the authors. Licensee MDPI, Basel, Switzerland. This article is an open access article distributed under the terms and conditions of the Creative Commons Attribution (CC BY) license (http://creativecommons.org/licenses/by/4.0/).
Share and Cite
MDPI and ACS Style
Ajjur, S.B.; Al-Ghamdi, S.G. Variation in Seasonal Precipitation over Gaza (Palestine) and Its Sensitivity to Teleconnection Patterns. Water 2021, 13, 667. https://doi.org/10.3390/w13050667
AMA Style
Ajjur SB, Al-Ghamdi SG. Variation in Seasonal Precipitation over Gaza (Palestine) and Its Sensitivity to Teleconnection Patterns. Water. 2021; 13(5):667. https://doi.org/10.3390/w13050667
Chicago/Turabian StyleAjjur, Salah Basem, and Sami G. Al-Ghamdi. 2021. "Variation in Seasonal Precipitation over Gaza (Palestine) and Its Sensitivity to Teleconnection Patterns" Water 13, no. 5: 667. https://doi.org/10.3390/w13050667
Note that from the first issue of 2016, this journal uses article numbers instead of page numbers. See further details here.