
The Field-Scale Investigation of the Low Mobility of Drainage Canal Sediments Polluted by Copper in Lowland Area of Croatia


1
Institute IGH, 31000 Osijek, Croatia
2
Faculty of Civil Engineering and Architecture, Josip Juraj Strossmayer University of Osijek, 31000 Osijek, Croatia
*
Author to whom correspondence should be addressed.
Water 2021, 13(5), 677; https://doi.org/10.3390/w13050677
Submission received: 30 December 2020
/
Revised: 22 February 2021
/
Accepted: 26 February 2021
/
Published: 2 March 2021
(This article belongs to the Special Issue Processes Influencing Water Quality in Surface Catchments in the Context of the Local and Global Distribution of Pollutants)
Abstract
:The sedimentation of drainage canals is a common process and its intensity depends on several geographical and hydrological factors. Drainage canal sediments are frequently polluted by heavy metals or other pollutants; they need to be periodically dredged and ultimately, have to be safely disposed of. Furthermore, pollution in smaller drainages may go undetected because under the Water Framework Directive (Directive 2000/60/EC), catchment areas < 10 km2 do not require monitoring. We investigated the hypothesis that water resources of small sub-catchments exposed to agricultural pollutants accumulate sediment for a longer period (several years) and severely enhance environmental risks. We analyzed the data on sediment mobility in drainage canals for a small lowland catchment in Croatia during 2013–2017. We conducted sediment transport modelling for actual precipitation episodes of a 10-year return period and design precipitation of a 50-year return period. The results indicated that sediments and associated copper pollution persist at the canal bottom for several years, which increases the risk of polluting groundwater and the environment in general. Only copper present at the maximum downstream section of the canal has the possibility of moving to the recipient stream and would only be detected in catchment areas bigger than 10 km2. We proved that smaller water bodies evaluated according to monitoring standards prescribed for the closest larger water can enhance environmental risks.
1. Introduction
Sedimentation in natural and artificial open watercourses is a hydrological and hydraulic phenomenon essential for watercourse morphology [1]. From a water quality perspective, besides the anthropogenic and geochemical input of heavy metals in the drainage system, the sedimentation process is important because of the tendency of heavy metals to bind to suspended and bed loads [2].
It has been found that sediment quality is mainly influenced by geological and geochemical background and because of that, direct determination of heavy metal speciation in soils and sediments is still difficult in routine analysist [3]. Generally, catchment characteristics and atmospheric conditions (including land cover) determine the yield, concentration of heavy metals, and chemical composition of sediments [4,5].
Sediments can be analyzed considering different criteria, such as catchment characteristics. Lowland parts of catchments are more exposed to intensive sedimentation of soil eroded from steeper parts of catchment, usually caused by heavy and intensive precipitation. The hydromorphological characteristics of the watercourse and pollution source can be criteria of sediment analysis as well. It is important to recognize that sediments of reservoirs, natural rivers, and artificial watercourses (drainage canals) are mutually distinct, owing to the differences in mechanisms of sedimentation, susceptibility to pollution, and mobility.
Sediments associated with natural watercourses have different susceptibilities to pollution during wet, intermediate, or dry seasons [6]. Pollution exposure also varies between upstream and downstream sections and metal contamination of sediments is mostly confined to the lower reaches of the river [7]. Additionally, large rivers are less susceptible to pollution despite their large basin.
For example, excluding single sampling sites and some tributaries, the pollution level of the River Danube by As, Cr, Cu, Pb, Hg, Ni, and Zn is regarded as rather low [8]. However, flooding episodes can increase heavy metal content in river sediments, but those effects are only temporary. Hence, anthropogenic pollution is more important than flood-related pollution, but they both have mainly anthropogenic and sometimes partly geogenic origins [9].
Artificial canals used for drainage and irrigation have higher levels of pollution compared to natural watercourses. The concentration of heavy metals in artificial watercourses such as drainage and irrigation canals can be several times higher than that for natural rivers, and their mobility is very low [10].
Comparing to drainage canals, irrigation canals are better researched with respect to the genesis of sediments and their pollution. As these processes are complex, irrigation-dominated watersheds require stochastic rather than deterministic forecasting [11]. Irrigation canals require monitoring of sediment mobility to maintain an adequate discharge profile [12]. Reduction in profile, particularly due to low longitudinal slope, and disposal of potentially polluted dredged sediment are recognized as serious problems [13,14], which are also applicable for drainage canals; however, the expected pollution level in drainage canals is much higher. Canal sediment contamination by heavy metals and its origin has been the focus of several investigations in Italy and The Netherlands [15,16]. These studies identified heavy metals and phosphorus as dominant pollutants that originate from vehicular traffic and agriculture, with concentrations dependent on catchment hydrological features. Similar conclusions were deduced for a large drainage system in Serbia, where severe pollution from chromium, copper, cadmium, and zinc was attributed to anthropogenic origin [17].
In addition, sediment mobility depends on local characteristics. It can be reduced by lower bed slopes and vegetation or increased by larger discharges caused by precipitation of high intensity and longer duration [15,18]. Furthermore, discharge in drainage canals is mostly temporary, which affects the tendency of accumulation and concentration of substances that are deposited in drainage canals [19]. However, research on drainage canal sediments is deficient and is mainly limited to problems of specific locations [20].
Drainage canals in lowland areas are expected to be resilient to erosion processes; however, thousands of tons of sediment are annually dredged out of them [1]. Lowland areas usually have a dense drainage canal network which requires regular maintenance and dredging of sediments that are often polluted [19]. The annual accumulation of sediments in canals depends on maintenance regularity, discharges, and vegetation that together influence sediment stability and its impact on the environment, particularly groundwater [21,22,23].
The disposal of sediment dredged from canals is also problematic. It is known that sediments generally have a tendency to associate with the labile fraction of the soil, which is the most mobile and most environmentally sensitive component [24].
The aim of this research is to overview treatment of this problem in the EU Water Framework Directive [25], which is a document of great importance. It institutionalizes ecosystem-based objectives and planning processes at the level of the hydrographic basin as the basis for water resource management, having important overall implications in shaping developments in water policy and management at an international level [26]. Of course, fulfilment of the ultimate objective of a “good” overall quality of all waters is questionable in terms of the high costs. Later, Directive 2008/105/EC defined environmental quality standards (EQS) in accordance with Directive 2000/60/EC, for the 33 priority substances identified in Decision No 2455/2001/EC and eight other pollutants that were already regulated at the Union level [27]. According to this regulation, member states should, inter alia, monitor sediment and biota, as appropriate, at an adequate frequency to provide sufficient data for a reliable long-term trend analysis of those priority substances that tend to accumulate in sediment and/or biota. Five years later, in Directive 2013/39/EU, the Commission completed its first review of the list of priority substances. For substances for which an EQS for sediment and/or biota is applied, monitoring the substance is obligatory in the relevant matrix at least once every year, unless technical knowledge and expert judgment justify another interval [28]. According to Croatian regulations, there are no standards for canal sediment pollution evaluation. In order to assess the severity of obtained pollution, we have analyzed Canadian regulations, Dutch regulations, and Serbian regulations related to sediment pollution [29,30,31].
After the above mentioned, only watercourses with catchment areas >10 km2 require monitoring and lakes with an area > 0.5 km2 require categorization and evaluation in accordance with WFD criteria. All smaller water bodies’ areas were evaluated according to standards prescribed for the closest larger water bodies. In Croatian circumstances, about 80% of total watercourse length belongs to a group of very small water bodies staying out of system control. According to the research of Reyol et al. [32], spatial extrapolation tools are needed in order to evaluate the ecological status of water bodies for which no data are available.
Small watercourses, including artificial canals, are those that are exposed to considerable pollution, and it is more difficult to return it to its natural or satisfactory condition. Butler, Kallis, and Mills [33] reported an example of two river basins that diffuse pollution, becoming a bigger threat. Even at the “micro”, well-monitored regional level of the two case studies, it proved impossible to ascertain the total extent of the improvement required to achieve “good status”. Experiences in the UK are similar—non-point pollution from agriculture is recognized as a major reason for the failure of rivers in the UK to meet this target [34]. Therefore, we estimate that other European countries face the same or a similar problem related to monitoring scale, and our analyses of a small catchment with severe diffuse pollution detected that is presented in this paper emphasizes this problem.
With this background, we conceived a study to investigate the hypothesis that water resources of small sub-catchments are exposed to diffuse pollutants originating from traffic, industry, agriculture, or waste accumulate sediments for a longer time period (several years) and severely enhance environmental risks, and after dredging, the sediments continue to endanger the environment if not analyzed and managed properly. Therefore, the aim of this research is to emphasize a problem of potentially great importance in a lowland agricultural area, where environmental quality standards established in the Water Framework Directive cannot be exceeded in right way.
2. Materials and Methods
2.1. Study Area
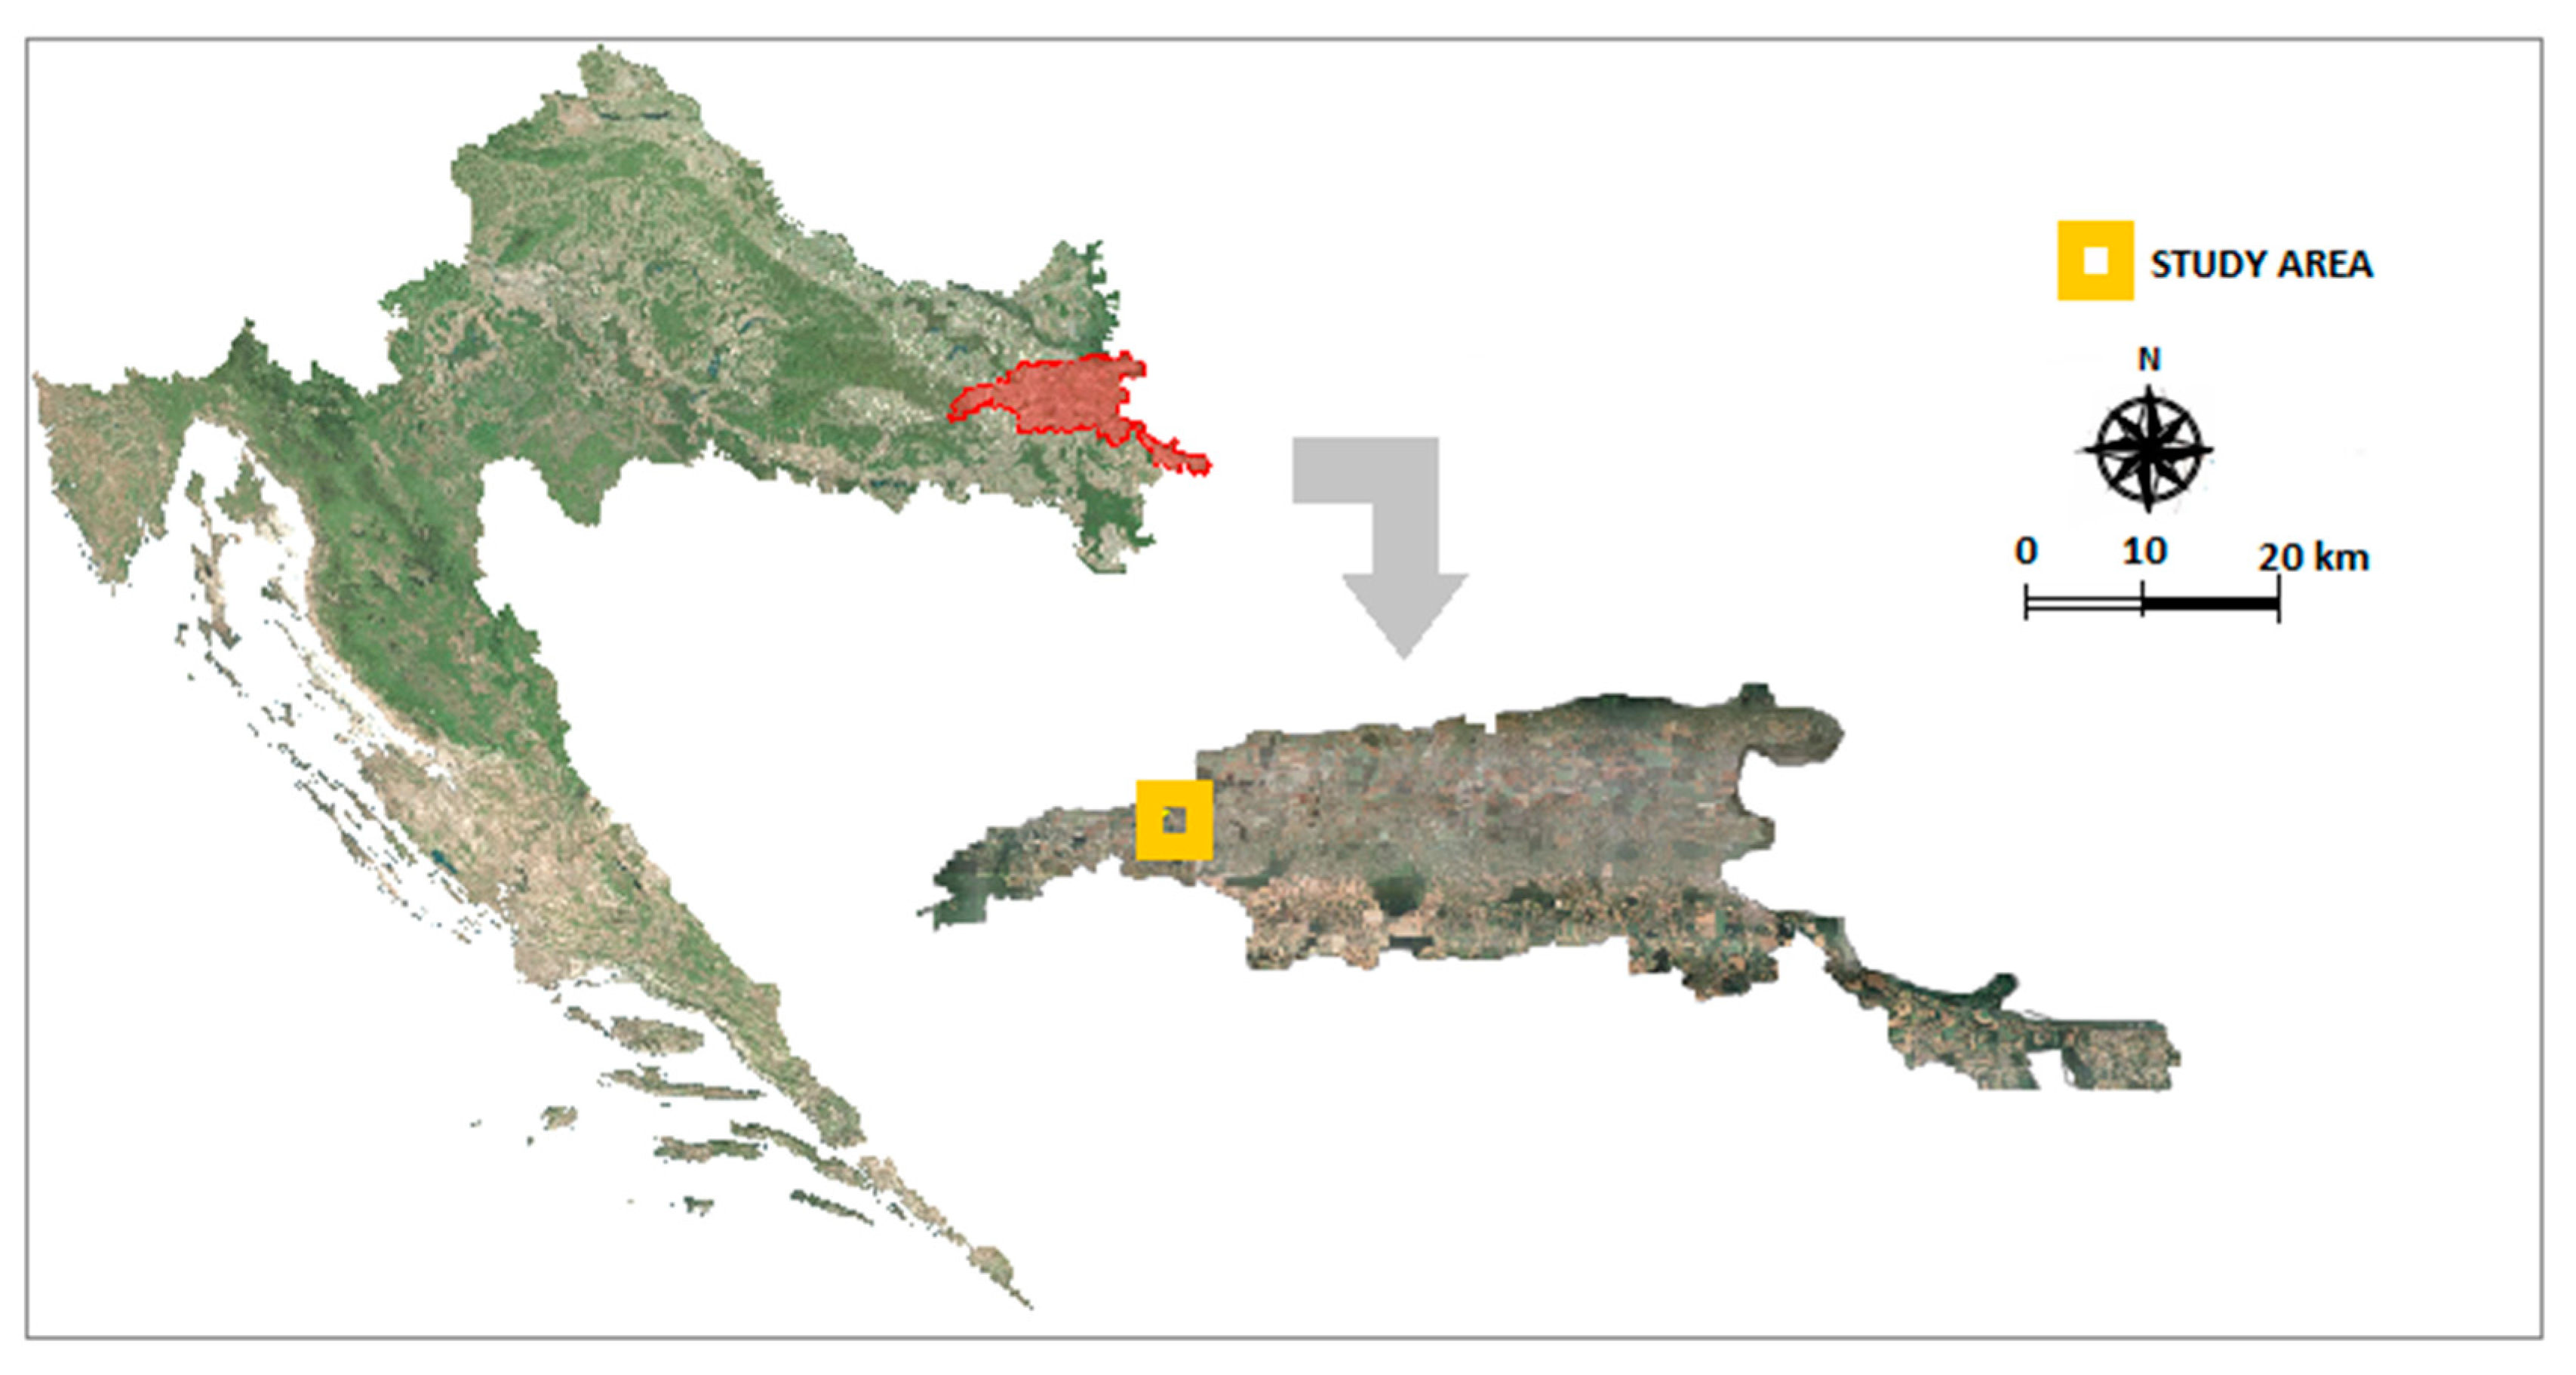
We studied sediment mobility in drainage canals in the small catchment of the Vuka river in the Danube river basin in Croatia. Most of the catchment is lowland and is spread over 1035 km2 (Figure 1). The climate of the study area is characterized as continental. In the period 1981–2018, mean air temperature was 11.5 °C and mean annual precipitation was 672 mm, with excessive rainfall occurring in June and September. The main soil types represented in the study area are automorphic and hydromorphic, characterized by a fine texture with low to very low hydraulic conductivity. The land is mainly used for agriculture (~70% of the total area), which encouraged the development of an extensive surface drainage system with associated structures [35]. The annual volume of dredged sediment was 120,000 and 200,000 m3 in 2016 and 2017, respectively. This small catchment can be representative of much larger lowland area with a significant portion of agricultural land [36].
Pollution levels were assessed by sediment sampling at 13 locations over the entire area and only copper exceeded the threshold concentration. Detection of copper pollution led to establishing a field-scale model of polluted sediment mobility or stability through canals [36].
2.2. Field Investigation
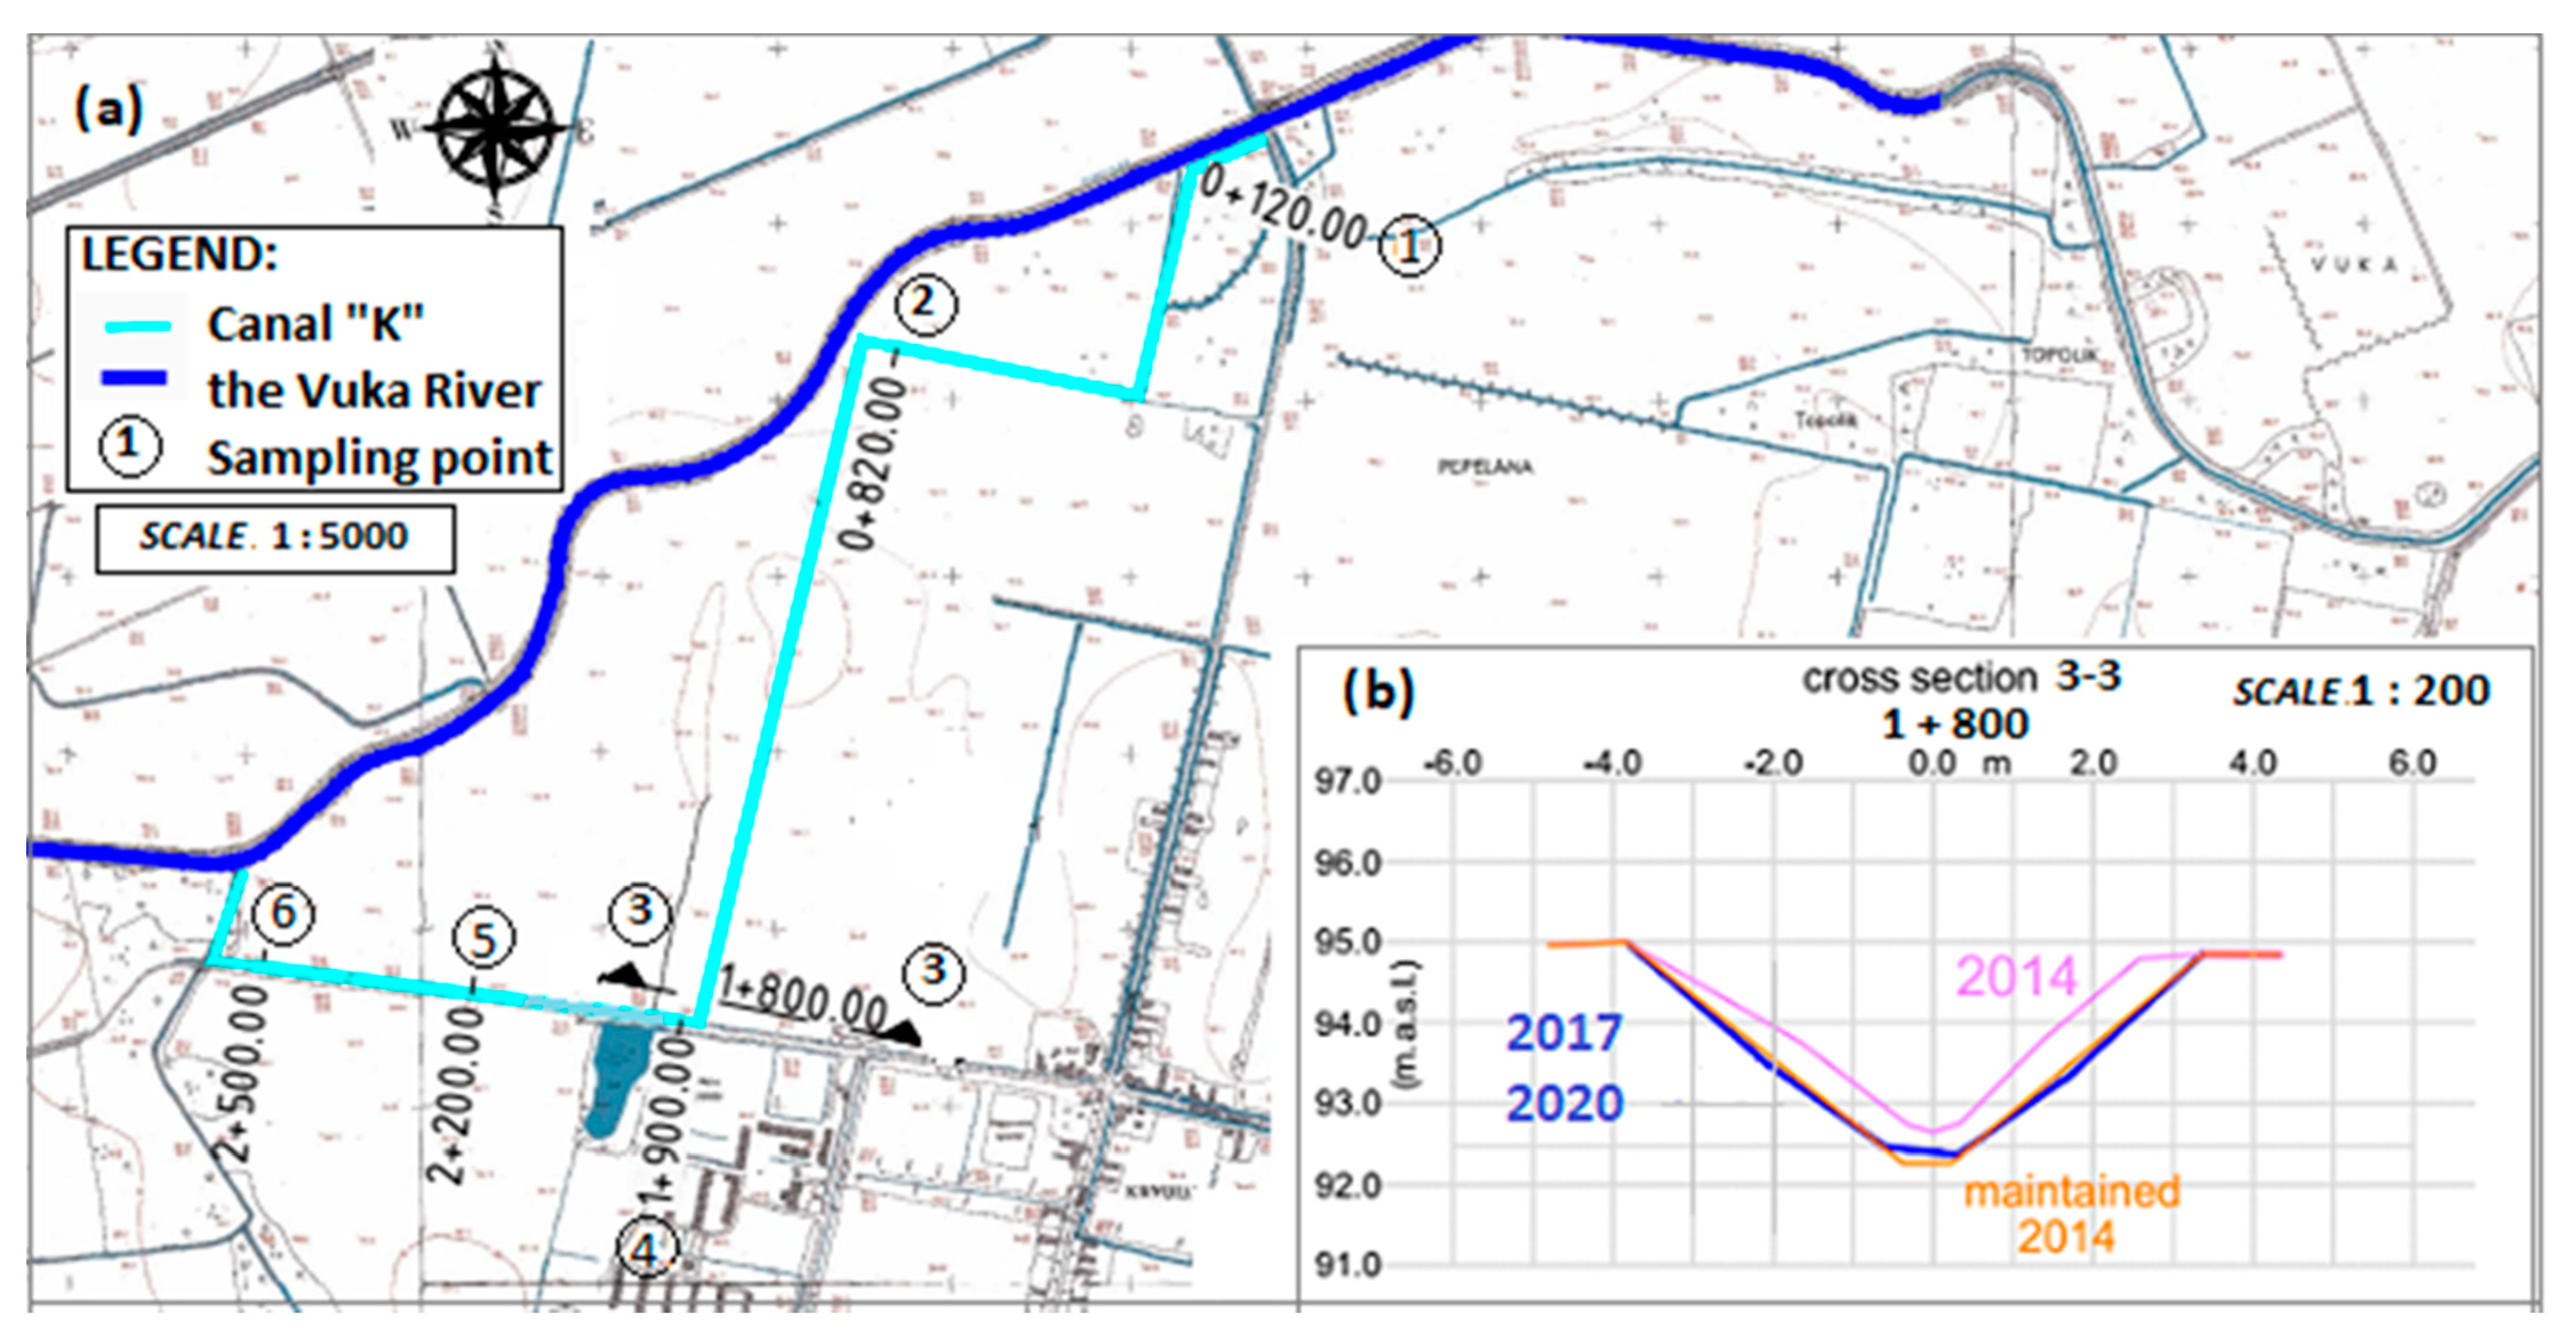
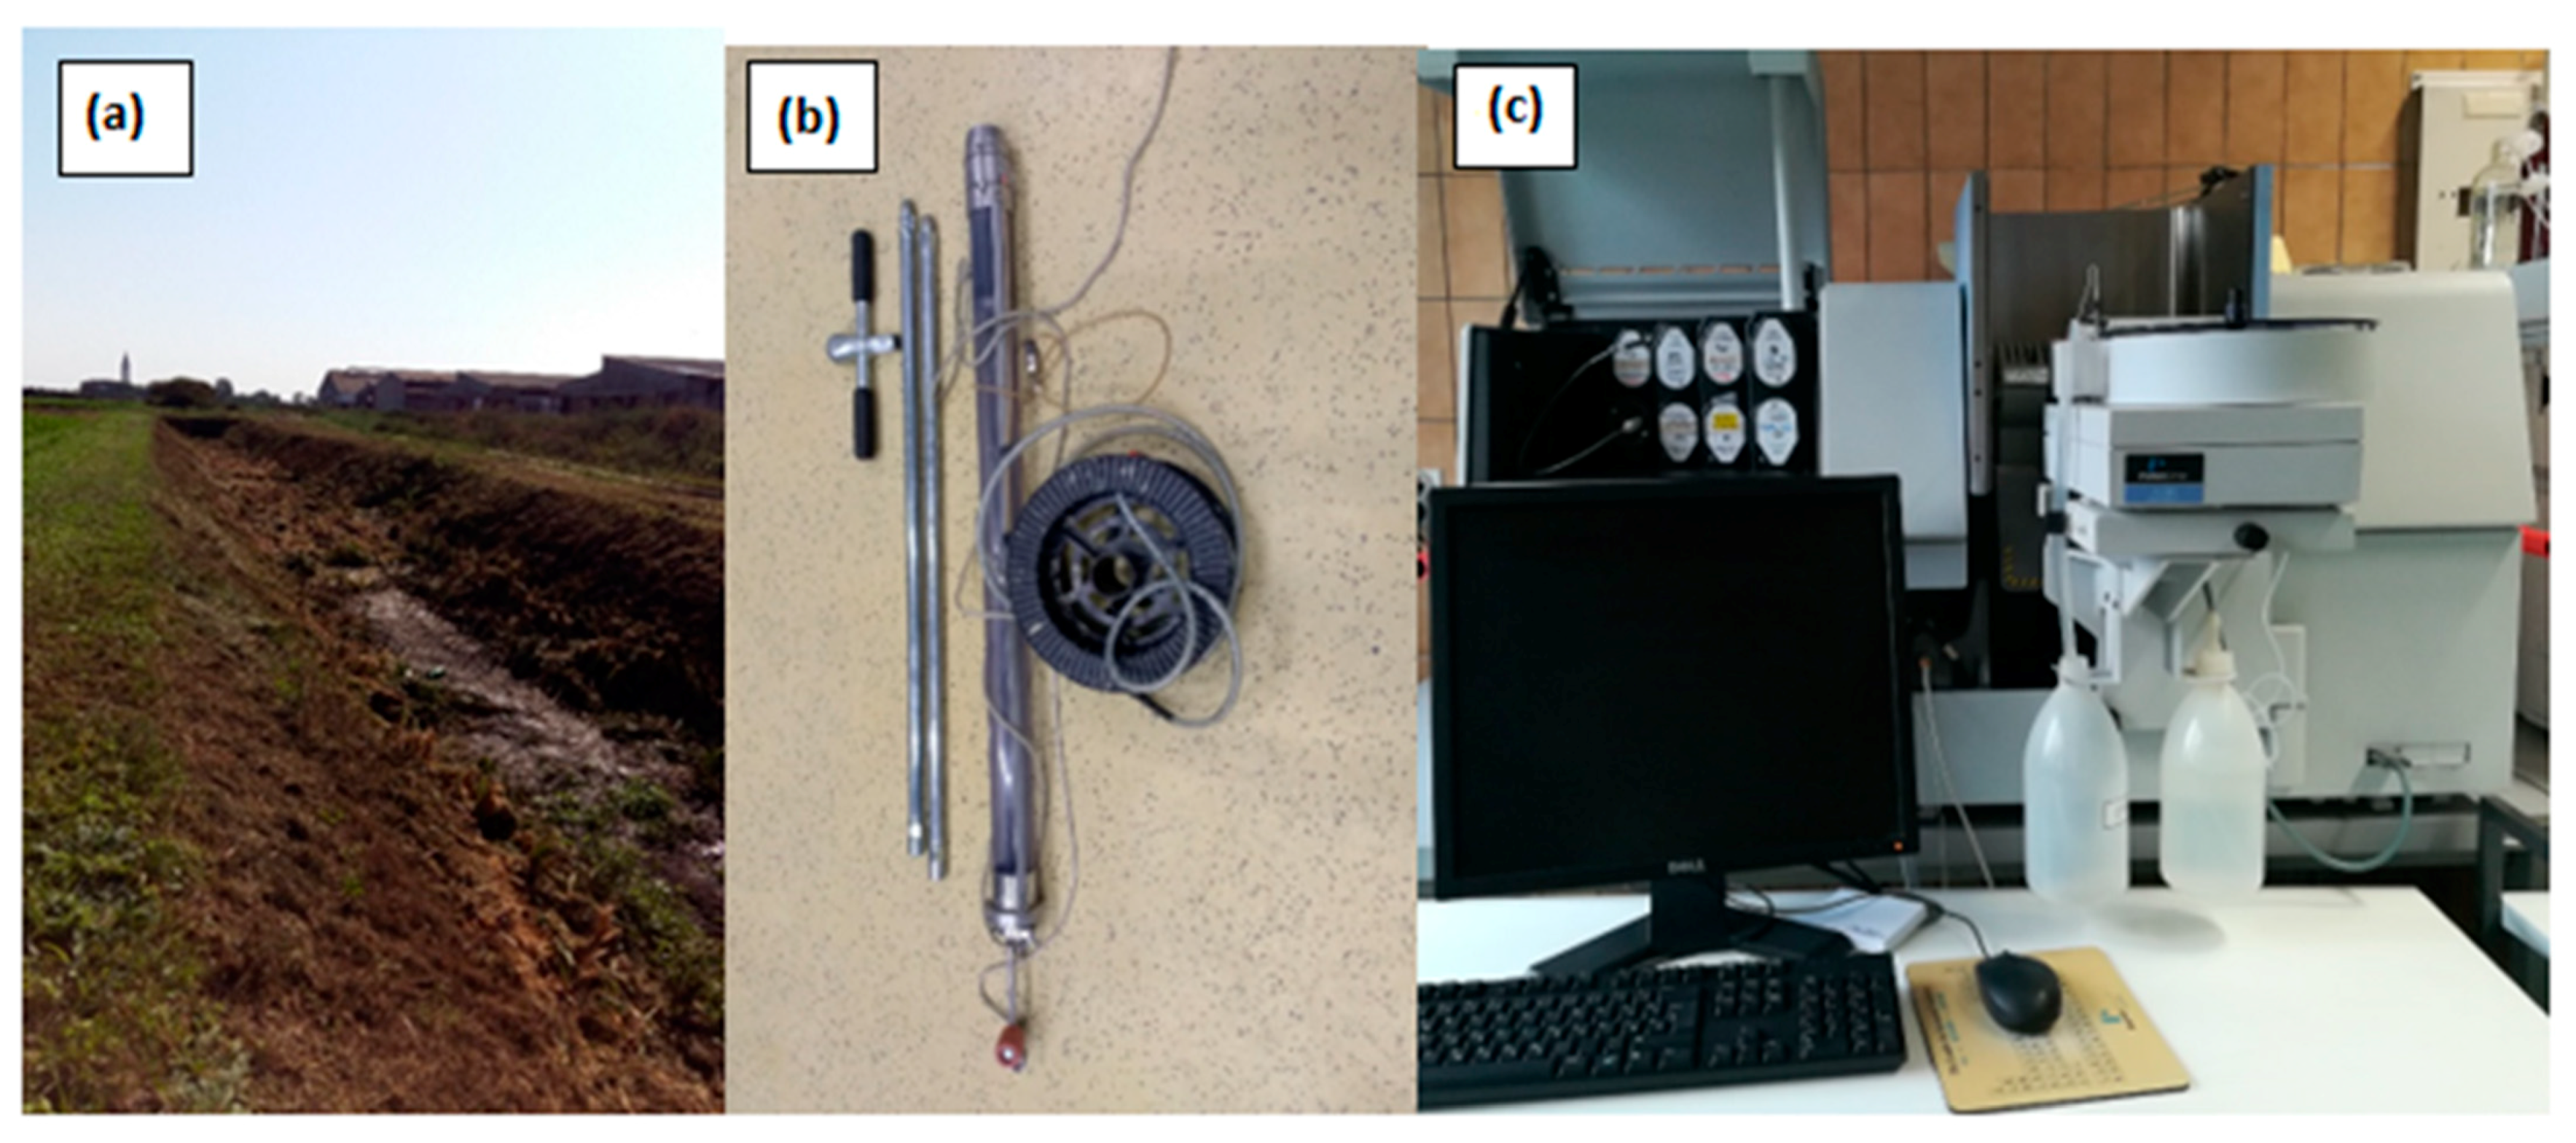
We conducted field investigations between October 2016 and December 2017 on the canal “K”, which is 2686 m long and has a uniform longitudinal slope of 0.05%. The surrounding area is agricultural (Figure 2a). We collected the following data for sediment movement modelling for the study canal: intensity of sedimentation, erodibility, sediment texture, and daily precipitation. Samples were taken from the upper sediment layer, in the middle part of the canal cross-section. Samples were taken in February 2017 and later in February 2020 by a sediment core sampler. Samples were put in plastic bags, marked, and the same day taken into the licensed laboratory of Institute of Public Health in Osijek-Baranja County. Additionally, the position of each sampling location was defined by its coordinates and registered for future samplings (Figure 2a). Figure 3 presents photographs of one sampling canal cross-section, sediment core sampler (Beeker type), and graphite furnace atomic absorption spectrometer. Analysis was made according to the General requirements for the competence of testing and calibration laboratories (EN ISO/IEC 17025:2017). Laboratory analysis of six sediment samples taken at six cross-sections confirmed high pollution by copper, especially in the midsection of the canal (Figure 2a). Cross-sections were defined on the basis of the canal’s longitudinal section and observed bottom changes [36]. Figure 2b presents depth reduction before sediment dredging in 2014 (approximately 0.5 m), in the period between 2014 and 2017 (approximately 0.3 m), and in the period between 2017 and 2020 (less than 0.15 m).
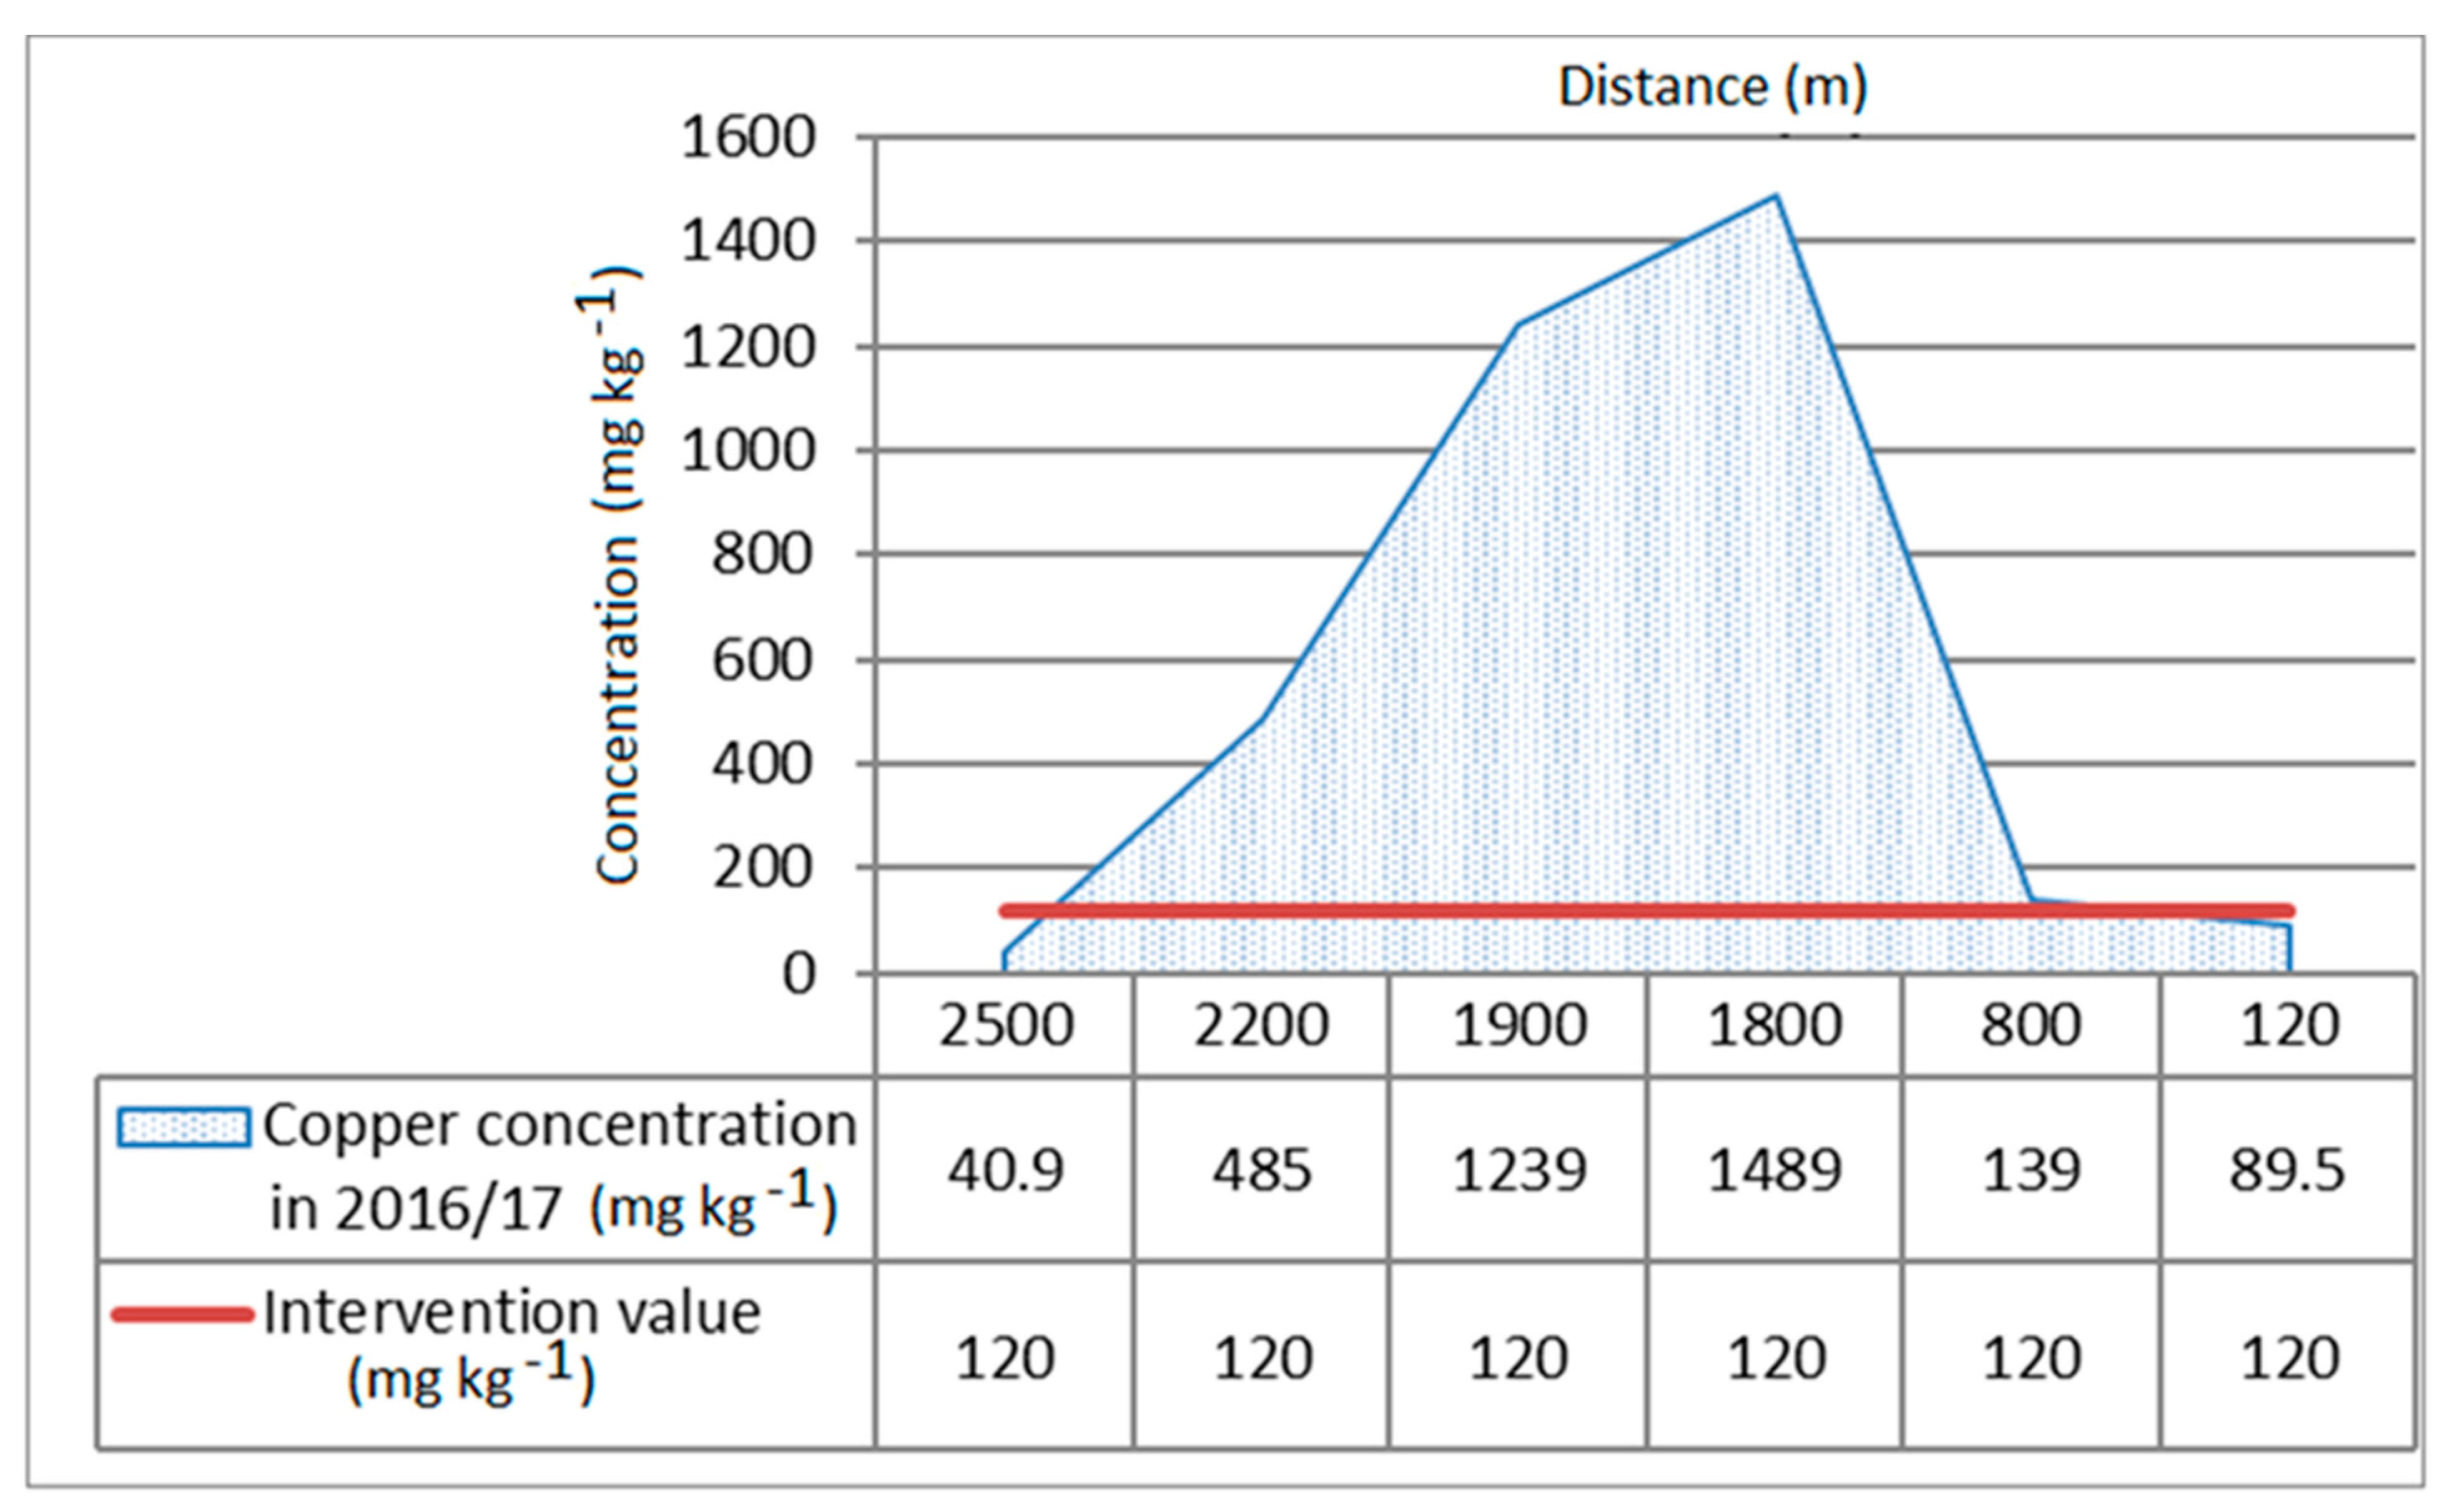
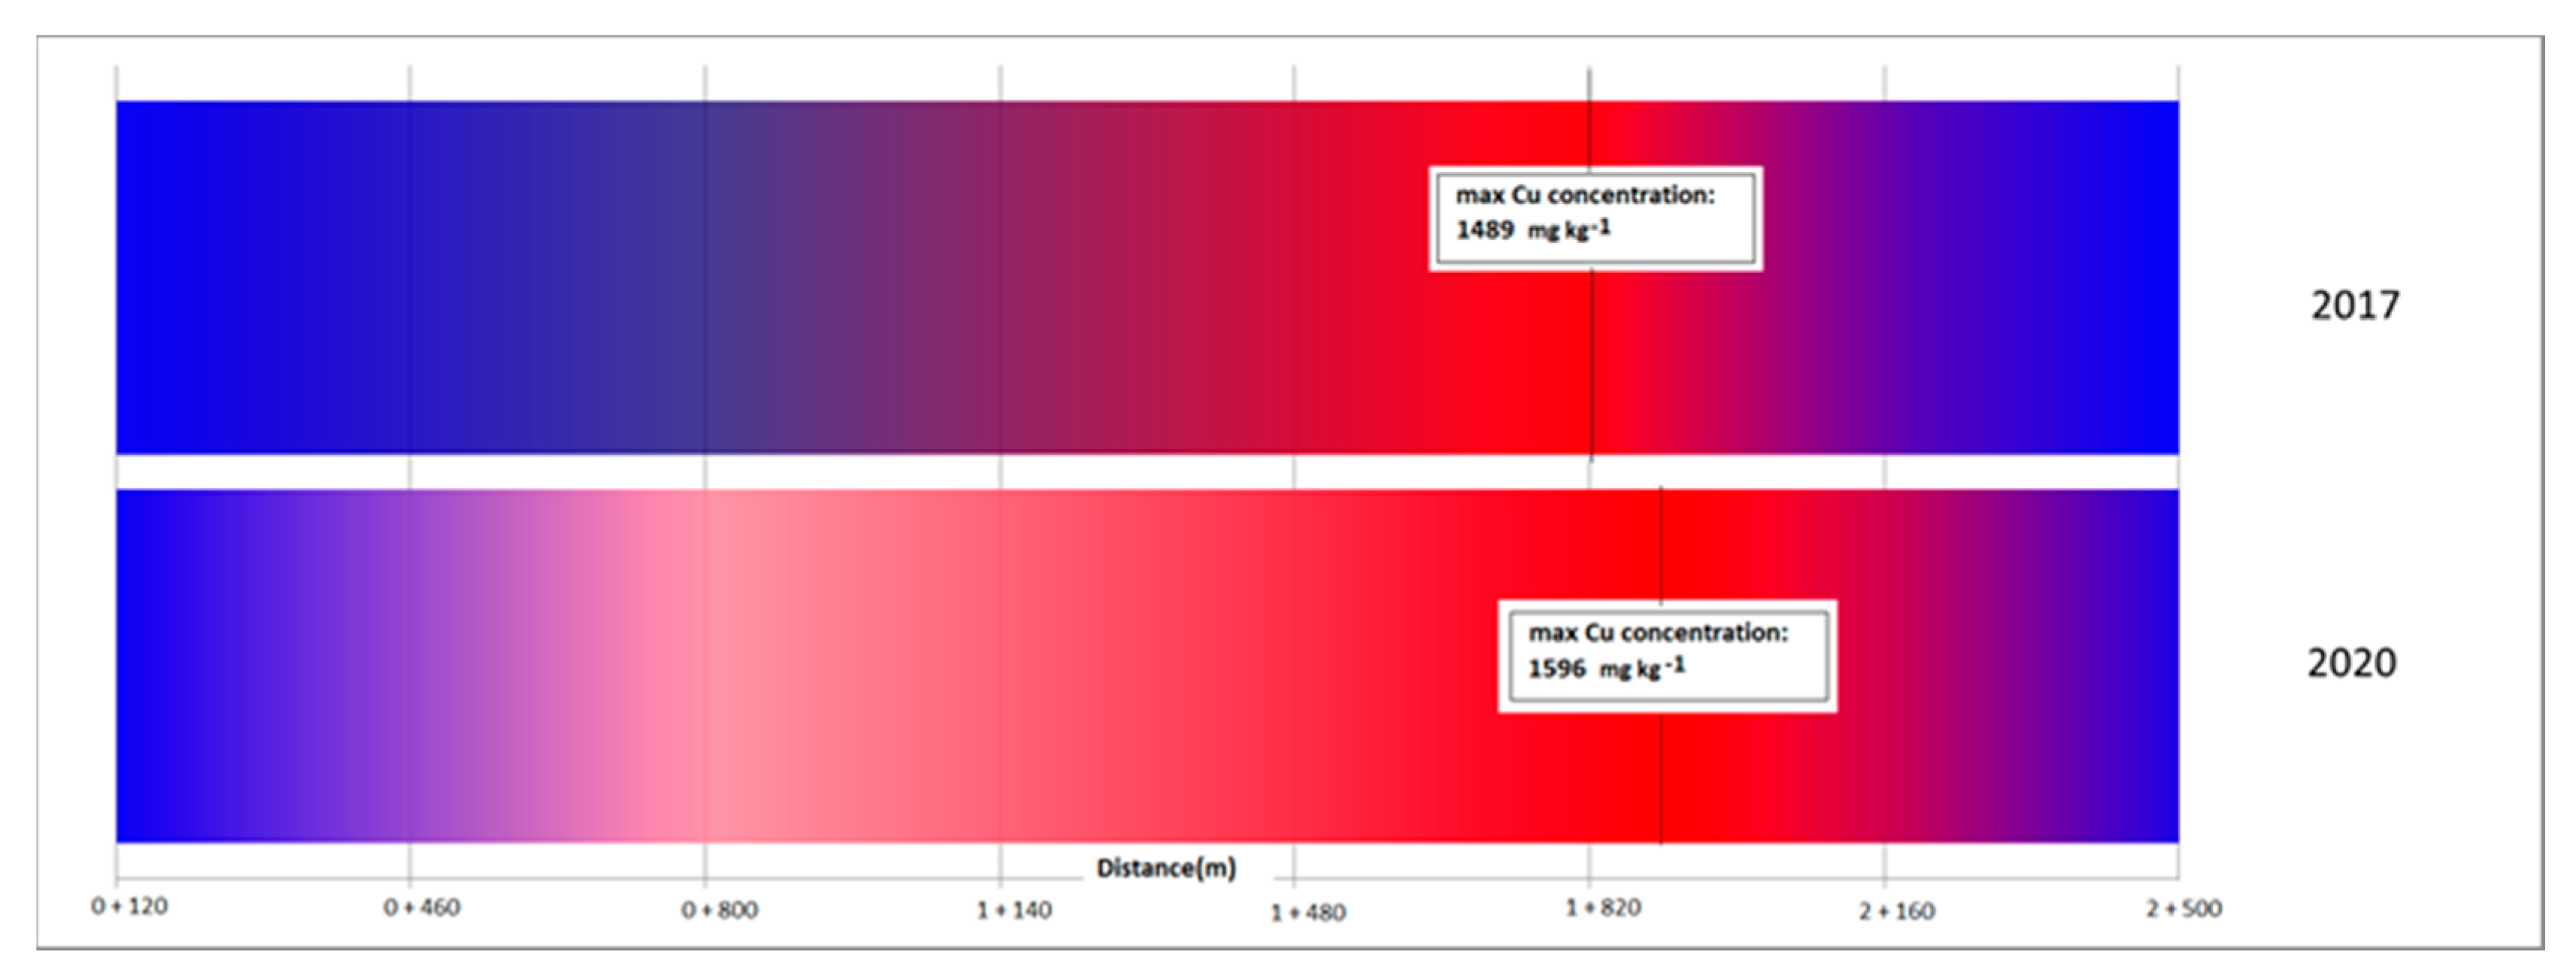
Figure 4 presents copper concentration along the canal and there is very obvious great pollution in the midsection of the canal, with maximum concentration of copper of 1489 mg kg−1, which is about 8 times over the maximum allowed concentration prescribed by consulted international guidelines [29,30,31]. All three countries have similar sediment quality guidelines with soil remediation intervention values between 190 and 197 mg kg−1.
We assessed the longitudinal profile measurements of the canal taken before and after dredging in 2014 (according to maintenance documentation) and more recently in 2017 to estimate depth reduction (Figure 2b). It was relatively uniform along the section (1 + 800–0 + 800) and sediment depth was ~30 cm with respect to the initial canal depth [36]. Textural classification of sediment samples showed high proportions of very fine sand (17.5%), coarse silt (34.8%), and fine silt (28.7%), with the remaining part comprising clay and fine sand. The last measurements of canal cross-sections, together with sediment sampling, occurred in 2020 and obtained data were used for model validation.
Canal “K” has no permanent flow; it occurs only after intensive precipitation periods. Moreover, there is no possibility of backwater influence caused by the recipient stream, i.e., River Vuka.
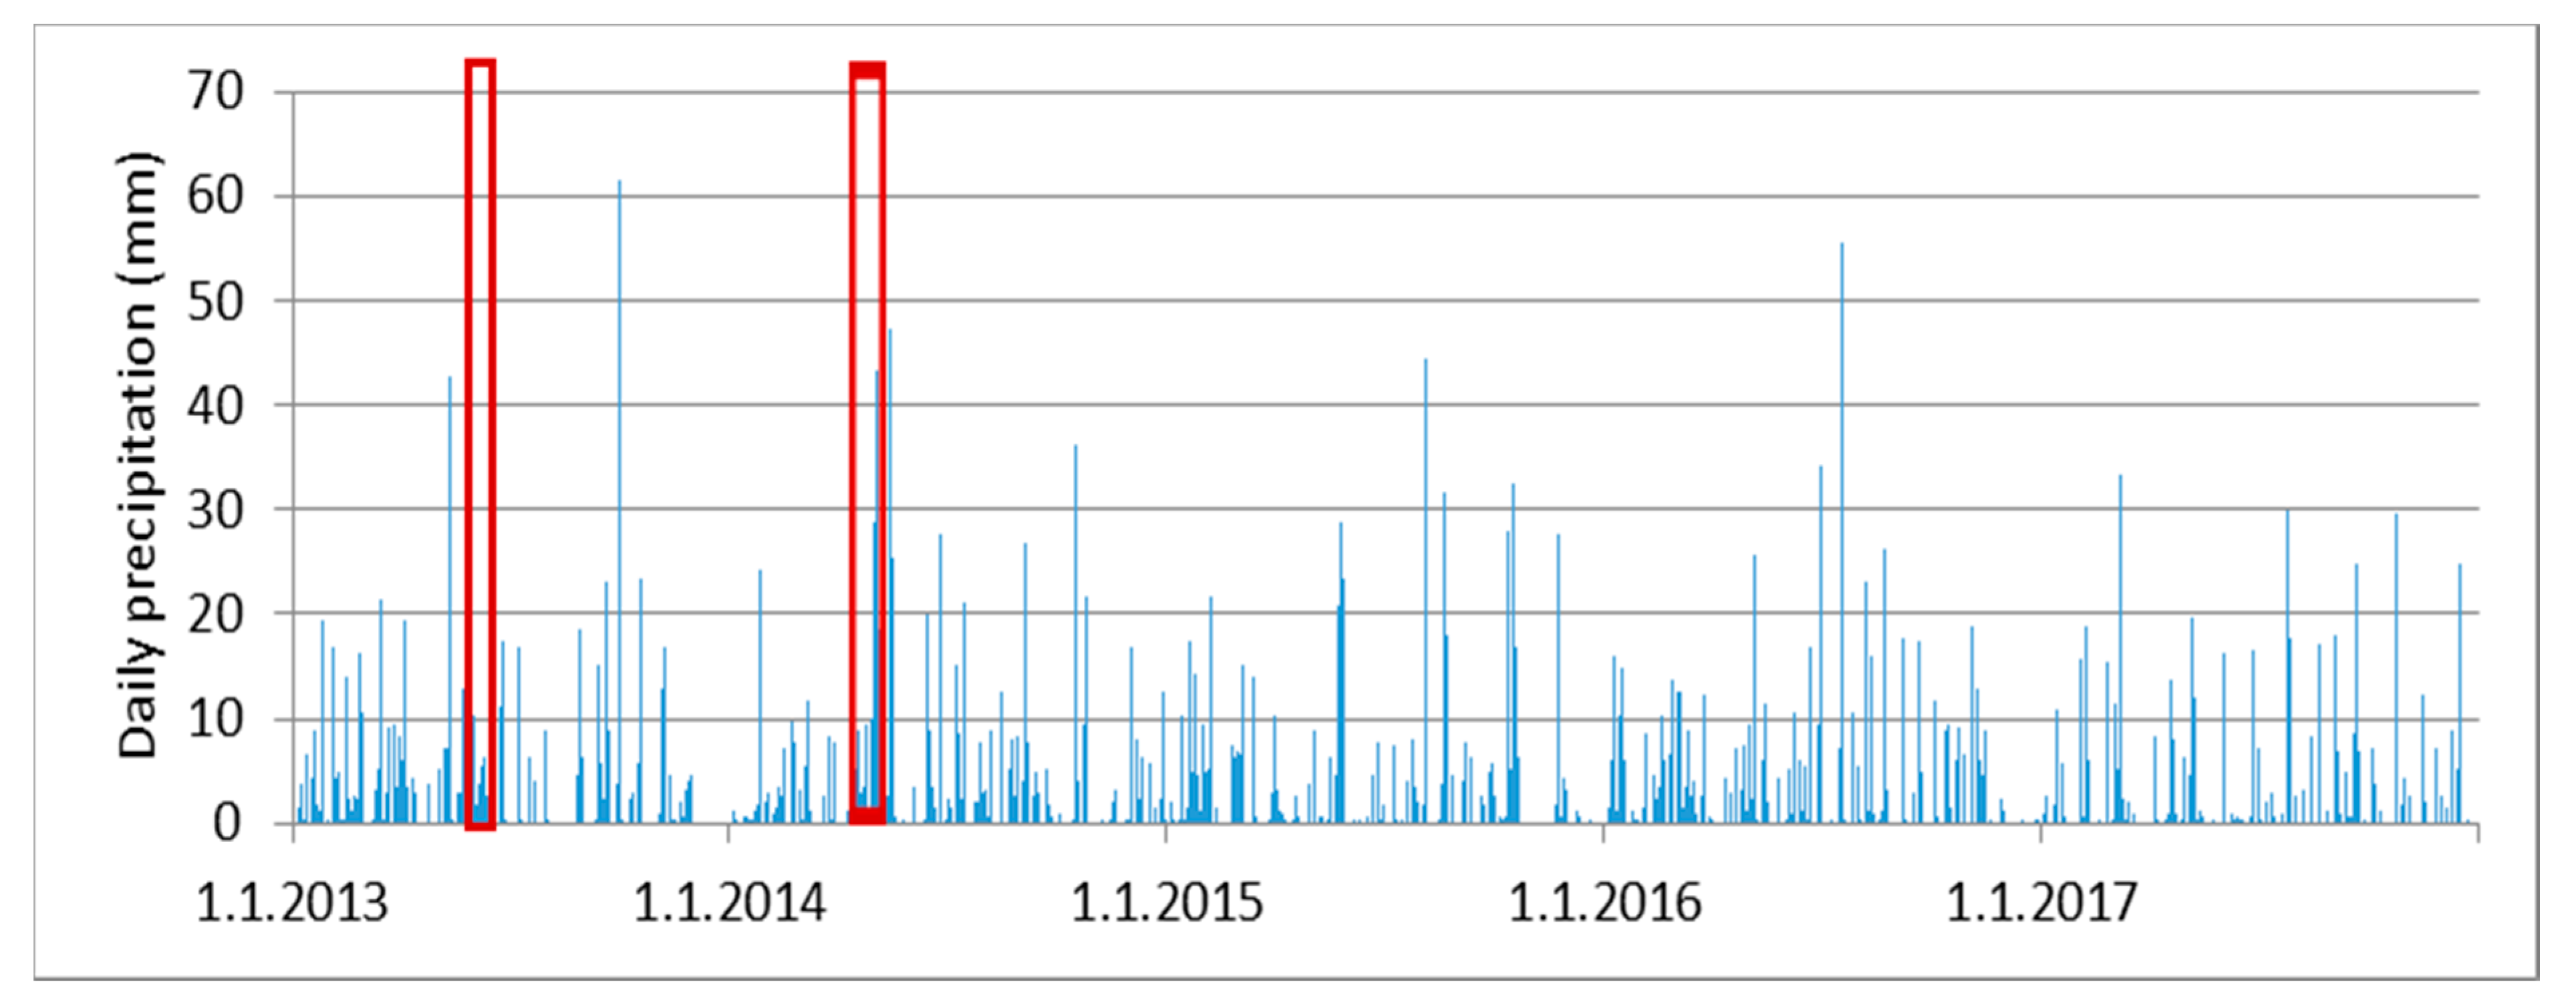
Considering the daily rainfall between January 2013 and December 2017 (Figure 5), we identified nine precipitation episodes based on precipitation duration and intensity. Additionally, there were two precipitation episodes, recognized as relevant for sediment transport modelling (Table 1, Figure 5).
The computed infiltration rate is based on vegetation cover, soil texture, tillage, and antecedent moisture using the Soil Conservation Service (SCS) method (CN) = 78.4) [36]. The antecedent moisture condition was assumed to be maximum for the selected precipitation episodes.
The erodibility of the lowland area was rather low. We calculated surface erosion using the Erosion Potential Method (EMP), considered suitable for Croatian geographical conditions [37], from the following equation:
where —total sediment production of erosion (m3 year−1); T—temperature coefficient (-); Pa—mean annual precipitation (mm); Z—erosion coefficient (-); and F—study area (km2).
2.3. Modelling
We conducted sediment transport modelling using the software HEC-RAS Ver. 5.0 (US Army Corps of Engineers, Washington, DC, USA). This application uses separate models for different components of surface run off viz. run off volume, cumulative and base flow, and discharge. Precipitation episodes relevant for modelling were identified on the basis of calculation of design discharges of 25- and 50-year return periods (Figure 5, Table 1). Hence, design run off increased by 30% and 45%, respectively. This procedure was used to simulate sediment transport during extreme hydrological conditions, which was higher than observed. We therefore obtained relationships between (a) discharge and sediment transport, and (b) flow velocity and starting point of sediment movement. The downstream boundary condition was derived by normal water depth and canal slope, while the upstream boundary condition comprised discharge series for a given time period. Sediment transport was explicitly a nonlinear process. Most of the transport and bed change was concentrated within relatively short periods of high discharge. Long quasi-steady time periods (24 h and longer) can be significant for small discharges and minor changes in bed elevation, which was exactly the situation in our case.
The Laursen (Copeland) sediment transport function, which considers bottom grain size, hydraulic radius, and range of flow velocities induced by design discharges, has been found to be most appropriate for estimating sediment discharge. It derives a total sediment load predictor from a combination of qualitative analysis, original experiments, and supplementary data.
Transport of sediments is primarily determined by hydraulic characteristics (e.g., mean channel velocity, depth of flow, and energy gradient), sediment characteristics, and fall velocity [38]. The general Laursen (Copeland) sediment transport equation for single grain size is given as follows:
where: Cm—sediment discharge concentration (kg m−3); γ—specific weight of water (kg m−3); ds—mean grain size (m); D—effective flow depth (m); τ0′—bed stress acting on bed grains (Pa); τc—critical shear stress (Pa); and ƒ(u*/ω)—function of the ratio of the shear velocity (u*) and fall velocity, defined by Laursen (1958) and incorporated into HEC-RAS.
Calibration was achieved using the observed data of bottom change during the period 2014–2017. Repeated cross-sections measurements were converted to volume change by multiplying the area change by the control volume reach length. Although this study primarily deals with sediment mobility and not total sediment yield, this method of calibration was adequately accurate and acceptable. Comparing to the process of sediment movement in rivers, sediment mobility in drainage canals is much lower. Therefore, bed elevation change is considered to be sufficiently good criteria for calibration. In 2020, measurements of canal cross-sections were repeated, together with sediment sampling. Those data were used for model validation. Figure 6 confirms our hypothesis of extremely low mobility of polluted sediment in lowland area drainage canals. In other words, during the last three years, continuous copper pollution has become more severe and its concentration has increased. Due to low sediment mobility, copper remains in the canal without significant movement downstream towards the canal recipient (the Vuka River). This is clearly presented in Figure 6 by the red color for copper pollution in the canal sediment.
3. Results and Discussion
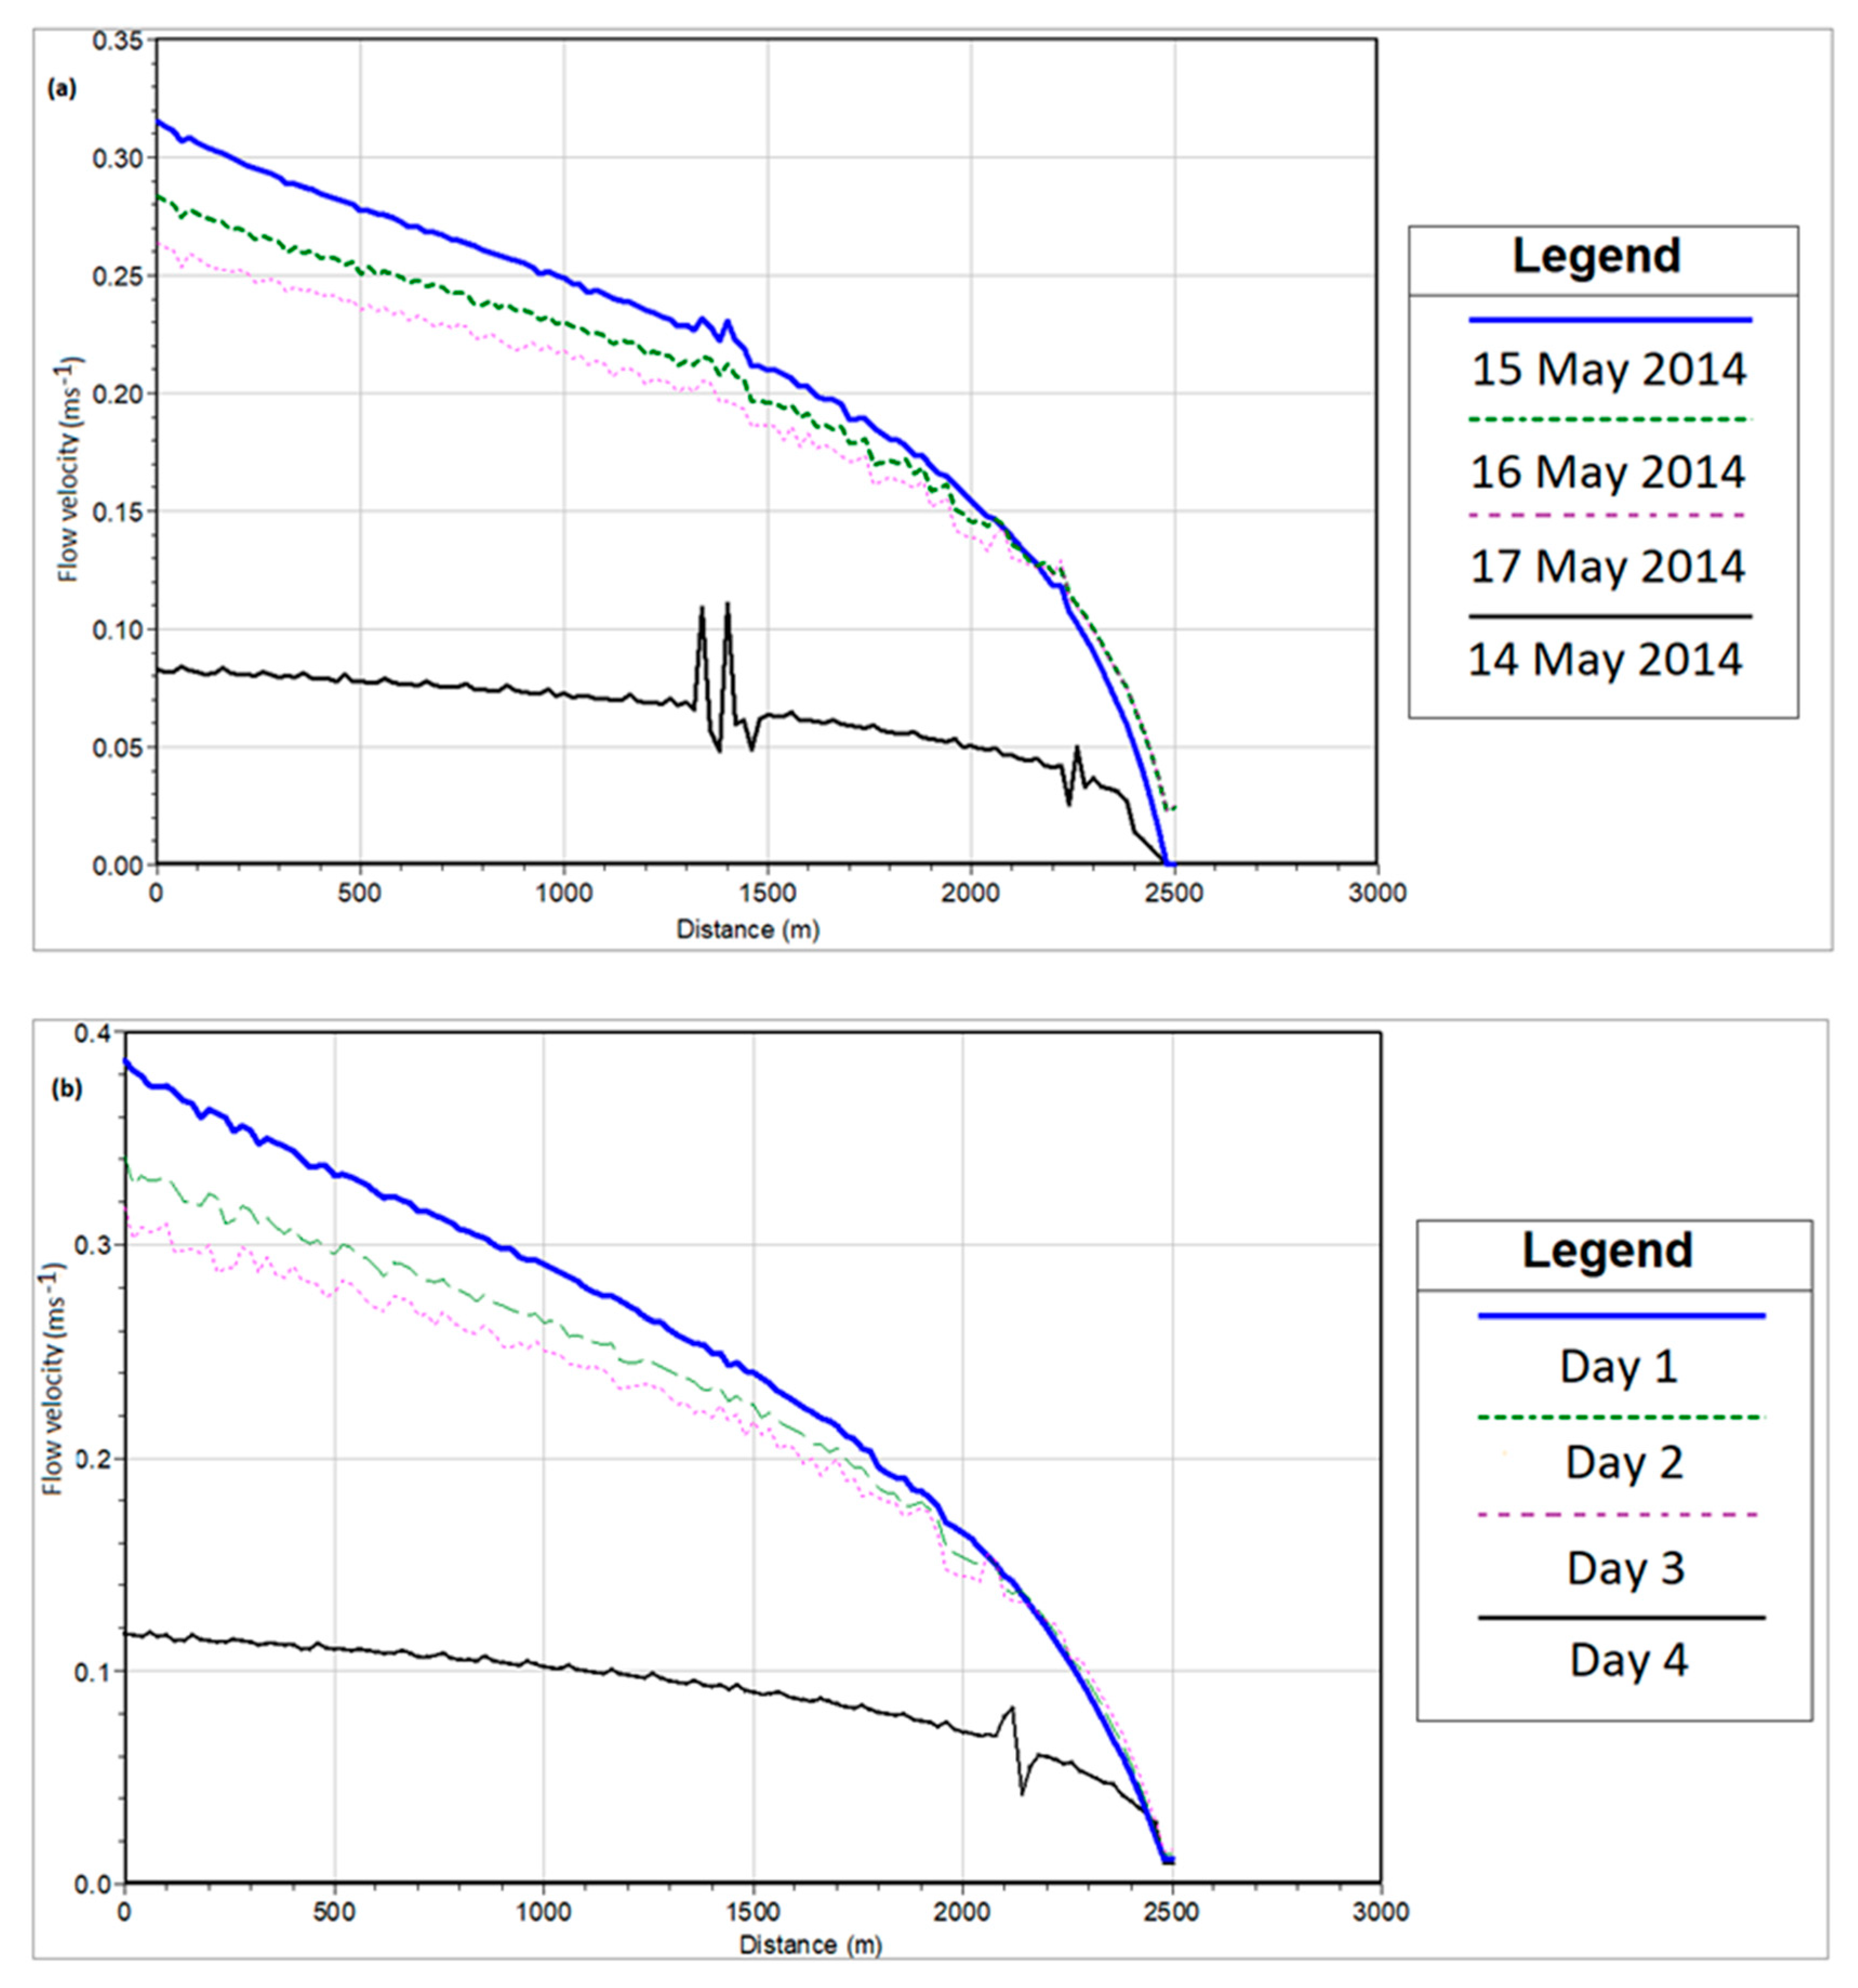
The maximum daily precipitation (61.3 mm) occurred between 13 May and 20 May 2014. Figure 7a depicts canal flow velocities in the period between 14 May and 17 May 2014, i.e., after discharge stabilization. The maximum velocity was 0.34 m s−1 on the day after the highest intensity of precipitation. Maximum daily precipitation of 47.3mm (Table 1) could not generate flow velocity large enough to be able to move bottom sediment. The design precipitation of the 50-year return period (96.6 mm) generated higher velocity (0.39 m s−1), again on the day after the highest intensity precipitation (Figure 7b). The simulation demonstrates how velocities greater than critical velocity cause sediment transport. During the first 24 h, small sediment movement starts in the middle canal section. Once the velocity and water level stabilize, canal bottom activities reduce. Furthermore, water table lowering and velocity fluctuations cause negligible changes in the canal bottom. Even precipitation of the 50-year return period was not able to generate more significant sediment movement or transport downstream. This means that only extreme precipitation episodes, of more than the 50-year return period, can cause more significant bottom activities, or the process of sediment movement in drainage canals can last many years. In this case, pollution continues and it stays trapped and undetected in sediment.
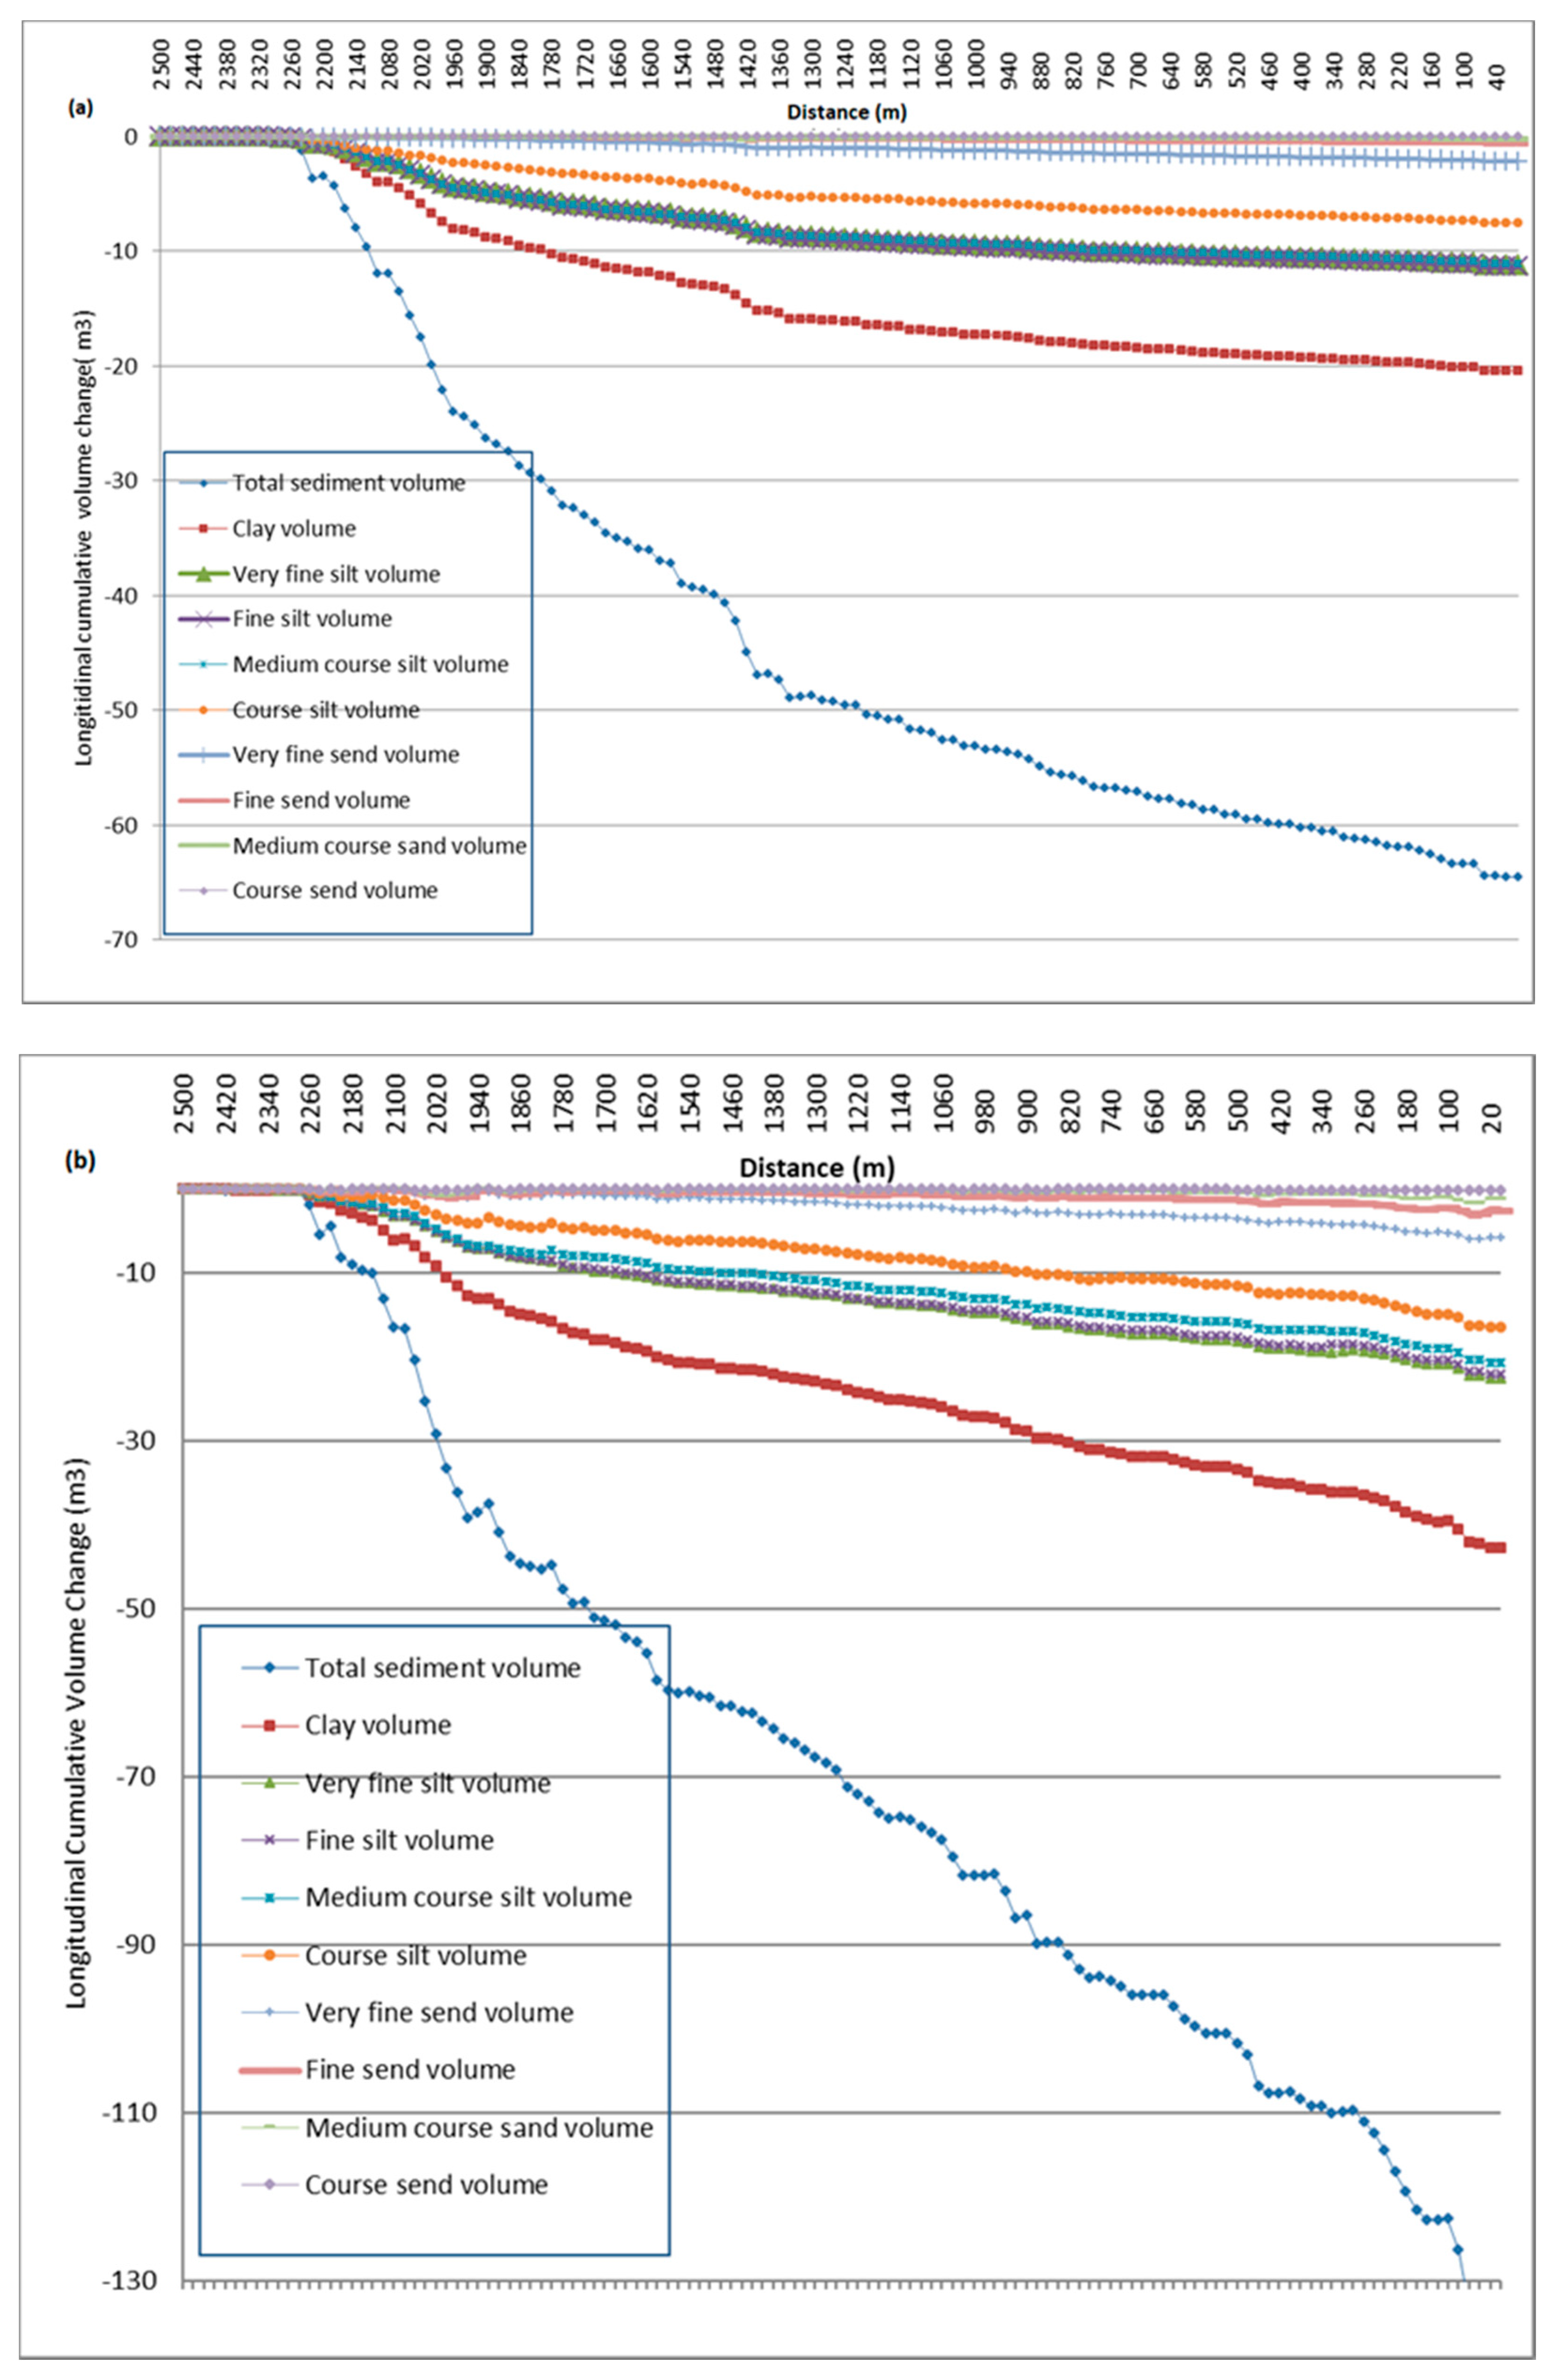
The total sediment volume transported along the canal during the actual precipitation period (13 May–20 May 2014) and estimated for the design precipitation of the 50-year return period was about 70 and 130 m3, respectively (Figure 8a,b). Considering the longitudinal transport of sediments by different fractions, clay and silt particles showed the highest mobility. However, these finest particles become mobile only during extreme precipitations, such as the maximum daily precipitation of the 50-year return period. In these extreme events, the dynamics of the surface erosion of the surrounding area is more important than the discharge ability of sediment movement. The volume of transported material accumulated depends on flow velocity and water depth. The most upstream canal section (~200 m length) showed no sediment movement. Significant reduction of the canal cross-section can be expected due to surface erosion and almost no discharge.
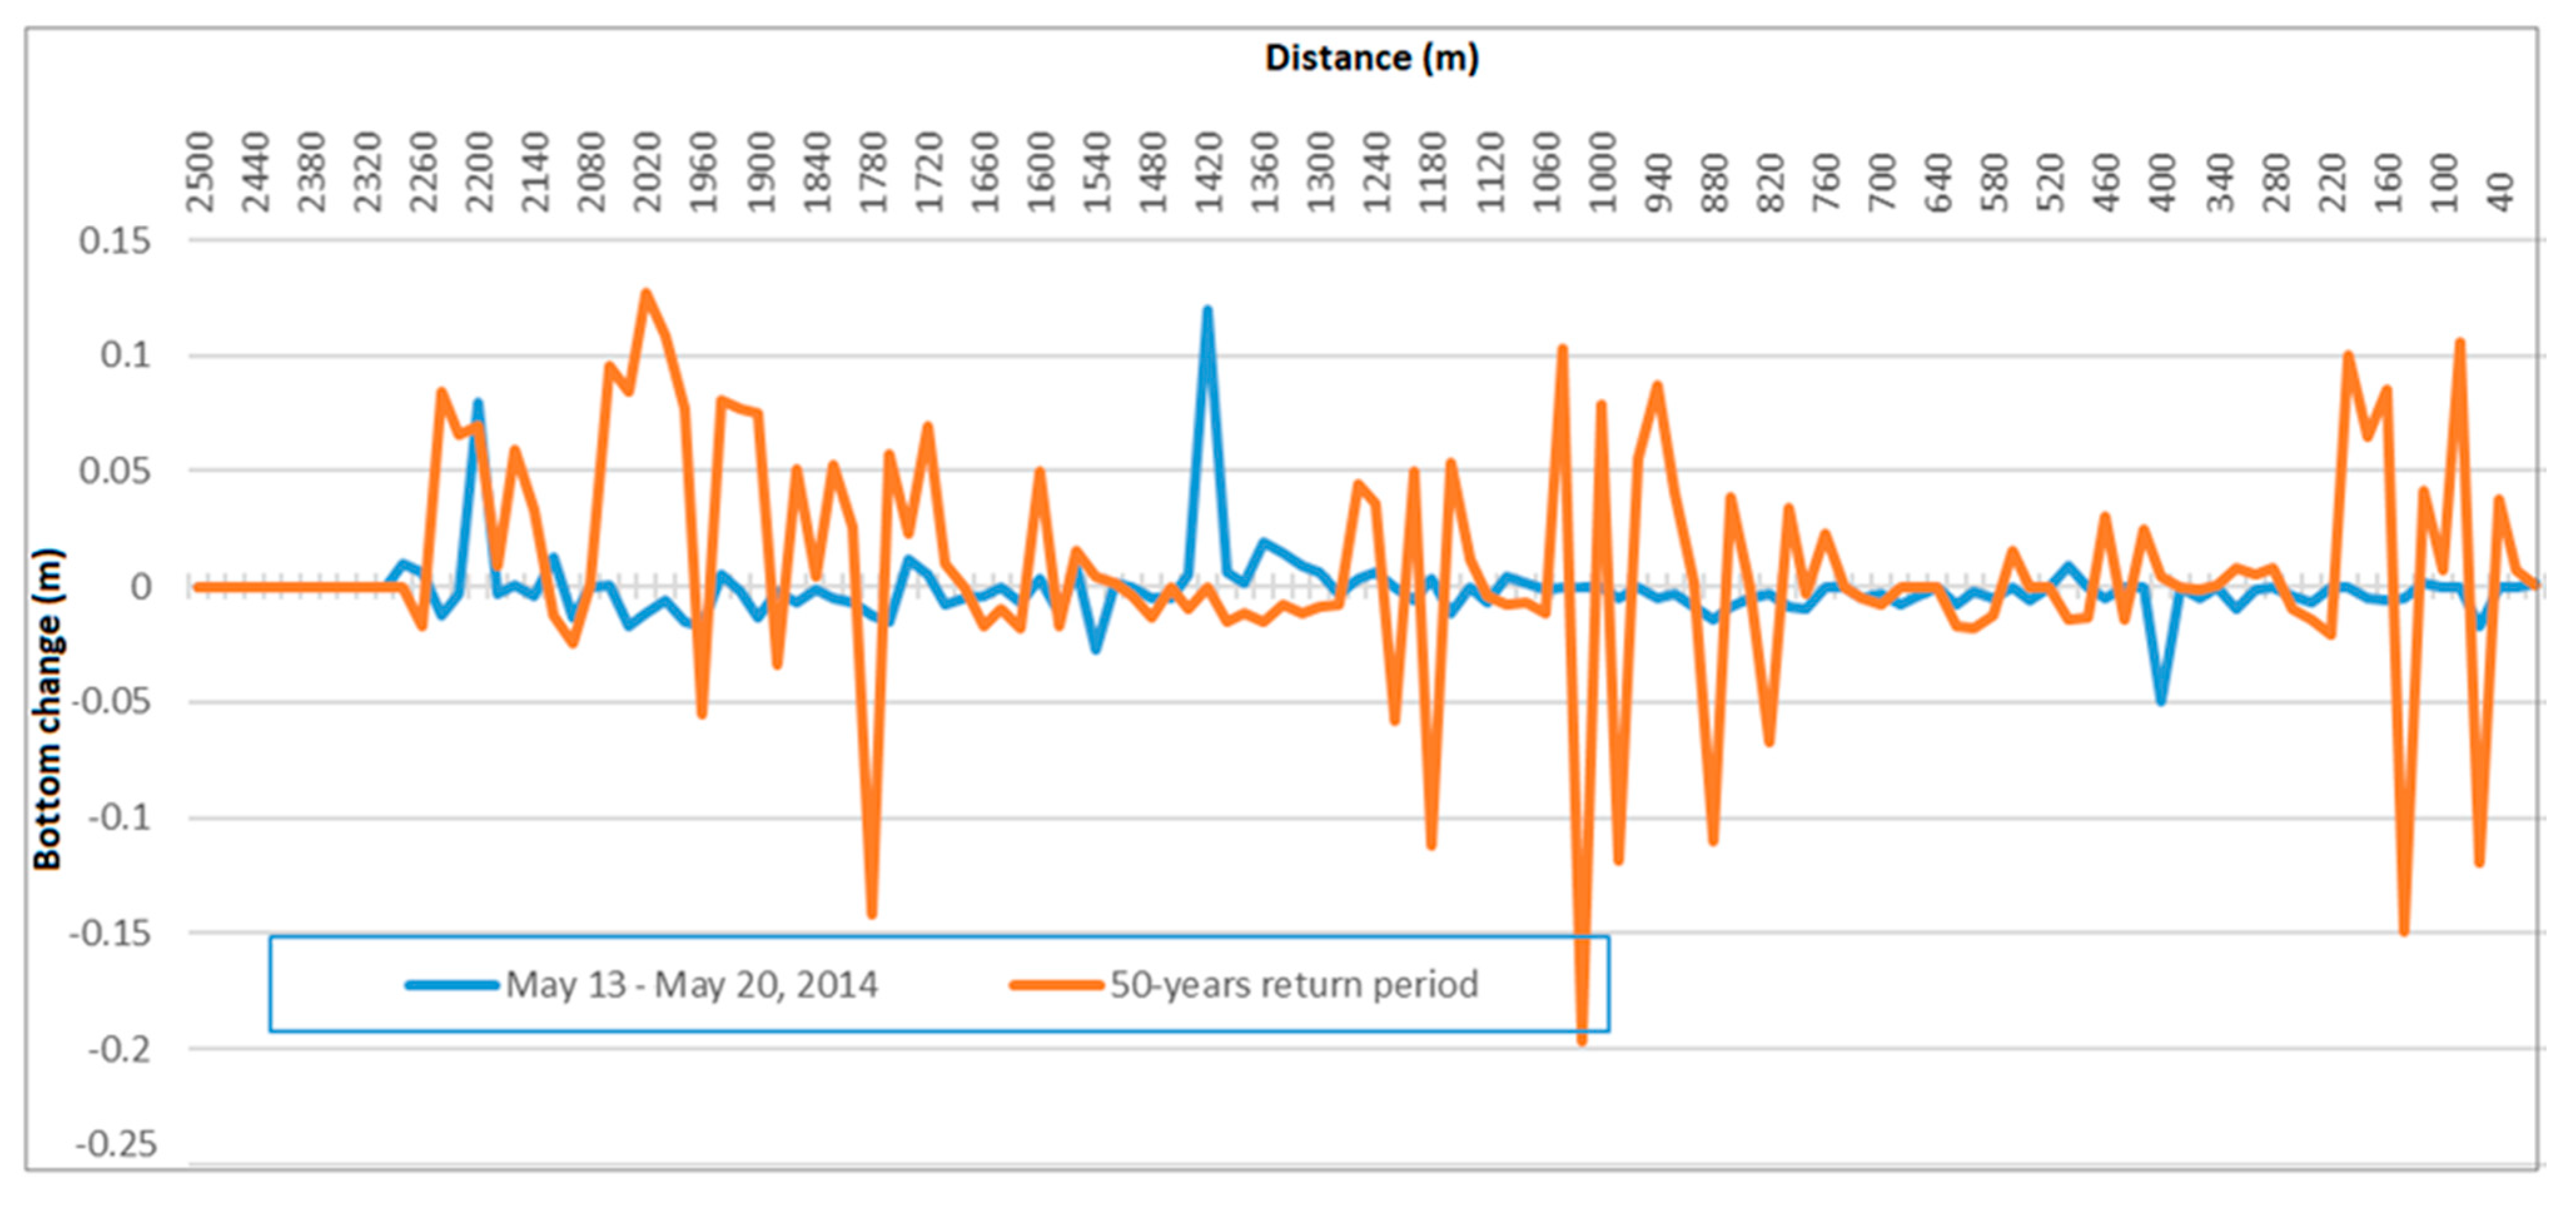
Further detailed analysis was performed for a precipitation event lasting seven days with the maximum of the 10-year return period. However, discharge generated by this event did not cause sediment movement, and bottom elevation changes were > 1 cm. However, the design precipitation of the 50-year return period caused higher discharges, causing the sediments to start moving downstream. Simulated discharges of the 50-year return period generated bottom change of ± 0.2 m. The most extensive changes occurred in the middle canal section (Figure 9).
During extreme precipitation, the most upstream section (~200 m length) showed almost no change in the canal bottom. Even the finest particles remain immobile along with the heavy metals attached to them. Model analyses suggest that only the pollutants entering the canal at most downstream sections have the possibility to move to the recipient stream, and are only detected in catchment areas >10 km2. Ultimately, this leads to a reduction in canal cross-section and necessitates regular maintenance activities.
4. Conclusions
Sediment pollution in drainage canals occurs frequently in agricultural areas. In the studied area presented in the research, copper had significantly high values, which prompted investigation of sediment transport downstream of the canal. Measurements of copper concentrations 3 years later proved the basic hypothesis of the low mobility of drainage canal sediment. The results show that it can stay trapped in canal sediment for several years and consequently, the sediment quality observed in representative monitoring points does not reflect the actual situation. Sediment transport modelling showed that smaller discharges generated by low-volume and low-intensity precipitation events do not cause significant sediment movement. Even the precipitation of a 50-year return period cannot generate sediment movement downstream. Considering the longitudinal transport of sediments by different fractions, clay and silt particles showed the highest mobility, but even these finest particles become mobile only during extreme precipitations, such as the maximum daily precipitation of the 50-year return period. However, these conclusions still have to be confirmed by analysis of a larger number of sediment samples during the next few years.
Sediments resulting from surface erosion along with the associated pollutants do not move downstream to the recipient, but remain at the canal bottom for several years and can potentially pollute water, sediment, biota, and the environment in general. The slopes of drainage canals are low, discharges are periodic, and velocities are small due to significant roughness, which causes the dominant sedimentation process. In such circumstances, only mechanical removal of sediment by dredging can maintain the designed and functional cross-section profile, thereby raising the problem of its disposal.
This field-scale research on the hydraulic aspect of sediment transport in drainage canals of a lowland area, based upon hydraulic on hydrological principles, highlights the problem of potentially severe pollution by copper, which cannot be detected by existing monitoring networks established in rivers with catchment areas > 10 km2. In our opinion, it could be a problem of great importance in a lowland agricultural area, where environmental quality standards established in the Water Framework Directive cannot be exceeded right away, due to the severe potential of keeping serious pollution trapped in small catchments. Finally, this research shows the importance of the assessment of pollution pressure magnitude, together with careful monitoring points selections.
Author Contributions
Conceptualization, M.L.K.; methodology, M.L.K. and L.T.; data analysis, M.L.K.; writing—original draft preparation, M.L.K. and L.T.; writing—review and editing, M.L.K. and L.T. All authors have read and agreed to the published version of the manuscript.
Funding
This research received no external funding.
Institutional Review Board Statement
Not applicable.
Informed Consent Statement
Not applicable.
Data Availability Statement
The data presented in this study are available on request from the corresponding author. The data are not publicly available due to research continuation.
Conflicts of Interest
The authors declare no conflict of interest.
References
- Ferrero, A.; Lisa, L.; Parena, S.; Sudiro, L. Runoff and soil erosion from tilled and controlled grass-covered vineyards in a hillside catchment.). In Technical Documents in Hydrology No. 67; Halko, L., Miklánek, P., Eds.; UNESCO-IHP: Paris, France, 2003; pp. 105–111. [Google Scholar]
- Krcmar, D.; Prica, M.; Dalmacija, B.; Watson, M.; Tričković, J.; Rajic, L.; Tamas, Z. Correlation of different pollution criteria in the assessment of metal sediment pollution. J. Environ. Sci. Health 2013, 48 Pt A, 380–393. [Google Scholar] [CrossRef]
- Dung, T.T.T.; Cappuyns, V.; Swennen, R.; Phung, N.K. From geochemical background determination to pollution assessment of heavy metals in sediments and soils. Rev. Environ. Sci. Biotechnol. 2013, 12, 335–353. [Google Scholar] [CrossRef]
- Bąk, L.; Szeląg, B.; Sałata, A.; Studziński, J. Modeling of Heavy Metal (Ni, Mn, Co, Zn, Cu, Pb, and Fe) and PAH Content in Stormwater Sediments Based on Weather and Physico-Geographical Characteristics of the Catchment-Data-Mining Approach. Water 2019, 11, 626. [Google Scholar] [CrossRef] [Green Version]
- Zhang, L.; Meng, X.; Wang, H.; Yang, M. Simulated Runoff and Sediment Yield Responses to Land-Use Change Using the SWAT Model in Northeast China. Water 2019, 11, 915. [Google Scholar] [CrossRef] [Green Version]
- Ma, Y.; Qin, Y.; Zheng, B.; Zhang, L.; Zhao, Y. Seasonal variation of enrichment, accumulation and sources of heavy metals in suspended particulate matter and surface sediments in the Daliao river and Daliao river estuary, Northeast China. Environ. Earth Sci. 2015, 73, 5107–5117. [Google Scholar] [CrossRef]
- Szalinska, E.; Drouillard, K.G.; Fryer, B.; Haffner, G.D. Distribution of Heavy Metals in Sediments of the Detroit River. J. Great Lakes Res. 2006, 32, 442–454. [Google Scholar] [CrossRef]
- Woitke, P.; Wellmitz, J.; Helm, D.; Kube, P.; Lepom, P.; Litheraty, P. Analysis and assessment of heavy metal pollution in suspended solids and sediments of the river Danube. Chemosphere 2003, 51, 633–642. [Google Scholar] [CrossRef]
- Čmelík, J.; Brovdyová, T.; Trögl, J.; Neruda, M.; Kadlečík, M.; Pacina, J.; Popelka, J.; Sirotkin, A.S. Changes in the Content of Heavy Metals in Bílina River during 2012–2017: Effects of Flood and Industrial Inputs. Water 2019, 11, 481. [Google Scholar] [CrossRef] [Green Version]
- Ferronato, C.; Antisari, L.V.; Modesto, M.M.; Vianello, G. Speciation of heavy metals at water-sediment interface. Int. J. Environ. Qual. 2013, 10, 51–64. [Google Scholar] [CrossRef]
- Gao, P.; Pasternack, G. Dynamics of suspended sediment transport at field-scale drain channels of irrigation-dominated watersheds in the Sonoran Desert, southeastern California. Hydrol. Process. 2007, 21, 2081–2092. [Google Scholar] [CrossRef]
- Zenebe, T.F.; Mohamed, Y.; Haile, A.M. Mitigation of Sedimentation at the Diversion Intake of Fota Spate Irrigation: Case Study of the Gash Spate Irrigation Scheme, Sudan. Irrig. Drain. Sys. Eng. 2015, 4, 1000138. [Google Scholar] [CrossRef] [Green Version]
- Koc, C.; Yilmaz, E. A Study on the Causes of Sediment, Accumulation in the Drainage Systems. J. Water Resour. Prot. 2014, 6, 224–235. [Google Scholar] [CrossRef] [Green Version]
- Lawrence, P.; Atkinson, E. Deposition of fine sediments in irrigation canals. Irrig. Drain. Syst. 1998, 12, 371–385. [Google Scholar] [CrossRef]
- Maggi, I.; Maraga, F.; Ottone, C. Erosive rains related to in-channel sediment delivery in a small Alpine basin (North-Western Italy). In Technical Documents in Hydrology No. 67; Halko, L., Miklánek, P., Eds.; UNESCO-IHP: Paris, France, 2003; pp. 91–99. [Google Scholar]
- Kelderman, P.; Drossaert, W.M.E.; Min, Z.; Galione, L.S.; Okonkwo, L.C.; Clarisse, I.A. Pollution assessment of the canal sediments in the city of Delft (the Netherlands). Water Res. 2000, 34, 936–944. [Google Scholar] [CrossRef]
- Dalmacija, B.; Prica, M.; Ivancev-Tumbas, I.; Van Der Kooij, A.; Roncevic, S.; Krcmar, D.; Bikit, I.; Teodorovic, I. Pollution of the Begej Canal sediment--metals, radioactivity and toxicity assessment. Environ. Int. 2006, 32, 606–615. [Google Scholar] [CrossRef] [PubMed]
- Lopez, F.; Marcelo, G. Open-channel flow through simulated vegetation: Suspended sediment transport modeling. Water Resour. Res. 1998, 34, 2341–2352. [Google Scholar] [CrossRef]
- Savić, R.; Belić, A.; Pantelić, S. Comparative review of sediment properties from drainage canals. Pol. J. Environ. Stud. 2013, 22, 849–859. [Google Scholar]
- Bellucci, L.G.; Frignani, M.; Paolucci, D.; Ravanelli, M. Distribution of heavy metals in sediments of the Venice Lagoon: The role of the industrial area. Sci. Total Environ. 2002, 295, 3–49. [Google Scholar] [CrossRef]
- Hu, N.; Liu, J.; Huang, P.; Yan, S.; Shi, X.; Ma, D. Sources, geochemical speciation, and risk assessment of metals in coastal sediments: A case study in the Bohai Sea, China. Environ. Earth Sci. 2017, 76, 266. [Google Scholar] [CrossRef]
- Hartley, W.; Dickinson, N.M. Exposure of anoxic and contaminated canal sediments: Mobility of metal(loid)s. Environ. Pollut. 2010, 158, 649–658. [Google Scholar] [CrossRef] [PubMed]
- Ogundiran, M.B.; Osibanjo, O. Mobility and speciation of heavy metals in soils impacted by hazardous waste. Chem. Speciat. Bioavailab. 2015, 21, 59–69. [Google Scholar] [CrossRef]
- Velimirović, M.B.; Prica, M.D.; Dalmacija, B.D.; Rončević, S.D.; Dalmacija, M.B.; Bečelić, M.D.; Tričković, J.S. Characterisation, Availability, and Risk Assessment of the Metals in Sediment after Aging. Water Air Soil Pollut. 2011, 214, 219–229. [Google Scholar] [CrossRef]
- Directive 2000/60/EC of the European Parliament and of the Council of 23 October 2000. Available online: https://www.voda.hr/hr/okvirna-direktiva-o-vodama (accessed on 14 February 2020).
- Kallis, G.; Butler, D. The EU water framework directive: Measures and implications. Water Policy 2001, 3, 125–142. [Google Scholar] [CrossRef]
- Directive 2008/105/EC of the European Parliament and of the Council of 16 December 2008. Available online: https://eur-lex.europa.eu/LexUriServ/LexUriServ.do?uri=OJ:L:2008:348:0084:0097:en:PDF (accessed on 13 December 2017).
- Directive 2013/39/EU of the European Parliament and of the Council of 12 August 2013. Available online: https://eur-lex.europa.eu/legal-content/EN/TXT/PDF/?uri=CELEX:32013L0039&from=EN (accessed on 10 December 2017).
- CCME (Canadian Council of Ministers of the Environment). Protocol for the Derivation of Canadian Sediment Quality Guidelines for the Protection of Aquatic Life; CCME EPC-98E; Canadian Council of Ministers of the Environment: Winnipeg, MB, Canada, 1995. [Google Scholar]
- Ministry of Housing, Spatial Planning and Environment Directorate-General for Environmental Protection. Circular on Target Values and Intervention Values for Soil Remediation; Netherlands Government Gazette: Amsterdam, The Netherlands, 2000; p. 39. [Google Scholar]
- Uredba o Graničnim Vrednostima Zagađujućih Materija u Površinskim i Podzemnim Vodama i Sedimentu i Rokovim za Njihov Dostizanje (Sl. Glasnik RS, 50/12). Available online: https://www.paragraf.rs/propisi/uredba-granicnim-vrednostima-zagadjujucih-materija-vodama.html (accessed on 15 December 2017).
- Reyjol, Y.; Argillier, C.; Bonne, W.; Borja, A.; Buijse, A.D.; Cardoso, A.C.; Daufresne, M.; Kernan, M.; Ferreira, M.T.; Poikane, S.; et al. Assessing the ecological status in the context of the European Water Framework Directive: Where do we go now? Sci. Total Environ. 2014, 497–498, 332–344. [Google Scholar] [CrossRef] [PubMed]
- Butler, D.; Kallis, G.; Mills, K. Assessing the Implications of the new EU water framework directive. In Paper Presented in Millennium Conference of CIWEM on Wastewater Treatment: Standards and Technologies to Meet the Challenges of the 21st Century; CIWEM: Leeds, UK, 2000. [Google Scholar]
- Hanley, N.; Colombo, S.; Tinch, D.; Black, A.; Aftab, A. Estimating the benefits of water quality improvements under the Water Framework Directive: Are benefits transferable? Eur. Rev. Agric. Econ. 2006, 33, 391–413. [Google Scholar] [CrossRef]
- Brleković, T.; Tadić, L. Numeričko modeliranje i analiza podzemnih voda na slivnom području rijeke Vuke. Hrvat. Vode 2020, 28, 29–38. [Google Scholar]
- Leko-Kos, M. Genesis and Mobility of Canal Sediments Polluted by Heavy Metals in Lowland Area. Ph.D. Thesis, University of Osijek, Faculty of Civil Engineering and Architecture, Osijek, Croatia, 2019. [Google Scholar]
- Dragičević, N.; Karleuša, B.; Ožanić, N. Erosion Potential Method (Gavrilović Method) Sensitivity Analysis. Soil Water Res. 2017. [Google Scholar] [CrossRef] [Green Version]
- Kayyun, T.S.; Dagher, D.H. Potential Sediment within a Reach in Tigris River. Int. J. Hydraul. Eng. 2018, 7, 22–32. [Google Scholar]
Figure 1.
Position of study area in Croatia with designated position of study area, right side.

Figure 2.
Field research layout of canal with designated sampling locations (a) and characteristic cross-section of canal indicating profile reduction (b).
Figure 2.
Field research layout of canal with designated sampling locations (a) and characteristic cross-section of canal indicating profile reduction (b).

Figure 3.
Sampling canal cross-section 3–3 (a), sediment core sampler (Beeker type) (b), and graphite furnace atomic absorption spectrometer (c).
Figure 3.
Sampling canal cross-section 3–3 (a), sediment core sampler (Beeker type) (b), and graphite furnace atomic absorption spectrometer (c).

Figure 4.
Field research of copper concentration along the canal with designated intervention value.
Figure 4.
Field research of copper concentration along the canal with designated intervention value.

Figure 5.
Daily precipitation of the period between January 2013 and December 2017 with designated tested precipitation episodes.
Figure 5.
Daily precipitation of the period between January 2013 and December 2017 with designated tested precipitation episodes.

Figure 6.
Field data of copper concentration along the canal in 2016–2017 and 2020.

Figure 7.
Flow velocity in the canal during the precipitation episode between 13 May and 20 May 2014 (a) and flow velocity in the canal calculated for design precipitation episode of 50-years return period (b).
Figure 7.
Flow velocity in the canal during the precipitation episode between 13 May and 20 May 2014 (a) and flow velocity in the canal calculated for design precipitation episode of 50-years return period (b).

Figure 8.
Longitudinal change in sediment volume in the period 13 May and 20 May 2014 (a) and longitudinal change scheme of the 50-year return period (b).
Figure 8.
Longitudinal change in sediment volume in the period 13 May and 20 May 2014 (a) and longitudinal change scheme of the 50-year return period (b).

Figure 9.
Longitudinal change of bottom in the period May 13 to May 20, 2014 and design precipitation episode of the 50-year return period.
Figure 9.
Longitudinal change of bottom in the period May 13 to May 20, 2014 and design precipitation episode of the 50-year return period.


Table 1.
Precipitation episodes relevant for sediment transport modelling.
| Starting Datum | Ending Datum | Duration (Days) | Daily Max (mm) | Daily Min (mm) | Prec. Sum (mm) | Return Period (Years) |
|---|---|---|---|---|---|---|
| 26 September 2013 | 2 October 2013 | 7 | 61.5 | 0.3 | 84.3 | 10 |
| 13 May 2014 | 20 May 2014 | 7 | 47.3 | 0.1 | 92.1 | 2 |
Publisher’s Note: MDPI stays neutral with regard to jurisdictional claims in published maps and institutional affiliations. |
© 2021 by the authors. Licensee MDPI, Basel, Switzerland. This article is an open access article distributed under the terms and conditions of the Creative Commons Attribution (CC BY) license (http://creativecommons.org/licenses/by/4.0/).
Share and Cite
MDPI and ACS Style
Leko Kos, M.; Tadić, L. The Field-Scale Investigation of the Low Mobility of Drainage Canal Sediments Polluted by Copper in Lowland Area of Croatia. Water 2021, 13, 677. https://doi.org/10.3390/w13050677
AMA Style
Leko Kos M, Tadić L. The Field-Scale Investigation of the Low Mobility of Drainage Canal Sediments Polluted by Copper in Lowland Area of Croatia. Water. 2021; 13(5):677. https://doi.org/10.3390/w13050677
Chicago/Turabian StyleLeko Kos, Marija, and Lidija Tadić. 2021. "The Field-Scale Investigation of the Low Mobility of Drainage Canal Sediments Polluted by Copper in Lowland Area of Croatia" Water 13, no. 5: 677. https://doi.org/10.3390/w13050677
Note that from the first issue of 2016, this journal uses article numbers instead of page numbers. See further details here.