
Influence of Groundwater Discharge on Temporal Evolution in Two Wetlands of an Intensely Anthropized Area: Analysis Using an Integrated Approach

 and
and
Abstract
:1. Introduction
2. Materials and Methods
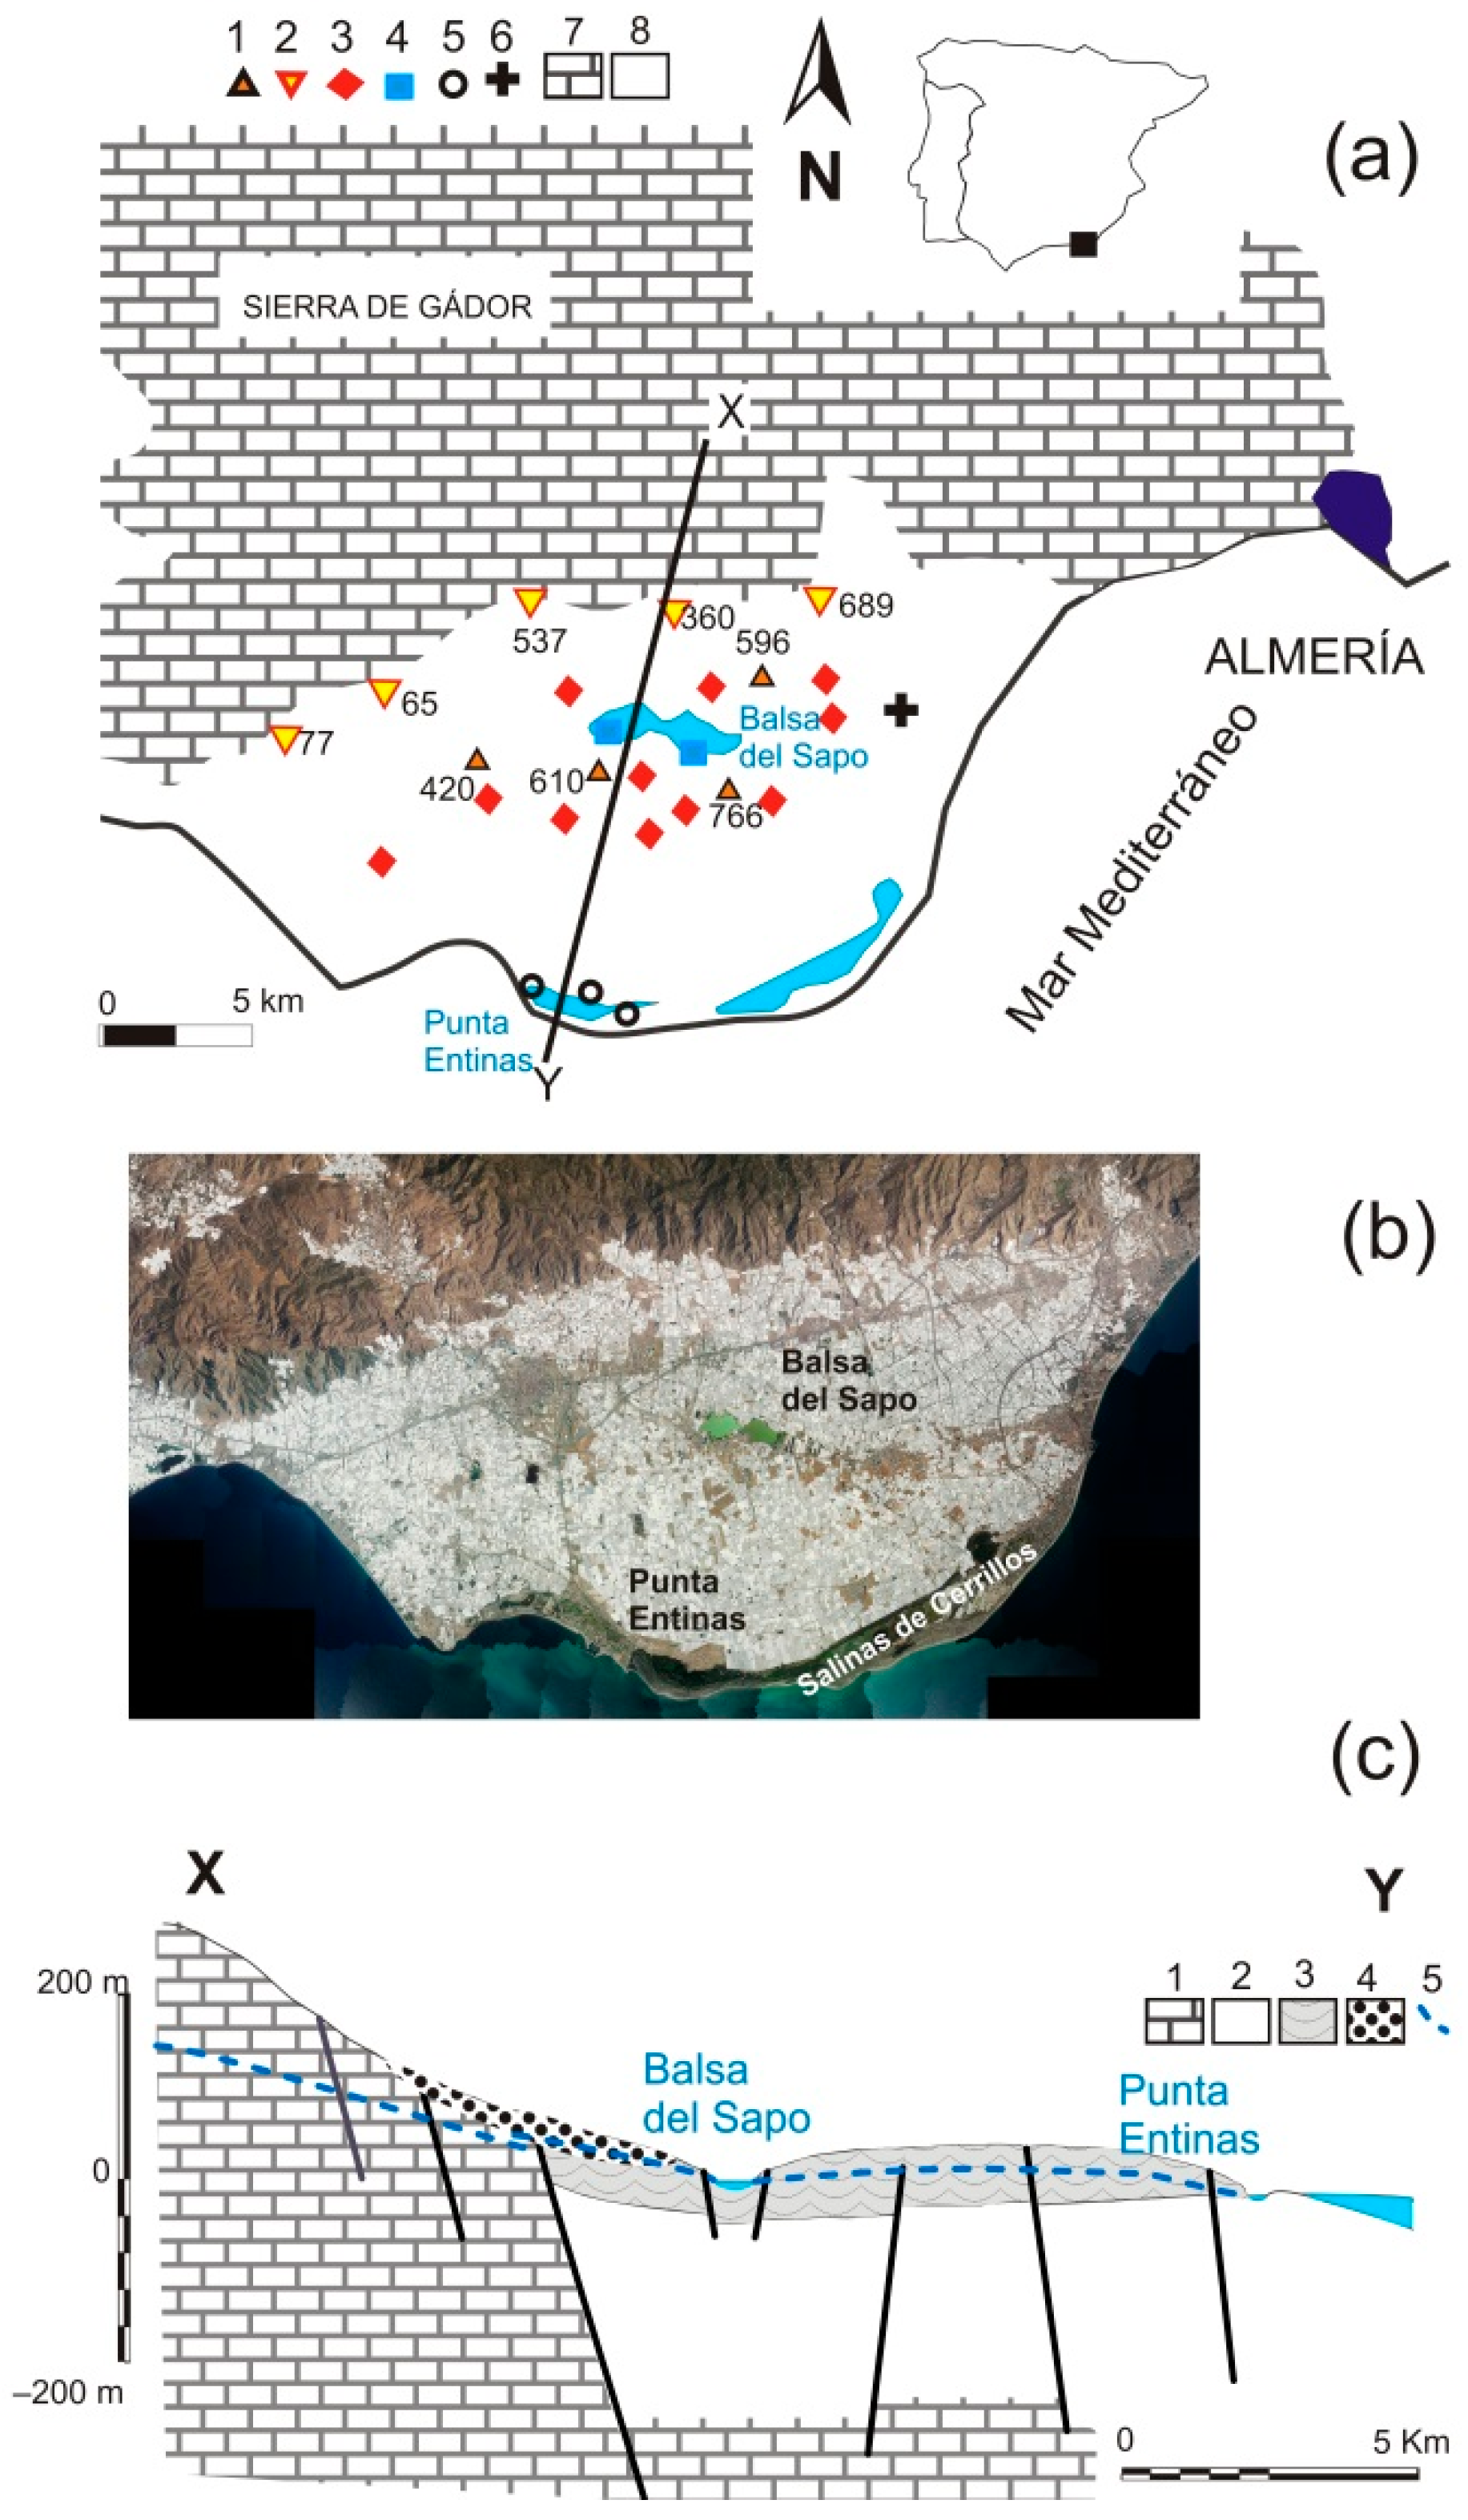
2.1. The Area
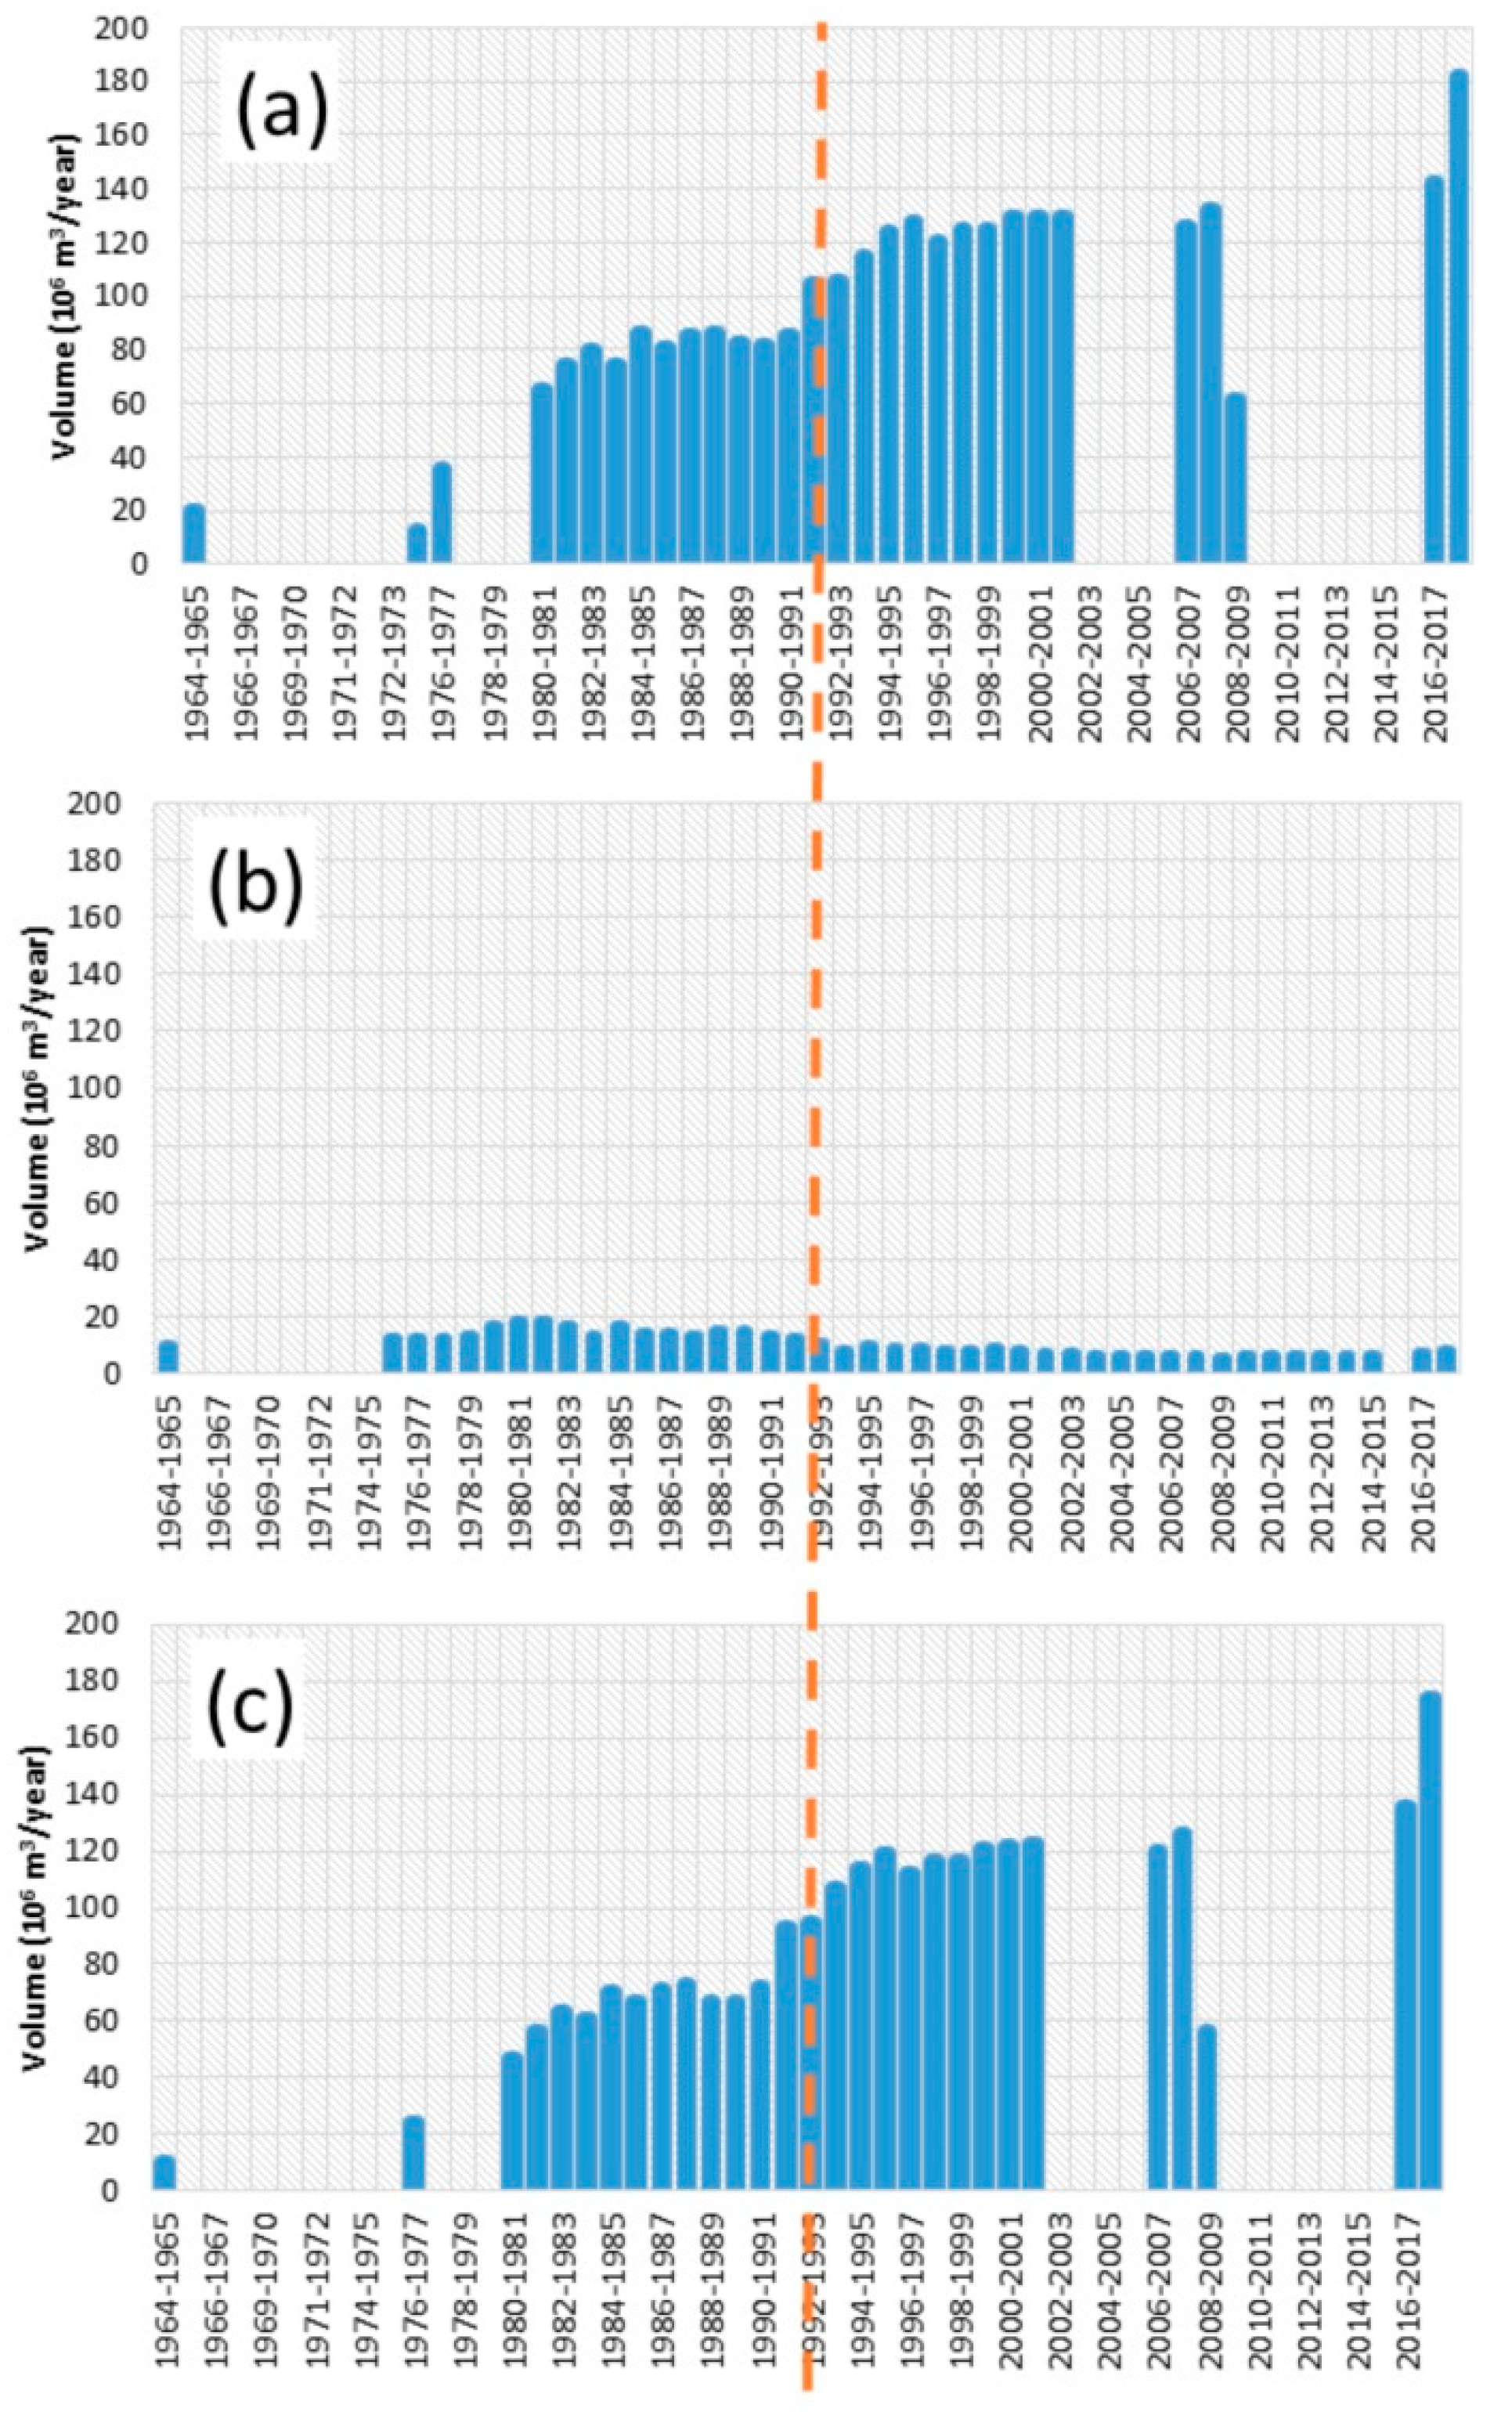
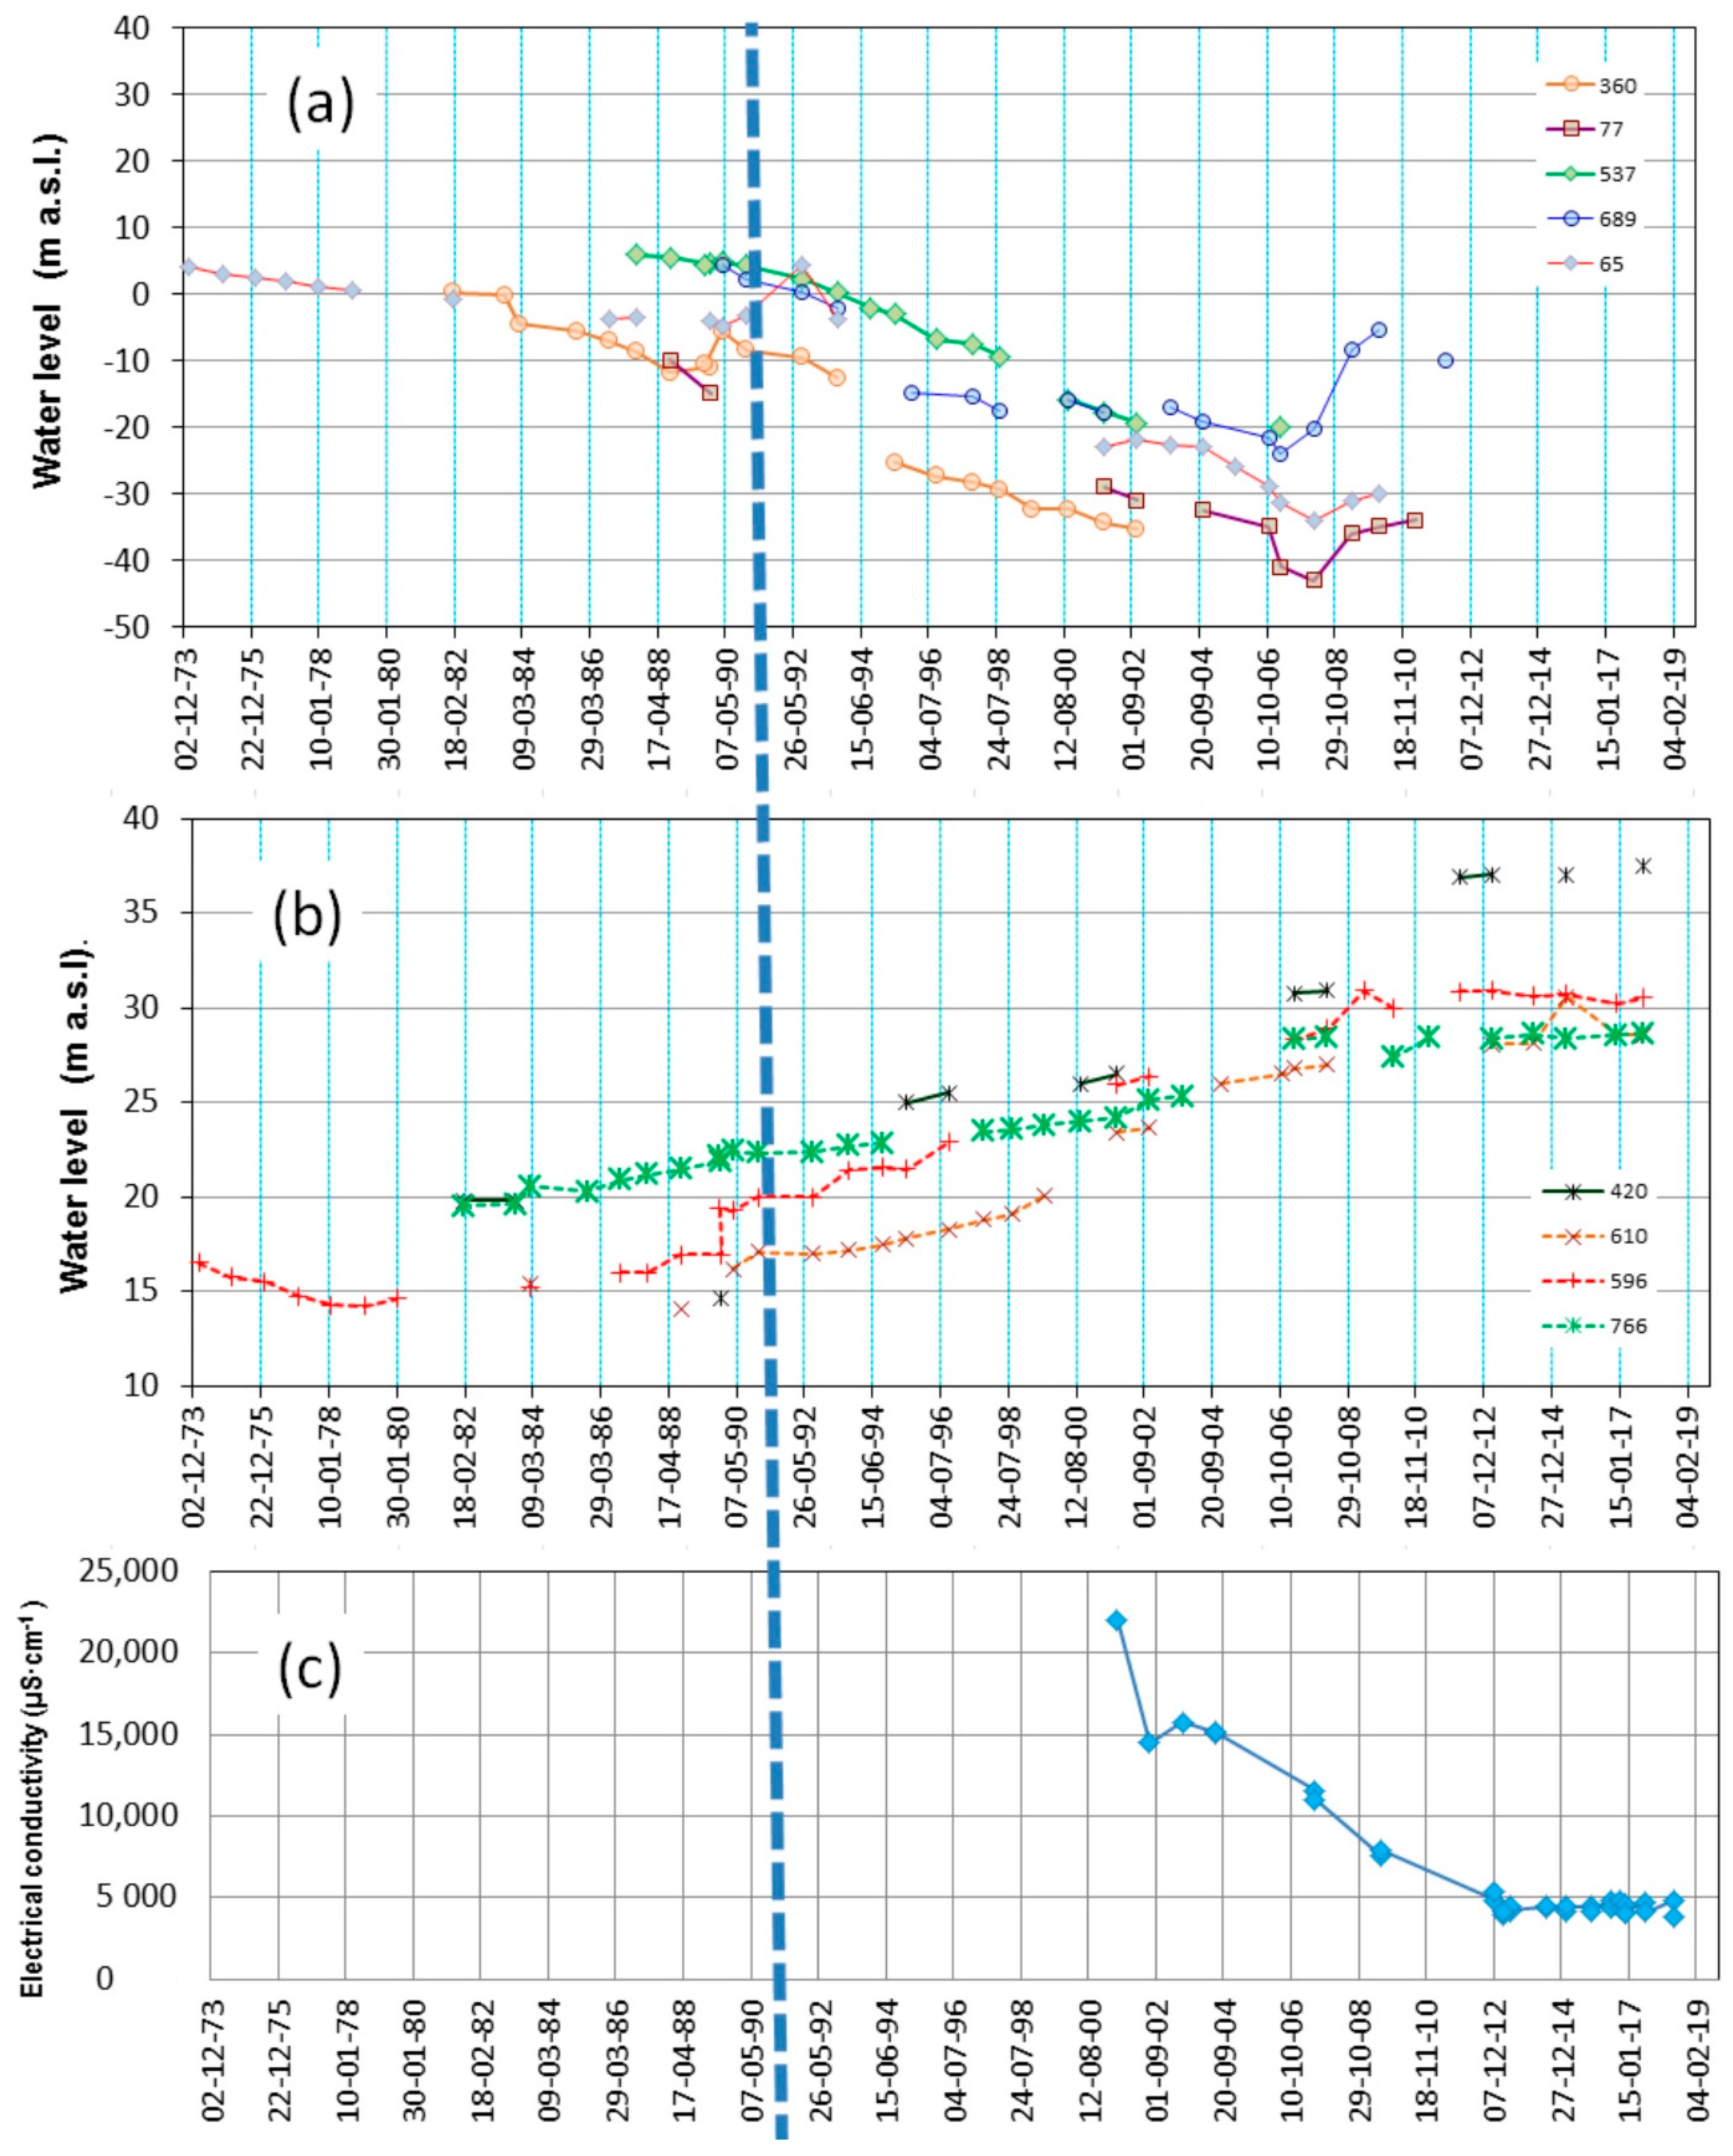
2.2. Data
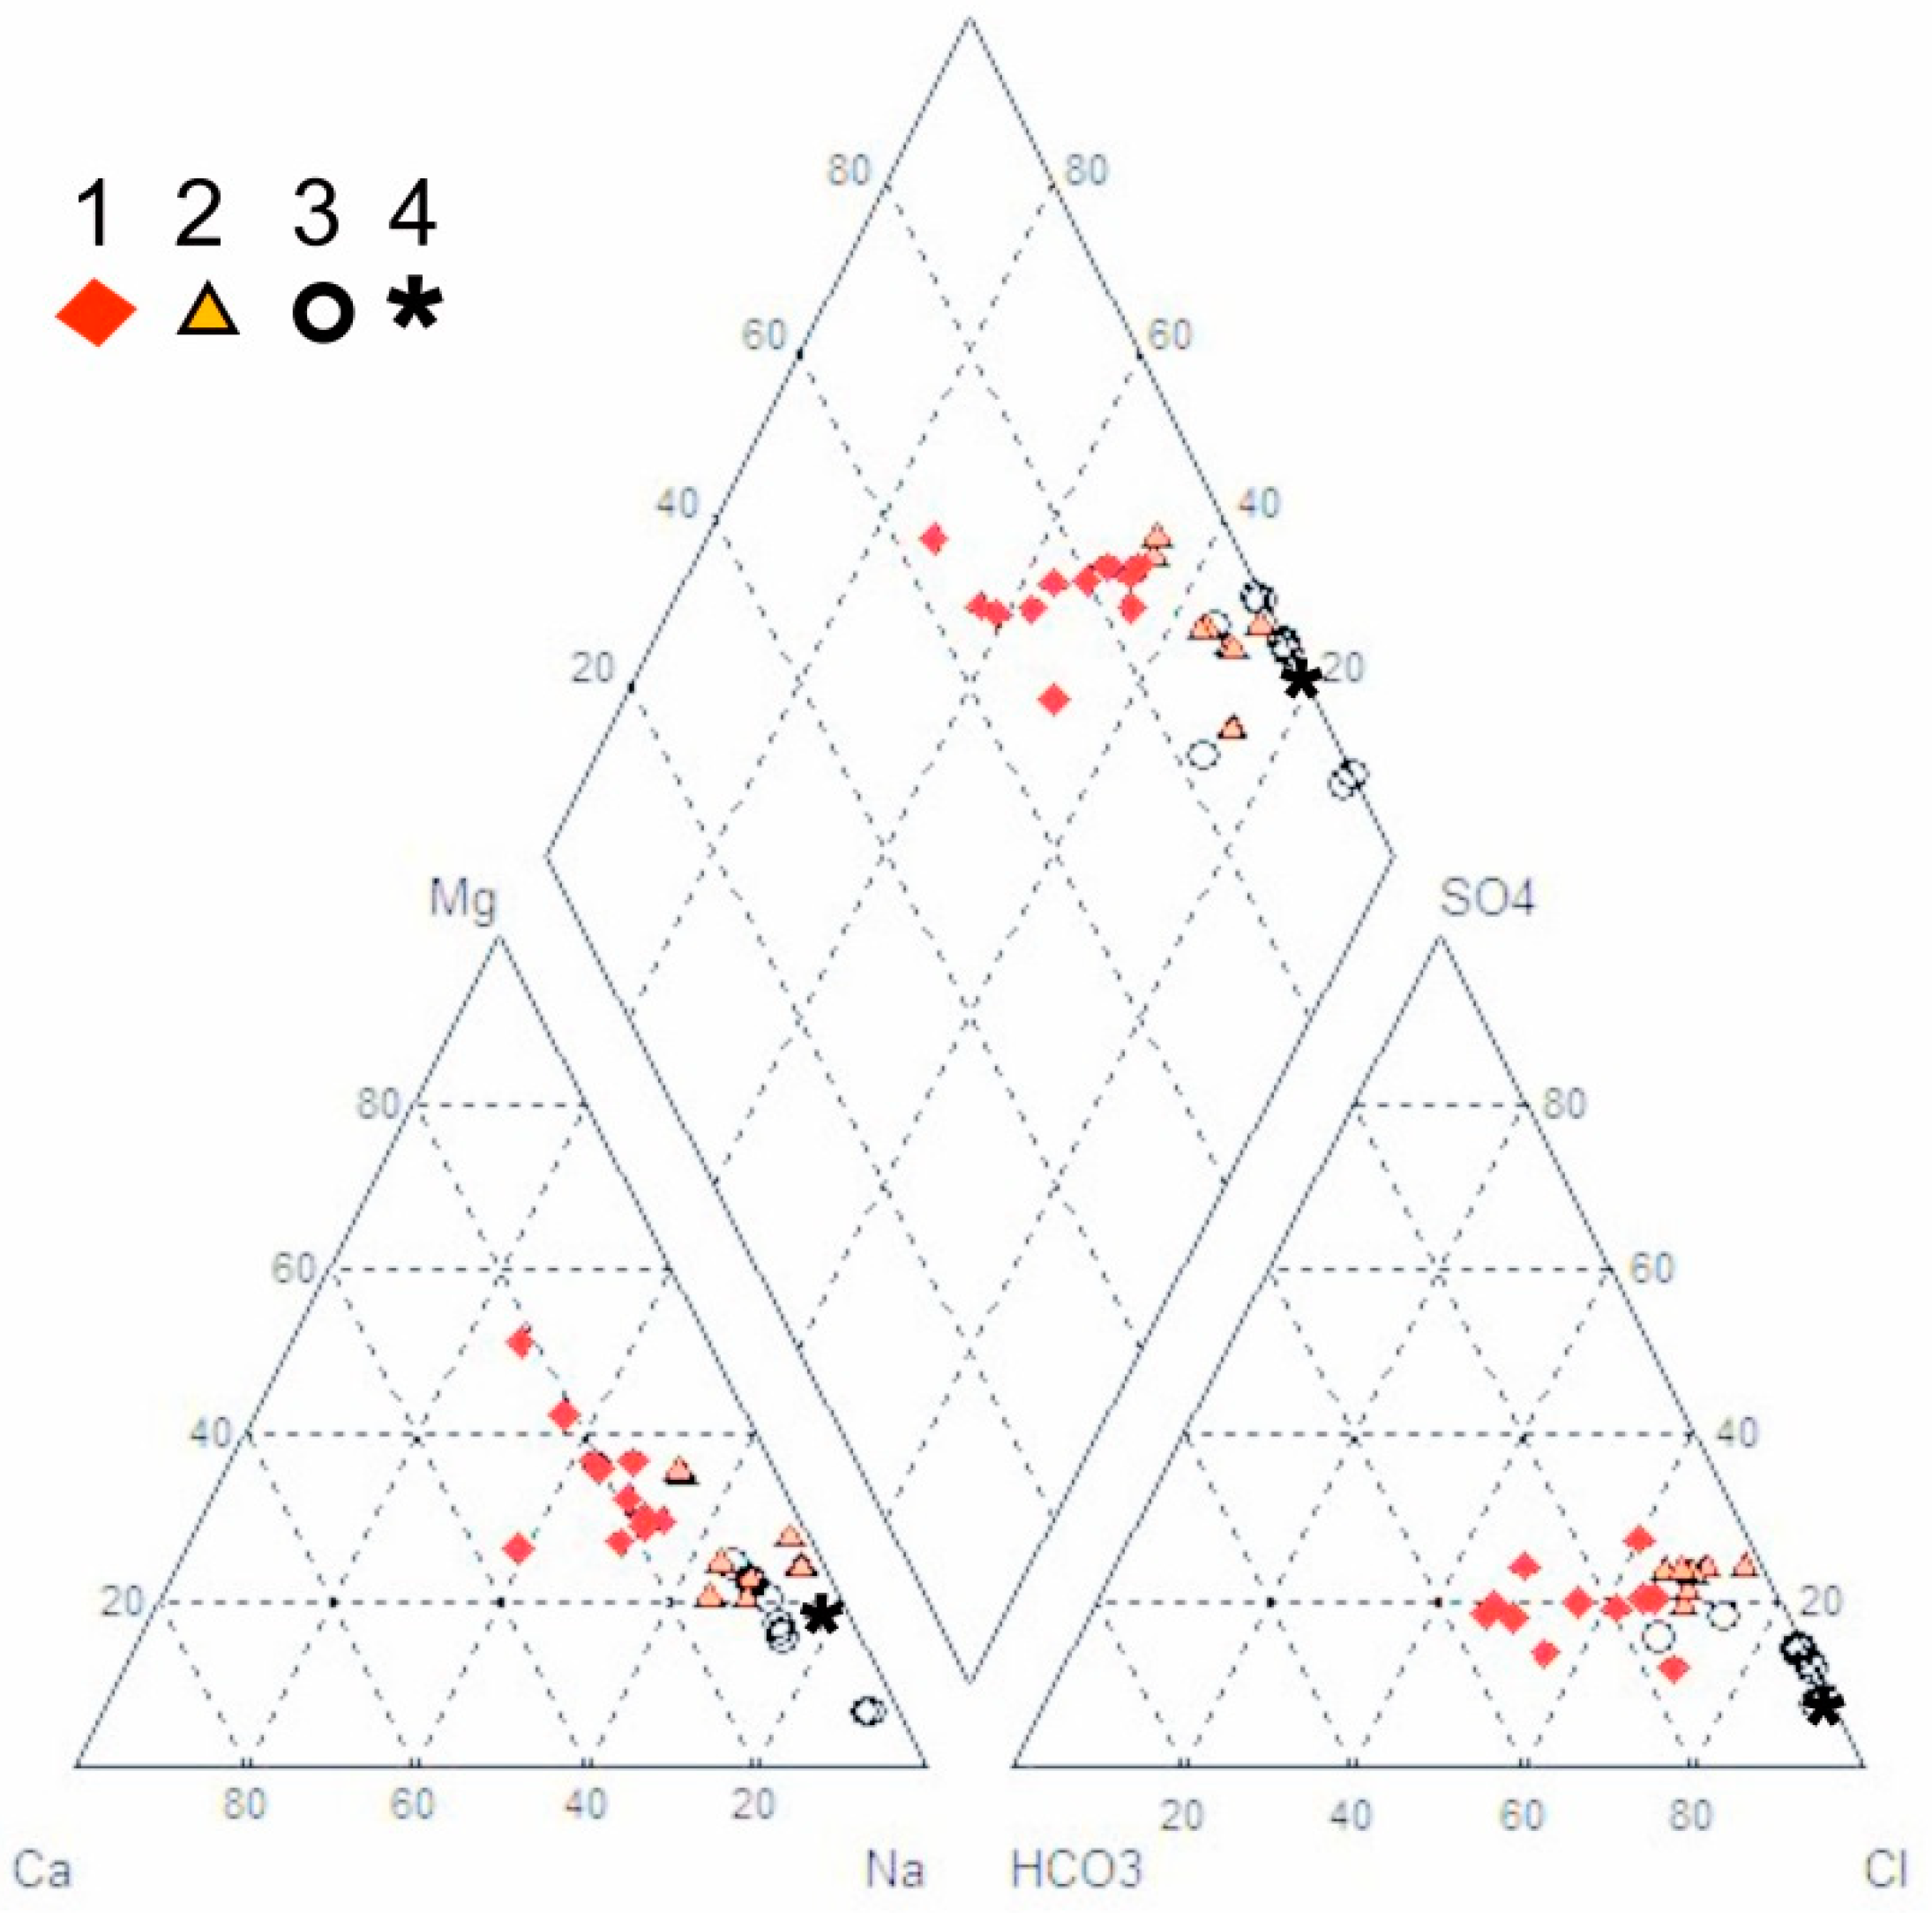
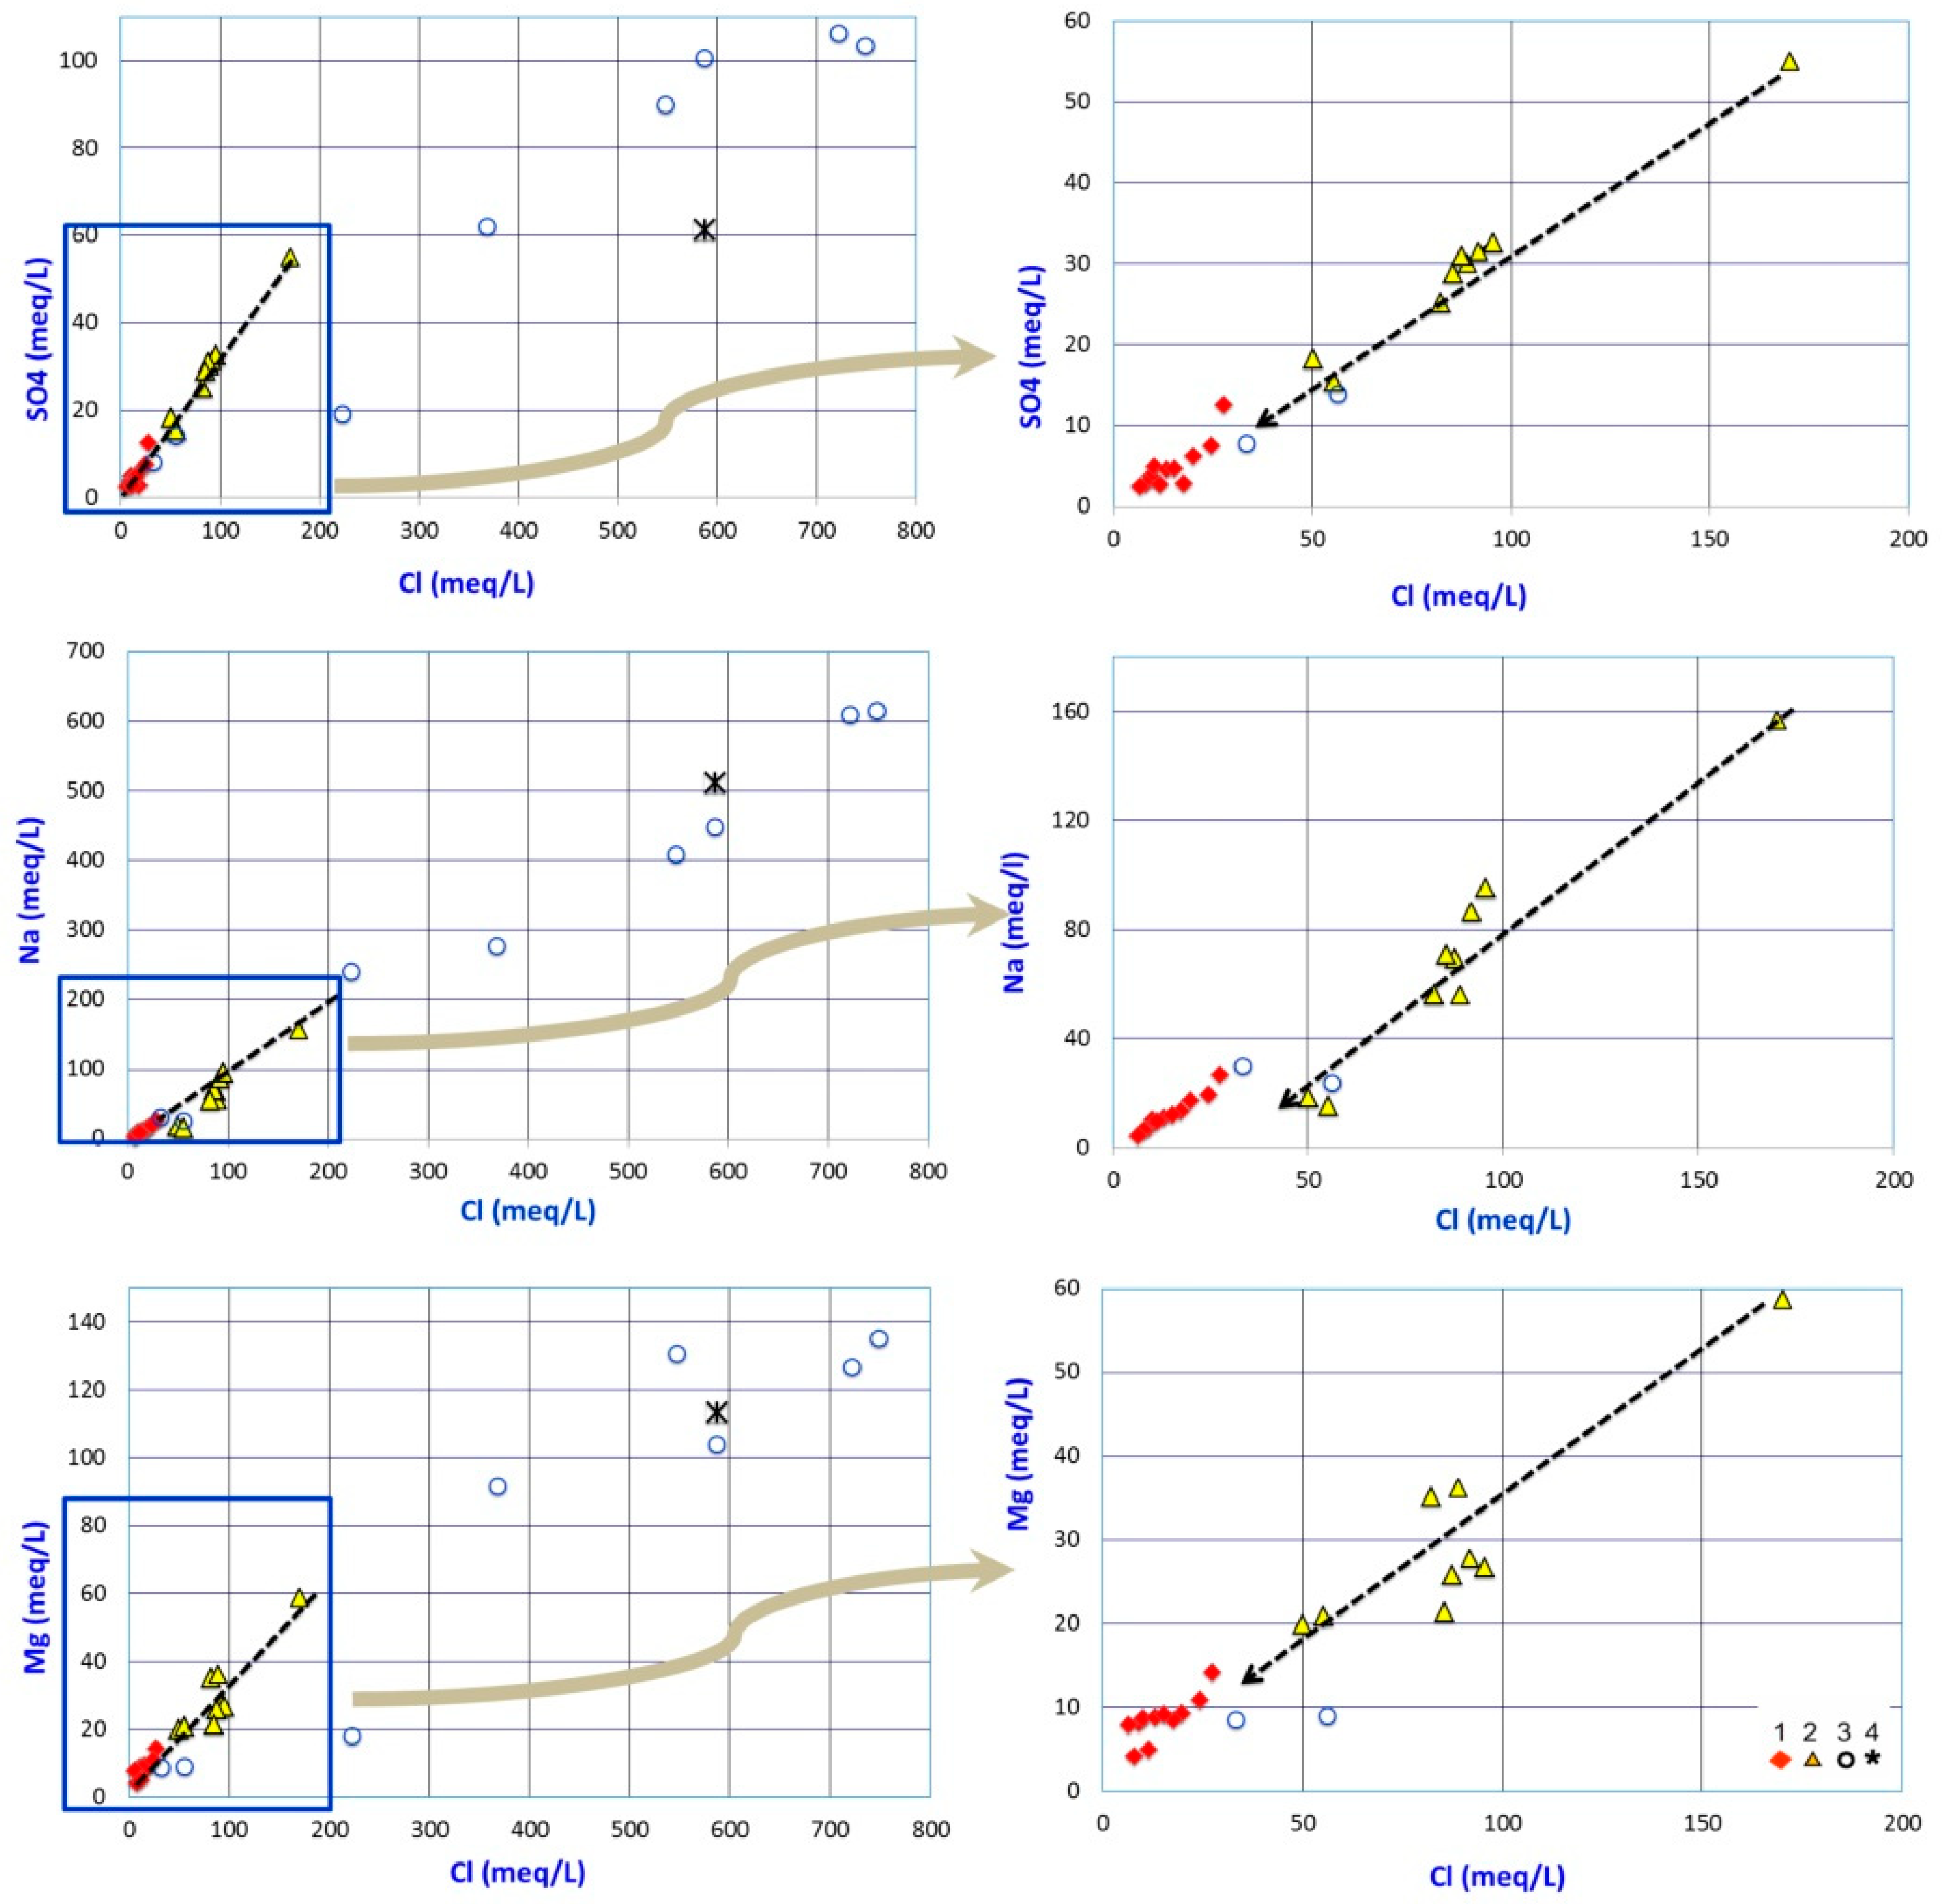
3. Results
4. Discussion
5. Conclusions
Author Contributions
Funding
Institutional Review Board Statement
Informed Consent Statement
Data Availability Statement
Acknowledgments
Conflicts of Interest
References
- Tiner, R.W. Wetlands: An Overview. In Remote Sensing of Wetlands. Applications and Advances; Tiner, R.W., Lang, M.L., KLemas, V.V., Eds.; CRC Press, Taylor & Francis Group: Boca Raton, FL, USA, 2015; pp. 3–18. [Google Scholar]
- Álvarez-Rogel, J.; Jiménez-Cárceles, F.J.; Roca, M.J.; Ortiz, R. Changes in soils and vegetation in a Mediterranean coastal salt marsh impacted by human activities. Estuar. Coast. Shelf. Sci. 2007, 3–4, 510–526. [Google Scholar] [CrossRef]
- Junk, W.J.; An, S.; Finlayson, C.M.; Gopal, B.; Květ, J.; Mitchell, S.A.; Mitsch, W.J.; Robarts, R.D. Current state of knowledge regarding the worlds wetlands and their future under global climate change: A synthesis. Aquat. Sci. 2013, 75, 151–167. [Google Scholar] [CrossRef] [Green Version]
- Liao, A.P.; Chen, L.J.; Chen, J.; He, C.Y.; Cao, X.; Chen, J.; Peng, S.; Sun, F.; Gong, P. High-resolution remote sensing mapping of global land water. Sci. China Earth Sci. 2014, 57, 2305–2316. [Google Scholar] [CrossRef]
- Verpoorter, C.; Kutser, T.; Seekell, D.A.; Tranvik, L.J. A global inventory of lakes based on high-resolution satellite imagery. Geophys. Res. Lett. 2014, 41, 6396–6402. [Google Scholar] [CrossRef]
- Feng, M.; Sexton, J.O.; Channan, S.; Townshen, J.R. A global, high-resolution (30-m) inland water body dataset for 2000: First results of a topographic–spectral classification algorithm. Int. J. Digit. Earth. 2015, 9, 113–133. [Google Scholar] [CrossRef] [Green Version]
- Carroll, M.; Wooten, M.; DiMiceli, C.; Sohlberg, R.; Kelly, M. Quantifying Surface Water Dynamics at 30 Meter Spatial Resolution in the North American High Northern Latitudes 1991–2011. Remote Sens. 2016, 8, 622. [Google Scholar] [CrossRef] [Green Version]
- Pietroniro, A.; Prowse, T.; Peters, D.L. Hydrologic assessment of an inland freshwater delta using multi-temporal satellite remote sensing. Hydrol. Process. 1999, 13, 2483–2498. [Google Scholar] [CrossRef]
- Krinner, G. Impact of lakes and wetlands on boreal climate. J. Geophys. Res. 2003, 108, 4520. [Google Scholar] [CrossRef]
- Fox, R.J.; Fisher, T.R.; Gustafson, A.B.; Jordan, T.E.; Kana, T.M.; Lang, M.W. Searching for the missing nitrogen: Biogenic nitrogen gases in groundwater and streams. J. Agric. Sci. 2014, 152, 96–106. [Google Scholar] [CrossRef]
- Winter, T.C. Relation of streams, lakes, and wetlands to groundwater flow systems. Hydrogeol. J. 1999, 7, 28–45. [Google Scholar] [CrossRef]
- Becker, M.W. Potential for satellite remote sensing of ground water. Groundwater 2006, 44, 306–318. [Google Scholar] [CrossRef] [PubMed]
- Mediterranean Wetlands Observatory. Land Cover—Spatial Dynamics in Mediterranean Coastal Wetlands from 1975 to 2005; Thematic Collection; Issue #2; Tour du Valat: Arles, France, 2014; p. 7. [Google Scholar]
- Mitsch, W.J.; Gosselink, J.G. Wetlands, 5th ed.; John Wiley & Sons: Hoboken, NJ, USA, 2015. [Google Scholar]
- Jin, H.; Huang, C.; Lang, M.W.; Yeo, I.Y.; Stehman, S. Monitoring of wetland inundation dynamics in the Delmarva Peninsula using Landsat time-series imagery from 1985 to 2011. Remote Sens. Environ. 2017, 190, 26–41. [Google Scholar] [CrossRef] [Green Version]
- Castañeda, C.; Herrero, J. Assessing the degradation of saline wetlands in an arid agricultural region in spain. Catena 2008, 72, 205–213. [Google Scholar] [CrossRef] [Green Version]
- Martínez-López, J.; Carreño, M.F.; Martínez-Fernández, J.; Esteve, M.A. Wetland and landscape indices for assessing the condition of semiarid Mediterranean saline wetlands under agricultural hydrological pressures. Ecol. Indic. 2014, 36, 400–408. [Google Scholar] [CrossRef]
- Adams, J.B.; Bate, G.C. Ecological implications of tolerance of salinity and inundation by Spartina maritima. Aquat. Bot. 1995, 52, 183–191. [Google Scholar] [CrossRef]
- Allen, Y.C.; Couvillion, B.R.; Barras, J.A. Using Multitemporal Remote Sensing Imagery and Inundation Measures to Improve Land Change Estimates in Coastal Wetlands. Estuaries Coasts 2012, 35, 190–200. [Google Scholar] [CrossRef]
- Pulido-Bosch, A.; Vallejos, A.; Sola, F.; Molina, L. Groundwater Sustainability Strategies in the Sierra de Gador-Campo de Dalías System, Southeast Spain. Water 2020, 12, 3262. [Google Scholar] [CrossRef]
- Mendoza-Fernández, A.J.; Peña-Fernández, A.; Molina, L.; Aguilera, P.A. The Role of Technology in Greenhouse Agriculture: Towards a Sustainable Intensification in Campo de Dalías (Almería, Spain). Agronomy 2021, 11, 101. [Google Scholar] [CrossRef]
- Martínez-Santos, P.; Martínez-Alfaro, P.E. Estimating groundwater withdrawals in areas of intensive agricultural pumping in central Spain. Agric. Water Manag. 2018, 98, 172–181. [Google Scholar] [CrossRef]
- Iglesias, A.; Garrote, L.; Flores, F.; Moneo, M. Challenges to manage the risk of water scarcity and climate change in the Mediterranean. Water Resour. Manag. 2007, 21, 775–788. [Google Scholar] [CrossRef]
- Pulido-Bosch, A.; Bensi, S.; Molina, L.; Vallejos, A.; Calaforra, J.M.; Pulido-Leboeuf, P. Nitrates as indicators of aquifer interconnection. Application to the Campo de Dalías (SE–Spain). Environ. Geol. 2000, 39, 791–799. [Google Scholar] [CrossRef]
- Molina-Sánchez, L.; Sánchez-Martos, F.; Daniele, L.; Vallejos, A.; Pulido-Bosch, A. Interaction of aquifer–wetland in a zone of intensive agriculture: The case of Campo de Dalías (Almería, SE Spain). Environ. Earth Sci. 2005, 73, 2869–2880. [Google Scholar] [CrossRef]
- Pulido Bosch, A.; Pulido-Leboeuf, P.; Molina-Sánchez, L.; Vallejos, A.; Martín Rosales, W. Intensive agriculture, wetlands, quarris and water management. A case study (Campo Dalías, SE Spain). Environ. Geol. 2000, 40, 163–168. [Google Scholar] [CrossRef]
- Goy, J.L.; Zazo, C.; Dabrio, C.J. A beach-ridge progradation complex reflecting periodical sea-level and climate variability during the Holocene (Gulf of Almería, Western Mediterranean). Geomorphology 2003, 50, 251–268. [Google Scholar] [CrossRef] [Green Version]
- López Martos, J.M. Transformaciones de un humedal incrustado en un paisaje del Antropoceno. El caso de los Charcones de Entinas. Bachelor’s Thesis, University of Almeria, Almería, Spain, 2015. [Google Scholar]


| Water | Date | E.C. | Cl | SO4 | HCO3 | NO3 | Na | Mg | Ca | K | |
|---|---|---|---|---|---|---|---|---|---|---|---|
| Sea water | 26-06-09 | 20,809 | 2950 | 148 | <0.45 | 11,720 | 1428 | 460 | 82.1 | ||
| Punta Entinas wetlands | ENT 04 | 01-09-05 | 73,200 | 33,711 | 4232 | 260 | 49 | 23,100 | 900 | 772 | 560.0 |
| ENT 01 | 01-09-05 | 21,800 | 7927 | 905 | 291 | 44 | 5480 | 216 | 212 | 240.0 | |
| ENT 04 | 01-05-09 | 64,300 | 26,587 | 4952 | 159 | 0 | 14,039 | 1637 | 1489 | 564.3 | |
| ENT 01 | 01-05-09 | 62,500 | 25,631 | 5088 | 190 | 0 | 13,936 | 1537 | 1493 | 541.2 | |
| ENT 02 | 04-02-13 | 44,500 | 19,444 | 4307 | 238 | 17 | 9312 | 1585 | 1103 | 435.0 | |
| ENT 01 | 04-02-13 | 34,520 | 13,091 | 2965 | 232 | 33 | 6316 | 1110 | 774 | 291.0 | |
| ENT 01b | 04-02-13 | 3485 | 1004 | 664 | 348 | 30 | 682 | 168 | 177 | 31.5 | |
| ENT 02 | 28-05-13 | 45,410 | 20,843 | 4818 | 201 | <0.45 | 10,247 | 1261 | 1064 | 482.8 | |
| ENT 01 | 28-05-13 | 3374 | 1191 | 570 | 500 | <0.45 | 682 | 168 | 170 | 35.0 | |
| Groundwater | 630-D | 26-06-07 | 4440 | 974 | 606 | 360 | 296 | 611 | 179 | 188 | 0.5 |
| 140-D | 26-06-07 | 3150 | 703 | 302 | 305 | 41 | 402 | 117 | 105 | 0.3 | |
| 162-D | 26-06-07 | 1887 | 322 | 183 | 403 | 125 | 166 | 103 | 86 | 0.5 | |
| 162-D0 | 26-06-07 | 1845 | 355 | 242 | 354 | 170 | 243 | 111 | 103 | 0.5 | |
| 168-D | 26-06-07 | 2480 | 464 | 222 | 336 | 177 | 257 | 112 | 106 | 0.2 | |
| 184-D | 26-06-07 | 3080 | 280 | 138 | 311 | 73 | 148 | 53 | 116 | 0.2 | |
| 207-D | 26-06-07 | 2180 | 620 | 138 | 246 | 53 | 308 | 108 | 104 | 0.4 | |
| 236-D | 26-06-07 | 2600 | 539 | 228 | 299 | 93 | 282 | 116 | 84 | 0.5 | |
| 239-D | 26-06-07 | 1462 | 230 | 123 | 299 | 110 | 99 | 100 | 71 | 0.2 | |
| 573-D | 26-06-07 | 3890 | 865 | 363 | 329 | 98 | 448 | 137 | 136 | 0.5 | |
| 623-D | 26-06-07 | 3530 | 405 | 135 | 384 | 55 | 219 | 62 | 85 | 0.2 | |
| Year | Month | Source (2) | Type (1) | Scale | Observations |
|---|---|---|---|---|---|
| 1956 | January | REDIAM | O | 1:45,0000 | American flight: series B |
| 1974 | September | IECA | F | 1:25,000 | |
| 1985 | Summer | REDIAM | O | (4) | |
| 1994 | December | IECA | F | 1:20,000 | |
| 2005 | Spring | REDIAM | O | 1:20,000 | ODA (3) |
| 2013 | Spring | REDIAM | O | ODA |
| Zones | 1956 | 1974 | 1984 | 1994 | 2004 | 2013 | |
|---|---|---|---|---|---|---|---|
| Crops | Greenhouse | 0 | 0.78 | 610.57 | 1125.14 | 1559.23 | 1610.52 |
| Traditional | 476.05 | 4.18 | 0 | 0 | 0 | 0 | |
| Areas | 6 | 4.55 | 5.22 | 6.44 | 5.90 | 5.83 | 13.76 |
| 5 | 42.69 | 68.25 | 75.11 | 65.25 | 27.21 | 19.90 | |
| 4 | 1.37 | 3.34 | 2.55 | 1.83 | 2.92 | 0.60 | |
| 3 | 18.97 | 18.87 | 28.65 | 28.88 | 32.02 | 22.91 | |
| 2 | 47.27 | 52.82 | 39.34 | 49.63 | 0 | 0 | |
| 1 | 29.86 | 29.07 | 28.33 | 31.98 | 130.40 | 154.14 | |
| Total | 144.70 | 177.57 | 180.41 | 183.46 | 198.39 | 211.32 | |
Publisher’s Note: MDPI stays neutral with regard to jurisdictional claims in published maps and institutional affiliations. |
© 2021 by the authors. Licensee MDPI, Basel, Switzerland. This article is an open access article distributed under the terms and conditions of the Creative Commons Attribution (CC BY) license (http://creativecommons.org/licenses/by/4.0/).
Share and Cite
Sánchez-Martos, F.; López-Martos, J.M.; Molina Sánchez, L.; Gisbert-Gallego, J.; Navarro-Martínez, F. Influence of Groundwater Discharge on Temporal Evolution in Two Wetlands of an Intensely Anthropized Area: Analysis Using an Integrated Approach. Water 2021, 13, 697. https://doi.org/10.3390/w13050697
Sánchez-Martos F, López-Martos JM, Molina Sánchez L, Gisbert-Gallego J, Navarro-Martínez F. Influence of Groundwater Discharge on Temporal Evolution in Two Wetlands of an Intensely Anthropized Area: Analysis Using an Integrated Approach. Water. 2021; 13(5):697. https://doi.org/10.3390/w13050697
Chicago/Turabian StyleSánchez-Martos, Francisco, José Manuel López-Martos, Luis Molina Sánchez, Juan Gisbert-Gallego, and Francisco Navarro-Martínez. 2021. "Influence of Groundwater Discharge on Temporal Evolution in Two Wetlands of an Intensely Anthropized Area: Analysis Using an Integrated Approach" Water 13, no. 5: 697. https://doi.org/10.3390/w13050697