
An Experimental Study on the Sources of Strontium in Mineral Water and General Rules of Its Dissolution—A Case Study of Chengde, Hebei

1
School of Water Resources and Environment, China University of Geosciences (Beijing), Beijing 100083, China
2
The 4th Geological Team of Hebei Geology and Mining Bureau, Chengde 067000, China
*
Author to whom correspondence should be addressed.
Water 2021, 13(5), 699; https://doi.org/10.3390/w13050699
Submission received: 15 January 2021
/
Revised: 22 February 2021
/
Accepted: 3 March 2021
/
Published: 5 March 2021
(This article belongs to the Special Issue Geochemistry of Water and Sediment Ⅱ)
Abstract
:Chengde City boasts a wealth of high-quality mineral water resources characterized by a high level of strontium (Sr), a low level of sodium, and low alkalinity. In order to study the mechanism of formation of Sr-bearing mineral water in Chengde and to scientifically guide future mineral water exploration, taking three typical mineral water exploration areas in Chengde as examples, this paper studies the sources of Sr in mineral water and the general rules of its dissolution via a laboratory static leaching experiment and impact experiments, and it provides an analysis of the characteristics of typical rock samples. The research results indicate that the content of Sr in surrounding rock and the characteristics of minerals existing in surrounding rock jointly control the dissolution of Sr in water; that CO2 can promote the formation of mineral water containing Sr; and that temperature increases may boost the dissolution of Sr from carbonate minerals but also inhibit the dissolution of Sr from silicate minerals.
1. Introduction
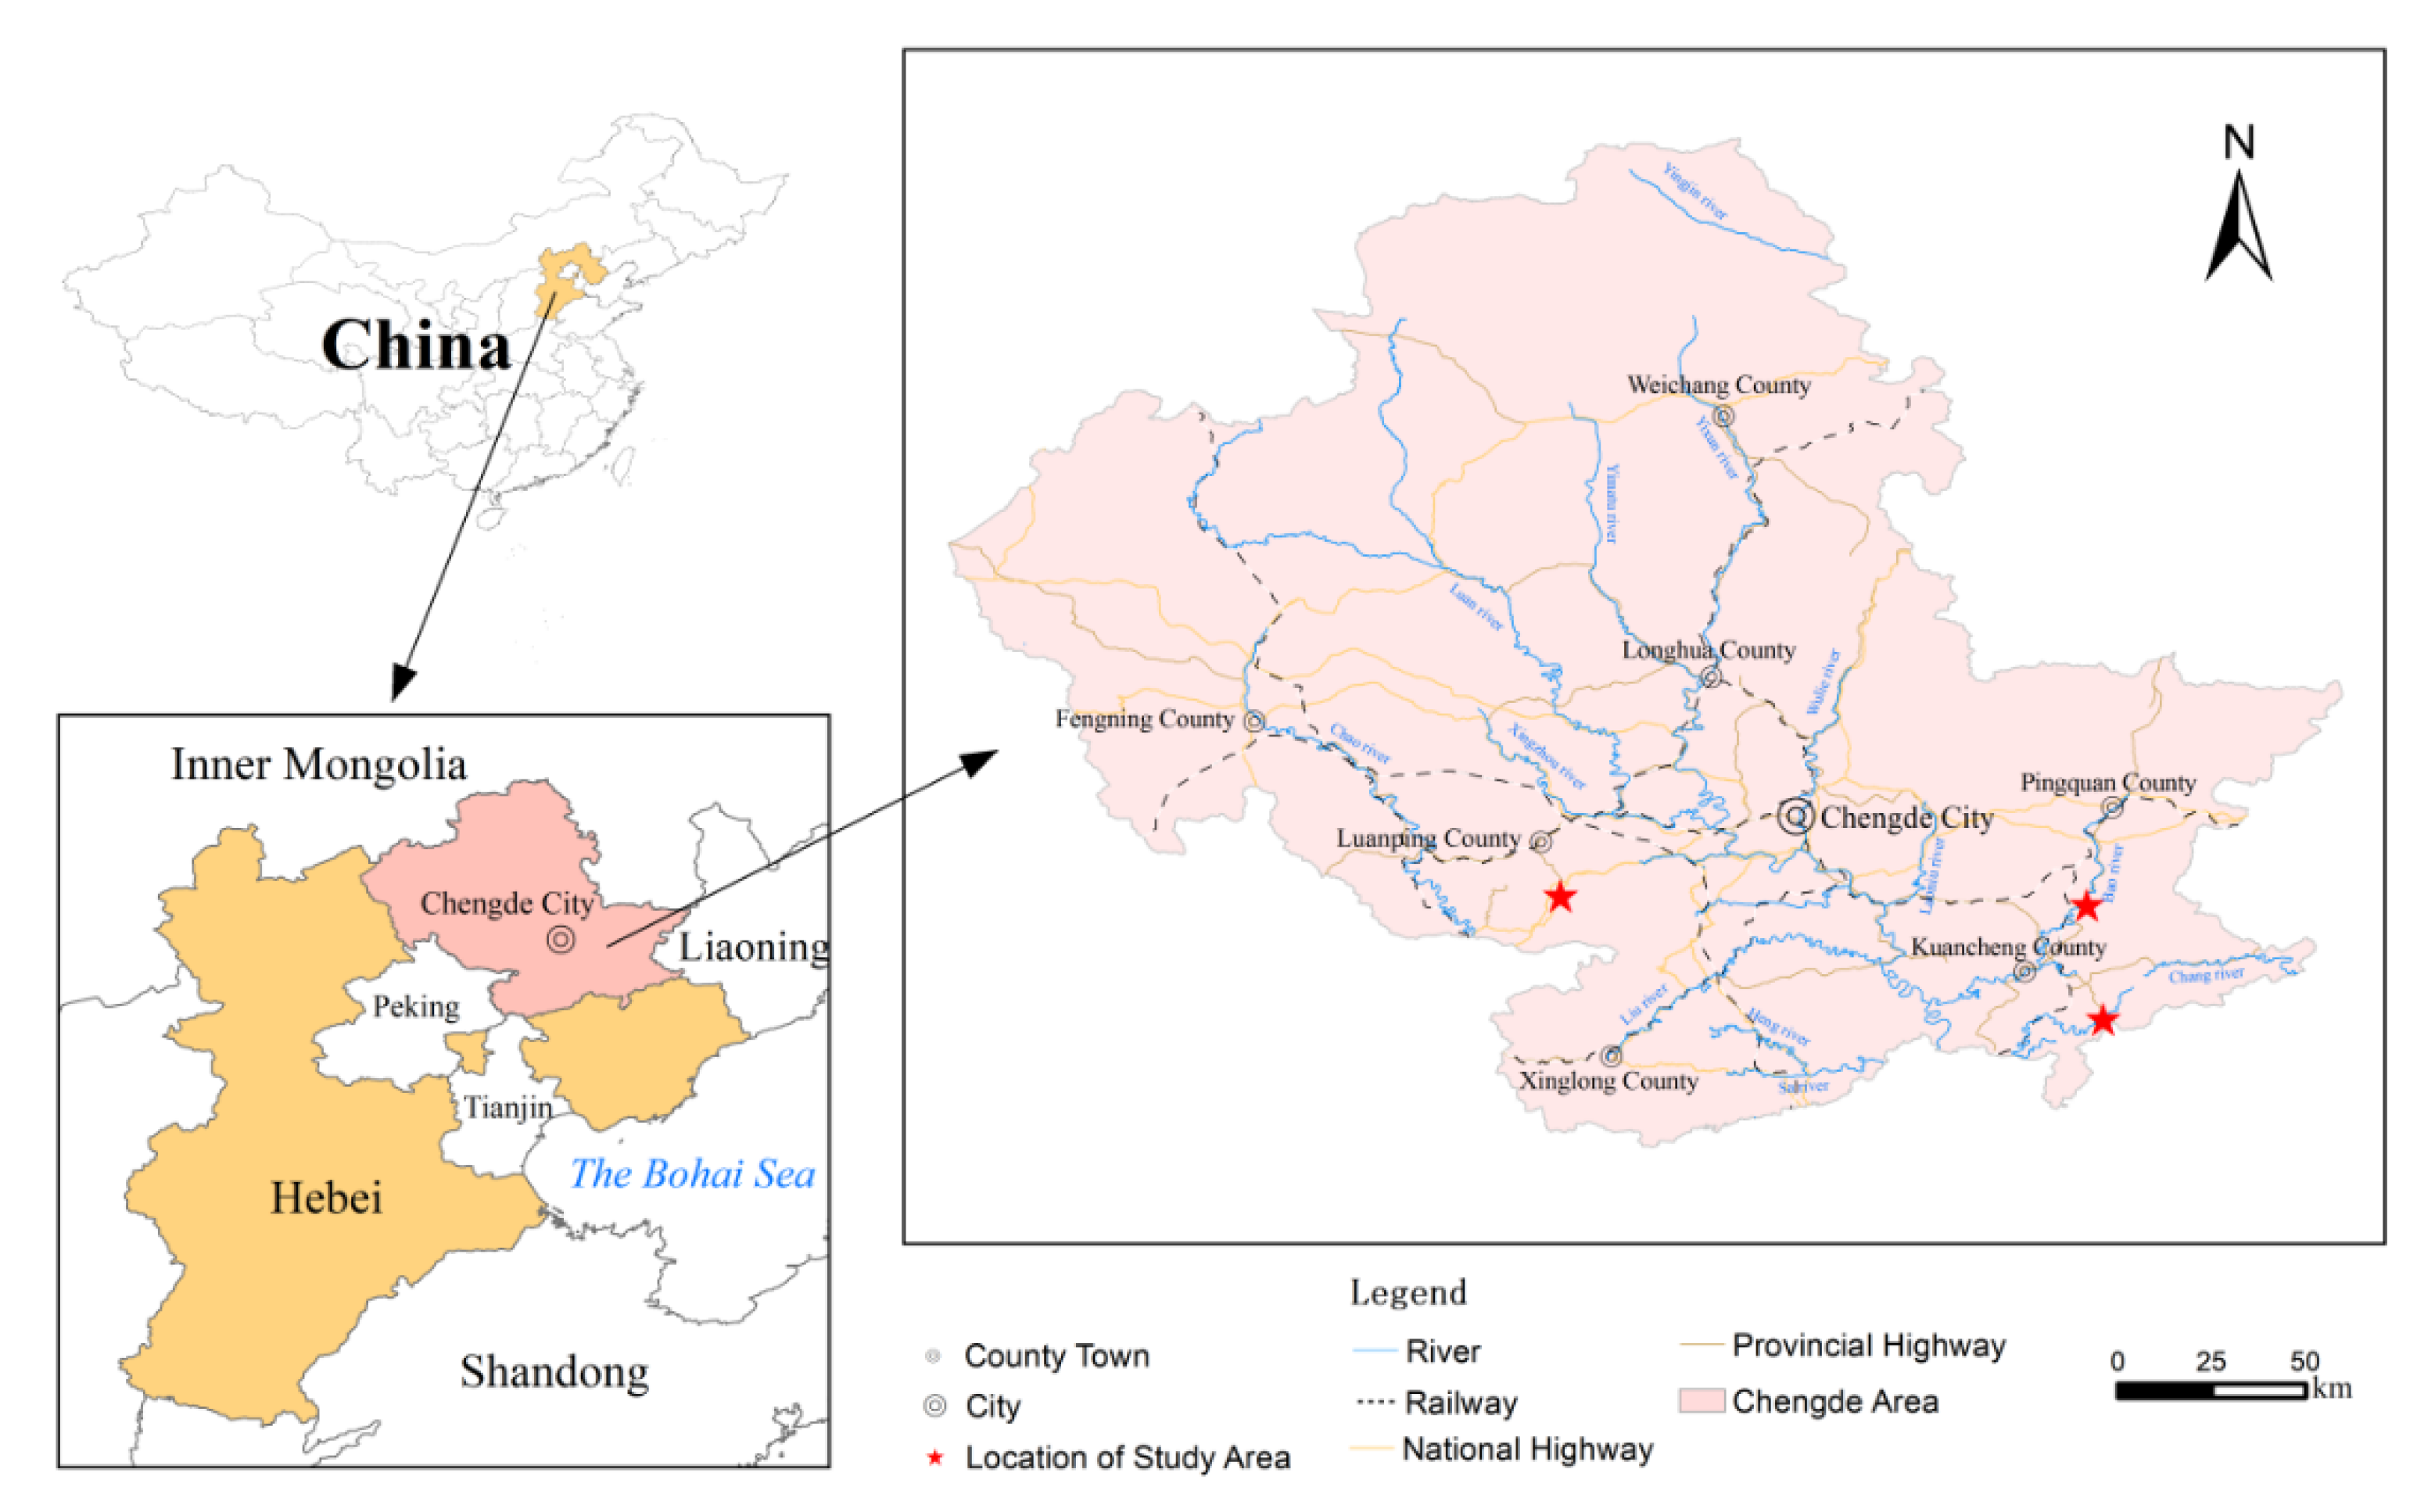
Located in the northeast of Hebei Province and the transitional zone between north China and northeast China, Chengde City is an important region connecting Beijing, Tianjin, Hebei, Liaoning, and Inner Mongolia, having a unique geographical advantage as a city connecting five provinces (Figure 1). In addition, Chengde City boasts a wealth of high-quality mineral water resources characterized by a high level of Sr, a low level of sodium, and low alkalinity. Relevant studies show that the water is rich in drinking water and can promote blood vessel softening and improve human metabolism; low sodium can prevent cardiovascular disease; and weak alkaline water combines with body fluids to form alkaline compounds in the body, which plays a vital role in maintaining the acid–base balance of human blood [1,2]. To give full play to the advantages of natural mineral water resources in Chengde in terms of geographical location and quality, vigorously develop aquaculture, and inject new impetus into the local economy, the local government has led the exploration of mineral water in the whole region in recent years, and some achievements have been made. At the same time, some problems have arisen during mineral water exploration, such as a lack of theoretical research on the origin of mineral water for scientific guidance on mineral water exploration, resulting in blindness of mineral water exploration and even some cases of exploration failure, hence greatly reducing the use efficiency of state-owned funds earmarked for exploration.
According to the data of Chengde natural resources and Planning Bureau, the proven mineral water reserves in Chengde area are 9 million tons per year, and the prospective resources are 32 million tons per year. At present, 45 mineral water exploration projects have been carried out in Chengde area. Among them, 24 water sources are Sr-bearing mineral water. It can be observed that Sr-bearing mineral water is the main type of mineral water in this area. From the spatial distribution analysis, Sr-bearing mineral water source areas are mainly distributed in the central and southeast of Chengde, namely the Longhua–Chengde–Kuancheng area. From the analysis of formation lithology, Sr-bearing mineral water is mainly produced in Jurassic, Cretaceous strata, and Archaean old strata. From the point of view of the three major rock types, there are 11 aquifers with magmatic rocks, 9 aquifers with metamorphic rocks, and 4 aquifers with sedimentary rocks. The hydrochemical types of Sr-bearing mineral water in Chengde area are mainly HCO3-Ca type, HCO3·SO4-Ca type, and SO4·HCO3-Ca type, accounting for 32%, 22%, and 18%, respectively. According to the existing research data, Sr in nature is mainly distributed in the form of isomorphism coexisting in potash feldspar, anorthite (plagioclase), calcite, dolomite, and other minerals, and the source of Sr in mineral water is mainly the Sr released by the above minerals in the process of hydrolysis. In order to better guide the future mineral water exploration in the Chengde area, from the perspective of grasping the main contradiction, we chose to study the Sr in mineral water. Therefore, to make up for the lack of theoretical research on the origin of mineral water and scientifically guide mineral water exploration in Chengde, from the perspective of laboratory experiment, we studied the sources of Sr in mineral water and general rules of its dissolution, which is of great significance to the enhancement of theoretical research on the causes of formation of mineral water, guidance on mineral exploration, and reduction in risks associated with use of state-owned funds earmarked for exploration.
Some scholars have studied mineral water from different perspectives. For instance, Nebojša Đ. Pantelić et al. assessed quality of spa mineral water from Vrnjačka Banja, Serbia from geochemical, bacteriological, and health risk aspects [3]; Olivera Krunić et al. studied the hydrogeological conditions for the occurrence of magnesium-rich mineral waters in Serbia and their physiological significance [4]; Suzan Pasvanoğlu systematically studied hydrogeochemistry of mineralized waters in eastern Turkey [5]; M. M. Corral et al. studied hydrogeochemical areas as background for specific mineral waters of Spain [6]. In addition, A. M. Kurchavova et al. proposed that mineral water can be used as evidence for research on the formation of granitoids in Caucasus [7]; WANG Lei established a hydrogeological conceptual model for the Danjiamiao Mineral Water Research Area, revealed the general rules of groundwater occurrence and migration, and identified the causes of mineral water concentration [8]; Jose M. Marques et al. studied the origin and evolution of Cl in mineral waters from northern Portugal [9]; Ignacio Suay-Matallana studied how chemical analyses are employed to study and describe mineral waters [10]. The research on the sources of beneficial elements in mineral water and their control mechanisms mainly focuses on a limited number of aspects. When studying the mechanism of the formation of mineral water in Maquanxiang, Shanxi, YU Kaining et al. believed that the material source was the Jining Group metamorphic rock series (where the percentages of elements are more than twice their Clarka values); faulted structures provided infiltration and migration channels for atmospheric precipitation, and deep geothermal circulation increased the water temperature, thus promoting the dissolution rate of media [11]. By analyzing the test data on 566 regions rich in Sr mineral water in China, their geochemical environments and geological backgrounds, LIU Qingxuan et al. formed the view that the formation of mineral water rich in Sr is closely related to the geochemical environment, including the abundance of different water-bearing media and Sr, and the best environment for Sr concentration in mineral water is carbonate rock formation, followed by clastic rock formation [12]. Petrović T et al. measured and analyzed bottled mineral water in Serbia and found that the chemical compositions of mineral water from different aquifers (limestone, schist, flysch, or Neogene sediments) are greatly affected by igneous intrusions [13]. MA Zhe, YAN Baizhong et al. studied the characteristics of mineral water in Jingyu, Jilin Province as well as the material sources, formation process, and influencing factors by experimental simulation of water–rock interaction and numerical simulation [14,15]. Natalia Vinograd et al. used hydrogen and oxygen isotopes to study the formation of mineral water in Staraya Russa in northwest Russia [16]. For the background of Sr in natural waters and the conditions of increasing strontium, Sun Houyun et al. studied the geochemical background of the formation of Sr-rich groundwater with a hydrochemical diagram and multivariate statistical analysis, ion ratio analysis, mineral balance system analysis, etc.; expounded the hydrochemical characteristics of Sr-rich groundwater in different regions; and discussed the formation mechanism of Sr-rich groundwater in natural waters [17]. Yan Zhaoxiu et al. proposed that the formation mechanism of Sr-rich groundwater has a certain relationship with water, that the content of different water bodies is different, and that its distribution has a certain regularity in the natural water cycle; that is, there is no Sr in the atmospheric water, there is little Sr in the surface water such as in rivers, and the content is relatively high in groundwater [18]. Su Hongjian and other researchers pointed out that after the infiltration and replenishment of atmospheric precipitation through pore fissures (mainly fissures), along the fissures and faults to considerable depths in the process of migration and circulation, due to the infiltration of CO2 in precipitation and CO2 produced by soil microbial decomposition into the ground with precipitation, in a certain temperature and pressure environment, it can hydrolyze and dissolve with surrounding rocks for a long time, resulting in the hydration of carbonate, silicate, and other minerals in rocks, which causes an increase in Sr in water [19]. For the study of Sr content and Sr-bearing minerals in rocks, Qian Yixiong et al. studied the geological background and filling mineral (petrology) and geochemical characteristics of Ordovician carbonate rocks in the central and western North of Tarim Basin and discussed in detail the contents of iron, manganese, magnesium, Sr, and other elements in calcite fillings [20]. Zhu Xueqin et al. analyzed and categorized a large number of strontium-bearing samples. By analyzing the data, aiming at quantitative correlation of strontium-bearing values of main lithology and the superposition coupling of Sr-bearing point layers, using correlation analysis, comparative analysis, and factor analysis in statistics, the quantitative comparative analysis of Sr-bearing values of main lithology in three major rock types was conducted, and the potential layer of lithostratigraphy rich in Sr was clearly identified [21]. Li Guorong et al. described in detail the different types of white beds in the Leikoupo Formation in the Western Sichuan Basin Sr element composition characteristics of dolomite [22]. At the junction of the Qilian North Qinling orogenic belt, Wen Zhiliang et al. tested and analyzed the Sr content of granite distributed in different periods in the area [23]. Shi Haiyan et al. observed that the long-term weathering of felsic bedrock provided the main Sr source for the formation of lacustrine celestite deposit [24].
Through a literature review, it can be found that there are few studies on the origin of Sr-bearing mineral water both home and abroad, especially in experimental research. There are abundant Sr-bearing mineral waters in the study area, and this research is carried out under this background. Based on this, three representative Sr-bearing mineral water exploration areas in Chengde area are selected as the research objects, and the research is carried out on the basis of the analysis and summary of the geological, hydrogeological, and other basic data of the three mineral water sources. The purpose of this study is to study and discuss the source of Sr in mineral water and its dissolution law under different conditions so as to enrich the theoretical research on the genesis of Sr-bearing mineral water and guide the exploration of Sr-bearing mineral water.
2. Materials and Methods
2.1. Rock Sample Collection
In view of the three major types of rock, we chose to study three typical mineral water exploration areas, namely Changshanyu in Luanping (a magmatic rock area), Miaoling in Kuancheng (a metamorphic rock area), and Yong’an in Pingquan (a sedimentary rock area), and we carried out field sampling on the basis of an analysis of data on the study areas, with three groups of different rock samples collected from each study area. Information on the rock samples collected is shown in Table 1.
2.2. Experiment Method
A laboratory leaching experiment was carried out in borosilicate glass reagent bottles. Nine kinds of rock samples collected from the study areas, each with a mass of 300 g (ground to 0.15 mm, similarly hereinafter), were put in reagent bottles; 1.5 L ultrapure water (water/rock ratio: 5:1) was added and then the bottles were sealed; samples were taken on days 1, 2, 3, 4, 5, 6, 7, 12, 18, 24, 30, 37, 44, 51, 58, 65, 72, 79, 86, and 93; each time 10 mL samples were taken, and pH was measured; then, the samples were filtered with a 0.2 μm syringe filter, 0.2 mL nitric acid 35% was added, and the samples were sealed. After sampling, 10 mL ultrapure water was added, and the pH value, Sr content, and content of other components were measured [25].
A CO2 impact experiment was carried out in borosilicate glass reagent bottles. Rock samples, each with a mass of 300 g, were taken and placed in sealed reagent bottles. A total of 1.5 L of ultrapure water was added, and CO2 gas was injected for 15 min every two days; the pH of the water was generally kept constant (pH of each sample solution did not change after injection of CO2 gas). Samples were taken on days 0, 7, 8, 9, 14, 21, 28, 35, 42, 49, 56, 63, 70, 77, and 84; each time 10 mL samples were taken, and pH was measured; then, the samples were filtered with a 0.2 μm membrane filter, 0.2 mL nitric acid 35% was added, and the samples were sealed. After sampling, 10 mL ultrapure water was added to maintain the original water level, and the pH value, Sr content, and content of other components were measured [25].
In addition, in order to study the rate of equilibrium in static leaching experiment and CO2 influence experiment, and to provide the possible concentration of solution after equilibrium [26], the reaction kinetics model (Formula (1)) of Stanford et al. (1973) was used to fit the curve of Sr dissolution.
In the formula, Mt is the total quantity dissolved (μg/L); M0 is the dissolution potential (μg/L); km is the rate constant (d−1); t is the reaction time (d).
Temperature impact experiment: 500 mL conical flasks were chosen as containers for the experiment, and rock samples, each with a mass of 60 g, were put into containers; 300 mL ultrapure water was added for immersion of the samples, and then the conical flasks were sealed with bottle plug, sealant and tape; a multi-function constant temperature magnetic stirrer was used to control temperature, and temperatures were set at 30, 60, and 90 °C, with the rotation rate being 800 rpm. Samples were taken on days 1, 3, 5, 9, and 15; each time 10 mL samples were taken, the samples were filtered with a 0.2 μm membrane filter, and 0.2 mL nitric acid 35% was added; then, the samples were sealed, and pH, Sr content, etc. were measured [27].
2.3. Test Method
Water samples were tested by inductively coupled plasma atomic emission spectrometry (ICP-AES, i CAP6000, Thermo) (US). The standard curve was measured using standard liquid produced by the National Analysis Center for Iron and Steel, and the results were corrected through quality control. In order to ensure the accuracy of Sr content measurement, standard Sr solution was prepared separately, and the standard curve was measured separately for it.
Testing of rock samples: (1) the rock samples were prepared as thin sections, and the samples was analyzed and appraised under the microscope using Nikon polarizing microscope LV100NPOL; (2) XRD (X-ray powder diffraction) was used to determine the mineral components of the rock samples; 2 g rock samples that had been ground to below 0.15 mm and fully mixed were ground to below 0.045 mm, and 1 g was taken for analysis and measurement with made-in-Japan D/Max-RC high-power rotating target fully automated X-ray powder diffractometer; (3) the chemical components of rock samples were determined using a portable X-ray fluorescence (XRF) instrument. Then, 10 g rock samples, which had been ground to below 0.15 mm and fully mixed, were spread evenly on flat tin paper and covered and flattened with industrial preservative film; then, a Niton XL3t 500 hand-held X-ray fluorescence (XRF) analyzer produced by Thermo Fisher Scientific was used to analyze and measure the samples, and the measurement results were corrected against the standard samples.
3. Results
3.1. Analysis of Rock Sample Characteristics
According to the results of XRD test of rock samples (Table 2), HG-KC contained the highest proportion of orthoclase (26%), HR-KC contained the highest proportion of mica (35%), PM-KC contained the highest proportions of amphibole (56%) and chlorite (14%), and JL-LP contained similar proportions of quartz and feldspar; AS-LP contained the highest proportions of plagioclase (68%) and feldspar (87%), and NH-LP contained the highest proportion of quartz (39%), while SH-PQ contained the highest proportion of calcite (90%); BY-PQ contained dolomite accounting for 98%, while DL-PQ contained similar proportions of calcite (74%) and dolomite (25%).
The results of the XRF test of the rock samples (Table 3) show the differences in the proportion of Ca. All carbonate rock samples (from the Pingquan study area) contained a higher proportion of Ca than silicate rock samples (from the Luanping study area and the Kuancheng study area); among the silicate rocks, PM-KC and AS-LP contained the highest proportions of Ca (AS-LP contained 12,500 mg/kg, and PM-KC contained 32,700 mg/kg), which were several times to dozens of times higher than the proportions of Ca in other silicate rock samples (0.817~6.36 mg/kg); among the carbonate rock samples, SH-PQ and DL-PQ also contained Ca more than twice that in BY-PQ. In addition, through the test of Sr content in rocks, it can be found that Sr content changes considerably (52.8~820 mg/kg), and HG-KC with the highest content is about 15 times higher than BY-PQ. It is worth noting that the change in Sr content is opposite to that of Ca content; that is, carbonate rock (from the Pingquan study area) is lower than silicate rock (from the Kuancheng study area).
3.2. Analysis of Results of the Static Leaching Experiment
The curves showing dynamic changes in concentration of Sr dissolved from rock samples taken from the three study areas are shown in Figure 2.
As demonstrated by the curve showing dynamic changes in concentrations of Sr dissolved from three groups of samples from the Luanping study area (Figure 2a), the Sr concentration in water rose rapidly in the first 7 days; the concentration of Sr dissolved from JL-LP rose from 0.00884 to 0.0186 mg/kg; AS-LP, from 0.0182 to 0.0585 mg/kg; and NH-LP, from 0.0074 to 0.0293 mg/kg. The Sr dissolution rates were as follows: AS-LP >> NH-LP > JL-LP. From day 7 to day 24, the concentrations of Sr dissolved from JL-LP and NH-LP rose at slower rates to 0.0276 and 0.0398 mg/kg, respectively, while the concentration of Sr dissolved from AS-LP increased at the same rate as in the first 7 days to 0.182 mg/kg. After 24 days, the concentrations of Sr dissolved from JL-LP and NH-LP hardly changed, but the concentration of Sr dissolved from AS-LP continued to rise, and equilibrium was basically reached after the concentration reached 0.218 mg/kg on day 32.
As demonstrated by the curve showing dynamic changes in concentration of Sr dissolved from three groups of samples from the Kuancheng study area (Figure 2b), the Sr concentration in water rose rapidly in the first 7 days; the concentration of Sr dissolved from HG-KC rose from 0.0161 to 0.0293 mg/kg; HR-KC, from 0.0038 to 0.0115 mg/kg; and PM-KC, from 0.0124 to 0.0798 mg/kg. The dissolution rates were as follows: PM-KC >> HG-KC > HR-KC. From day 7 to the day 32, the concentrations of Sr dissolved from the three samples of HG-KC, HR-KC, and PM-KC rose at slower rates, eventually reaching 0.0548, 0.0212, and 0.145 mg/kg, respectively; the dissolution rates remained as follows: PM-KC >> HG-KC > HR-KC. After 32 days, the concentrations of Sr dissolved from HG-KC and HR-KC increased at extremely slow rates, reaching 0.0771 and 0.0322 mg/kg, respectively, on day 96, while the concentration of Sr dissolved from PM-KC fluctuated with no significant change.
As demonstrated by the curve showing dynamic changes in concentration of Sr dissolved from three groups of samples from the Pingquan study area (Figure 2c), in the first 7 days, the concentration of Sr dissolved from DL-PQ rose from 0.0714 to 0.16035 mg/kg; SH-PQ, 0.0696 to 0.1547 mg/kg; and BY-PQ, 0.0246 to 0.05678 mg/kg. The Sr dissolution rates were as follows: SH-PQ >DL-PQ >> BY-PQ. From day 7 to day 46, the concentrations of Sr dissolved from the three samples of DL-PQ, SH-PQ, and BY-PQ rose at slower rates, reaching 0.31, 0.368, and 0.09 mg/kg, respectively. After 46 days, the rise in Sr concentration again slowed down; the concentration of Sr dissolved from BY-PQ was almost unchanged; the concentration of Sr dissolved from DL-PQ increased slowly to 0.342 mg/kg on day 96; and the concentration of Sr dissolved from SH-PQ rose faster than the other two samples, reaching 0.484 mg/kg on day 96.
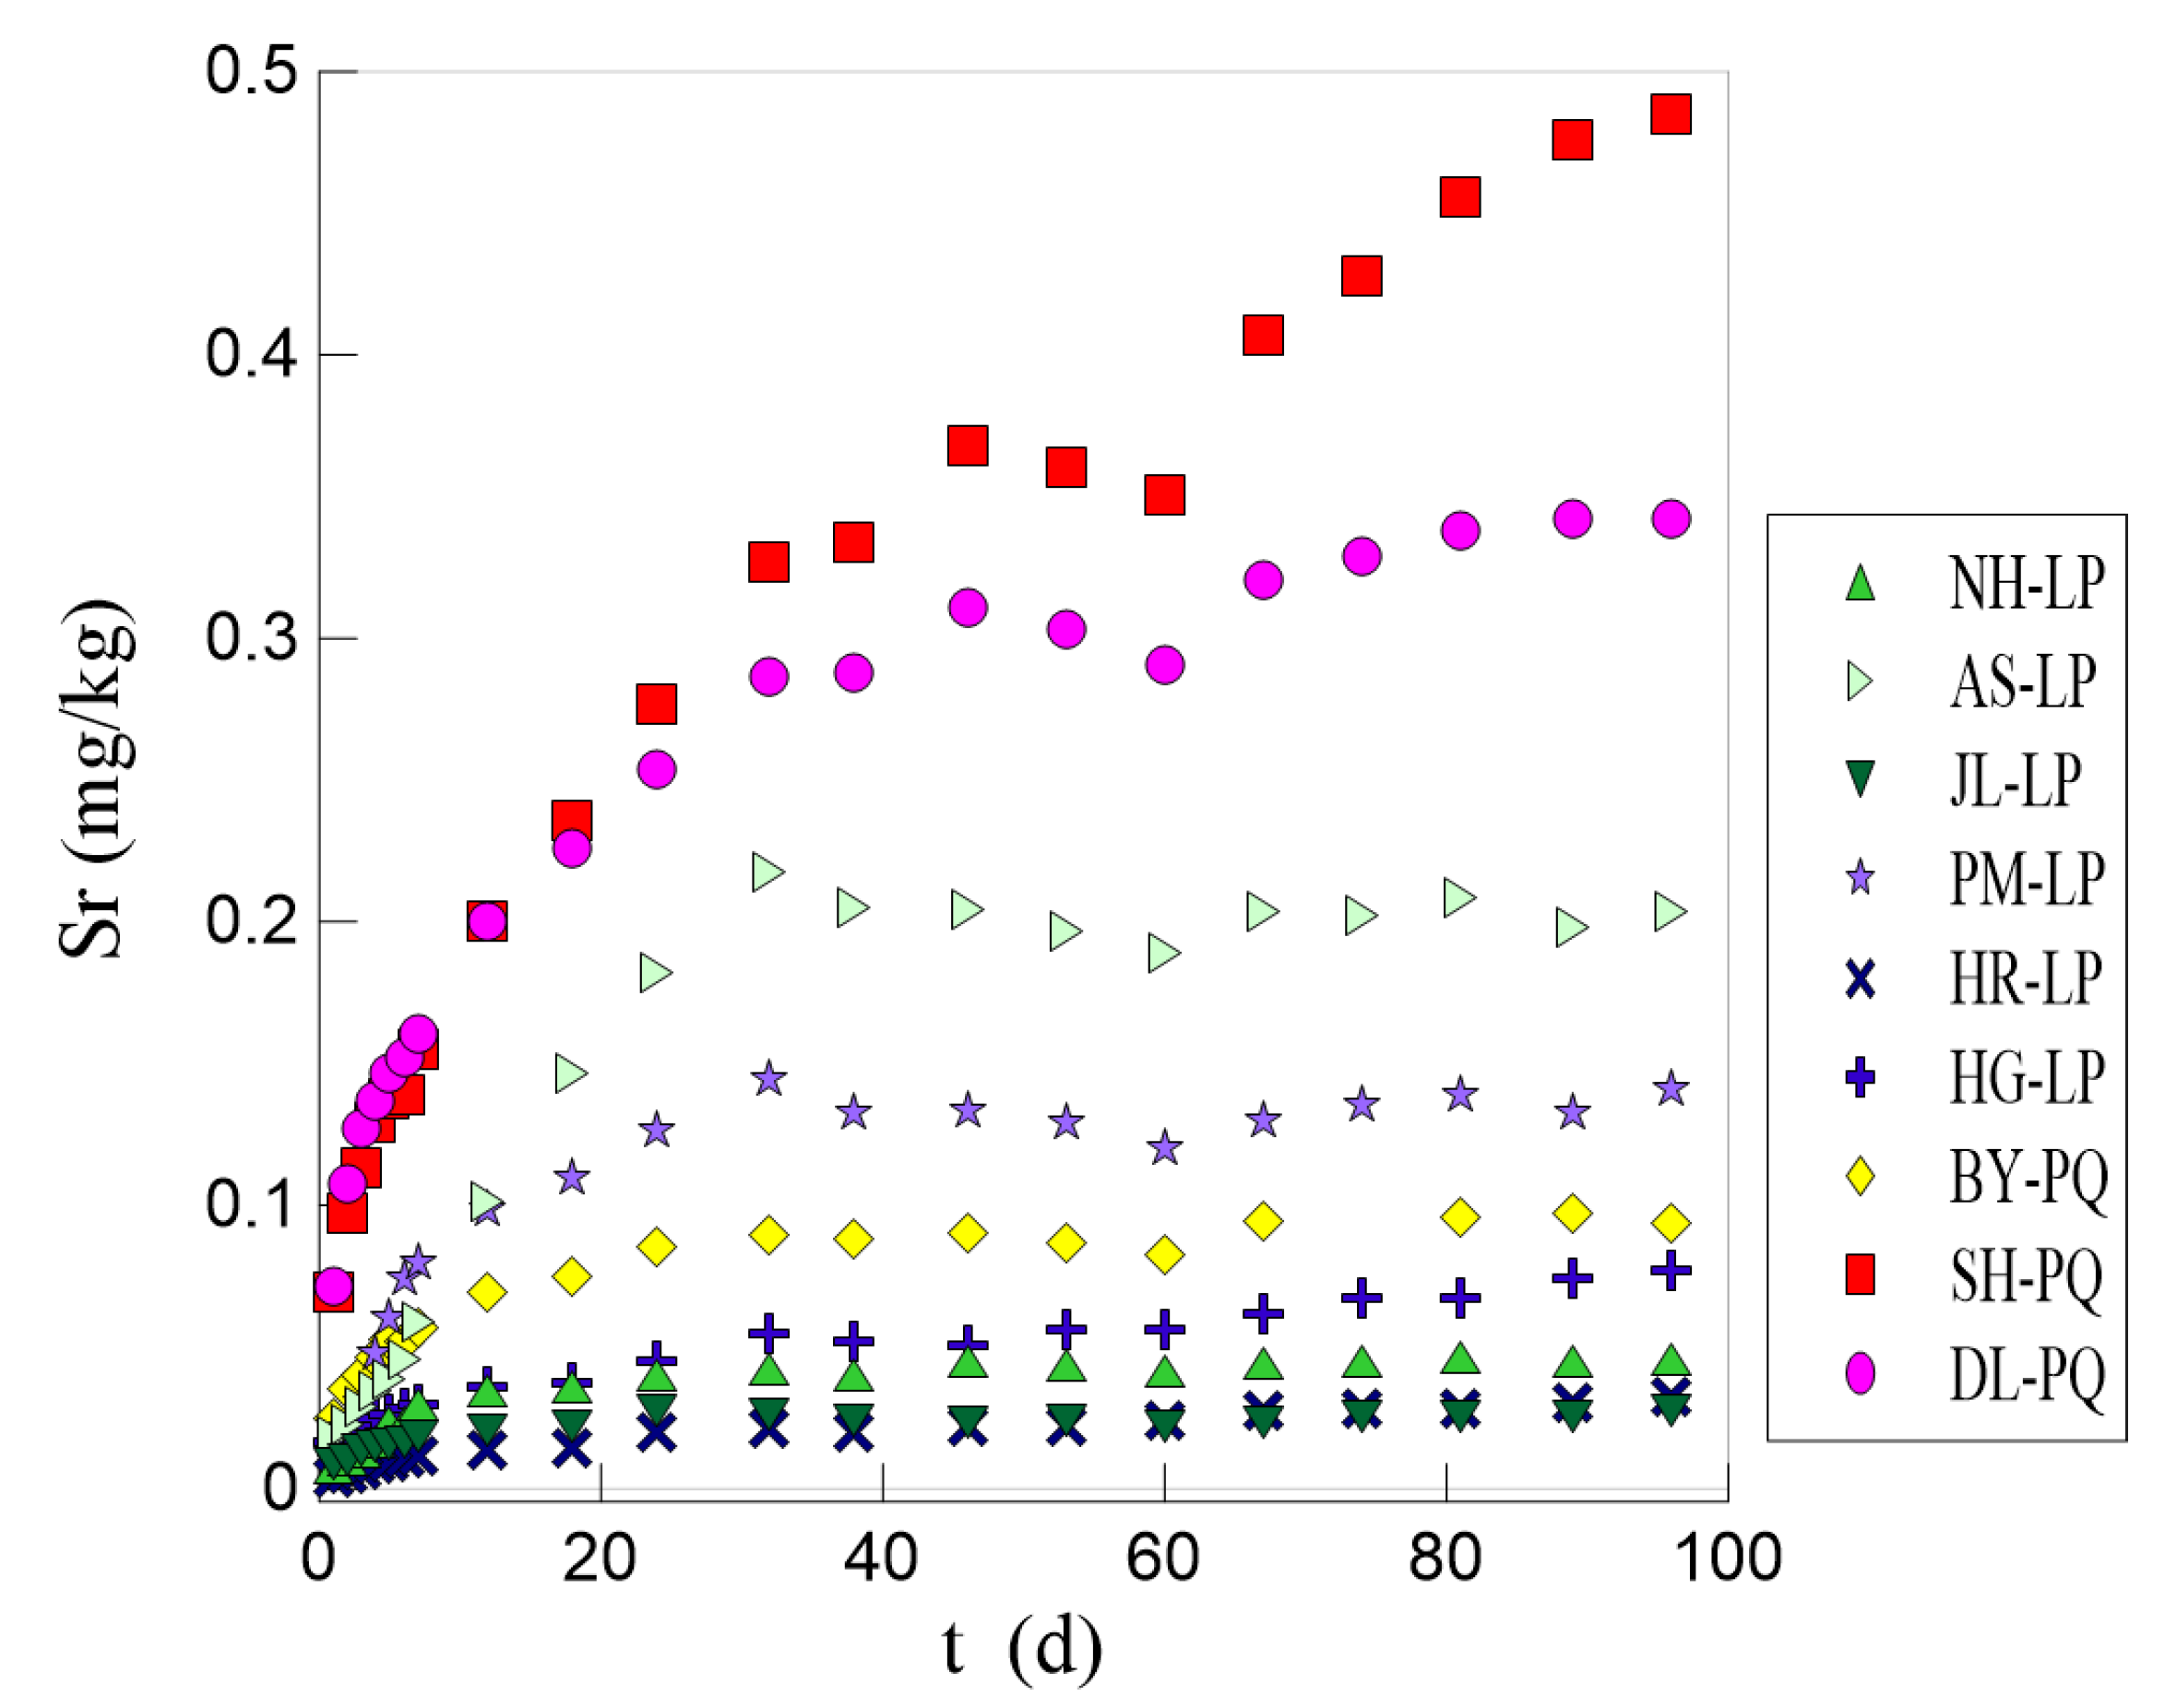
According to the results of the static leaching experiment, a comprehensive comparison chart (Figure 3) was made, showing the changes in Sr concentration over time in the static leaching experiment. Using Formula (1), the concentration of Sr dissolved from each sample when dissolution equilibrium was reached was calculated (Table 4).
As seen from Table 4 and Figure 3, the quantity of Sr dissolved from samples with different lithology varied greatly, with the quantity of Sr dissolved from some samples being several times or even an order of magnitude higher than that from other samples. The equilibrium concentration of Sr dissolved from one rock sample from each of the three study areas (AS-LP, PM-KC, and SH-PQ) after static leaching was the highest. The experiments discussed below (CO2 and temperature) were mainly conducted for the three rock samples.
3.3. Analysis of Results of the CO2 Impact Experiment
In order to study the impact of CO2 on Sr dissolution, one group of samples (AS-LP, PM-KC, and SH-PQ) was selected from three study areas to conduct the CO2 impact experiment. According to the results of the experiment, a curve showing the changes over time in concentration of Sr dissolved from the three samples (Figure 4) was drawn. Formula (1) was adopted to simulate the water–rock interaction process. The simulation results are shown in Table 5, and a comparison with the results of the static leaching experiment is presented in Table 6.
As shown in Figure 4, the concentration of Sr dissolved from AS-LP rose from 0.106 to 0.782 mg/kg from day 0 to day 49, and then no significant change occurred; the concentration of Sr dissolved from PM-KC rose from 0.104 to 0.522 mg/kg from day 0 to day 35 and then stabilized; the concentration of Sr dissolved from SH-PQ rose from 0.381 to 0.951 mg/kg from day 0 to day 42 and then stabilized. As can be seen from Table 5, among the three representative samples, SH-PQ had the highest dissolution potential and rate constant, indicating that CO2 injection had the greatest impact on the dissolution of Sr from carbonate rocks. As shown in Table 6, after CO2 injection, the rate constant and dissolution potential of Sr from all of the three representative samples increased, indicating that CO2 injection promoted the dissolution of Sr from the three representative rocks.
3.4. Analysis of Results of the Temperature Impact Experiment
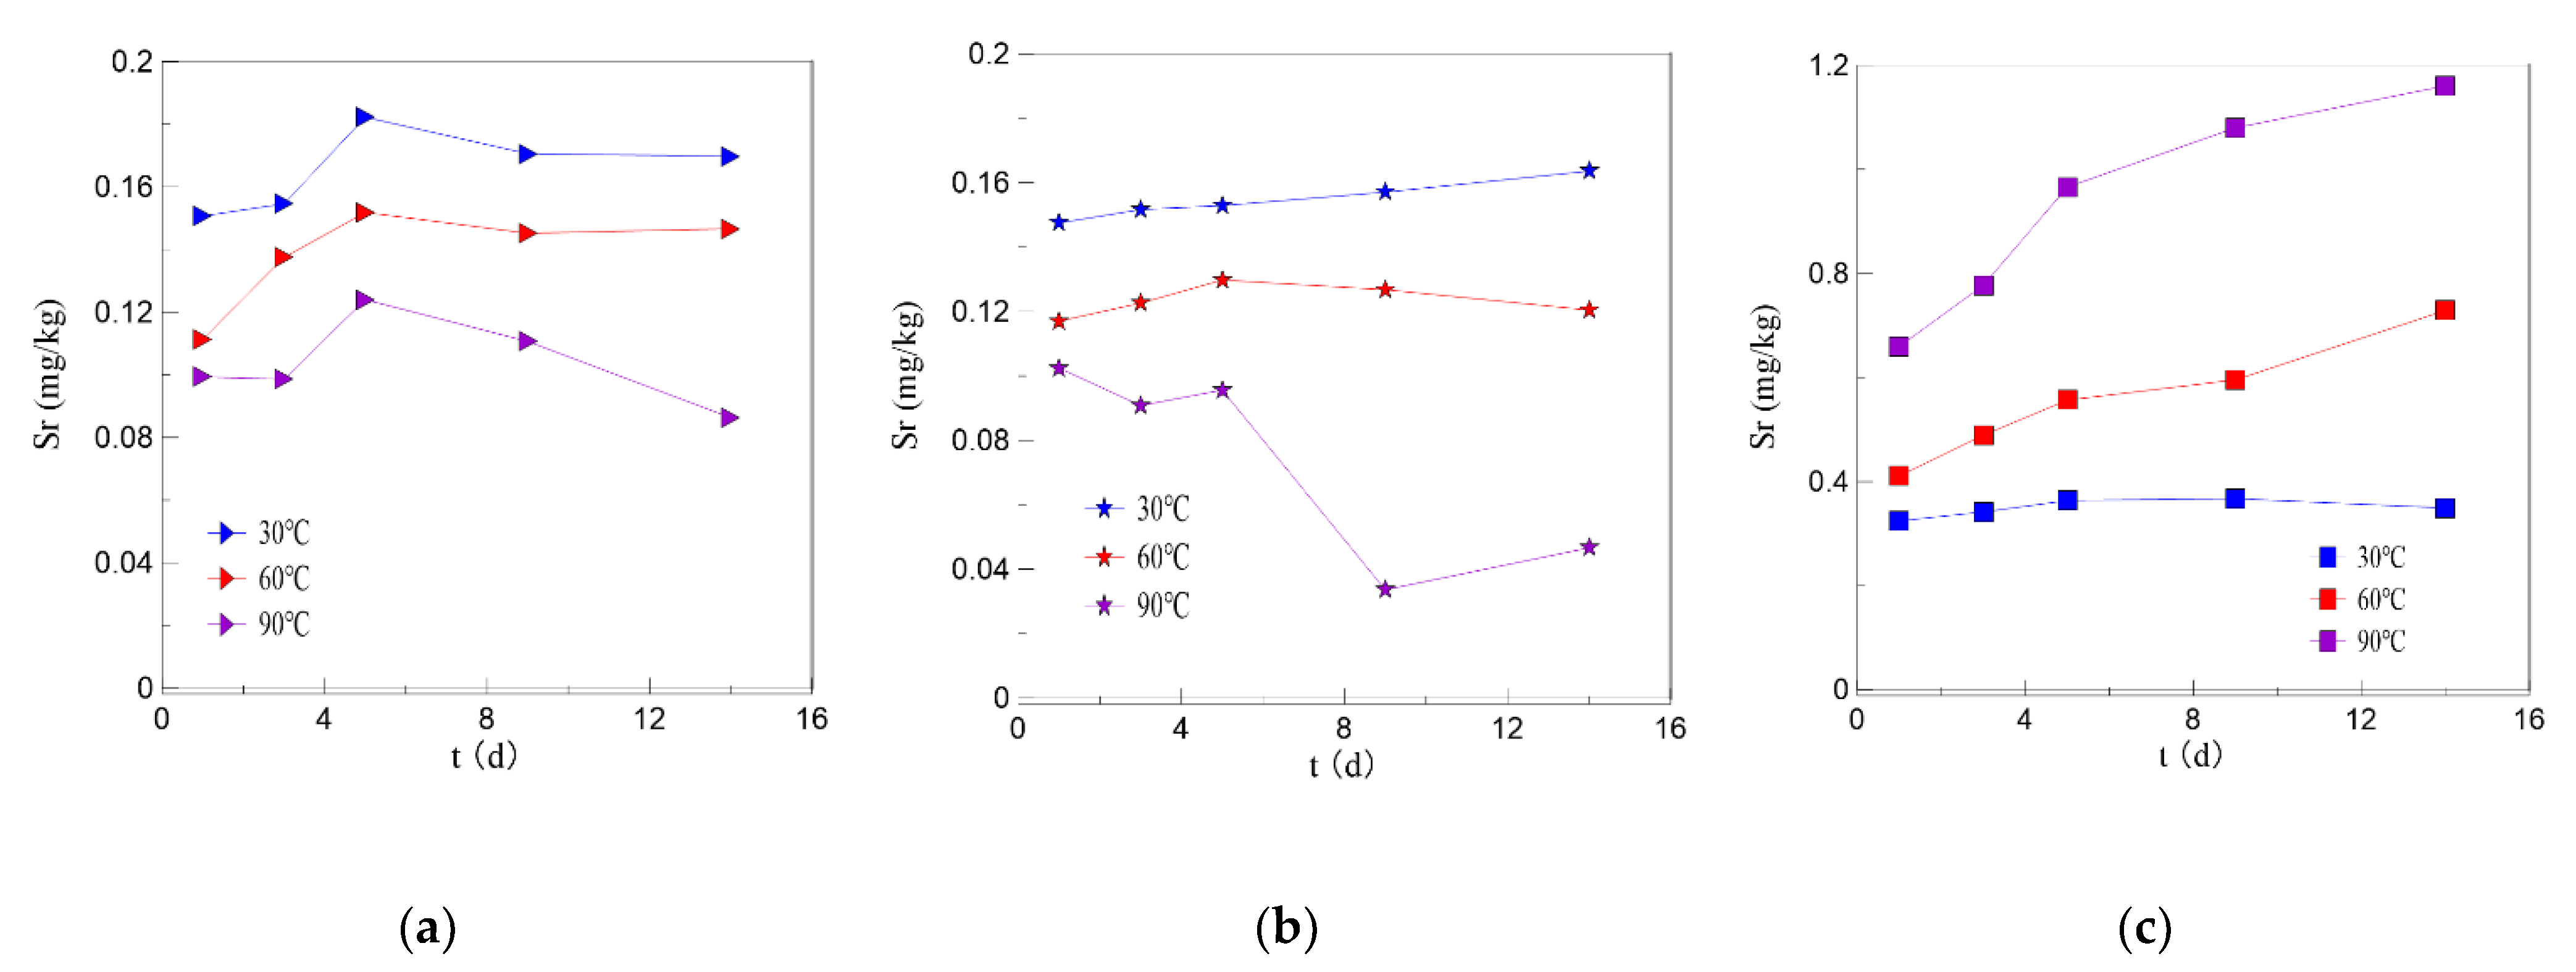
In order to study the impact of temperature on Sr dissolution, a temperature impact experiment was conducted for the three representative samples (AS-LP, PM-KC, and SH-PQ). According to the results of the experiment, a curve showing the changes over time in concentration of Sr dissolved from the samples (Figure 5) was drawn.
As can be seen from Figure 5, the concentration of Sr dissolved from AS-LP followed a rising-equilibrium pattern at each of the temperature gradients of 30, 60, and 90 °C. At 30 °C, the minimum, maximum, and average concentrations were 0.151, 0.182, and 0.166 mg/kg, respectively. At 60 °C, the minimum, maximum, and average concentrations were 0.111, 0.152, and 0.136 mg/kg, respectively. At 90 °C, the minimum, maximum, and average concentrations were only 0.0863, 0.124, and 0.104 mg/kg, respectively. It is clear that at the same point of time, the concentration of dissolved Sr decreased with the rise in temperature. Therefore, it can be assumed that the dissolution of Sr from AS-LP is an exothermic process, and temperature rise is not conducive to the dissolution of Sr from rocks.
At 30 and 60 °C, the change curve for PM-KC is gentler than that for AS-LP. The concentration rose from 0.148 to 0.164 mg/kg at 30 °C and from 0.117 to 0.13 mg/kg at 60 °C. However, at 90 °C, there was a decrease after gradual change. At the same point of time, the concentration of dissolved Sr decreased with the rise in temperature. Therefore, it can also be believed that the dissolution of Sr from PM-KC is an exothermic process, and temperature rise is not conducive to the dissolution of Sr from rocks.
SH-PQ showed a rising-stabilization pattern at 30, 60, and 90 °C, and the higher the temperature, the more obvious the phenomenon. The concentration of dissolved Sr changed within the range of 0.324~0.367 mg/kg at 30 °C, rose from 0.41 to 0.729 mg/kg at 60 °C, and eventually rose from 0.66 to 0.966 mg/kg at 90 °C. Nevertheless, at the same point of time, the concentration of dissolved Sr increased with the rise in temperature, contrary to the results in respect of AS-LP and PM-KC. It is reasonable to believe that the dissolution of Sr from SH-PQ is an endothermic process, and the rise in temperature is conducive to the dissolution of Sr from rocks.
4. Discussion
4.1. Sources of Sr
According to the results of the static leaching experiment, the rock samples from the three study areas with the highest Sr concentration were AS-LP, PM-KC, and SH-PQ, respectively. Based on the characteristics of the rock samples, it can be found that the samples from which the highest amount of Sr was dissolved were those containing higher proportions of calcium, but these samples did not necessarily contain the highest amount of Sr among all samples taken from the corresponding study area (Table 7). This indicates that high Sr content in rocks is a necessary but not sufficient condition for the dissolution of Sr. For example, among samples taken from the Kuancheng study area, HG-KC contained the highest amount of Sr, but under the same conditions, the sample from which the highest amount of Sr was dissolved was PM-KC, and the difference was obvious. Thus, it is reasonable to infer that the leaching of Sr is affected by the state of its occurrence in the rocks.
The three samples from the Luanping study area contained overwhelming proportions of plagioclase and orthoclase, and two extreme states are analyzed below. The first hypothesis is that the Sr in all of the three samples occurred in orthoclase, and the second is that the Sr in all of the three samples occurred in the plagioclase. The samples JL-LP and NH-LP contained about the same amount of orthoclase, and the relationship in terms of Sr content was JL-LP > NH-LP, while the relationship in terms of concentration of leached Sr was JL-LP < NH-LP. Apparently, these facts are not in line with the state assumptions. Since plagioclase hydrolyzes much more easily than orthoclase, it can be proved from the opposite angle that Sr in JL-LP mainly occurred in orthoclase, while Sr in NH-LP mainly occurred in plagioclase. AS-LP contained the highest amount of plagioclase (68%). Among the samples, it contained the highest amount of Sr and was also the sample with the highest concentration of Sr dissolved in the leaching experiment. Therefore, the positive correlations among plagioclase content–Sr element content–concentration of Sr leached can be established, and it can be observed that the source of Sr leached from the sample AS-LP was mainly plagioclase.
Among the three samples from the Kuancheng study area, the relationship in terms of Sr content was HG-KC > PM-KC > HR-KC, while the relationship in terms of concentration of leached Sr was PM-KC > HG-KC > HR-KC. Since the unstable and sub-stable minerals in HG-KC were mainly plagioclase and orthoclase, and plagioclase hydrolyzes much more easily than orthoclase, the source of Sr leached from HG-KC was mainly orthoclase. The unstable and sub-stable minerals in PM-KC were mainly plagioclase and amphibole. As the lattice structure of calcium in amphibole is not suitable for Sr replacement [28], it can be inferred that the source of Sr leached from PM-KC was mainly plagioclase.
The three samples from the Pingquan study area contained overwhelming proportions of calcite and dolomite, both of which are unstable minerals extremely prone to hydrolysis. Therefore, the final concentration of Sr leached was mainly controlled by the Sr content in rock samples, which was verified by the experiment results. Therefore, the positive correlations among “alcite/dolomite content–Sr element content–concentration of Sr leached can be established, and it can be observed that the source of Sr leached from the sample SH-PQ was mainly calcite, while the source of Sr leached from the sample BY-PQ was mainly dolomite.
The source of Sr leached from the DL-PQ sample can be analyzed based on the leaching experiment results. The increase in Sr concentration in the DL-PQ leaching experiment is closer to that in SH-PQ than that in the BY-PQ leaching experiment, while the calcite content in DL-PQ and SH-PQ rock samples is similar. When it is determined that Sr leached from the SH-PQ sample is from calcite, it can also be inferred that Sr leached from the DL-PQ sample is from calcite. The source of Sr leaching from the HR-KC sample can be analyzed by combining it with the leaching experimental data of the PM-KC sample. As the content of plagioclase in the HR-KC sample and PM-KC sample is equivalent, on the premise that the source of Sr leaching from the PM-KC sample is plagioclase, it can be confirmed that the source of Sr leaching from the HR-KC sample is not plagioclase. Combined with the XRD test results of rock samples, it can be inferred the Sr leached by HR-KC may come from mica.
4.2. General Rules of Sr Dissolution under Different Conditions
Impact of CO2: After CO2 injection, the rate constant and dissolution potential of Sr from all of the three representative samples increased, with SH-PQ experiencing the biggest change in rate constant. It can be seen from Figure 6 that the pH value of the three representative samples decreased after CO2 injection; that is, the amount of H+ in water increased. For SH-PQ, CO2 injection increased H+ in water, thus promoting dissolution of calcite [29] and then dissolution of Sr in calcite. The same is true for the dissolution of feldspar among silicate minerals. ZHAO Tong et al. came to the conclusion that anorthite was highly sensitive to CO2 at all temperatures, as CO2 dissolves in water to form carbonic acid and then ionizes to H+ ions, which can significantly promote the dissolution of feldspar minerals, especially anorthite [30,31]. Thus, CO2 injection will accelerate the dissolution of Sr and cause the reaction equilibrium to shift in the direction of dissolution. However, due to the differences between calcite and feldspar minerals in hydrolytic properties and sensitivity to CO2 injection, the Sr dissolution rates and concentrations were different after injection of the same amount of CO2.
Impact of temperature: The experimental results indicate that temperature rise can boost the dissolution of Sr from carbonate minerals but inhibit the dissolution of Sr from silicate minerals. CHI Enxian et al. found that, when anorthite is separately dissolved at normal temperatures, a higher temperature of the solution is conductive to the reaction; however, when it is dissolved together with albite and potassium feldspar, a higher temperature does not inhibit its dissolution [32]. In addition, the rise in temperature will hinder the formation of carbonic acid, which will undermine the contribution of carbonic acid to the dissolution of feldspar (LUO Renjun, 2015). These findings are consistent with the phenomenon in this experiment that the amount of Sr dissolved from AS-LP and PM-KC (both silicate rocks with Sr mainly existing in feldspar) decreased with the rise in temperature within the range of 30~90 °C. LIU Zaihua et al. found that, for calcite, in a 0~90 °C open system (carbon dioxide can be continuously supplemented), with the rise in temperature, equilibrium solubility decreases; however, in a closed system, when the initial partial pressure of carbon dioxide is lower than 100 Pa, the equilibrium Ca2+ concentration increases with the rise in temperature [33,34]. The second finding (closed system) is consistent with the results of this experiment. Given that Sr mineral water is formed in underground space with a high temperature and a relative lack of CO2, a high temperature will promote the dissolution of Sr from carbonate rocks.
5. Conclusions
- (1)
- Lithology has a great impact on the formation of Sr-bearing mineral water. It is noted that the higher the Sr content in rocks, the higher the Sr content in groundwater. The Sr content in the water is jointly controlled by the Sr content in rocks and the characteristics of the minerals in the rocks. The Sr content in groundwater may be more related to the minerals in rocks. A higher content of plagioclase (anorthite) in silicate rock areas is conducive to the leaching of Sr in water, while a higher content of calcite in carbonate rock areas boosts the leaching of Sr in water.
- (2)
- When the external conditions change, the response speeds and degrees of different rock samples are different. CO2 can promote the leaching of Sr from rocks, and CO2 has a greater impact on the leaching of Sr from carbonate minerals than from silicate minerals. The rise in temperature promotes the leaching of Sr from carbonate minerals but inhibits the leaching of Sr from silicate minerals.
- (3)
- Based on the shortcomings of the present experiments, leaching experiments under different redox conditions and selective sequential extraction experiments should be carried out in the future; the influence of artificially changing the chemical balance in the experimental process should be evaluate, and the mineral equivalence of Sr in different rocks should be studied so as to better understand the release mechanism of Sr in the process of water rock interaction.
Author Contributions
Conceptualization, R.W.; methodology, X.W.; writing—original draft preparation, Y.Z.; writing—review and editing, Y.S.; investigation, C.L. and Y.S. All authors have read and agreed to the published version of the manuscript.
Funding
This study was supported by the following projects: the key R&D projects of resources and environment in Hebei Province (Project No.20374207D); scientific research project of Hebei Bureau of Geology and mineral resources exploration and development (Project No.454-0601-YBN-NHMN); scientific research project of Chengde Bureau of Geology and mineral resources exploration and development; geological survey project of China Geological Survey (Project No.DD20190310, DD20190311).
Institutional Review Board Statement
Not applicable.
Informed Consent Statement
Not applicable.
Data Availability Statement
Data are contained within the article.
Acknowledgments
The author would like to thank Shuangqi Wu, director of Chengde Bureau of Geology and mineral resources for his administrative support.
Conflicts of Interest
The authors declare no conflict of interest.
References
- Duo, X.; Mi, M.; Yang, L.; Guo, J.; Xue, J.; Zhou, W.; Zhong, X.; Chen, F.; Zhao, A. Identification characteristics and formation conditions of natural mineral water in Luanping County. Miner. Explor. 2019, 10, 1830–1837. [Google Scholar]
- Niu, X. What benefits does drinking natural mineral water have for human body. Shanghai Geol. 2003, 3, 21–32. [Google Scholar]
- Nebojša, Đ.P.; Simona, J.; Jana, Š.; Danijela, B.M.; Biljana, P.D.; Aleksandar, Ž.K. Assessment of spa mineral water quality from Vrnjačka Banja, Serbia: Geochemical, bacteriological, and health risk aspects. Environ. Monit. Assess. 2019, 191, 11. [Google Scholar]
- Olivera, K.; Suzana, E.; Dušan, P.; Petar, D.; Aleksandar, K. Hydrogeological conditions for the occurrence of two magnesium-rich natural mineral waters in Serbia and their physiological significance. Environ. Earth Sci. 2017, 76, 1–10. [Google Scholar]
- Suzan, P. Hydrogeochemistry of thermal and mineralized waters in the Diyadin (Ağri) area, Eastern Turkey. Appl. Geochem. 2013, 38, 70–81. [Google Scholar]
- Corral, M.M.; Galindo, E.; Ontiveros, C.; Díaz, J.A. Hydrogeochemical areas as background for specific mineral and thermal waters of Spain. Environ. Earth Sci. 2015, 73, 2683–2697. [Google Scholar] [CrossRef]
- Kurchavov, A.M.; Tolmacheva, E.V.; Bogatikov, O.A.; Kotov, A.B. Formation of granitoids of Caucasus Mineral Waters: Evidence from study of melt and fluid inclusions in minerals. Dokl. Earth Sci. 2013, 452, 308–312. [Google Scholar] [CrossRef]
- Wang, L. Origin of the Enrichment Mineral Water in Danjiamiao and the Research on Mining Scheme. Ph.D. Thesis, Hefei University of Technology, Hefei, China, 2017. [Google Scholar]
- Jose, M.M.; Hans, G.M.; Paula, M.C.; Silva, M.A. Origin and Evolution of Cl In CO2-rich thermal and mineral waters from northern Portugal. Appl. Geochem. 2020, 116, 1–9. [Google Scholar]
- Ignacio, S.M. Between chemistry, medicine and leisure: Antonio Casares and the study of mineral waters and Spanish spas in the nineteenth century. Ann. Sci. 2016, 73, 289–302. [Google Scholar]
- Yu, K.; Zheng, S. A discussion on the formational mechanism of compounded, high-quality, Maquanxiang natural mineral water for drinking in Shanxi Province. J. Hebei GEO Univ. 1996, Z1, 373–379. [Google Scholar]
- Liu, Q.; Wang, G.; Zhang, F. Geochemical environment of trace element strontium (Sr) enriched in mineral waters. Hydrogeol. Eng. Geol. 2004, 31, 19–23. [Google Scholar]
- Tanja, P.; Milena, Z.M.; Nebojsa, V.; Dragana, V. Hydrogeological conditions for the forming and quality of mineral waters in Serbia. J. Geochem. Explor. 2010, 107, 373–381. [Google Scholar]
- Ma, Z. Experimental Study on Formation Mechanism of Mineral Water in Jingyu County. Ph.D. Thesis, Jilin University, Changchun, China, 2016. [Google Scholar]
- Baizhong, Y.; Changlai, X.; Xiujuan, L.; Runchu, W.; Shili, W. Characteristics and genesis of mineral water from Changbai Mountain, Northeast China. Environ. Earth Sci. 2015, 73, 4819–4829. [Google Scholar]
- Vinograd, N.; Porowski, A. Application of isotopic and geochemical studies to explain the origin and formation of mineral waters of Staraya Russa Spa, NW Russia. Environ. Earth Sci. 2020, 79, 1–17. [Google Scholar] [CrossRef]
- Sun, H.; Wei, X.; Gan, F.; Wang, H.; Jia, F.; He, Z.; Li, D.; Li, J.; Zhang, J. Genetic type and formation mechanism of strontium-rich groundwater in the upper and middle reaches of Luanhe river basin. Acta Geosci. Sin. 2020, 41, 65–79. [Google Scholar]
- Yan, Z.; Hao, H. Cause analysis of strontium type mineral water in Jinan. Water Res. Sci. Technol. Shandong 2017, 11, 12–13. [Google Scholar]
- Su, H.; Yang, R.; Duo, X.; Zhao, Q.; Sun, Z.; Zhao, H. Distribution rules and geochemical conditions of mineral water resources in Chengde city. Geol. Chem. Miner. 2019, 41, 27–34. [Google Scholar]
- Qian, Y.; Chen, Y.; Chen, Q.; You, D.; Zou, S. General characteristics of burial dissolution for Ordovician carbonate reservoirs in the northwest of Tazhong area. Acta Petrolei Sin. 2006, 27, 47–52. [Google Scholar]
- Zhu, X.; Liu, W.; Li, Z.; Chen, T.; Ren, Y.; Shao, H.; Wang, L. Distribution and characterization analyses of strontium-bearing mineral spring water in the Chengde region. Hydrogeol. Eng. Geol. 2020, 47, 65–73. [Google Scholar]
- Li, G.; Liu, Z.; Xie, Z.; Duan, Y.; He, S.; Deng, M.; Wang, Y.; Li, Y.; Wu, Z. Discovery of non-hydrothermal saddle-shaped dolomite in Leikoupo formation, western Sichuan basin and its significance. Oil Gas Geol. 2020, 41, 164–176. [Google Scholar]
- Wen, Z.; Xu, X.; Zhao, R.; Wang, F.; Hu, W. Geologic and geochemical features of Devonian granites in Dangchuan area, western Qinling, and its tectonic significance. Geol. Rev. 2008, 54, 827–836. [Google Scholar]
- Shi, H.; Miao, W.; Zhang, X.; Li, W.; Tang, Q.; Li, Y. Geochemical characteristics and ore-forming material source of celestite deposits in Dafeng Mountain, northwestern Qaidam basin. Acta Geol. Sin. 2018, 92, 1733–1752. [Google Scholar]
- Yan, B.; Xiao, C.; Liang, X.; Ma, Z.; Wei, R.; Wu, S. Experiment on the characteristics component (H2SiO3) of the mineral water in the basalt in Jingyu County: A case study of Wangdashan spring. J. Jilin Univ. 2015, 45, 892–898. [Google Scholar]
- George, S.; Legg, J.O.; Smith, S.J. Soil nitrogen availability evaluations based on nitrogen mineralization potentials of soils and uptake of labeled and unlabeled nitrogen by plants. Plant Soil. 1973, 39, 113–124. [Google Scholar]
- Haiyan, Z.; Yuesuo, Y.; Heyang, Q.; Ying, L.; Tong, Y. Hydrochemical evolution of rare cold mineral waters in the Wudalianchi UNESCO Global Geopark, China. Environ. Earth Sci. 2018, 77, 1–11. [Google Scholar]
- Yue, W. Analysis for Amphibole Characteristics and Provenances of Typical Rivers in Northern China. Ph.D. Thesis, Ludong University, Yantai, China, 2012. [Google Scholar]
- Huang, S.; Zhang, X.; Liu, L.; Huan, J.; Huang, K. Progress of research on carbonate diagenesis. Earth Sci. Front. 2009, 16, 219–231. [Google Scholar]
- Zhao, T.; Yan, Z.; Zhang, J.; Wang, Y.; Jiang, L. PHREEQC-based Simulation of Impact of Temperature and CO2 on Feldspar Mineral Solubility. Guangxi J. Light Ind. 2016, 3, 84–86. [Google Scholar]
- Carreira, P.M.; Marques, J.M.; Carvalho, M.R.; Nunes, D.; Silva, M.A. Carbon isotopes and geochemical processes in CO2-rich cold mineral water, N-Portugal. Environ. Earth Sci. 2014, 71, 2941–2953. [Google Scholar] [CrossRef]
- Chi, E.; Lan, B.; Xiao, Y. Impact of temperature and CO2 in solution on feldspar solubility. J. Water Res. Water Eng. 2014, 25, 230–232. [Google Scholar]
- Liu, Z.; Han, J.; Li, H. Equilibrium chemistry of the CaCO3-CO2-H2O system and discussions. Carsol. Sin. 2005, 24, 1–14. [Google Scholar]
- Vannucci, L.; Fossi, C.; Quattrini, S.; Guasti, L.; Pampaloni, B.; Gronchi, G.; Giusti, F.; Romagnoli, C.; Cianferotti, L.; Marcucci, G.; et al. Calcium Intake in Bone Health: A Focus on Calcium-Rich Mineral Waters. Nutrients 2018, 10, 1930. [Google Scholar] [CrossRef] [PubMed] [Green Version]
Figure 1.
Locations of the study areas.

Figure 2.
Curves showing changes in concentrations of Sr dissolved from rock samples: (a) Luanping study area; (b) Kuancheng study area; (c) Pingquan study area.
Figure 2.
Curves showing changes in concentrations of Sr dissolved from rock samples: (a) Luanping study area; (b) Kuancheng study area; (c) Pingquan study area.

Figure 3.
Curves showing changes in concentrations of Sr dissolved from all rock samples in the static leaching experiment.
Figure 3.
Curves showing changes in concentrations of Sr dissolved from all rock samples in the static leaching experiment.

Figure 4.
Curves showing changes in concentrations of Sr dissolved from representative rock samples in the CO2 injection experiment.
Figure 4.
Curves showing changes in concentrations of Sr dissolved from representative rock samples in the CO2 injection experiment.

Figure 5.
Curves showing changes in concentrations of Sr dissolved over time at different temperatures: (a) AS-LP; (b) PM-KC; (c) SH-PQ.
Figure 5.
Curves showing changes in concentrations of Sr dissolved over time at different temperatures: (a) AS-LP; (b) PM-KC; (c) SH-PQ.

Figure 6.
Variation trend of pH value in experiment of representative samples: (a) static leaching experiment; (b) CO2 impact experiment.
Figure 6.
Variation trend of pH value in experiment of representative samples: (a) static leaching experiment; (b) CO2 impact experiment.


Table 1.
Rock samples collected for experimental study 1.
| Sampling Site | No. | Field Name | Name Used in Laboratory | Standard Symbol |
|---|---|---|---|---|
| Majiazhuang Village, Changshanyu Town, Luanping County | JL-LP | Breccia | Welded breccia | ib |
| AS-LP | Andesite | Trachyandensite | α | |
| NH-LP | Tuff | Crystal tuff | tf | |
| Miaoling Village, East Huanghuachuan Township, Kuancheng County | HG-KC | Granite | Plagiogranite | γ |
| HR-KC | Hybrid rock | Mica schist | sch | |
| PM-KC | Gneiss | Hornblende plagiogneiss | gn | |
| Yong’an Village, Dangba Town, Pingquan County | DL-PQ | Marble | Dolomitic marble | mb |
| SH-PQ | Limestone | Micrite | ls | |
| BY-PQ | Dolomite | Fine crystalline dolomite | dol |
Table 2.
Results of analysis of mineral components of rock samples (%).
| No. | HG-KC | HR-KC | PM-KC | JL-LP | AS-LP | NH-LP | SH-PQ | BY-PQ | DL-PQ |
|---|---|---|---|---|---|---|---|---|---|
| Chlorite | 1 | 1 | 14 | 0 | 3 | 0 | 0 | 0 | 0 |
| Plagioclase | 52 | 27 | 26 | 37 | 68 | 36 | 0 | 0 | 0 |
| Orthoclase | 26 | 6 | 4 | 22 | 19 | 20 | 0 | 0 | 0 |
| Quartz | 17 | 26 | 0 | 36 | 6 | 39 | 2 | 1 | 1 |
| Mica | 4 | 35 | 0 | 4 | 0 | 0 | 0 | 0 | 0 |
| Amphibole | 0 | 5 | 56 | 0 | 0 | 0 | 0 | 0 | 0 |
| Hematite | 0 | 0 | 0 | 1 | 1 | 1 | 0 | 0 | 0 |
| Pyroxene | 0 | 0 | 0 | 0 | 3 | 4 | 0 | 0 | 0 |
| Calcite | 0 | 0 | 0 | 0 | 0 | 0 | 90 | 1 | 74 |
| Dolomite | 0 | 0 | 0 | 0 | 0 | 0 | 8 | 98 | 25 |
Table 3.
Results of analysis of elements in rock samples.
| Study Area | No. | Sr (mg/kg) | SD-Sr (mg/kg) | Zn (mg/kg) | SD-Zn (mg/kg) | Fe (mg/kg) | SD-Fe (mg/kg) | Ca (mg/kg) | SD-Ca (mg/kg) | K (mg/kg) | SD-K (mg/kg) | Ba (mg/kg) | SD-Ba |
|---|---|---|---|---|---|---|---|---|---|---|---|---|---|
| Detection limits | 3 | 10 | 25 | 40 | 45 | 45 | |||||||
| Luanping | JL-LP | 119 | 1.25 | 61 | 2.81 | 17,100 | 77.81 | 2060 | 28.84 | 14,200 | 90.03 | 594 | 12.18 |
| AS-LP | 454 | 2.53 | 90 | 3.48 | 44,000 | 181.28 | 12,500 | 160 | 12,200 | 106.75 | 1650 | 16.38 | |
| NH-LP | 86.1 | 1.00 | 47.5 | 2.42 | 6100 | 35.87 | 817 | 19.61 | 13,200 | 81.84 | - | - | |
| Kuancheng | HG-KC | 820 | 3.20 | 51.3 | 2.78 | 14,500 | 80.91 | 6360 | 41.91 | 13,100 | 92.35 | 2150 | 16.06 |
| HR-KC | 394 | 2.19 | 52.5 | 2.73 | 18,800 | 82.34 | 3500 | 34.3 | 13,700 | 96.59 | 1420 | 15.05 | |
| PM-KC | 671 | 3.33 | 146 | 4.53 | 83,600 | 237.42 | 32,700 | 283.51 | 45,600 | 72.50 | 937 | 16.96 | |
| Pingquan | DL-PQ | 178 | 1.57 | 22.1 | 2.48 | 971 | 18.25 | 320,000 | 736 | 232 | 52.43 | 303 | 15.42 |
| SH-PQ | 298 | 1.11 | 23.1 | 1.37 | 1190 | 10.96 | 302,000 | 398.64 | 778 | 31.66 | 50.2 | 10.74 | |
| BY-PQ | 52.8 | 0.70 | 19.4 | 1.77 | 5090 | 28.35 | 138,000 | 387.78 | 1000 | 40.4 | 80 | 13.04 | |
Table 4.
Sr equilibrium concentrations after static leaching from nine samples with different lithology.
Table 4.
Sr equilibrium concentrations after static leaching from nine samples with different lithology.
| Study Area | Sample No.—Sr Equilibrium Concentration (mg/kg) | ||
|---|---|---|---|
| Luanping | JL-LP—0.02449 | AS-LP—0.209 | NH-LP—0.0435 |
| Kuancheng | HG-KC—0.0625 | HR-KC—0.0275 | PM-KC—0.133 |
| Pingquan | DL-PQ—0.311 | SH-PQ—0.432 | BY-PQ—0.0891 |
Table 5.
Equations fitted to concentrations of Sr dissolved from representative rock samples in the CO2 injection experiment.
Table 5.
Equations fitted to concentrations of Sr dissolved from representative rock samples in the CO2 injection experiment.
| Sample No. | M0 (mg/kg) | km (d−1) | Fitted Equation | Coefficient of Determination R2 |
|---|---|---|---|---|
| AS-LP | 0.765 | 0.0784 | Mt = 765[1 − e(−0.0784t)] | 0.911 |
| PM-KC | 0.494 | 0.135 | Mt = 494[1 − e(−0.135t)] | 0.904 |
| SH-PQ | 0.923 | 0.195 | Mt = 923[1 − e(−0.195t)] | 0.472 |
Table 6.
Comparison of the CO2 injection experiment and static leaching experiment for representative rock samples.
Table 6.
Comparison of the CO2 injection experiment and static leaching experiment for representative rock samples.
| No. | Static Leaching Experiment | CO2 Injection Experiment | ||
|---|---|---|---|---|
| Dissolution Potential (mg/kg) | Rate Constant (d−1) | Dissolution Potential (mg/kg) | Rate Constant (d−1) | |
| AS-LP | 0.21 | 0.0622 | 0.765 | 0.0784 |
| PM-KC | 0.134 | 0.114 | 0.494 | 0.135 |
| SH-PQ | 0.433 | 0.0495 | 0.923 | 0.195 |
Table 7.
Comparison of different samples’ Sr content and Sr equilibrium concentration in the static leaching experiment.
Table 7.
Comparison of different samples’ Sr content and Sr equilibrium concentration in the static leaching experiment.
| Study Area | No. | Element Content | Static Leaching Experiment | |||
|---|---|---|---|---|---|---|
| Sr (mg/kg) | Ca (mg/kg) | Sr Equilibrium Concentration (mg/kg) | Overall Ranking | Ranking among Samples in the Study Area | ||
| Luanping | JL-LP | 119 | 2060 | 0.02449 | 9 | 3 |
| AS-LP | 454 | 12,500 | 0.209 | 3 | 1 | |
| NH-LP | 86.1 | 817 | 0.0435 | 7 | 2 | |
| Kuancheng | HG-KC | 820 | 6360 | 0.0625 | 6 | 2 |
| HR-KC | 394 | 3500 | 0.0275 | 8 | 3 | |
| PM-KC | 671 | 32,700 | 0.133 | 4 | 1 | |
| Pingquan | DL-PQ | 178 | 320,000 | 0.311 | 2 | 2 |
| SH-PQ | 298 | 302,000 | 0.432 | 1 | 1 | |
| BY-PQ | 52.8 | 138,000 | 0.0891 | 5 | 3 | |
Publisher’s Note: MDPI stays neutral with regard to jurisdictional claims in published maps and institutional affiliations. |
© 2021 by the authors. Licensee MDPI, Basel, Switzerland. This article is an open access article distributed under the terms and conditions of the Creative Commons Attribution (CC BY) license (http://creativecommons.org/licenses/by/4.0/).
Share and Cite
MDPI and ACS Style
Wang, R.; Wu, X.; Zhai, Y.; Su, Y.; Liu, C. An Experimental Study on the Sources of Strontium in Mineral Water and General Rules of Its Dissolution—A Case Study of Chengde, Hebei. Water 2021, 13, 699. https://doi.org/10.3390/w13050699
AMA Style
Wang R, Wu X, Zhai Y, Su Y, Liu C. An Experimental Study on the Sources of Strontium in Mineral Water and General Rules of Its Dissolution—A Case Study of Chengde, Hebei. Water. 2021; 13(5):699. https://doi.org/10.3390/w13050699
Chicago/Turabian StyleWang, Ruifeng, Xiong Wu, Yanliang Zhai, Yuxuan Su, and Chenhui Liu. 2021. "An Experimental Study on the Sources of Strontium in Mineral Water and General Rules of Its Dissolution—A Case Study of Chengde, Hebei" Water 13, no. 5: 699. https://doi.org/10.3390/w13050699
Note that from the first issue of 2016, this journal uses article numbers instead of page numbers. See further details here.