
Integrating GIS-Based MCDA Techniques and the SCS-CN Method for Identifying Potential Zones for Rainwater Harvesting in a Semi-Arid Area


Department of Agricultural Engineering, College of Food and Agriculture Sciences, King Saud University, P.O. Box 2460, Riyadh 11451, Saudi Arabia
*
Author to whom correspondence should be addressed.
Water 2021, 13(5), 704; https://doi.org/10.3390/w13050704
Submission received: 8 February 2021
/
Revised: 3 March 2021
/
Accepted: 3 March 2021
/
Published: 5 March 2021
(This article belongs to the Section Hydrology)
Abstract
:An increasing scarcity of water, as well as rapid global climate change, requires more effective water conservation alternatives. One promising alternative is rainwater harvesting (RWH). Nevertheless, the evaluation of RWH potential together with the selection of appropriate sites for RWH structures is significantly difficult for the water managers. This study deals with this difficulty by identifying RWH potential areas and sites for RWH structures utilizing geospatial and multi-criteria decision analysis (MCDA) techniques. The conventional data and remote sensing data were employed to set up needed thematic layers using ArcGIS software. The soil conservation service curve number (SCS-CN) method was used to determine surface runoff, centered on which yearly runoff potential map was produced in the ArcGIS environment. Thematic layers such as drainage density, slope, land use/cover, and runoff were allotted appropriate weights to produced RWH potential areas and zones appropriate for RWH structures maps of the study location. Results analysis revealed that the outcomes of the spatial allocation of yearly surface runoff depth ranging from 83 to 295 mm. Moreover, RWH potential areas results showed that the study areas can be categorized into three RWH potential areas: (a) low suitability, (b) medium suitability, and (c) high suitability. Nearly 40% of the watershed zone falls within medium and high suitability RWH potential areas. It is deduced that the integrated MCDA and geospatial techniques provide a valuable and formidable resource for the strategizing of RWH within the study zones.
1. Introduction
In many countries around the world, water shortage is the main challenge, especially in developing countries [1]. In the contemporary world, the freshwater supply is rapidly declining because of urbanization, mass industrialization, and groundwater overexploitation. Besides, the change of soil characteristics has contributed to deforestation and soil erosion [2]. Therefore, an immediate change and a better water management system are critical.
One way of managing water scarcity is rainwater harvesting (RWH), ensuring safe, affordable, and accessible water for drinking and domestic use [3]. RWH is extremely valuable, especially in dry areas, to address water shortage, reduce groundwater extraction, increase crop yields, increase growth and development of pastures, combat erosion, and conserve water resources [4]. RWH is defined as the collection, storage, distribution, and use of rainwater. RWH includes techniques for collecting and storing runoff from rainwater for domestic and agricultural use in the wider sense [5]. RWH benefits include decreased runoff, flood protection in upstream areas, soil moisture improvement, and soil conservation [1].
Several nations in Southeast Asia, Africa, and the Middle East have planned and developed methods for collecting, storing, and consuming rainwater for agricultural activities [6]. Innovative new techniques have been employed to enable RWH, which is the most abundant water resource available. In areas receiving a relatively small amount of rainfall, the method for prioritizing, assessing, and preparing RWH becomes significant [7,8]. In semi-arid areas, however, identifying potential RWH zones is crucial in rising water supply and land productivity.
The six considerations that are important in RWH site selection are hydrology, climate, agronomy, topography, soil, and socioeconomic conditions [9]. The issues and factors influencing the sustainability and reliability of RWH systems are variabilities in rainfall, quantity and quality of runoff, and institutional support [10]. Various rainfall-runoff models are widely used in practice, such as the artificial neural network-based model [11], water balance approach [1,12], the rational method [13], and soil conservation service curve number (SCS-CN) method [14,15,16], to find the potential of RWH zones. Among these methods, the SCS-CN method is the most widely used and suitable for estimating runoff events [17]. This method considers many factors affecting runoff generation, including rainfall, soil type, land use/cover, and antecedent moisture conditions, which are incorporated into a single curve number (CN) parameter [18,19,20,21].
Continued application of the geographic information system (GIS) and remote sensing (RS) to site selection has channeled increased attention to these two technologies. Besides GIS, RS, and SCS-CN techniques, other available metrics, such as the analytic hierarchy process (AHP), have been cited for weighting thematic data layers and generating runoff potential in the site-suitability analysis [1,22]. AHP is a multi-criteria decision-making tool providing a structured technique based on mathematics and expert knowledge to organize and analyze complex decisions [23].
Several studies have applied AHP, RS, and GIS techniques to study land suitability for RWH [24,25,26]. For example, Tiwari et al. [17] used RS and a GIS-based SCS-CN method to assess the runoff and RWH structures sites. They found that earthworks could be reduced in cost and become a means for cost-effective water resource management. Singh et al. [27] utilized a GIS-based multi-criteria decision analysis (MCDA) method. They reported that GIS and multi-criteria methods are time-saving, cost-effective, and extremely effective for planning and managing water resources on larger scales. In a study by Wu et al. [28], GIS proved to be a useful tool in prioritizing RWH sites in Northeastern Guatemala. Similarly, Al-Ghobari et al. [29] implemented the SCS-CN approach integrated with GIS and RS to estimate runoff from the western area of Saudi Arabia. They reported that SCS-CN, in combination with RS and GIS, deserved more consideration for better basin management and conservation. Shadeed and Almasri [30] also used GIS with SCS-CN to estimate runoff volumes in the West Bank catchments, Palestine. They showed that the integration of GIS and SCS-CN gives a highly effective tool for estimating runoff. This study prioritizes the area suitable for RWH and RWH structures by incorporating the rainfall-runoff modeling, RS, and GIS-Based MCDA.
2. Materials and Methods
2.1. Study Location
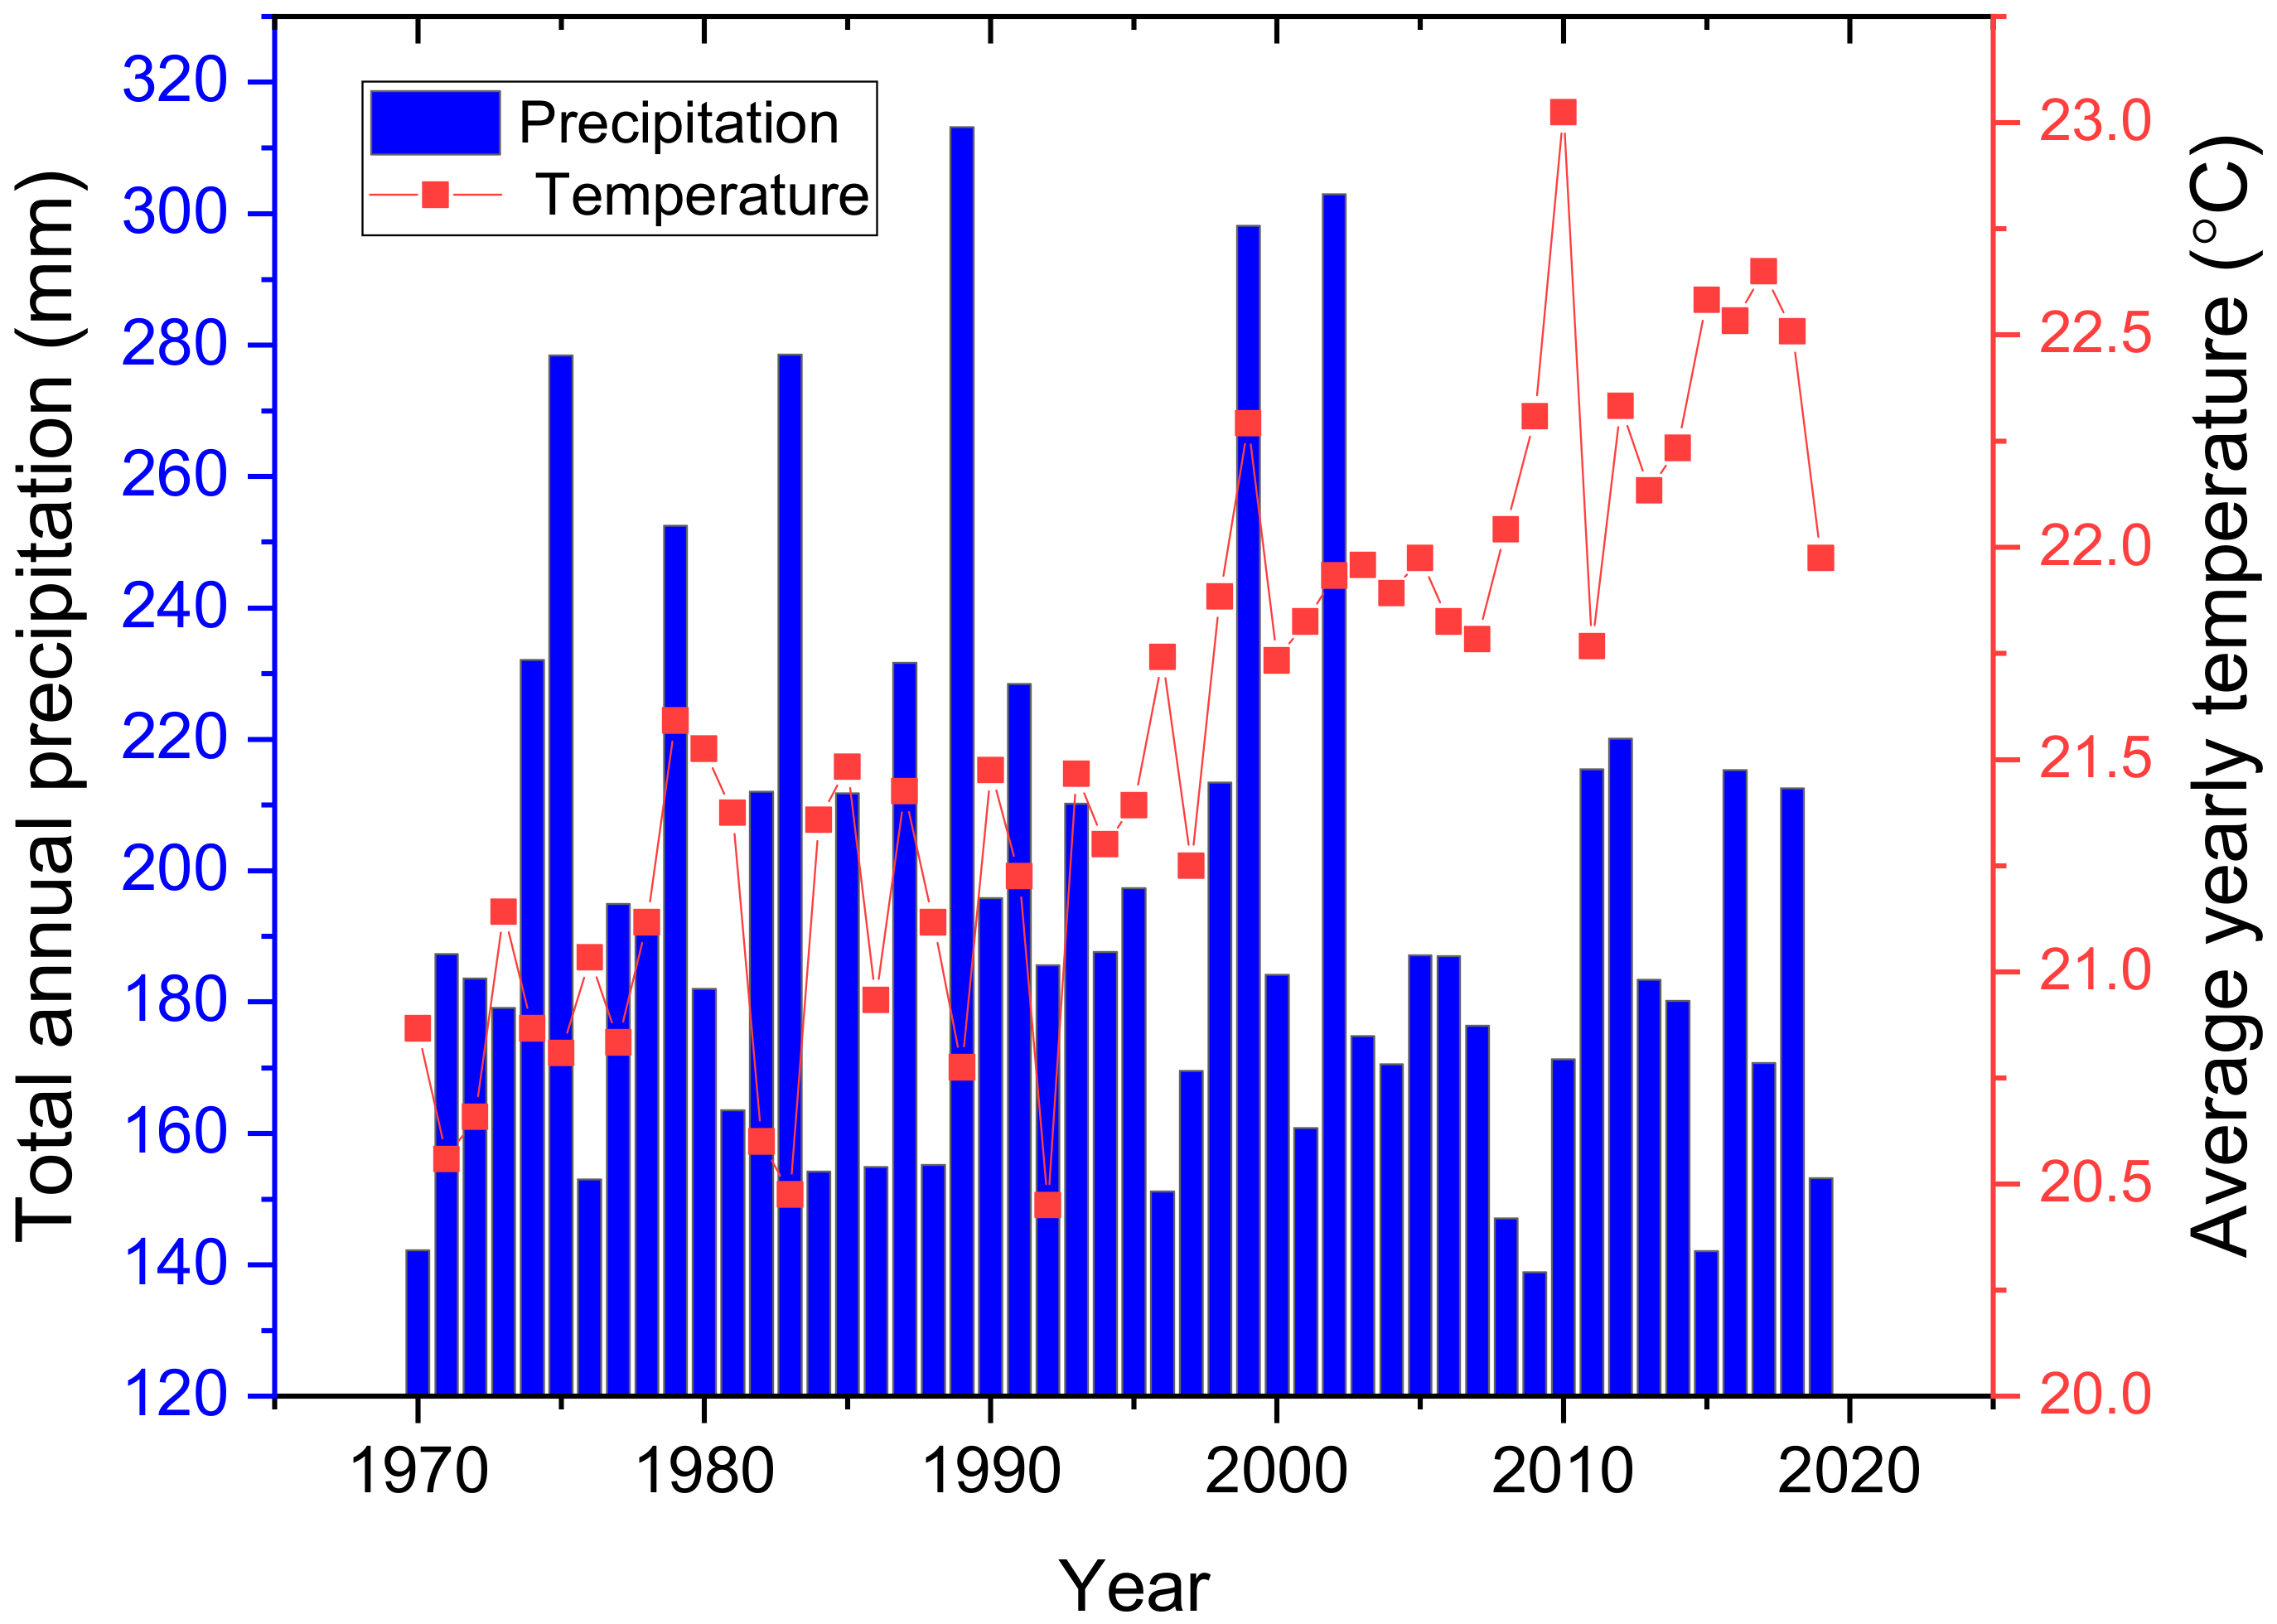
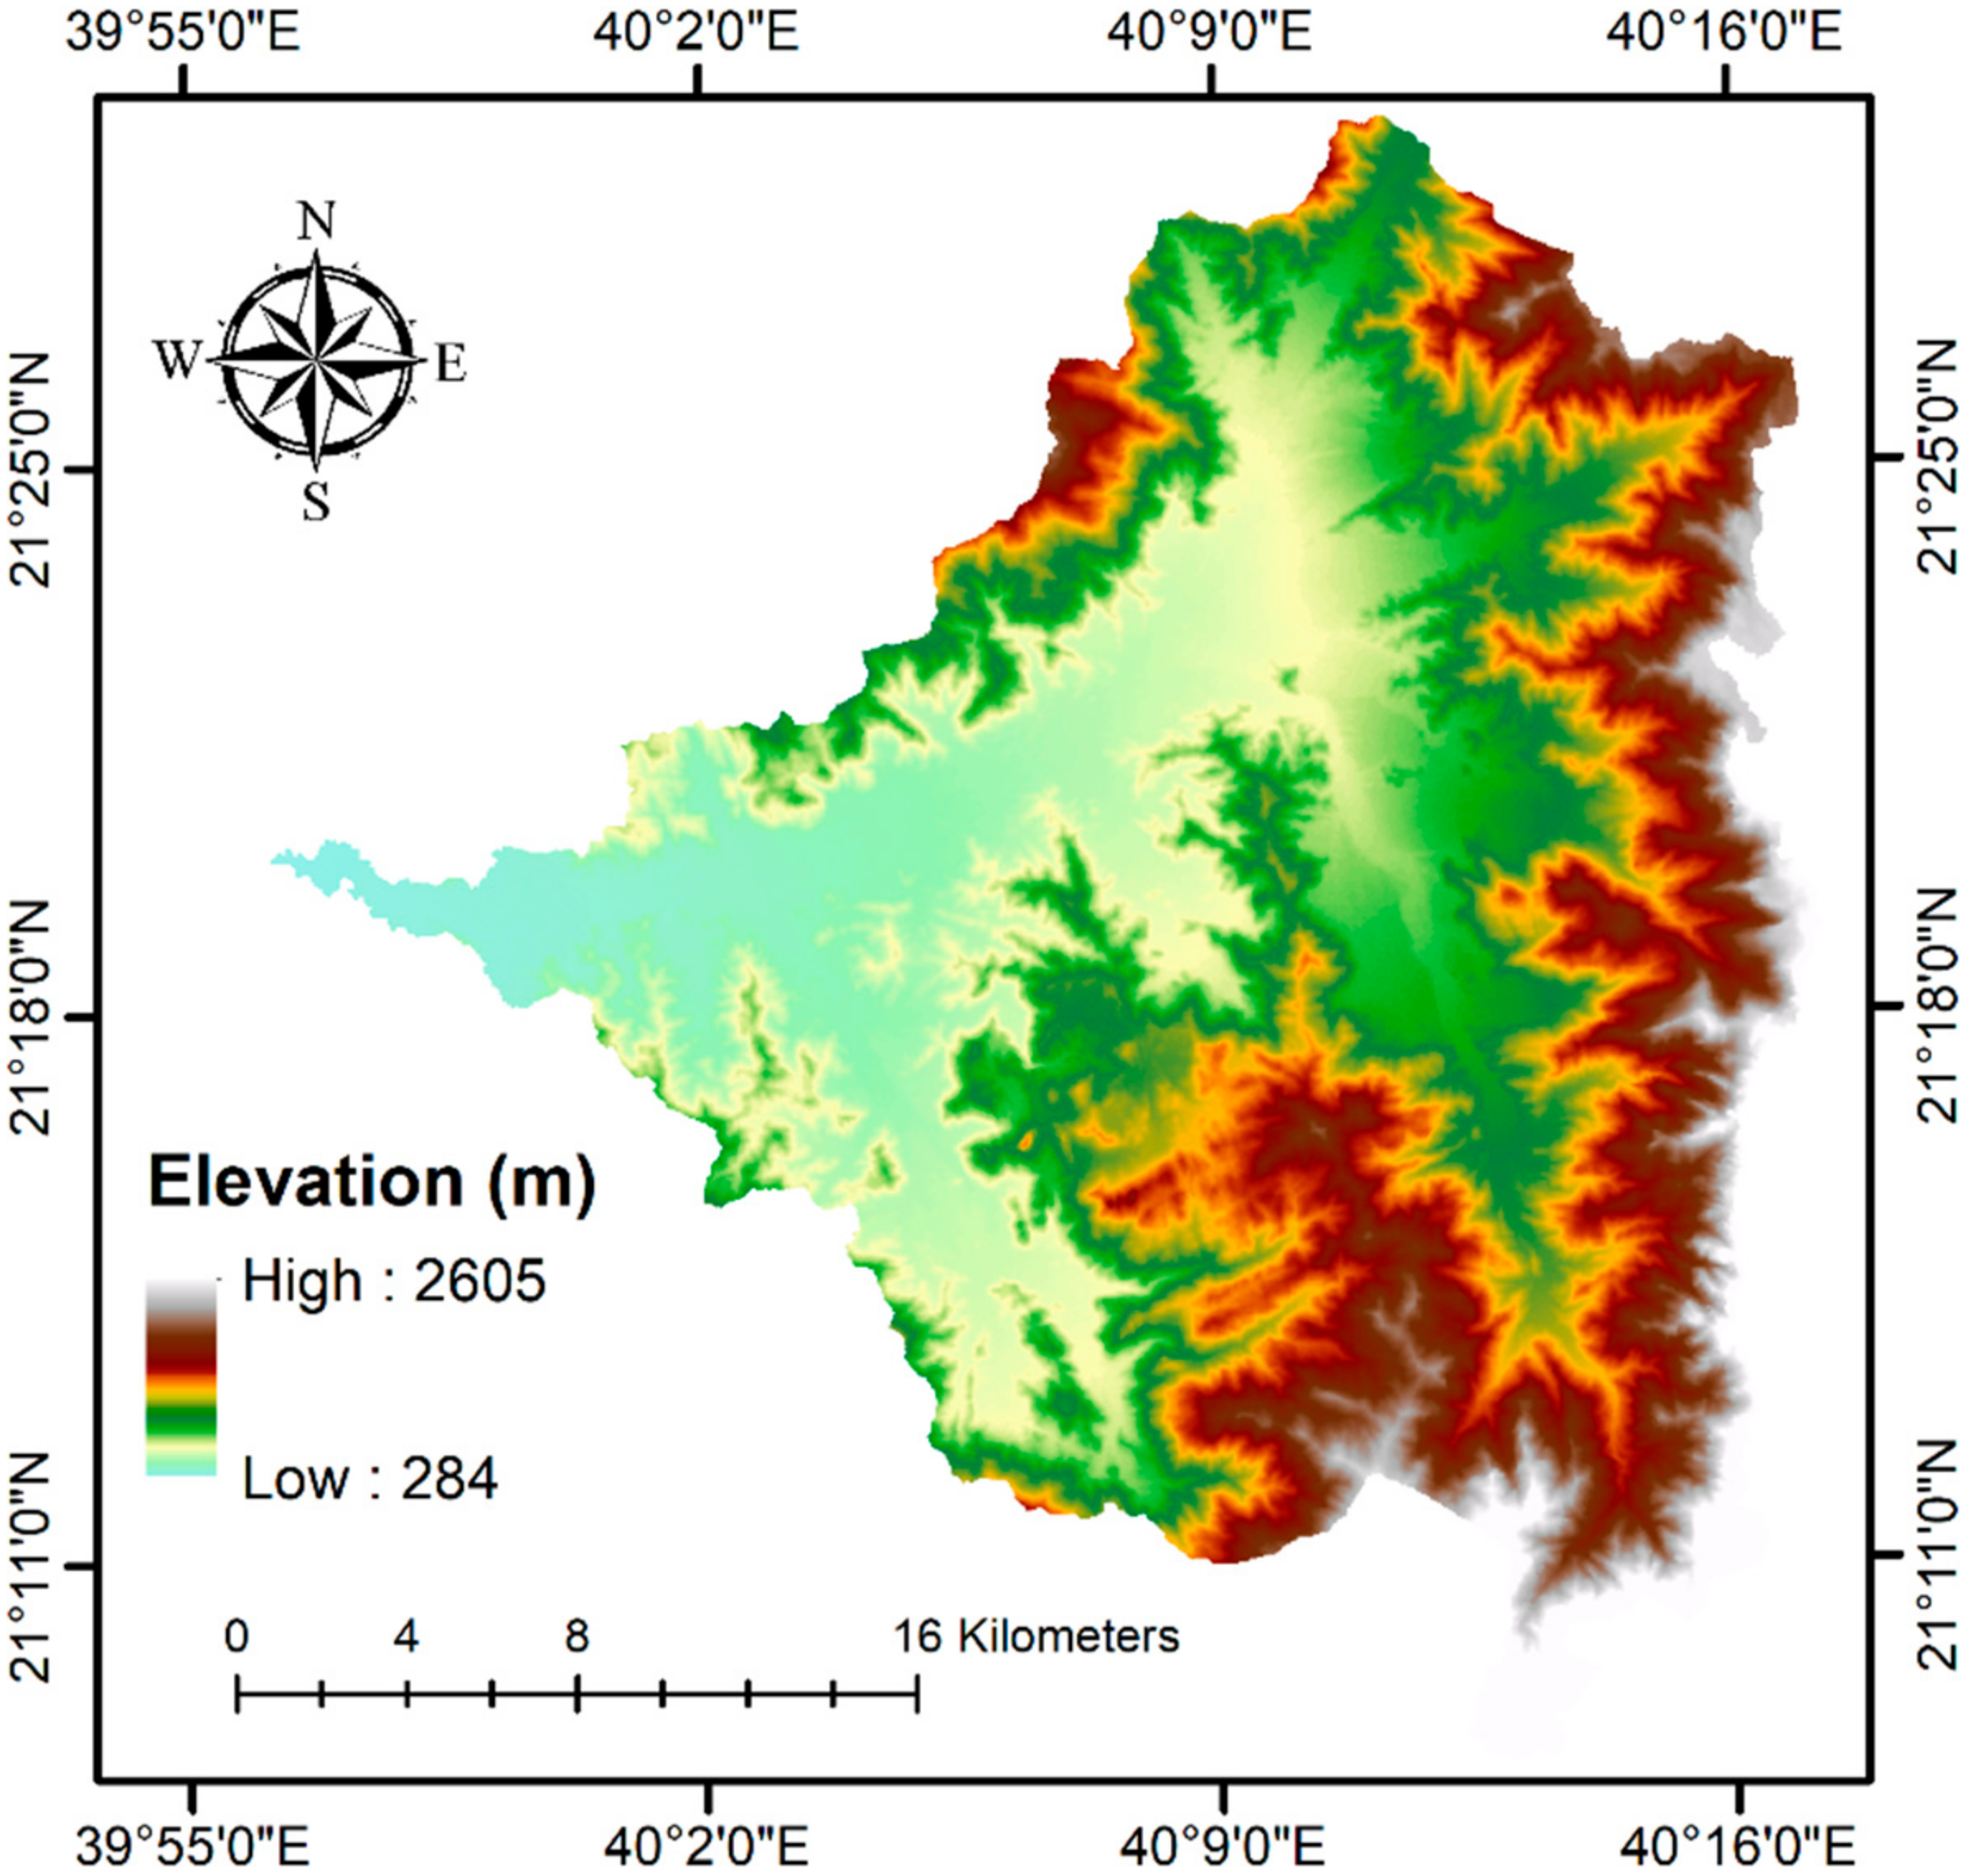
This study was carried out at the Wadi Nu’man watershed in the Western region of Saudi Arabia (Figure 1). The watershed is geographically located within the latitude ranges of 21°9′0″ N to 21°29′0″ N and longitude of 39°55′0″ E to 40°17′0″ E. The Wadi Nu’man watershed encompasses an overall area of nearly ~681 km2 with an average elevation of 941 m above mean sea level. In terms of physiography, the watershed is split into agricultural, barren, urban, and mountainous areas. The area has cold winters and hot summers. The area’s typical temperature varies with altitudes, denoting that the mountains are colder and the plains are warmer. The temperature fluctuates between 18 to 40 degrees Celsius, with an average annual temperature of 29 °C [31]. The average annual precipitation is 197 mm, with a rainy season lasting from November to January [31]. Figure 2 displays the area’s yearly average precipitation and temperature, as per the 50-year record from 1969 to 2019. High temperatures and low precipitation along with a high variability of these two factors increase evapotranspiration and cause mechanical weathering damage to the soil. These unfavorable conditions affect the agricultural sector and water supplies in Saudi Arabia, which makes the country a very poor place in terms of agricultural potential and water resources. Climatic conditions in Saudi Arabia could be adversely affected by any rise in temperature, decrease in precipitation, or change in their variability. Future climatic conditions could have deleterious effects in various locations, including water supply for agricultural, residential, and municipal use.
2.2. Criteria Selection
The six principal factors listed by the Food and Agriculture Organization (FAO) for selecting potential RWH zones are climate, hydrology, topography, agronomy, soils, and socioeconomics [9,32]. Accordingly, the basic thematic layers in this study were rainfall, soil texture, land use/cover, slope, and drainage network. The choice of layers was intended to satisfy the rainfall-runoff model’s requirements. However, socioeconomic factors were not considered due to the lack of data and to make the interpretation of the results easier.
2.3. Datasets and Methodology
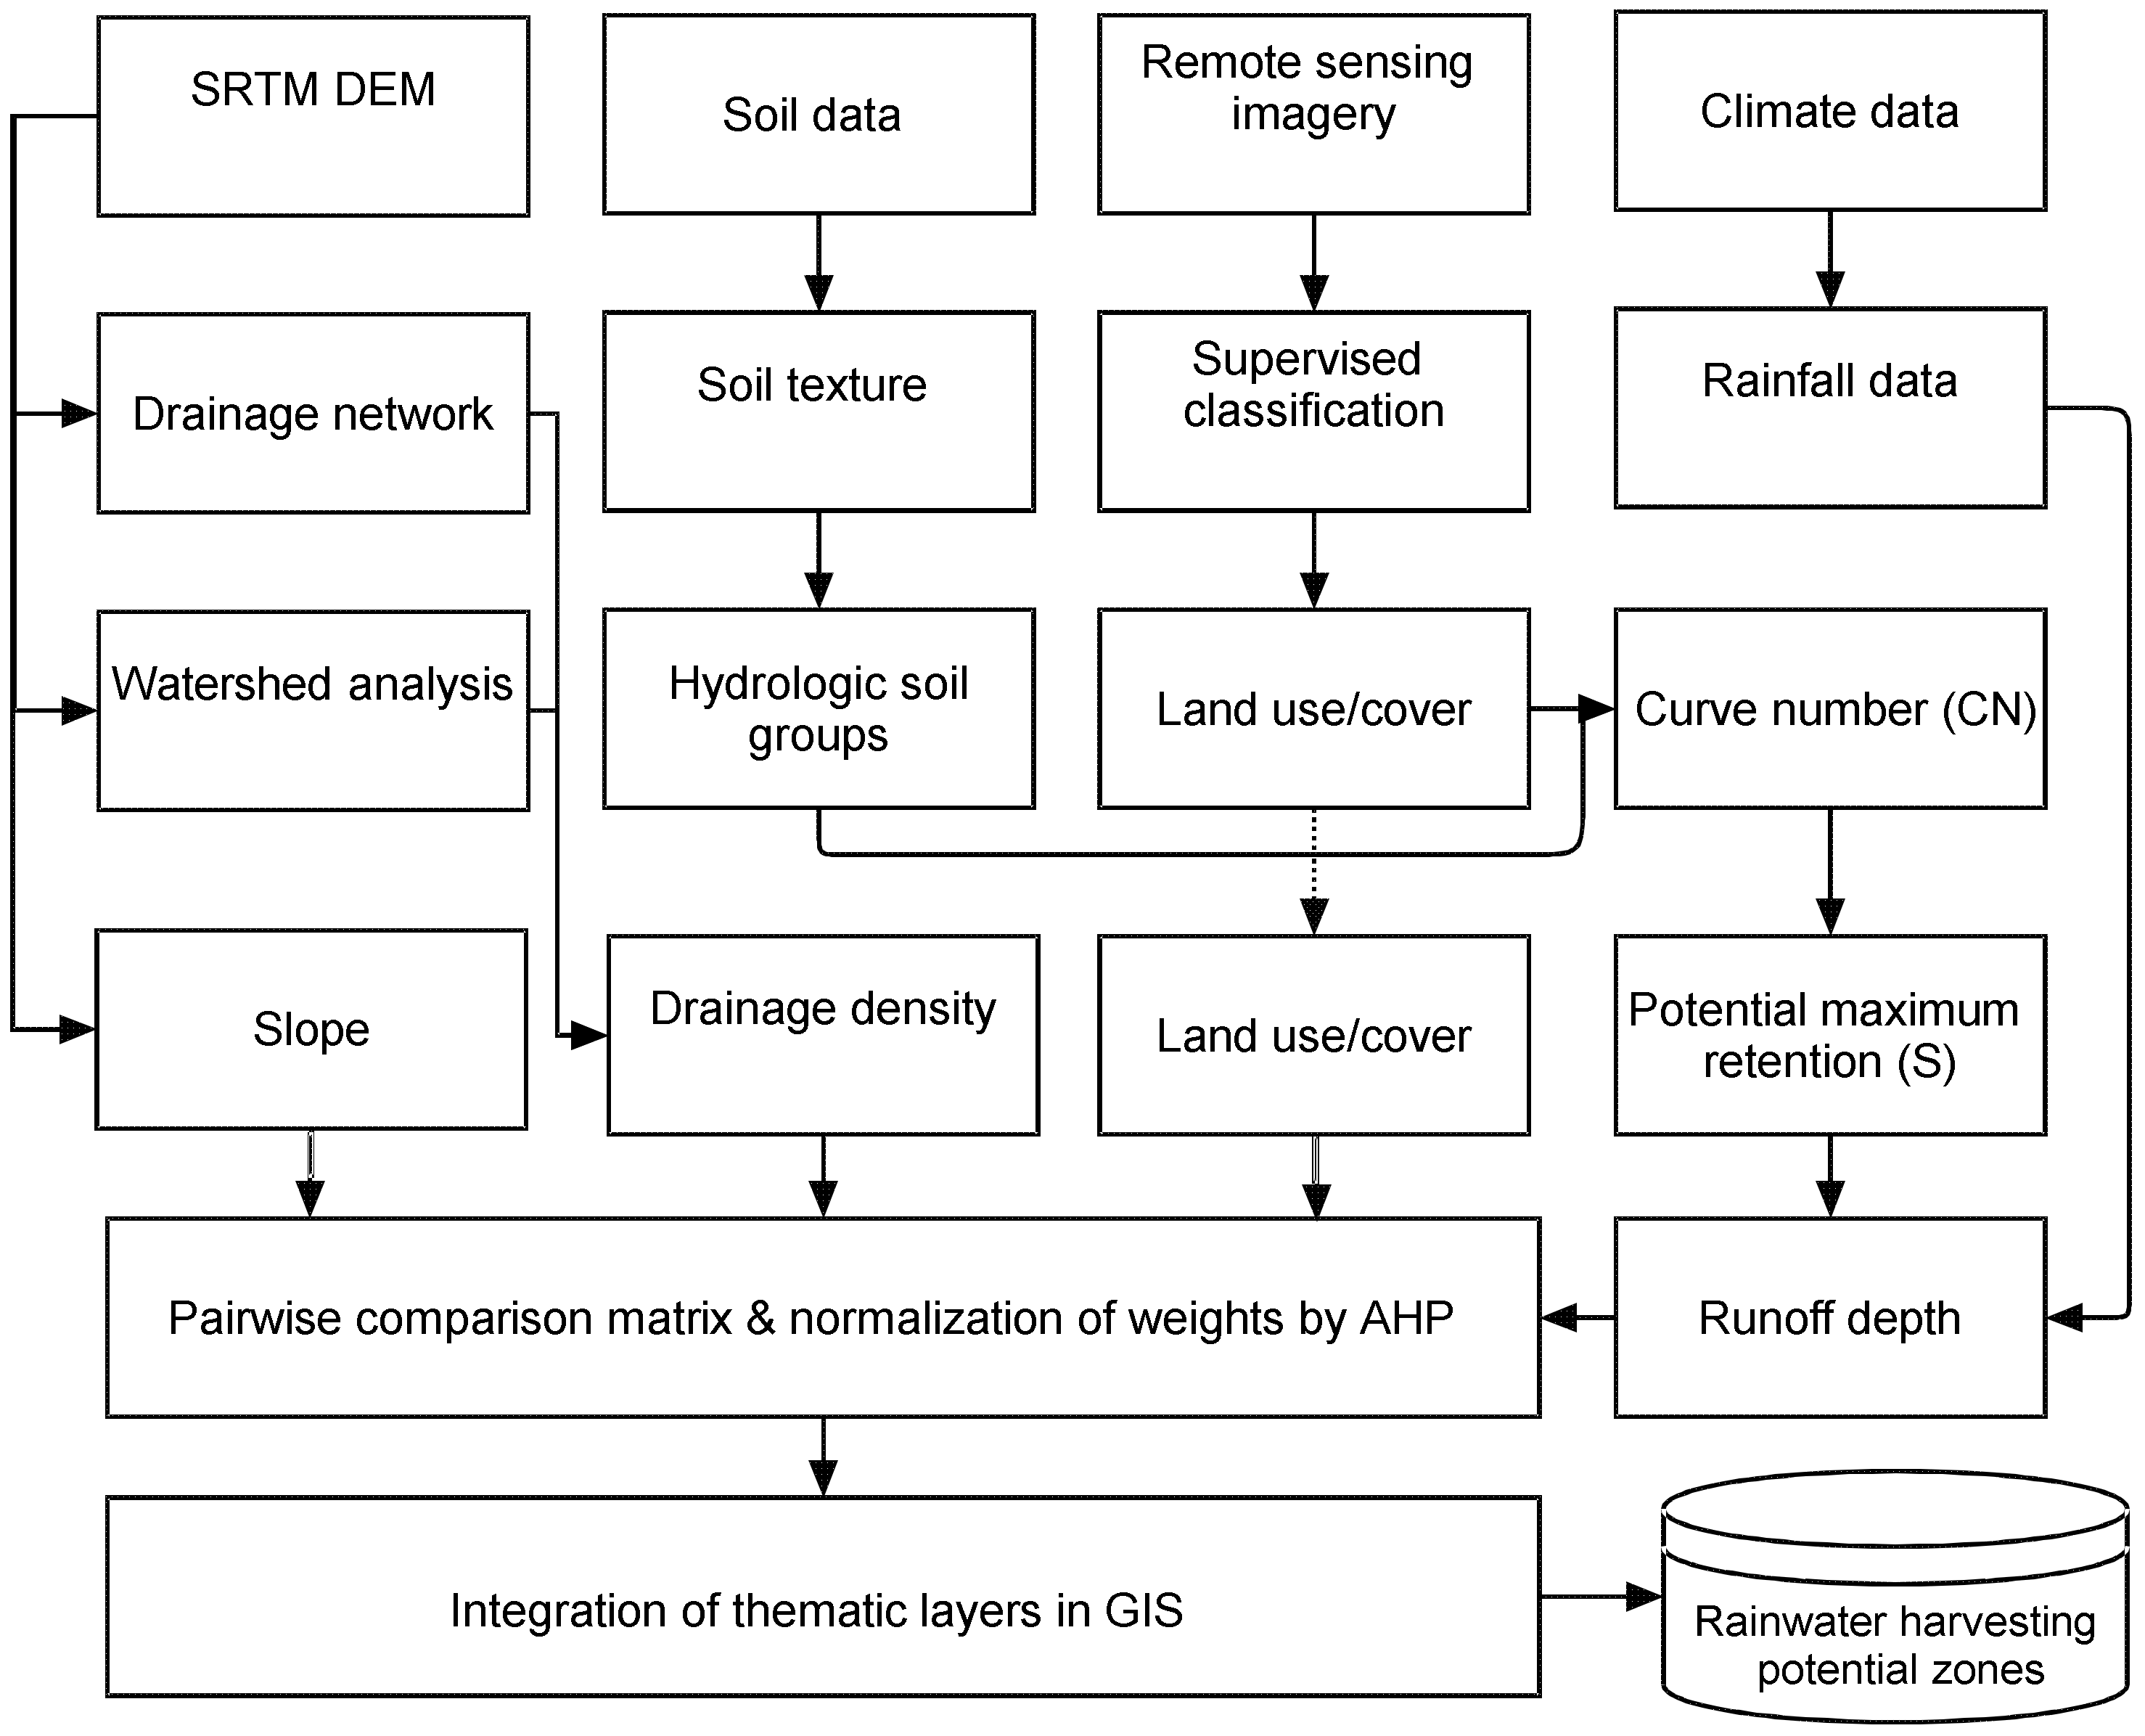
For the purpose of this study, data that were collected such as soil texture, rainfall, land use/cover, and digital elevation model (DEM) were obtained using freely available RS data and processed in ArcGIS software. The DEM data of the United States Geological Survey (USGS) with a 30-m resolution (Figure 3) was used to delineate the watershed of the Wadi Nu’man area with the help of ArcGIS (Figure 4). The land use/cover map was set up with the use of a Landsat ETM+ satellite imagery, downloaded from the USGS website. The satellite image (path 169 and row 45) was taken on March 3, 2020, with a spatial resolution of 30 m. The rainfall data were obtained from the climatic research unit (based on data gotten from King Abdul-Aziz international airport weather station) for a period extending from 1969 to 2019. The soil data for the study location was obtained from Saudi Arabia’s Ministry of Environmental Water and Agriculture. Figure 5 displays a flow diagram of the adopted methodology for producing the runoff and RWH potential areas employing the SCS-CN method coupled with RS and GIS.
2.4. Data Processing
2.4.1. Slope
The area’s slope or topographical characteristics are the main criteria to map and implement RWH systems. It significantly influences generating runoff, affecting the water flow velocity, amount of sedimentation, and materials needed to construct dams [33]. From an RWH viewpoint, as the land slope rises, the suitability of a given region to RWH declines and vice versa. A steep slope, for example, produces high runoff without an opportunity for RWH. To process the obtained DEM, the spatial analyst tools in ArcGIS software were used. A slope map was generated using the slope tool under the surface group in the ArcGIS environment. The generated slopes of the study area were reclassified into percentage categories relative to runoff generation.
2.4.2. Drainage Density
The drainage density is mathematically defined as the total stream length per unit catchment area (Equation (1)) [34].
where DD is the drainage density, n is the number of streams, L is the stream length (km), and A is the drainage area (km).
2.4.3. Land Use/Cover
A major factor affecting the determining appropriate areas for RWH is land use/cover. Both the land use/cover changes and rainfall impact the hydrological reaction of river basins. Essentially, land use/cover is associated with runoff and rainfall, producing the capability for runoff to take place. For example, higher infiltration and interception rates are linked with denser vegetation, creating lesser runoff [32]. Hence, it is crucial to ascertain the land use/cover variations and their effect on the nature of the watershed’s runoff. In this study, a Landsat ETM+ satellite imagery with a 30 m resolution was employed to produce the spatial information on land use/cover of the Wadi Nu’man watershed area. The land use/cover map was categorized by employing supervised classification with a maximum likelihood logarithm. To sustain the supervised classification, extra actual field land use/cover data were also utilized.
2.4.4. Soil Map
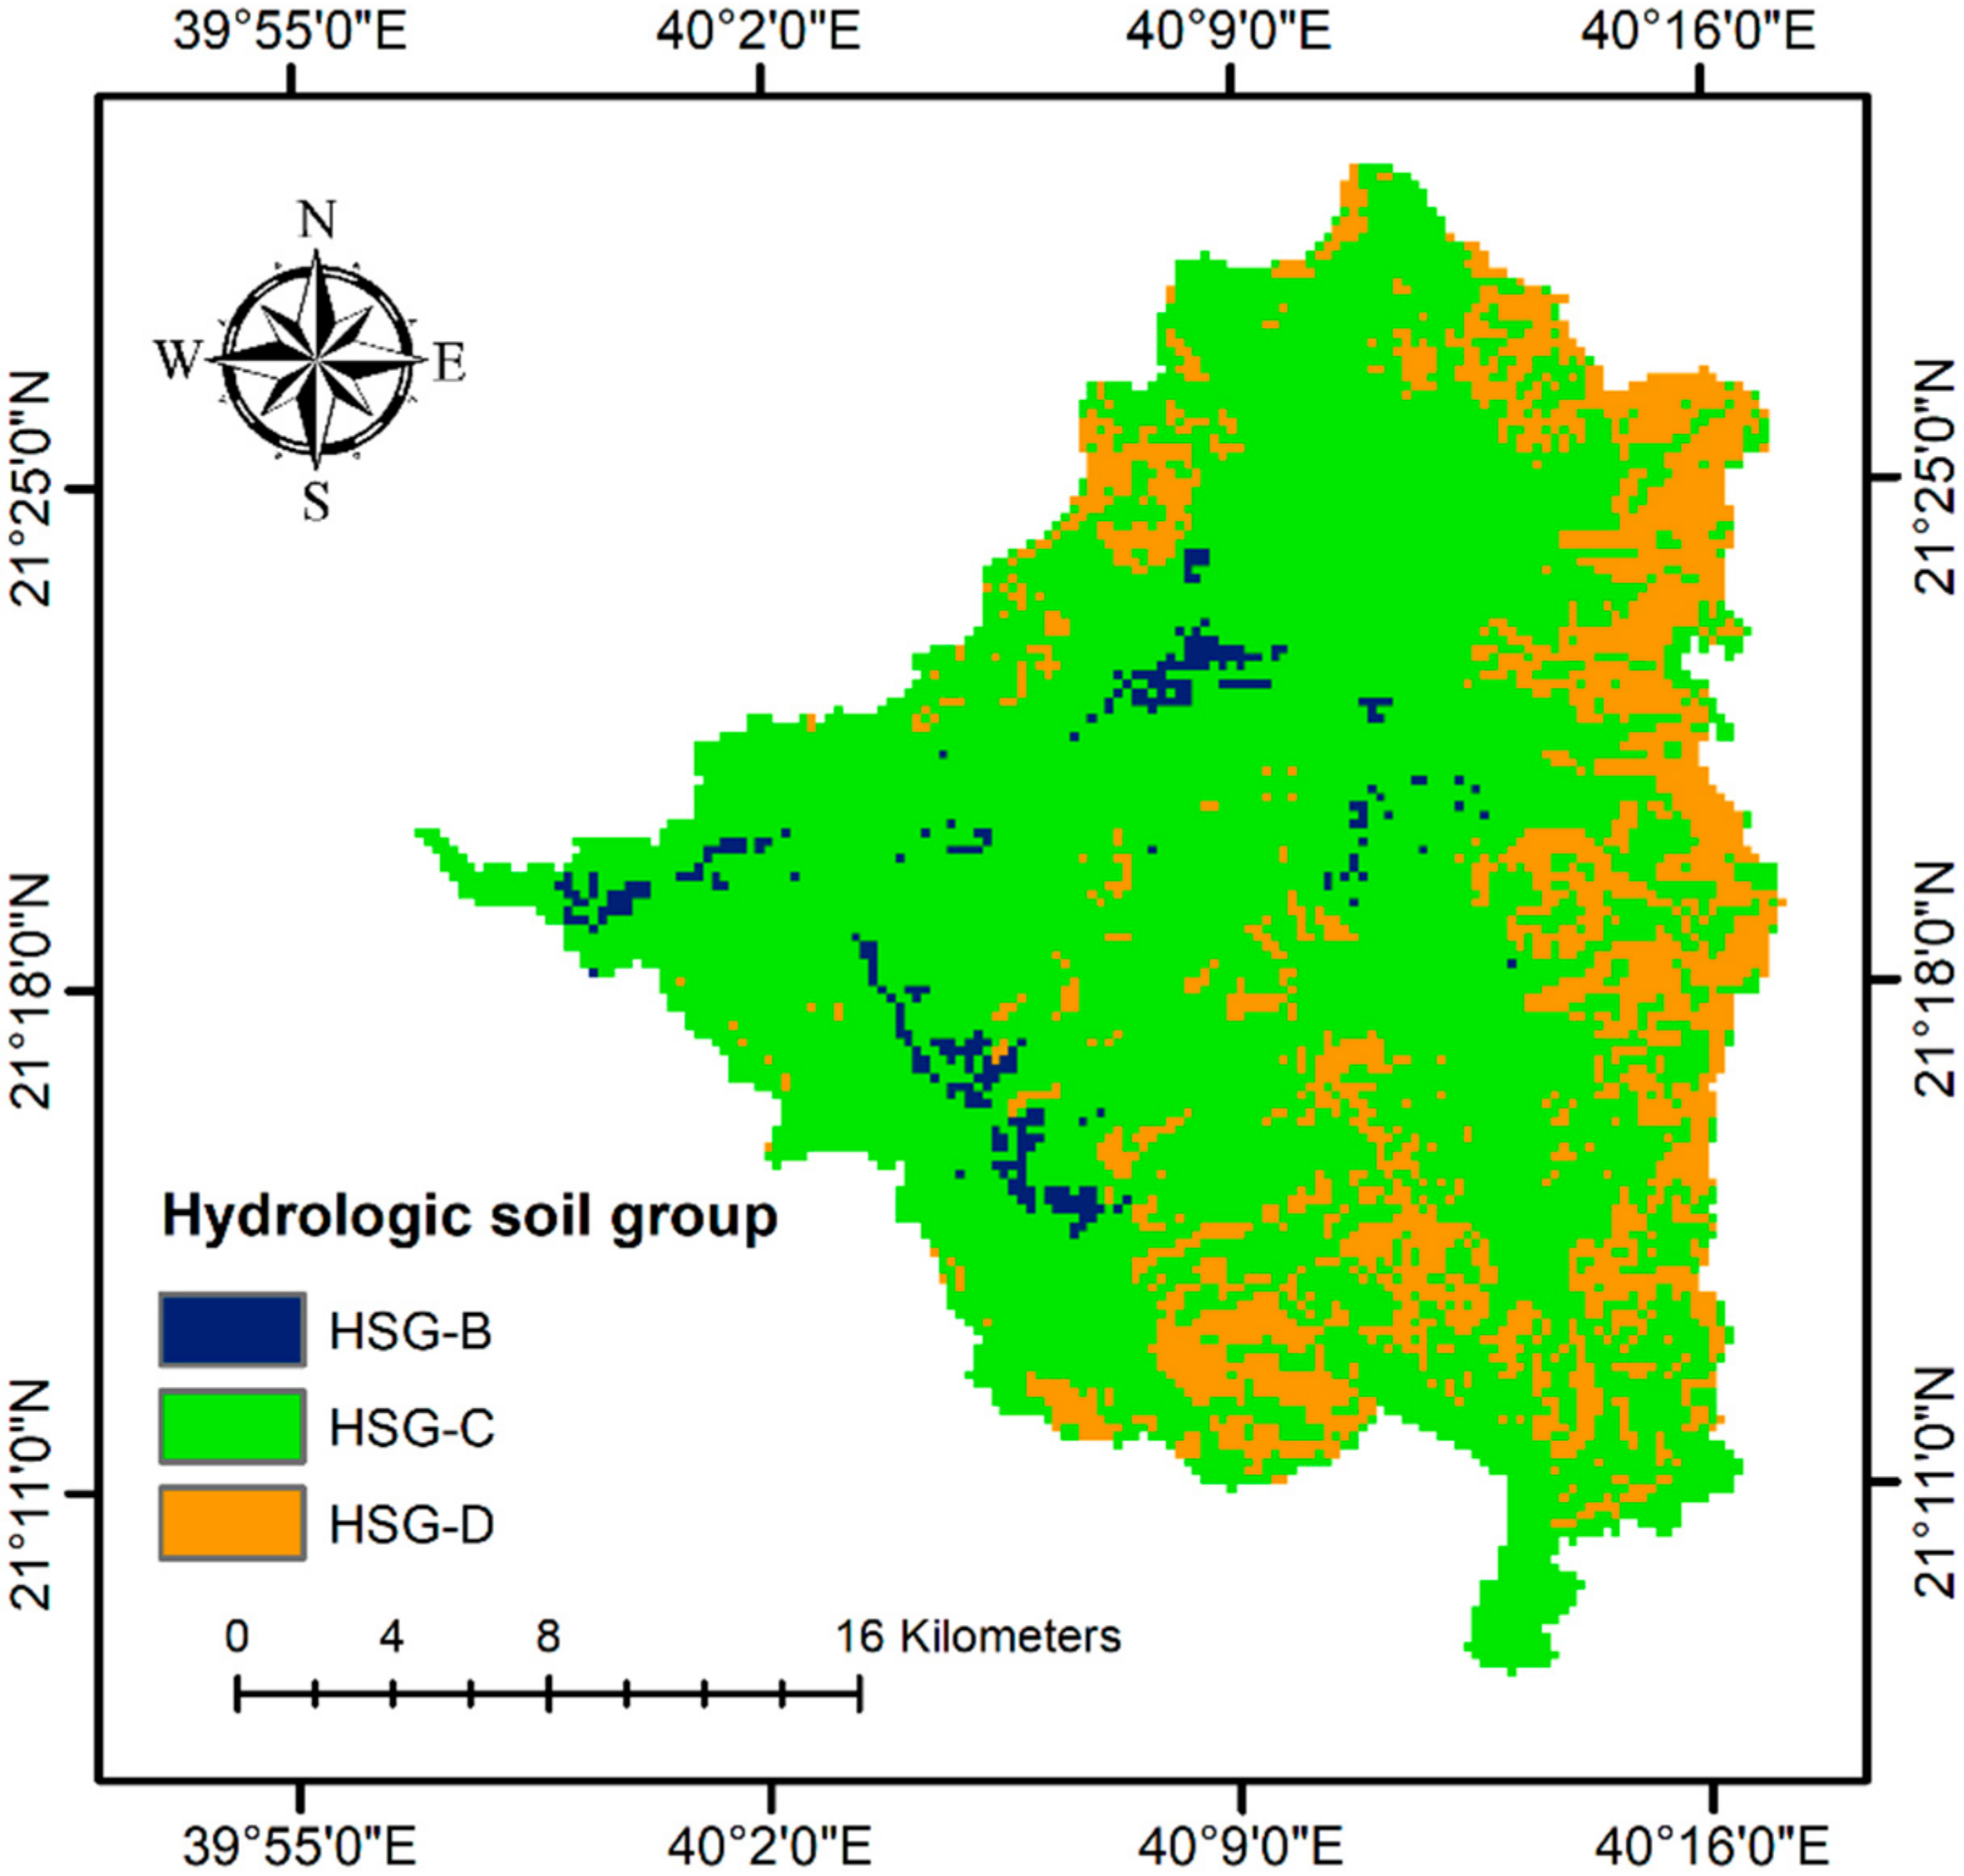
Soil is an important factor in setting up RWH as the soil’s texture has an impact on both the surface runoff and infiltration rate. The texture of the soil can be ascertained by the percentage of clay, sand, and silt. Medium and fine-textured soils offer a good environment for RWH due to their high water holding capacity [33]. Areas that possess a high level of clay soil are optimal sites for RWH systems [35,36]. For soil data to be employed in the SCS-CN model, the natural resource conservation service (NRCS) has classified soils into four hydrologic soil groups (HSGs) A, B, C, and D based on the proportion of water transmission through the soil and infiltration ability [37]. HSG-A provides high permeability with a low potential for runoff. Conversely, HSG-D denotes high clay or significantly shallow content with increased runoff potential. HSG-B and HSG-C are middle categories. Table 1 summarizes the four categories of HSGs [37,38,39].
2.4.5. Runoff Potential Map
The SCS-CN model (developed by the USDA) [40] combines all of the factors that affect generating the runoff and incorporates them into a single CN parameter [41]. The CN which shows the watershed’s reaction to a storm was estimated based on land use/cover and HSGs layers. According to the SCS-CN method, the runoff formula (Equation (2)) is given by:
where Q is the runoff depth (mm), P is the total rainfall (mm), S is the potential maximum retention after the beginning of runoff (mm), and λ is surface runoff abstraction (dimensionless). As a standard value, the SCS considers the parameter λ to be equal to 0.2 [40]. Shrestha [42], in his sensitivity analysis, uncovered that λ = 0.2 value befits mountainous agricultural lands, similar characteristics to the study area. Using the estimated CN, the maximum retention parameter S can be computed as:
where CN is the curve number that ranges from 0 to 100, reflecting the surface runoff’s response to a given rainfall. The high CN values show that much of the rainfall is transformed into surface runoff and vice versa.
2.4.6. RWH Potential Map
The AHP-based MCDA [43] and GIS-based SCS-CN were utilized in this research to generate a potential RWH map of the study location. For ascertaining the zones for RWH in the study area, thematic layers such as slope, land use/cover, runoff, drainage density, were taken into account. These principal layers and their features were assigned weights of 1 to 9 on Saaty’s scale [43]. All thematic layers and their features were considered by their ability to collect rainwater. Immediately the weights of each thematic layer and their necessary characteristics were concluded, pairwise comparison matrices of the given weights were made, using Saaty’s AHP method. Afterward, the given weights were normalized employing the eigenvector technique [44]. To determine the consistency of weights allocated to each thematic layer and its characteristics, the consistency ratio was calculated using Equation (4) suggested by Saaty [43]:
where RCI is the random consistency index, and CI is the consistency index given as:
where is the principal eigenvalue computed by the eigenvector technique, and n is the number of criteria (factors). Saaty [43] recommended that the optimum consistency ratio (CR) value should be lesser than 10%. Otherwise, the weights should be re-examined. Finally, all thematic layers and their normalized weights were incorporated using ArcGIS software for delineating RWH potential zones. Other than the finding of RWH potential zones in the study location, this study also considered suitable locations/zones for farm ponds. To accomplish this aim, the suitability requirements for the RWH structure were developed based on a critical review of previous studies and the local/regional knowledge [14,15,39] (Table 2).
3. Results and Discussion
3.1. Land Use/Cover Map
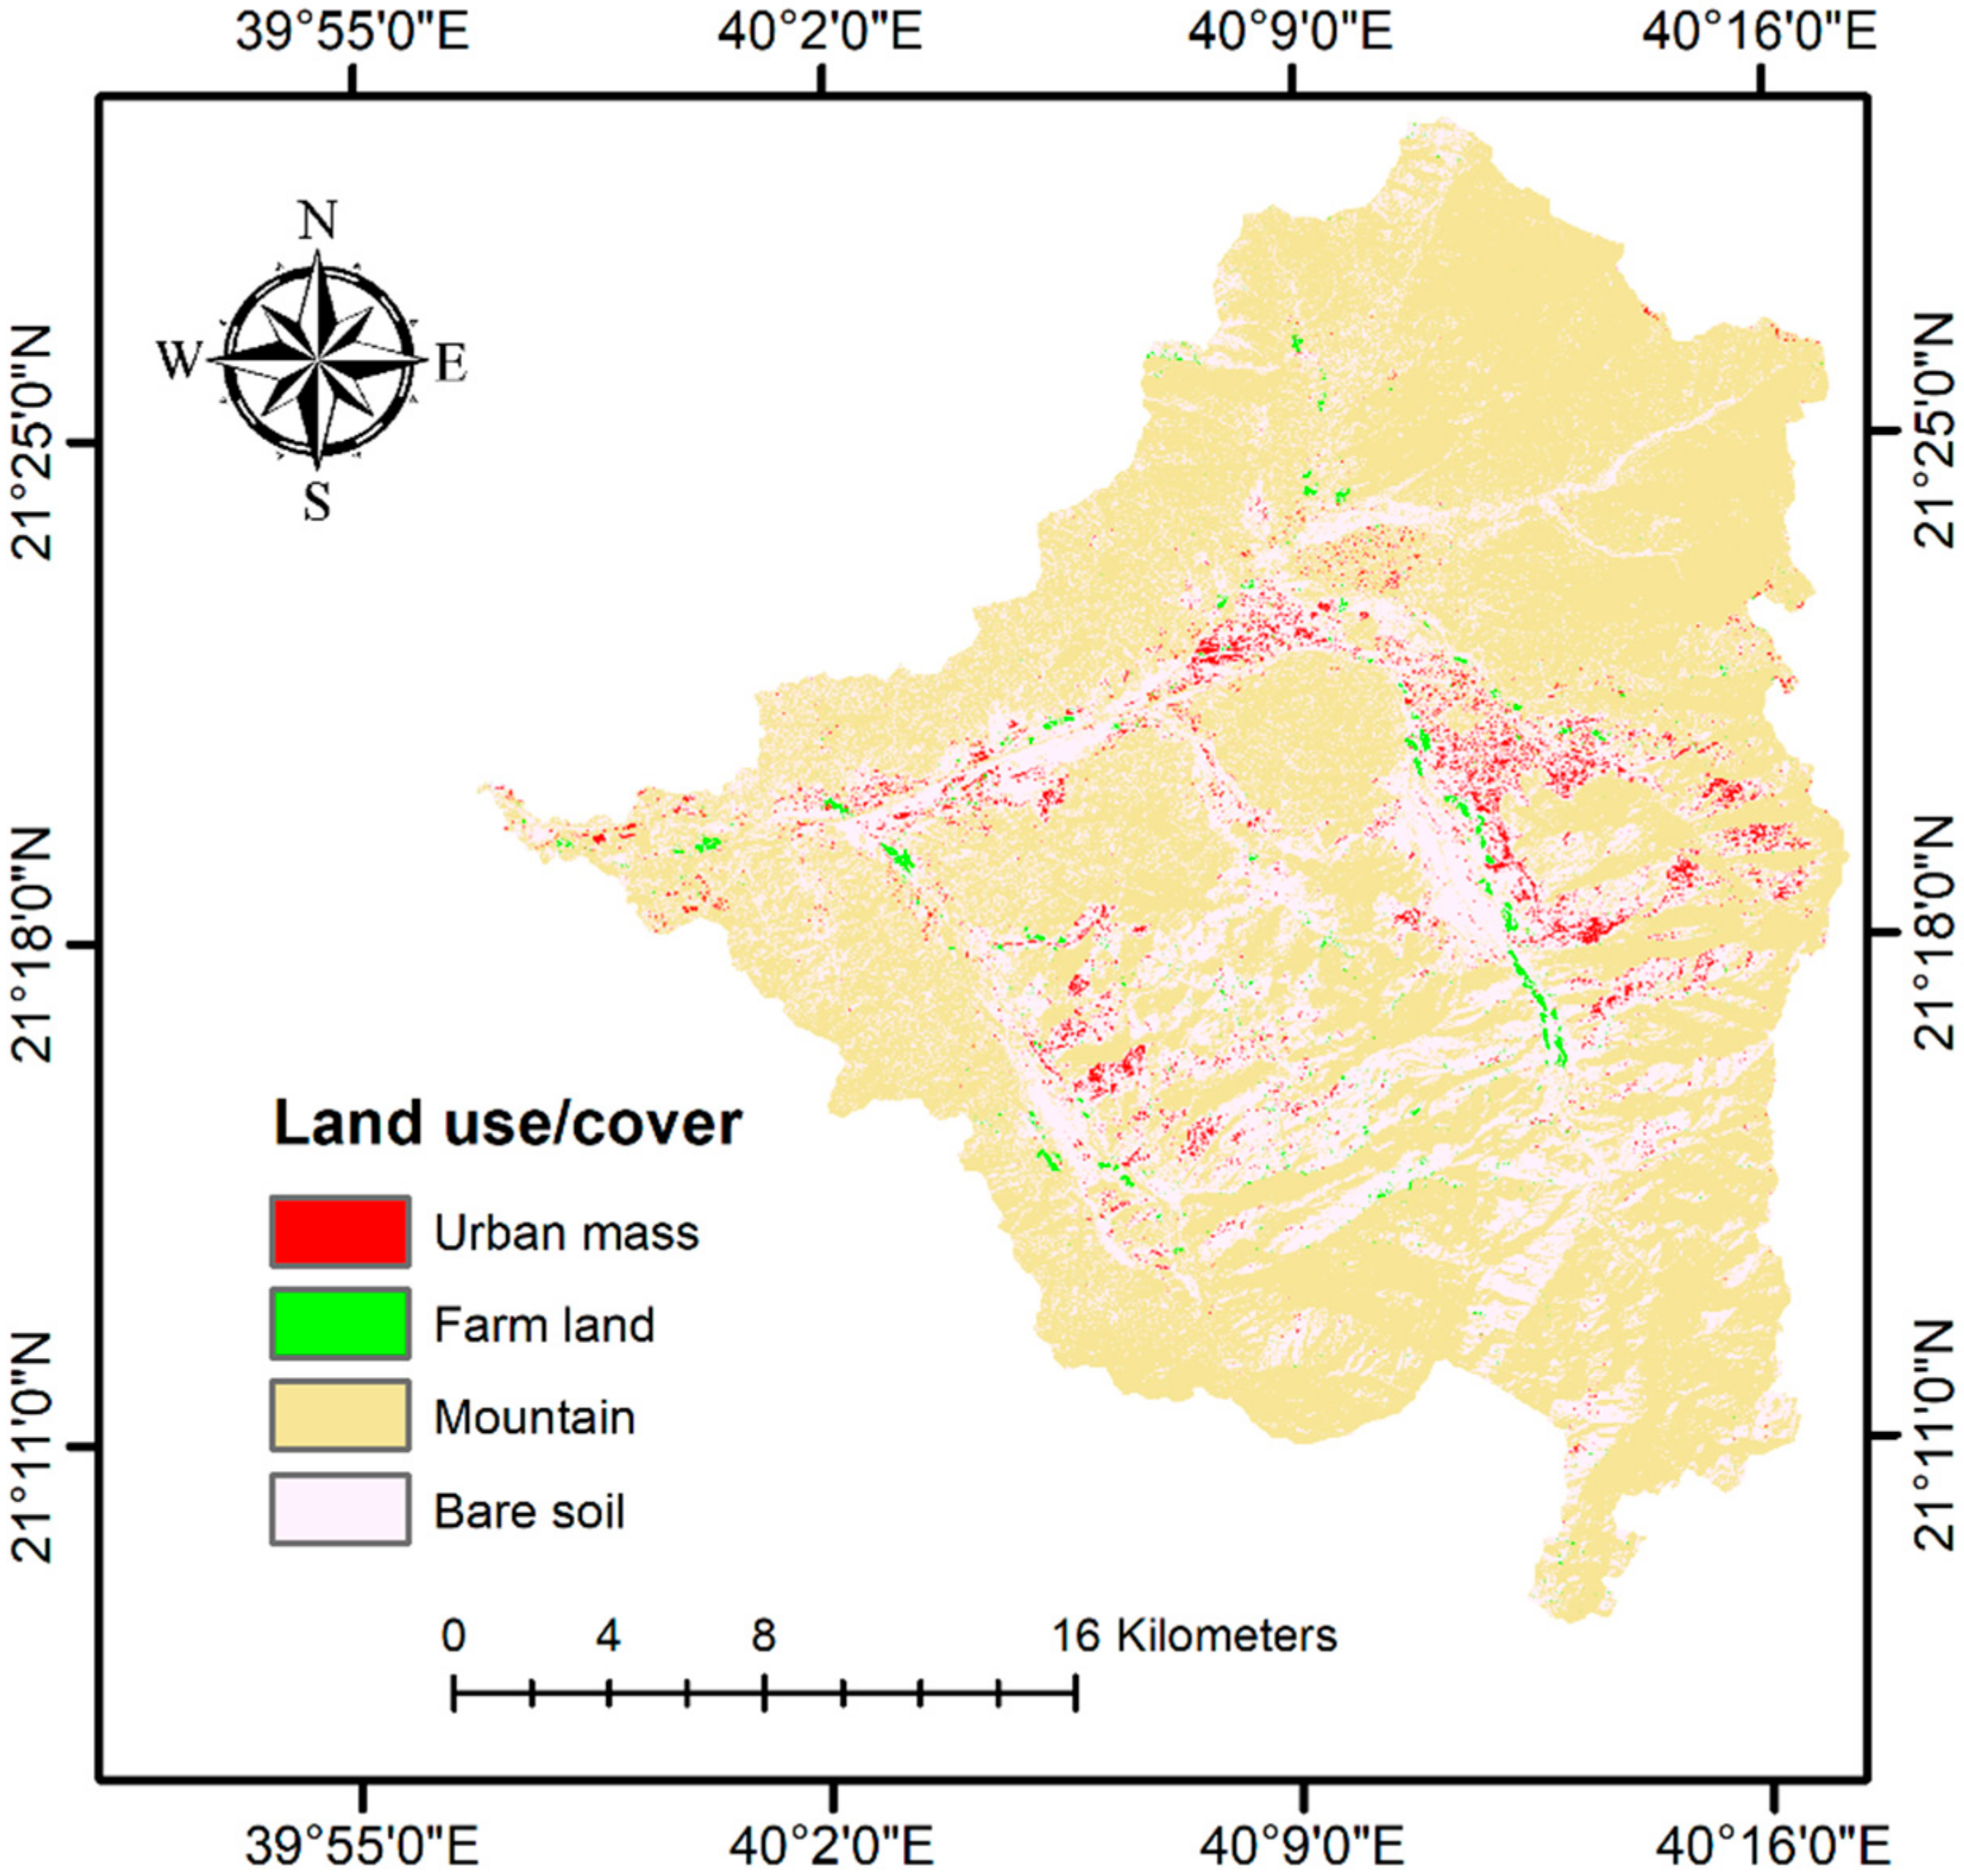
The land use/cover map of the watershed was categorized into four categories: urban masses, farmlands, bare soils, and mountains (Figure 6). The study region is mainly covered by mountains and bare soils covering 66% and 31%, respectively. The urban areas take up 2% of the total area, and they are not suitable for harvesting runoff water. Conversely, farmlands take up the least portion of the study region (~1%). Thus, it is apparent that both farmlands and bare soils which take up 32% of the study region are the most favorable areas for collecting runoff rainwater.
3.2. HSGs Map
Soil texture in the Wadi Nu’man watershed region can be split into three forms: sandy clay loam, clay, and loam. Using the infiltration rates and soil classification data, the Wadi Nu’man watershed region is categorized into three HSGs B, C, and D (Figure 7). The assessment revealed that a sizable portion of the area is covered by HSG-C, spreading all over the southeastern, central, and western parts of the study region. It takes up 528 km2 (77% of the total area). HSG-B and HSG-D each cover ~15 and 138 km2, respectively, contributing to 23% of the total area. HSG-B spreads in small patches while HSG-D is in the northeastern, southeastern, and southwestern parts of the study area. Thus, the majority of the area within the watershed region is very optimal for water retention, surface RWH zones, and producing large amounts of runoff.
3.3. Slope Map
Figure 8 displays the slope map of the Wadi Nu’man watershed area. As displayed in Figure 8, the slope of the study region was categorized into five slope classes: (a) nearly level (0–3%), (b) gentle (3–5%), (c) moderate (5–8%), (d) steep (8–30%), and (e) very steep (>30%). The slope categories of nearly level and gentle, each taking up an area of 47 km2 (7%) and 41 km2 (6%), respectively, are significantly suitable for RWH. The moderate slope portion is spread over the study location in small patches, taking up ~7% (50 km2) of the study area. Both the steep and very steep slope categories take up 159 km2 (24%) and 384 km2 (56%), respectively, are unsuitable for RWH zones due to their high slopes. These findings are in line with those of Mbilinyi et al. [35], who proposed that regions with gentle to moderate slopes, in unison with soils that possess high water-holding ability, are optimum for setting up RWH structures.
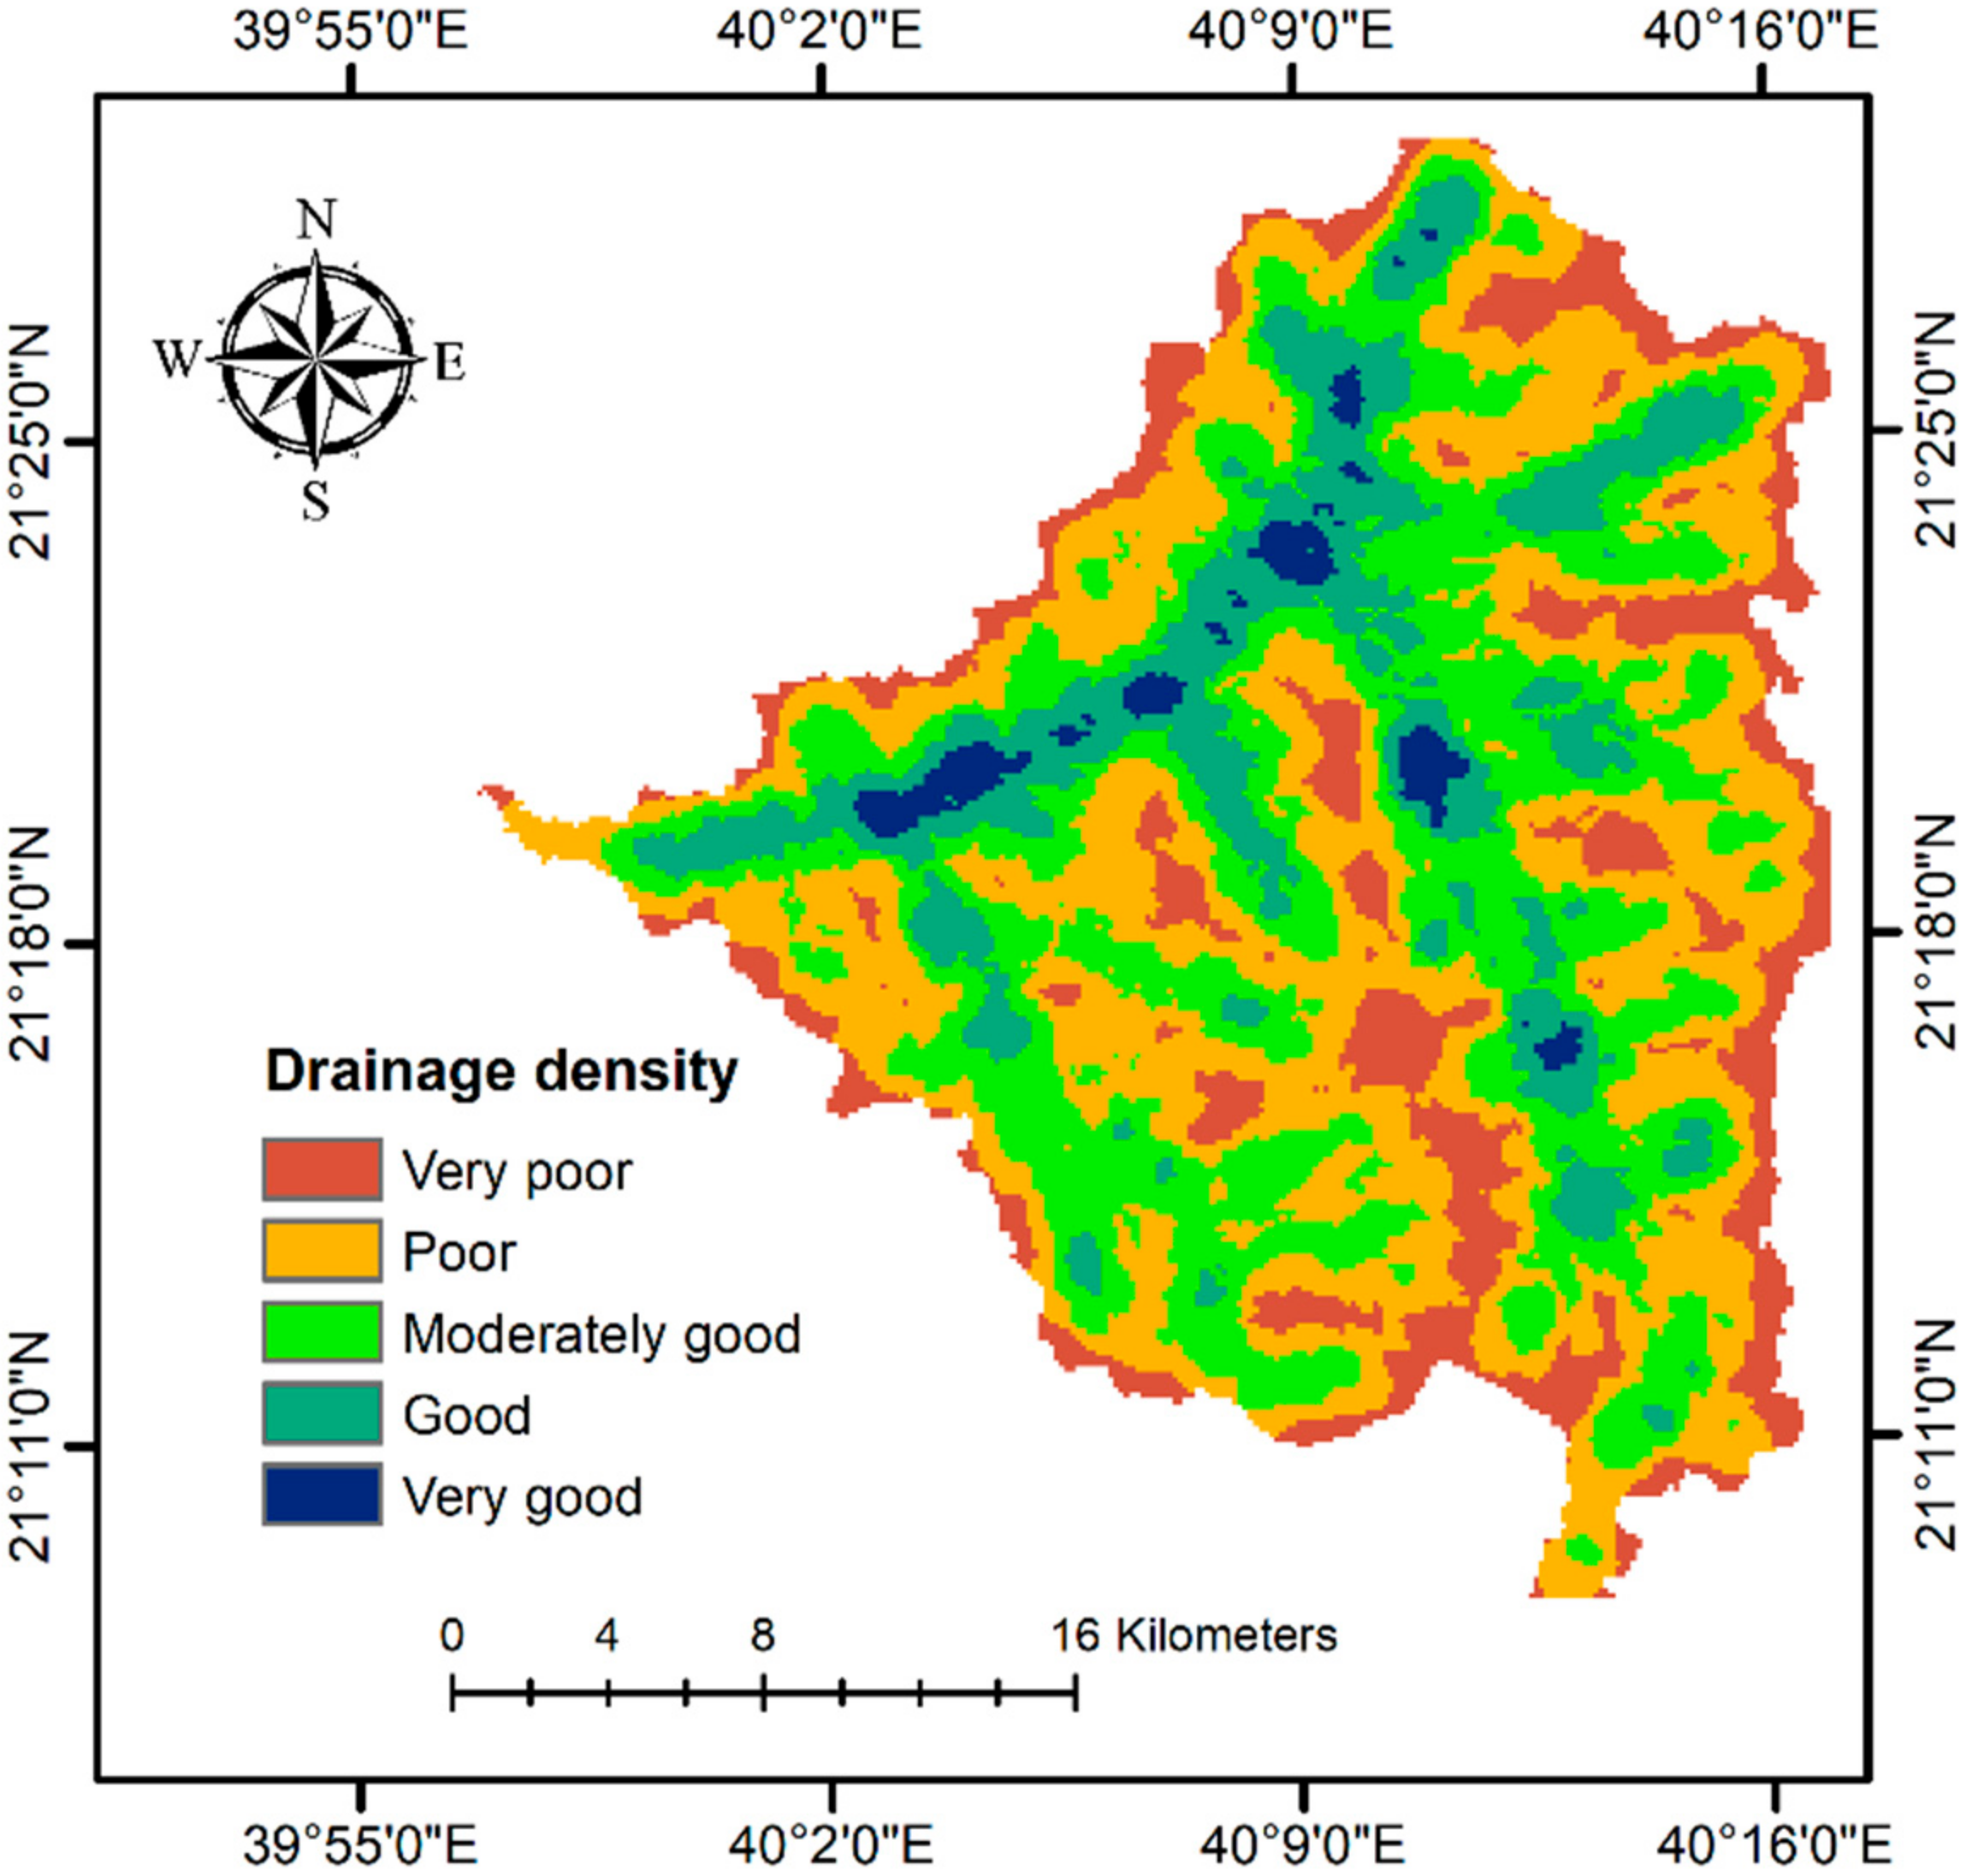
3.4. Drainage Density Map
On the basis of the drainage density, the study area’s watershed was classified into five groups: (a) very poor (0–0.6 km−2), (b) poor (0.6–1.2 km−2), (c) moderately good (1.2–1.8 km−2), (d) good (1.8–2.4 km−2), and very good (2.4–3 km−2) (Figure 9). The dominant categories of drainage density are poor, covering 247 km2 (36%), and moderately good, covering 213 km2 (32%) of the study region. The very poor and good drainage density groups cover 106 km2 (16%) and 97 km2 (14%), respectively. The very poor category is mostly on the region’s edges, whereas the good category is primarily in the central portion of the study area. The very good category of drainage density which is distributed in the central and western portions (in patches) has a small area of 18 km2 (2%).
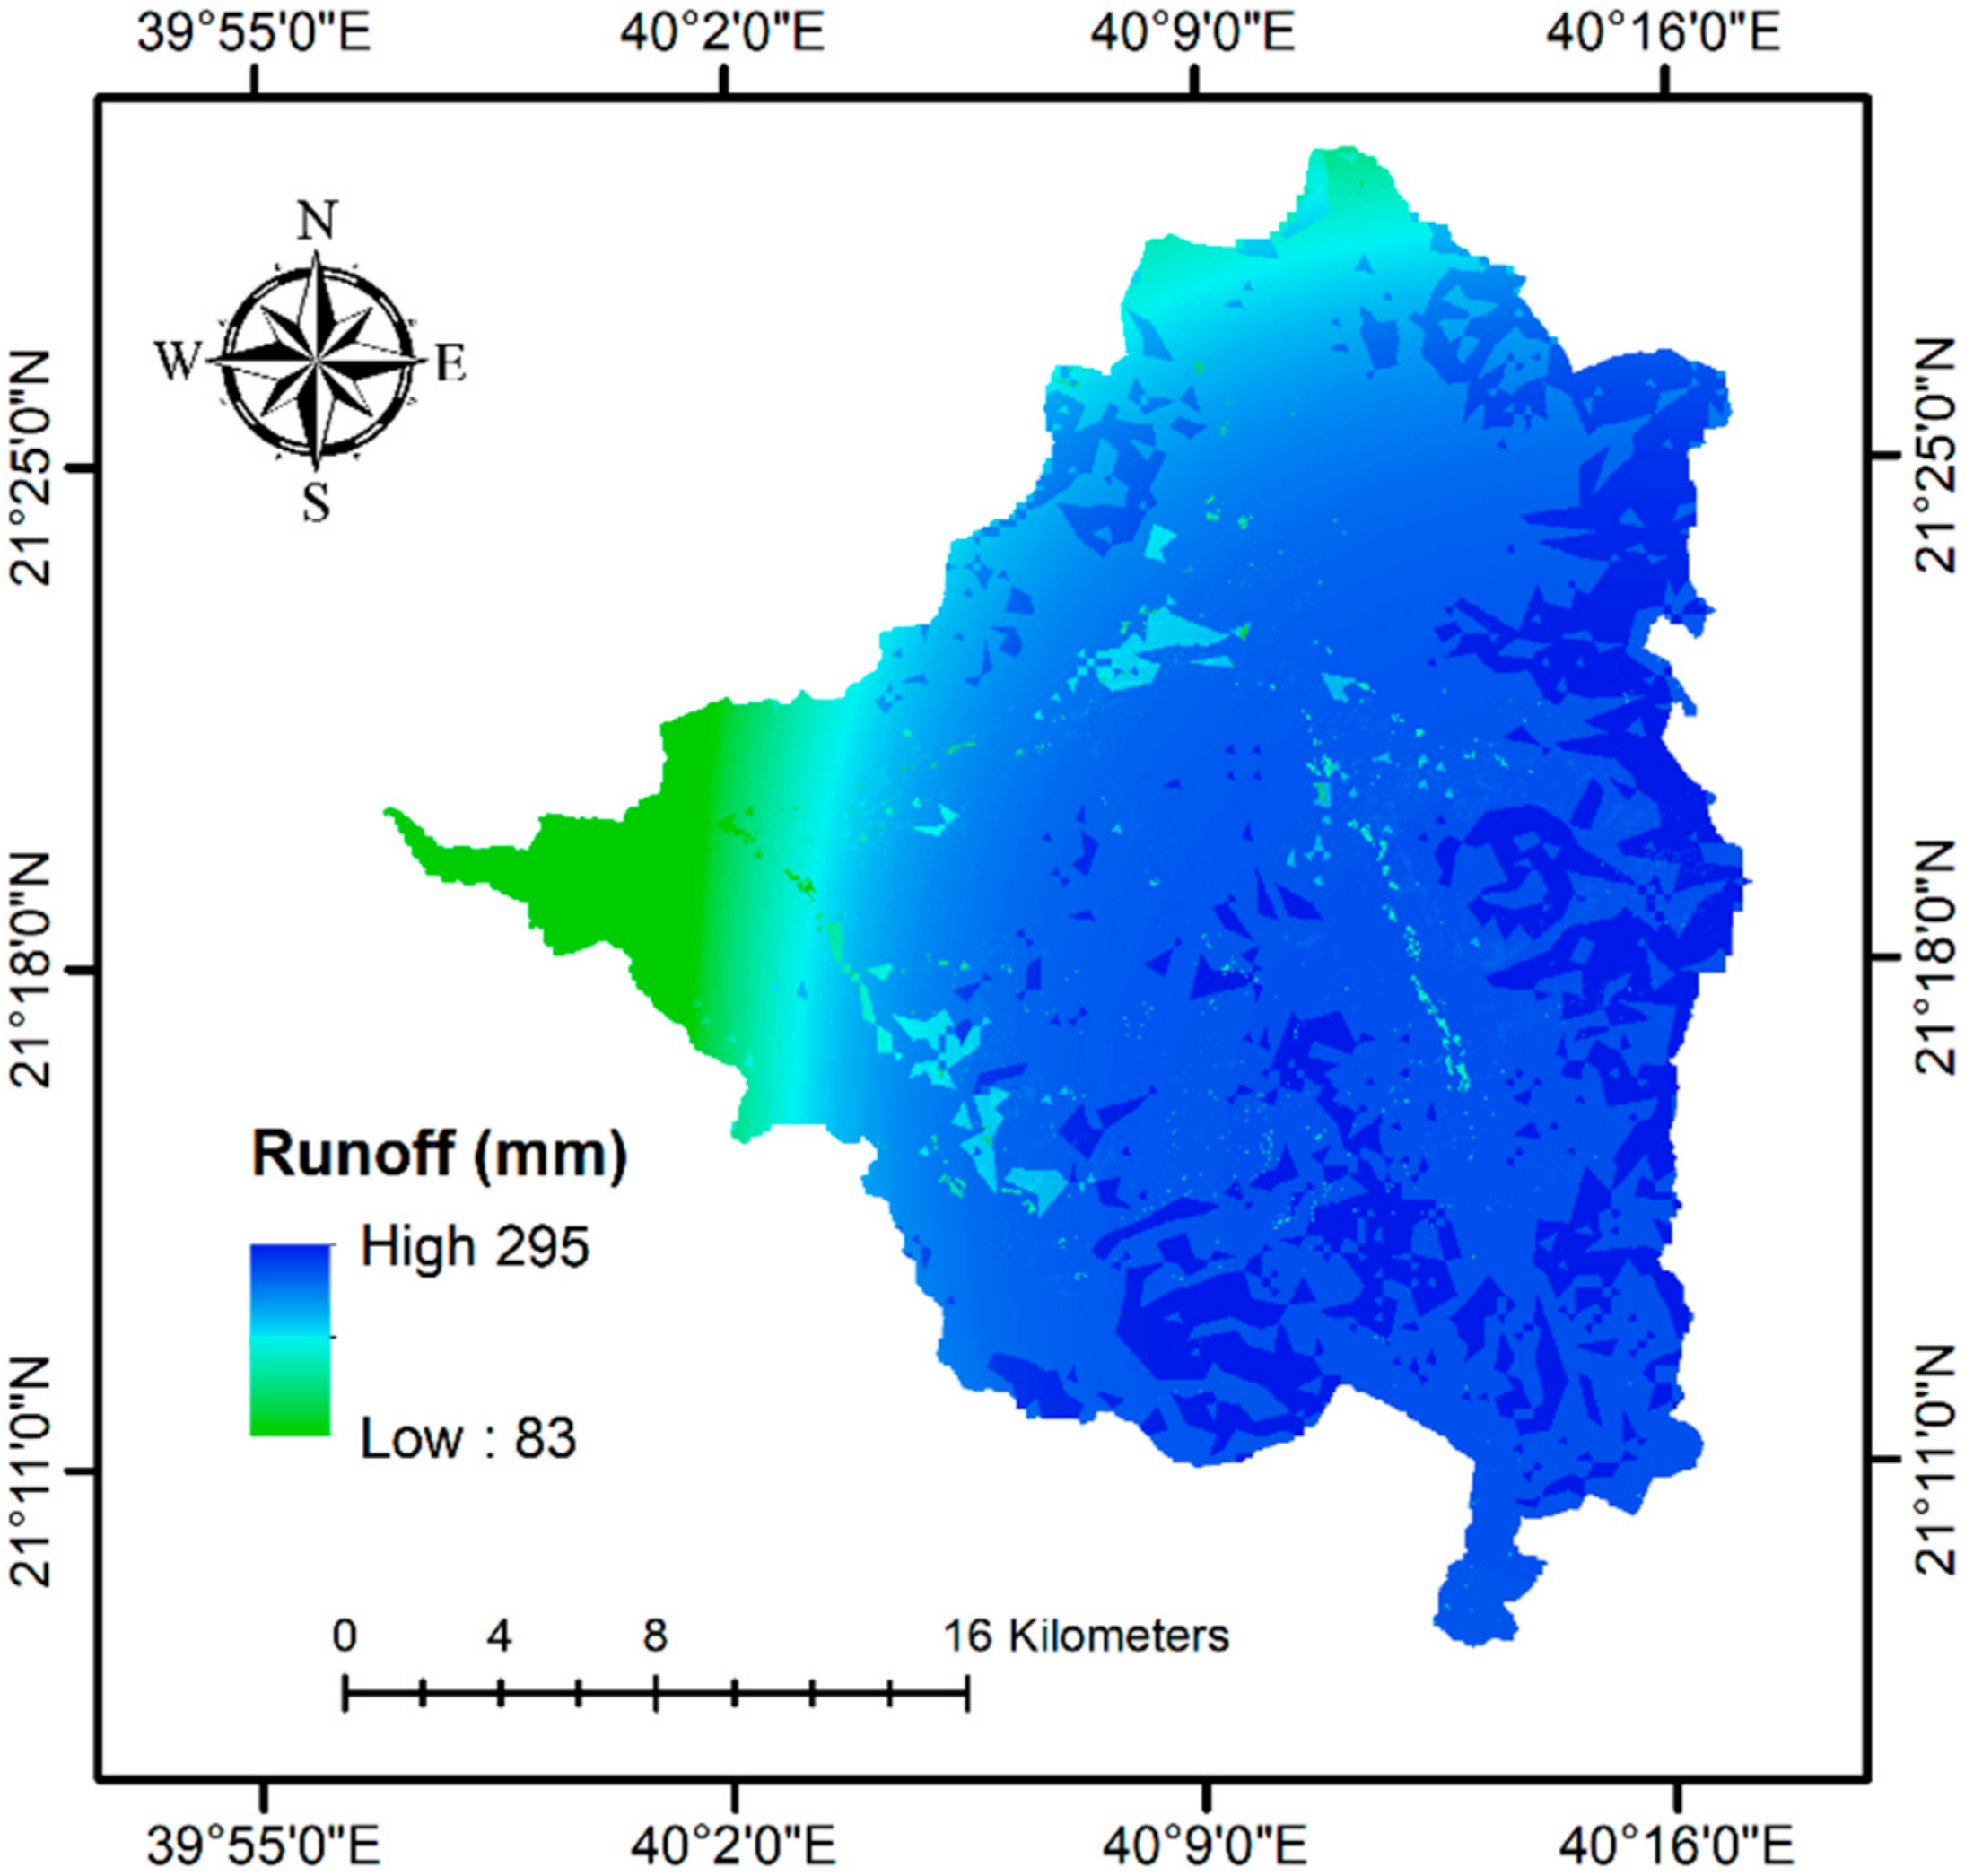
3.5. Runoff Potential Map
The thematic layers of HSGs and land use/cover were superimposed with the use of ArcGIS software to generate the CN map. Using the standard table given by SCS [45], every land use/cover category was allotted an appropriate CN based on HSG. The CN values were all over 74, implying robust runoff ability within the watershed areas. The CN range was between 74 and 94 (Figure 10). Based on both the spatially spread CN values and the potential maximum retention, every polygon’s runoff potential of the CN map was calculated using Equation (2). Figure 11 illustrates the outcomes of the spatial allocation of yearly surface runoff depth in millimeters. Changes ranging from 83 to 295 mm/year were observed depending on the climate, topography, and study area’s environment. For runoff map to be employed in producing the RWH potential map, it was classified into five categories: very poor (<175), poor (175–200), moderate (200–250), good (250–275), and very good (>275) mm/year. The watershed region is mainly covered by very good potential areas, while good and moderate runoff potential areas occupy 18% and 5%, respectively of the total area. An 3% of the region comes under very poor and poor runoff potential zones, implying a restricted prospect for runoff collecting.
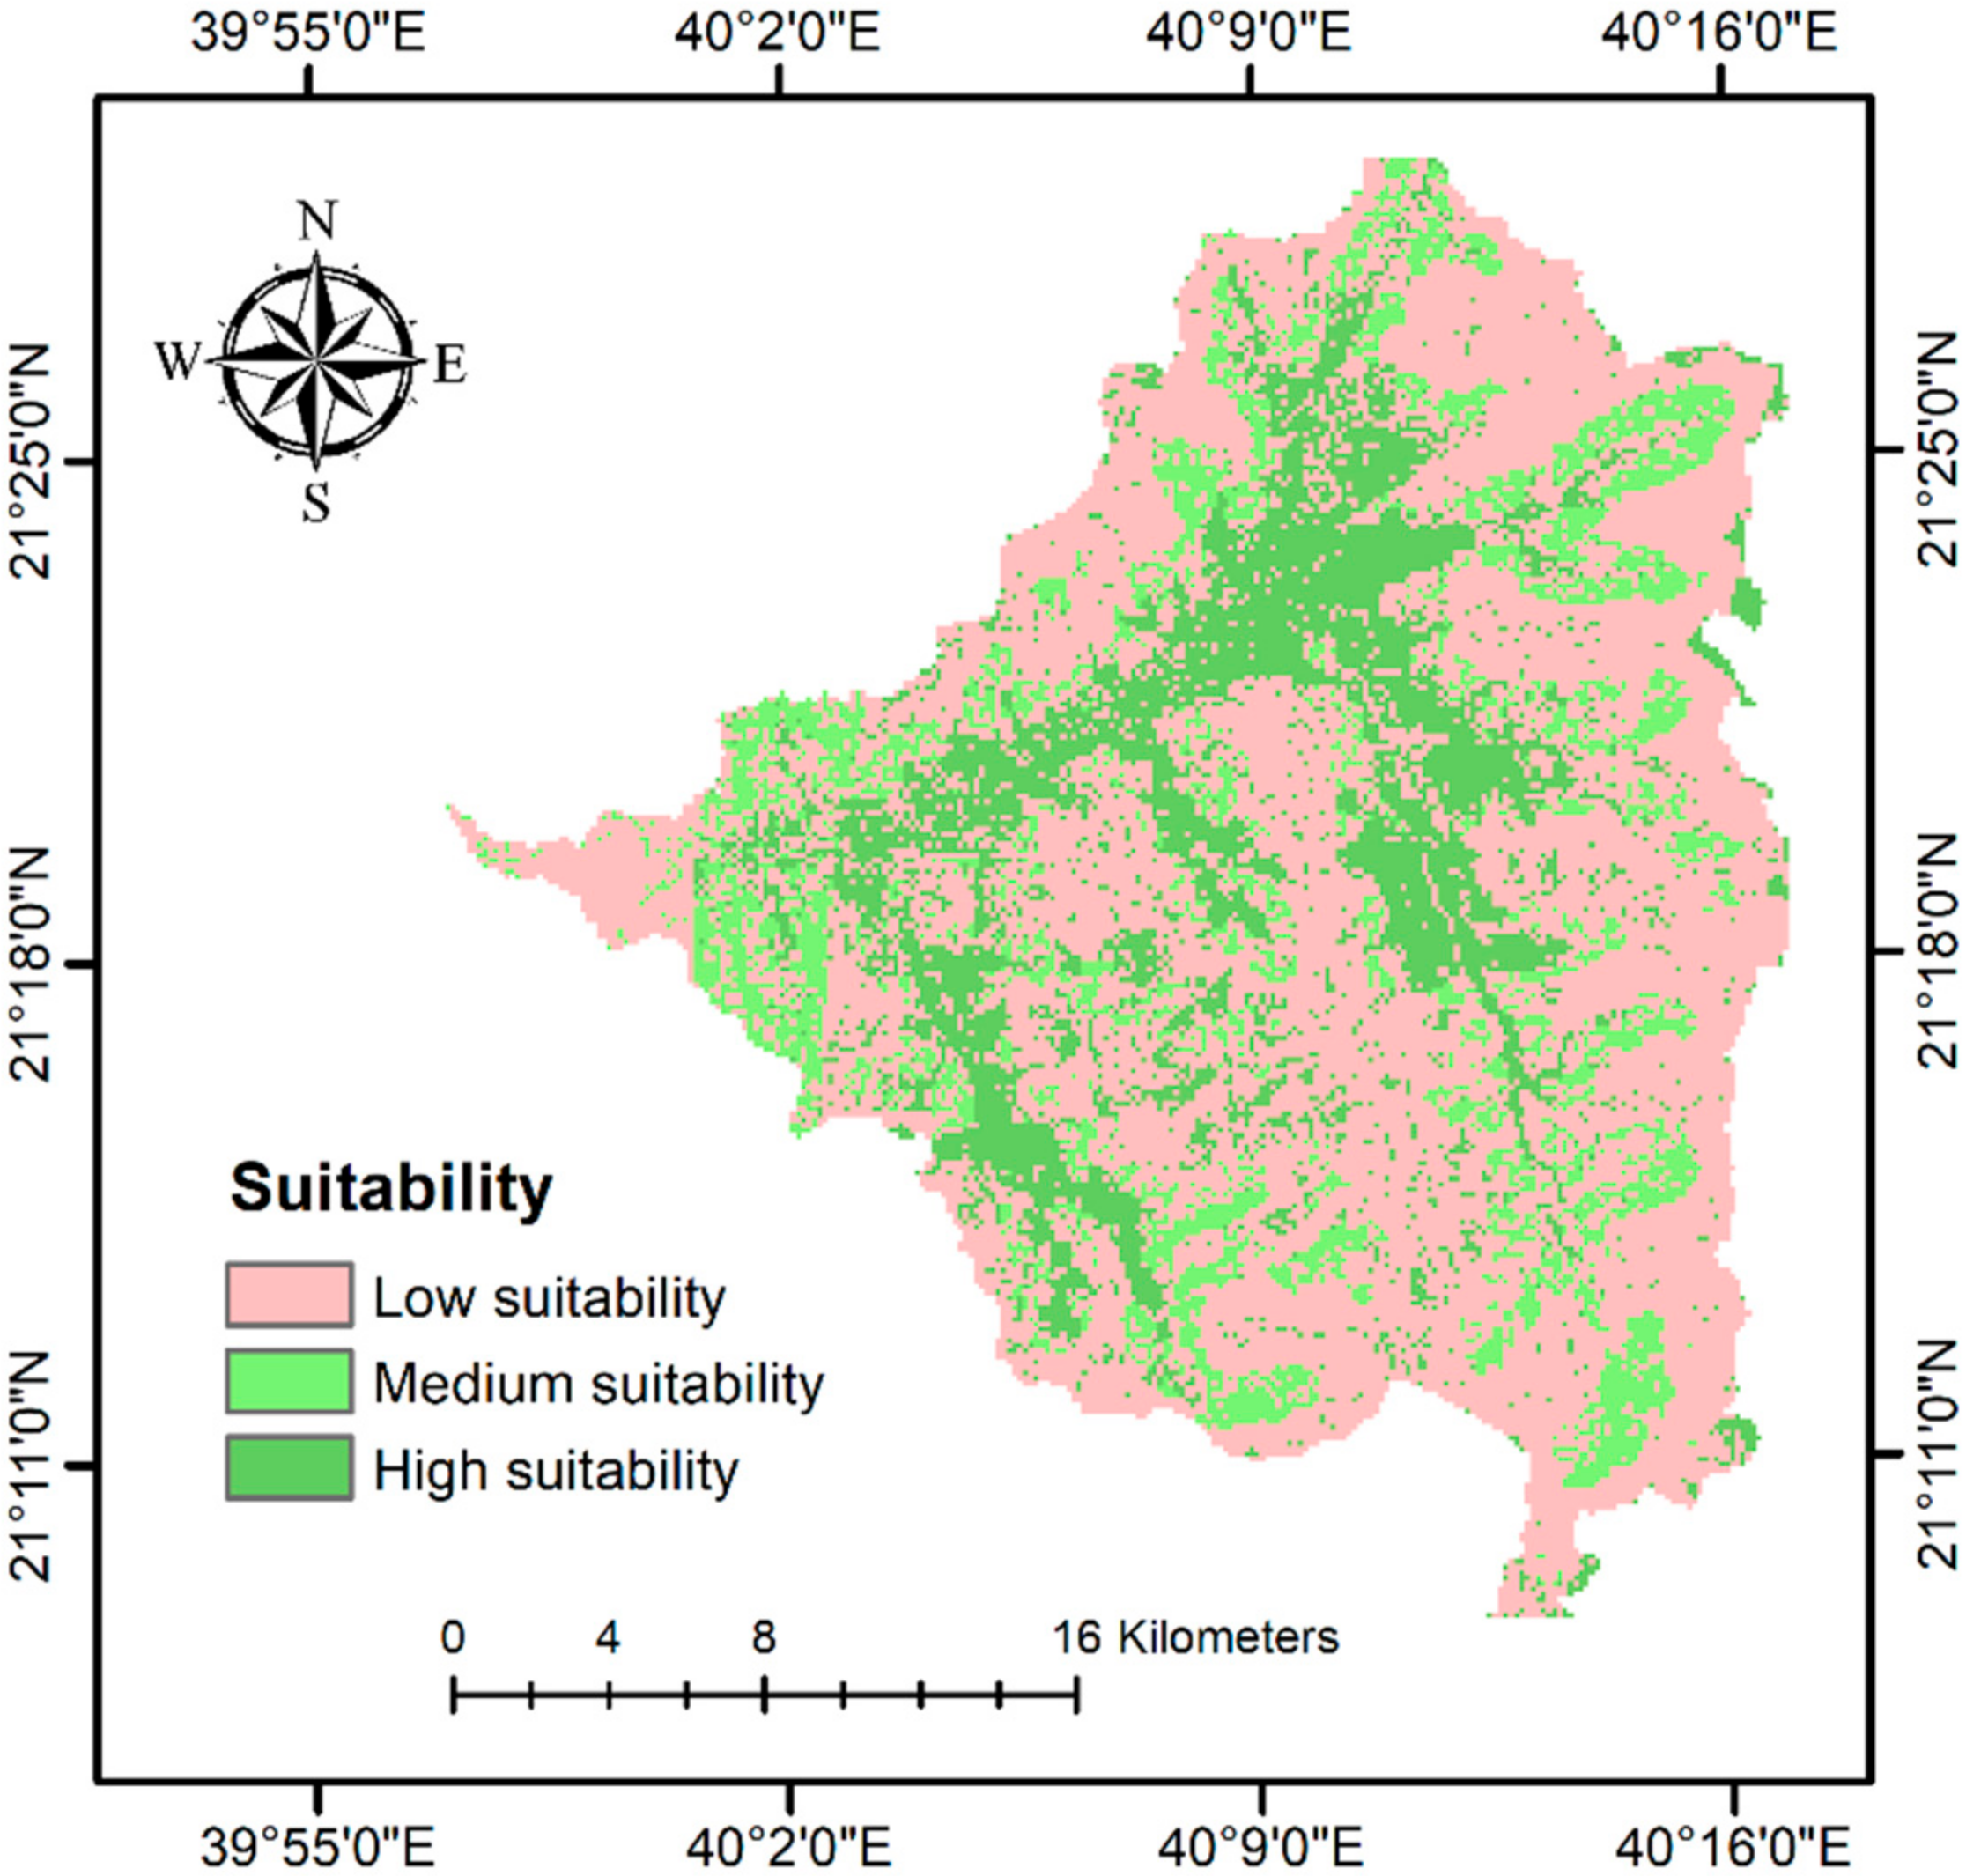
3.6. RWH Potential Map
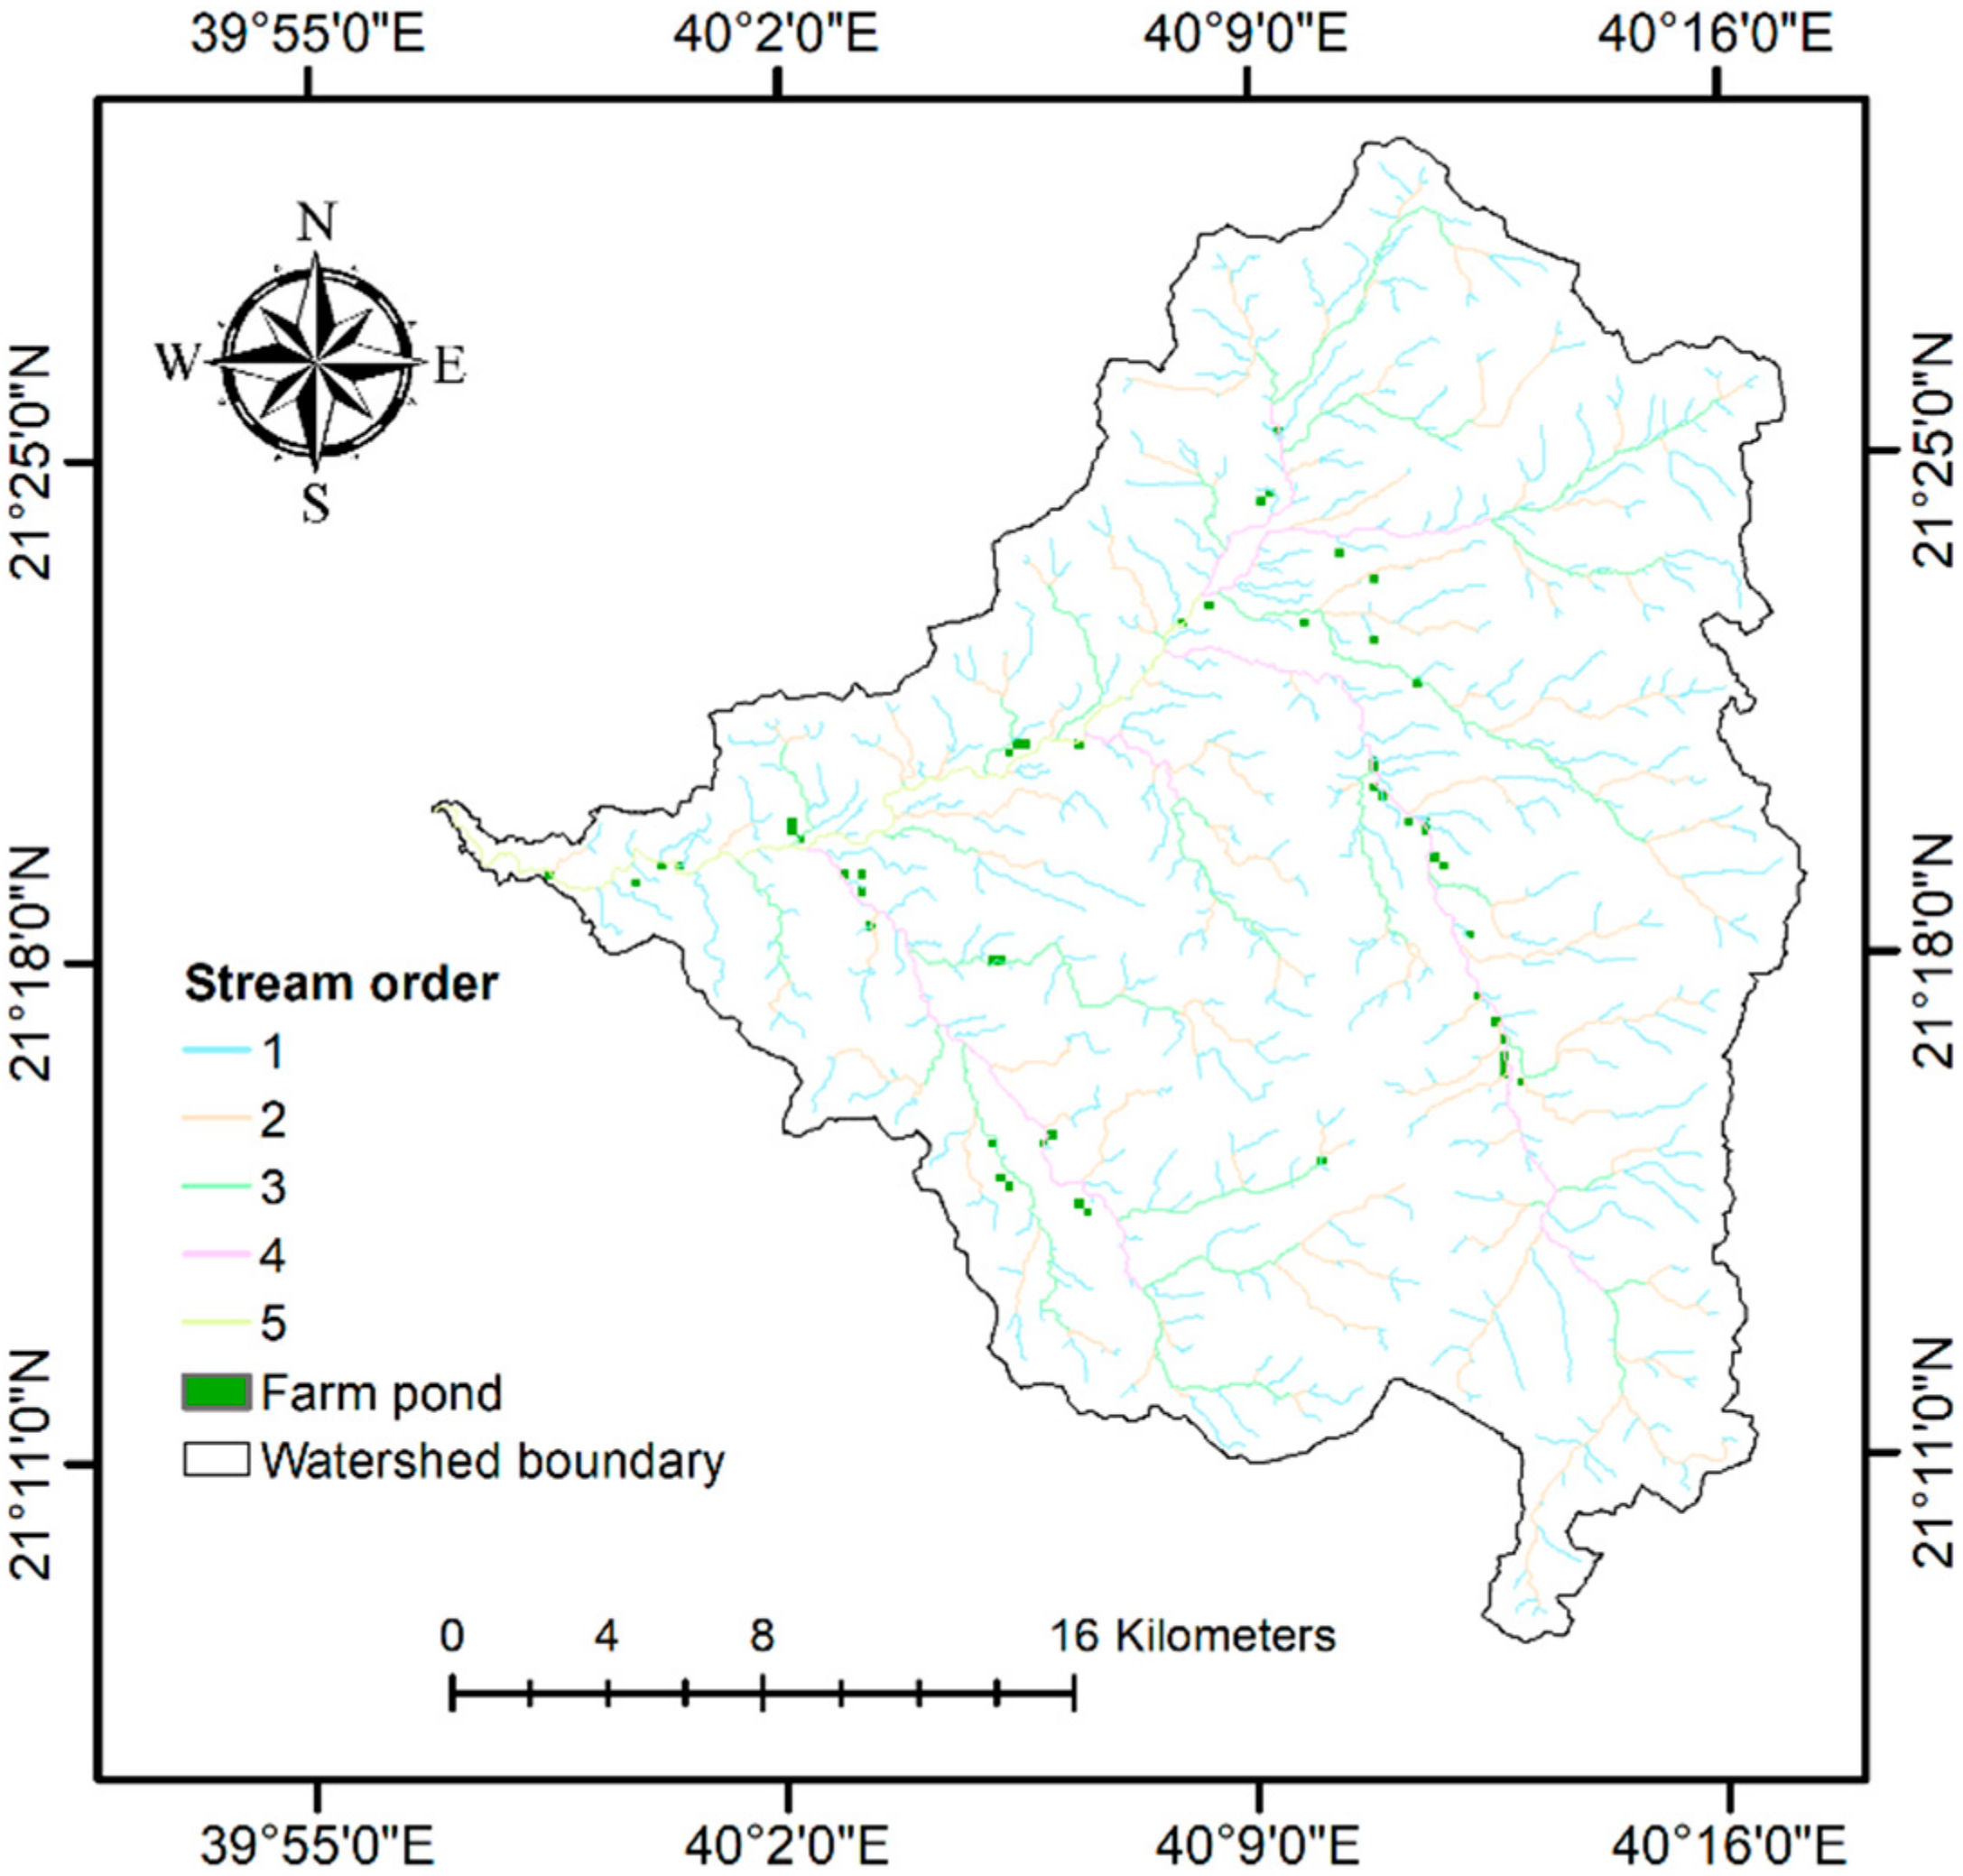
The study location’s RWH potential map was generated by integrating the thematic layers of slope, runoff, land use/cover, and drainage density (Figure 12). The CR was lesser than the threshold cap (0.10), indicating that the weight allocation procedure for RWH potential mapping is consistent. Using the RWH potential map, three potential areas can be established: (a) low suitability, (b) medium suitability, and (c) high suitability. The low suitability RWH potential areas are dominant in the study location, taking up 410 km2 (60%). The medium and high suitability RWH potential areas take up 110 km2 (16%) and 161 km2 (24%), respectively. Thus, a significant part of the study area (40%) is optimal for RWH. The potential suitability areas (less than 1% of the total area) for constructing the farm ponds within the watershed region are given in Figure 13. A crucial factor in choosing areas suitable for farm ponds was that the land use/cover should be agriculture, for the reason that farm ponds are necessary for offering additional irrigation to the crops.
4. Conclusions
RWH is a very promising and pragmatic technique for efficiently handling water scarcity difficulties by supplementing water supplies continuingly. Results of the study showed that the multi-criteria assessment in the GIS environment with field experience-based decision criteria provides an advantageous and cost-effective incorporated resource for the identification of RWH potential sites and areas suitable for viable RWH structures. The generated maps of runoff potential areas, RWH potential areas, and appropriate areas for viable RWH structures are significantly beneficial to the water resource engineers and planners in the study region for effective management of sparse water supply. Furthermore, delineating the groundwater recharge potential sites which are a key issue should be addressed as well. Avital field investigation also has to be done in the identified RWH potential zones to corroborate the outcomes of this study. Since the assessments and the techniques shown in this study have broad applicability, they have the potential to be very advantageously used in other areas of the world, especially in developing countries, regardless of agro-climatic and hydrological differences.
Author Contributions
Conceptualization, methodology, H.A.-G.; data curation, software, formal analysis, writing—original draft, A.Z.D.; writing—review and editing, H.A.-G. and A.Z.D. All authors have read and agreed to the published version of the manuscript.
Funding
The work was funded by the Deanship of Scientific Research at King Saud University through research group number RG-1441-321.
Institutional Review Board Statement
Not applicable.
Informed Consent Statement
Not applicable.
Data Availability Statement
Not applicable.
Acknowledgments
The authors extend their appreciation to the Deanship of Scientific Research at King Saud University for funding this work through research group no. RG-1441-321.
Conflicts of Interest
The authors declare no conflict of interest.
References
- Singh, J.P.; Singh, D.; Litoria, P.K. Selection of suitable sites for water harvesting structures in Soankhad watershed, Punjab using remote sensing and geographical information system (RS&GIS) approach—A case study. J. Indian Soc. Remote Sens. 2009, 37, 21–35. [Google Scholar] [CrossRef]
- Savary, S.; Rousseau, A.N.; Quilbé, R. Assessing the Effects of Historical Land Cover Changes on Runoff and Low Flows Using Remote Sensing and Hydrological Modeling. J. Hydrol. Eng. 2009, 14, 575–587. [Google Scholar] [CrossRef]
- Kumar, T.; Jhariya, D.C. Identification of rainwater harvesting sites using SCS-CN methodology, remote sensing and Geographical Information System techniques. Geocarto Int. 2016, 32, 1367–1388. [Google Scholar] [CrossRef]
- Kaposztasova, D.; Vranayova, Z.; Markovic, G.; Purcz, P. Rainwater Harvesting, Risk Assessment and Utilization in Kosice-city, Slovakia. Procedia Eng. 2014, 89, 1500–1506. [Google Scholar] [CrossRef] [Green Version]
- Naseef, T.A.U.; Thomas, R. Identification of Suitable Sites for Water Harvesting Structures in Kecheri River Basin. Procedia Technol. 2016, 24, 7–14. [Google Scholar] [CrossRef] [Green Version]
- Li, F.; Cook, S.; Geballe, G.T.; Burch, W.R., Jr. Rainwater harvesting agriculture: An integrated system for water management on rainfed land in China’s semi-arid areas. AMBIO J. Hum. Environ. 2000, 29, 477–484. [Google Scholar] [CrossRef]
- Dhakate, R.; Rao, V.V.S.G.; Raju, B.A.; Mahesh, J.; Rao, S.T.M.; Sankaran, S. Integrated Approach for Identifying Suitable Sites for Rainwater Harvesting Structures for Groundwater Augmentation in Basaltic Terrain. Water Resour. Manag. 2013, 27, 1279–1299. [Google Scholar] [CrossRef]
- Abdulla, F.A.; Amayreh, J.A.; Hossain, A.H. Single Event Watershed Model for Simulating Runoff Hydrograph in Desert Regions. Water Resour. Manag. 2002, 16, 221–238. [Google Scholar] [CrossRef]
- FAO. Land and Water Digital Media Series, 26. Training Course on RWH (CD-ROM). Planning of Water Harvesting Schemes, Unit 22; Food and Agriculture Organization: Rome, Italy, 2003. [Google Scholar]
- Pachpute, J.S.; Tumbo, S.D.; Sally, H.; Mul, M.L. Sustainability of Rainwater Harvesting Systems in Rural Catchment of Sub-Saharan Africa. Water Resour. Manag. 2009, 23, 2815–2839. [Google Scholar] [CrossRef]
- Sarkar, A.; Kumar, R. Artificial Neural Networks for Event Based Rainfall-Runoff Modeling. J. Water Resour. Prot. 2012, 4, 891–897. [Google Scholar] [CrossRef] [Green Version]
- Jasrotia, A.S.; Majhi, A.; Singh, S. Water Balance Approach for Rainwater Harvesting using Remote Sensing and GIS Techniques, Jammu Himalaya, India. Water Resour. Manag. 2009, 23, 3035–3055. [Google Scholar] [CrossRef]
- Young, C.B.; McEnroe, B.M.; Rome, A.C. Empirical Determination of Rational Method Runoff Coefficients. J. Hydrol. Eng. 2009, 14, 1283–1289. [Google Scholar] [CrossRef]
- Kadam, A.K.; Kale, S.S.; Pande, N.N.; Pawar, N.J.; Sankhua, R.N. Identifying Potential Rainwater Harvesting Sites of a Semi-arid, Basaltic Region of Western India, Using SCS-CN Method. Water Resour. Manag. 2012, 26, 2537–2554. [Google Scholar] [CrossRef]
- Ramakrishnan, D.; Bandyopadhyay, A.; Kusuma, K.N. SCS-CN and GIS-based approach for identifying potential water harvesting sites in the Kali Watershed, Mahi River Basin, India. J. Earth Syst. Sci. 2009, 118, 355–368. [Google Scholar] [CrossRef] [Green Version]
- Singh, P.K.; Yaduvanshi, B.K.; Patel, S.; Ray, S. SCS-CN Based Quantification of Potential of Rooftop Catchments and Computation of ASRC for Rainwater Harvesting. Water Resour. Manag. 2013, 27, 2001–2012. [Google Scholar] [CrossRef]
- Tiwari, K.; Goyal, R.; Sarkar, A. GIS-based Methodology for Identification of Suitable Locations for Rainwater Harvesting Structures. Water Resour. Manag. 2018, 32, 1811–1825. [Google Scholar] [CrossRef]
- Huang, M.; Gallichand, J.; Dong, C.; Wang, Z.; Shao, M. Use of soil moisture data and curve number method for estimating runoff in the Loess Plateau of China. Hydrol. Process. 2007, 21, 1471–1481. [Google Scholar] [CrossRef]
- Mishra, S.K.; Pandey, R.P.; Jain, M.K.; Singh, V.P. A Rain Duration and Modified AMC-dependent SCS-CN Procedure for Long Duration Rainfall-runoff Events. Water Resour. Manag. 2007, 22, 861–876. [Google Scholar] [CrossRef]
- Elhakeem, M.; Papanicolaou, A.N. Estimation of the Runoff Curve Number via Direct Rainfall Simulator Measurements in the State of Iowa, USA. Water Resour. Manag. 2009, 23, 2455–2473. [Google Scholar] [CrossRef]
- Bo, X.I.A.O.; Qing-Hai, W.A.N.G.; Jun, F.A.N.; Feng-Peng, H.A.N.; Quan-Hou, D.A.I. Application of the SCS-CN model to runoff estimation in a small watershed with high spatial heterogeneity. Pedosphere 2011, 21, 738–749. [Google Scholar]
- Eshghizadeh, M.; Talebi, A.; Dastorani, M.-T. A Modified LAPSUS Model to Enhance the Effective Rainfall Estimation by SCS-CN Method. Water Resour. Manag. 2018, 32, 3473–3487. [Google Scholar] [CrossRef]
- Saaty, T.L. Decision making with the analytic hierarchy process. Int. J. Serv. Sci. 2008, 1, 83. [Google Scholar] [CrossRef] [Green Version]
- Youssef, A.M.; Pradhan, B.; Hassan, A.M. Flash flood risk estimation along the St. Katherine road, southern Sinai, Egypt using GIS based morphometry and satellite imagery. Environ. Earth Sci. 2011, 62, 611–623. [Google Scholar] [CrossRef]
- Bhatt, S.; Ahmed, S. Morphometric analysis to determine floods in the Upper Krishna basin using Cartosat DEM. Geocarto Int. 2014, 29, 878–894. [Google Scholar] [CrossRef]
- Diakakis, M.; Deligiannakis, G.; Pallikarakis, A.; Skordoulis, M. Factors controlling the spatial distribution of flash flooding in the complex environment of a metropolitan urban area. The case of Athens 2013 flash flood event. Int. J. Disaster Risk Reduct. 2016, 18, 171–180. [Google Scholar] [CrossRef]
- Singh, L.K.; Jha, M.K.; Chowdary, V. Multi-criteria analysis and GIS modeling for identifying prospective water harvesting and artificial recharge sites for sustainable water supply. J. Clean. Prod. 2017, 142, 1436–1456. [Google Scholar] [CrossRef]
- Wu, R.-S.; Molina, G.L.L.; Hussain, F. Optimal Sites Identification for Rainwater Harvesting in Northeastern Guatemala by Analytical Hierarchy Process. Water Resour. Manag. 2018, 32, 4139–4153. [Google Scholar] [CrossRef] [Green Version]
- Al-Ghobari, H.; Dewidar, A.; Alataway, A. Estimation of Surface Water Runoff for a Semi-Arid Area Using RS and GIS-Based SCS-CN Method. Water 2020, 12, 1924. [Google Scholar] [CrossRef]
- Shadeed, S.; Almasri, M. Application of GIS-based SCS-CN method in West Bank catchments, Palestine. Water Sci. Eng. 2010, 3, 1–13. [Google Scholar]
- New, M.; Lister, D.; Hulme, M.; Makin, I. A high-resolution data set of surface climate over global land areas. Clim. Res. 2002, 21, 1–25. [Google Scholar] [CrossRef] [Green Version]
- Kahinda, J.M.; Lillie, E.; Taigbenu, A.; Taute, M.; Boroto, R. Developing suitability maps for rainwater harvesting in South Africa. Phys. Chem. Earth Parts A B C 2008, 33, 788–799. [Google Scholar] [CrossRef]
- Adham, A.; Riksen, M.; Ouessar, M.; Ritsema, C.J. A Methodology to Assess and Evaluate Rainwater Harvesting Techniques in (Semi-) Arid Regions. Water 2016, 8, 198. [Google Scholar] [CrossRef] [Green Version]
- Horton, R.E. Erosional development of streams and their drainage basins; hydrophysical approach to quantitative morphology. Geol. Soc. Am. Bull. 1945, 56, 275–370. [Google Scholar] [CrossRef] [Green Version]
- Mbilinyi, B.; Tumbo, S.; Mahoo, H.; Senkondo, E.; Hatibu, N. Indigenous knowledge as decision support tool in rainwater harvesting. Phys. Chem. Earth Parts A B C 2005, 30, 792–798. [Google Scholar] [CrossRef]
- Al-Adamat, R. GIS As A Decision Support System for Sitting Water Harvesting Ponds in The Basalt Aquifer/NE Jordan. J. Environ. Assess. Policy Manag. 2008, 10, 189–206. [Google Scholar] [CrossRef]
- NRCS. Hydrologic Soil Groups. In National Engineering Handbook; United States Department of Agriculture, Natural Resources Conservation Science, US Government Printing Office: Washington, DC, USA, 2009. [Google Scholar]
- Ibrahim, M.B. Rainwater Harvesting for Urban Areas: A Success Story from Gadarif City in Central Sudan. Water Resour. Manag. 2009, 23, 2727–2736. [Google Scholar] [CrossRef]
- Agarwal, R.; Garg, P.K.; Garg, R.D. Remote Sensing and GIS Based Approach for Identification of Artificial Recharge Sites. Water Resour. Manag. 2013, 27, 2671–2689. [Google Scholar] [CrossRef]
- SCS. Hydrology. In National Engineering Handbook; United States Department of Agriculture, Soil Conservation Service, US Government Printing Office: Washington, DC, USA, 1985. [Google Scholar]
- Ponce, V.M.; Hawkins, R.H. Runoff Curve Number: Has It Reached Maturity? J. Hydrol. Eng. 1996, 1, 11–19. [Google Scholar] [CrossRef]
- Shrestha, M.N. Spatially distributed hydrological modelling considering land-use changes using remote sensing and GIS. In Proceedings of the Map Asia Conference, Kuala Lumpur, Malaysia, 13 October 2003. [Google Scholar]
- Saaty, T.L.; Kearns, K.P. The Analytic Hierarchy Process; Elsevier BV: Amsterdam, The Netherlands, 1985; pp. 19–62. [Google Scholar]
- Saaty, T.L. How to make a decision: The analytic hierarchy process. Eur. J. Oper. Res. 1990, 48, 9–26. [Google Scholar] [CrossRef]
- SCS. Urban. Hydrology for Small Watersheds, Technical Release No. 55 (TR-55); United States Department of Agriculture, Soil Conservation Service, US Government Printing Office: Washington, DC, USA, 1986; pp. 2–6.
Figure 1.
A map of the Wadi Nu’man watershed in Saudi Arabia.

Figure 2.
The study area’s yearly average precipitation and temperature.

Figure 3.
The digital elevation map of the study area.

Figure 4.
Delineation of Wadi Nu’man watershed map.

Figure 5.
Flow chart showing the adopted methodology.

Figure 6.
Land use/cover map of the study area.

Figure 7.
Hydrologic soil group (HSG) map of the study region.

Figure 8.
Slope map of the study region.

Figure 9.
Drainage density map of the study area.

Figure 10.
Distribution of curve number (CN) map in the study area.

Figure 11.
Runoff depth potential map in the study area.

Figure 12.
Map of the study area depicting RWH potential zones.

Figure 13.
Zones suitable for the farm ponds within the watershed area.


Table 1.
Natural resource conservation service classification [37].
Table 1.
Natural resource conservation service classification [37].
| Hydrologic Soil Group | Soil Taxonomy | Runoff Potential | Water Transmission | Infiltration (mm/h) |
|---|---|---|---|---|
| A | “Sand, loamy sand or sandy loam” | Low | High rate | >7.62 |
| B | “Silt loam or loam” | Moderate | Moderate rate | 3.81–7.62 |
| C | “Sandy clay loam” | Moderate | Low rate | 1.27–3.81 |
| D | “Clay loam, silty clay loam, sandy clay, silty clay, clay” | High | Very low rate | <1.27 |
Publisher’s Note: MDPI stays neutral with regard to jurisdictional claims in published maps and institutional affiliations. |
© 2021 by the authors. Licensee MDPI, Basel, Switzerland. This article is an open access article distributed under the terms and conditions of the Creative Commons Attribution (CC BY) license (http://creativecommons.org/licenses/by/4.0/).
Share and Cite
MDPI and ACS Style
Al-Ghobari, H.; Dewidar, A.Z. Integrating GIS-Based MCDA Techniques and the SCS-CN Method for Identifying Potential Zones for Rainwater Harvesting in a Semi-Arid Area. Water 2021, 13, 704. https://doi.org/10.3390/w13050704
AMA Style
Al-Ghobari H, Dewidar AZ. Integrating GIS-Based MCDA Techniques and the SCS-CN Method for Identifying Potential Zones for Rainwater Harvesting in a Semi-Arid Area. Water. 2021; 13(5):704. https://doi.org/10.3390/w13050704
Chicago/Turabian StyleAl-Ghobari, Hussein, and Ahmed Z. Dewidar. 2021. "Integrating GIS-Based MCDA Techniques and the SCS-CN Method for Identifying Potential Zones for Rainwater Harvesting in a Semi-Arid Area" Water 13, no. 5: 704. https://doi.org/10.3390/w13050704
Note that from the first issue of 2016, this journal uses article numbers instead of page numbers. See further details here.