
Water-Sediment Physicochemical Dynamics in a Large Reservoir in the Mediterranean Region under Multiple Stressors

 ,
,  , ,
, ,  , , ,
, , ,  ,
,  , and
, and 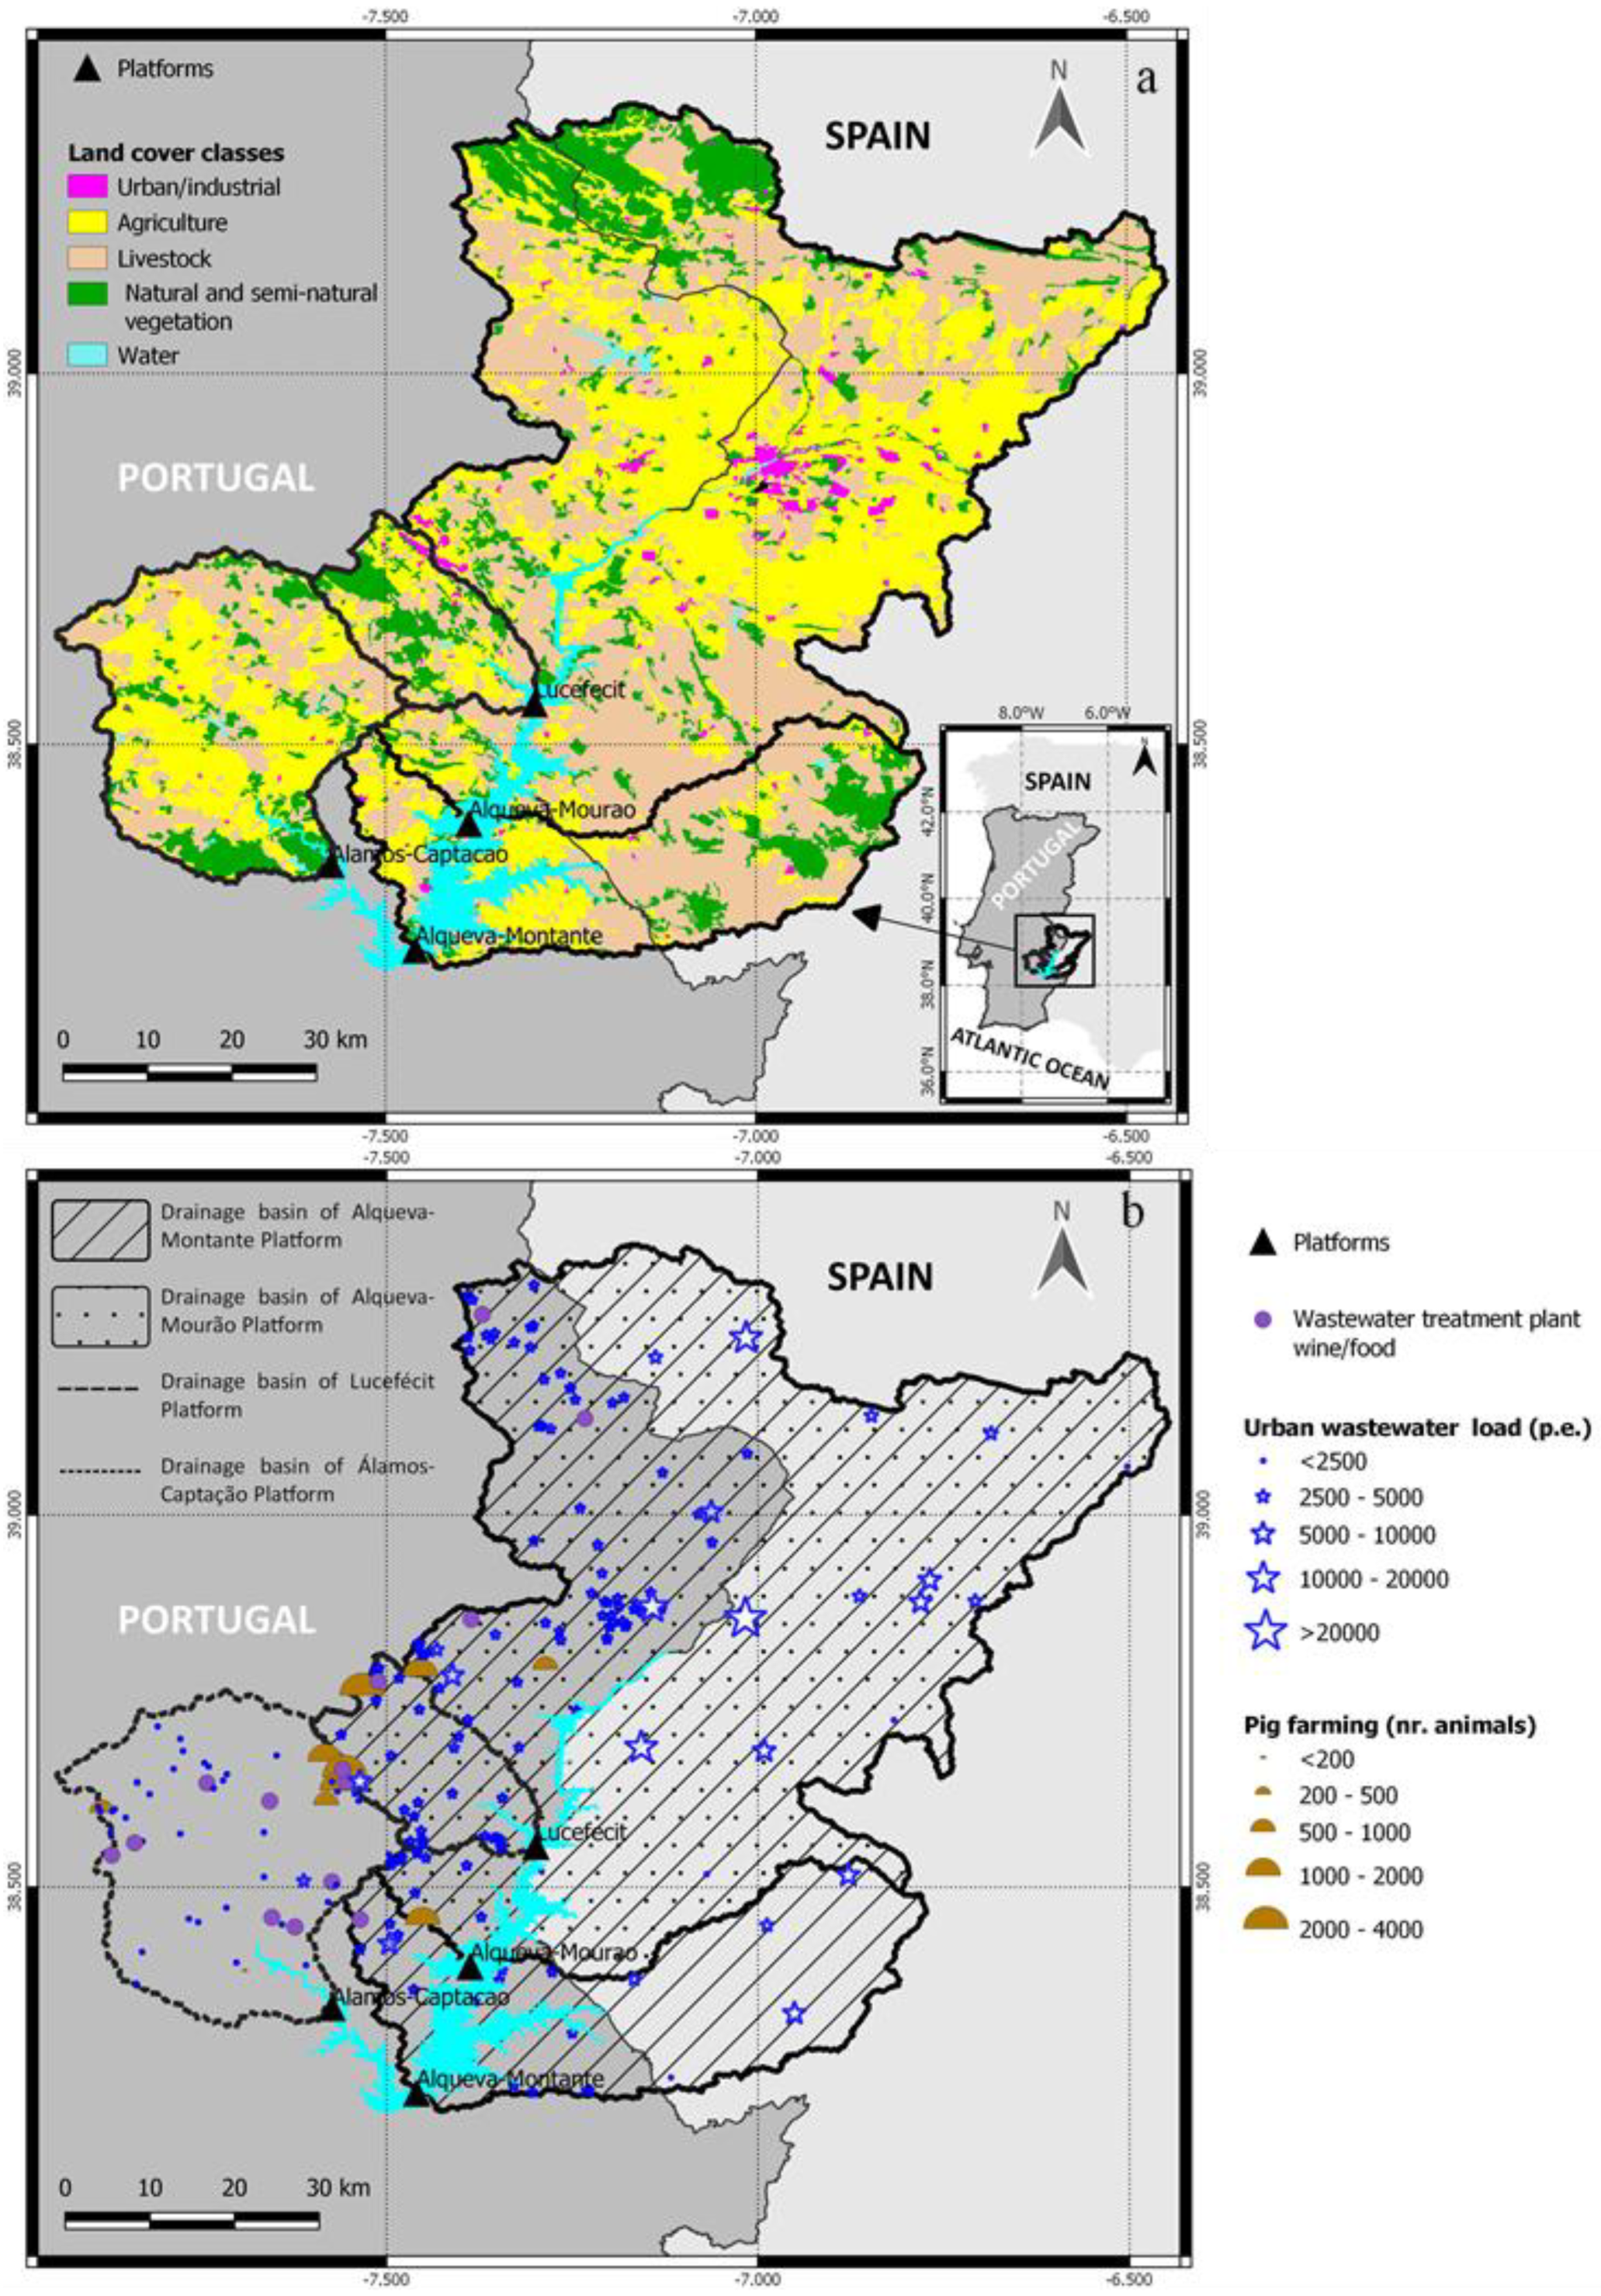
Abstract
:1. Introduction
2. Materials and Methods
2.1. Study Area and Sampling Sites Characterization
2.2. Climatological and Land Use/Land Cover (LULC) Characterization
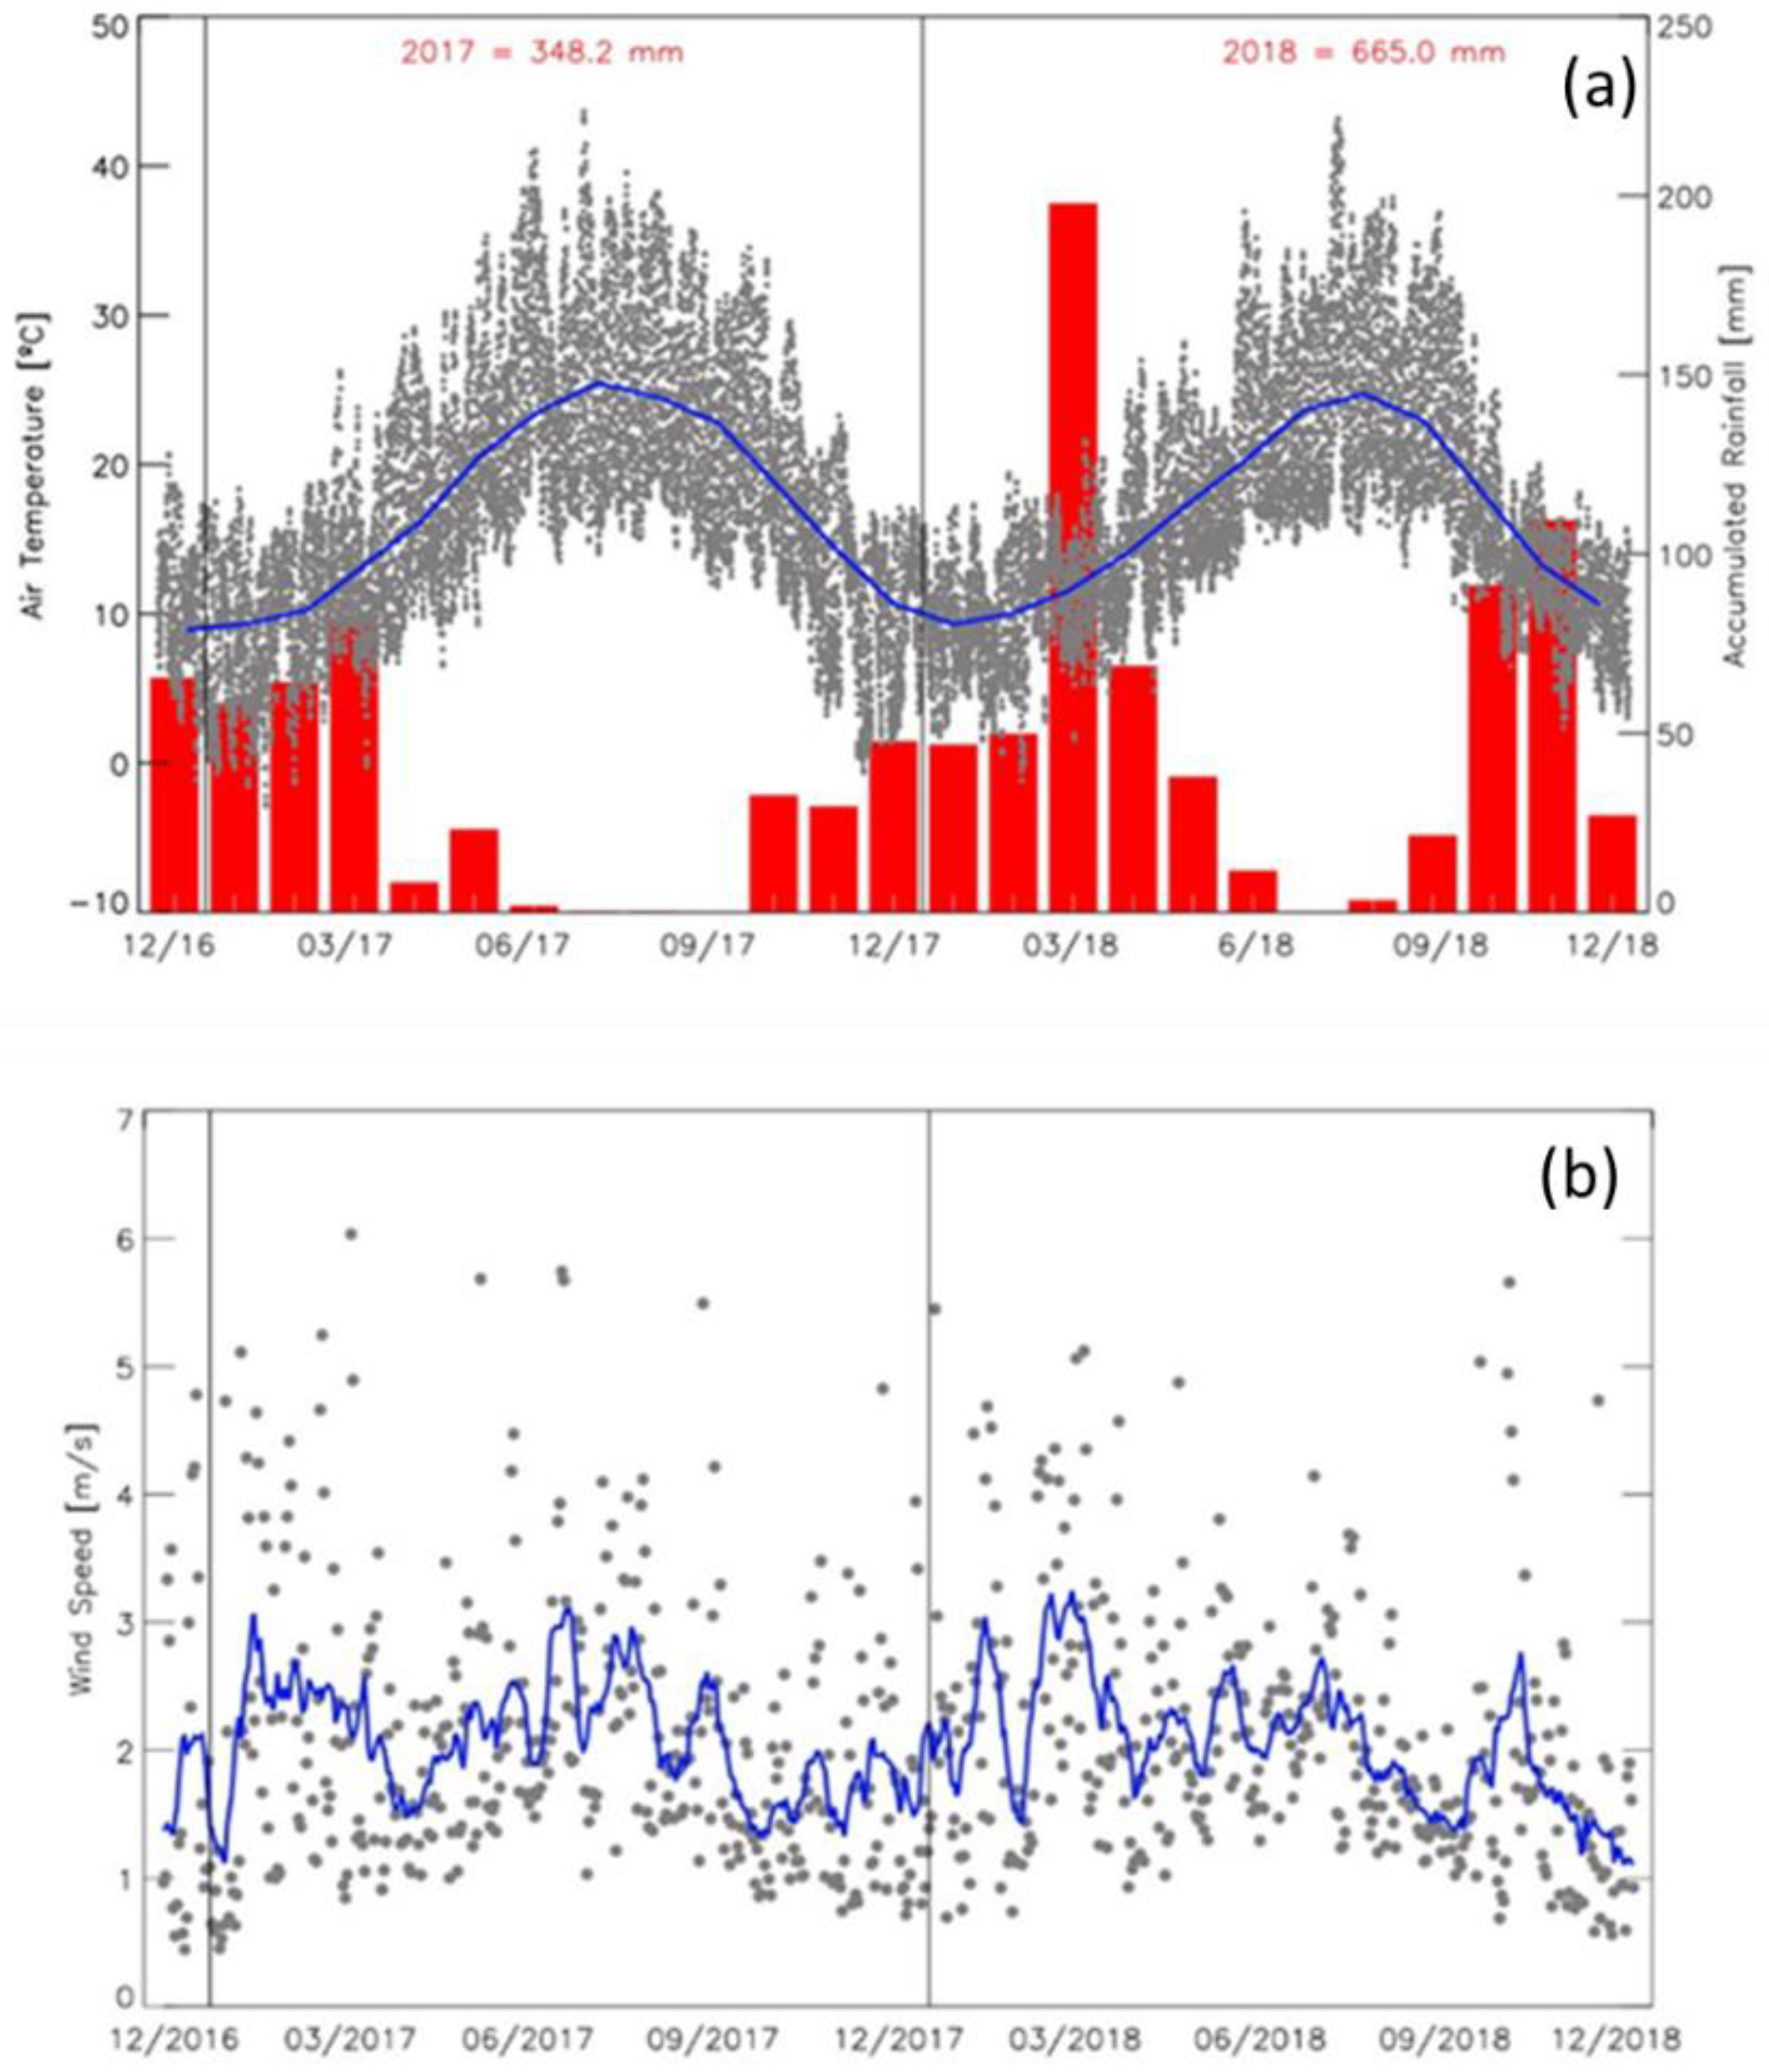
2.2.1. Climate Conditions
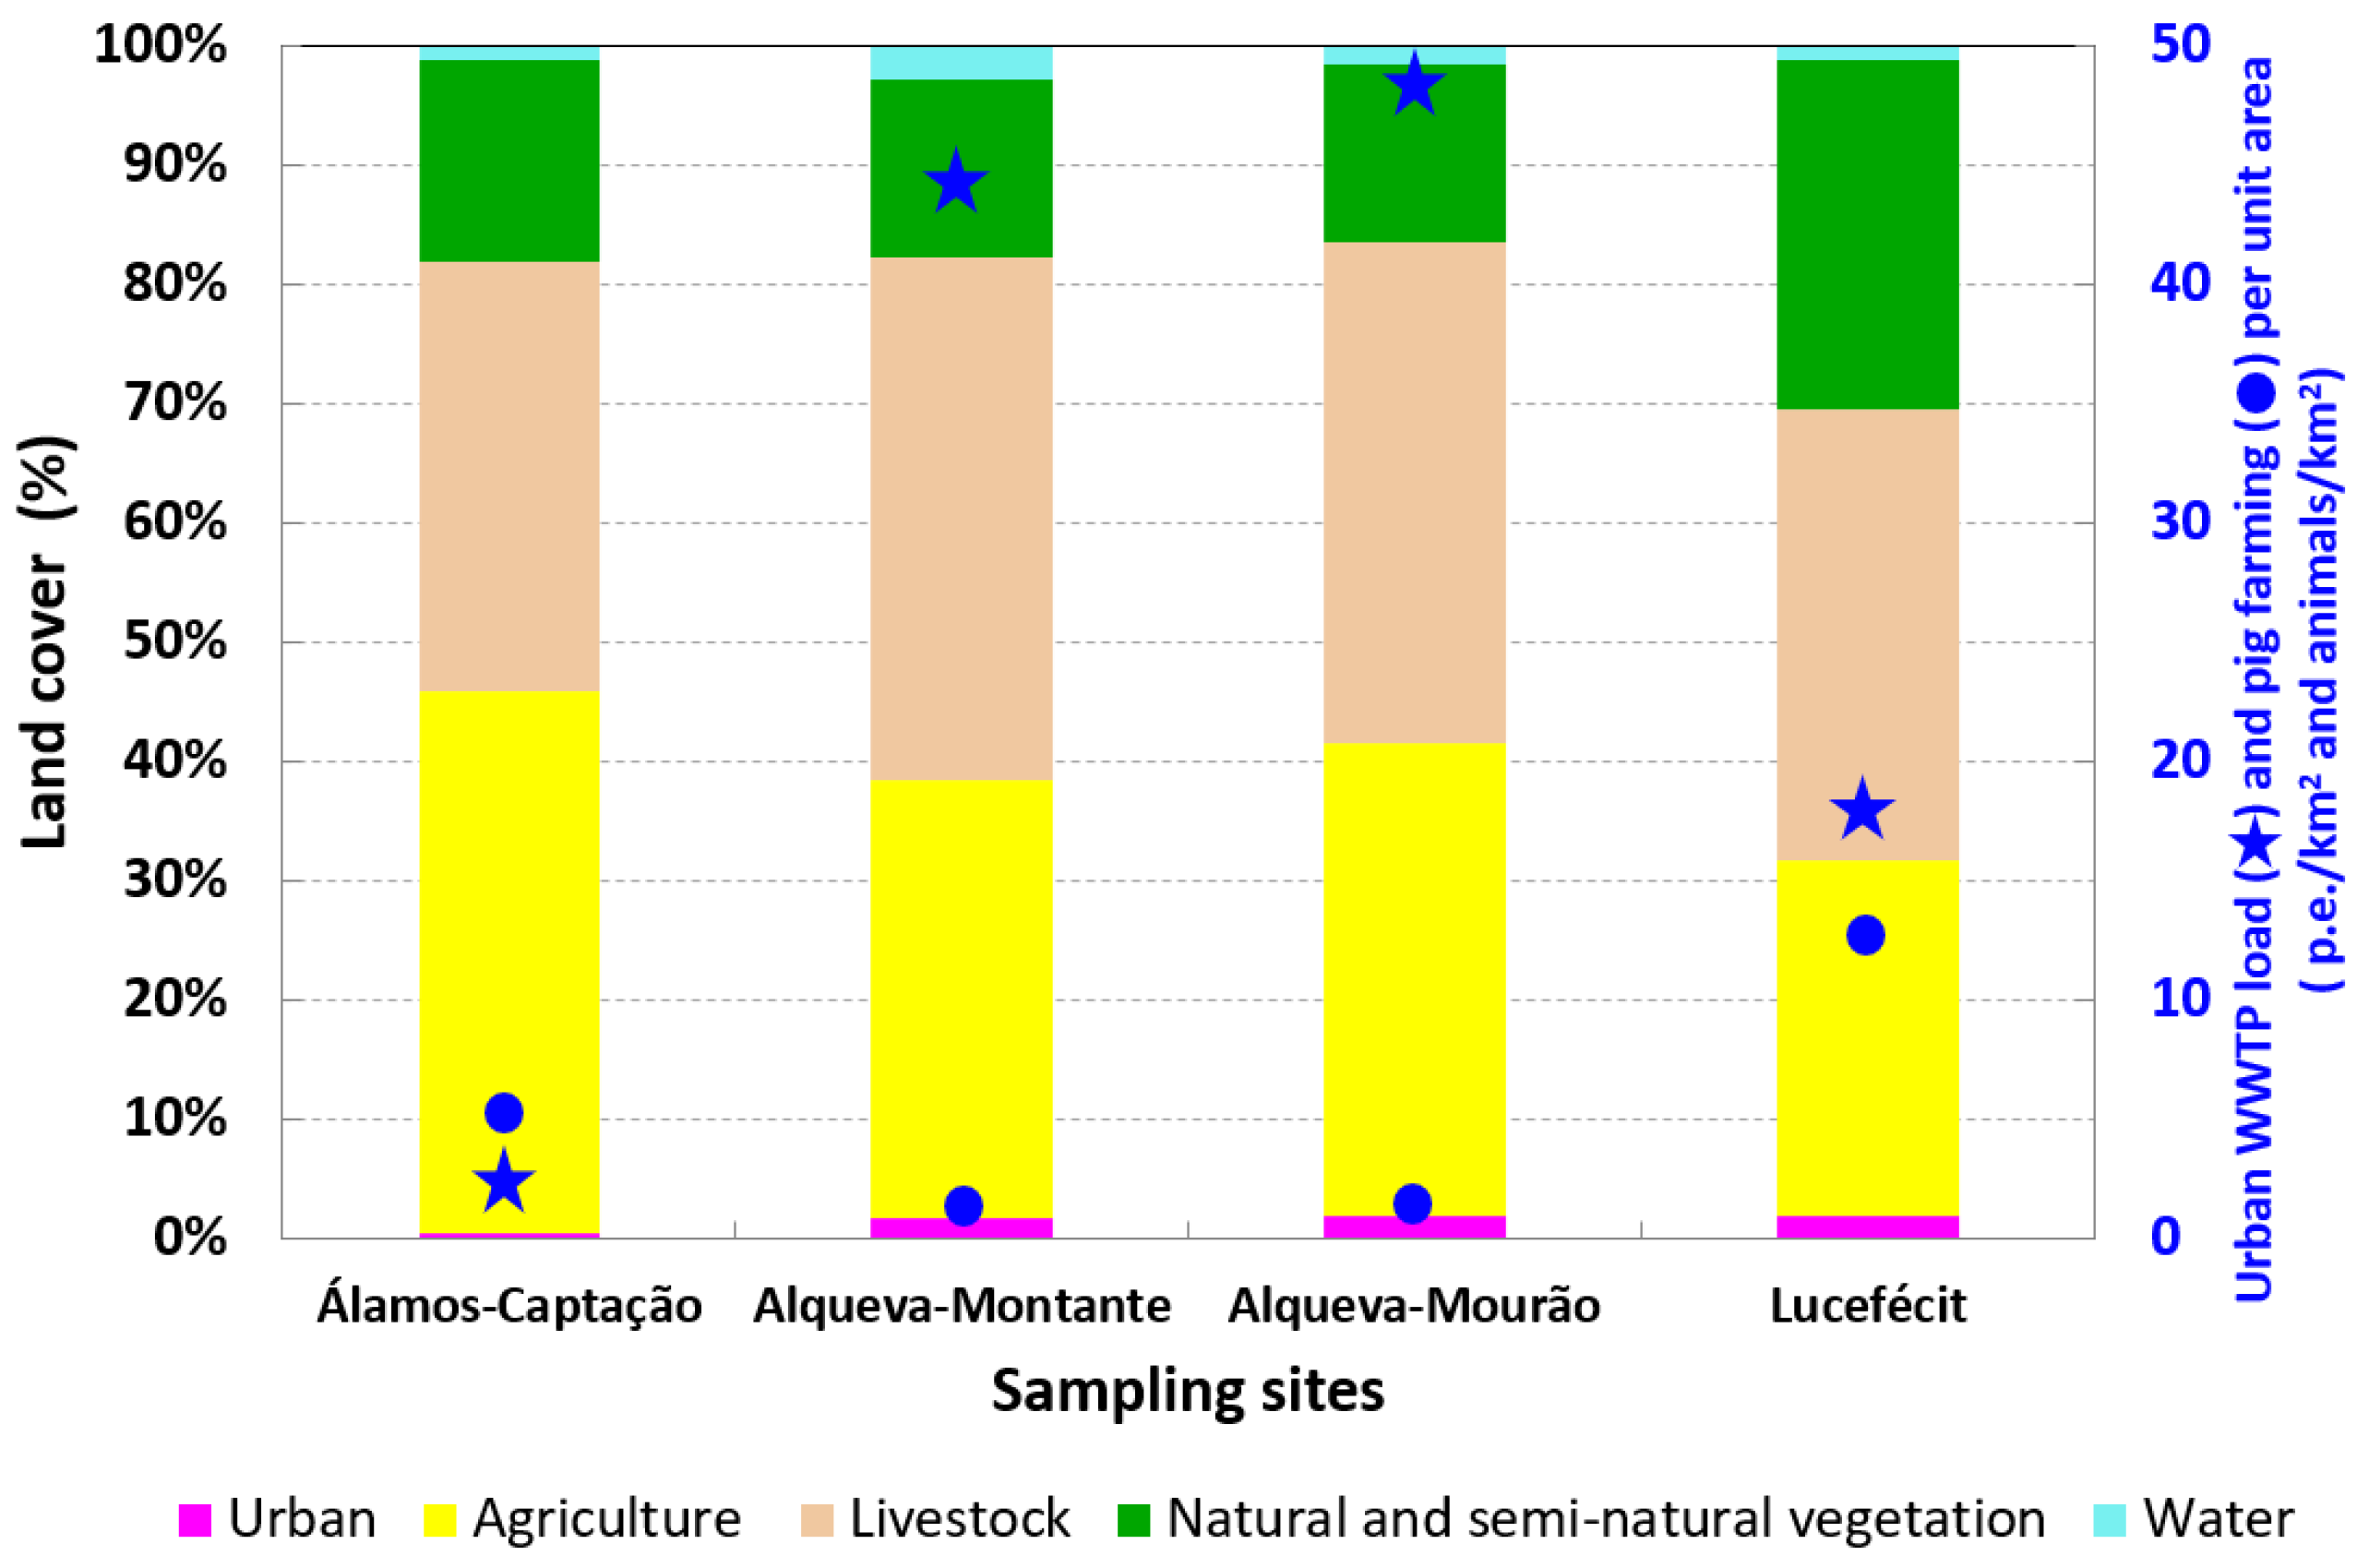
2.2.2. Land Use/Land Cover (LULC) Patterns
2.3. Sampling
2.4. Physical, Chemical and Phytoplankton Biomass Characterization
2.4.1. Water Parameters
2.4.2. Sediment Parameters
2.5. Statistical Treatment of Data
3. Results and Discussion
3.1. Meteorological and Land Use/Land Cover (LULC) Characterization
3.1.1. Meteorological Conditions
3.1.2. LULC Characterization
3.2. Water Column Seasonal and Spatial Dynamics
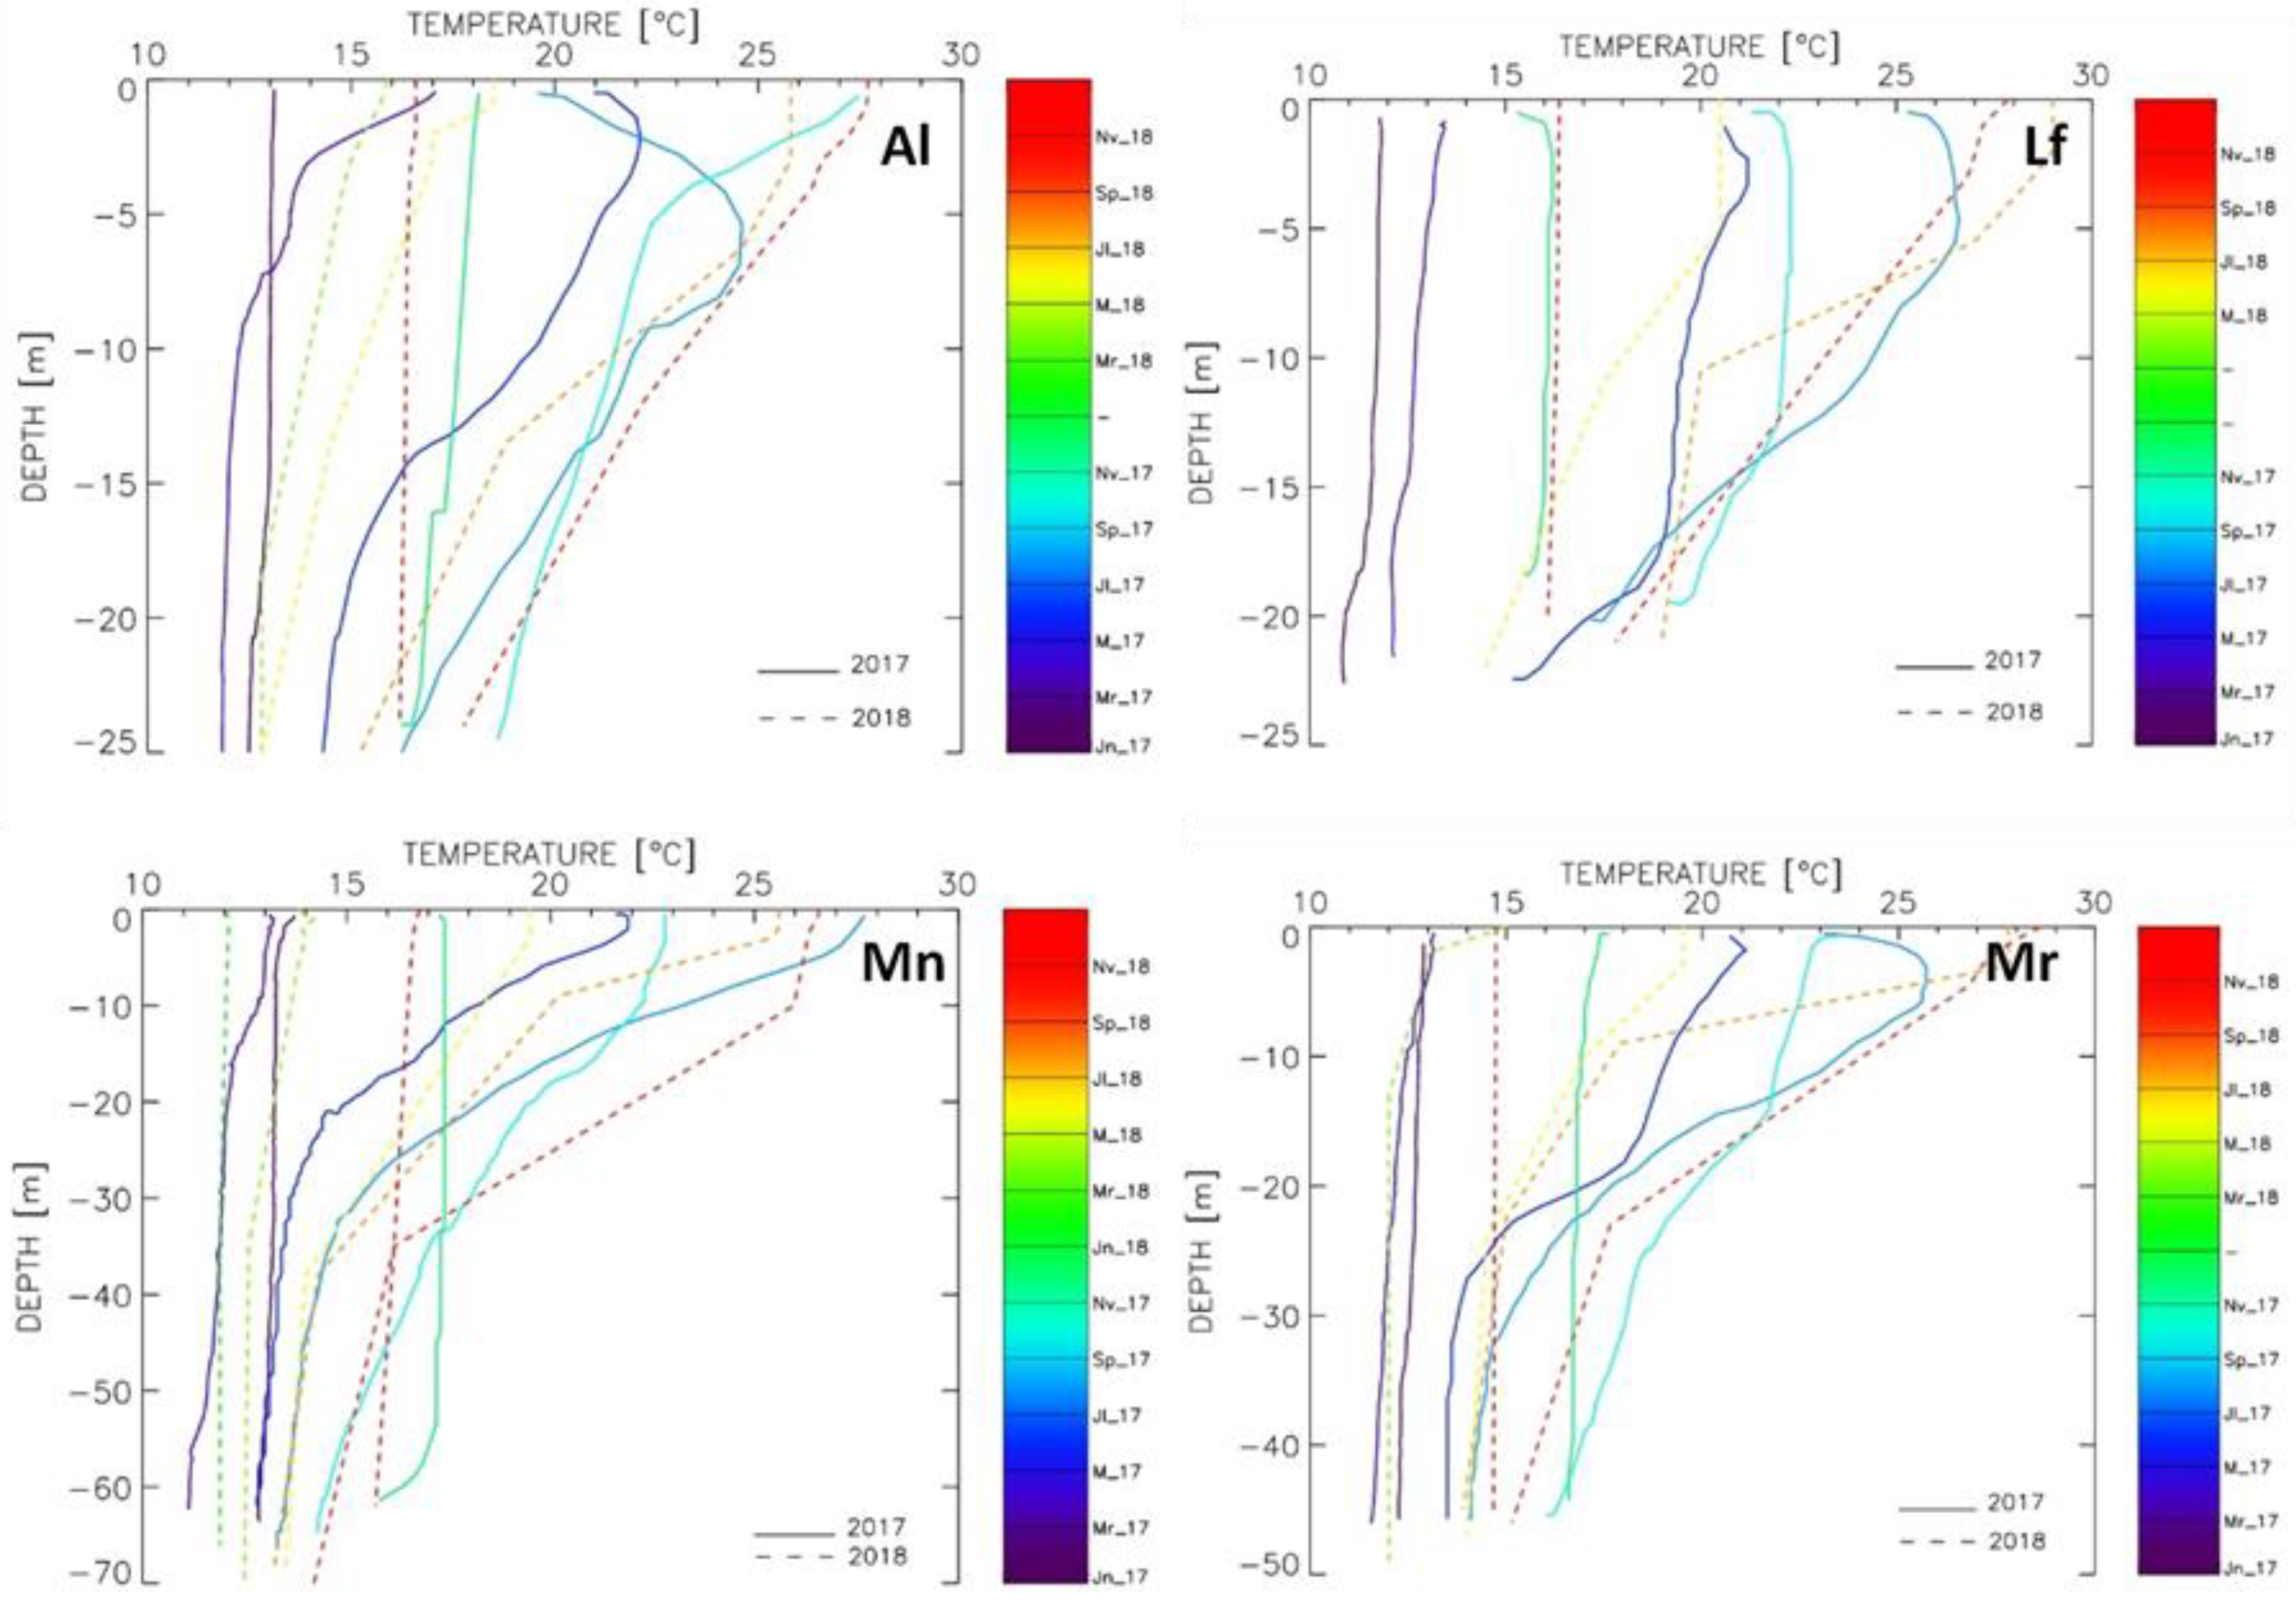
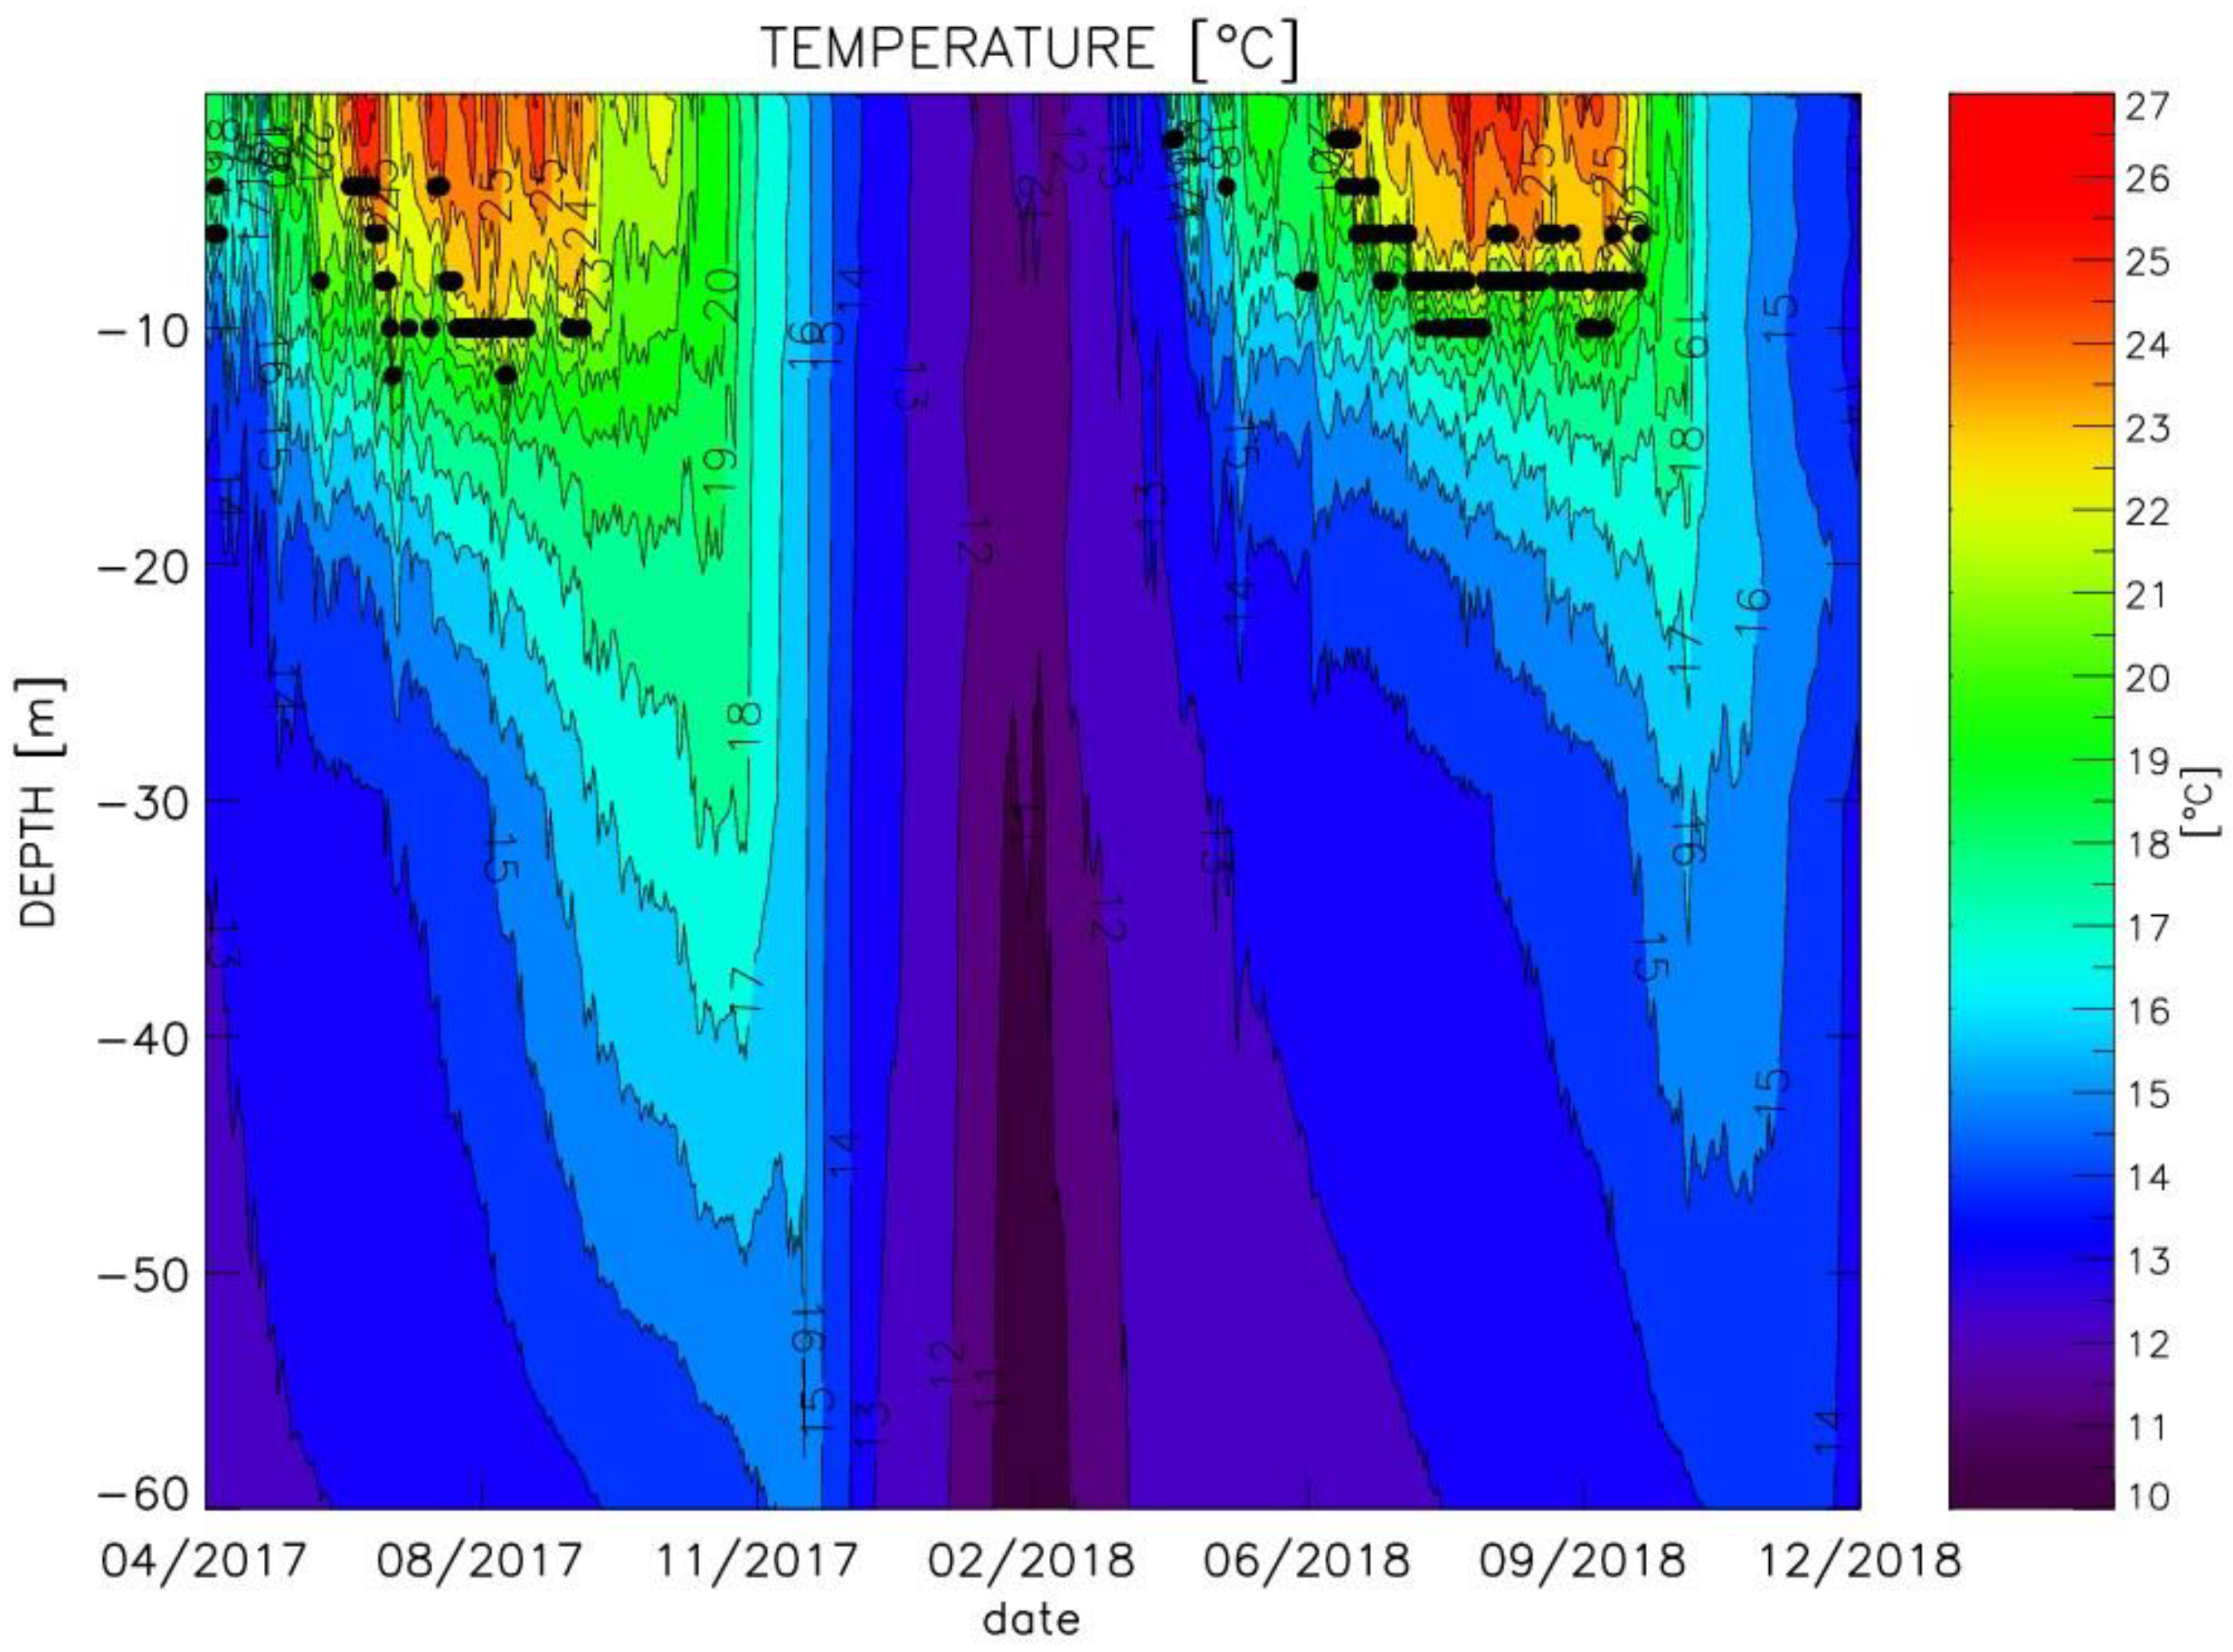
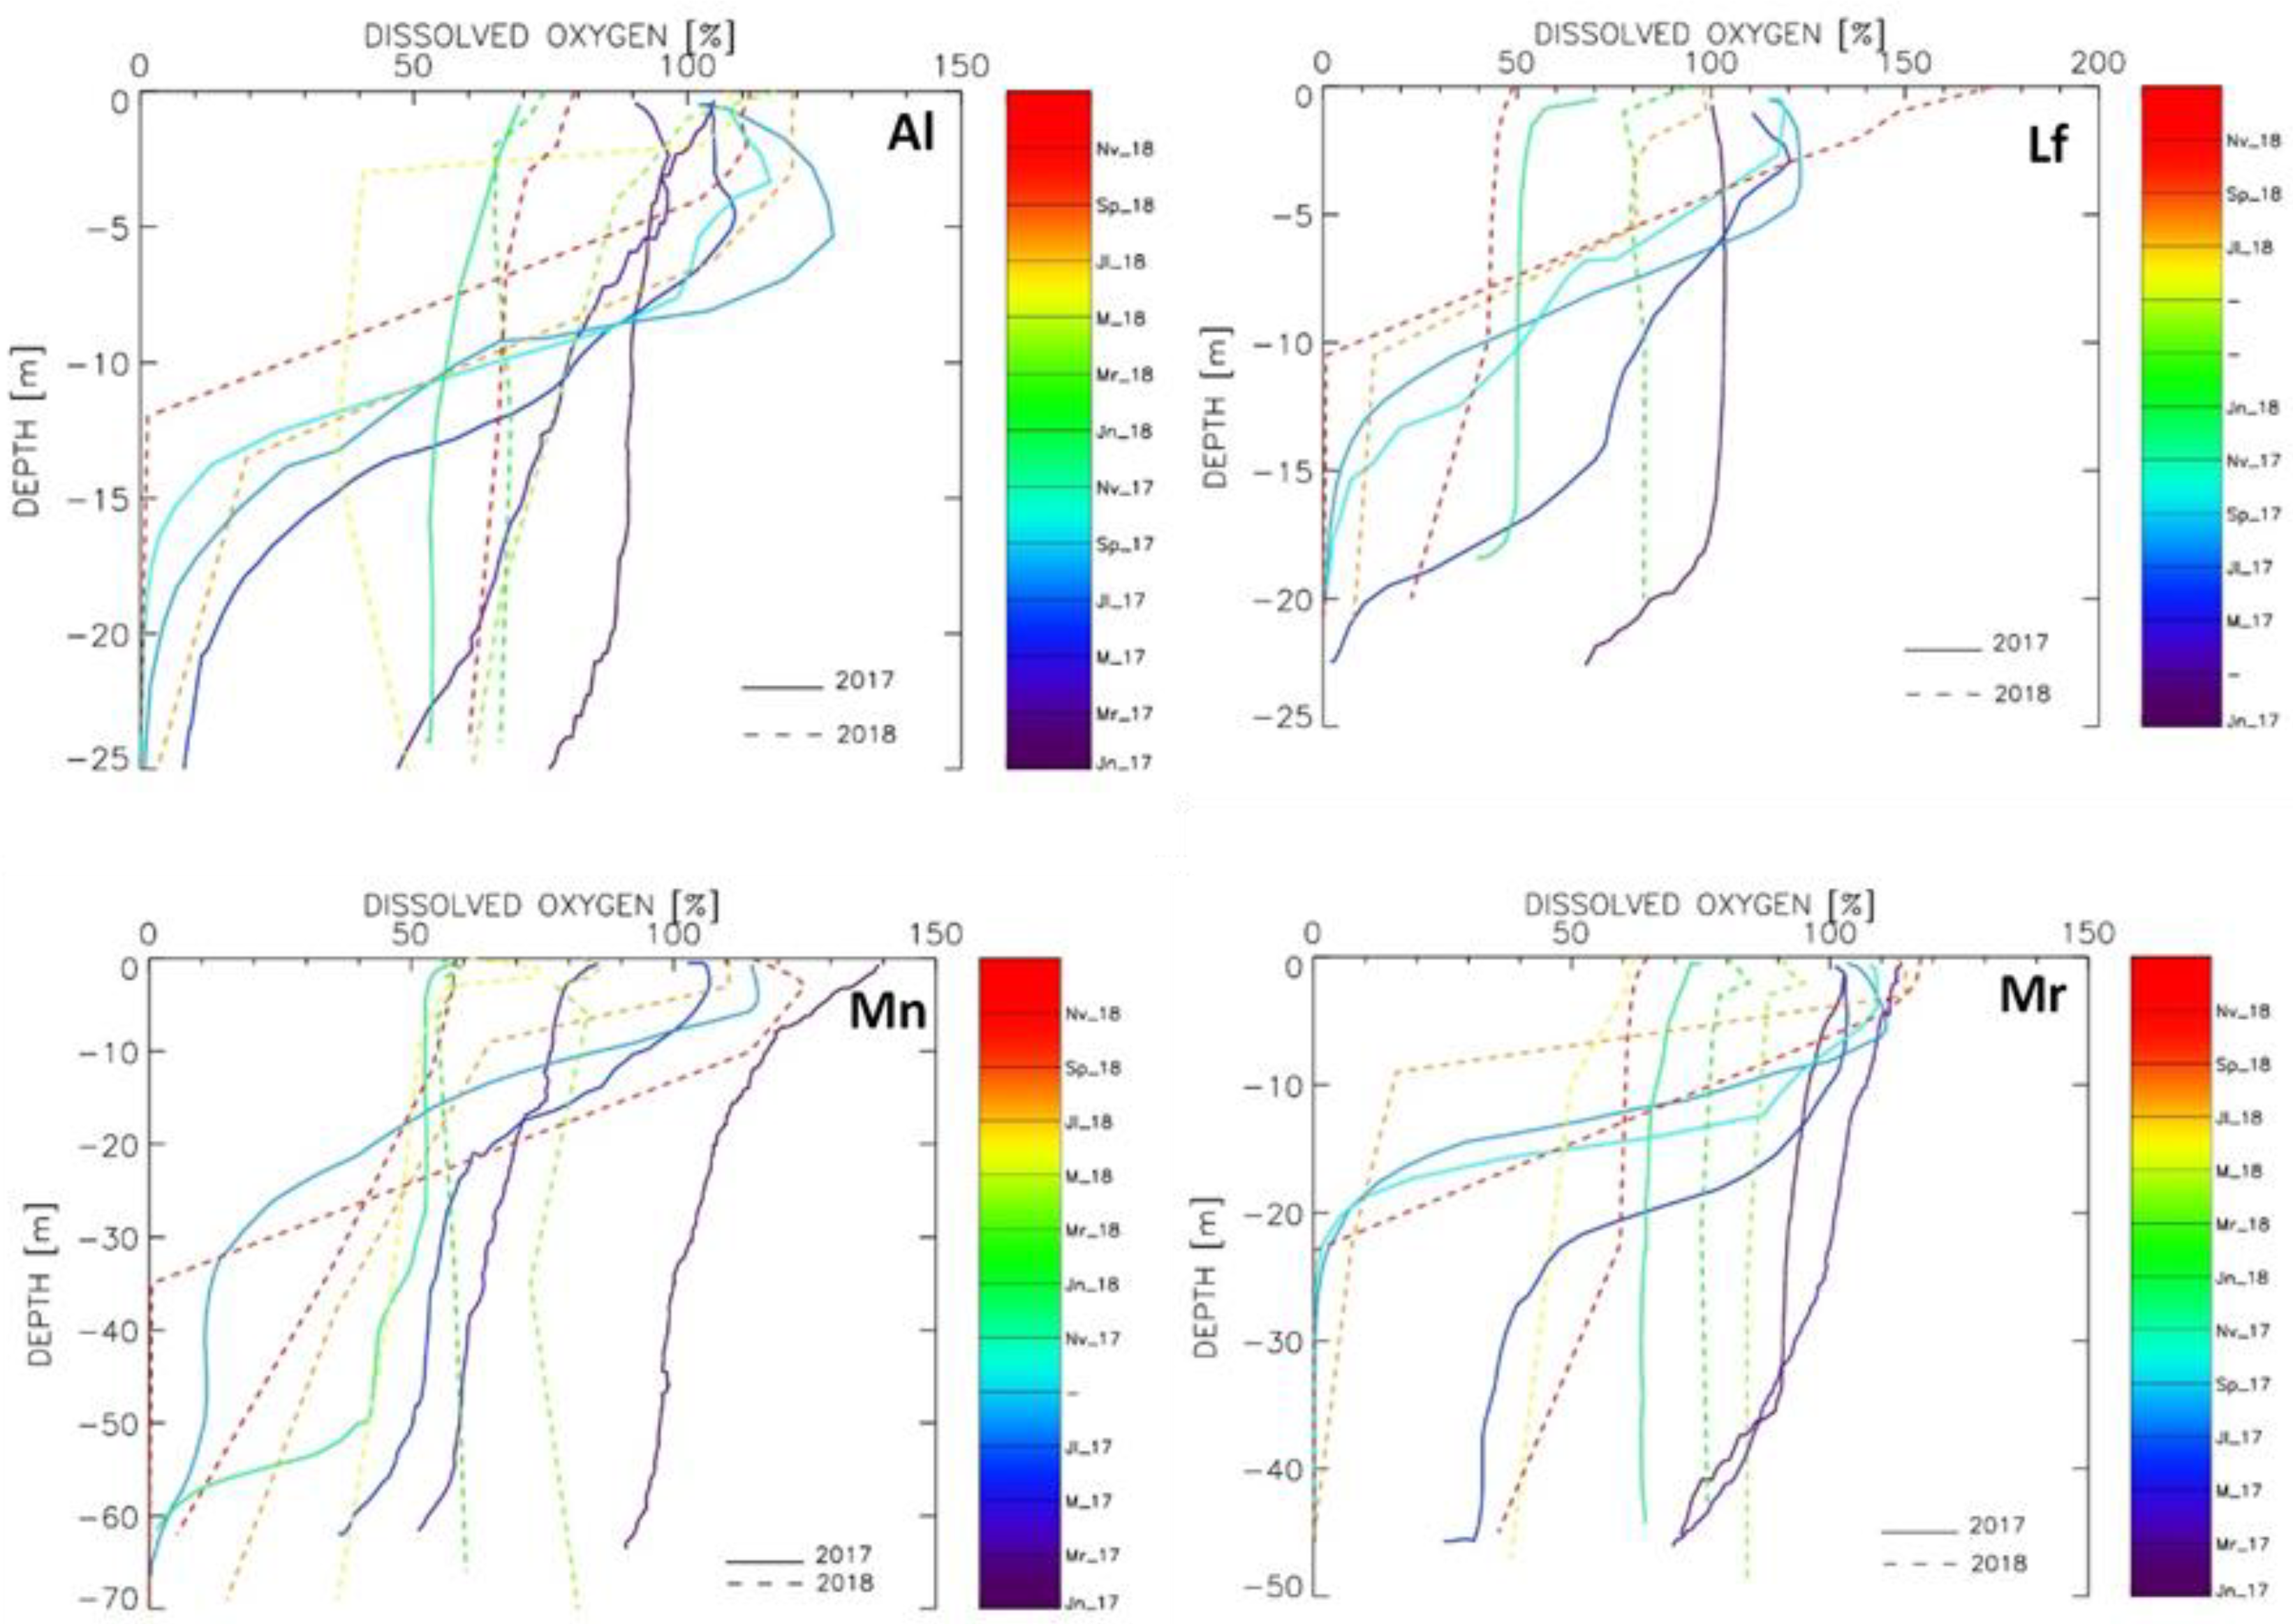
3.2.1. Temperature and Dissolved Oxygen Profiles
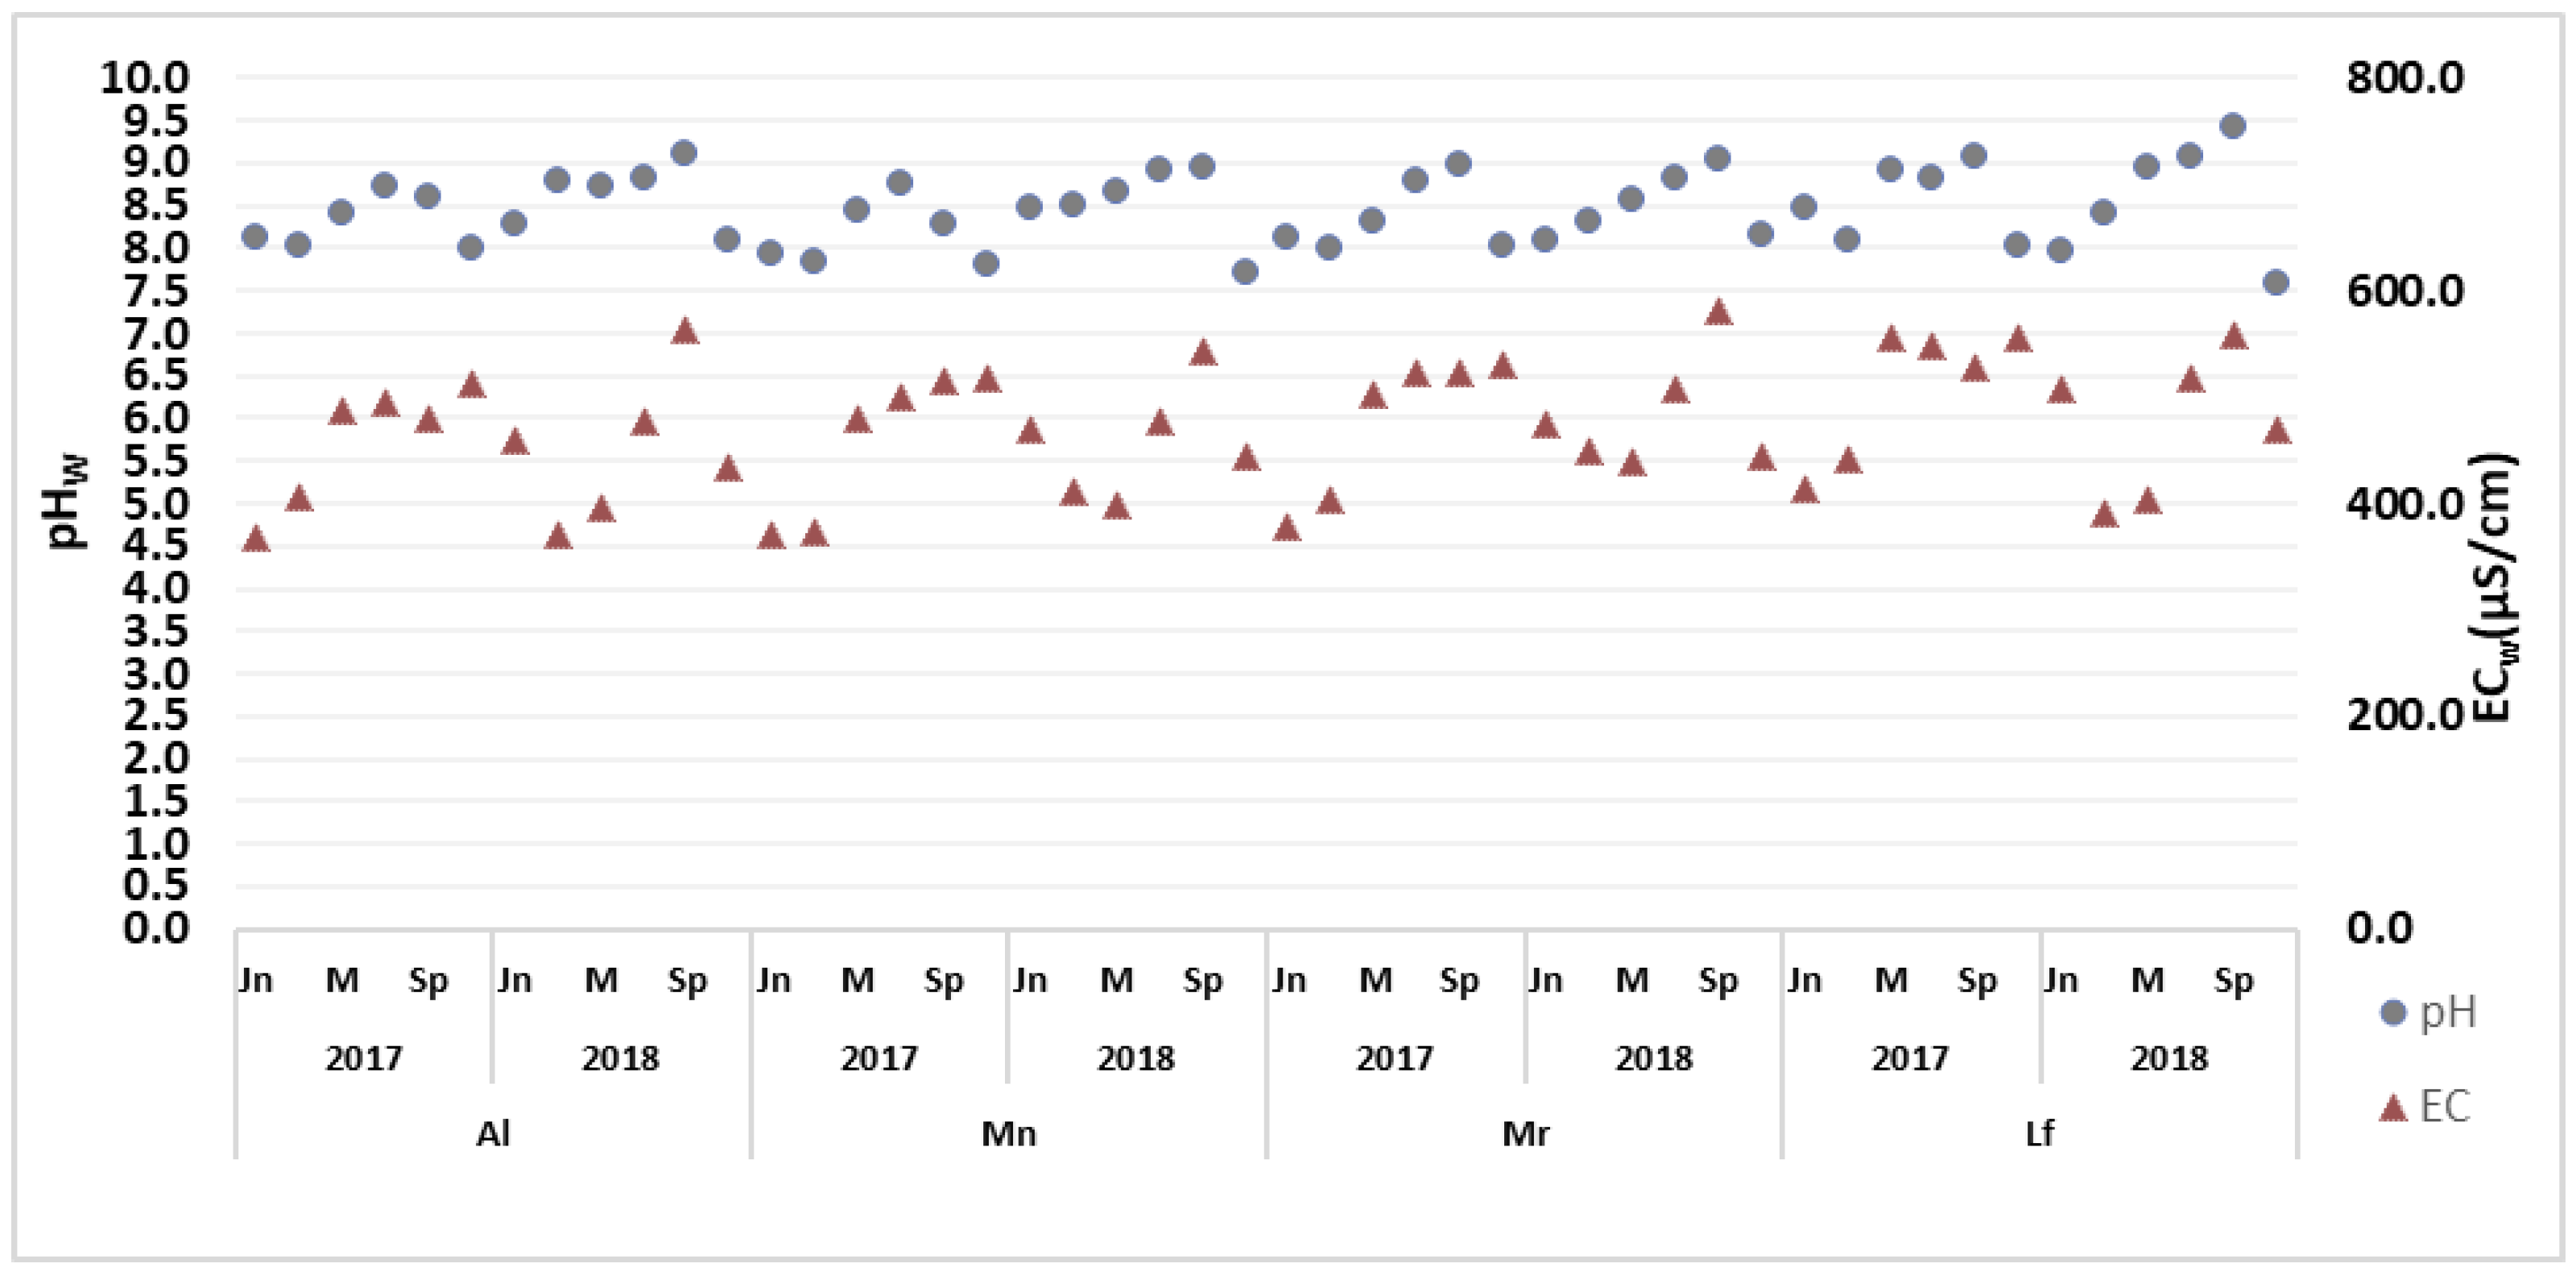
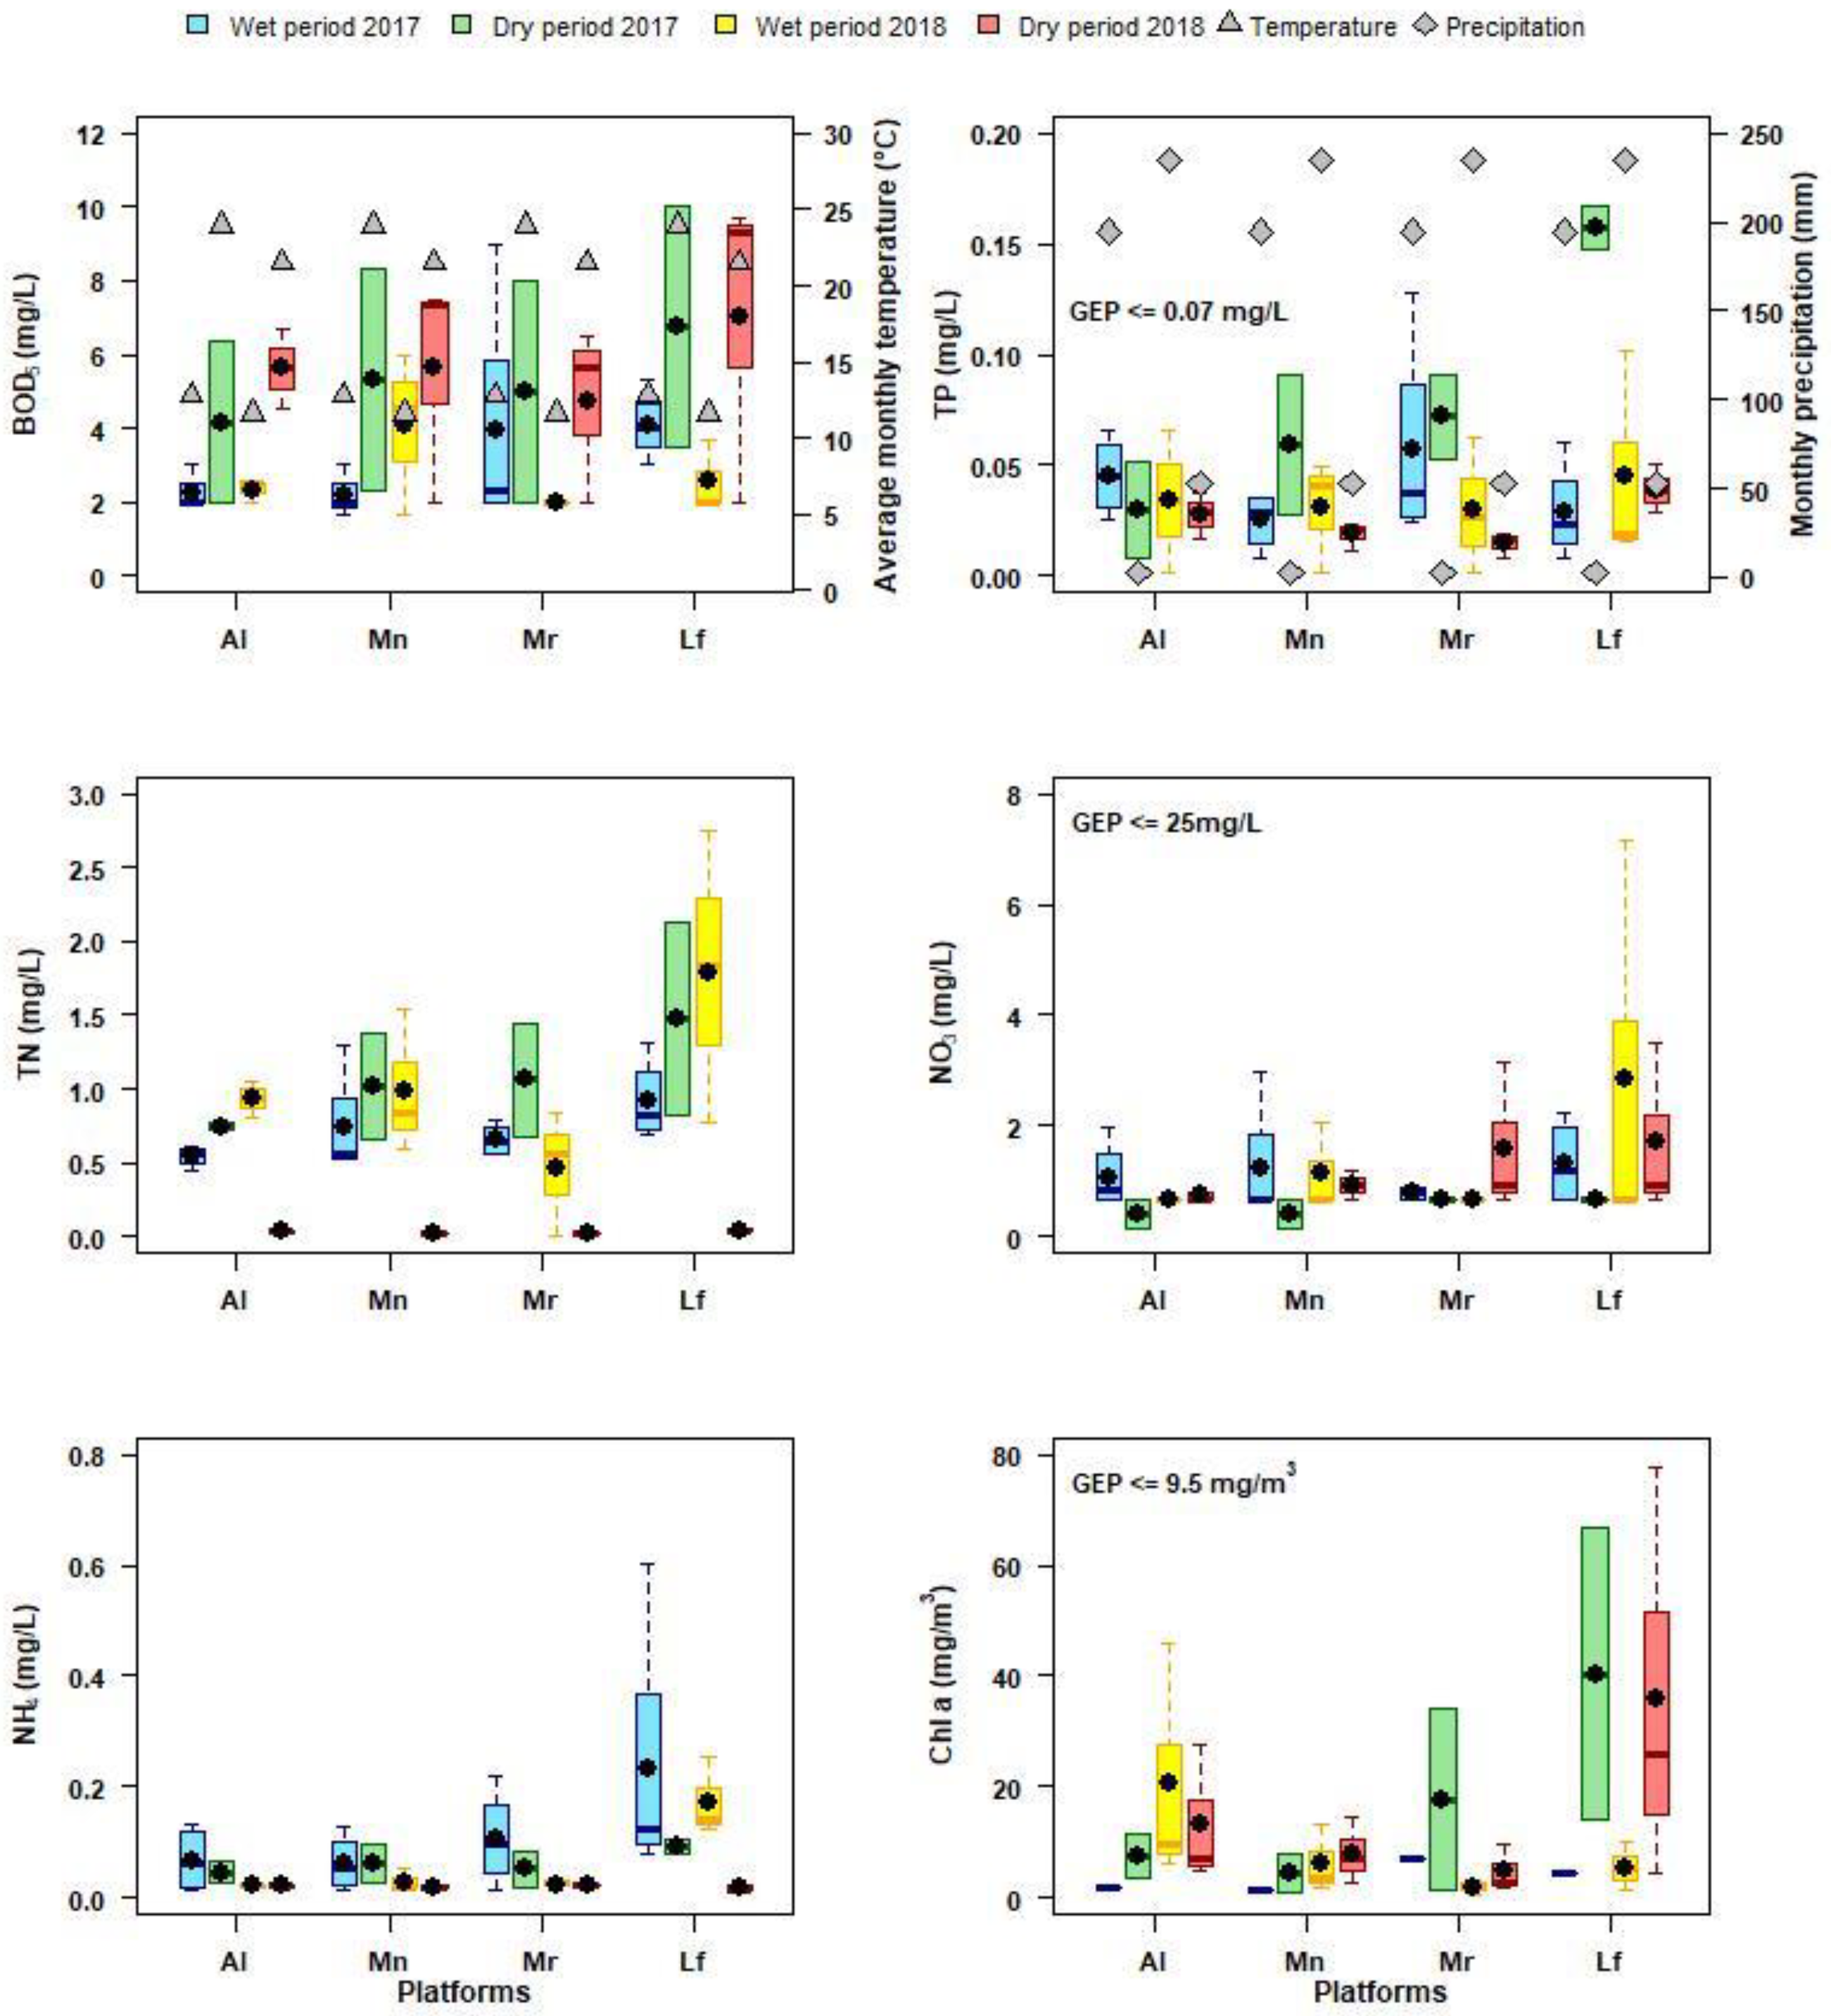
3.2.2. Chemical and Phytoplankton Biomass Patterns
3.3. Sediments Seasonal and Spatial Dynamics
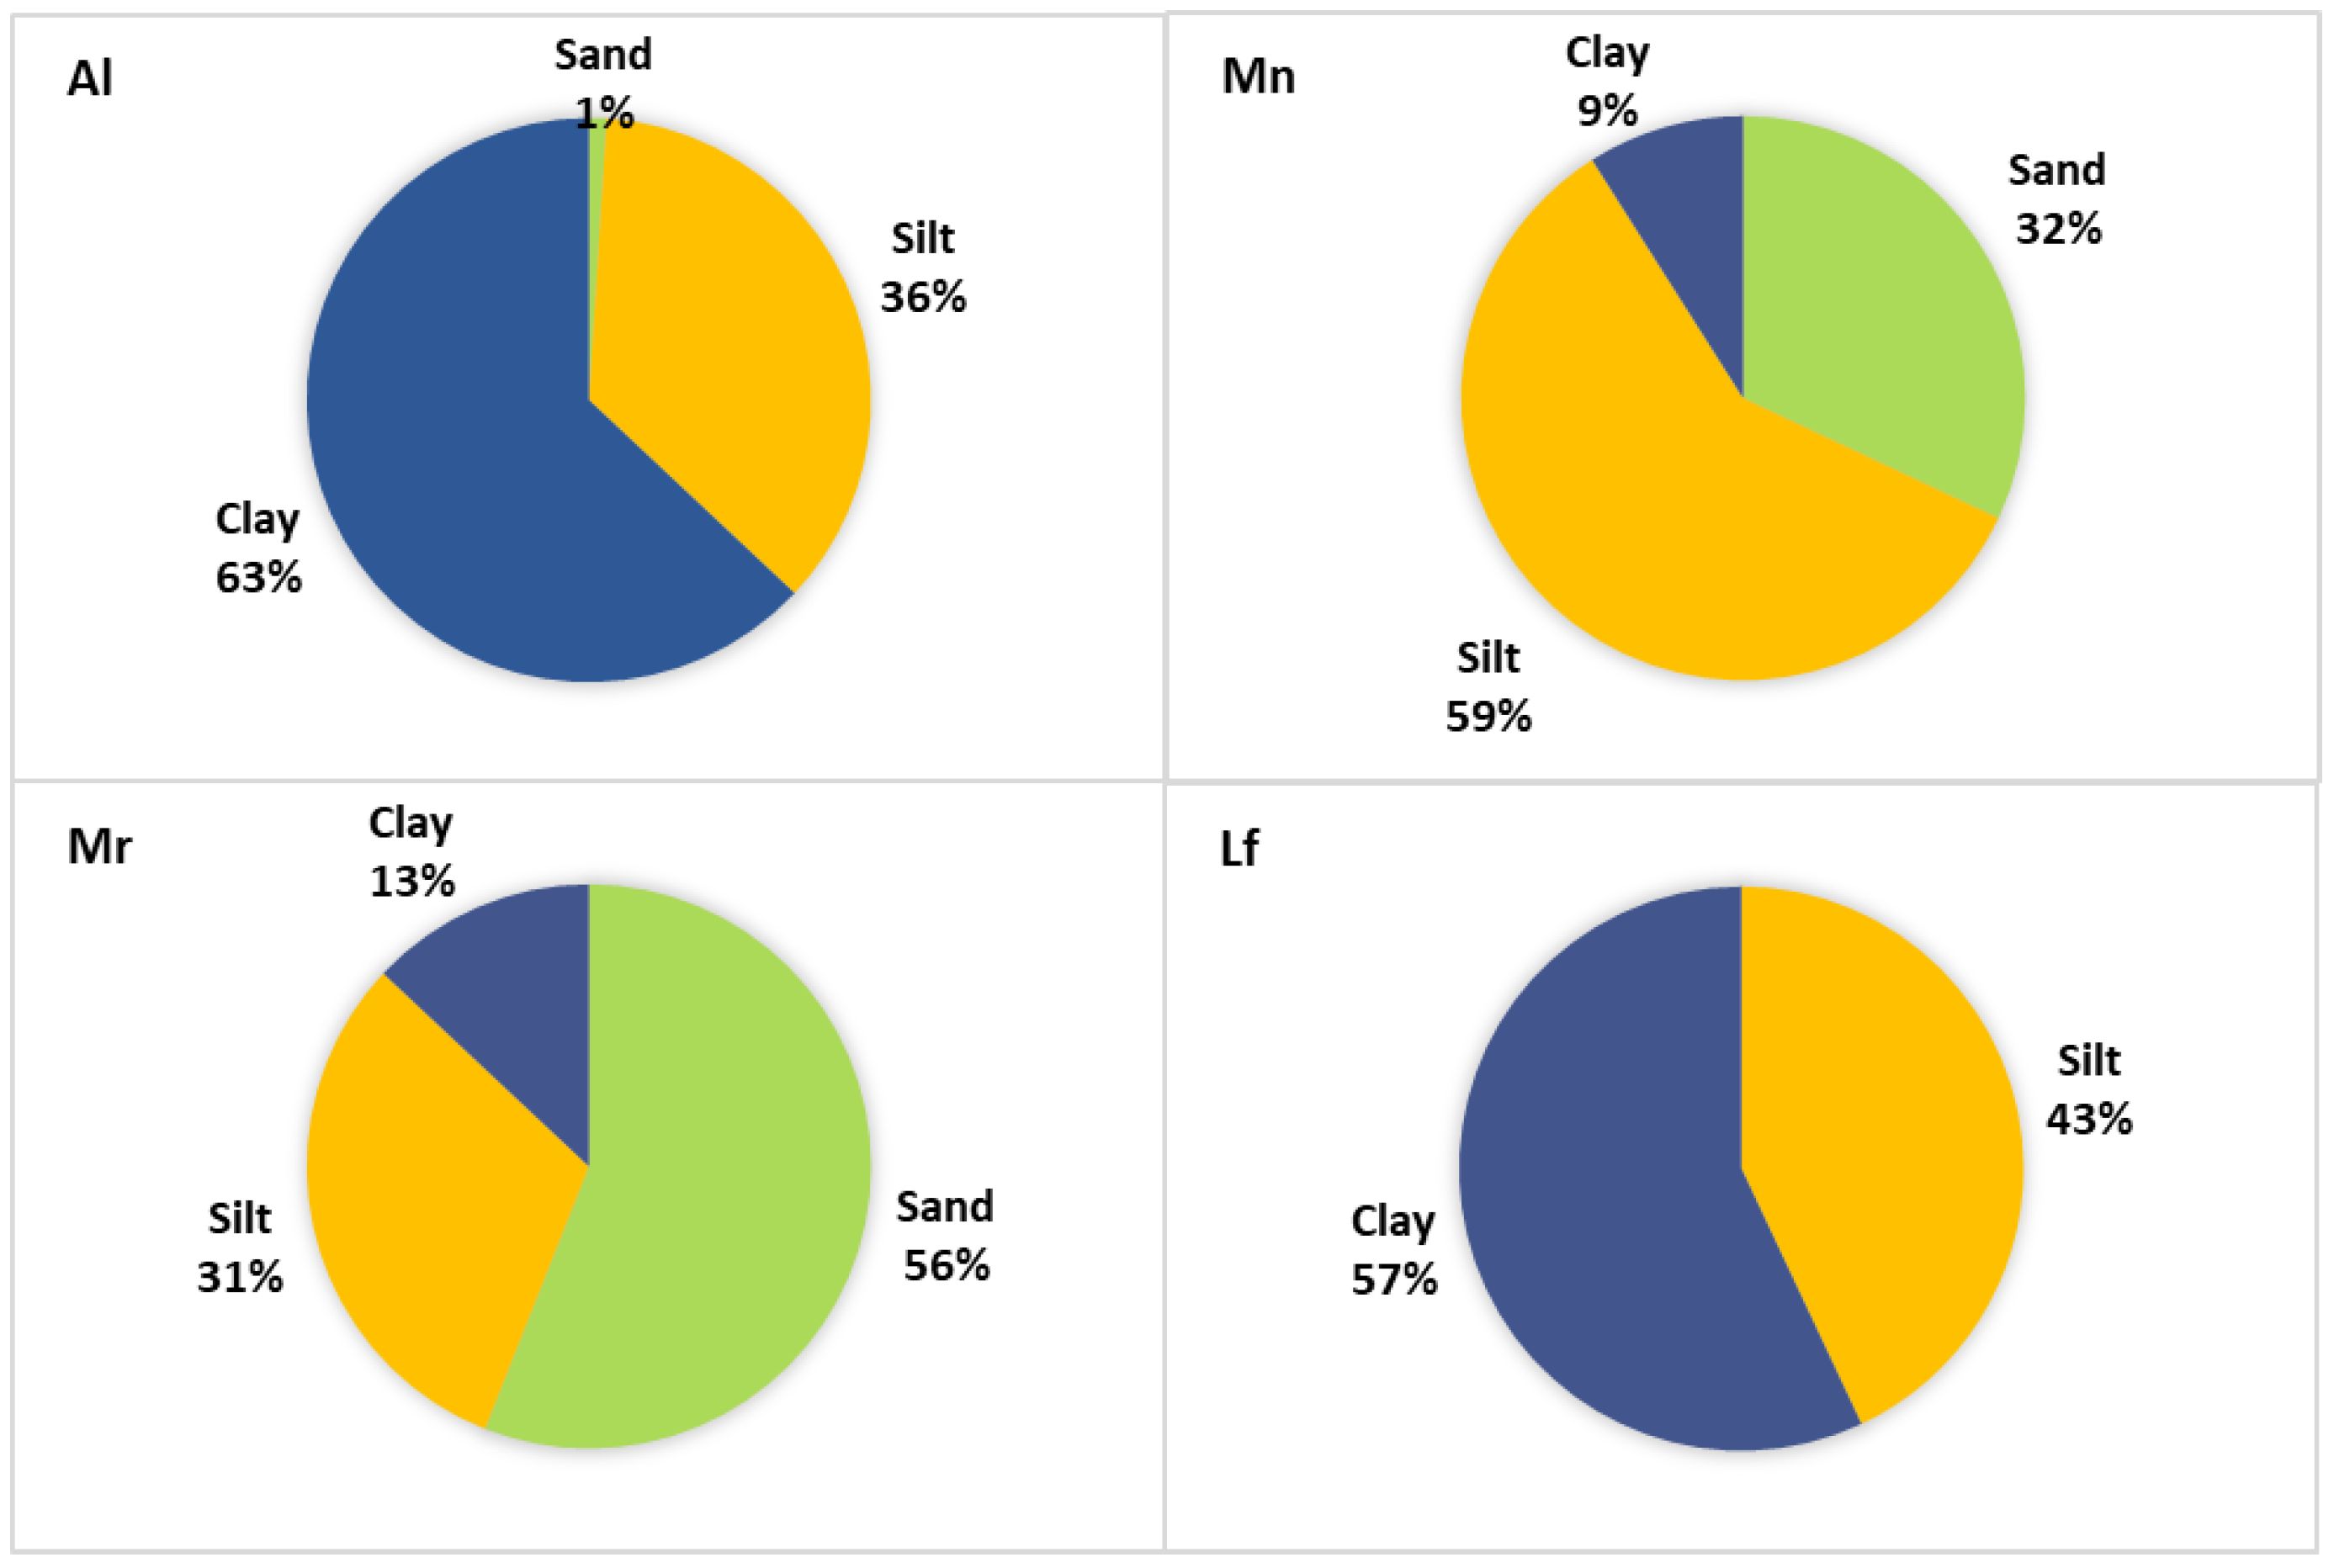
3.3.1. Granulometric Characteristics
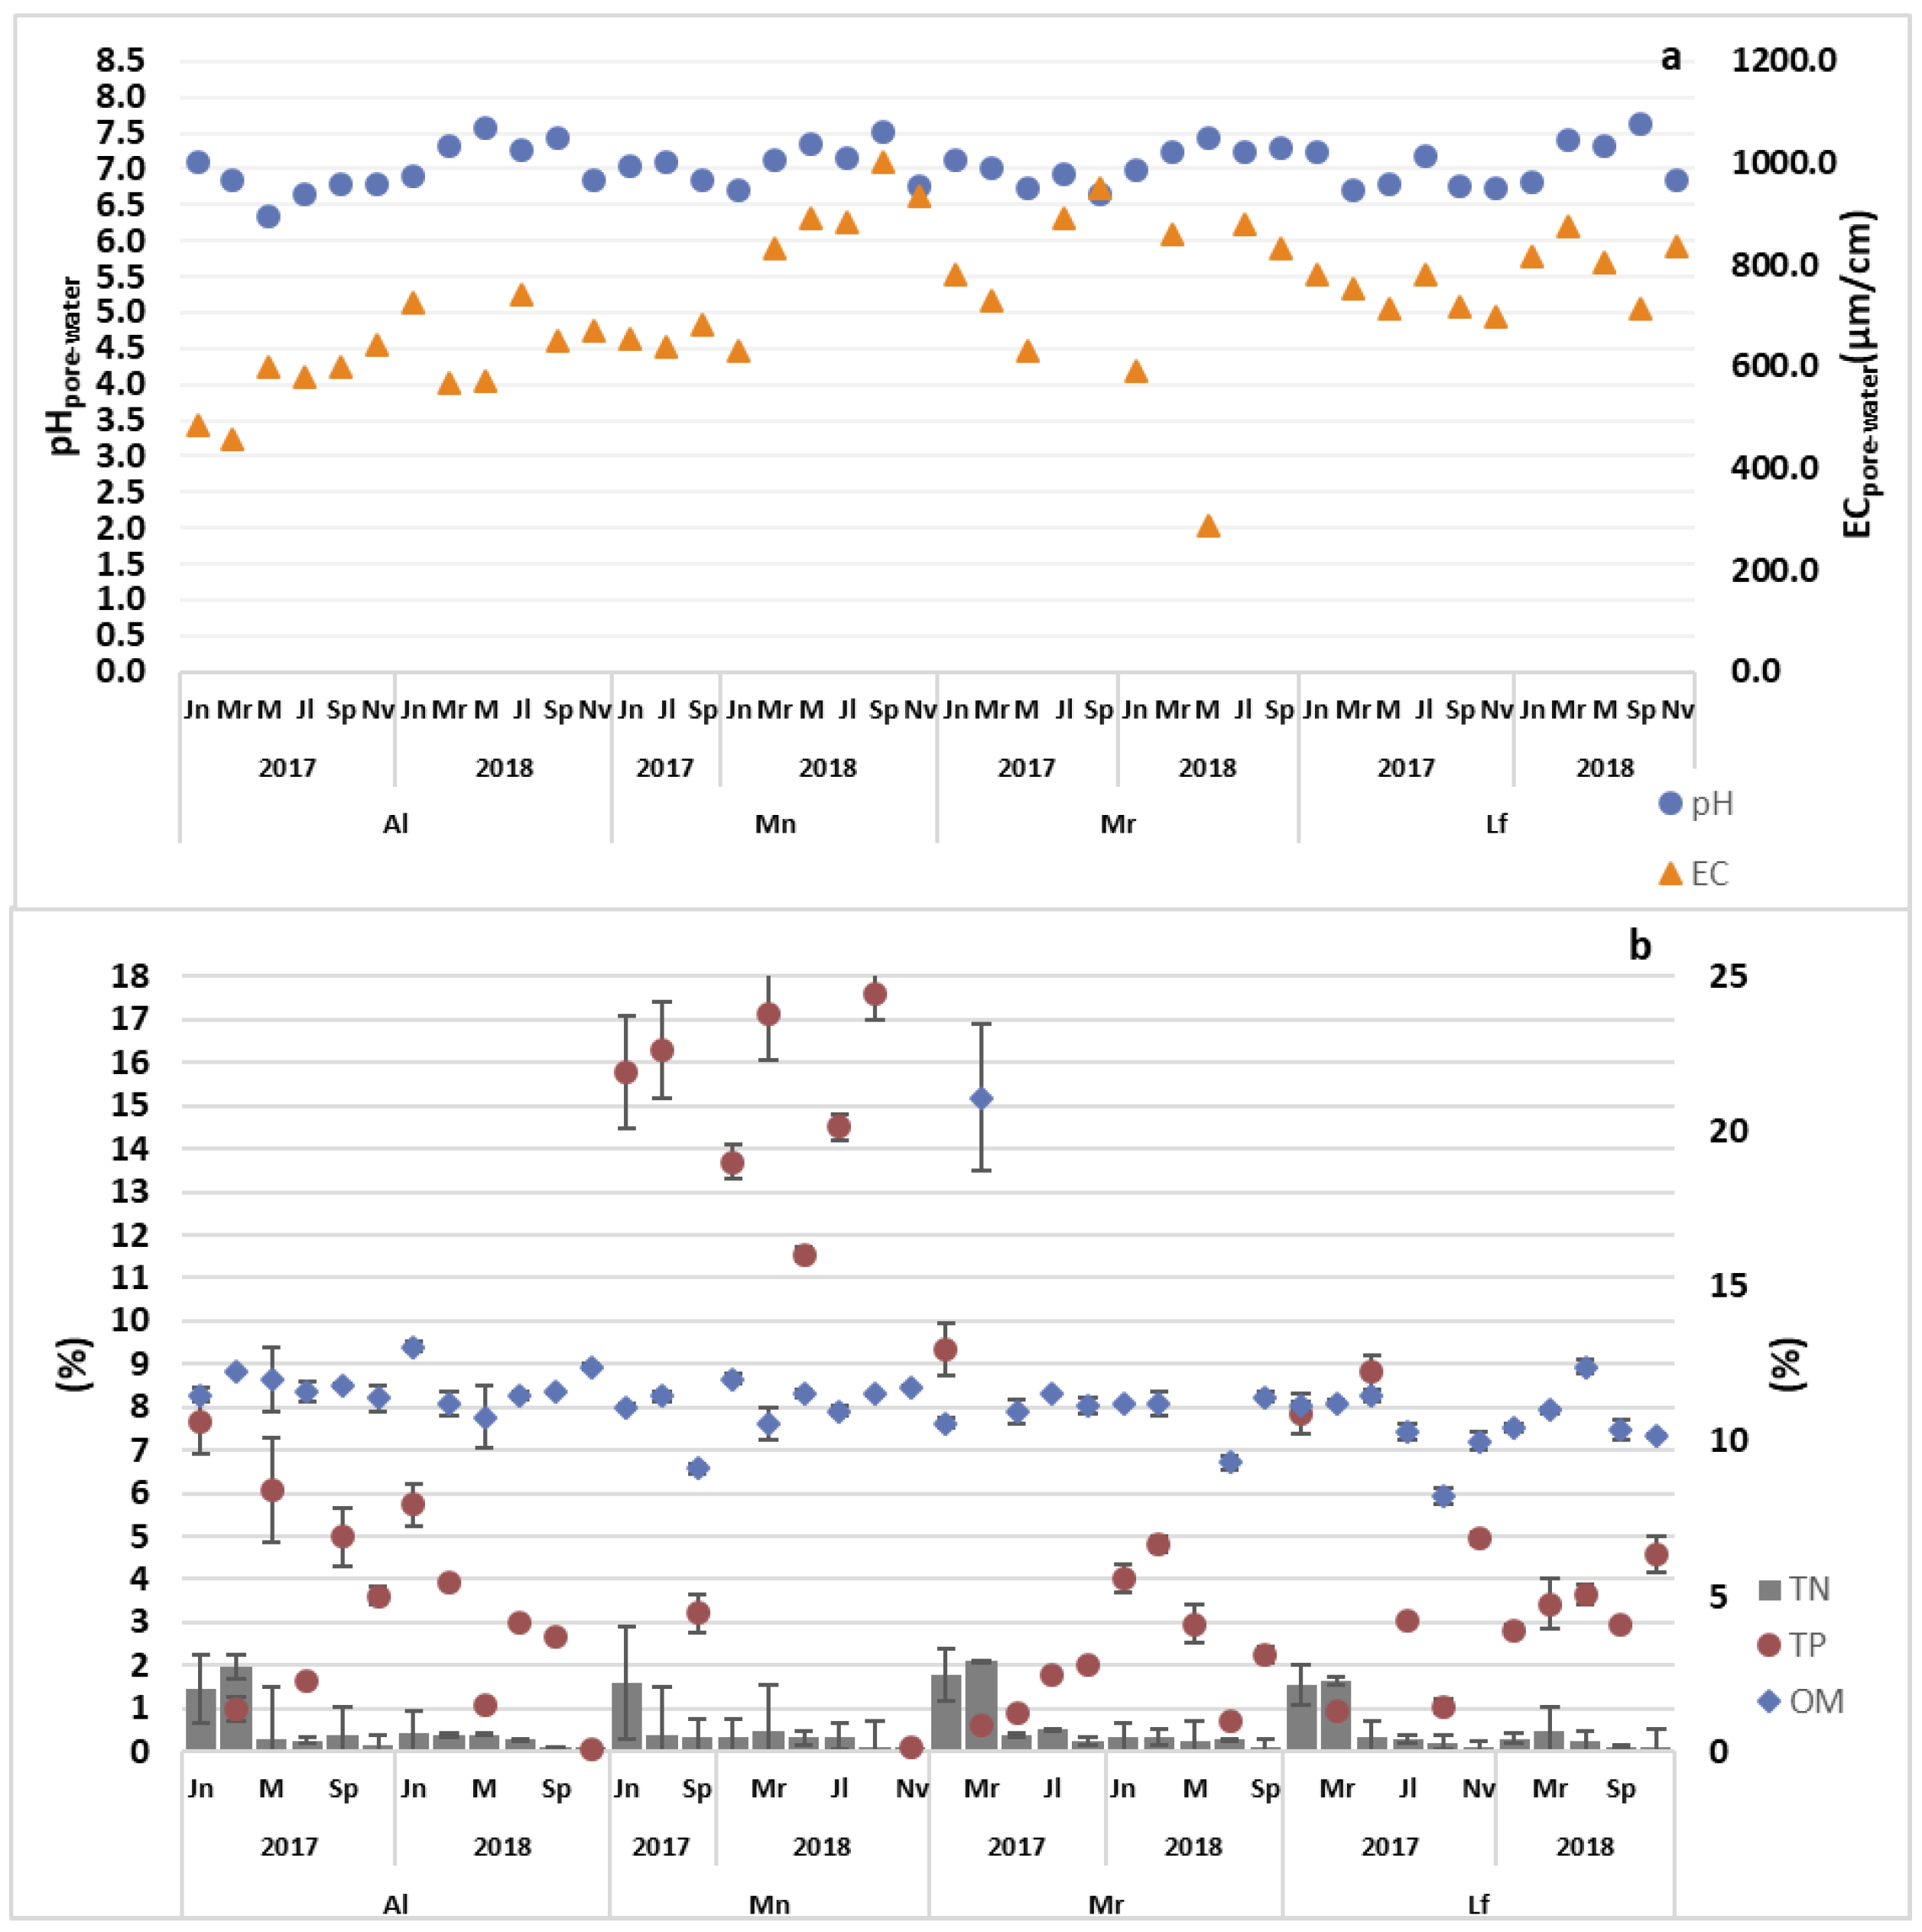
3.3.2. Chemical Patterns
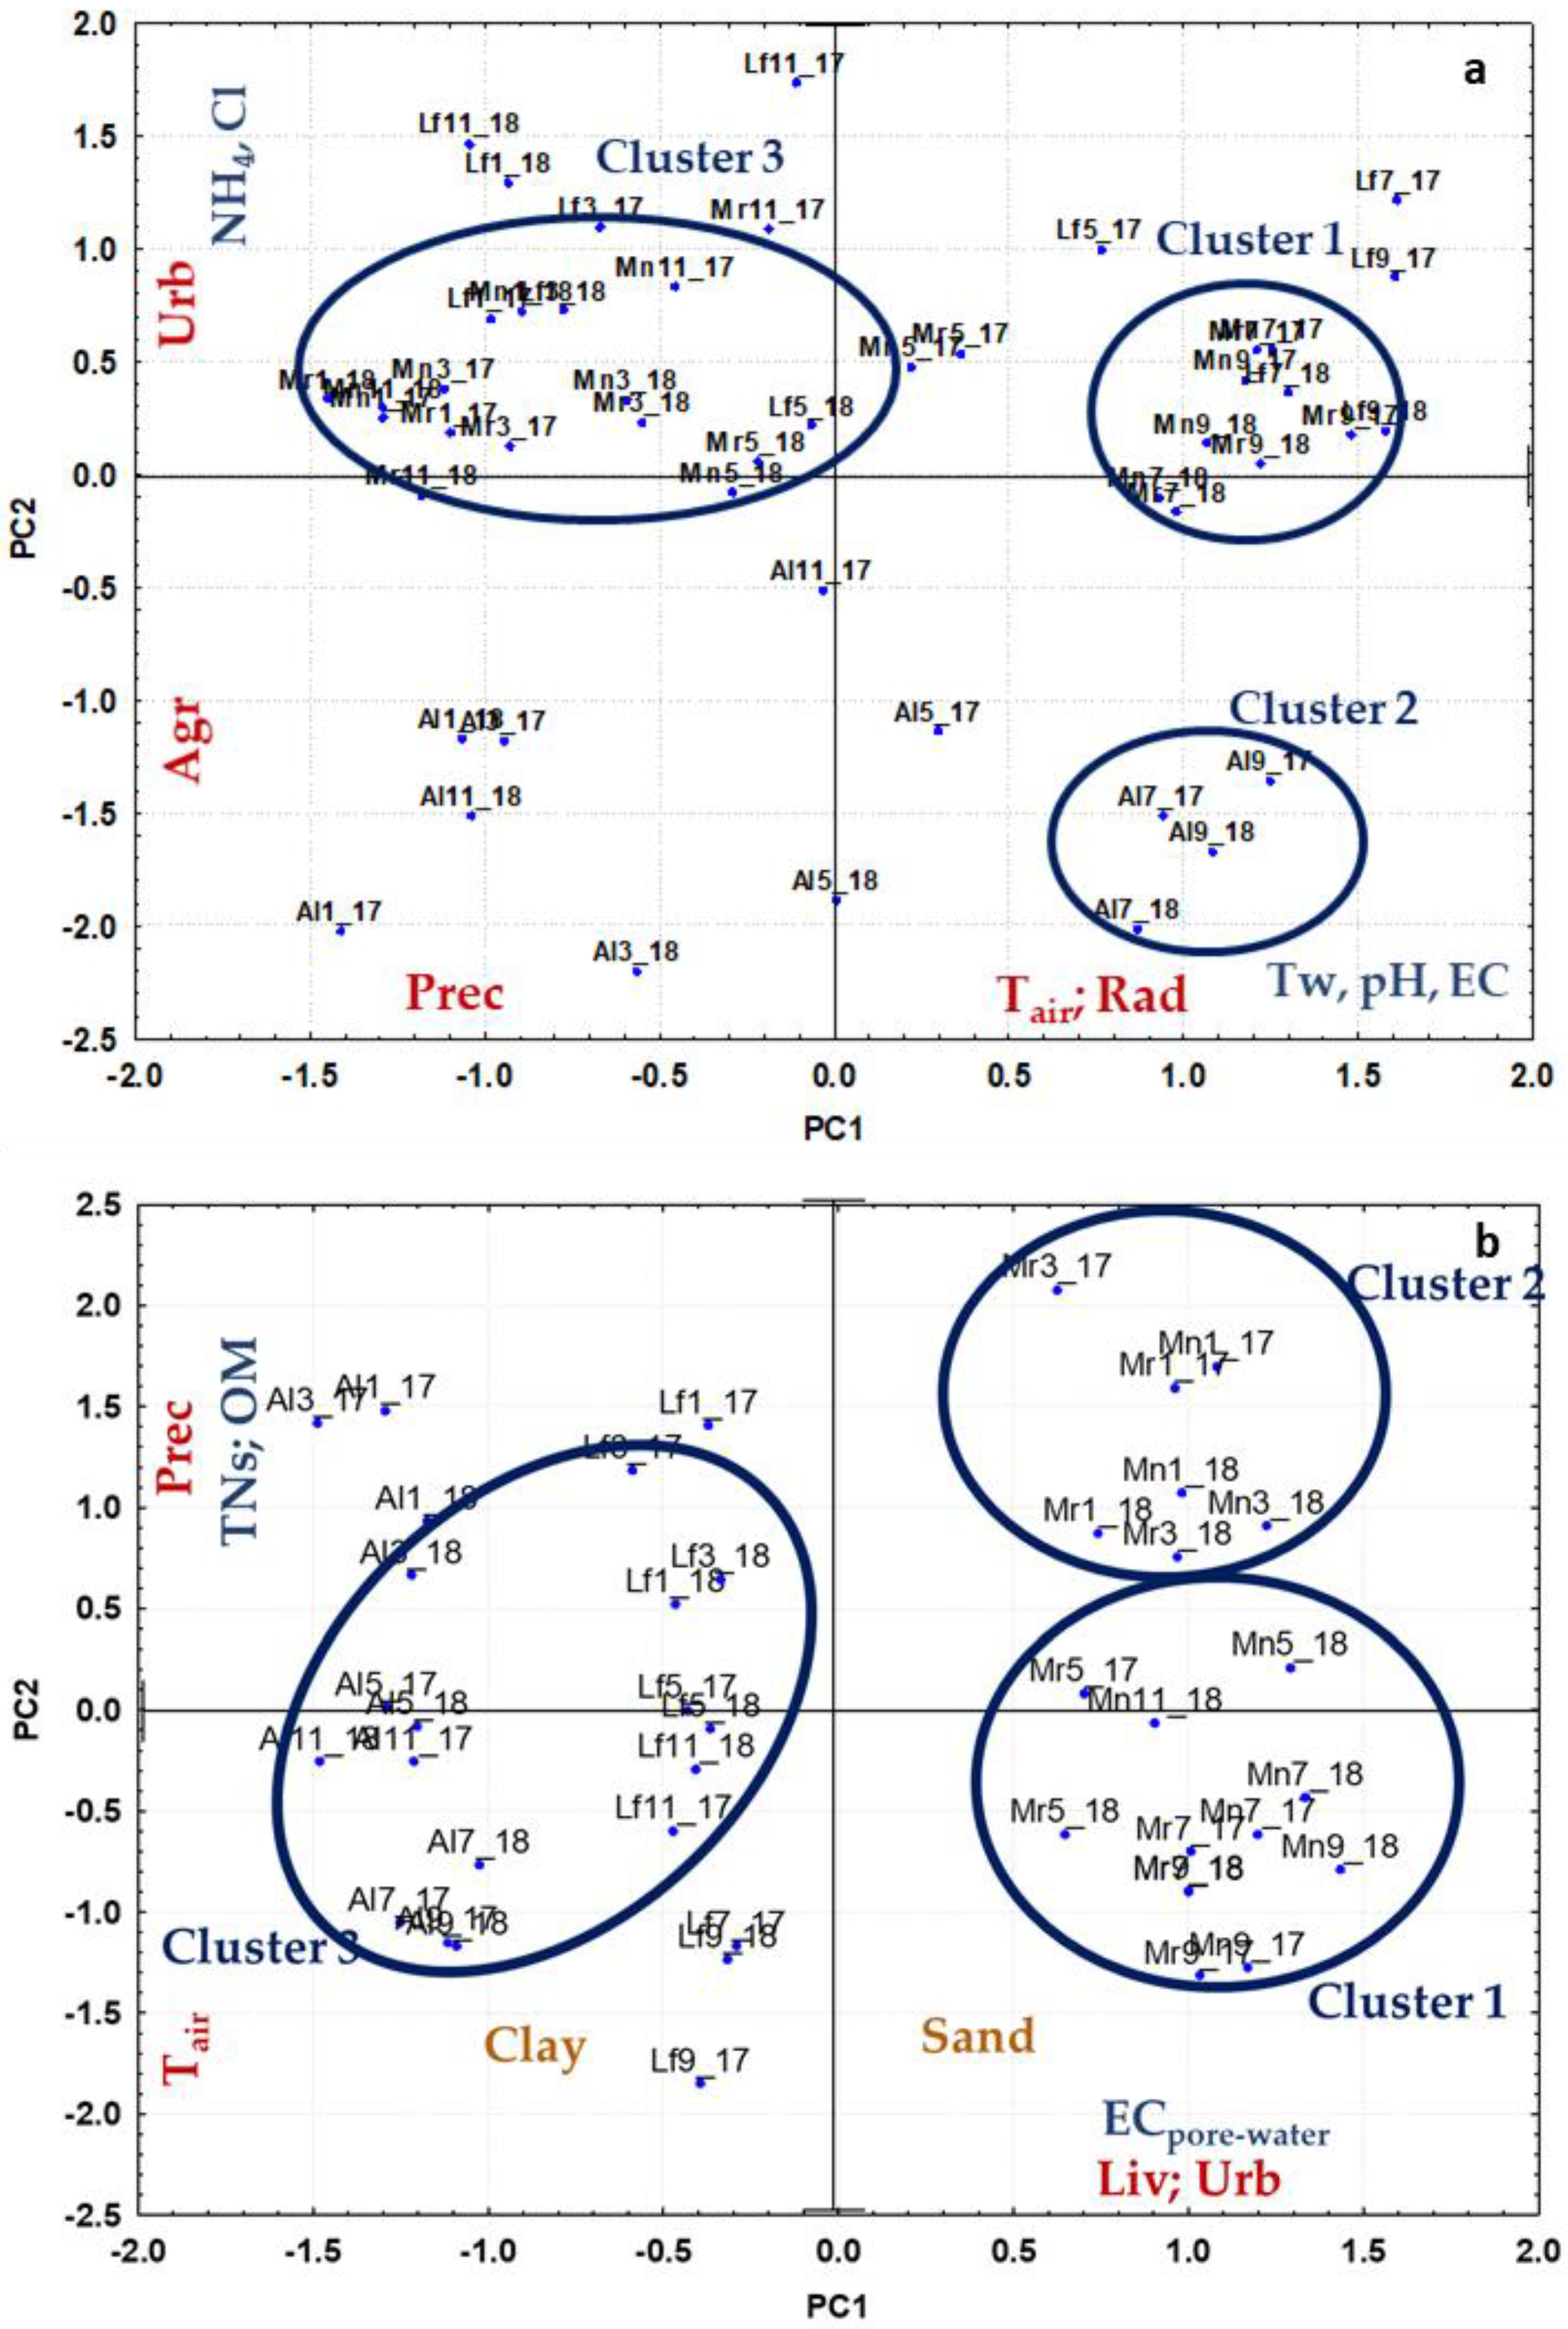
3.4. Influence of Clime and LULC Patterns on Physic-Chemistry and Phytoplankton Biomass of the Reservoir
3.4.1. Drought and Post-Drought Periods
3.4.2. Meteorological Conditions and LULC Patterns
4. Conclusions
Supplementary Materials
Author Contributions
Funding
Institutional Review Board Statement
Informed Consent Statement
Data Availability Statement
Acknowledgments
Conflicts of Interest
References
- Smeti, E.; von Schiller, D.; Karaouzas, I.; Laschou, S.; Vardakas, L.; Sabater, S.; Tornés, E.; Monllor-Alcaraz, L.S.; Guillem-Argiles, N.; Martinez, E.; et al. Multiple stressor effects on biodiversity and ecosystem functioning in a Mediterranean temporary river. Sci. Total Environ. 2019, 647, 1179–1187. [Google Scholar] [CrossRef]
- Sabater, S.; Bregoli, F.; Acuña, V.; Barceló, D.; Elosegi, A.; Ginebreda, A.; Marcé, R.; Muñoz, I.; Sabater-Liesa, L.; Ferreira, V. Effects of human-driven water stress on river ecosystems: A meta-analysis. Sci. Rep. 2018, 8, 1–11. [Google Scholar] [CrossRef] [PubMed]
- Hering, D.; Carvalho, L.; Argillier, C.; Beklioglu, M.; Borja, A.; Cardoso, A.C.; Duel, H.; Ferreira, T.; Globevnik, L.; Hanganu, J.; et al. Managing aquatic ecosystems and water resources under multiple stress—An introduction to the MARS project. Sci. Total Environ. 2015, 503–504, 10–21. [Google Scholar] [CrossRef]
- Capula-Rodríguez, R.; Valdez-Aguilar, L.A.; Cartmill, D.L.; Cartmill, A.D.; Alia-Tejacal, I. Supplementary Calcium and Potassium Improve the Response of Tomato (Solanum lycopersicum L.) to Simultaneous Alkalinity, Salinity, and Boron Stress. Commun. Soil Sci. Plant Anal. 2016, 1–7. [Google Scholar] [CrossRef]
- Füssel, H.-M.; Jol, A.; Kurnik, B.; Hemming, D. Climate Change, Impacts and Vulnerability in Europe 2012: An Indicator-Based Report; European Environment Agency: Copenhagen, Denmark, 2012; ISBN 9789292133467.
- Castellari, S.; Kurnik, B. Climate Change, Impacts and Vulnerability in Europe 2016; European Environment Agency: Copenhagen, Denmark, 2017; ISBN 9789292138356.
- Milano, M.; Ruelland, D.; Fernandez, S.; Dezetter, A.; Fabre, J.; Servat, E.; Fritsch, J.M.; Ardoin-Bardin, S.; Thivet, G. Current state of Mediterranean water resources and future trends under climatic and anthropogenic changes. Hydrol. Sci. J. 2013, 58, 498–518. [Google Scholar] [CrossRef]
- UNESCO. The United Nations World Water Development Report 2019: Leaving no One Behind; UNESCO: Paris, France, 2019; ISBN 978-92-3-100309-7. [Google Scholar]
- Mourato, S.; Moreira, M.; Corte-Real, J. Water Resources Impact Assessment Under Climate Change Scenarios in Mediterranean Watersheds. Water Resour. Manag. 2015, 29, 2377–2391. [Google Scholar] [CrossRef]
- Rocha, J.; Carvalho-Santos, C.; Diogo, P.; Beça, P.; Keizer, J.J.; Nunes, J.P. Impacts of climate change on reservoir water availability, quality and irrigation needs in a water scarce Mediterranean region (southern Portugal). Sci. Total Environ. 2020, 736, 139477. [Google Scholar] [CrossRef]
- Fehér, J.; Gáspár, J.; Veres, K.S.; Kiss, A.; Globevnik, L.; Kirn, T.; Peterlin, M.; Spiteri, C.; Prins, T.; Laukkonen, E.; et al. Hydromorphological Alterations and Pressures in European Rivers, Lakes, Transitional and Coastal Waters; ETC/ICM Technical Report 2/2012; European Topic Centre on Inland, Coastal and Marine Waters: Leipzig, Germany, 2012; ISBN 9788578110796. [Google Scholar]
- Chamoglou, M.; Papadimitriou, T.; Kagalou, I. Key-Descriptors for the Functioning of a Mediterranean Reservoir: The Case of the New Lake Karla-Greece. Environ. Process. 2014, 1, 127–135. [Google Scholar] [CrossRef] [Green Version]
- Inag Critérios Para A Classificação do Estado das Massas de Água Superficiais—Rios e Albufeiras; Ministério do Ambiente, do Ordenamento do Território e do Desenvolvimento: Lisbon, Portugal, 2009.
- McCartney, M.; Sullivan, C.; Acreman, M.C. Ecosystem Impacts of Large Dams; International Union for Conservation of Nature and Natural Resources and the United National Enivronment Programme: Gland, Switzerland, 2001; p. 82. [Google Scholar]
- Feldbauer, J.; Kneis, D.; Hegewald, T.; Berendonk, T.U.; Petzoldt, T. Managing climate change in drinking water reservoirs: Potentials and limitations of dynamic withdrawal strategies. Environ. Sci. Eur. 2020, 32. [Google Scholar] [CrossRef] [Green Version]
- Azadi, F.; Ashofteh, P.S.; Loáiciga, H.A. Reservoir Water-Quality Projections under Climate-Change Conditions. Water Resour. Manag. 2019, 33, 401–421. [Google Scholar] [CrossRef]
- Blasco, J.; Navarro-Ortega, A.; Barceló, D. Towards a better understanding of the links between stressors, hazard assessment and ecosystem services under water scarcity. Sci. Total Environ. 2015, 503–504, 1–2. [Google Scholar] [CrossRef] [PubMed]
- Navarro-Ortega, A.; Acuña, V.; Batalla, R.J.; Blasco, J.; Conde, C.; Elorza, F.J.; Elosegi, A.; Francés, F.; La-Roca, F.; Muñoz, I.; et al. Assessing and forecasting the impacts of global change on Mediterranean rivers. The SCARCE Consolider project on Iberian basins. Environ. Sci. Pollut. Res. 2012, 19, 918–933. [Google Scholar] [CrossRef] [PubMed]
- Crossman, J.; Elliott, J.A. Bridging the gap between terrestrial, riverine and limnological research: Application of a model chain to a mesotrophic lake in North America. Sci. Total Environ. 2018, 622–623, 1363–1378. [Google Scholar] [CrossRef] [PubMed] [Green Version]
- Dupas, R.; Minaudo, C.; Abbott, B.W. Stability of spatial patterns in water chemistry across temperate ecoregions. Environ. Res. Lett. 2019, 14. [Google Scholar] [CrossRef] [Green Version]
- Carvalho-Santos, C.; Monteiro, A.T.; Azevedo, J.C.; Honrado, J.P.; Nunes, J.P. Climate Change Impacts on Water Resources and Reservoir Management: Uncertainty and Adaptation for a Mountain Catchment in Northeast Portugal. Water Resour. Manag. 2017, 31, 3355–3370. [Google Scholar] [CrossRef] [Green Version]
- Messina, N.J.; Couture, R.M.; Norton, S.A.; Birkel, S.D.; Amirbahman, A. Modeling response of water quality parameters to land-use and climate change in a temperate, mesotrophic lake. Sci. Total Environ. 2020, 713, 136549. [Google Scholar] [CrossRef]
- Nunes, J.P.; Seixas, J.; Keizer, J.J. Modeling the response of within-storm runoff and erosion dynamics to climate change in two Mediterranean watersheds: A multi-model, multi-scale approach to scenario design and analysis. Catena 2013, 102, 27–39. [Google Scholar] [CrossRef]
- Atique, U.; An, K.G. Reservoir water quality assessment based on chemical parameters and the chlorophyll dynamics in relation to nutrient regime. Pol. J. Environ. Stud. 2019, 28, 1043–1061. [Google Scholar] [CrossRef]
- Liu, L.; Dong, Y.; Kong, M.; Zhou, J.; Zhao, H.; Wang, Y.; Zhang, M.; Wang, Z. Towards the comprehensive water quality control in Lake Taihu: Correlating chlorphyll a and water quality parameters with generalized additive model. Sci. Total Environ. 2020, 705, 135993. [Google Scholar] [CrossRef]
- Palma, P.; Ledo, L.; Alvarenga, P. Assessment of trace element pollution and its environmental risk to freshwater sediments influenced by anthropogenic contributions: The case study of Alqueva reservoir (Guadiana Basin). Catena 2015, 128, 174–184. [Google Scholar] [CrossRef] [Green Version]
- Palma, P.; Ledo, L.; Soares, S.; Barbosa, I.R.; Alvarenga, P. Spatial and temporal variability of the water and sediments quality in the alqueva reservoir (Guadiana Basin; Southern Portugal). Sci. Total Environ. 2014, 470–471. [Google Scholar] [CrossRef]
- Palma, P.; Alvarenga, P.; Palma, V.L.; Fernandes, R.M.; Soares, A.M.V.M.; Barbosa, I.R. Assessment of anthropogenic sources of water pollution using multivariate statistical techniques: A case study of the Alqueva’s reservoir, Portugal. Environ. Monit. Assess. 2010, 165. [Google Scholar] [CrossRef] [PubMed]
- Agência Portuguesa do Ambiente. Water Mirrors in Portugal—Emblematic Tangible and Intangible Projects in the Portuguese Water Sector; Agência Portuguesa do Ambiente: Alfragide, Portugal, 2018.
- Lindim, C.; Pinho, J.L.; Vieira, J.M.P. Analysis of spatial and temporal patterns in a large reservoir using water quality and hydrodynamic modeling. Ecol. Modell. 2011, 222, 2485–2494. [Google Scholar] [CrossRef]
- Matono, P.; Batista, T.; Sampaio, E.; Ilhéu, M. Effects of Agricultural Land Use on the Ecohydrology of Small- Medium Mediterranean River Basins: Insights from a Case Study in the South of Portugal. In Land Use—Assessing the Past, Envisioning the Future; InTechOpen: London, UK, 2019. [Google Scholar] [CrossRef] [Green Version]
- Agência Portuguesa do Ambiente. Plano de Gestão de Região Hidrográfica 2016/2021. Parte 2. Caracterização e Diagnóstico, Anexo IV; Agência Portuguesa do Ambiente: Alfragide, Portugal, 2016.
- Novais, M.H.; Penha, A.M.; Morales, E.A.; Potes, M.; Salgado, R.; Morais, M. Vertical distribution of benthic diatoms in a large reservoir (Alqueva, Southern Portugal) during thermal stratification. Sci. Total Environ. 2019, 659, 1242–1255. [Google Scholar] [CrossRef] [PubMed]
- Instituto Português do Mar e da Atmosfera. Normais Climatológicas 1981–2010 Provisórias de Beja; Instituto Português do Mar e da Atmosfera: Lisbon, Portugal; Available online: https://www.ipma.pt/pt/oclima/normais.clima/1981-2010/002/ (accessed on 25 September 2019).
- Potes, M.; Salgado, R.; Costa, M.J.; Morais, M.; Bortoli, D.; Kostadinov, I.; Mammarella, I. Lake–atmosphere interactions at Alqueva reservoir: A case study in the summer of 2014. Tellus A 2017, 69. [Google Scholar] [CrossRef] [Green Version]
- America Public Health Association. Standard Methods for the Examination of Water and Wastewater, 23th ed.; America Public Health Association: New York, NY, USA, 2017. [Google Scholar]
- United States Environmental Protection Agency. Methods for Collection, Storage and Manipulation of Sediments for Chemical and Toxicological Analyses: Technical Manual; EPA-823-B-01-002.EPA Region V; United States Environmental Protection Agency: Chicago, IL, USA, 2001.
- Vinçon-Leite, B.; Casenave, C. Modelling eutrophication in lake ecosystems: A review. Sci. Total Environ. 2019, 651, 2985–3001. [Google Scholar] [CrossRef]
- Instituto Português da Qualidade. NP 4327:Water Quality—Determination of Cholorophyll a and Pheopigments by Molecular Absorption Spectrometry. Extraction Method in Acetone; Instituto Português da Qualidade: Monte de Caparica, Portugal, 1996. [Google Scholar]
- Laboratório Nacional de Engenharia Civil. E 196—Solos. Análise Granulométrica; Laboratório Nacional de Engenharia Civil: Lisbon, Portugal, 1966. [Google Scholar]
- Vega, M.; Pardo, R.; Barrado, E.D.L. Assessment of seasonal and polluting effects on the quality of river water by exploratory data analysis. Water Res. 1998, 32, 3581–3592. [Google Scholar] [CrossRef]
- Wunderlin, D.A.; Díaz, M.P.; Amé, M.V.; Pesce, S.F.; Hued, A.C.B.M. Pattern recognition techniques for the evaluation of spatial and temporal variations in water quality. A case study: Suquía River Basin (Córdoba-Argentina). Water Res. 2001, 35, 2881–2894. [Google Scholar]
- Salgado, R.; Miranda, P.M.A.; Lacarrère, P.; Noilhan, J. Boundary layer development and summer circulation in Southern Portugal. Tethys 2015, 12. [Google Scholar] [CrossRef] [Green Version]
- Zhang, D.; Wang, X.; Zhou, Z. Impacts of small-scale industrialized swine farming on local soil, water and crop qualities in a hilly red soil region of subtropical China. Int. J. Environ. Res. Public Health 2017, 14, 1524. [Google Scholar] [CrossRef] [Green Version]
- Zhou, Y.; Xu, J.F.; Yin, W.; Ai, L.; Fang, N.F.; Tan, W.F.; Yan, F.L.; Shi, Z.H. Hydrological and environmental controls of the stream nitrate concentration and flux in a small agricultural watershed. J. Hydrol. 2017, 545, 355–366. [Google Scholar] [CrossRef]
- Saraiva, A.; Rodrigues, G.; Mamede, H.; Silvestre, J.; Dias, I.; Feliciano, M.; Oliveira, E.; Silva, P.; Oliveira, M. The impact of the winery’s wastewater treatment system on the winery water footprint. Water Sci. Technol. 2020, 80, 1823–1831. [Google Scholar] [CrossRef] [PubMed] [Green Version]
- Elçi, Ş. Effects of thermal stratification and mixing on reservoir water quality. Limnology 2008, 9, 135–142. [Google Scholar] [CrossRef] [Green Version]
- Fontes, C.L. Modelling of Water Quality in the Alqueva Reservoir. Ph.D. Thesis, University of Minho, Braga, Portugal, 2010; p. 172. [Google Scholar]
- Nunes, J.P.; Jacinto, R.; Keizer, J.J. Combined impacts of climate and socio-economic scenarios on irrigation water availability for a dry Mediterranean reservoir. Sci. Total Environ. 2017, 584–585, 219–233. [Google Scholar] [CrossRef] [PubMed]
- Lisboa, M.S.; Schneider, R.L.; Sullivan, P.J.; Walter, M.T. Drought and post-drought rain effect on stream phosphorus and other nutrient losses in the Northeastern USA. J. Hydrol. Reg. Stud. 2020, 28, 100672. [Google Scholar] [CrossRef]
- Mosley, L.M. Drought impacts on the water quality of freshwater systems; review and integration. Earth Sci. Rev. 2015, 140, 203–214. [Google Scholar] [CrossRef]
- Gutiérrez-Cánovas, C.; Arribas, P.; Naselli-Flores, L.; Bennas, N.; Finocchiaro, M.; Millán, A.; Velasco, J. Evaluating anthropogenic impacts on naturally stressed ecosystems: Revisiting river classifications and biomonitoring metrics along salinity gradients. Sci. Total Environ. 2019, 658, 912–921. [Google Scholar] [CrossRef]
- Krupa, E.; Barinova, S.; Amirgaliyev, N.A.; Issenova, G.; Kozhabayeva, G. Statistical approach to estimate the anthropogenic sources of potentially toxic elements on the shardara reservoir (Kazakhstan). MOJ Ecol. Environ. Sci. 2017, 2. [Google Scholar] [CrossRef] [Green Version]
- Wu, Z.; Zhang, Y.; Zhou, Y.; Liu, M.; Shi, K.; Yu, Z. Seasonal-spatial distribution and long-term variation of transparency in Xin’anjiang Reservoir: Implications for reservoir management. Int. J. Environ. Res. Public Health 2015, 12, 9492–9507. [Google Scholar] [CrossRef]
- Agencia Portuguesa do Ambiente. Plano de Gestão de Região Hidrográfica 2016/2021: Região Hidrográfica do Guadiana (RH7); Agência Portuguesa do Ambiente: Alfragide, Portugal, 2016.
- Zuccarello, P.; Manganelli, M.; Oliveri Conti, G.; Copat, C.; Grasso, A.; Cristaldi, A.; De Angelis, G.; Testai, E.; Stefanelli, M.; Vichi, S.; et al. Water quality and human health: A simple monitoring model of toxic cyanobacteria growth in highly variable Mediterranean hot dry environments. Environ. Res. 2021, 192, 110291. [Google Scholar] [CrossRef] [PubMed]
- Instituto da Água Relatório. Síntese Sobre a Caracterização das Regiões Hidrográficas prevista na Directiva-Quadro da Água; Instituto da Água Relatório: Alfragide, Portugal, 2005; p. 163.
- Al-Taani, A.A.; El-Radaideh, N.M.; Al Khateeb, W.M.; Al Bsoul, A. Reservoir water quality: A case from Jordan. Environ. Monit. Assess. 2018, 190. [Google Scholar] [CrossRef]
- Naveedullah, N.; Hashmi, M.Z.; Yu, C.; Shen, C.; Muhammad, N.; Shen, H.; Chen, Y. Water Quality Characterization of the Siling Reservoir (Zhejiang, China) Using Water Quality Index. Clean Soil Air Water 2016, 44, 553–562. [Google Scholar] [CrossRef]
- Mavromati, E.; Kagalou, I.; Kemitzoglou, D.; Apostolakis, A.; Seferlis, M.; Tsiaoussi, V. Relationships Among Land Use Patterns, Hydromorphological Features and Physicochemical Parameters of Surface Waters: WFD Lake Monitoring in Greece. Environ. Process. 2018, 5, 139–151. [Google Scholar] [CrossRef]
- Coppens, J.; Özen, A.; Tavşanoğlu, T.N.; Erdoğan, Ş.; Levi, E.E.; Yozgatligil, C.; Jeppesen, E.; Beklioğlu, M. Impact of alternating wet and dry periods on long-term seasonal phosphorus and nitrogen budgets of two shallow Mediterranean lakes. Sci. Total Environ. 2016, 563–564, 456–467. [Google Scholar] [CrossRef]
- Søndergaard, M.; Jensen, J.P.; Jeppesen, E. Role of sediment and internal loading of phosphorus in shallow lakes. Hydrobiologia 2003, 506–509, 135–145. [Google Scholar] [CrossRef]
- Caetano, S. Toxicity Risks Linked to Cyanobacteria Blooms in Southern Portugal Reservoirs. Ph.D. Thesis, University of Algarve, Algarve, Portugal, 2015. [Google Scholar]
- Rzetala, M.; Babicheva, V.A.; Rzetala, M.A. Composition and physico-chemical properties of bottom sediments in the southern part of the Bratsk Reservoir (Russia). Sci. Rep. 2019, 9, 1–9. [Google Scholar] [CrossRef] [Green Version]
- Cardoso-Silva, S.; de Lima Ferreira, P.A.; Moschini-Carlos, V.; Figueira, R.C.L.; Pompêo, M. Temporal and spatial accumulation of heavy metals in the sediments at Paiva Castro Reservoir (São Paulo, Brazil). Environ. Earth Sci. 2016, 75, 1–16. [Google Scholar] [CrossRef] [Green Version]
- Palma, P.; Fialho, S.; Lima, A.; Mourinha, C.; Penha, A.; Novais, M.H.; Rosado, A.; Morais, M.; Potes, M.; Costa, M.J.; et al. Land-cover patterns and hydrogeomorphology of tributaries: Are these important stressors for the water quality of reservoirs in the mediterranean region? Water 2020, 12, 2665. [Google Scholar] [CrossRef]
- Cardoso-Silva, S.; Da Silva, D.C.V.R.; Lage, F.; de Paiva, T.C.B.; Moschini-Carlos, V.; Rosa, A.H.; Pompêo, M. Metals in sediments: Bioavailability and toxicity in a tropical reservoir used for public water supply. Environ. Monit. Assess. 2016, 188. [Google Scholar] [CrossRef] [Green Version]
- Cardoso-Silva, S.; de Lima Ferreira, P.A.; Figueira, R.C.L.; da Silva, D.C.V.R.; Moschini-Carlos, V.; Pompêo, M.L.M. Factors that control the spatial and temporal distributions of phosphorus, nitrogen, and carbon in the sediments of a tropical reservoir. Environ. Sci. Pollut. Res. 2018, 25, 31776–31789. [Google Scholar] [CrossRef] [PubMed] [Green Version]
- Fletcher, R.; Welsh, P.F.P. Guidelines for Identify, Assessing and Managing Contaminated Sediments in Ontario: An Integrated Approach; Water Resources Branch: Toronto, ON, Canada, 2008.
- Barros, M.C.; Mendo, M.J.M.; Negrão, F.C.R. Surface water quality in Portugal during a drought period. Sci. Total Environ. 1995, 171, 69–76. [Google Scholar] [CrossRef]


Publisher’s Note: MDPI stays neutral with regard to jurisdictional claims in published maps and institutional affiliations. |
© 2021 by the authors. Licensee MDPI, Basel, Switzerland. This article is an open access article distributed under the terms and conditions of the Creative Commons Attribution (CC BY) license (http://creativecommons.org/licenses/by/4.0/).
Share and Cite
Palma, P.; Penha, A.M.; Novais, M.H.; Fialho, S.; Lima, A.; Mourinha, C.; Alvarenga, P.; Rosado, A.; Iakunin, M.; Rodrigues, G.; et al. Water-Sediment Physicochemical Dynamics in a Large Reservoir in the Mediterranean Region under Multiple Stressors. Water 2021, 13, 707. https://doi.org/10.3390/w13050707
Palma P, Penha AM, Novais MH, Fialho S, Lima A, Mourinha C, Alvarenga P, Rosado A, Iakunin M, Rodrigues G, et al. Water-Sediment Physicochemical Dynamics in a Large Reservoir in the Mediterranean Region under Multiple Stressors. Water. 2021; 13(5):707. https://doi.org/10.3390/w13050707
Chicago/Turabian StylePalma, Patrícia, Alexandra Marchã Penha, Maria Helena Novais, Sofia Fialho, Ana Lima, Clarisse Mourinha, Paula Alvarenga, Anabela Rosado, Maksim Iakunin, Gonçalo Rodrigues, and et al. 2021. "Water-Sediment Physicochemical Dynamics in a Large Reservoir in the Mediterranean Region under Multiple Stressors" Water 13, no. 5: 707. https://doi.org/10.3390/w13050707