
Numerical Study on the Hydraulic Properties of Flow over Different Pooled Stepped Spillways


1
Department of Civil Engineering, Faculty of Engineering, University of Zanjan, Zanjan 537138791, Iran
2
Department of Engineering, Niccolò Cusano University, 00166 Rome, Italy
*
Author to whom correspondence should be addressed.
Water 2021, 13(5), 710; https://doi.org/10.3390/w13050710
Submission received: 1 February 2021
/
Revised: 1 March 2021
/
Accepted: 2 March 2021
/
Published: 5 March 2021
(This article belongs to the Special Issue Ecohydraulics Modeling and Simulation)
Abstract
:This work presents numerical simulations carried out to study the influence of geometric characteristics of pooled steps on the energy dissipation performance, flow patterns properties, velocity rates, and pressure distributions over a spillway. The localization of the inception point of air entrainment was also assessed, being a key design parameter of spillways. With this aim, different configurations of steps were taken in account, including flat, pooled, and notch pooled types. The computational procedure was first validated with experimental results from the literature and then used to test the hydraulic behavior derived from different geometric configurations. The flat step configuration showed the best energy dissipation performance as compared with other configurations. With the notched pooled step configuration, the efficiency performance of the pooled structure improved by about 5.8%. The interfacial velocities of the flat stepped spillway were smaller than those of the pooled structure. The pressure value at the beginning of the step in the pooled configuration was larger than the flat configuration, while for the notched pool the maximum pressure values decreased near the step pool. Pool configuration (simple or notched) did not have a significant influence on the location of air entrainment.
1. Introduction
Spillways are commonly constructed as floodwater release facilities in reservoir dams to transfer high-energy water [1]. In fact, steps on stepped spillways play an important role in improving energy dissipation and lead to a significant reduction in the specific residual energy [2]; moreover, the improved aeration performance helps to mitigate the risk of cavitation damages [3]. Depending on the flow conditions, the flow over a stepped spillway is usually categorized into three regimes: nape, transition, and skimming. In engineering practice, skimming flow regime is more relevant than the other two. Thus, stepped spillways are often designed for skimming flow, a practice that started from the wide knowledge on the energy dissipation performance of flat uniform stepped spillways [4,5].
In skimming flow, the water or air–water mixture flows as a coherent stream over the pseudo-bottom formed by the outer step edges; beneath this, three-dimensional vortices occur [6]. In the past decades, various laboratory investigations have been carried out on stepped spillways by Rajaratnam [7], Peyras et al. [8], Chanson [9], and Robinson et al. [10] in order to describe the flow regimes and energy losses.
Recently, numerous studies on flat uniform and non-uniform stepped spillways by Meireles and Matos [11], Wüthrich and Chanson [12], Bai and Zhang [13], and Wan et al. [14] have determined the flow characteristics (i.e., flow regime, flow pattern, and velocity field), the inception point (the location where the turbulent boundary layer reaches the free surface), and the amount of energy loss in these spillways.
Chinnarasri and Wongwises [15] presented flow regimes and energy losses in chutes with upward inclined steps. They concluded that the slope of the inclined steps increased the relative energy loss and decreased the outlet velocity by nearly 10%.
Felder [16] examined energy dissipation on stepped spillways, considering five configurations with uniform and non-uniform step heights along the spillway, with a constant chute slope (θ) (i.e., θ = 26.6°). The results indicated that the energy dissipation levels of the five different cases were slightly different.
Peng et al. [17] investigated the effects of varying horizontal face angles on turbulent kinetic energy and energy dissipation rates—the energy dissipation rate decreased with an increase of the unit discharge (q), while it increased due to enlargement of the horizontal face angles.
In recent years, an innovative design was proposed for stepped spillways to improve the energy dissipation performance. Unlike conventional stepped spillways, whose horizontal step faces are flat, this novel kind of stepped spillway, named a pooled stepped spillway, is equipped with pool weirs at the step edges. Some studies and experiments were also performed on pooled stepped spillways, providing information on flow patterns and dissipation performance [18,19,20].
Felder and Chanson [21] conducted experiments on pooled and flat stepped spillways with slopes of 8.9° and 26.6°, highlighting that energy dissipation in the pooled stepped spillway was larger than in the flat stepped spillway with a smaller slope.
Felder and Chanson [22] studied the effects of stepped, pooled porosity upon flow patterns and the energy dissipation performance on porous pooled stepped spillways. Their results stated that the pores contribute to reducing the cavity recirculation and air entrainment into the step cavities. The porous pooled steps exhibited smaller energy dissipation performance.
In addition to experimental studies, thanks to advances in the computational performance of computers, numerical methods such as computational fluid dynamics (CFD) have been developed and have also been successfully used to study the detailed flow properties in hydraulic structures [23,24,25,26,27,28,29,30,31,32].
Li and Zhang [33] simulated pooled stepped spillways with four types of pool weirs using the volume of fluid (VOF) and renormalization group (RNG) turbulence models.
The numerical studies by Kaouachi et al. [34] and Wan et al. [35] were instead focused on the localization of the inception point in stepped spillways; for pooled spillways it is closer to the spillway crest than for flat stepped spillways.
While the existing studies have increased the understanding of different types of pooled stepped spillways, little has been still done about the impact of pool configurations on the flow properties. The present paper focuses on the roles of different configurations of the step edges (simple and notch) and pooled weirs on the hydraulic properties of flow (such as flow pattern, velocity, and pressure distribution), inception point, energy dissipation, and turbulent kinetic energy in pooled stepped spillways.
The paper is organized as follows: First, an overview of the literature is presented. Second, the hydraulic and geometric characteristics of the models studied, the numerical setup, and validation of the simulations are explained. Afterwards, the hydraulic properties of flow over different pooled stepped spillways are analyzed. The article ends with a conclusion and a discussion on the numerical results obtained.
2. Theoretical Relations of Flow Regime Detection
The factors that affect the generation of various types of flow on stepped spillways include the geometry of the steps (length and height of the steps, l and h) and the flow rate, Q. However, some researchers have proposed other criteria [7,8,9], showing that the type of flow regime depends on the normalized critical depth, yc/h (yc is the critical depth of the flow on the broad crested weir), and a dimensionless variable of steps, h/l. According to Equations (1)–(3), criteria are presented when a skimming flow regime occurs by Rajaratnam [7]; Peyras et al. [8] and Chanson [9], respectively:
3. Numerical Simulation and Simulation Setup
3.1. Numerical Models
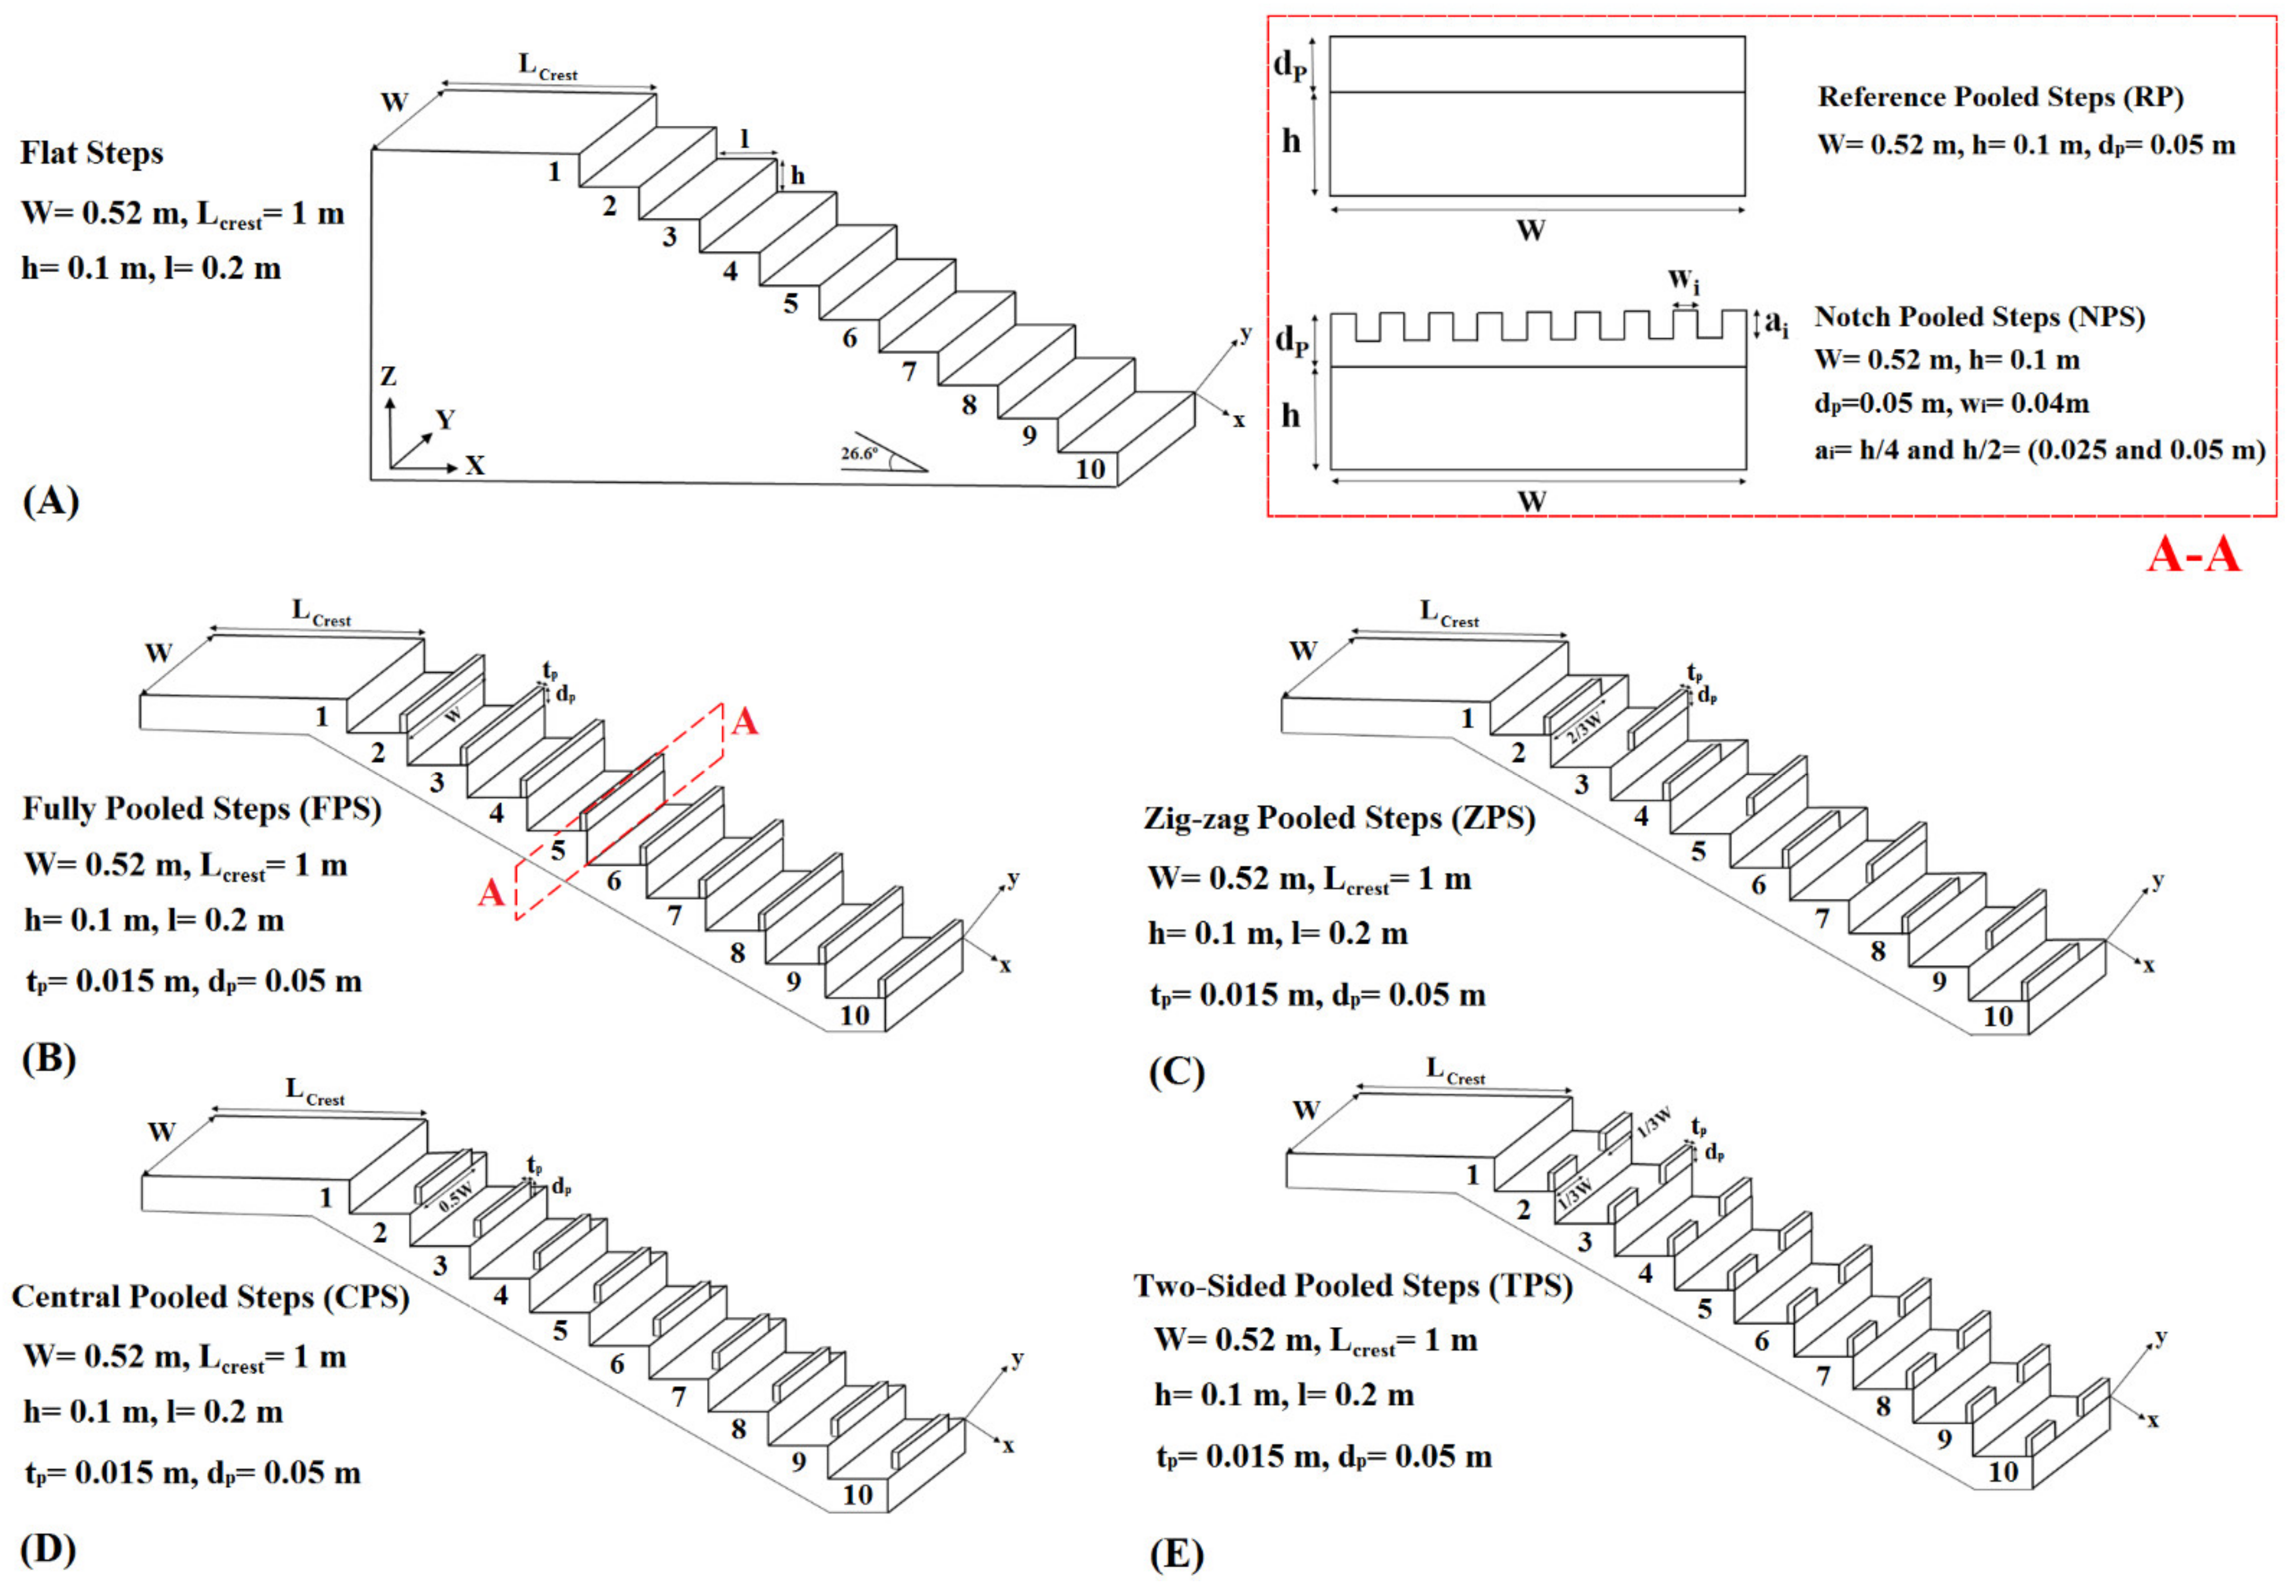
In this study, the hydraulic properties of the skimming flow (i.e., flow pattern, velocity, pressure distribution, inception point, and energy dissipation) over pooled stepped spillways of different configurations are simulated. The physical experiments reported by Felder et al. [18] were used to verify the numerical results. They used a stepped spillway with 10 steps, with a vertical step height (h) and horizontal step length (l) of 0.1 m and 0.2 m, respectively. The length, Lcrest, and width, W, of the broad-crested weir were 1 m and 0.52 m, respectively (see Figure 2a). Based on this physical model, 4 layouts were designed and studied numerically by modifying the step edges, using pooled weirs with same pool of height dp = 0.05 m and different configurations of the main steps: fully pooled steps (FPS) with the same channel width; zig-zag pooled steps (ZPS) with 2/3 channel width; central pooled steps (CPS) with 1/2 channel width; two-sided pooled steps with 1/3 channel width on each side (TPS) (see other details in Figure 2). Additionally, the pooled steps used were simple, with a notch (in short, “no” is a percentage of the notch) configuration. The notch heights of the pooled step sets were h/4 (no = 50%) and h/2 (no = 100%), with thickness tp = 1.5 cm (Figure 2 b-e). The modified cases are illustrated in Figure 2.
3.2. FLOW-3D Model
FLOW-3D® is a CFD program allowing simulation of flow, turbulence, bed load, and suspended load under different boundary conditions [36]. FLOW-3D® uses the true volume of fluid (TruVOF) method based on the solution algorithm (SOLA) developed by Hirth and Nicolas [37]. The VOF method consists of three main steps: the definition of the volume of fluid function, the use of a method to solve the VOF transport equation, and the setting of boundary conditions at the free surface. Within the frame of VOF methods, the interface is determined from the volume fraction F. The F value varies between zero, when the grid cell contains no fluid, and unity, when the grid cell is fully occupied with fluid [30,36].
3.3. Hydrodynamic Model
The hydrodynamic model is based on the solution of the three-dimensional Navier–Stokes equations and the continuity equation. For incompressible flows, they can be expressed as follows [36]:
where:
where Ui is the mean velocity; P is the hydrostatic pressure; Ai is the fractional area open to flow in the subscript direction; VF is the volume fraction of fluid in each cell; Gi is the gravitational acceleration in the subscript direction; fi is the represented Reynolds stress, which the turbulence model needs for closure; Sij is the strain rate tensor; τb,i is the wall shear stress; ρ is the fluid density; μtot is the total dynamic viscosity, which includes the effects of turbulence (μtot = μ + μT); μ is the dynamic viscosity; and μT is the eddy viscosity. In the model setting, for computational cells full with fluid Vf, Aj is equal to one, leading the equations to reduce to single-fluid, incompressible, Reynolds-averaged Navier–Stokes (RANS) form.
3.4. Turbulence Model
The RNG k-ε turbulence model was selected to estimate the shear stress near the wall, as it has been proven to be sufficiently accurate [38,39]. This model has shown acceptable outcomes in complex geometries and flow fields in hydraulic structures, such as stepped spillways [40,41,42,43,44,45,46]. The model is a two-equation model; the first equation (Equation (7)) expresses the energy in turbulence, called the turbulent kinetic energy (k). The second equation (Equation (8)) is the turbulent dissipation rate (ε), which determines the rate of kinetic energy dissipation:
where Gk is the generation of turbulent kinetic energy caused by the average velocity gradient, Gb is the generation of turbulent kinetic energy caused by buoyancy Sk, and Sε represents source terms. Here, αk and αε are inverse effective Prandtl numbers for k and ε, respectively. For the above equation:
The constant values for this model are [47]: Cµ = 0.0845, C1ε = 1.42, C2ε = 1.68, C3ε = 1.0, σk = 0.7194, σε = 0.7194, η0 = 4.38, and β = 0.012.
3.5. Numerical Domain
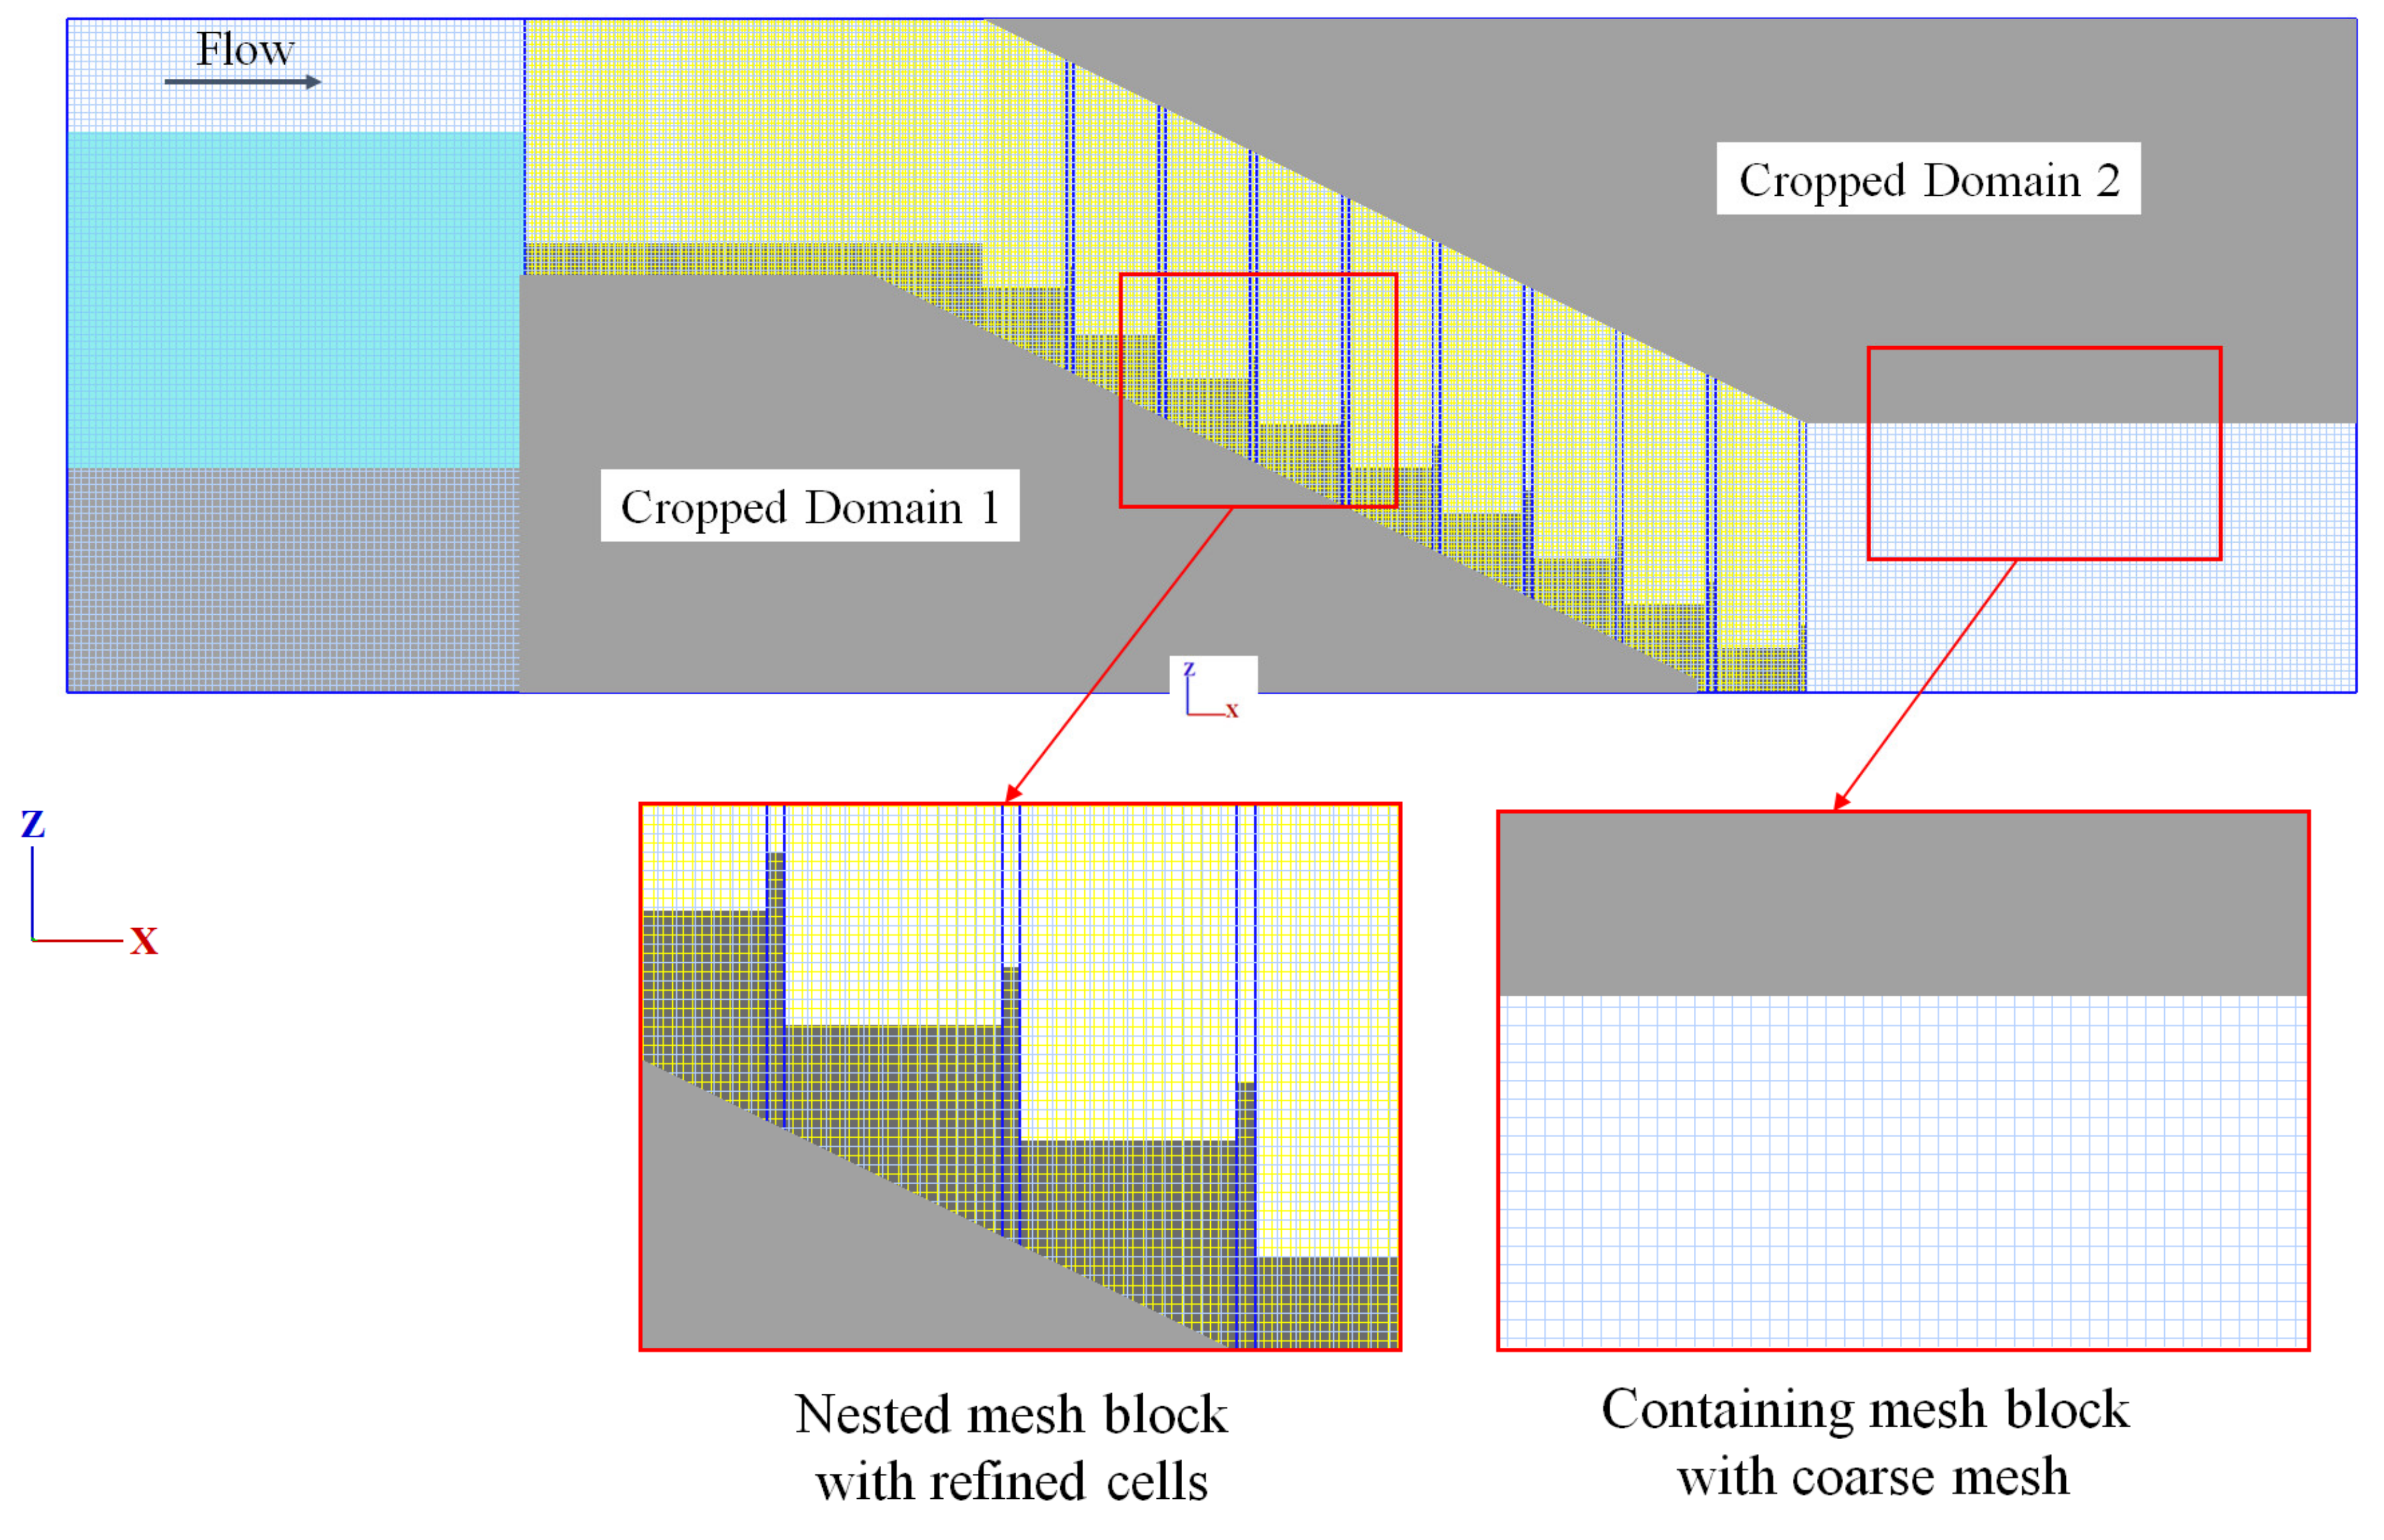
AutoCAD® software was used to build the geometries of the models through an sterolithography (STL) file. Two mesh blocks were used: a containing mesh block was created for the entire spatial domain and a nested block was built, with refined cells for the area of interest where the stepped spillway is located. The areas where flow was not expected were cropped in the meshing process in order to increase the efficiency of the simulation without affecting the results, as shown in Figure 3. This technique (the nested mesh block technique) was adopted from previous studies by Choufu et al. [48] and Pourshahbaz et al. [49]. Best practice is to have fixed points aligning the mesh boxes and aspect ratios of no greater than 2.
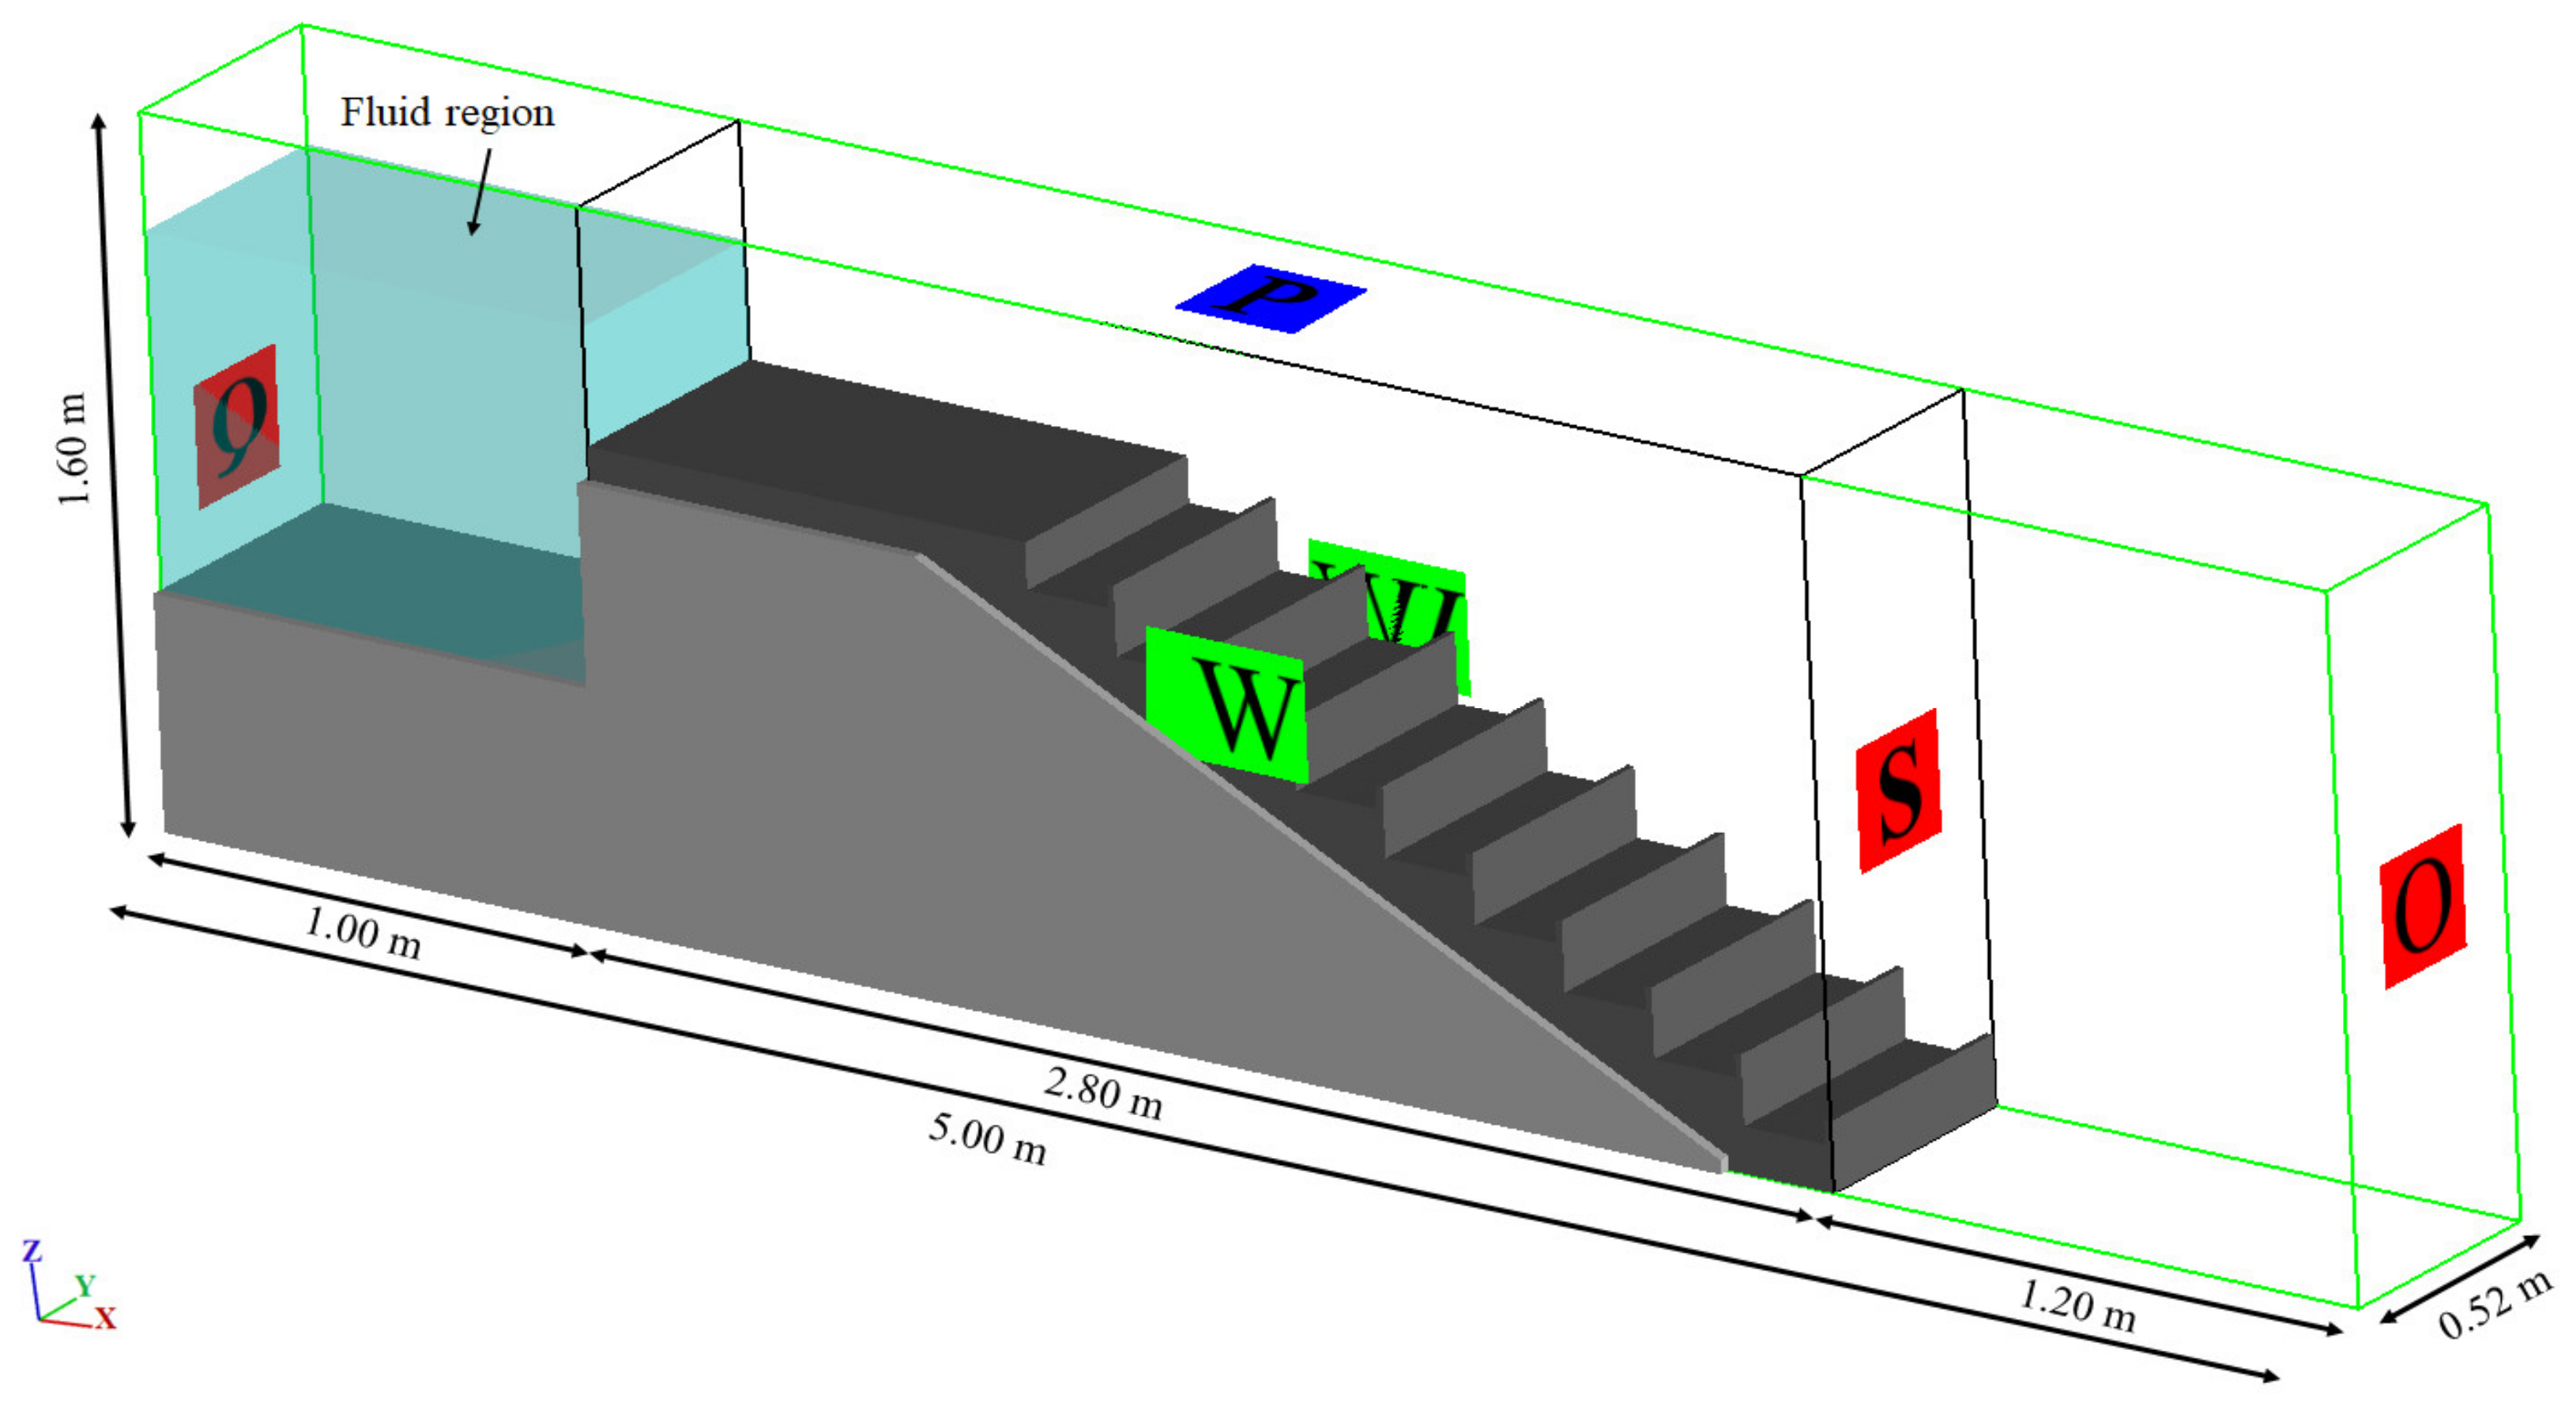
Boundary conditions corresponding to the physical conditions of the problem were employed. The inlet boundary condition was set as the discharge flow rate (Q) at the beginning of the spillway channel. At the downstream end of the domain, an outflow BC was applied (to prevent the downstream boundary effects on the last step results). No-slip conditions, used at the wall boundaries and the bottom, are expressed as zero tangential and normal velocities (u = v = w = 0, where u, v, and w are the velocities in directions x, y, and z, respectively). With a no-slip boundary, it was assumed that a law-of-the-wall type profile (the average velocity of a turbulent flow at a certain point is proportional to the logarithm of the distance from that point to the boundary of the fluid region) exists in the boundary layer, according to the applied RNG k-ε turbulence closure model. Wall roughness was not taken into consideration given the negligible material roughness of the experimental setup used for validation of the numerical solutions. However, the logarithmic velocity profile is used by the RANS model to calculate the shear stress at all no-slip wall boundaries in conjunction with the turbulence closure model. Specific pressure (P) (standard atmospheric pressure) was employed at the upper face and the symmetry boundary condition (S) was used in the inner boundaries as well. In the symmetry boundary condition, no shear stresses were calculated across the boundary [36]. Figure 4 shows the computational domain of the present study and associated boundary conditions.
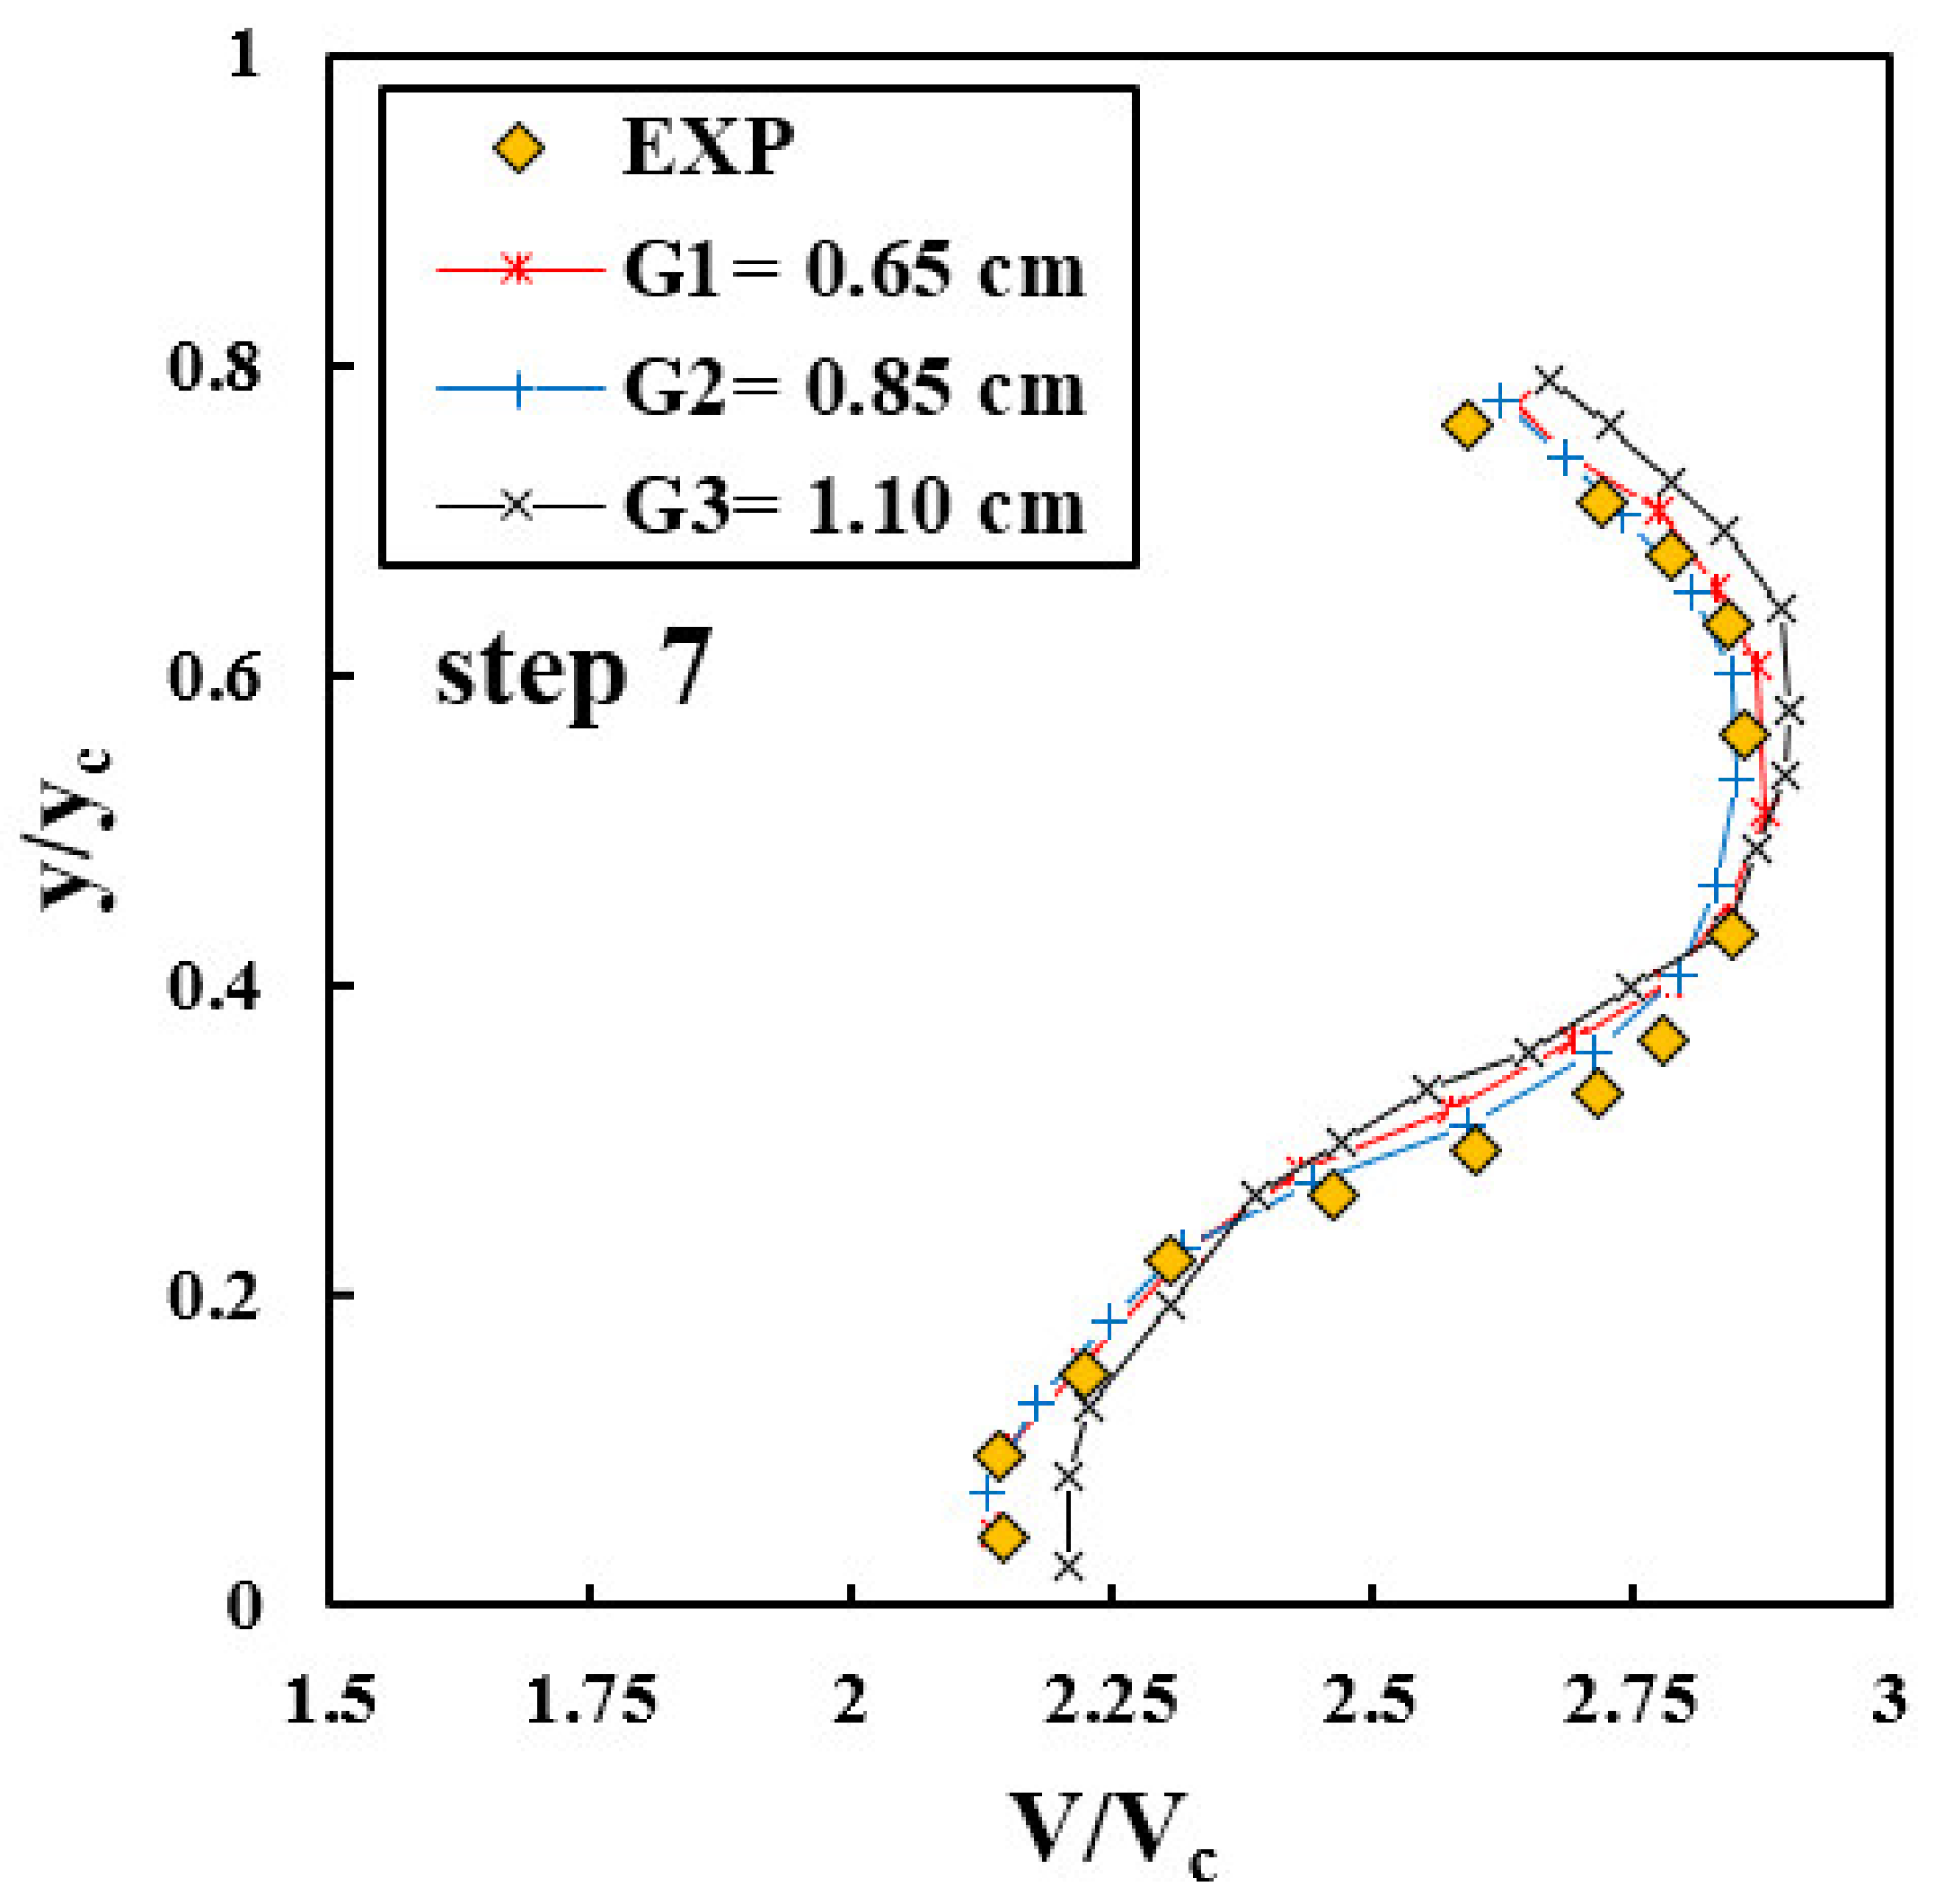
Several computational meshes were tested to select the appropriate mesh with the use of a grid convergence index (GCI), which is a widely accepted and recommended method for estimating discretization error. The analysis was developed following the Richardson extrapolation method by Celik et al. [50]. Three different meshes with fine, medium, and coarse cells, consisting of 1,141,124, 1,975,870, and 2,798,910 cells in total (without considering the cropped domain), respectively, were used to examine the effects of the grid size on the accuracy of the numerical results. Table 2 summarizes certain details of the three computational grids. Cell size was considered as the minimum refinement ratio, rij, of 1.3 recommended by Celik et al. [50].
A grid convergence index (GCI) [51] was determined for the computed velocity profiles over step 7 on the three grids. Using the Richardson error estimator to compare the three grids, the fine grid convergence index is defined as:
where E32 = (us2 − us3)/us2 and is the approximate relative error between the medium and fine grids; us2 and us2 = medium and fine grid solutions for velocities, respectively; and p = local order of accuracy. For the three-grid solutions, p is obtained by solving the equation:
Here, e21 = us2 − us1; e32 = us3 − us2; r21 = G2/G1 and is the grid refinement factor between a coarse and medium grid; and r32 = G3/G2 and is the grid refinement factor between a medium and fine grid. For the present three-grid comparisons, G1 < G2 < G3. Table 3 shows a summary of the GCI calculations for velocity distributions in step 7 in Q = 0.113 m3/s.
In the Figure 5, the velocity distributions profiles are presented on step 7 for three grids set. Once the mesh convergence analysis was performed, the mesh consisting of a containing block with a cell size of 1.8 cm and a nested block of 0.85 cm was chosen.
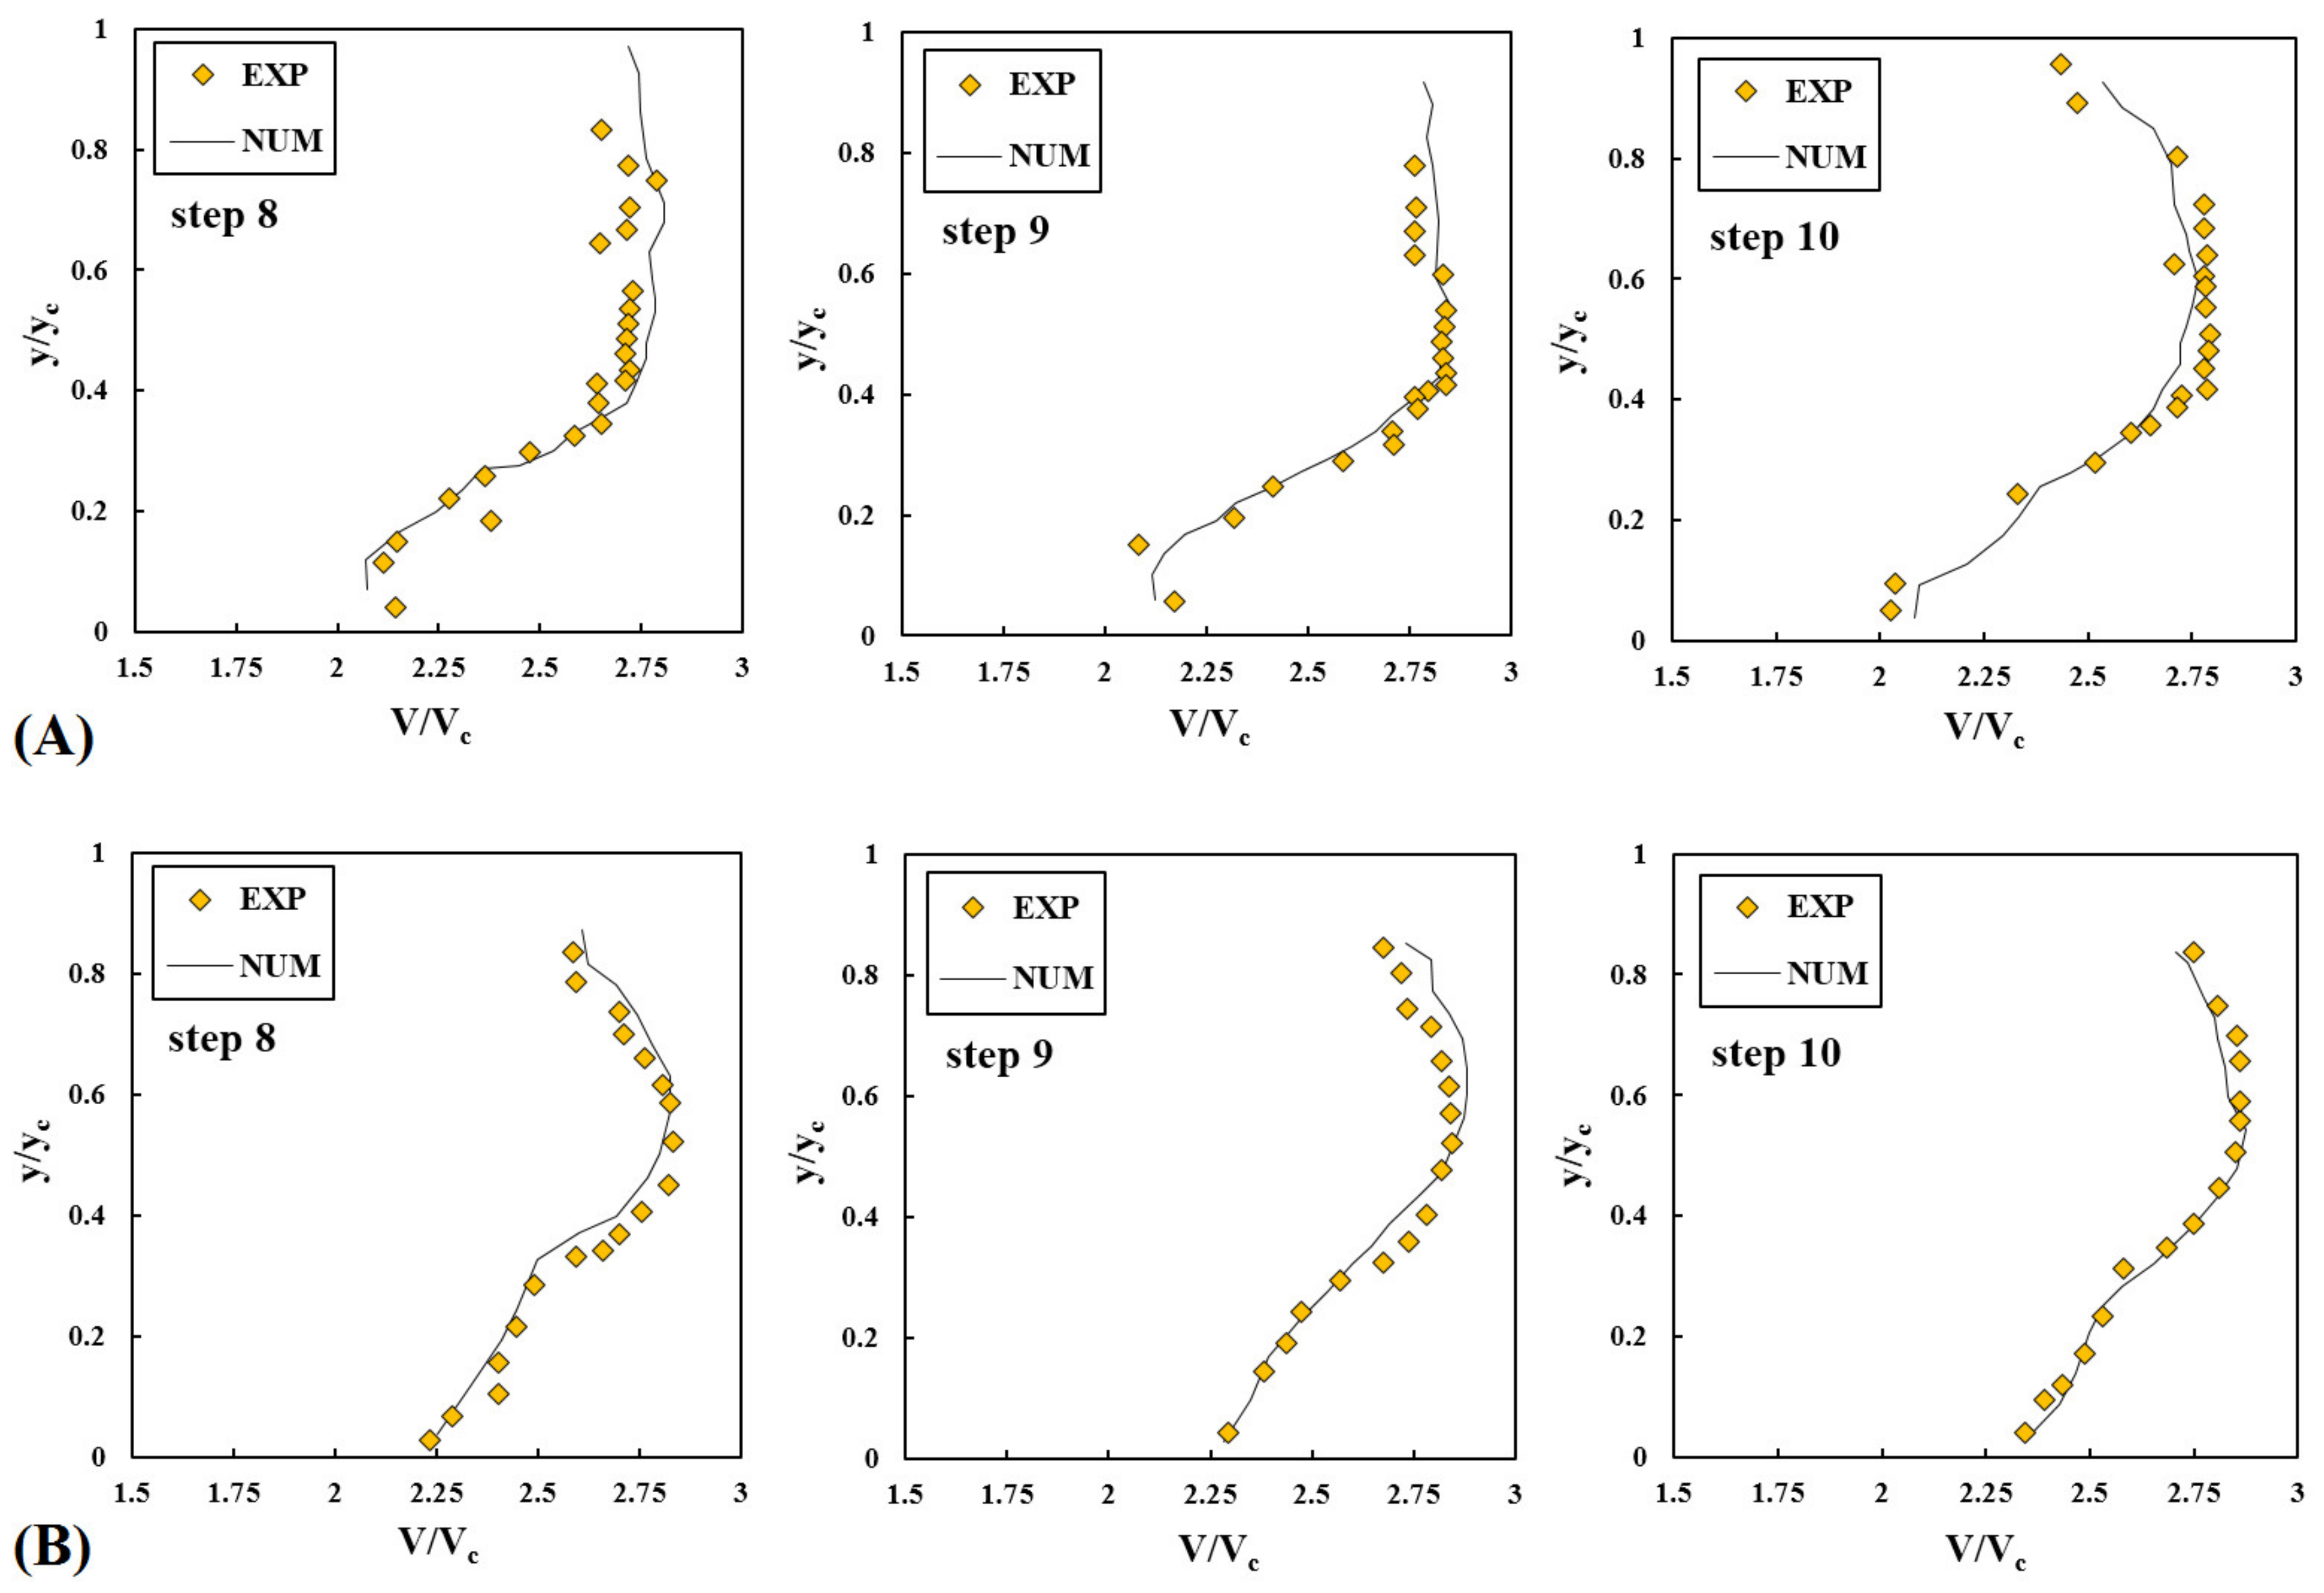
The resulting apparent order of the model was 3.46 and the maximum GCI value for the velocity profiles over step 7 was 5.04%, corresponding to 0.12 m/s. In addition, experimental data obtained from Felder et al. [18] were used to verify the numerical results by comparing the velocity distributions as functions of the dimensionless water depth y/yc (here, y is the water depth on the step) against the dimensionless velocities V/Vc (here, Vc is critical velocity Vc = (g × yc)0.5) over flat steps 8, 9, and 10, as shown in Figure 6. The maximum values for the relative error for steps 8, 9, and 10 were 6.25%, 5.25%, and 6.35% for Q = 0.113 m3/s and 6.42%, 5.33%, and 6.21% for Q = 0.090 m3/s, respectively. The maximum level of consistency between the numerical and experimental model was in the middle area of the depth up to the flow surface, indicating a high degree of accuracy of the numerical simulation.
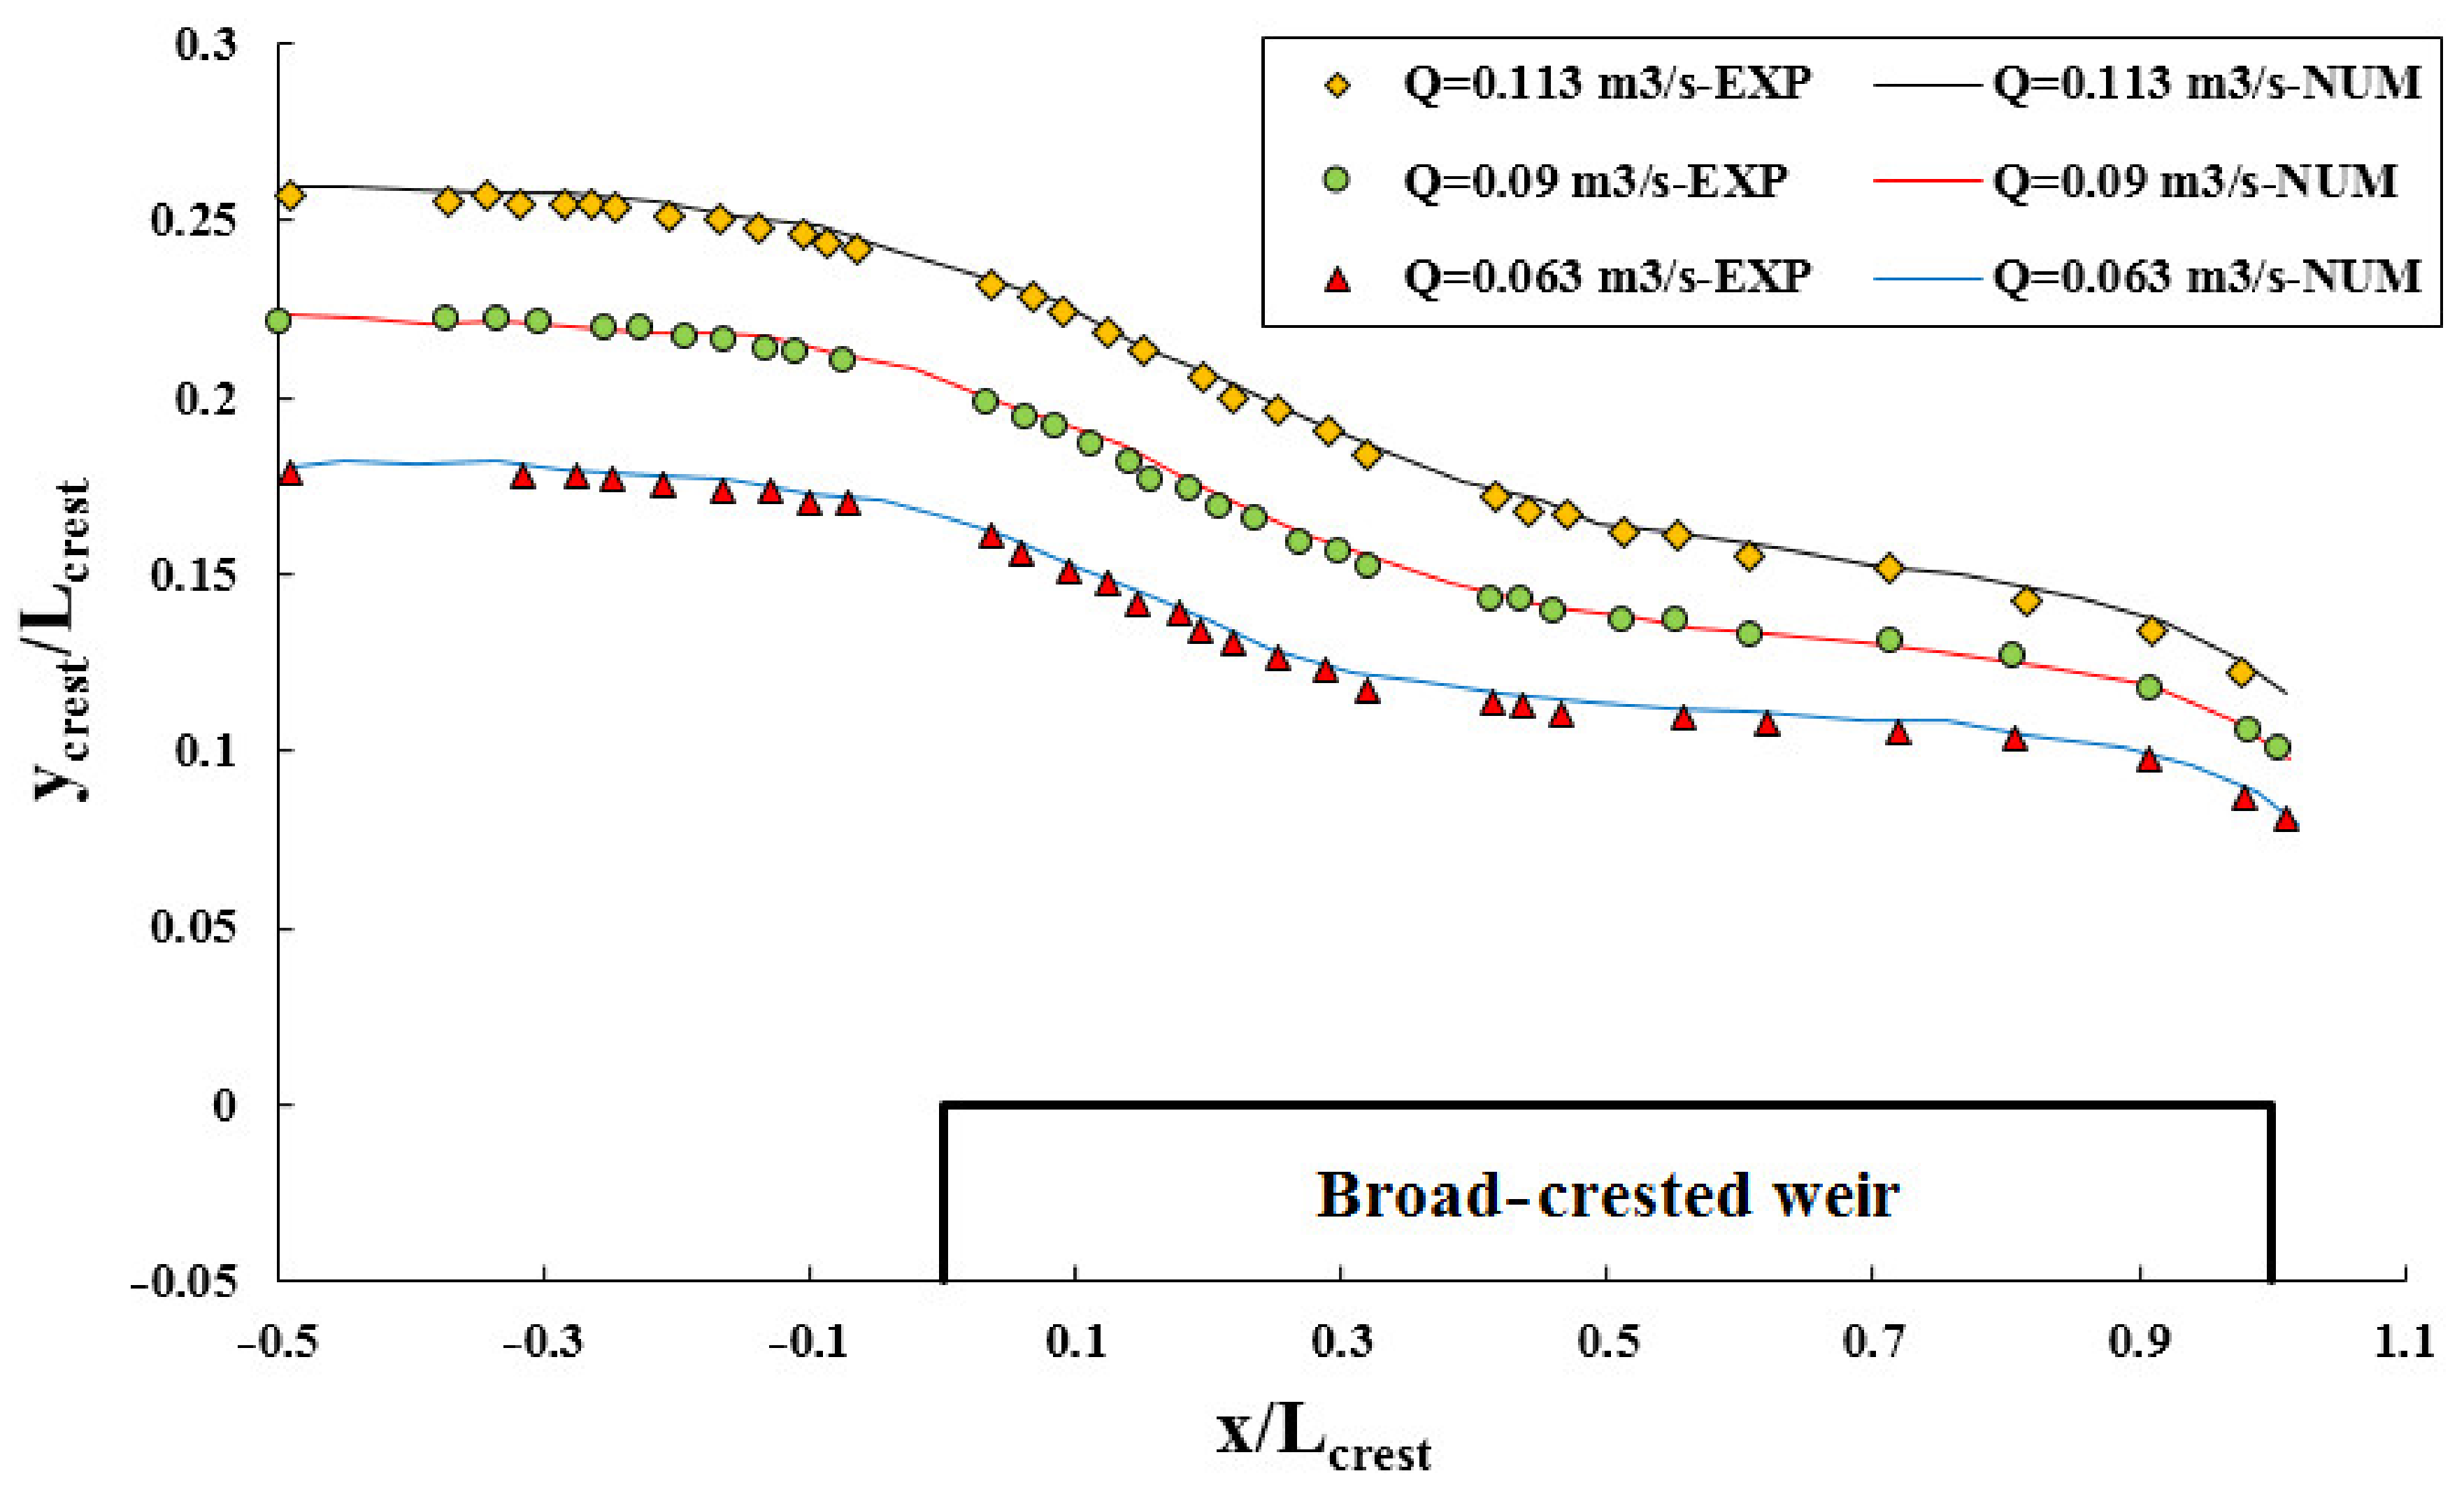
The numerical model was also validated through the experimental data obtained from Felder et al. [18] by comparing the free-surface profiles as functions of the dimensionless water depth ycrest/Lcrest over a broad-crested weir for three different discharges. As shown in Figure 7, the simulated water surface profiles over a broad-crested weir length (Lcrest) were very similar to the experimental values. The mean relative error percentage of the flat stepped spillway was 4.85%. This figure indicates that the numerical results were fairly consistent with the experimental results. In addition, the numerical model was able to simulate the flow patterns with different discharges to an acceptable level.
4. Results and Discussions
In this section, we analyze results for the different configurations steps. In particular, we focus our attention on the flow pattern in terms of streamlines and velocity vectors, plotted in a vertical transverse section; velocity and pressure distribution; location of the inception point; residual head and energy dissipation; and turbulent kinetic energy (TKE).
In the present study, skimming flows occur at all discharges. Taking into consideration the fact that the change process of the flow behavior (flow pattern, velocity, pressure, and TKE) was the same for all discharge points, the results relating to only one of the discharges are shown in Section 4. It should be noted that for the energy dissipation and inception point, all discharges were considered and represented by critical depth (yc) and The Froude number (F*)
4.1. Flow Pattern
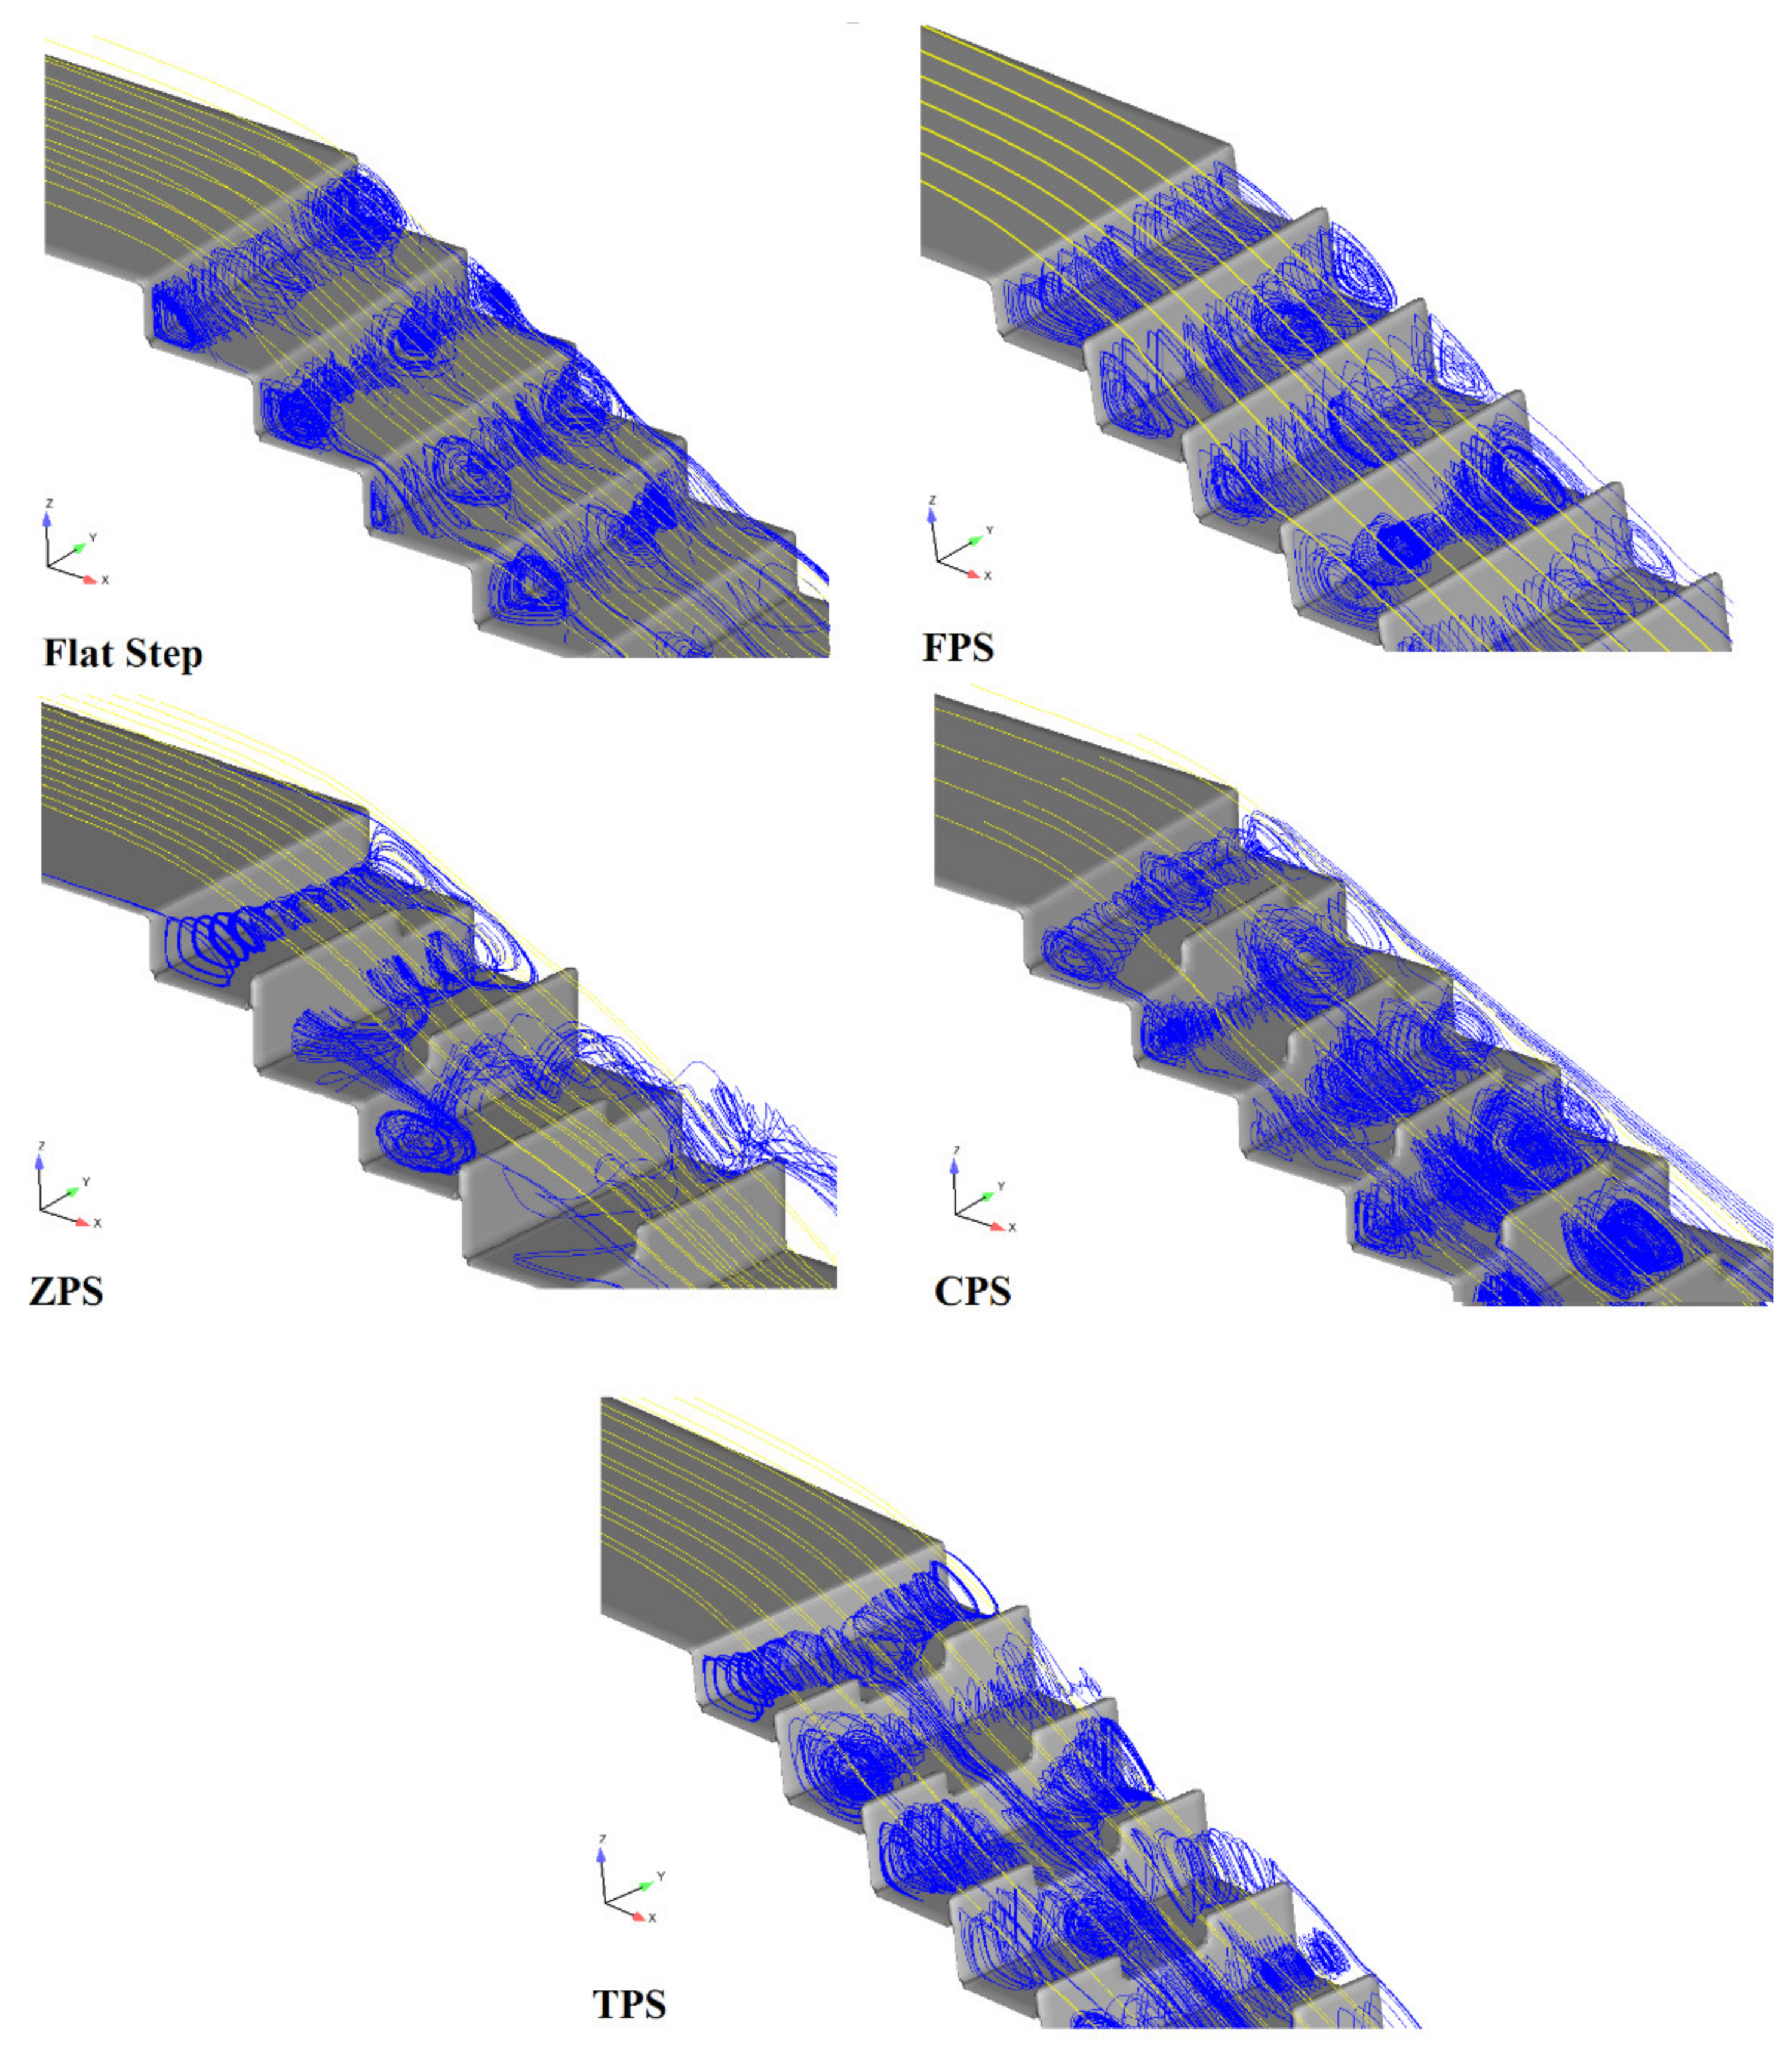
Figure 8 shows the streamlines of different pool configurations steps. It can be seen that the streamlines are parallel to the axial plane in the flat and FPS steps. When we used the pooled step, the water flow caused collisions near the pool and the aggregation of the streamlines increased. In ZPS and CPS configurations steps, the streamlines were not parallel to the axial plane, which meant that in the parts of steps with pool aggregation, the streamlines were more intense, while in the parts without pool aggregation, the streamlines aggregation decreased.
Differences in the movement of the streamlines affected the free water surface. In other words, the free water surface was horizontal in flat and FSP steps, however in ZPS, CPS, and TPS, standing sidewall waves were formed on the free water surface. According to Felder et al. [18], standing sidewall waves depend on the flow discharge and pool configurations in the flow over stepped spillways. Figure 9 highlights the streamlines on the representative steps in each configuration. As can be seen, as with the flat stepped spillway, the flow surface over the pool weir was approximately parallel to the pseudo-bottom formed by the pool edges, although ZPS, CPS, and TPS presented some instabilities caused by the staggered configurations.
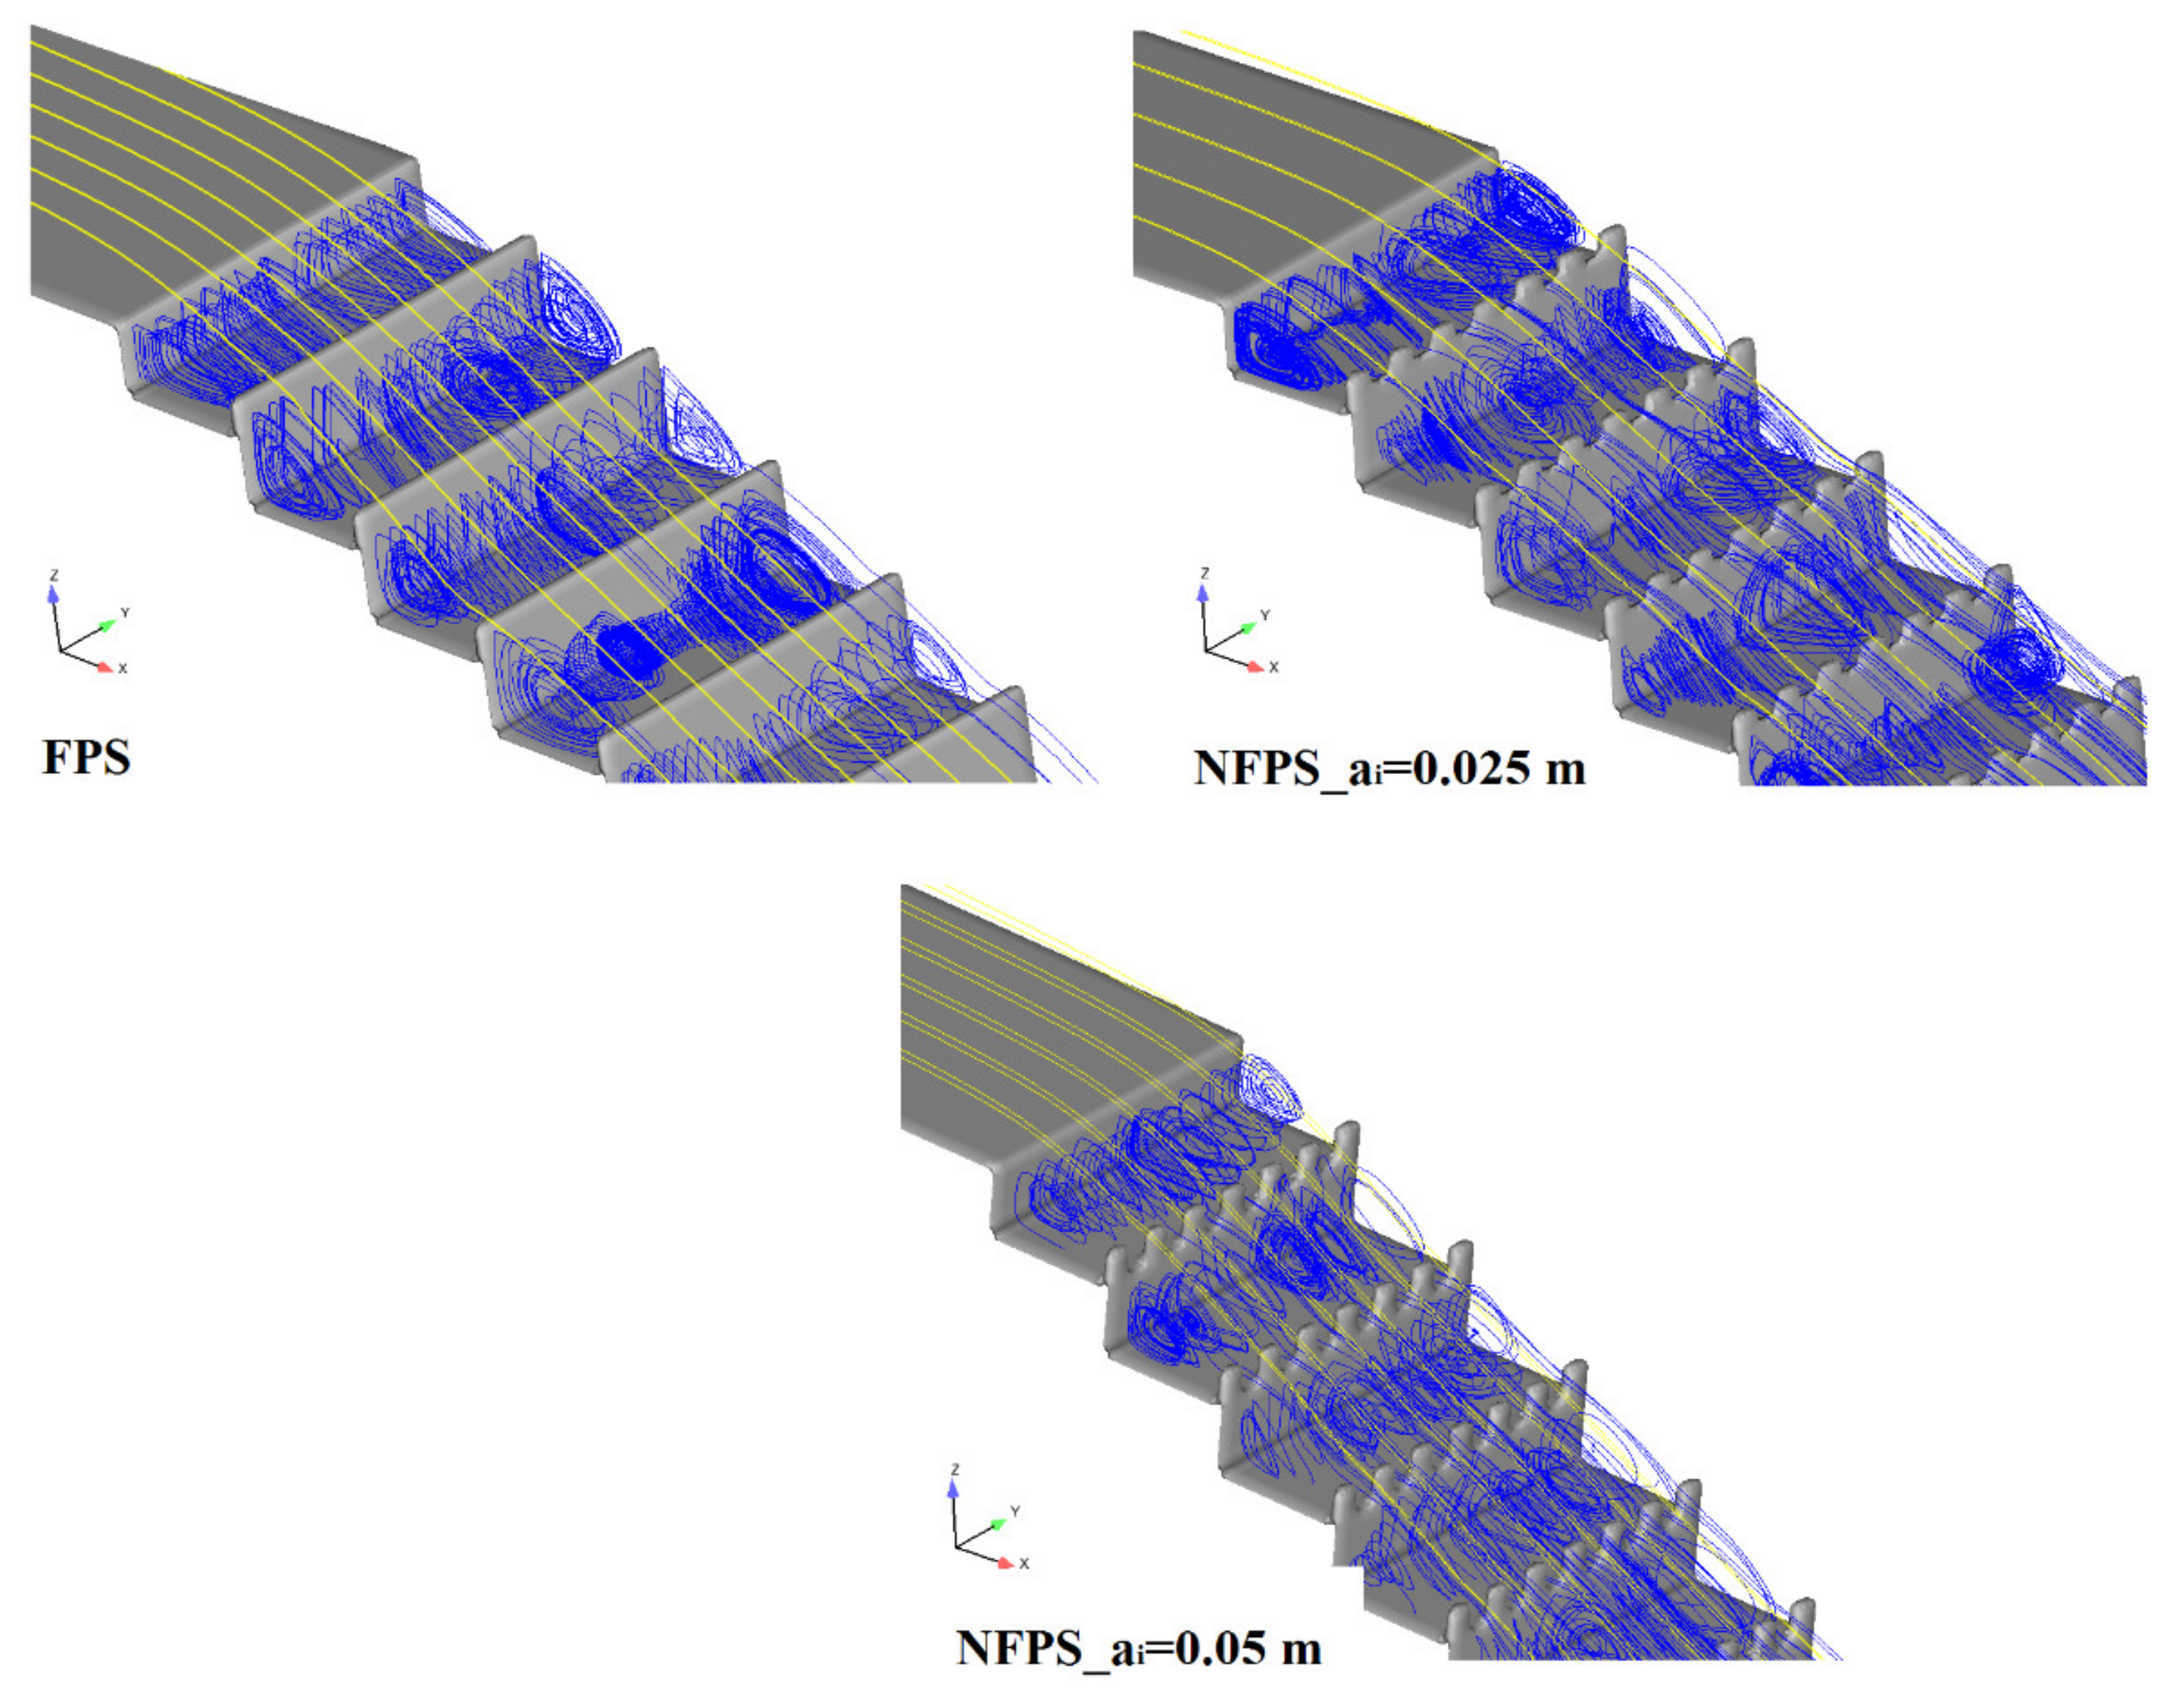
Figure 10 displays the streamlines of the notch of the pooled steps with ai = h/4 (no = 50%) and h/2 (no = 100%), and the results were compared with the pooled step (no = 0%). It can be seen that the streamlines do not show significant changes in the axial plane between the pooled steps and the notch of the pooled steps. When we used the notch of the pooled steps, the aggregation of the streamlines, due to the passage of some vortexes of the notch, decreased.
4.2. Velocity and Pressure Distribution
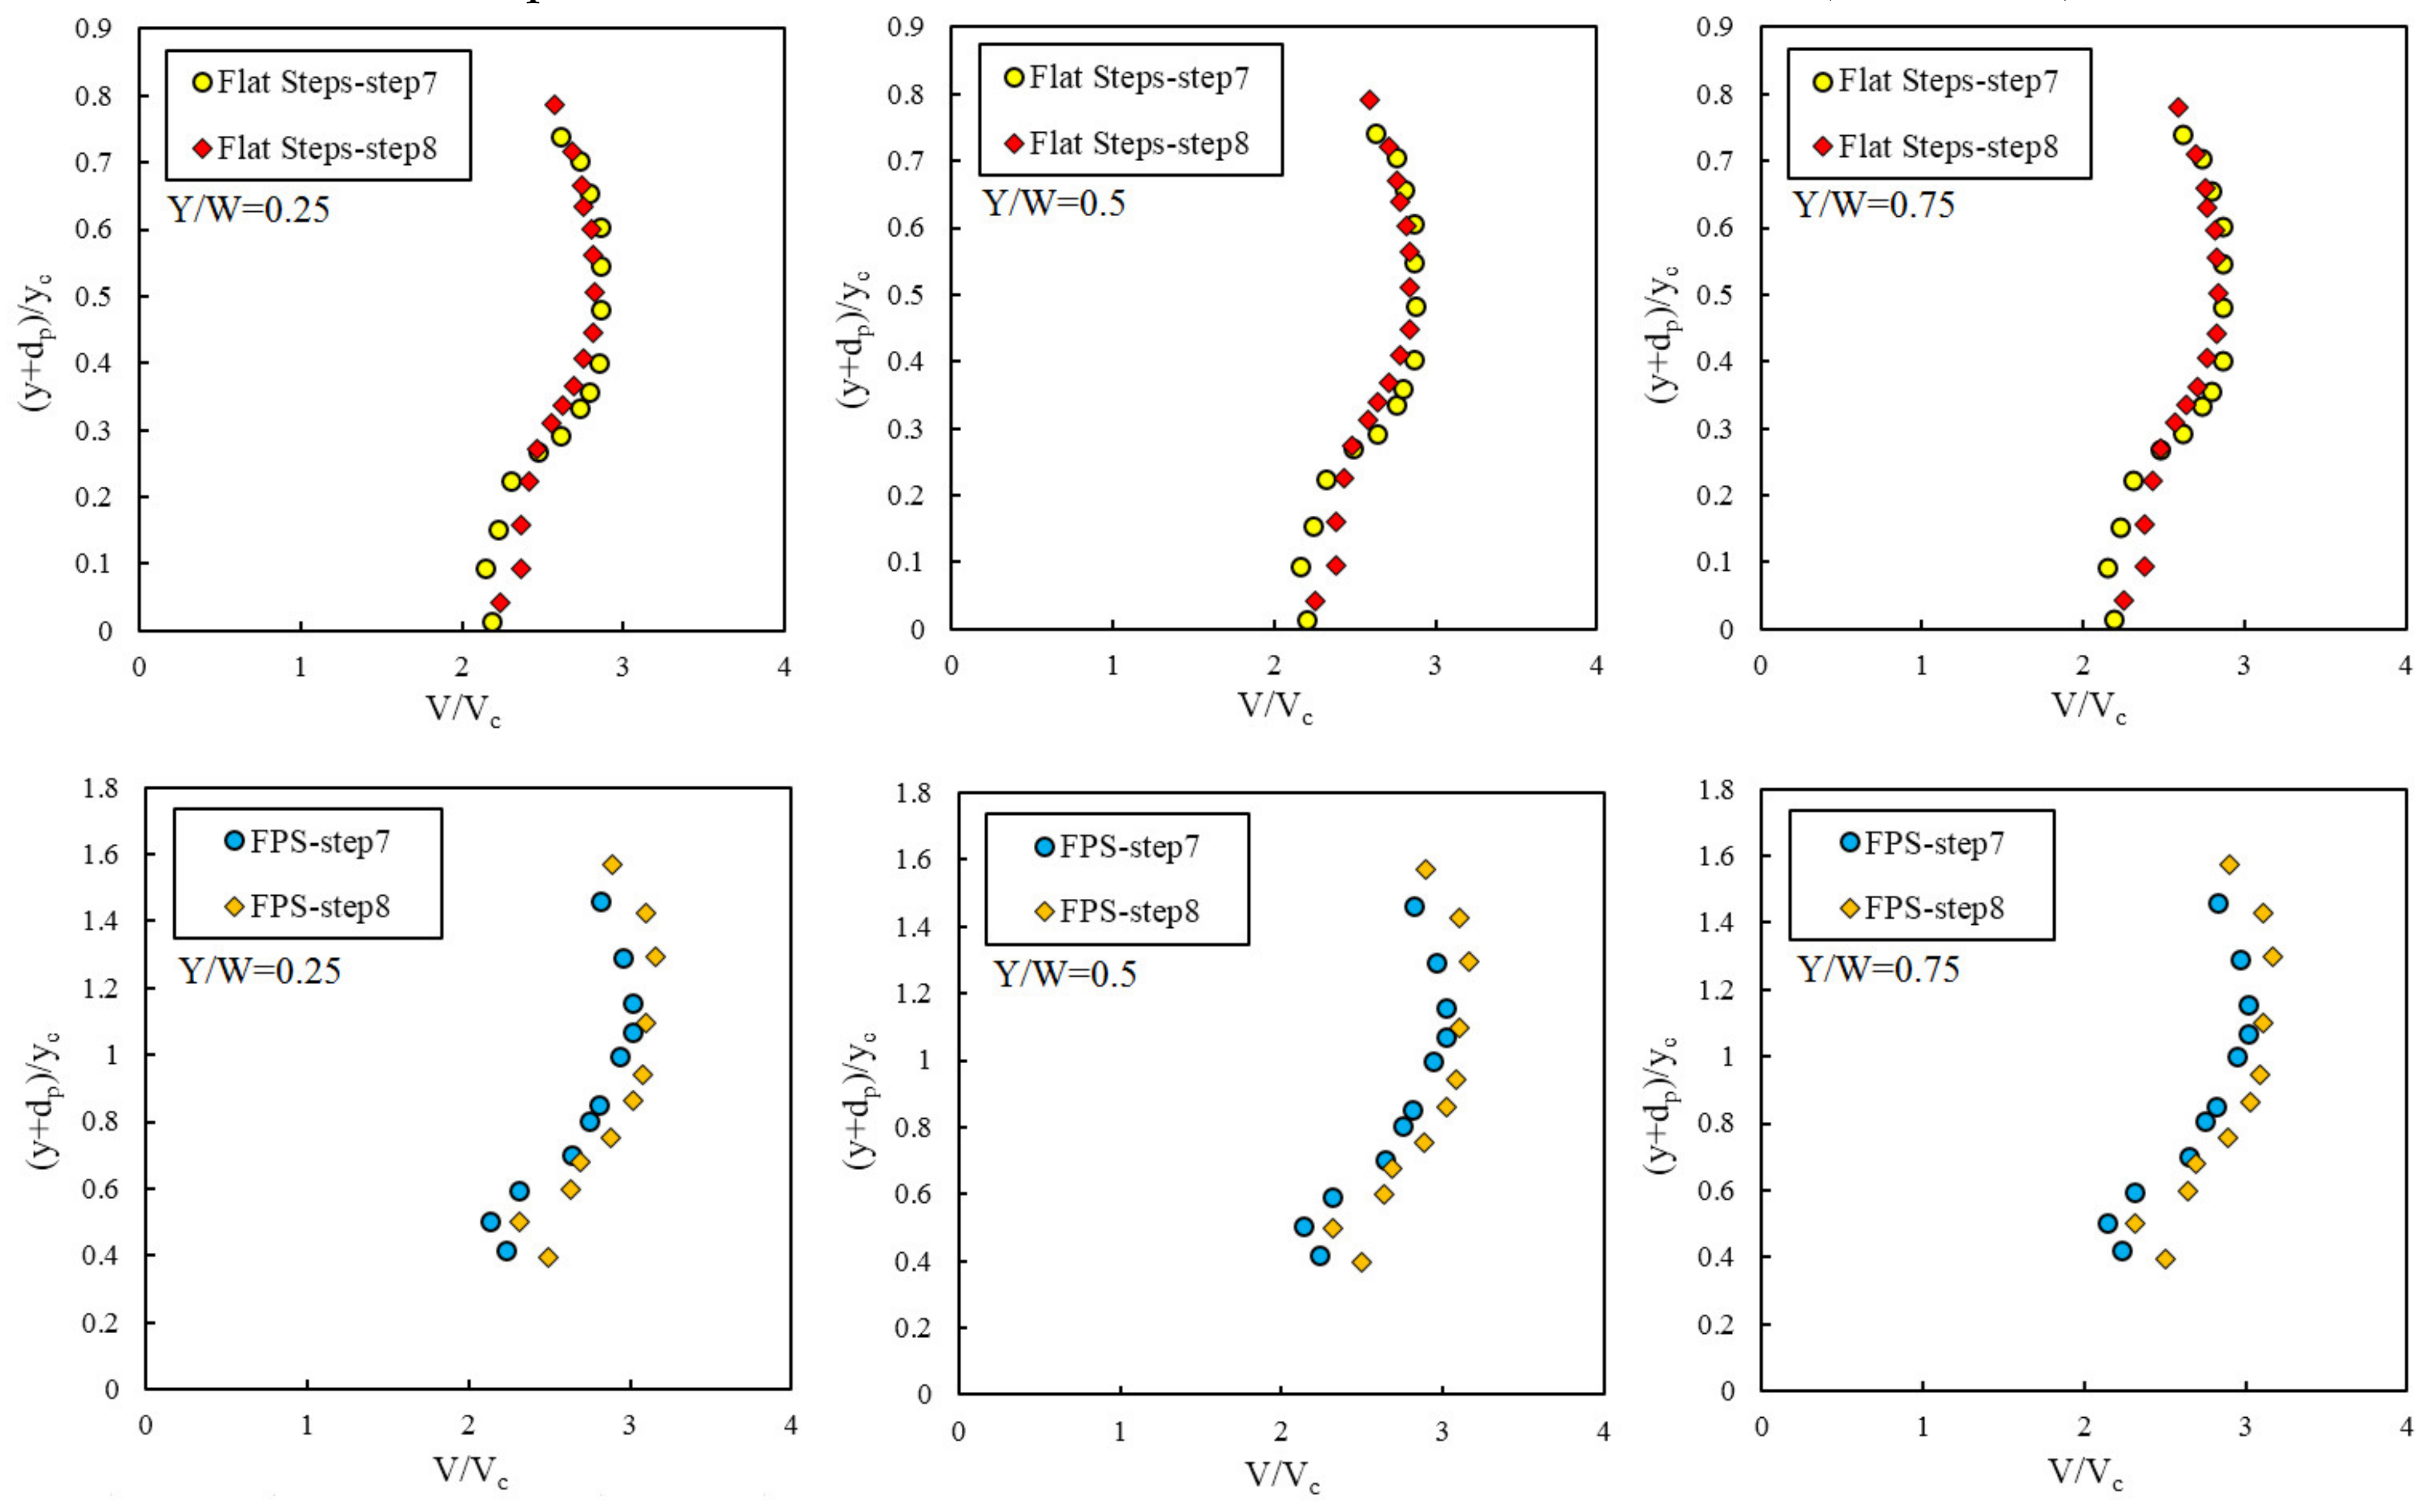
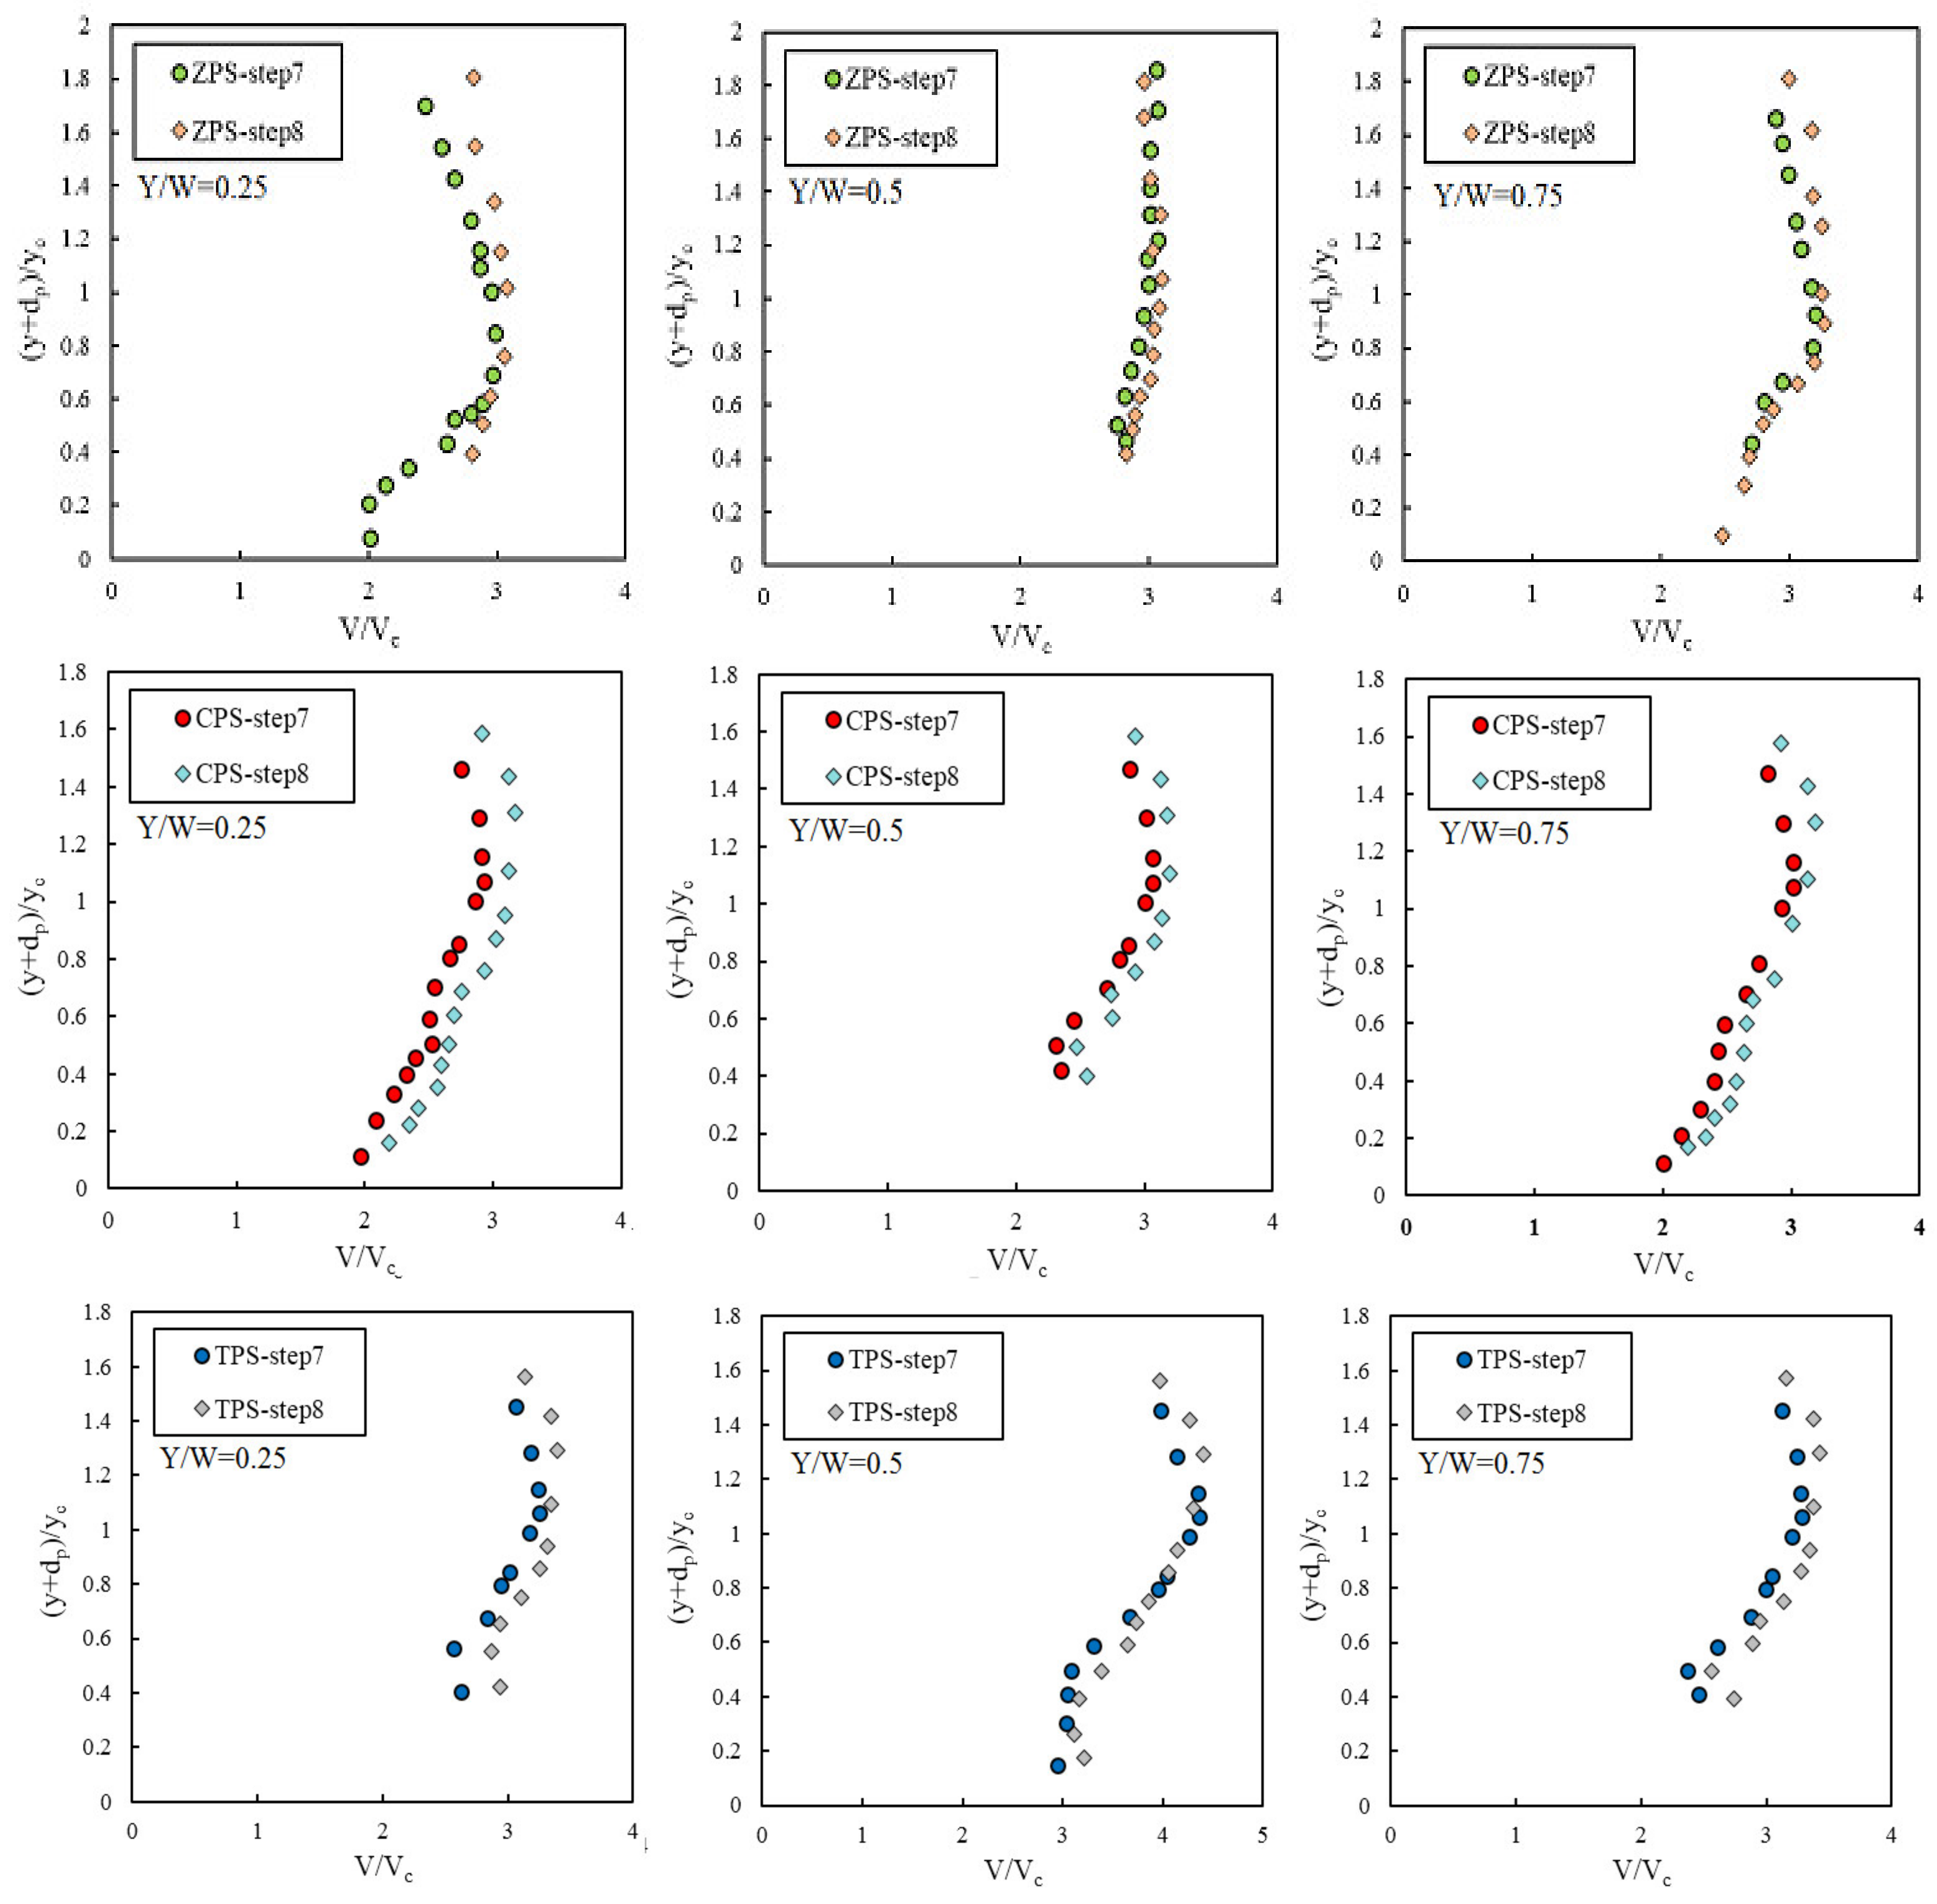
Figure 11 show velocity profiles for different pool configurations in terms of the dimensionless velocity V/Vc as a function of (y + dp)/yc for Q = 0.105 m3/s. Herein, Vc = ((Q × g)/W)0.5 is the critical flow velocity. For all configurations, the measurements were performed at three transverse locations: Y/W = 0.25, 0.5 (centerline), and 0.75.
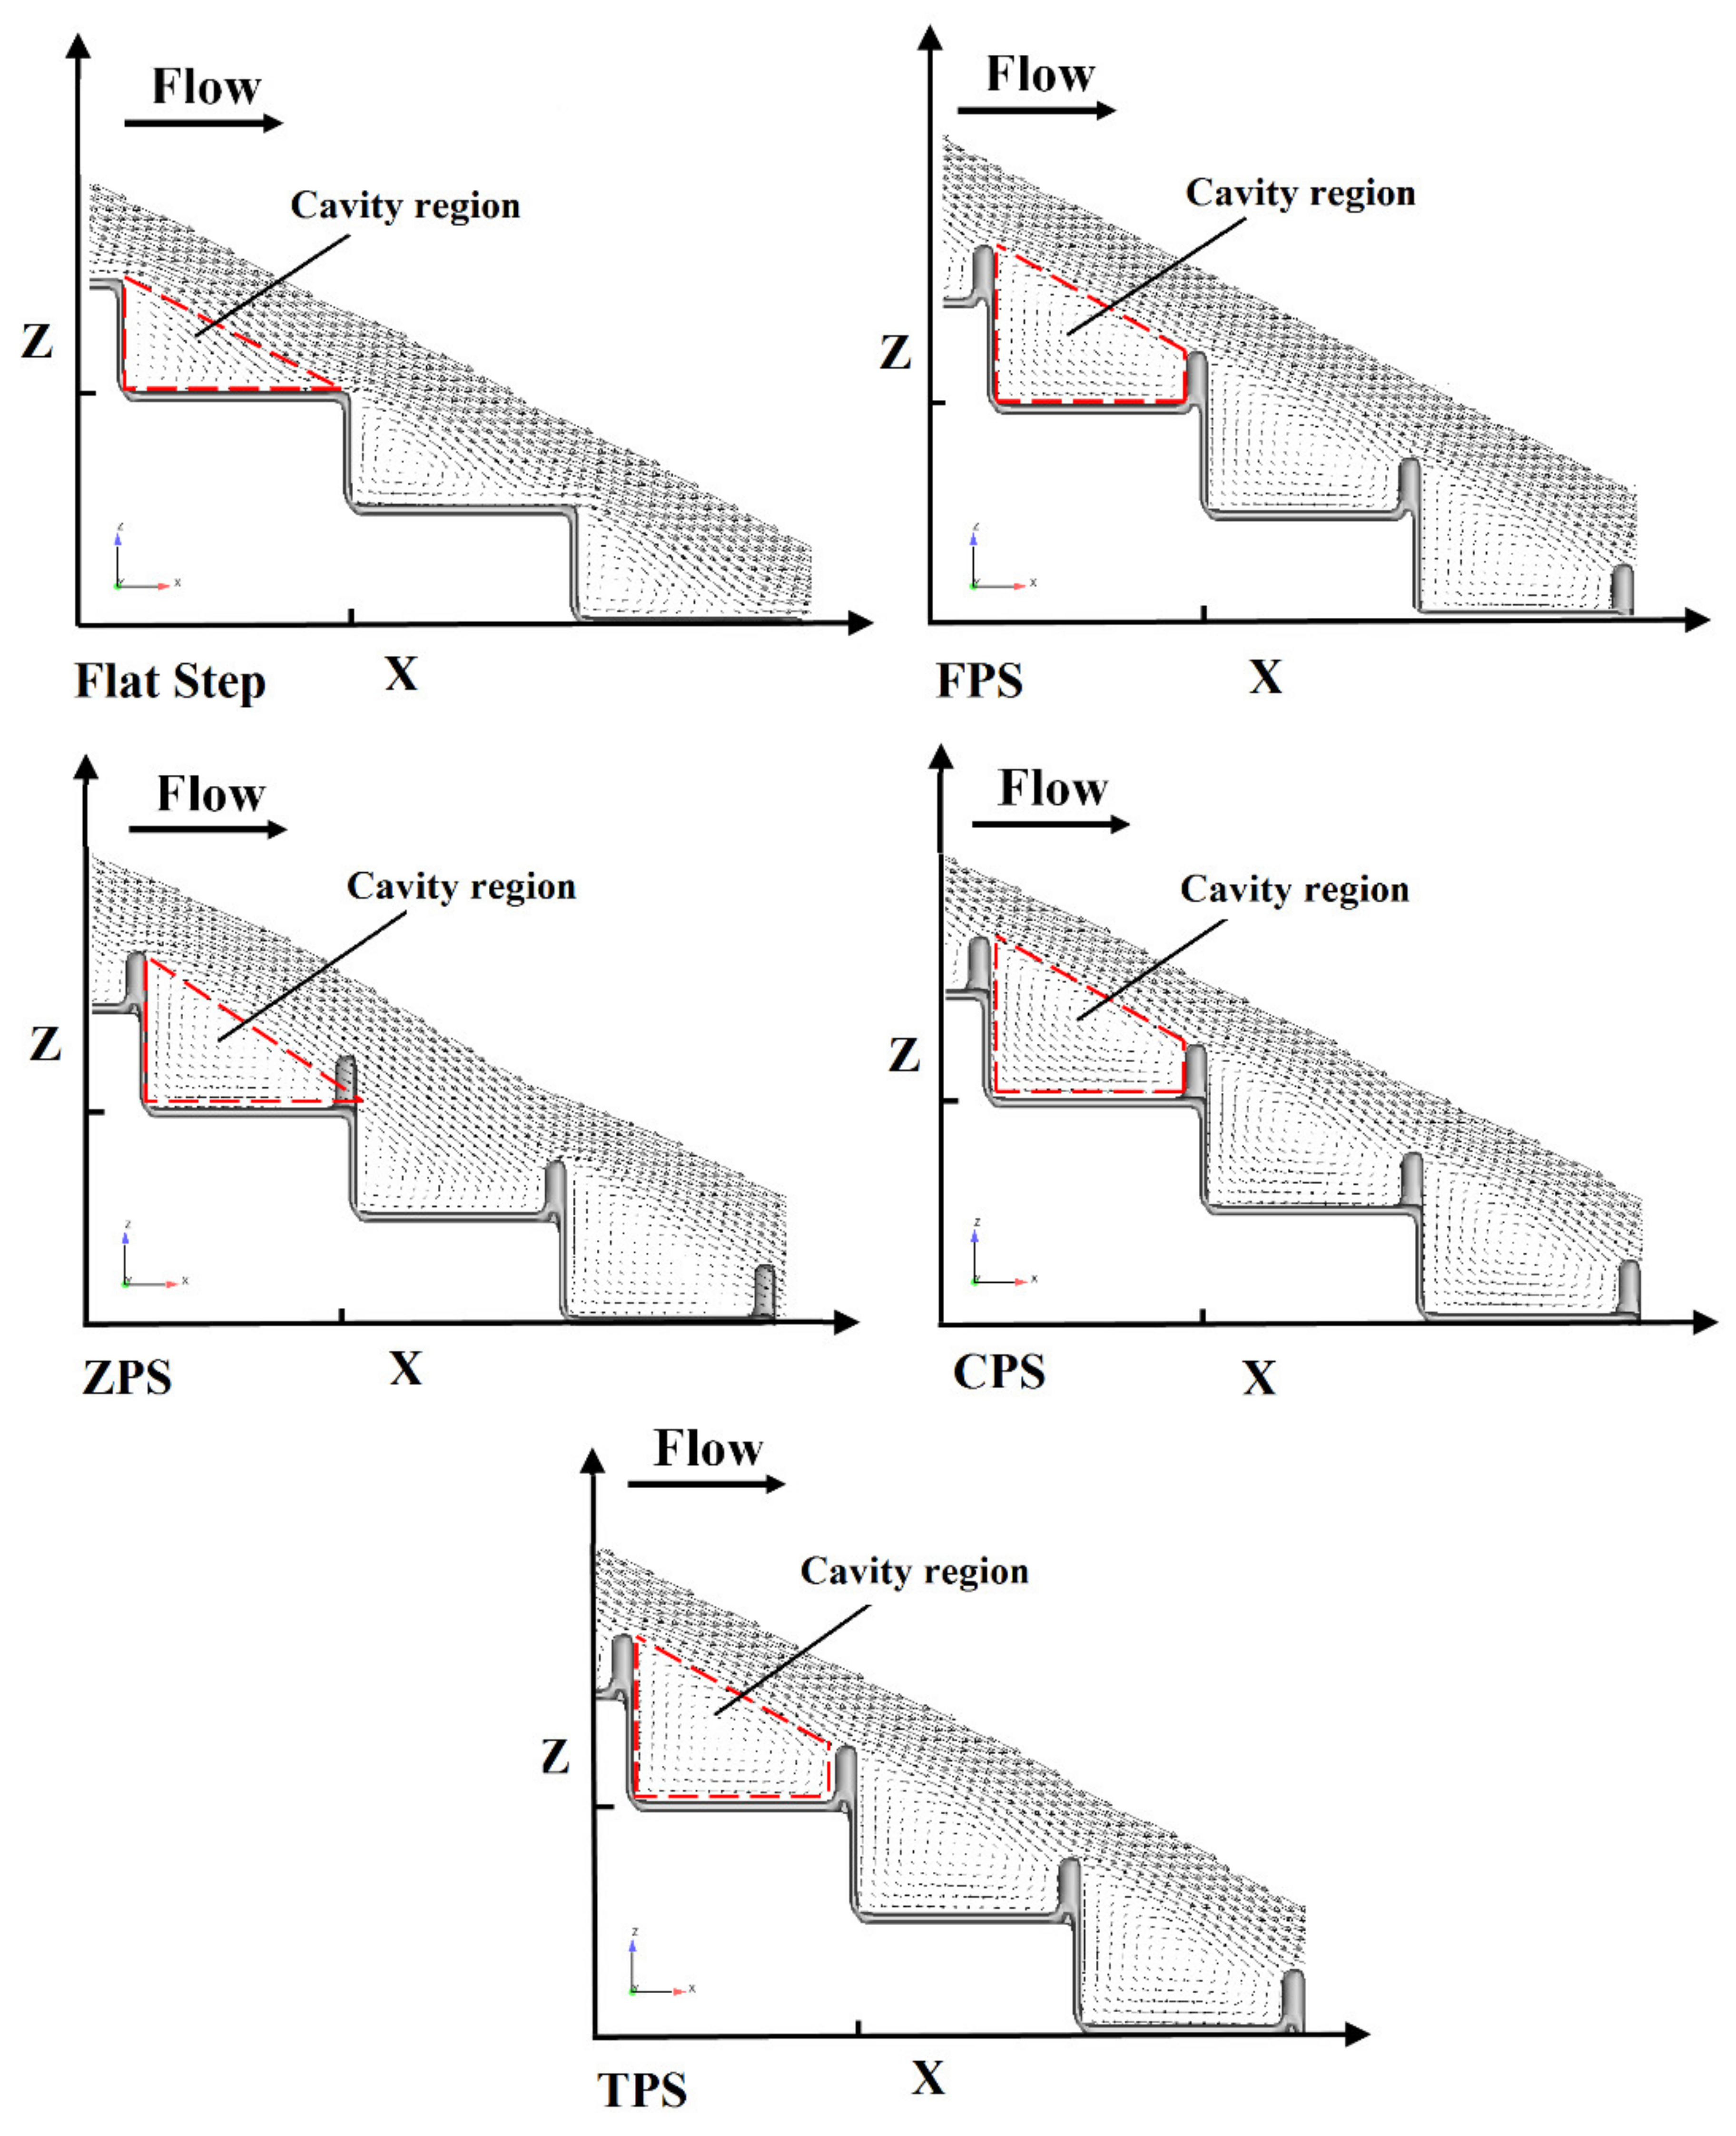
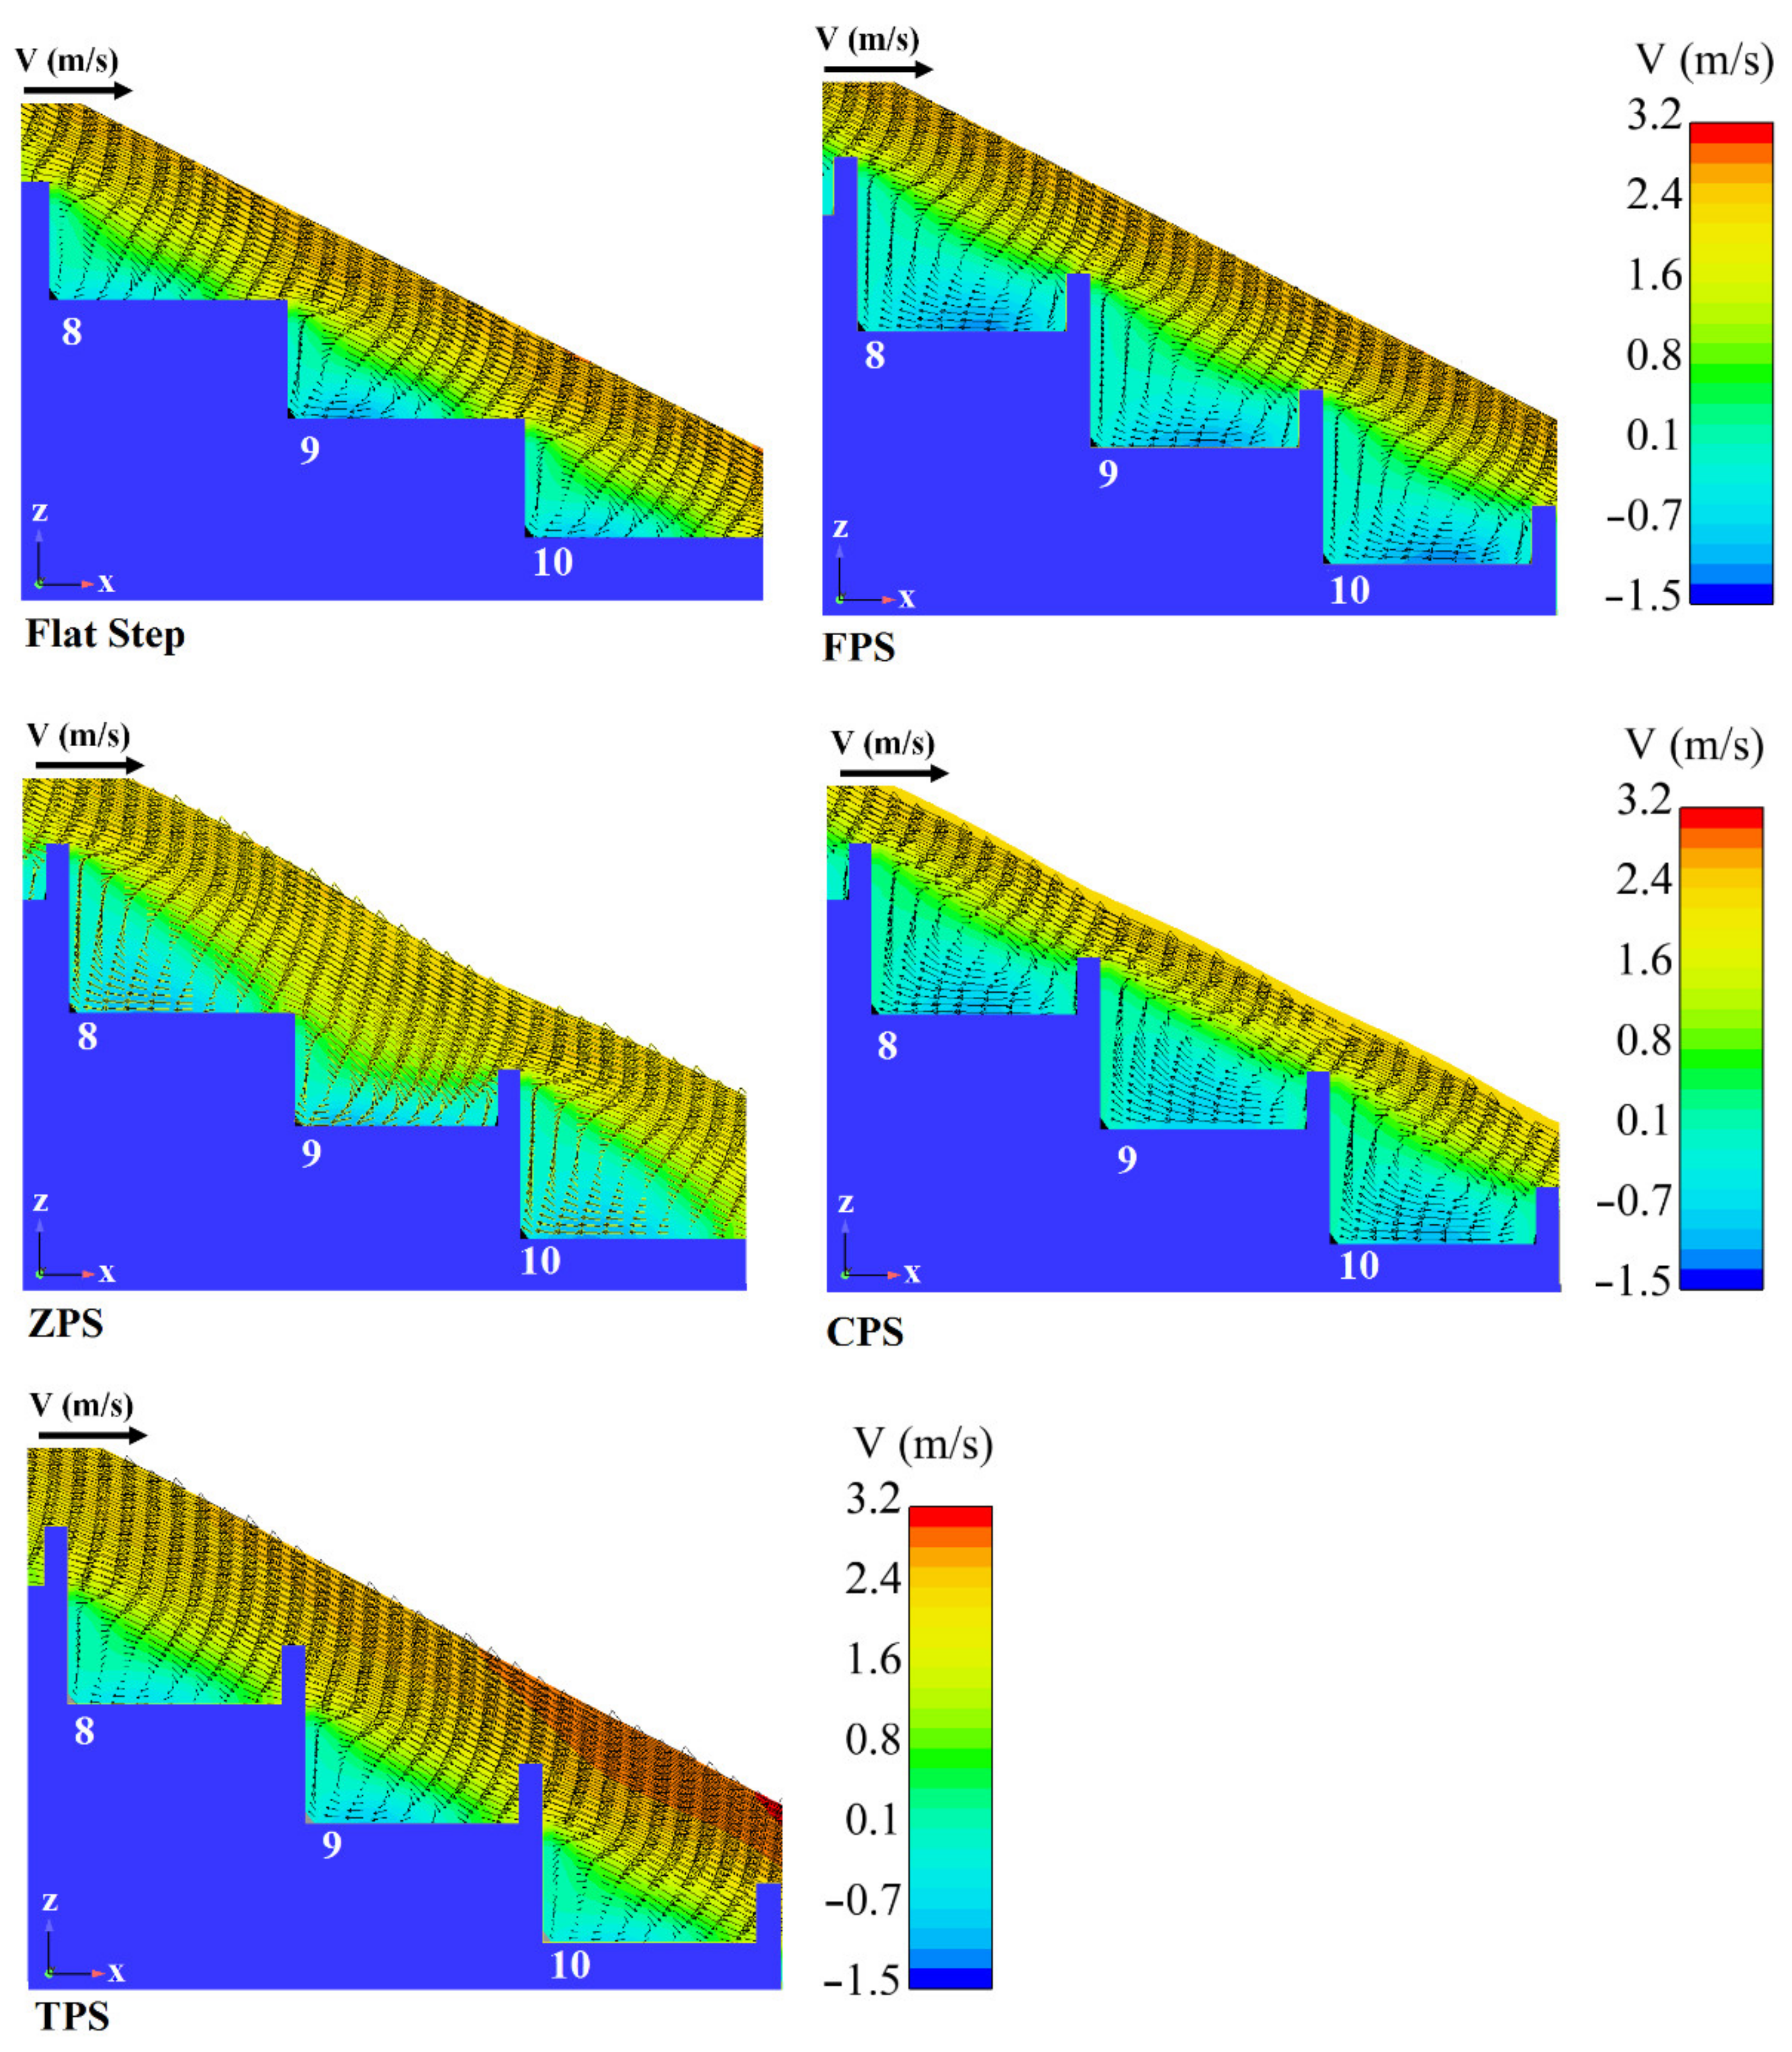
It can be seen that flat stepped spillways have smaller interfacial velocities compared with pooled steps. On the flat stepped spillways, the mean interfacial velocity was ~2.51, and for the same flow conditions the average interfacial velocity on the pooled steps was ~2.96. The reason for this is that the water flow depth on steps for pooled stepped spillways was smaller than the flat step. The velocities on the pooled stepped spillways with different pool configurations had almost identical distributions for (y + dp)/yc > 0.6. However, the interfacial velocities on FPS steps are less than other pooled step configurations. In the bottom region, i.e., (y + w)/yc < 0.6, the velocity distributions for FPS with ZPS and CPS configurations were obviously different in the axial plane for Y/W = 0.25 and 0.75. However, at Y/W = 0.5, there was no major difference in the velocity distribution above different steps, except the free surface region. These cases have the opposite behavior between FPS and TPS at Y/W = 0.5. Figure 12 illustrates the velocity vectors in the axial plane Y/W = 0.5. In all configurations, the skimming flow transferring from the upstream to the downstream over the steps was partly trapped in the recirculating zones under the pseudo-bottom. However, it is evident that for pooled step configurations and in the recirculating zones, the vortex was significantly greater than for flat steps. Additionally, for each pooled step configuration, the velocity magnitude on steps was greater than on flat steps.
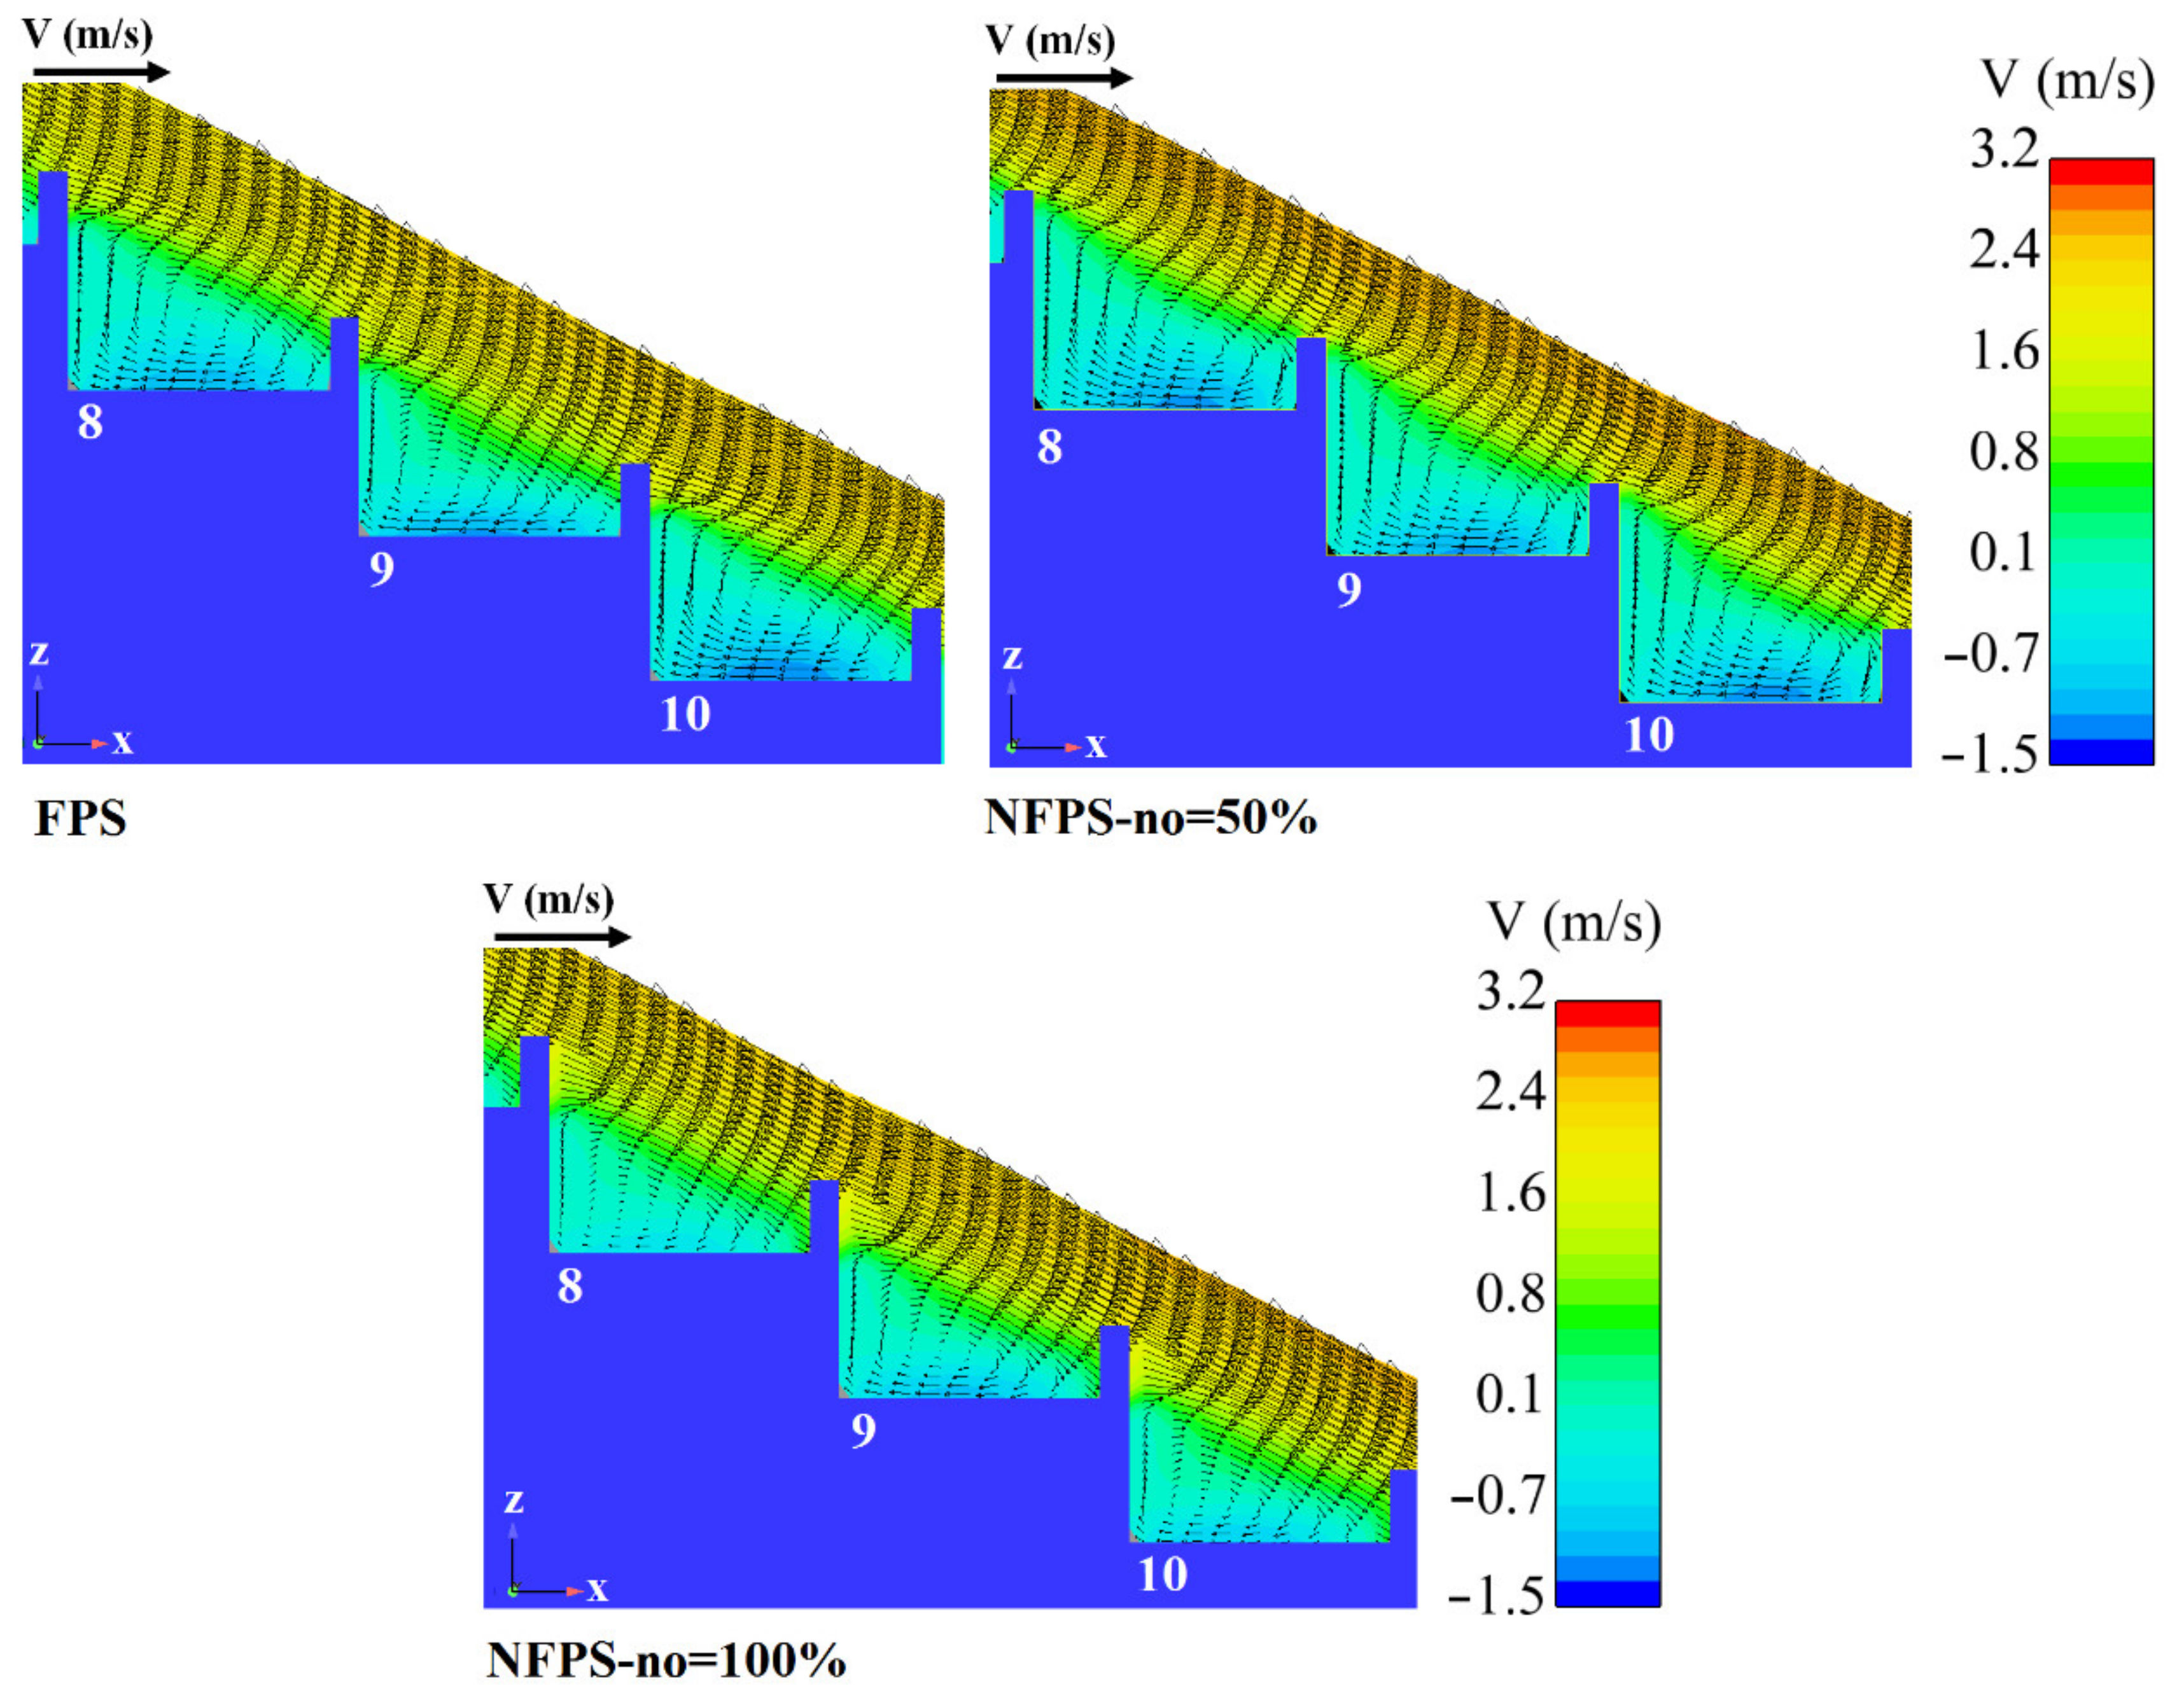
A comparison of the velocity contours at the notches of the pooled steps (no = 0%) are shown in Figure 13. The velocity pattern in the transverse direction was symmetrical, the maximum velocity magnitude was observed in the overlaying flow over the pooled step, while the minimum velocity value was in the proximity of the bottom, however no changes were evident with different notched pooled steps.
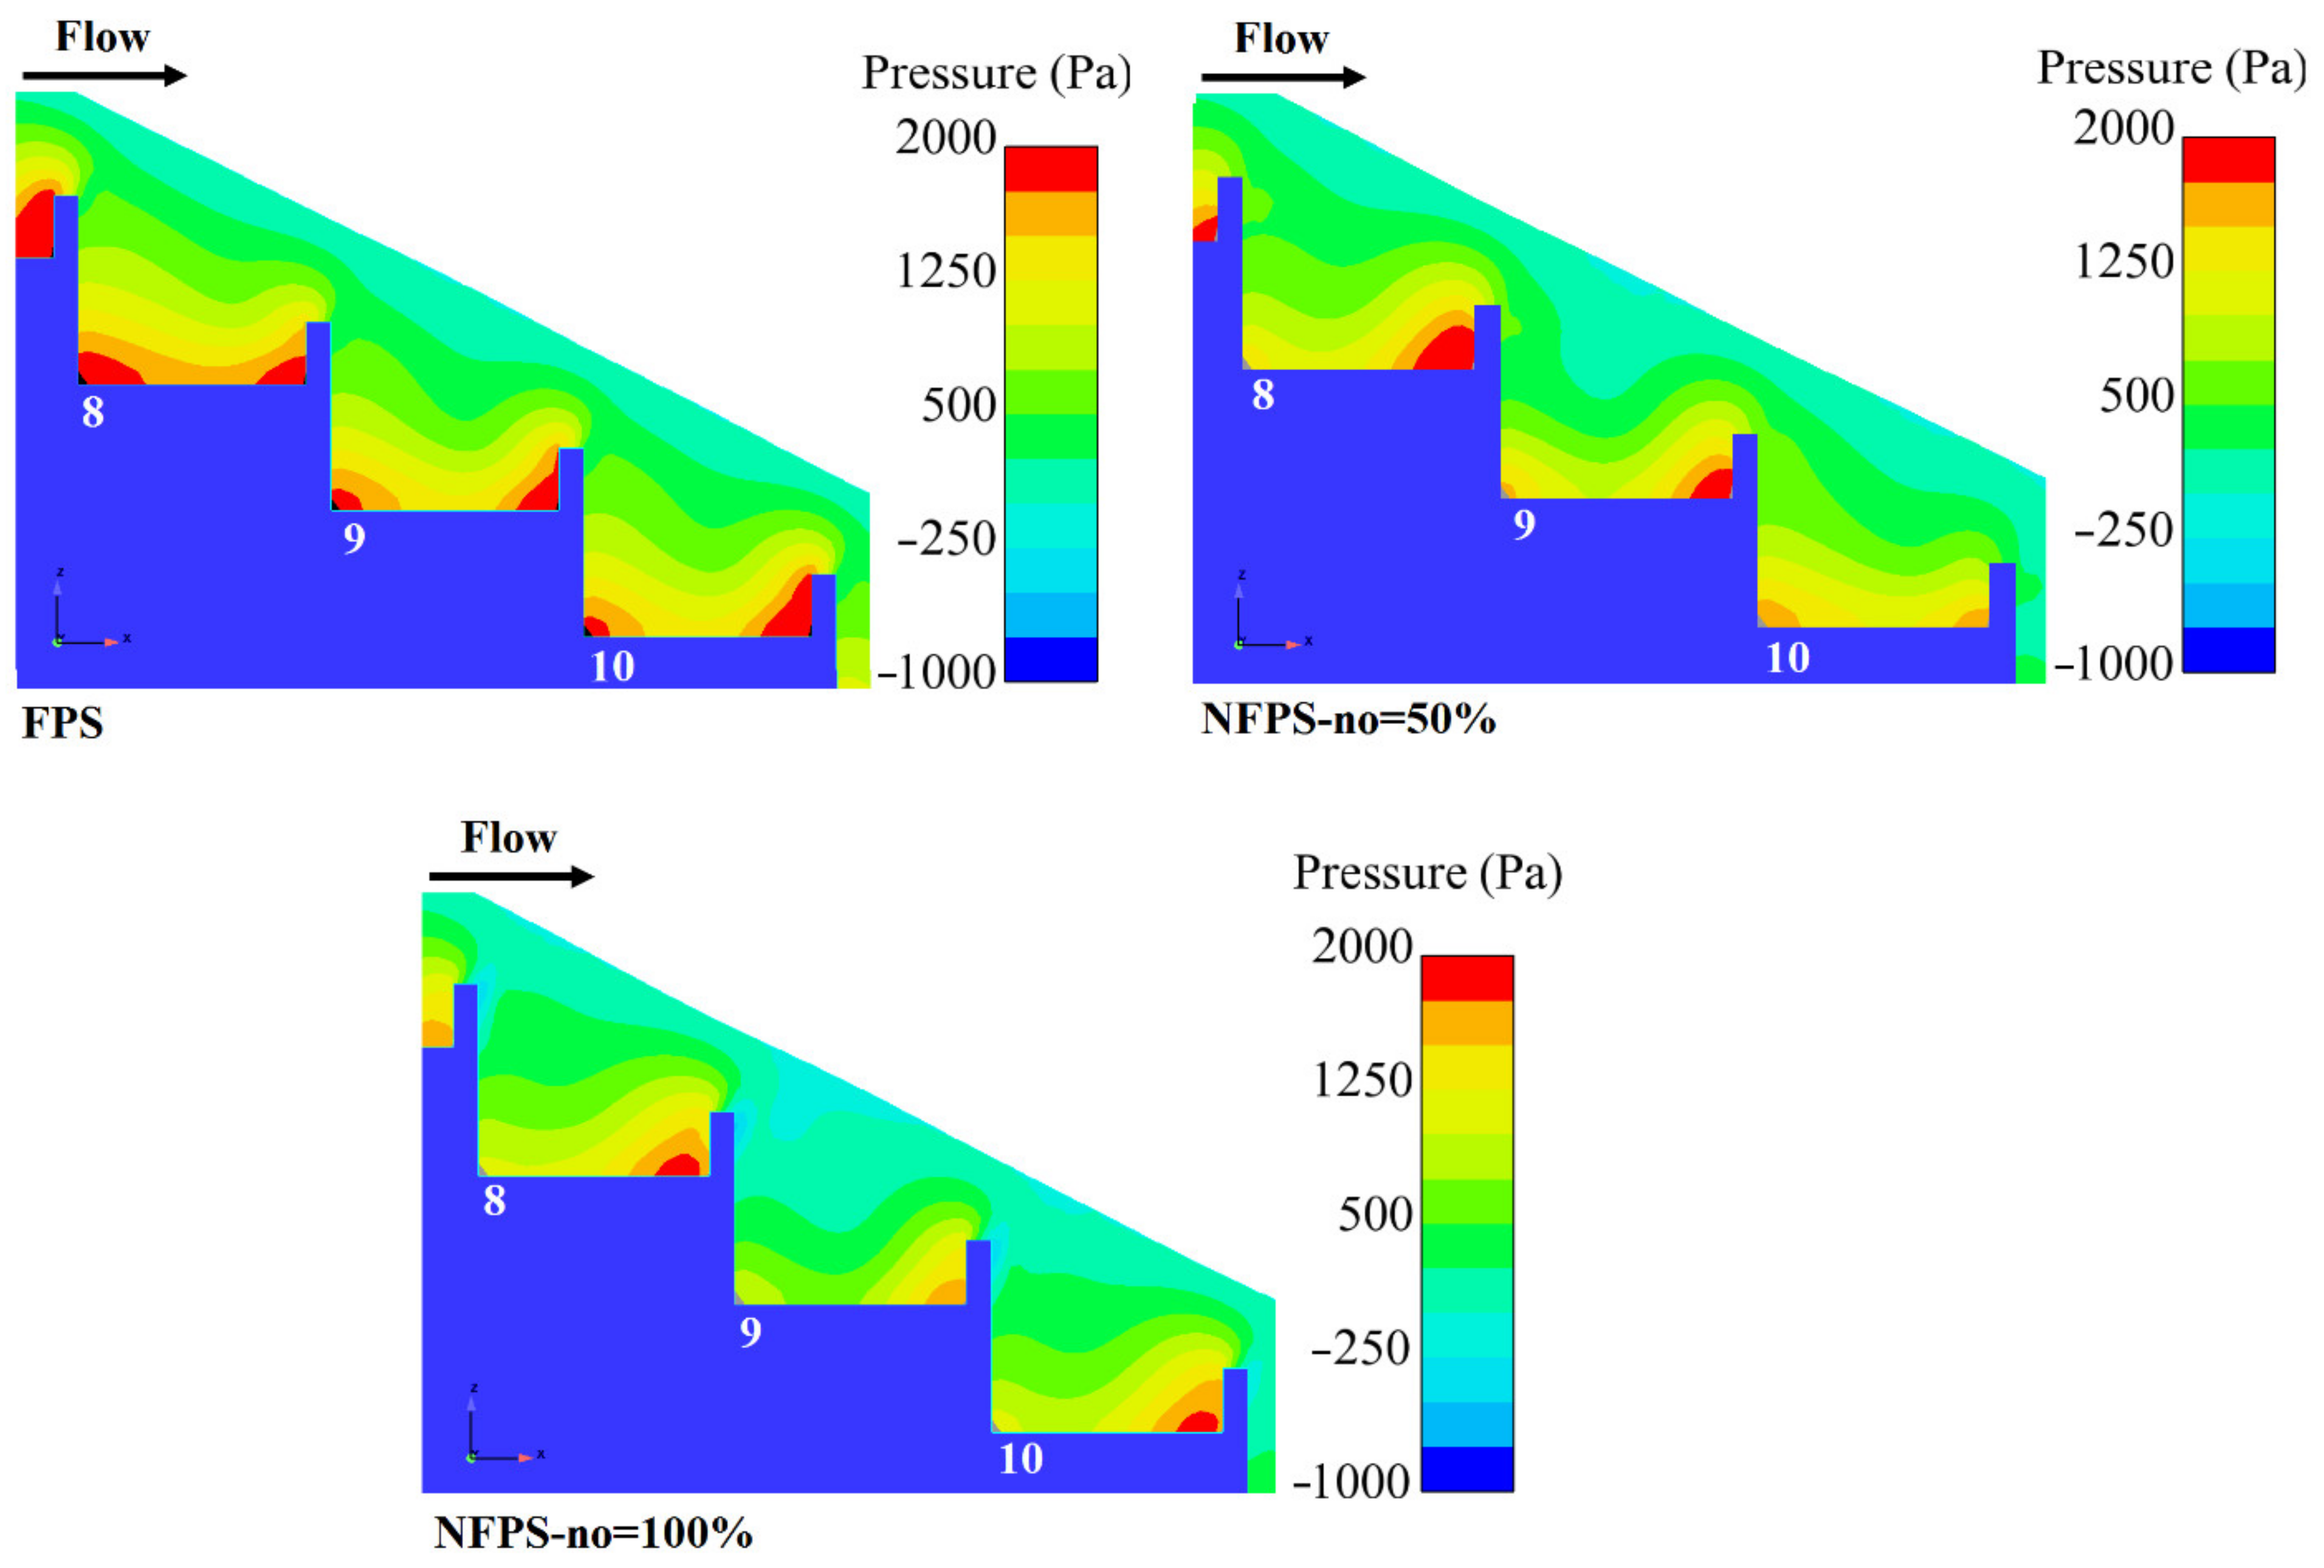
Figure 14 displays pressure contours for different pool step configurations with the same slope and discharge. The pressure value at the beginning of the step in the pooled case is larger than in the flat case, while the maximum pressure is always observed near the step pool at the end of the step. Additionally, on the flat step, the location of maximum pressure moves from a point in the step center towards the end of the step.
Negative pressures can be observed in the flat stepped spillway—the maximum values occurred in the upper part of step wall on the vertical face of the step. For all proposed configurations (pooled and flat), pressure values near the steps were never negative—the cavitation phenomenon is more likely to occur on the vertical face of the step. The pooled steps, having fewer areas with negative pressures, are therefore less subject to cavitation. With regard to the Figure 15, it could be seen that with the notched pool, the maximum pressure values decreased near the step pool.
4.3. Inception Point
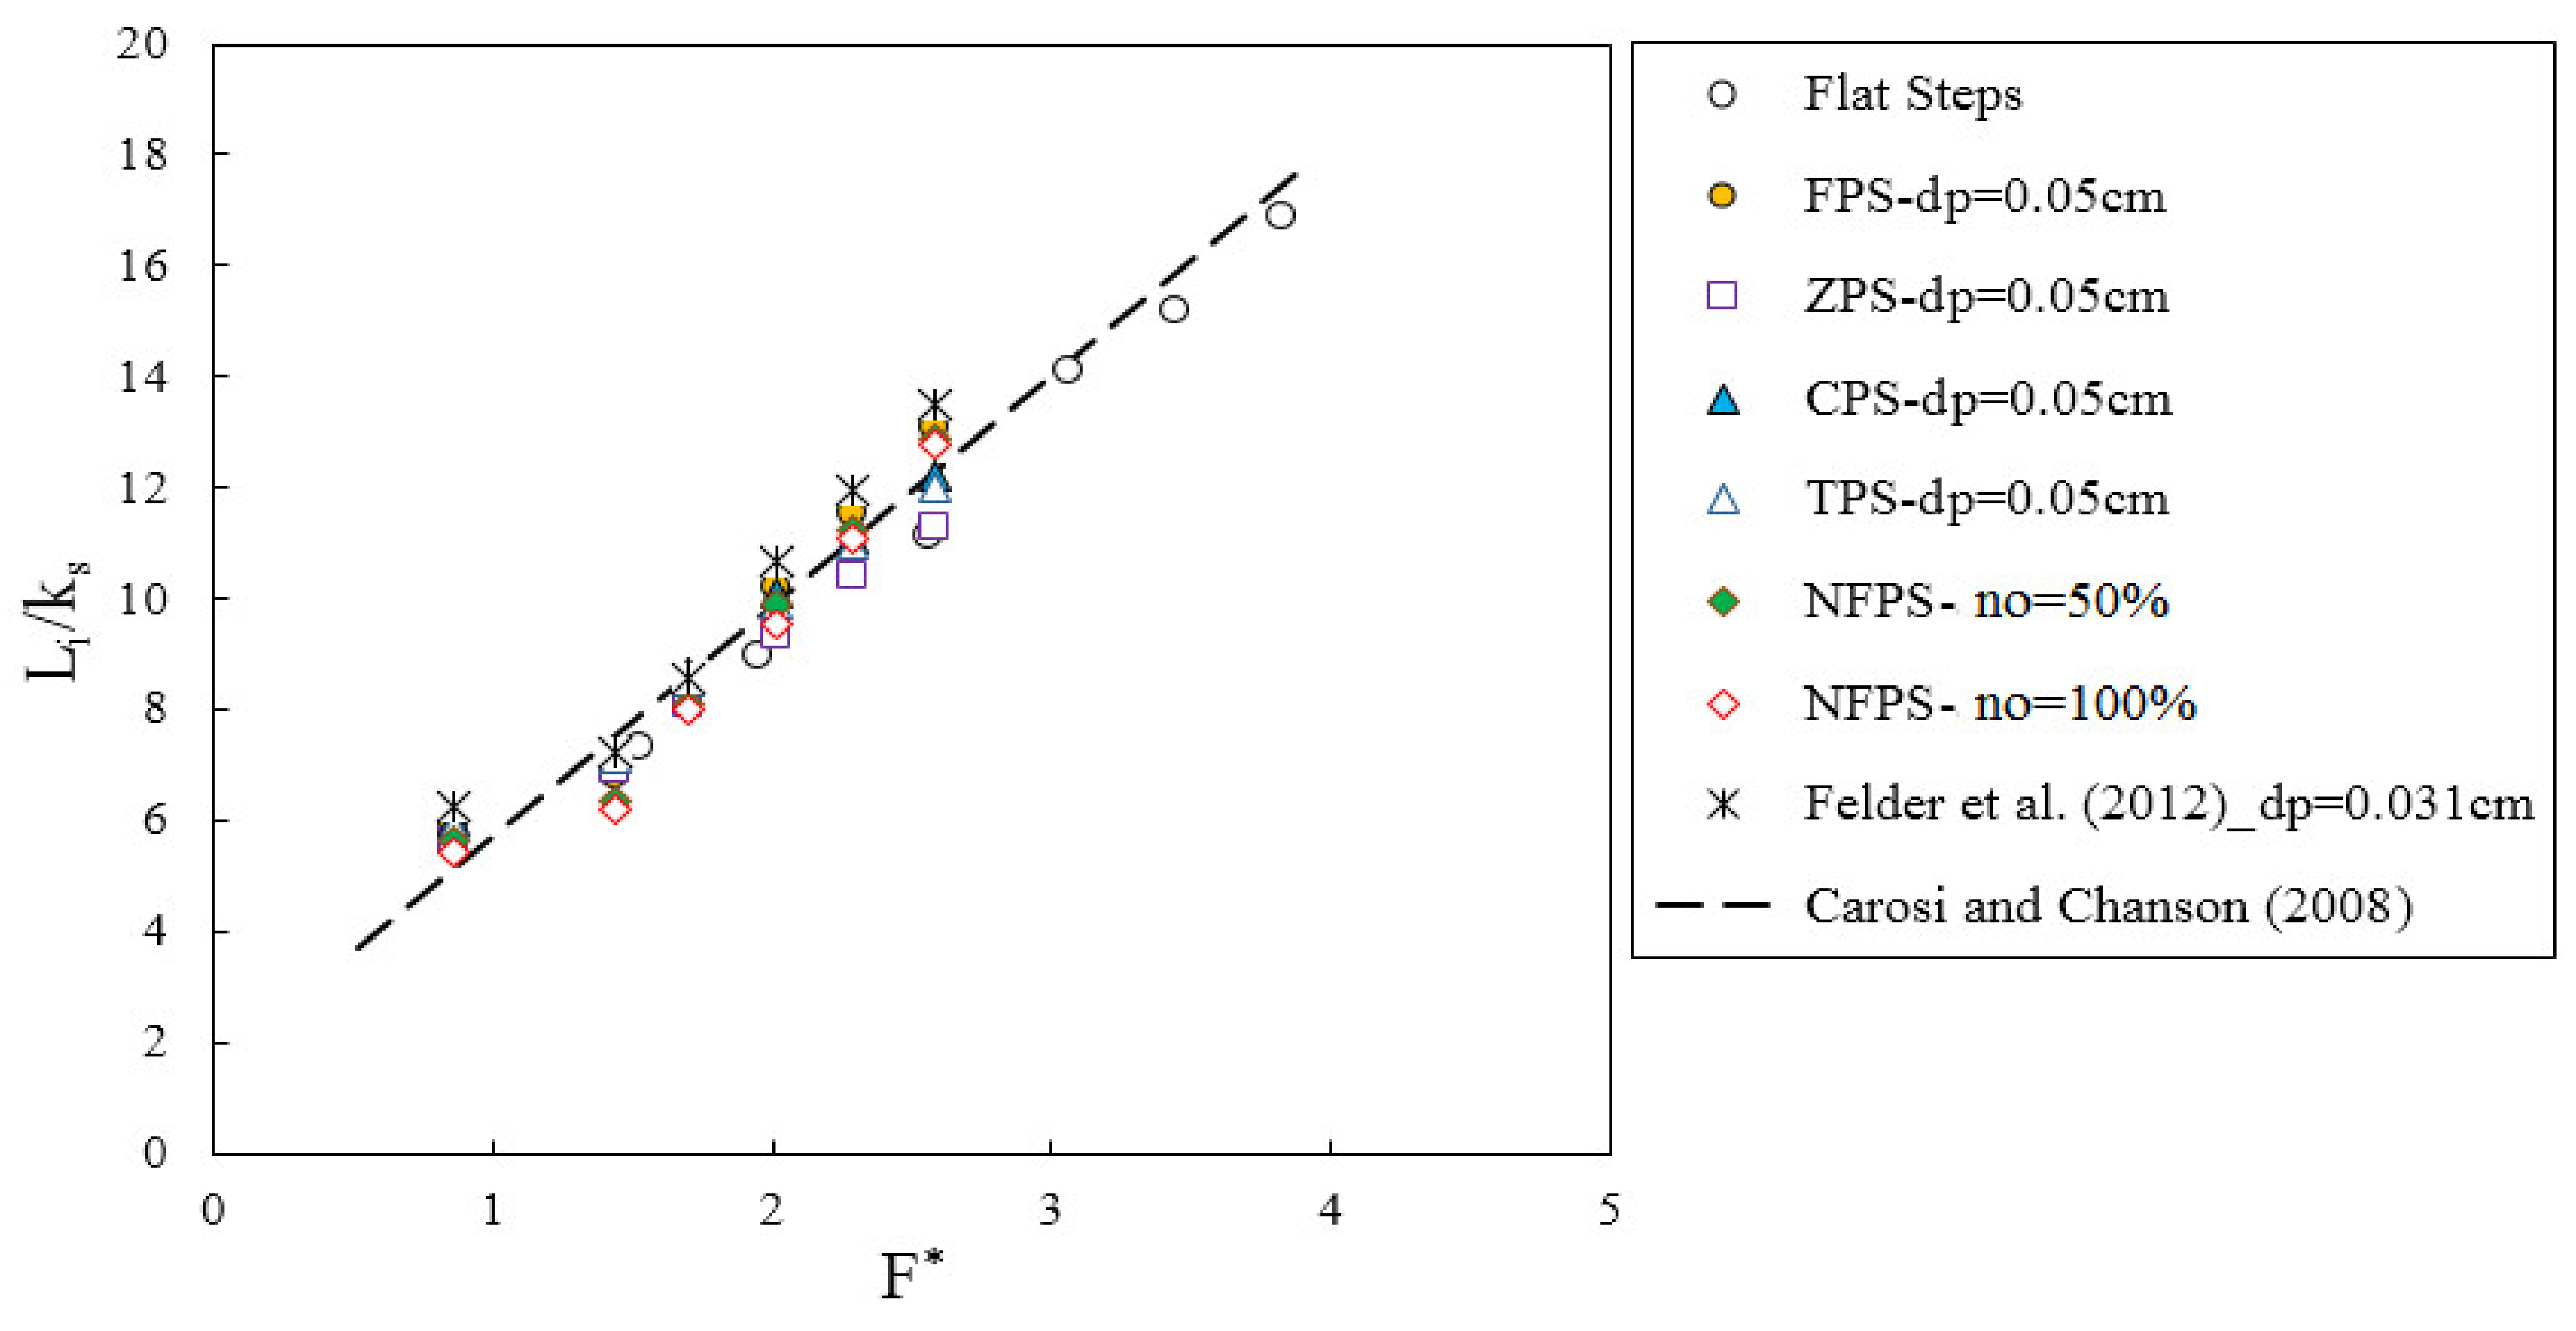
The determination of the inception point is a key aspect for the delineation of aerated and non-aerated regions and for the appropriate design of walls and stilling basins [52]. The locations of the inception points of free-surface aeration were calculated for all configurations and are presented in dimensionless terms as Li/ks as a function of the Froude number F* in Figure 16. Herein, Li is the longitudinal distance from the first step edge to the inception point location and ks = (h + dp) × cosθ (in Flat step, dp = 0) is the roughness height. The Froude number F* is defined in terms of the step roughness:
In Figure 16, the data are compared with experimental data from Felder et al. [18] for a pooled stepped spillway (dp = 0.03 cm) and a simple linear correlation proposed by Carosi and Chanson [53]:
The numerical and experimental data were in good agreement—the inception point of air entrainment, positioned further upstream than for the flat stepped spillway, was always close to empirical correlations. Moreover, pool configuration (height and notch) did not have a significant influence on the location of air entrainment.
4.4. Residual Head and Energy Dissipation
Knowledge of the energy dissipation and residual energy efficiency is fundamental for engineering designs. The rate of energy dissipation and the residual energy were calculated herein at the edge of the last step for all stepped spillway configurations. According to Li and Zhang [54] and Ghaderi et al. [39], the relative energy dissipation (ΔH/Hmax) expresses the percentage of total energy loss along the stepped spillway relative to the upstream total head, Hmax. The total head can be evaluated as:
where Hdam is the height of the dam and yc is the critical flow depth. The total head loss ΔH can be estimated as ΔH = Hmax − Hres, in which the residual head, Hres, is:
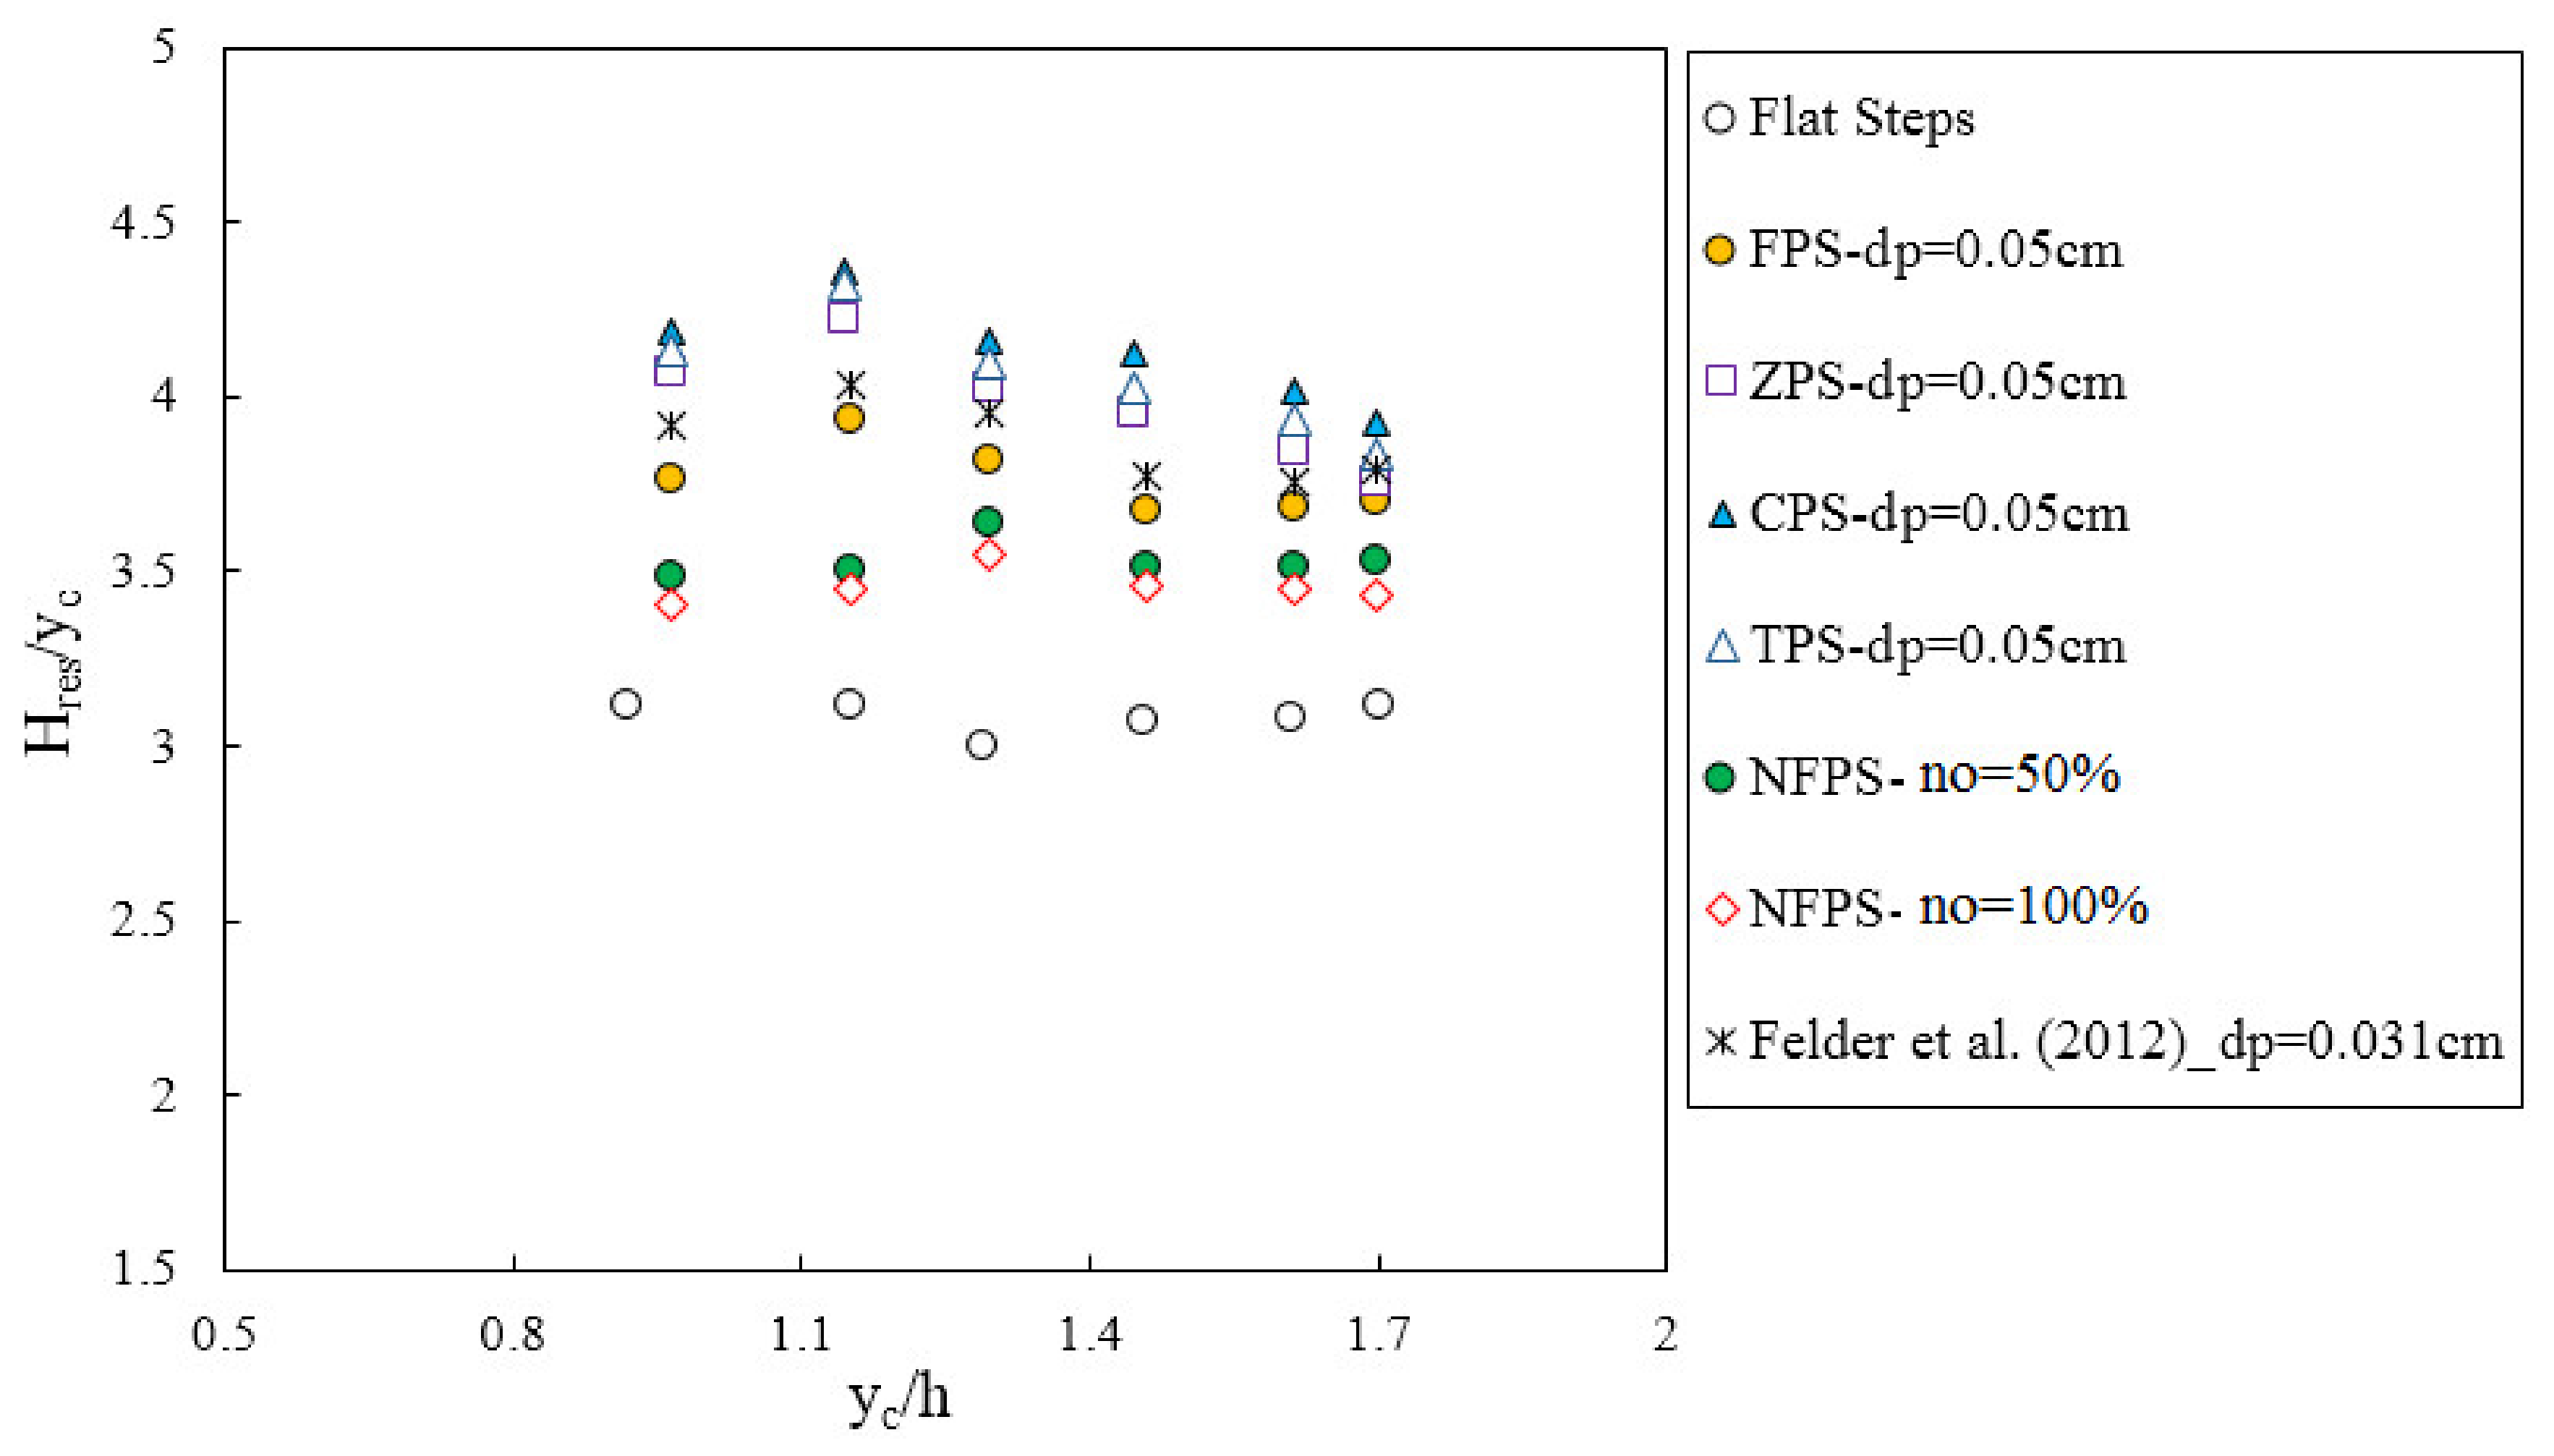
where V = q/y represents the mean flow velocity at the downstream end of the spillway (q is the water discharge per unit width); θ, y, dp, and g are the spillway slope, the water flow depth, the pool height (dp = 0 for a flat step), and the gravitational acceleration, respectively. Note that for notched pooled step configurations, the notch heights were 0.025 and 0.05 pool weir heights were 0.75wp and 0.5wp, respectively. The dimensionless residual head Hres/yc for all discharges is illustrated in Figure 17 as a function of the dimensionless discharge (yc/h).
The residual head in the FPS configuration in the present work showed little difference to that in the study by Felder et al. [18], indicating that the accuracy of the simulation and the difference can be associated with the pool height. In other words, increasing the pool height causes the residual head to decrease. The lowest residual head was achieved with the flat step configuration. For the smaller flow rates, the residual head decreased with increasing discharge for all models, while it was about constant for the largest flow rates. On the flat stepped spillway, the dimensionless residual head was the largest (~3.16), and for the same flow conditions the average dimensionless residual head on the other configurations of the pools was ~3.96. In addition, the residual head for the spillway with ZPS configuration decreased compared with the spillway with CPS and TPS. With the notched pooled step configuration, the mean residual head decreased to 3.49. The rates of the energy dissipation for all stepped spillway configurations are shown in Figure 18.
For all step configurations, a decreasing rate of energy dissipation with increasing discharge was observed. It can be seen that the flat step configuration showed the best energy dissipation performance as compared with other configurations. By comparing different pooled step configurations, it can be observed that the FSP configuration had a higher rate of energy dissipation than ZPS, CPS, and TPS. With the notched pooled step configuration, the performance of this structure improved. Notched fully pooled step (NFSP) with no = 100% showed the best performance of the pool configurations and the mean percentage of efficiency improvements was 5.8%. This was because more turbulence and flow interference occurred in NFSP caused by the notches in the pool, leading to greater momentum exchange between the overlaying flow and the vortex flow.
4.5. Turbulent Kinetic Energy (TKE)
The turbulent kinetic energy (TKE) is a function of the average velocity values in the three directions (x, y, z) and is an important index reflecting the energy loss between two sections of the flow. TKE is characterized by measuring the root mean square of velocity fluctuations [55]. Considering the continuous values of velocities in the flow direction (u1, u2, u3, …, un), the value of the root mean square velocity, urms, was obtained as:
Then, the TKE was calculated as:
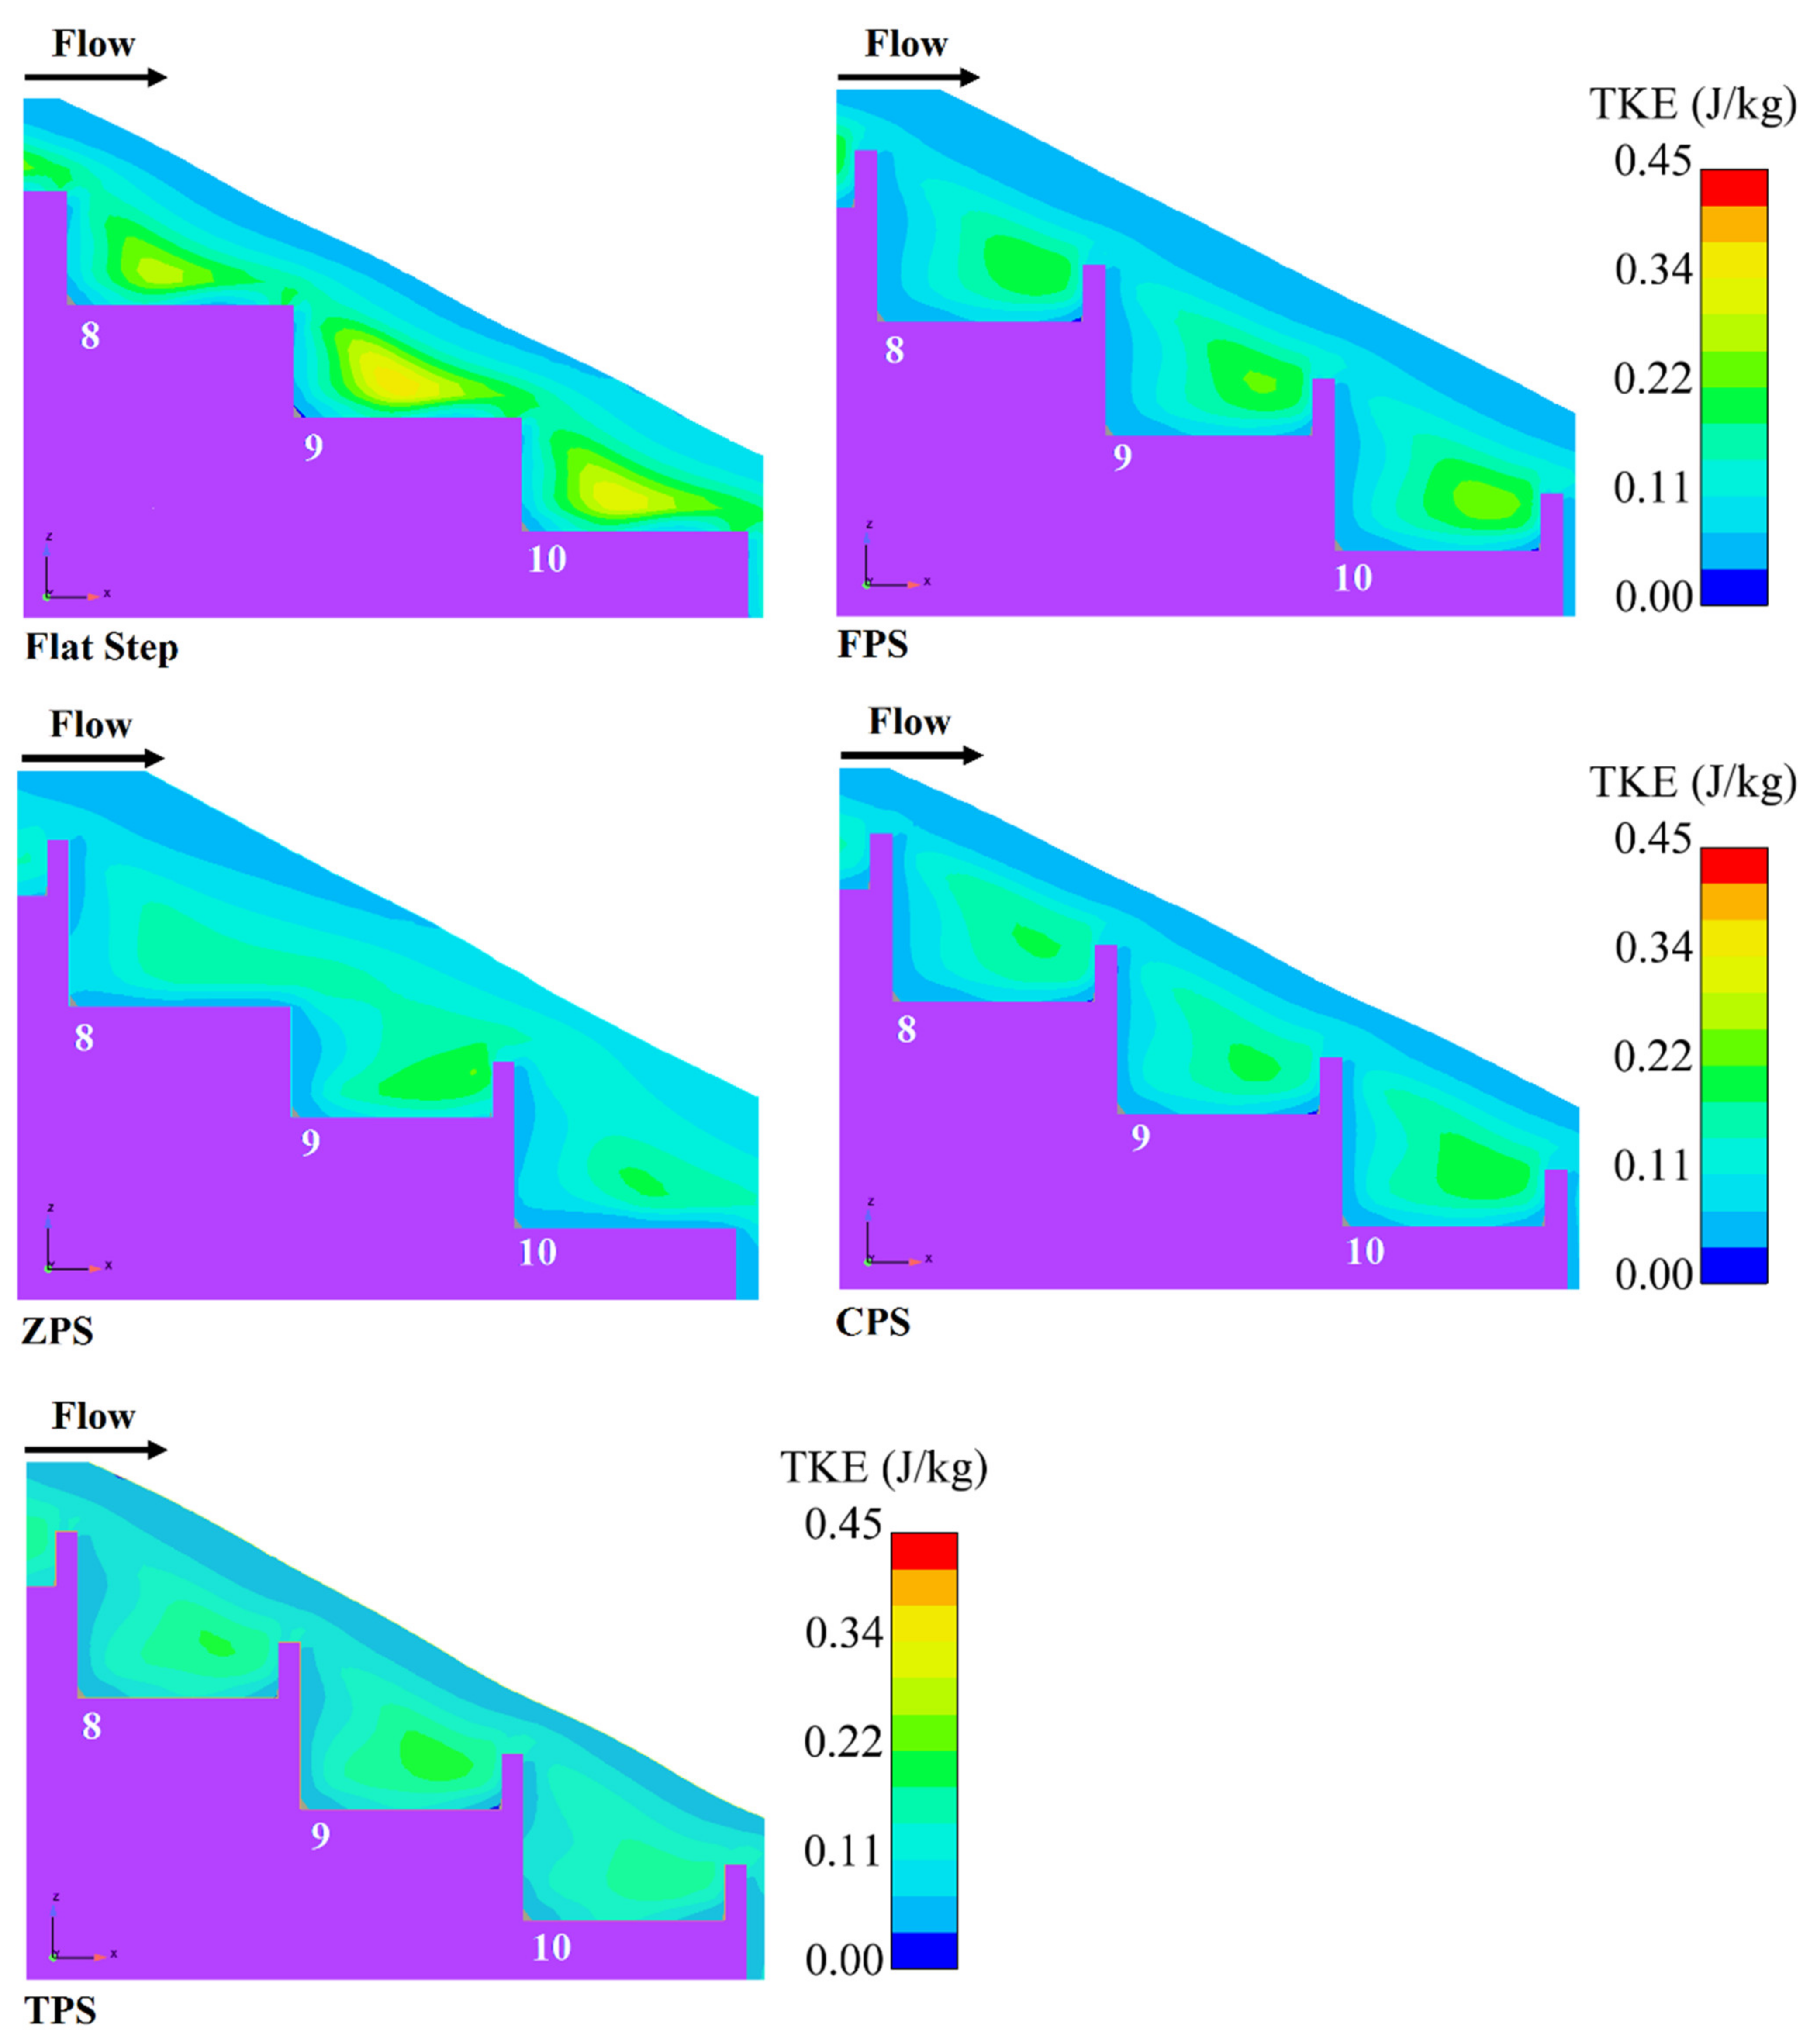
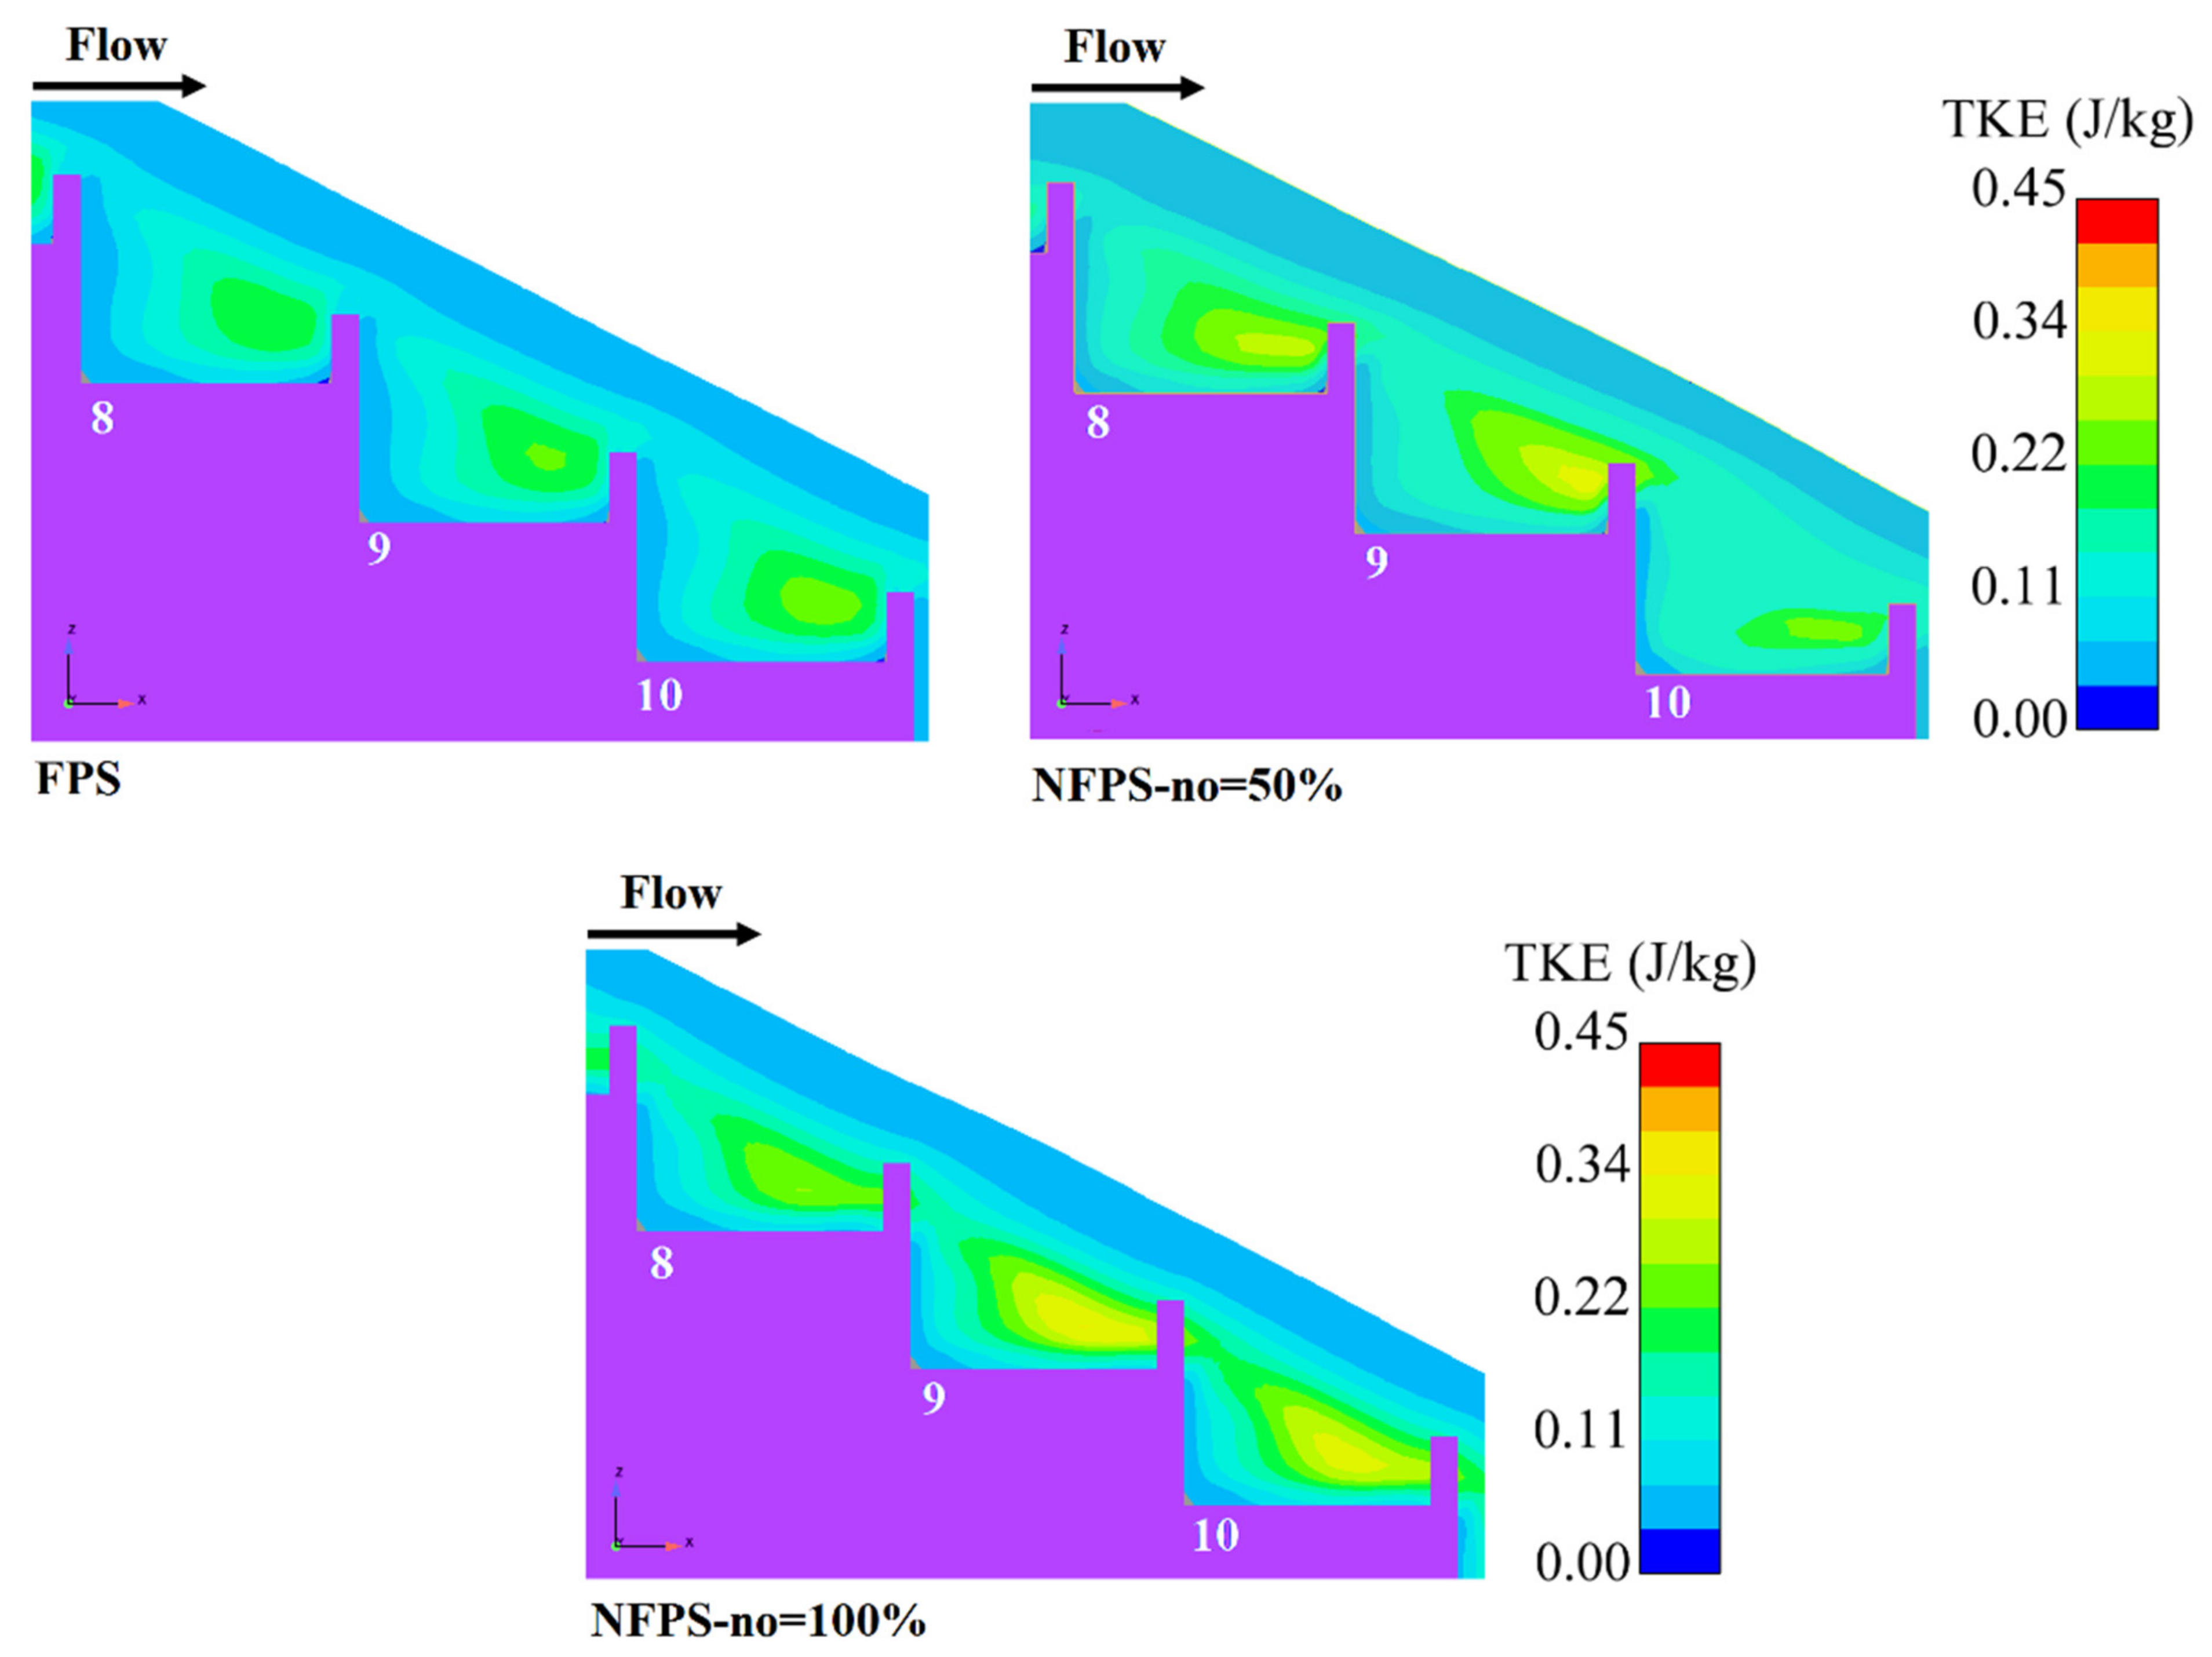
Turbulent kinetic energy (TKE) is formed in the spillways due to the high gradient of velocity [56]. Taking into consideration the fact that the change process of the TKE was the same for all discharges, only the results related to discharge 0.090 m3/s are shown in Figure 19. It could be seen in this figure that the maximum TKE was created on flat steps rather than the different pooled step configurations. In contrast to the flat configurations, the maximum turbulent kinetic energy occurred in the middle of the horizontal step surface, while the maximum turbulent kinetic energy occurred near the step pool. The value of the TKE also increased along the spillway, which was similar to the results of previous studies, such as that by Bombardelli et al. [56]. The region of turbulence on the FPS was greater in intensity than for other types of pooled steps. With regard to Figure 20, it can be seen that with notched pools, the maximum TKE values increased near the step pool.
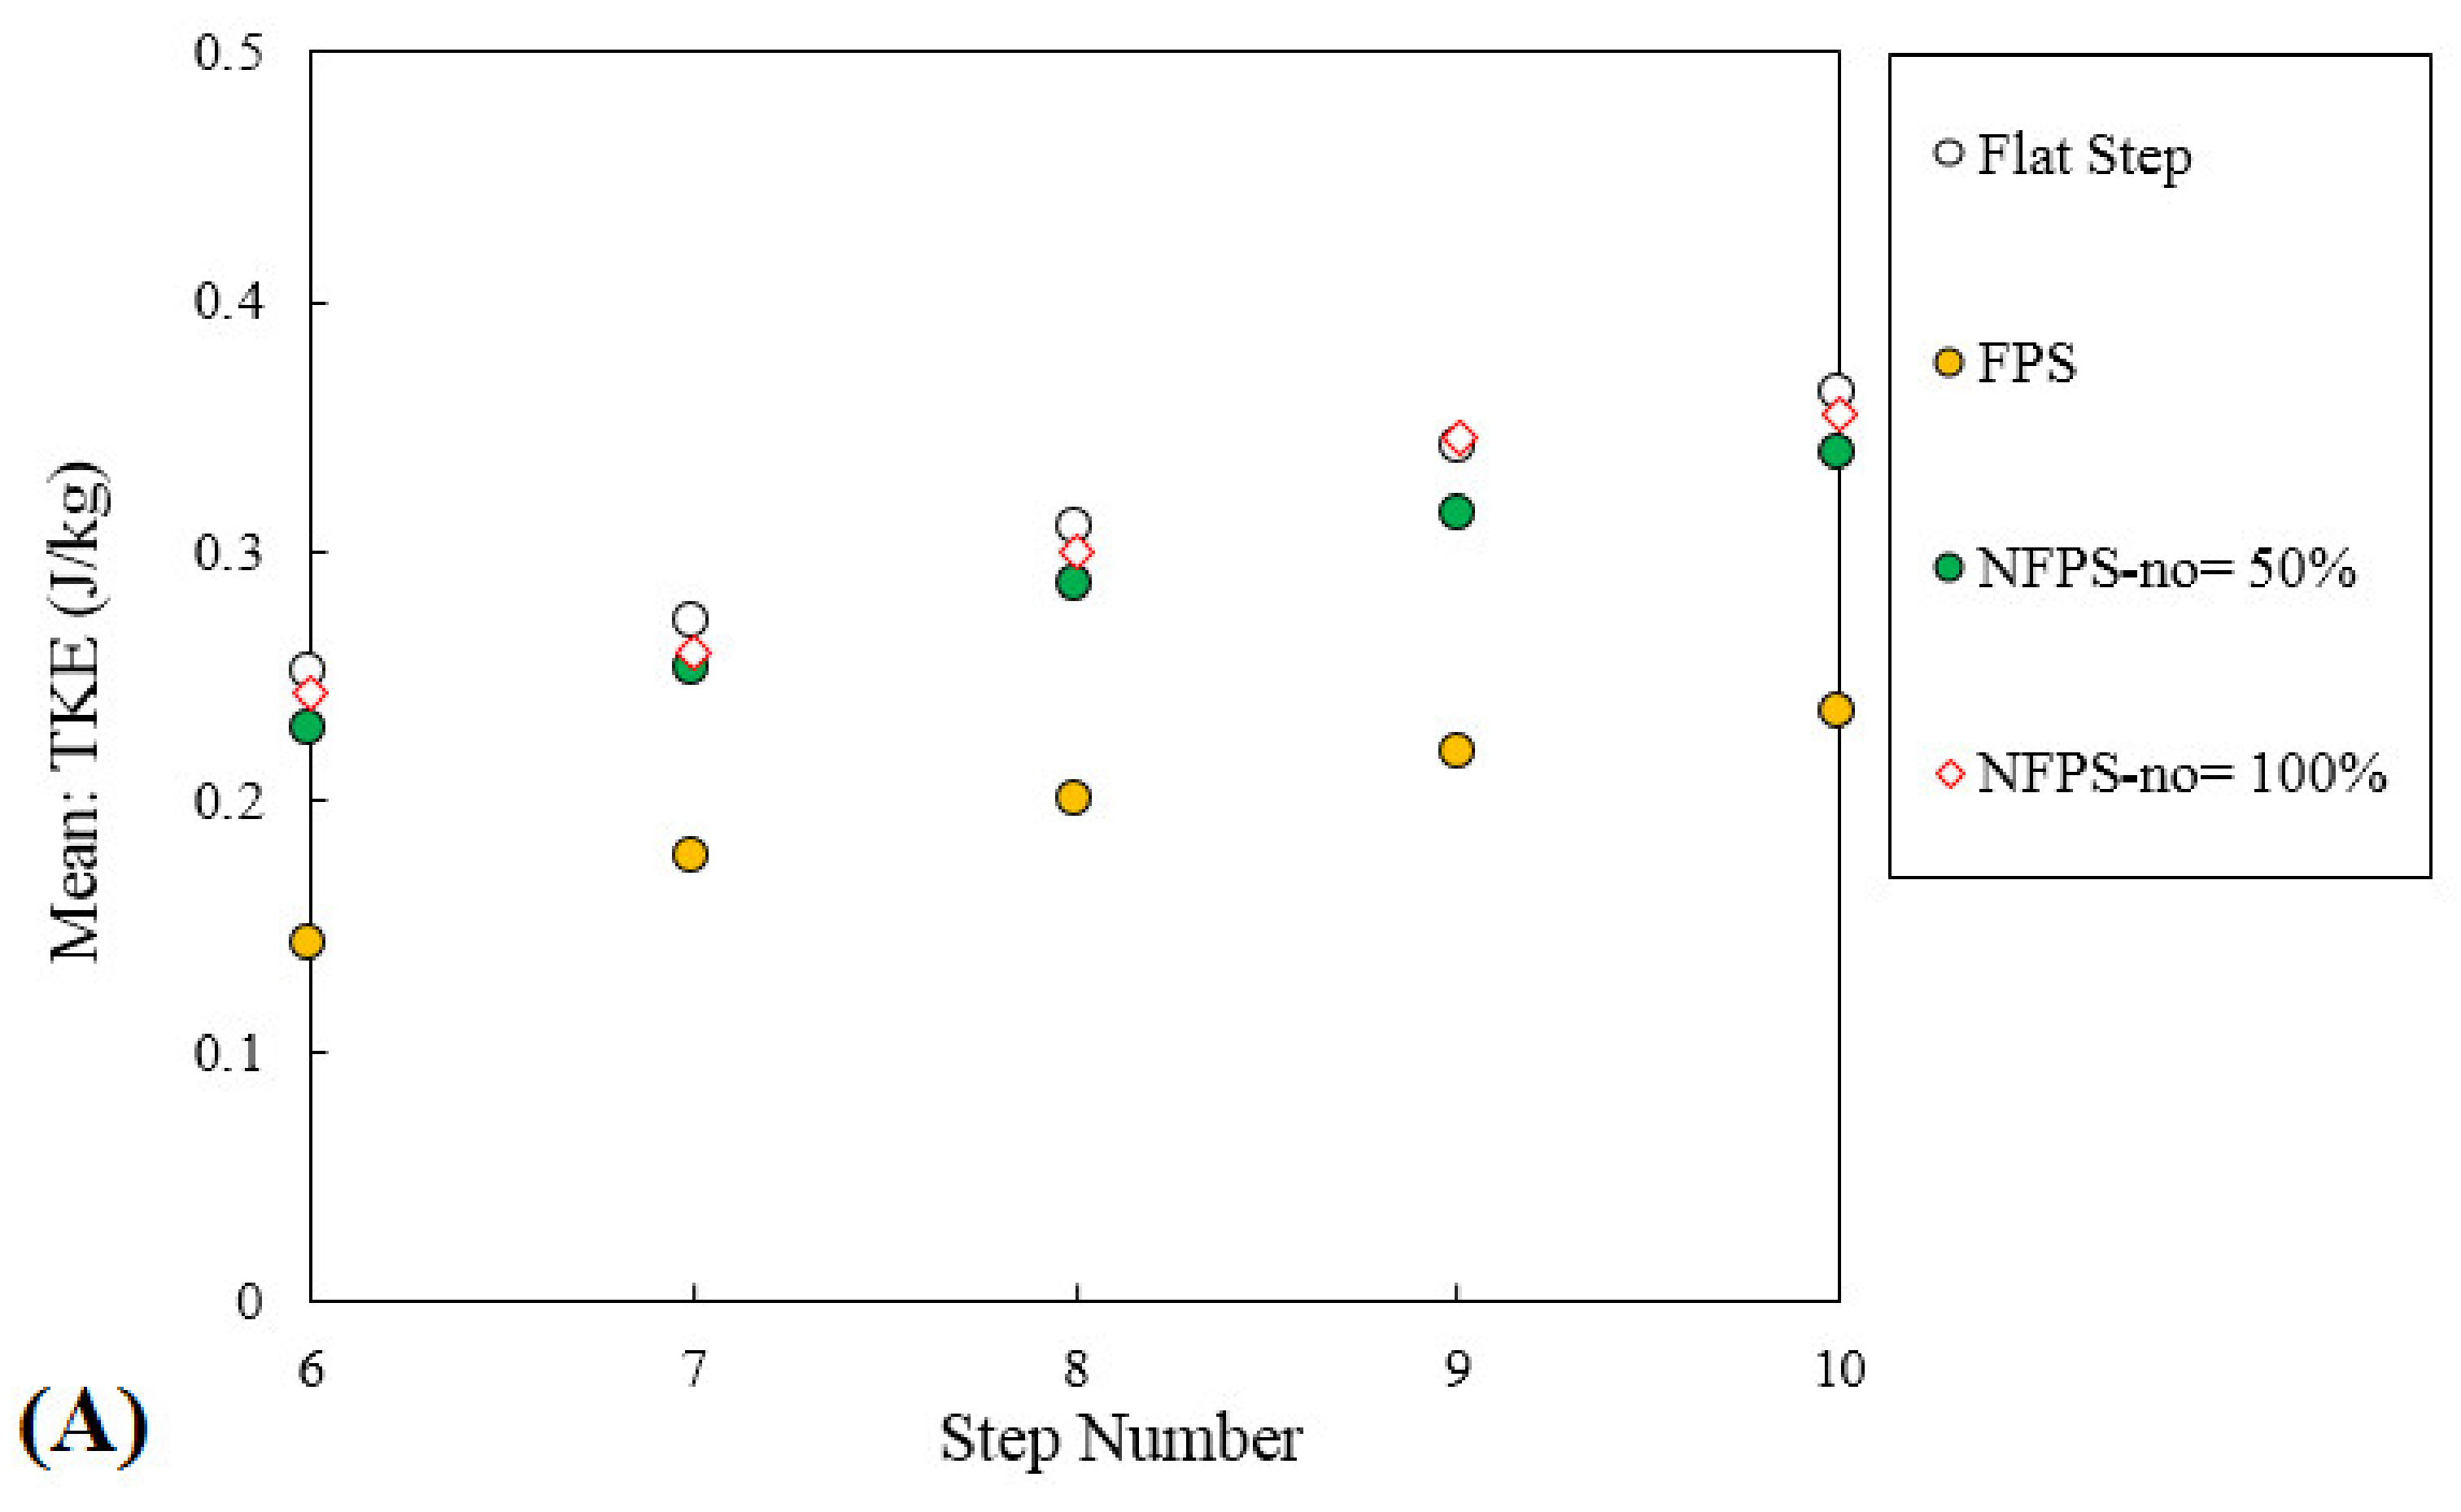
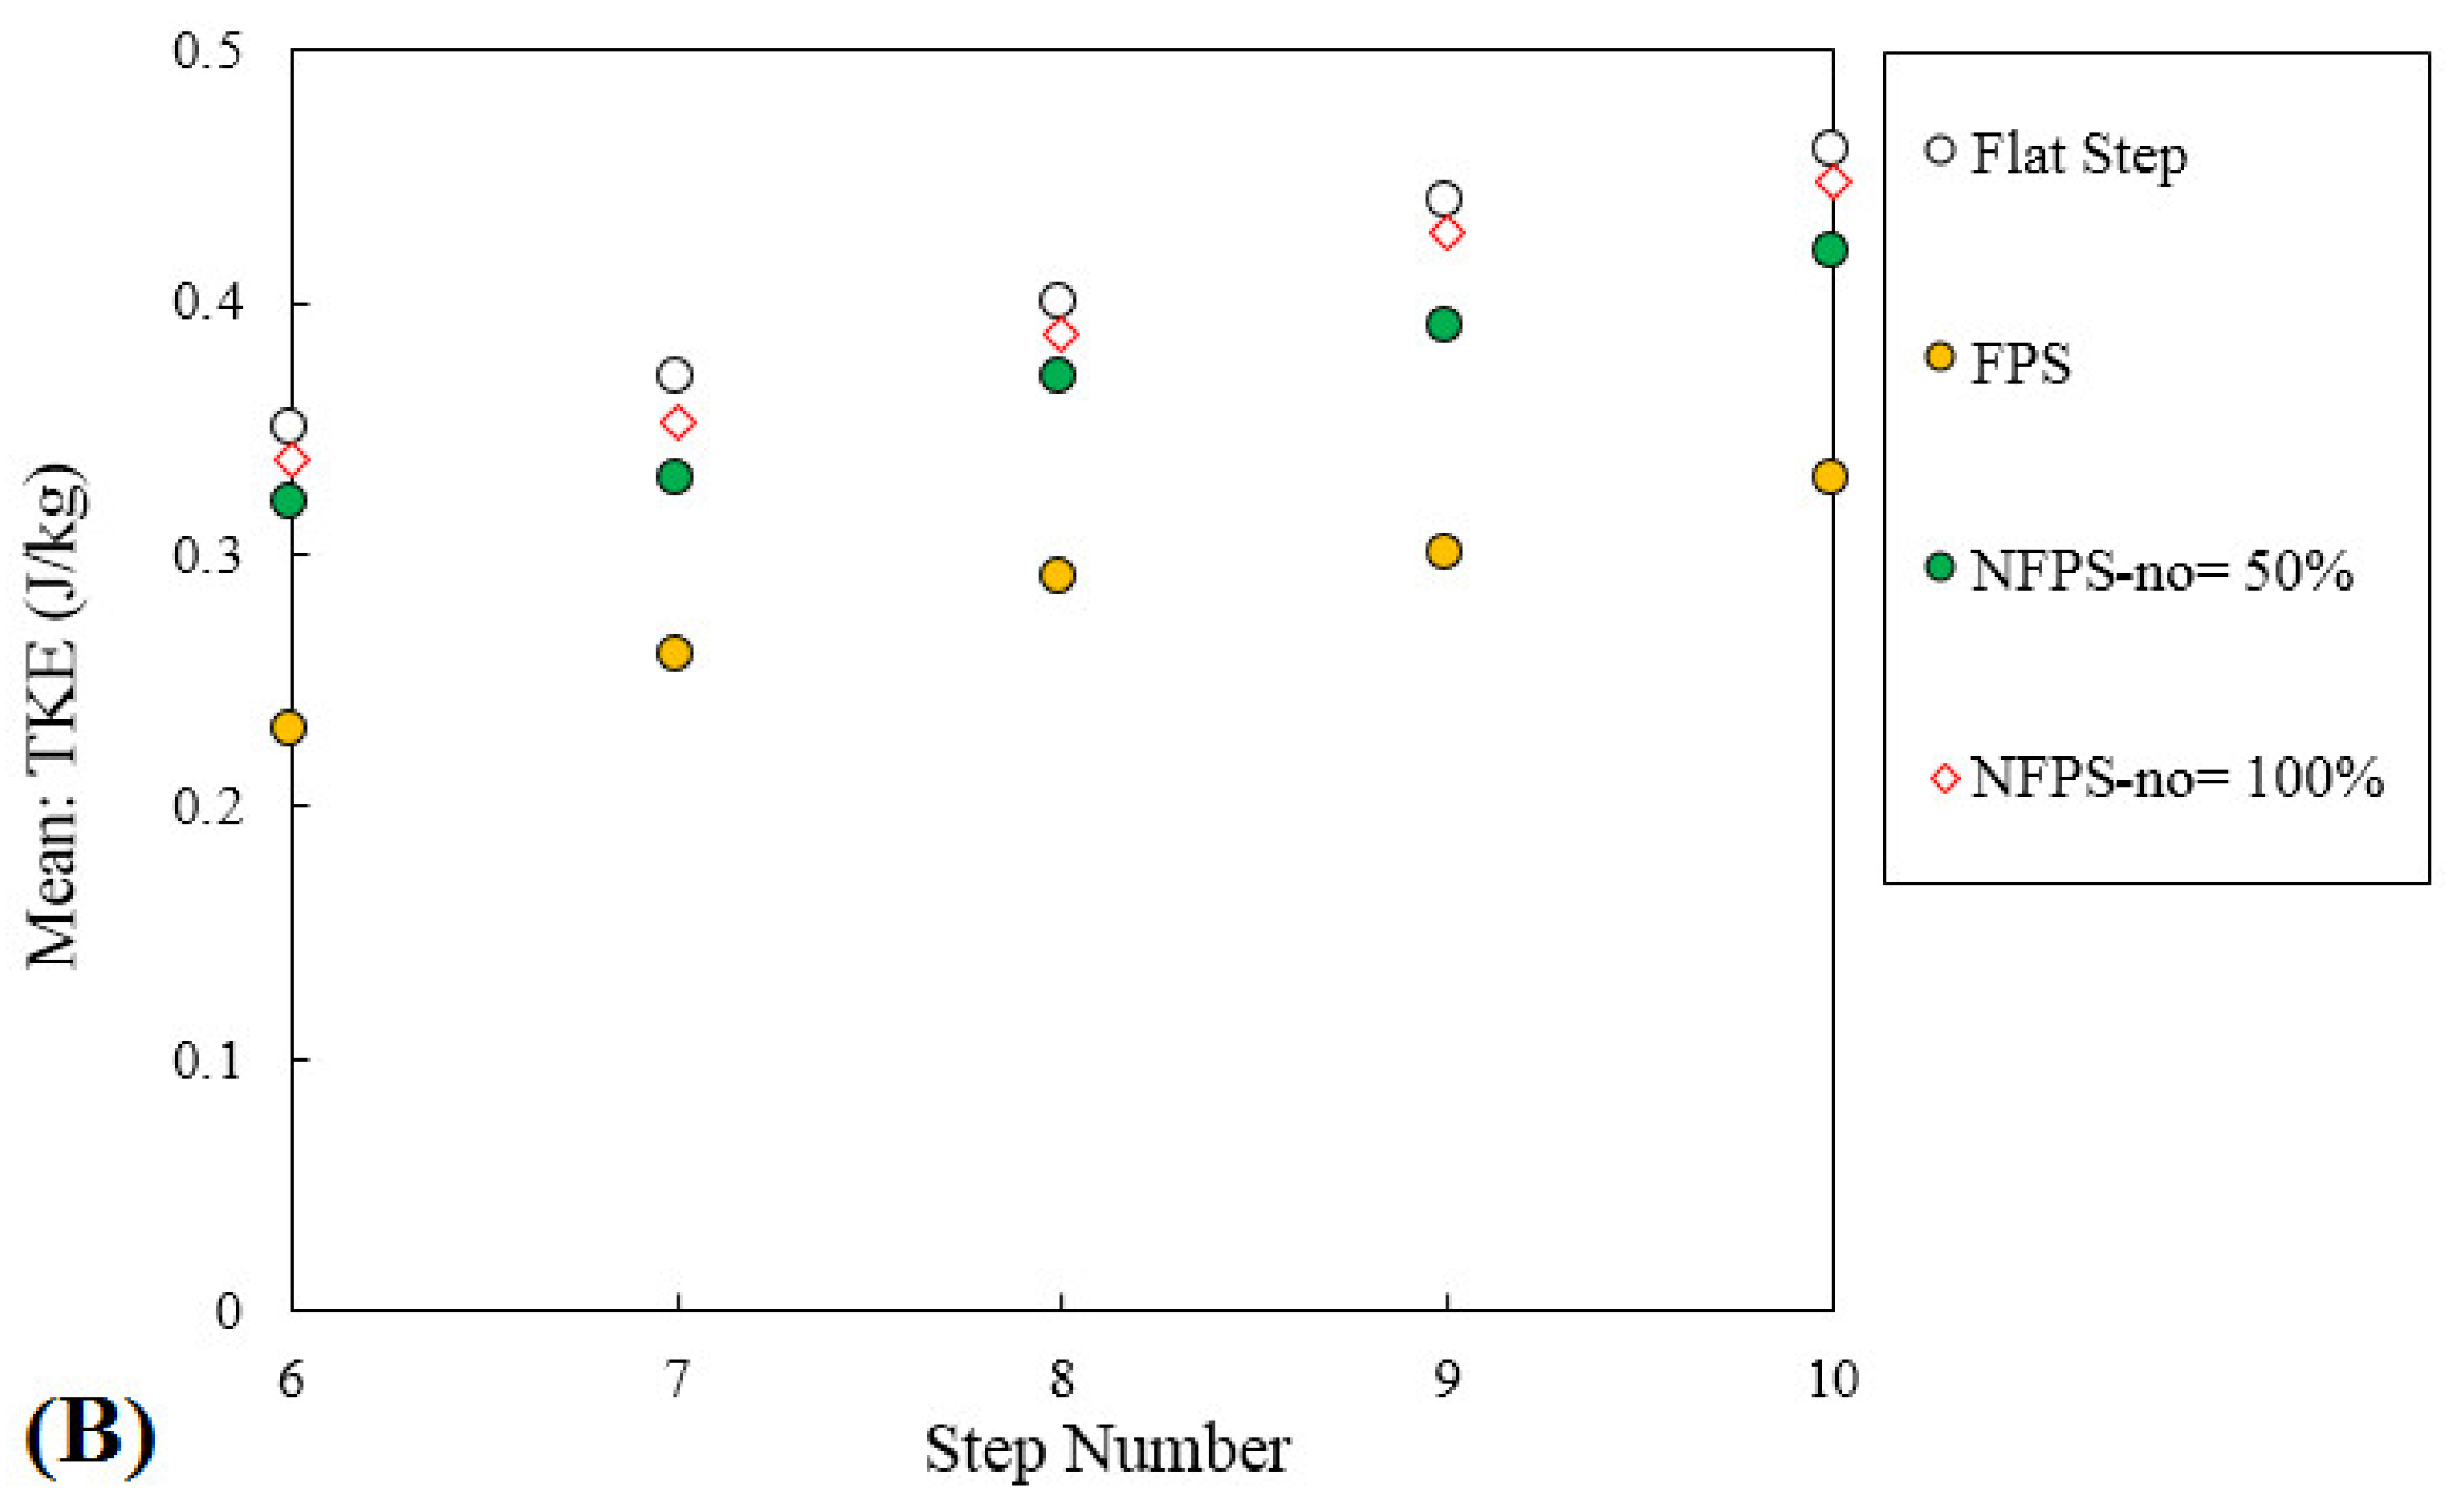
Figure 21 illustrates the mean TKE values for pooled steps with two different configurations (simple and notched) and discharges. The results show that the maximum TKE values were created for the flat stepped spillway and the stepped spillway with pooled steps, with no = 100% for the two selected discharges. Moreover, as the notch height of the pooled steps increased, the TKE values also increased. It can also be seen that as the discharge increased, the TKE values increased for all models.
From the presented results, some clear conclusions can be drawn:
- The free water surface was horizontal on flat and FSP steps, however on ZPS, CPS, and TPS configurations, certain instabilities were caused by the staggered nature of the configurations. With the notch of the pooled steps, the aggregation of the streamlines decreased due to the passage of some vortexes of the notch;
- The interfacial velocities of flat stepped spillways were smaller than for pooled step configurations. The velocities of the pooled stepped were almost identical distributions for (y + dp)/yc > 0.6. However, the interfacial velocities on FPS steps were lower than for other configurations;
- The maximum velocity magnitude was observed in the overlaying flow over the pooled steps, while the minimum velocity value occurred in the bottom, but no changes were evident with different notched pooled steps;
- The pressure value at the beginning of the steps for the pooled configurations was larger than for the flat configuration and the maximum pressure was observed always near the step pool at the end of the step. Along the vertical step surface, negative pressures were observed for the flat stepped spillway. For all the proposed configurations (pooled and flat), pressure values along the horizontal step surfaces were never negative;
- The pool configuration (simple or notched) did not have a significant influence on the location of air entrainment;
- The lowest residual head was achieved with the flat step configuration. On the flat stepped spillway, the dimensionless residual head was the largest (~3.16), while for the same flow conditions the average dimensionless residual head on the other configurations of the pools was ~3.96. With the notched pooled steps, the mean residual head decreased to 3.49;
- The flat step configuration showed the best energy dissipation performance as compared with other configurations. Additionally, the FSP had a higher rate of energy dissipation than ZPS, CPS, or TPS. With the notched pooled steps, the performance of this structure improved;
- The maximum TKE was created on the flat steps as compared to different pooled step configurations. The region of turbulence on the FPS was greater in intensity than for other types of pooled steps. With the notched pool configuration, the maximum TKE values increased near the step pool.
5. Conclusions
In the present study, four types of pool configurations (simple and notch pooled stepped configurations) were numerically investigated using the FLOW-3D model. To simulate the free surface, the volume of fluid (VOF) method was adopted and the turbulence RNG k-ε model was used. The numerical results agreed well with the literature data and were fairly consistent with the experimental model.
This work shows that it is feasible to improve the hydraulic behaviors of a stepped spillway using notch pool configurations. In fact, the notch pools overcome the flow stability and energy dissipation issues; for example, compared with the simple pooled stepped spillway, they enhance the energy dissipation by about 5.8%.
Meanwhile, the risk of cavitation is mitigated. The lowest pressures on step surfaces, both horizontal and vertical, were improved compared with flat step and simple pooled configurations.
Moreover, with notched pool configurations, the maximum TKE values were greater than simple pooled step configurations and somewhat close to flat stepped spillways, which showed the best energy dissipation performance.
Although more research is necessary on the topic, the present work shows the modified notched step configuration as the best choice for pooled stepped designs.
Author Contributions
Conceptualization, A.G., S.A., and S.D.F.; methodology, A.G.; software, A.G.; validation, A.G., S.A., and S.D.F.; investigation, A.G., S.A., and S.D.F.; data curation, A.G.; writing—original draft preparation, A.G., S.A., and S.D.F.; writing—review and editing, A.G., S.A., and S.D.F.; supervision, A.G.; project administration, A.G. All authors have read and agreed to the published version of the manuscript.
Funding
This research received no external funding.
Institutional Review Board Statement
Not applicable.
Informed Consent Statement
Not applicable.
Data Availability Statement
Data is contained within the article.
Conflicts of Interest
The authors declare no conflict of interest.
References
- Chanson, H. Hydraulic Design of Stepped Cascades, Channels, Weirs and Spillways; Pergamon: Oxford, UK, 1995; p. 292. [Google Scholar]
- Chanson, H. The Hydraulics of Stepped Chutes and Spillways; Balkema: Lisse, The Netherlands, 2001; p. 384. [Google Scholar]
- Chanson, H.; Toombes, L. Air-Water Flows down Stepped chutes: Turbulence and Flow Structure Observations. Int. J. Multiph. Flow 2002, 27, 1737–1761. [Google Scholar] [CrossRef] [Green Version]
- Gonzalez, C.; Chanson, H. Hydraulic design of stepped spillways and downstream energy dissipators for embankment dams. Dam Eng. 2007, 17, 223–244. [Google Scholar]
- Felder, S.; Chanson, H. Energy dissipation, flow resistance and gas-liquid interfacial area in skimming flows on moderate slope stepped spillways. Env. Fluid Mech. 2009, 9, 427–441. [Google Scholar] [CrossRef]
- Boes, R.M.; Hager, W.H. Hydraulic Design of Stepped Spillways. J. Hydraul. Eng. 2003, 129, 671–679. [Google Scholar] [CrossRef] [Green Version]
- Rajaratnam, N. Skimming flow in stepped spillways. J. Hydraul. Eng. 1990, 116, 587–591. [Google Scholar] [CrossRef]
- Peyras, L.; Royet, P.; Degoutte, G. Flow and Energy Dissipation over Stepped Gabion Weirs. J. Hydraul. Eng. 1992, 118, 707–717. [Google Scholar] [CrossRef]
- Chanson, H. Hydraulics of skimming flows over stepped channels and spillways. J. Hydraul. Res. 1994, 32, 445–460. [Google Scholar] [CrossRef] [Green Version]
- Robinson, K.M.; Rice, C.E.; Kadavy, K.C.; Talbot, J.R. Energy losses on a roller compacted concrete stepped spillway. Water Resour. Eng. 1998, 98, 1434–1439. [Google Scholar]
- Meireles, I.; Matos, J. Skimming Flow in the Nonaerated Region of Stepped Spillways over Embankment Dams. J. Hydraul. Res. 2009, 135, 685–689. [Google Scholar] [CrossRef]
- Wüthrich, D.; Chanson, H. Hydraulics, air entrainment, and energy dissipation on a Gabion stepped weir. J. Hydraul. Eng. 2014, 140, 04014046. [Google Scholar] [CrossRef]
- Bai, Z.L.; Zhang, J.M. Comparison of Different Turbulence Models for Numerical Simulation of Pressure Distribution in V-Shaped Stepped Spillway. Math. Probl. Eng. 2017, 3537026. [Google Scholar] [CrossRef] [Green Version]
- Wan, W.; Raza, A.; Chen, X. Effect of Height and Geometry of Stepped Spillway on Inception Point Location. Appl. Sci. 2019, 9, 2091. [Google Scholar] [CrossRef] [Green Version]
- Chinnarasri, C.; Wongwises, S. Flow patterns and energy dissipation over various stepped chutes. J. Irrig. Drain. Eng. 2006, 132, 70–76. [Google Scholar] [CrossRef]
- Felder, S. Air-Water Flow Properties on Stepped Spillways for Embankment Dams: Aeration, Energy Dissipation and Turbulence on Uniform, Non-Uniform and Pooled Stepped Chutes. Ph.D. Thesis, School of Civil Engineering, University of Queensland, Brisbane, Australia, 2013. [Google Scholar]
- Peng, Y.; Zhang, X.; Yuan, H.; Li, X.; Xie, C.; Yang, S.; Bai, Z. Energy Dissipation in Stepped Spillways with Different Horizontal Face Angles. Energies 2019, 12, 4469. [Google Scholar] [CrossRef] [Green Version]
- Felder, S.; Guenther, P.; Chanson, H. Air-Water Flow Properties and Energy Dissipation on Stepped Spillways: A Physical Study of Several Pooled Stepped Configurations; Hydraulic Model Report No. CH87/12; School of Civil Engineering, The University of Queensland: Brisbane, Australia, 2012. [Google Scholar]
- Sholichin, M.; Dermawan, V.; Krisnayanti, D. Energy dissipation of skimming flow on flat and pooled stepped spillways. Australian. J. Basic Appl. Sci. 2016, 10, 62–68. [Google Scholar]
- Felder, S.; Chanson, H. Simple design criterion for residual energy on embankment dam stepped spillways. J. Hydraul. Eng. 2016, 142, 04015062. [Google Scholar] [CrossRef] [Green Version]
- Felder, S.; Chanson, H. Aeration, flow instabilities, and residual energy on pooled stepped spillways of embankment dams. J. Irrig. Drain. Eng. 2013, 139, 880–887. [Google Scholar] [CrossRef] [Green Version]
- Felder, S.; Chanson, H. Effects of step pool porosity upon flow aeration and energy dissipation on pooled stepped spillways. J. Hydraul. Eng. 2014, 140, 04014002. [Google Scholar] [CrossRef] [Green Version]
- Tabbara, M.; Chatila, J.; Awwad, R. Computational simulation of flow over stepped spillways. Comput. Struct. 2005, 83, 2215–2224. [Google Scholar] [CrossRef]
- Morovati, K.; Eghbalzadeh, A.; Soori, S. Study of Energy Dissipation of Pooled Stepped Spillways. Civil Eng. J. 2016, 2, 208–220. [Google Scholar] [CrossRef]
- Daneshfaraz, R.; Ghaderi, A. Numerical Investigation of Inverse Curvature Ogee Spillway. Civil Eng. J. 2017, 3, 1146–1156. [Google Scholar] [CrossRef] [Green Version]
- Morovati, K.; Eghbalzadeh, A. Study of inception point, void fraction and pressure over pooled stepped spillways using Flow-3D. Int. J. Numer. Methods Heat Fluid Flow 2018, 28, 982–998. [Google Scholar] [CrossRef]
- Daneshfaraz, R.; Joudi, A.R.; Ghahramanzadeh, A.; Ghaderi, A. Investigation of flow pressure distribution over a stepped spillway. Adv. Appl. Fluid Mech. 2016, 19, 811–822. [Google Scholar] [CrossRef]
- Ghaderi, A.; Abbasi, S. CFD simulation of local scouring around airfoil-shaped bridge piers with and without collar. Sādhanā 2019, 44, 216. [Google Scholar] [CrossRef] [Green Version]
- Daneshfaraz, R.; Minaei, O.; Abraham, J.; Dadashi, S.; Ghaderi, A. 3-D Numerical simulation of water flow over a broad-crested weir with openings. ISH J. Hydraul. Eng. 2019, 1–9. [Google Scholar] [CrossRef]
- Ghaderi, A.; Dasineh, M.; Aristodemo, F.; Ghahramanzadeh, A. Characteristics of free and submerged hydraulic jumps over different macroroughnesses. J. Hydroinform. 2020, 22, 1554–1572. [Google Scholar] [CrossRef]
- Abbasi, S.; Fatemi, S.; Ghaderi, A.; Di Francesco, S. The Effect of Geometric Parameters of the Antivortex on a Triangular Labyrinth Side Weir. Water 2021, 13, 14. [Google Scholar] [CrossRef]
- Dong, Z.Y. Numerical simulation of skimming flow over mild stepped channel. J. Hydrodyn. Ser. B 2006, 18, 367–371. [Google Scholar] [CrossRef]
- Ghaderi, A.; Dasineh, M.; Aristodemo, F.; Aricò, C. Numerical Simulations of the Flow Field of a Submerged Hydraulic Jump over Triangular Macroroughnesses. Water 2021, 13, 674. [Google Scholar] [CrossRef]
- Kaouachi, A.; Carvalho, R.F.; Benmamar, S.; Gafsi, M. Numerical assessment of the inception point in different stepped spillway configurations. Arab. J. Geosci. 2019, 12, 564. [Google Scholar] [CrossRef]
- Wan, H.; Li, R.; Gualtieri, C.; Yang, H.; Feng, J. Numerical Simulation of Hydrodynamics and Reaeration over a Stepped Spillway by the SPH Method. Water 2017, 9, 565. [Google Scholar] [CrossRef] [Green Version]
- Flow Science Inc. FLOW-3D V 11.2 User’s Manual; Flow Science: Santa Fe, NM, USA, 2016. [Google Scholar]
- Hirt, C.W.; Nichols, B.D. Volume of fluid (VOF) method for the dynamics of free boundaries. J. Comput. Phys. 1981, 39, 201–225. [Google Scholar] [CrossRef]
- Pu, J.H.; Shao, S.; Huang, Y. Numerical and experimental turbulence studies on shallow open channel flows. J. Hydro Environ. Res. 2014, 8, 9–19. [Google Scholar] [CrossRef] [Green Version]
- Ghaderi, A.; Abbasi, S.; Abraham, J.; Azamathulla, H.M. Efficiency of Trapezoidal Labyrinth Shaped Stepped Spillways. Flow Meas. Instrum. 2020, 72, 101711. [Google Scholar] [CrossRef]
- Hekmatzadeh, A.A.; Papari, S.; Amiri, S.M. Investigation of energy dissipation on various configurations of stepped spillways considering several RANS turbulence models. Iran. J. Sci. Technol. Trans. Civil Eng. 2018, 42, 97–109. [Google Scholar] [CrossRef]
- Bayon, A.; Toro, J.P.; Bombardelli, F.A.; Matos, J.; López-Jiménez, P.A. Influence of VOF technique, turbulence model and discretization scheme on the numerical simulation of the non-aerated, skimming flow in stepped spillways. J. Hydro-Environ. Res. 2018, 19, 137–149. [Google Scholar] [CrossRef] [Green Version]
- Carvalho, R.F.; Rui, M. Stepped spillway with hydraulic jumps: Application of a numerical model to a scale model of a conceptual prototype. J. Hydraul. Eng. 2014, 135, 615–619. [Google Scholar] [CrossRef]
- Shahheydari, H.; Nodoshan, E.J.; Barati, R.; Moghadam, M.A. Discharge coefficient and energy dissipation over stepped spillway under skimming flow regime. KSCE J. Civil Eng. 2015, 19, 1174–1182. [Google Scholar] [CrossRef]
- Ghaderi, A.; Dasineh, M.; Abbasi, S.; Abraham, J. Investigation of trapezoidal sharp-crested side weir discharge coefficients under subcritical flow regimes using CFD. Appl. Water Sci. 2020, 10, 31. [Google Scholar] [CrossRef] [Green Version]
- Ghaderi, A.; Daneshfaraz, R.; Dasineh, M.; Di Francesco, S. Energy dissipation and hydraulics of flow over trapezoidal–triangular labyrinth weirs. Water 2020, 12, 1992. [Google Scholar] [CrossRef]
- Daneshfaraz, R.; Ghaderi, A.; Akhtari, A.; Di Francesco, S. On the Effect of Block Roughness in Ogee Spillways with Flip Buckets. Fluids 2020, 5, 182. [Google Scholar] [CrossRef]
- Yakhot, V.; Orszag, S.A.; Thangam, S.; Gatski, T.B.; Speziale, C.G. Development of turbulence models for shear flows by a double expansion technique. Phys. Fluids A Fluid Dyn. 1992, 4, 1510–1520. [Google Scholar] [CrossRef] [Green Version]
- Choufu, L.; Abbasi, S.; Pourshahbaz, H.; Taghvaei, P.; Tfwala, S. Investigation of flow, erosion, and sedimentation pattern around varied groynes under different hydraulic and geometric conditions: A numerical study. Water 2019, 11, 235. [Google Scholar] [CrossRef] [Green Version]
- Pourshahbaz, H.; Abbasi, S.; Pandey, M.; Pu, J.H.; Taghvaei, P.; Tofangdar, N. Morphology and hydrodynamics numerical simulation around groynes. ISH J. Hydraul. Eng. 2020, 1–9. [Google Scholar] [CrossRef]
- Celik, I.B.; Ghia, U.; Roache, P.J.; Freitas, C.J. Procedure for estimation and reporting of uncertainty due to discretization in CFD applications. J. Fluids Eng. Trans. ASME 2008, 130, 078001. [Google Scholar] [CrossRef] [Green Version]
- Roache, P.J. Perspective: A Method for Uniform Reporting of Grid Refinement Studies. J. Fluids Eng. 1994, 116, 405–413. [Google Scholar] [CrossRef]
- Hunt, S.L.; Kadavy, K.C.; Hanson, G.J. Simplistic design methods for moderate-sloped stepped chutes. J. Hydraul. Eng. 2014, 140, 04014062. [Google Scholar] [CrossRef]
- Carosi, G.; Chanson, H. Turbulence Characteristics in Skimming Flows on Stepped Spillways. Can. J. Civil Eng. 2008, 35, 865–880. [Google Scholar] [CrossRef]
- Li, S.; Zhang, J. Numerical investigation on the hydraulic properties of the skimming flow over pooled stepped spillway. Water 2018, 10, 1478. [Google Scholar] [CrossRef] [Green Version]
- Rajaratnam, N. Turbulent Jets; Elsevier Science: Amsterdam, The Netherlands, 1976. [Google Scholar]
- Bombardelli, F.A.; Inês Meireles, I.; Matos, J. Laboratory measurements and multi-block numerical simulations of the mean flow and turbulence in the non-aerated skimming flow region of steep stepped spillways. Environ. Fluid Mech. 2011, 11, 263–288. [Google Scholar] [CrossRef] [Green Version]
Figure 1.
Flow regime conditions in the skimming flow region.

Figure 2.
Sketch of stepped spillway configurations with flat, pooled, and notch pooled steps: (A) flat steps; (B) FPS; (C) ZPS; (D) CPS; (E) TPS.
Figure 2.
Sketch of stepped spillway configurations with flat, pooled, and notch pooled steps: (A) flat steps; (B) FPS; (C) ZPS; (D) CPS; (E) TPS.

Figure 3.
Sketch of mesh setup.

Figure 4.
Boundary conditions on the numerical domain in FLOW-3D.

Figure 5.
Results of the mesh convergence analysis for velocity distributions on step 7.

Figure 6.
Dimensionless interfacial velocity distributions of the flat stepped spillways; numerical simulation vs. experimental data (A): Q = 0.113 m3/s; (B): Q = 0.090 m3/s.
Figure 6.
Dimensionless interfacial velocity distributions of the flat stepped spillways; numerical simulation vs. experimental data (A): Q = 0.113 m3/s; (B): Q = 0.090 m3/s.

Figure 7.
Free-surface profiles above a broad-crested weir.

Figure 8.
Flow patterns on different pool configurations steps.

Figure 9.
Velocity vector in the transverse direction.

Figure 10.
Flow patterns on the notches of the pooled steps with no = 50% and no = 100%.

Figure 11.
Velocity profile distributions on steps for different pool configurations, in terms of the dimensionless velocity V/Vc as a function of (y + dp)/yc for two steps (i.e., step 7 and 8). Vc = critical flow velocity.
Figure 11.
Velocity profile distributions on steps for different pool configurations, in terms of the dimensionless velocity V/Vc as a function of (y + dp)/yc for two steps (i.e., step 7 and 8). Vc = critical flow velocity.


Figure 12.
Velocity vectors for different pooled step configurations.

Figure 13.
Velocity vectors on steps for notch pool configurations with no = 50% and no = 100%.

Figure 14.
Pressure contours for different pool configurations steps.


Figure 15.
Pressure contours for the notch of the pooled steps with no = 50% and no = 100%.

Figure 16.
Inception points of air entrainment for different pooled step configurations.

Figure 17.
Residual energy values at the downstream end of the spillway in different pooled step configurations.
Figure 17.
Residual energy values at the downstream end of the spillway in different pooled step configurations.

Figure 18.
The rates of energy dissipation for different pooled step configurations.

Figure 19.
Turbulent kinetic energy(TKE) (J/kg) values over different pool configurations.

Figure 20.
TKE (J/kg) values over notched pooled steps with no = 50% and no = 100%.

Figure 21.
The mean TKE (J/kg) values on pooled steps of different configurations (height and notched): (A) Q = 0.090 m3/s; (B) Q = 0.105 m3/s.
Figure 21.
The mean TKE (J/kg) values on pooled steps of different configurations (height and notched): (A) Q = 0.090 m3/s; (B) Q = 0.105 m3/s.


Table 1.
Hydraulic characteristics and the type of flow regime on the stepped spillway in the present study.
Table 1.
Hydraulic characteristics and the type of flow regime on the stepped spillway in the present study.
| Q (m3/s) | yc = (q2/g)1/3 (m) | Step Height (m) | Step Length (m) | h/l | yc/h | Fr | Re | Flow Regime |
|---|---|---|---|---|---|---|---|---|
| 0.045 | 0.092 | 0.1 | 0.2 | 0.5 | 0.92 | 0.88 | 3.5 × 10⁵ | ✓Skimming flow |
| 0.063 | 0.115 | 0.1 | 0.2 | 0.5 | 1.15 | 1.23 | 4.9 × 10⁵ | ✓Skimming flow |
| 0.075 | 0.129 | 0.1 | 0.2 | 0.5 | 1.29 | 1.46 | 5.6 × 10⁵ | ✓Skimming flow |
| 0.09 | 0.145 | 0.1 | 0.2 | 0.5 | 1.45 | 1.74 | 6.9 × 10⁵ | ✓Skimming flow |
| 0.105 | 0.161 | 0.1 | 0.2 | 0.5 | 1.61 | 2.04 | 8 × 10⁵ | ✓Skimming flow |
| 0.113 | 0.17 | 0.1 | 0.2 | 0.5 | 1.7 | 2.21 | 8.7 × 10⁵ | ✓Skimming flow |
Table 2.
Characteristics of the meshes tested in the convergence analysis.
| Mesh | Nested Block Cell Size | Containing Block Cell Size |
|---|---|---|
| G1 | 0.65 cm | 1.45 cm |
| G2 | 0.85 cm | 1.80 cm |
| G3 | 1.10 cm | 2.45 cm |
Table 3.
GCI calculation.
| Mesh Size | R = G2/G1 | Grid Convergence Index (GCI) |
|---|---|---|
| 0.65 | - | - |
| 0.85 | 1.30 | 5.04% |
| 1.10 | 1.30 | 14.86% |
Publisher’s Note: MDPI stays neutral with regard to jurisdictional claims in published maps and institutional affiliations. |
© 2021 by the authors. Licensee MDPI, Basel, Switzerland. This article is an open access article distributed under the terms and conditions of the Creative Commons Attribution (CC BY) license (http://creativecommons.org/licenses/by/4.0/).
Share and Cite
MDPI and ACS Style
Ghaderi, A.; Abbasi, S.; Di Francesco, S. Numerical Study on the Hydraulic Properties of Flow over Different Pooled Stepped Spillways. Water 2021, 13, 710. https://doi.org/10.3390/w13050710
AMA Style
Ghaderi A, Abbasi S, Di Francesco S. Numerical Study on the Hydraulic Properties of Flow over Different Pooled Stepped Spillways. Water. 2021; 13(5):710. https://doi.org/10.3390/w13050710
Chicago/Turabian StyleGhaderi, Amir, Saeed Abbasi, and Silvia Di Francesco. 2021. "Numerical Study on the Hydraulic Properties of Flow over Different Pooled Stepped Spillways" Water 13, no. 5: 710. https://doi.org/10.3390/w13050710
Note that from the first issue of 2016, this journal uses article numbers instead of page numbers. See further details here.