
Towards a Correlation between Long-Term Seawater Intrusion Response and Water Level Fluctuations


1
School of Natural and Built Environment, Queen’s University, Belfast BT7 1NN, UK
2
Department of Civil and Environmental Engineering, Brunel University London, Kingston Lane, Uxbridge, Sussex UB8 3PH, UK
3
Civil Engineering Department, Faculty of Engineering, Assiut University, 71515 Asyut, Egypt
*
Authors to whom correspondence should be addressed.
Water 2021, 13(5), 719; https://doi.org/10.3390/w13050719
Submission received: 1 February 2021
/
Revised: 27 February 2021
/
Accepted: 1 March 2021
/
Published: 6 March 2021
(This article belongs to the Special Issue Seawater Intrusion into Coastal Aquifers)
Abstract
:Laboratory and numerical experiments were conducted to provide a quantitative steady-state analysis of the effect of incremental variations of water level on saltwater intrusion. The purpose was to seek mathematical correlations relating both the wedge toe length and the height along the coastline to the boundary head difference. The laboratory experiments were completed in a 2D sand tank where both freshwater and seawater levels were varied. The experiments were conducted for two bead sizes having different hydraulic conductivities. The numerical model SEAWAT was used to validate the results and then to perform sensitivity analysis. The experimental results show that at steady-state conditions, the logarithmic toe length could be expressed as a linear function of the boundary head difference. The linear relationship was recorded in both advancing and receding wedge phases. The linearity of the correlation was also well demonstrated with analytical solutions. Similar relationships were also derived in the scenarios where the sea level fluctuated while the freshwater boundary head was constant. The height of the saltwater wedge along the coastline was also found to be a linear function of the boundary head difference. The sensitivity analysis shows that the regression coefficients were sensitive to the hydraulic conductivity, the dispersivity, and the saltwater density, while the porosity and the rate of boundary head change induced negligible effects. The existence of a linear relationship between the logarithmic toe length and the boundary head difference was also well evidenced in a field-scale aquifer model for all the different hydrogeological aquifer conditions tested. This study is the first attempt in identifying the underlying correlation between the boundary water level variations and the main seawater intrusion (SWI) external metrics under controlled laboratory conditions, which is of great relevance from a water resources management perspective.
1. Introduction
Historically, urban communities have been dwelling in coastal zones for the economic benefits yielded from ports. According to the United Nations Atlas of Oceans 2012, eight of the top ten largest cities in the world are located near the coast [1]. The Intergovernmental Panel on Climate Change (IPCC) [2] forecasted a sea-level rise of as high as 0.82 m per century in several regions around the globe, which will not be uniform across regions. It is therefore critically important to implement appropriate strategies to protect coastal groundwater from the ever-growing threat of seawater intrusion (SWI). This major environmental problem has already prompted the abandonment of many production wells in many coastal areas around the globe, thereby causing significant economic losses, especially considering the quasi-exclusive reliance of industries and farms on groundwater in coastal zones.
A large number of studies have been conducted to understand the saltwater intrusion process, including laboratory-scale investigations, numerical, and analytical modelling studies [3,4,5,6]. Felisa et al. [3] developed a probabilistic numerical model to predict the extent of saltwater intrusion into a coastal phreatic aquifer for the case of steady-state flow. Kerrou et al. [4] studied the uncertainties of the spatial distribution of pumping rates and hydraulic conductivity influence on the saltwater intrusion mechanism. Their results evidenced that the impact of the uncertainty in the hydraulic conductivity distribution on the predictions of contaminant transport was greater than the impact of the uncertainty in the spatial distribution of the discharge rates.
Using laboratory-scale experiments, Goswami and Clement [5] proposed a benchmark model for seawater intrusion problems. They examined the advancing and retreating motion of a saltwater wedge under both steady-state and transient conditions. Abarca and Clement [7] developed a method for mapping the mixing or dispersive zone at the saltwater–freshwater interface. They utilised the colourimetric changes of phenolphthalein with regard to pH to visualise the dispersive zone. More recently, Robinson et al. [8] provided transient experimental results for different homogeneous soils exhibiting various hydraulic conductivities. They found that the receding wedge moved faster than the advancing wedge, thereby confirming previous observations. Abdelgawad et al. [9] found the critical pumping rate of a well, the rate at which 1% salt concentration reaches the well, was more sensitive to the well location than the well depth. Abdoulhalik et al. [10] extended their study by analysing the critical pumping rate in layered heterogeneous coastal aquifers. They evidenced that critical pumping rate significantly decreased with decreasing hydraulic conductivity and thickness of the middle layer of the aquifer.
Many studies investigated the effect of sea-level rise on SWI [6,11,12,13]. Werner and Simmons [11] found a marked difference between an inland flux-controlled boundary and constant head boundary in response to sea-level rise. While in the flux-controlled boundary the SWI advanced by only 50 m due to the rise in sea level by up to 1.5 m, it migrated between a few to some hundreds of kilometres in response to sea-level rise of the same magnitude of 1.5 m in the case of a constant head boundary. Hussain and Javadi [12] investigated SWI in response to the forecasted sea-level rise from 2015 until the year 2100. Their results showed a greater rate and amount of SWI in coastal aquifers with flat shoreline slopes compared with those with steep slopes. The steady-state condition was reached in considerably shorter time in systems with flatter slopes. Chang et al. [6] showed that for a confined aquifer, a constant ambient recharge would cause sea-level rise to have a minimum or no impact on the steady saltwater wedge. They found that in both confined and unconfined aquifers, the rising seas would lift up the entire aquifer, and the lifting process would minimise the impacts of SWI. More recently, Abdoulhalik and Ahmed [13] showed that the advancing saltwater wedge needed nearly twice as long to reach a steady-state condition than the receding wedge, regardless of whether the fluctuations occurred at the inland or seaside boundary.
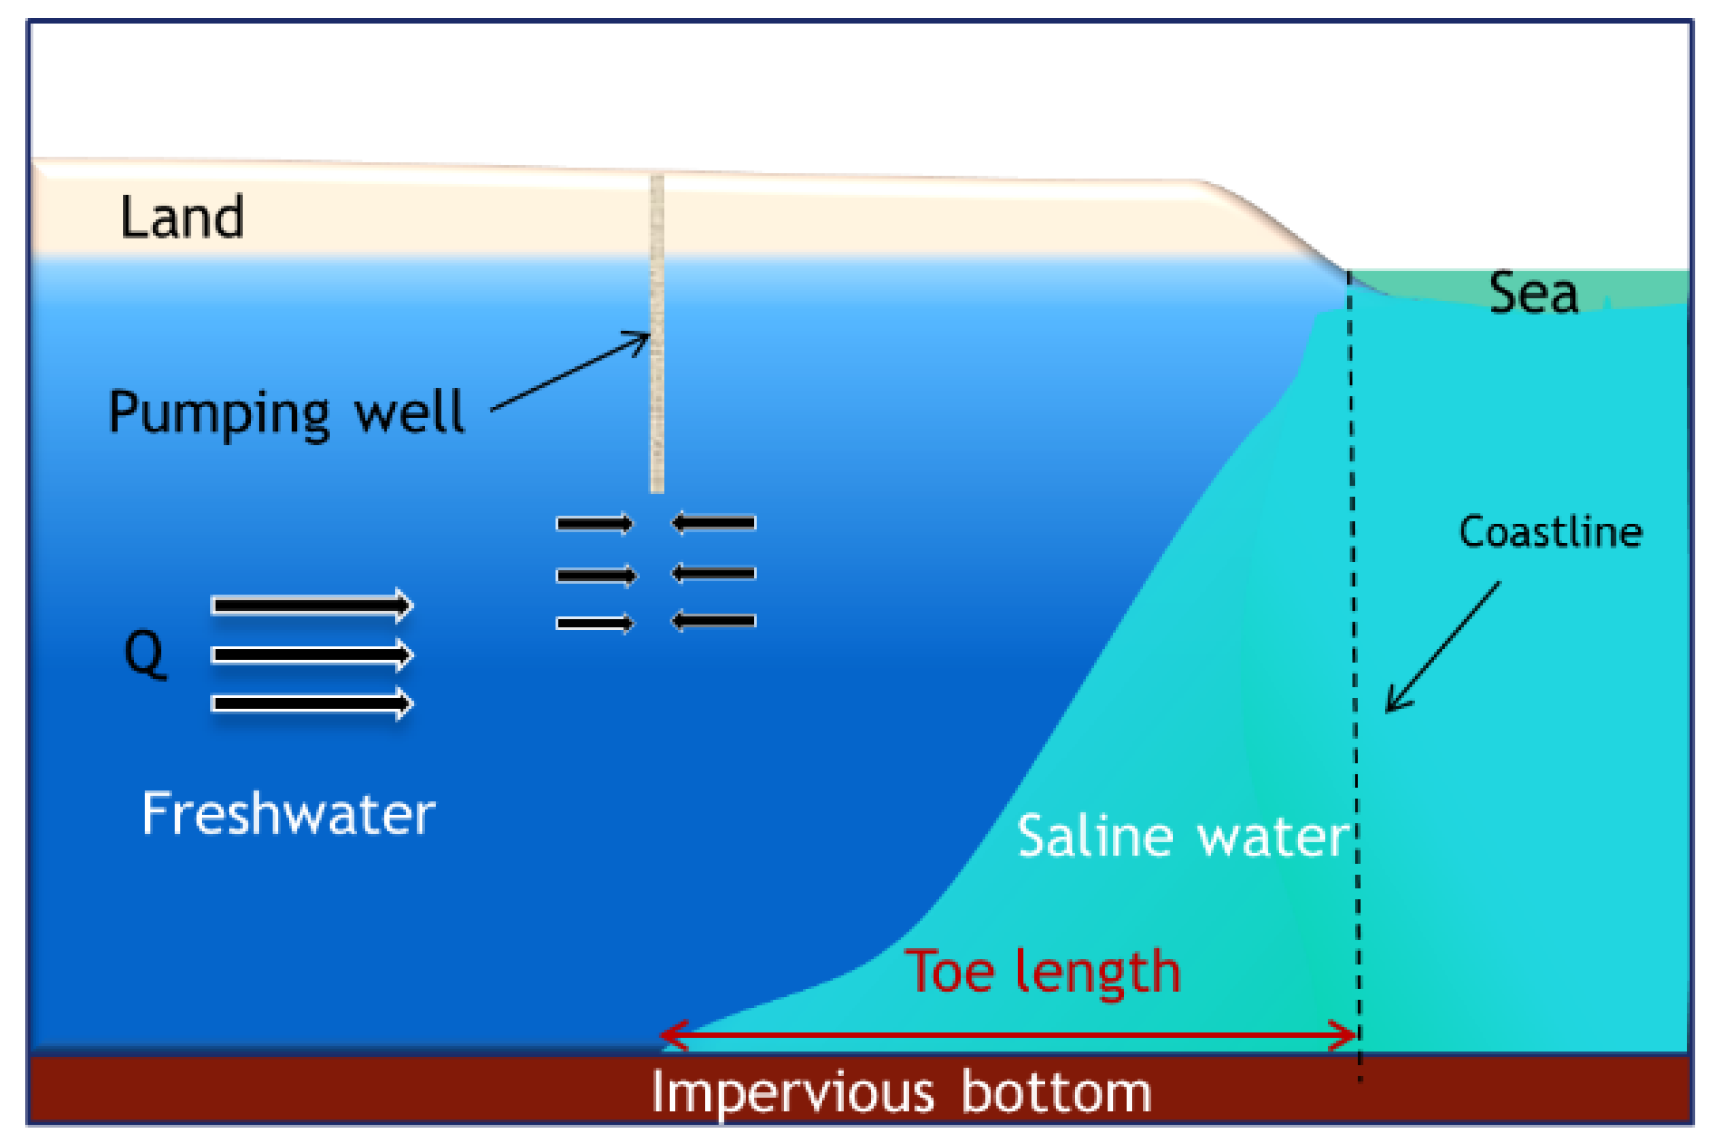
While the above studies, and others in the literature, have emphasised the impact of sea-level rise and also the changes in freshwater flow on saltwater intrusion and the associated timescale of interface motion, a relationship between the boundary water level variations and the main SWI external metrics (i.e., the toe length and the height along the coastline) has never been examined in a systematic and quantitative manner under controlled laboratory conditions (Figure 1). Identifying the underlying nature of such correlations would undoubtedly be valuable from a water resources management perspective.
Hence, this investigation aims to seek quantitative correlations relating the external SWI metrics and the boundary head difference by assessing systematically and quantitatively the steady-state response of the saltwater wedge to freshwater and saltwater level fluctuations under a controlled laboratory setting. The SWI parameters were quantified under a high spatial and temporal resolution using an experimental automated image analysis technique. The experiments were conducted in a laboratory-scale aquifer for two homogeneous systems using different bead sizes in order to examine experimentally the sensitivity of the sought correlations to aquifer permeability. Both incremental and decremental head changes were implemented (with the same magnitude) to further confirm the sought relationships. As this investigation builds over the previous work of Abdoulhalik and Ahmed [13] who exclusively focused on the transient processes associated with saltwater intrusion dynamics, some experimental results were reused herein, and appropriate referencing was given upon use. The numerical model SEAWAT [14] was applied for validation purposes and to further explore the sensitivity of the derived correlations to the main hydrogeological parameters.
2. Materials and Methods
2.1. Experimental Methods
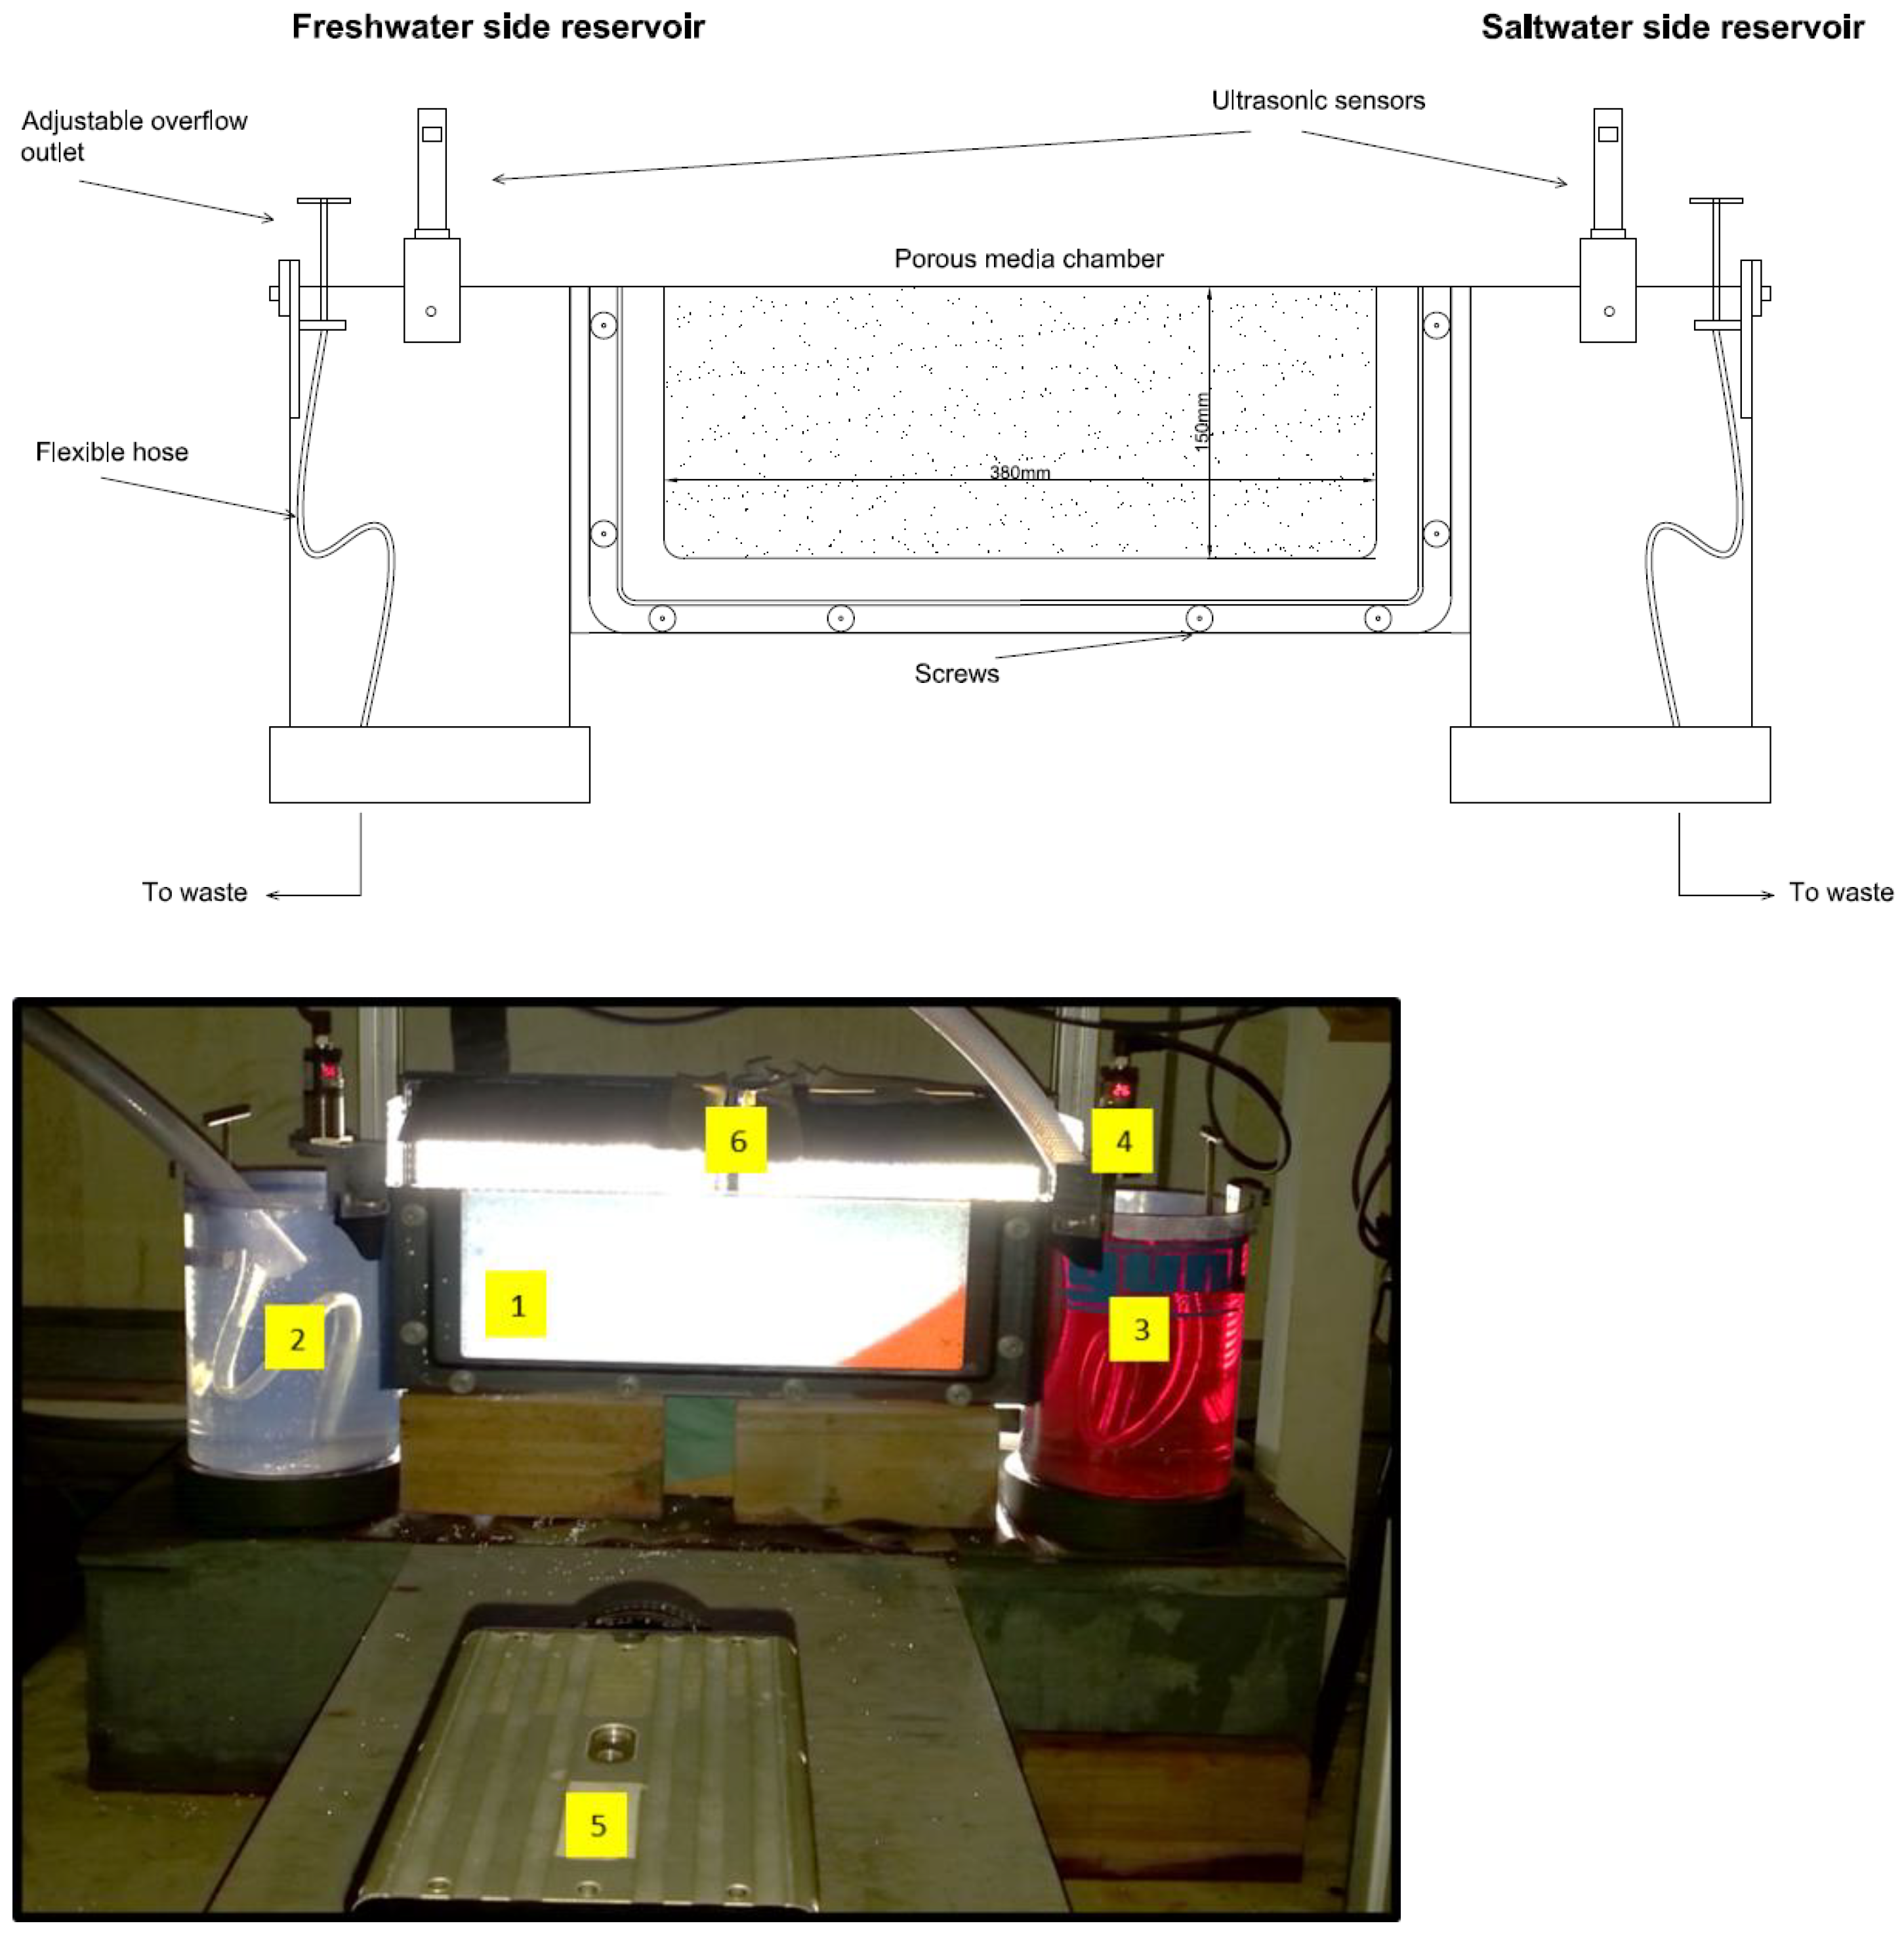
The experimental method and procedures were already described in detail in Abdoulhalik and Ahmed [13] where similar experiments were conducted. Therefore, only a concise description is provided below. The laboratory flow tank used to conduct the experiments was composed of a central chamber measuring 0.38 × 0.15 × 0.01 m flanked by two reservoirs (Figure 2). Clear glass beads were used to simulate the porous media and enable a clear visualisation of the saltwater intrusion process. The vertical thickness of the porous media was about 14 cm. Two experimental cases were performed using two different glass bead sizes of mean diameters of 1090 and 1325 µm, referred here to as case 1090 and case 1325, respectively. The measured average conductivity was 85 and 108 cm/min, for the beads 1090 and 1325 µm, respectively.
The saltwater solution was prepared before the experiments by dissolving commercial salt into dyed freshwater at a concentration of 36.16 g/L to achieve a density of 1025 kg/m3. The water levels in each side reservoir were accurately monitored using ultrasonic sensors and were varied to impose various head boundary differences. A fixed head of 129.7 mm was set on the saltwater reservoir, while the freshwater level was set high enough such that the porous media remain fully saturated with freshwater.
The saline water was allowed to penetrate into the aquifer by dropping the freshwater head to 135.7 mm, thereby imposing an initial head difference dh = 6 mm. Other head differences of dh = 5.2, 4.4, and 3.6 mm were then successively applied for 50 min each (Table 1). This duration was sufficient for the system to reach quasi steady-state equilibrium in all the tests. The final head difference applied was the same as the initial one (dh = 6 mm) to verify the occurrence of any hysteresis throughout the test. The experimental images recorded during the tests were analysed using automated image analysis techniques [15,16,17], and the toe length (TL) was derived.
Two sets of experimental cases were conducted, where either the freshwater level (FW) or saltwater level (SL) was changed, while the other was fixed. Specifically, these experimental cases included the advancing and receding saltwater wedge experiments as a result of gradual freshwater head drop and rise, respectively, while the seawater head boundary remained constant at 129.7 mm (scenario FW). Another two sets of experimental cases were performed where the saltwater level was changed while the freshwater head boundary was held constant at 135.7 mm (scenario SL) as shown in Table 1.
2.2. Numerical Methods
The MODFLOW family variable density flow code SEAWAT [14] was used to perform the numerical modelling experiments. SEAWAT combines the modified MODFLOW [18] and MT3DMS [19] into a single program that solves the coupled groundwater flow and solute-transport equations. SEAWAT has been widely used to solve various variable-density groundwater flow, such as the Henry problem, the Elder problem, and the HYDROCOIN problem [14]. SEAWAT has also been successfully used for modelling SWI experiments involving freshwater head boundary variations [5,6].
The dimensions of the simulation area corresponded to those of the thickness of the porous media. A mesh size of 0.2 cm was used for the discretisation of the model. The longitudinal and transverse dispersivity were set at 0.1 and 0.05 cm, respectively. The spatial discretisation and dispersivity values satisfied the grid Peclet number criterion. The molecular diffusion was neglected in this work, following other studies e.g., [9,10,13,20,21]. A constant head was set at the coastal boundary (C = 36.16 g/L), and a variable head was set at the inland freshwater boundary (C = 0 g/L). As in the experiments, the simulation time was set at t = 50 min for each head difference tested, with a time step of 30 s.
The evolution of the saltwater wedge was reproduced over four stress periods, lasting 50 min each. The initial head difference (dh = 6mm) was initially set in the stress period to allow the penetration of the saline water in the aquifer. This was carried out by imposing at the freshwater and saltwater boundary a constant head of 13.57 and 12.97 cm, respectively. The freshwater head was then successively decreased in a stepwise fashion such that to impose the head differences dh = 5.2, 4.4, and 3.6 mm, in the three following stress periods, respectively.
3. Results and Discussion
3.1. Experimental Results
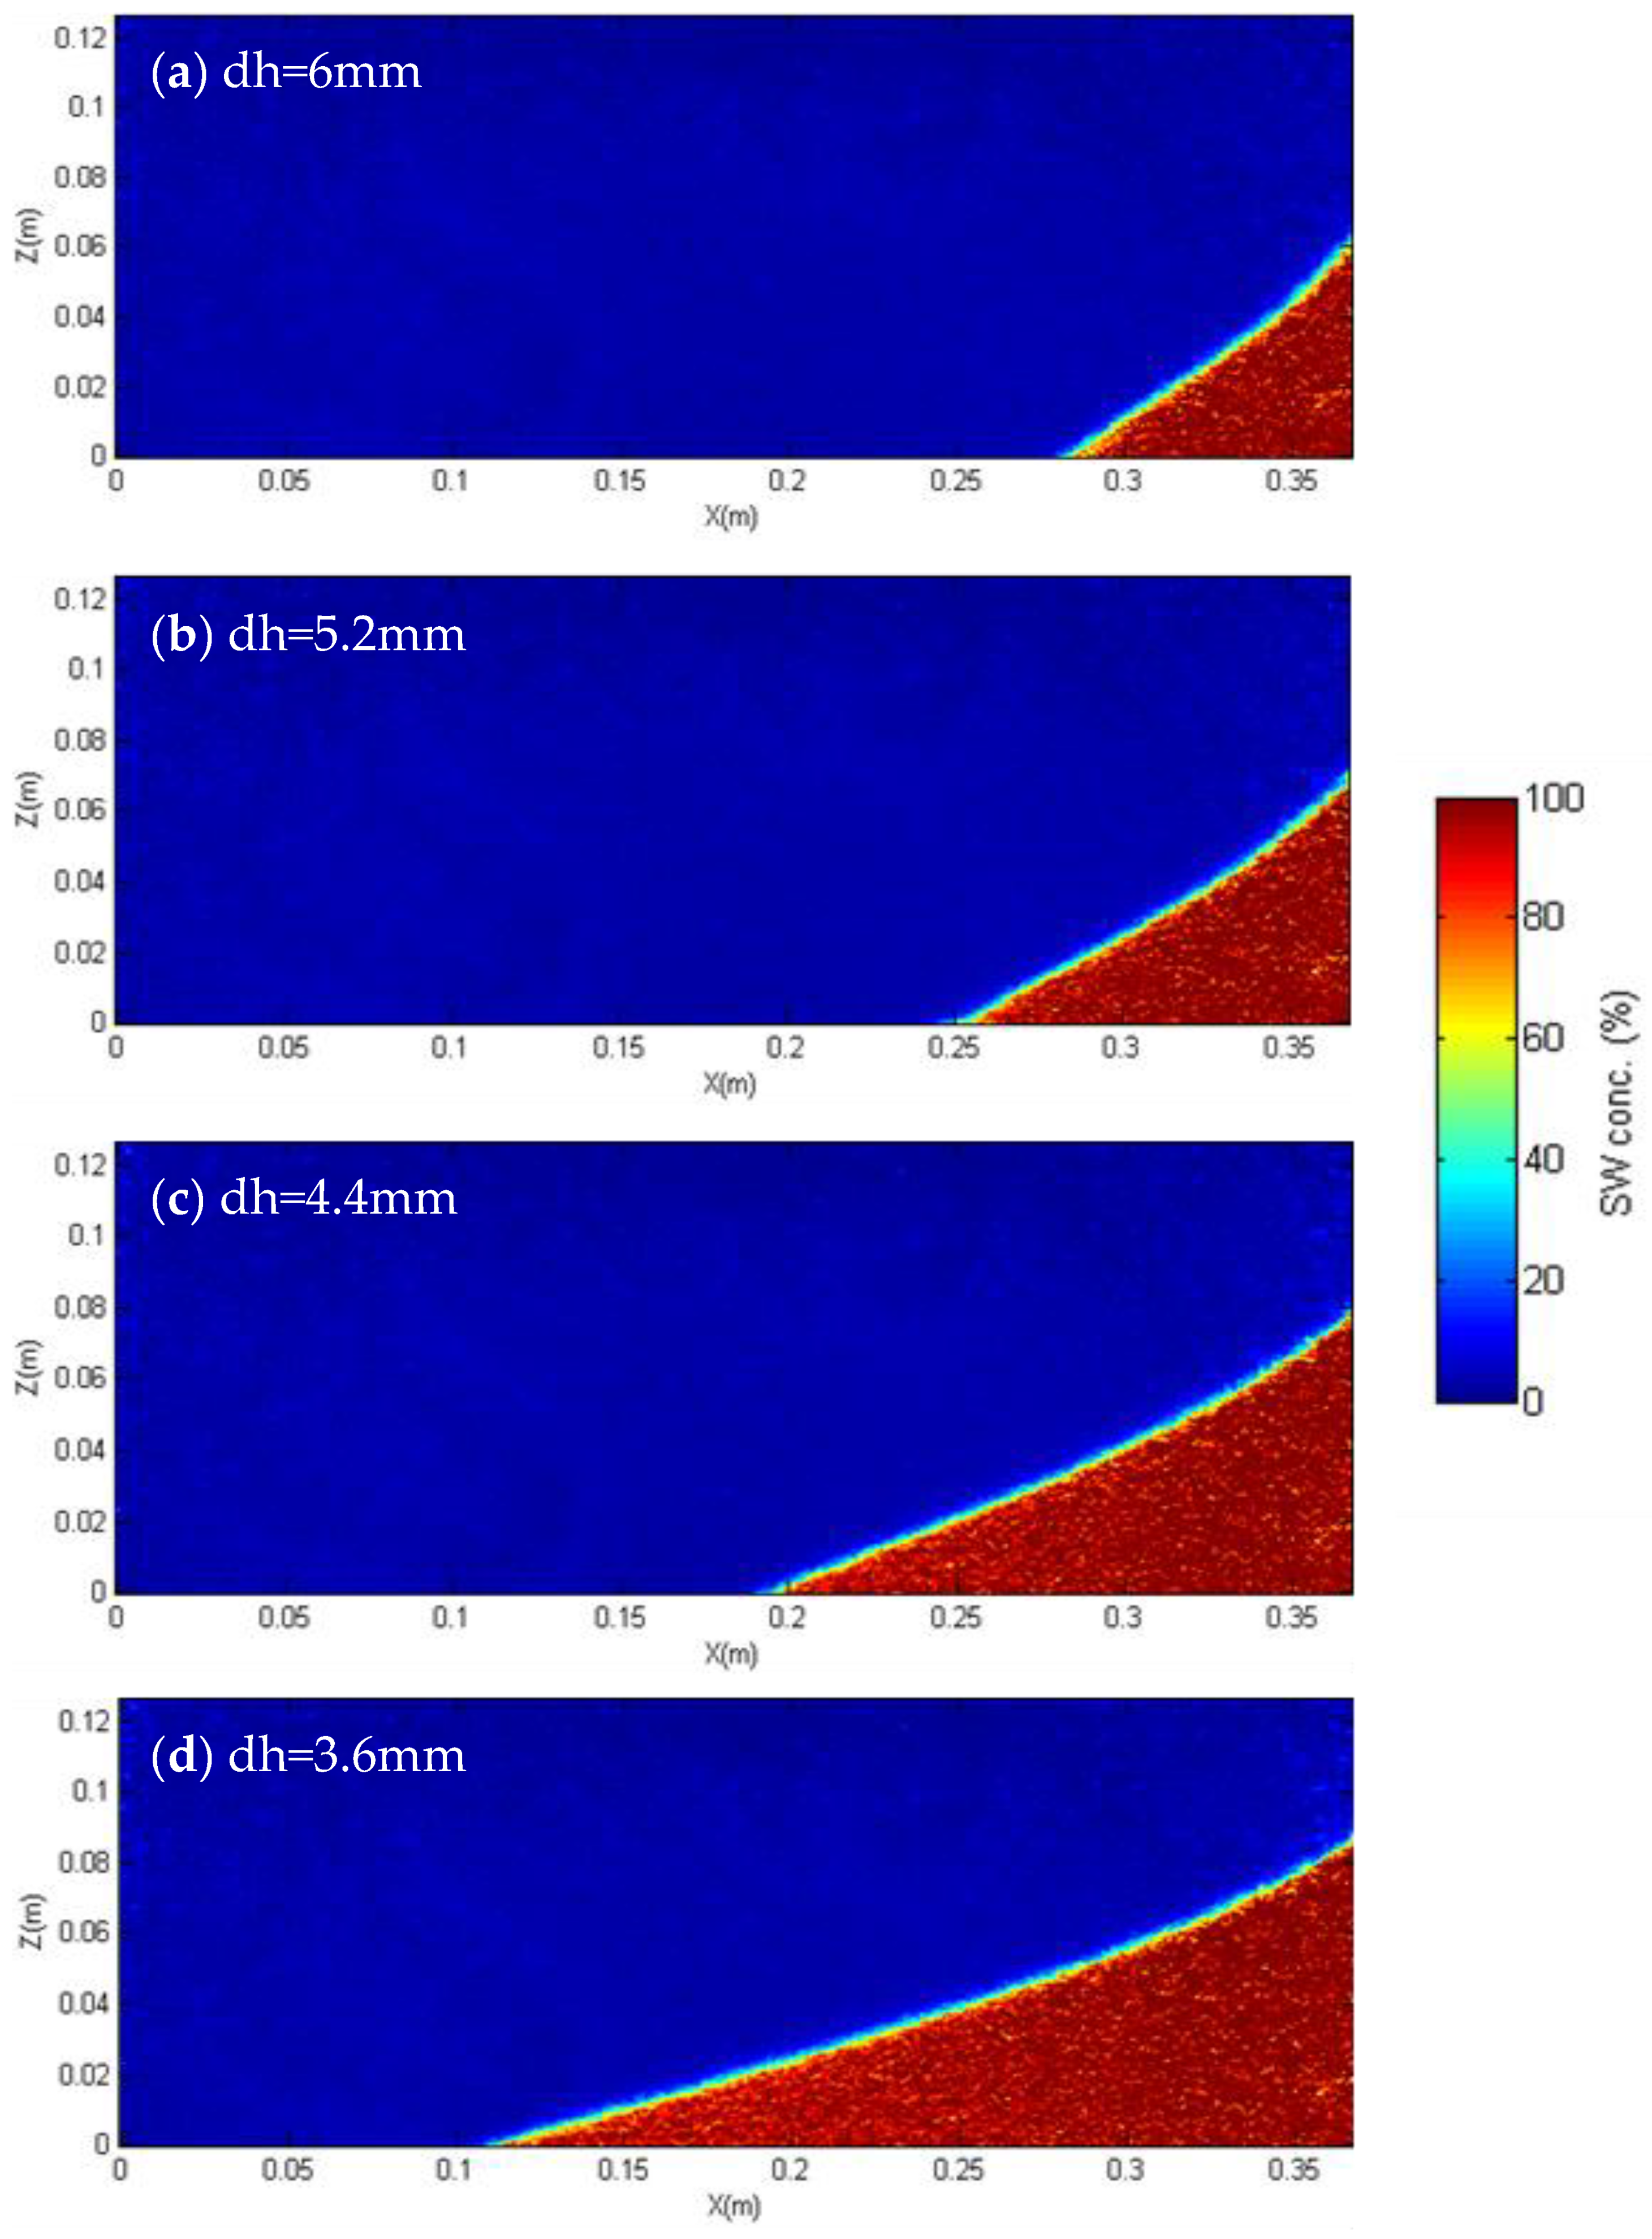
Figure 3 shows the experimental images of the aquifer system for the various hydraulic gradients. Note that these experimental results are analogous to those previously reported in Abdoulhalik and Ahmed [13] where the transient SWI behaviour was analysed. Table 2 shows the values of the steady-state toe length for the two cases. For equivalent head change magnitude but opposite directions, larger toe length was exhibited in scenarios where the saltwater intrusion mechanism was induced by sea-level changes compared to that of freshwater fluctuations. The difference increases with a decreasing hydraulic gradient, with a maximum percentage increase in the toe length of about 7% in case 1090 and 11% in case 1325. This is due to the increase in saturated thickness in the sea level rise scenario, which causes deeper landward saltwater penetration in unconfined coastal aquifers, as opposed to the confined setting, where the saturated thickness remains constant regardless of the magnitude of the sea-level rise [6].
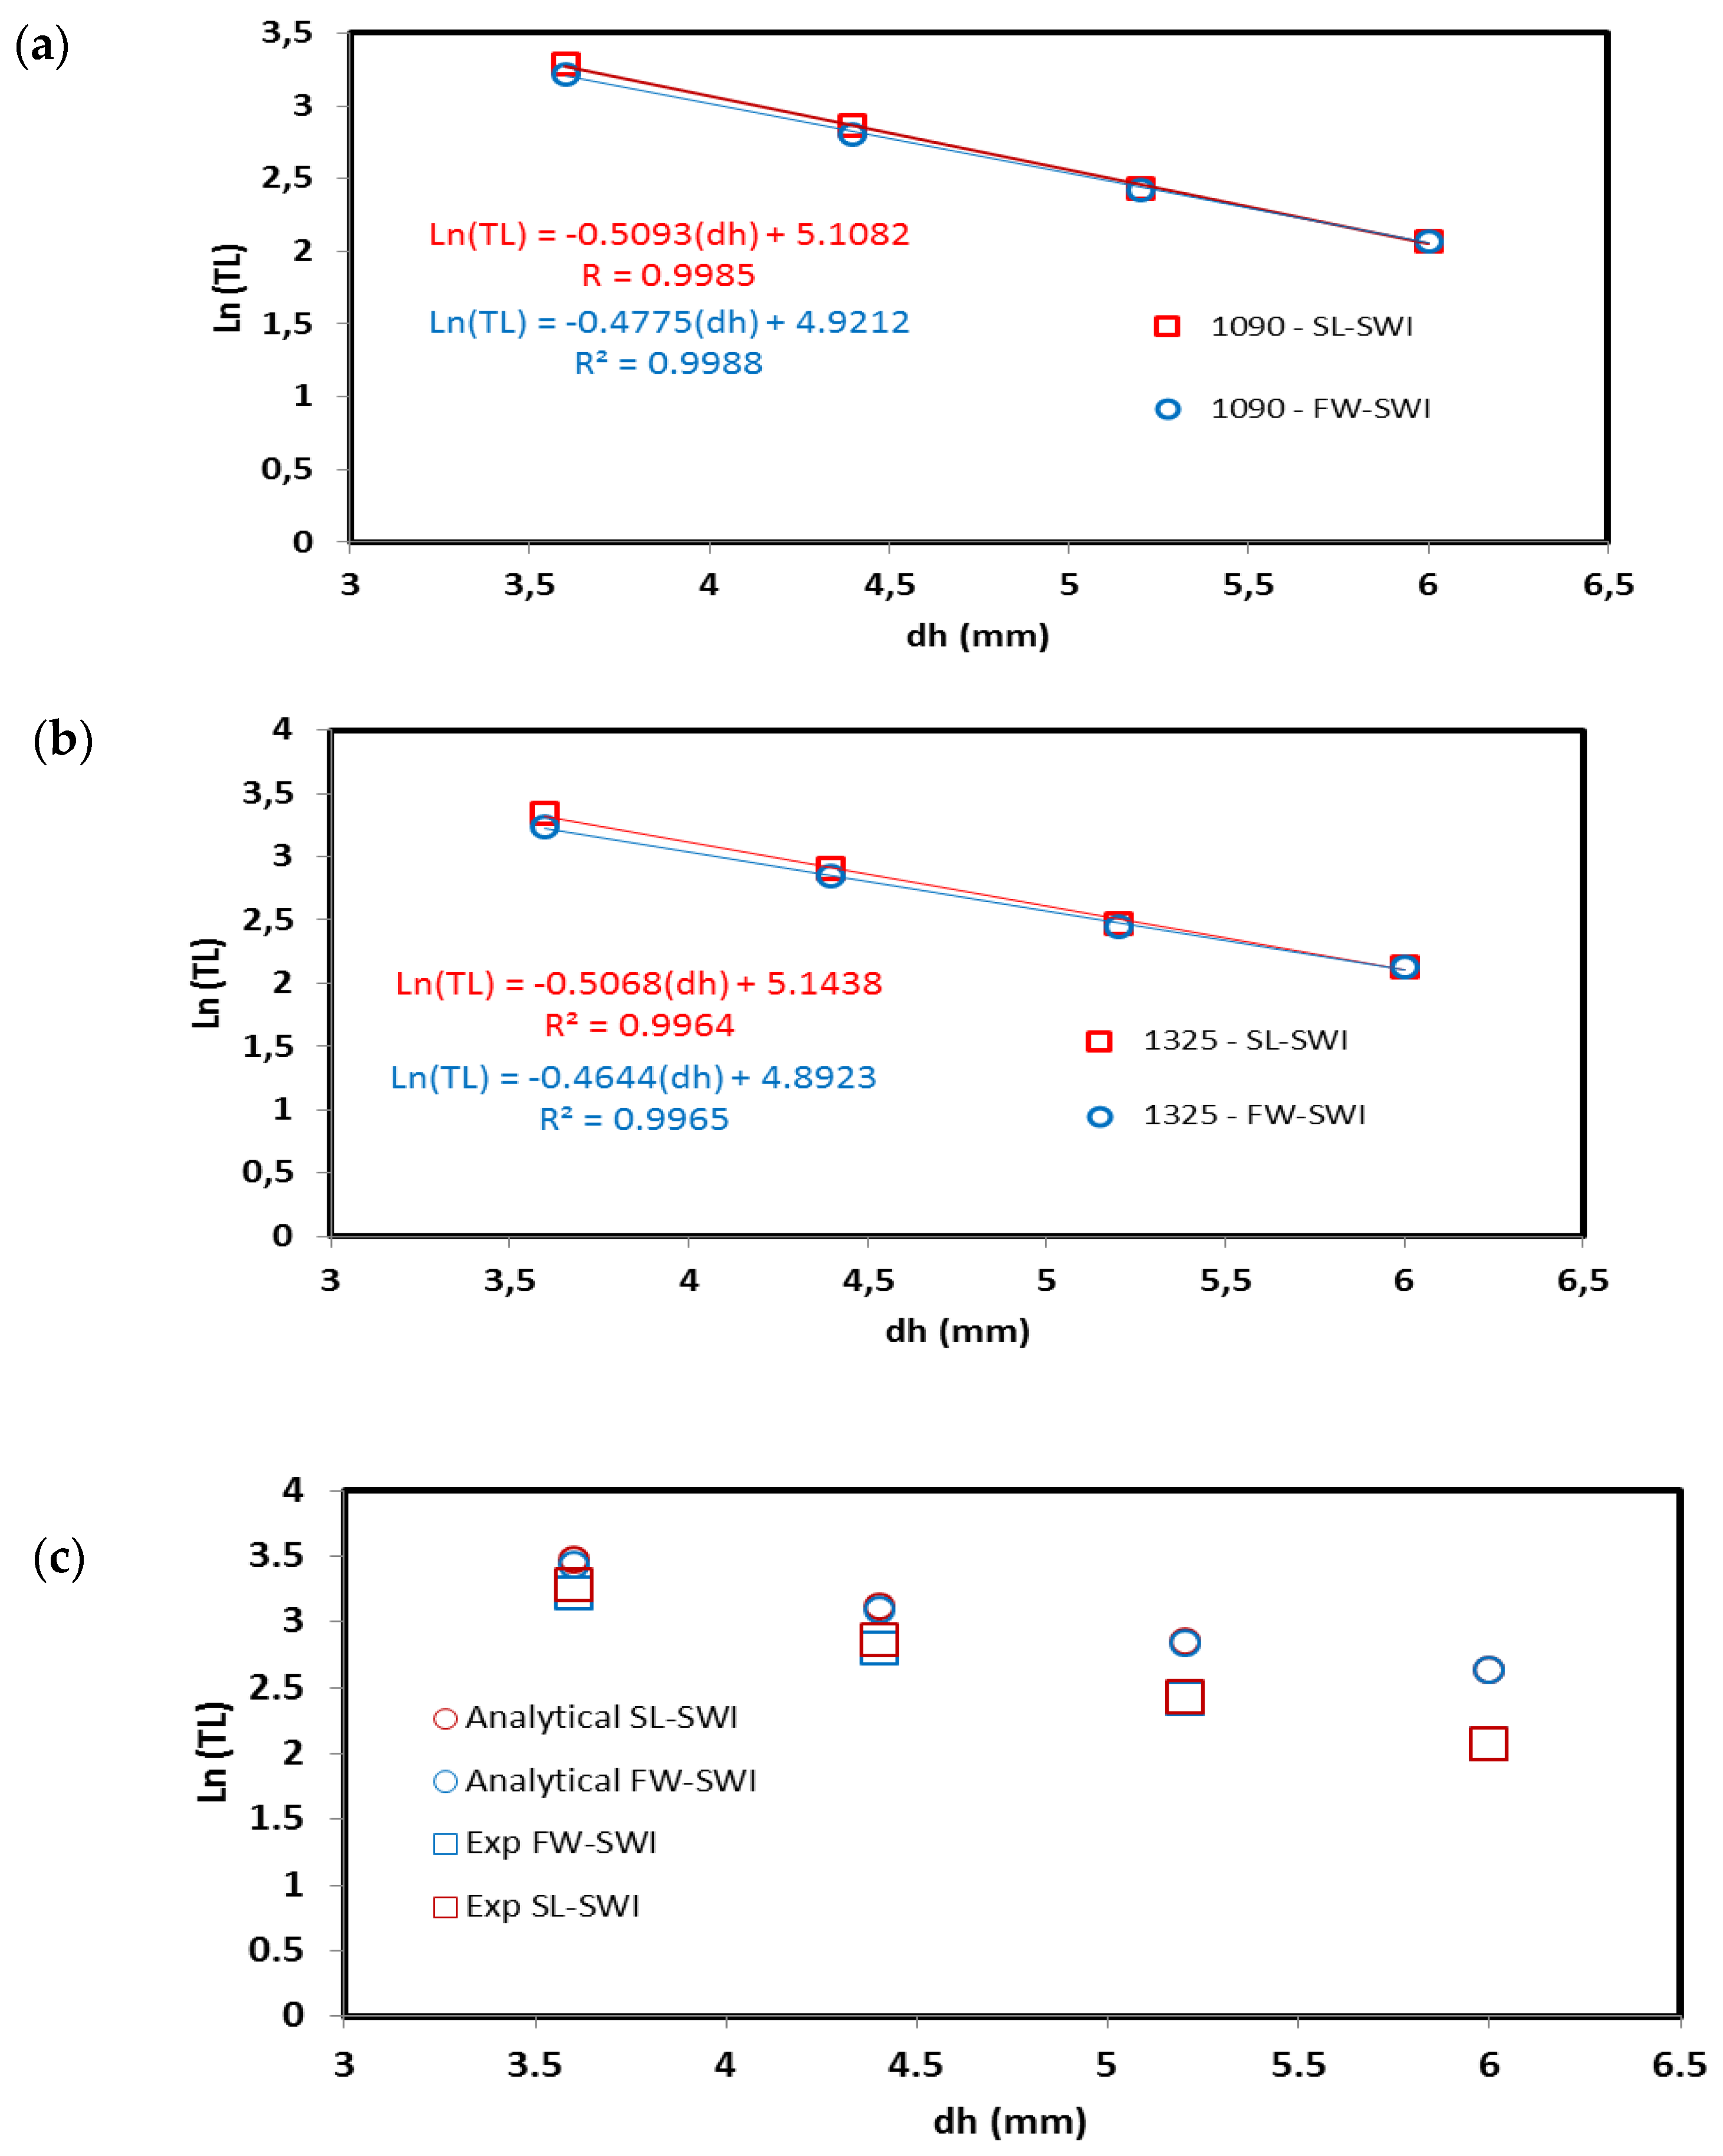
The logarithm of the steady-state toe length of the wedge has a perfect linear function of the head difference dh (Figure 4). A relatively simple linear equation of the type ln (TL) = a(dh) + b could be derived, with a and b being the linear regression coefficients. The values of a and b for the current system are shown in the figure. These coefficients are strongly dependent on the hydrogeological parameters of the system, as shown in the forthcoming sensitivity analysis. The negative value of a simply indicates that lower dh values induce larger wedge penetrations into the aquifer. The coefficient b is slightly larger in the sea-level scenarios, as expected. The strong linearity of the correlations is characterised by the relatively high coefficient of determination R2 > 0.99.
The experimental results were compared with the analytical solution (Figure 4c) of Lu et al. [22], which was derived using the single potential theory by Strack [23]. The results show that the linearity of the correlation was also well demonstrated with the analytical solution. As expected, the toe length values predicted by the analytical model were slightly overestimated compared to the experimental data. This is because the analytical model assumes a sharp interface condition, whereby dispersion effects are neglected, while in the physical model, dispersion effects cause the breakdown of density contrast effects, thereby inducing smaller intrusion lengths. That is why the mismatch was more pronounced for dh = 6 mm, where the flow velocity was the highest.
The linearity of this correlation was also tested during saltwater retreat experiment, whereby the head difference was changed from 6 to 3.6 mm (t = 0–50 min) and then successively increased using a constant step of 0.8 mm up to dh = 6 mm again, following both inland and coastal head variations (Figure 5). For the same boundary head variation (FW or SL) and equivalent dh value, one may observe some slight discrepancies in the resulting toe length values between the advancing and receding scenario, especially the SL experiments. This could be due to several factors, including some occasional minor saltwater level fluctuations induced by the rather slow drain of the excess freshwater in the saltwater reservoir, possible vibrations occurring around the experiments, or simply because the steady-state was not completely reached at the end of the test duration.
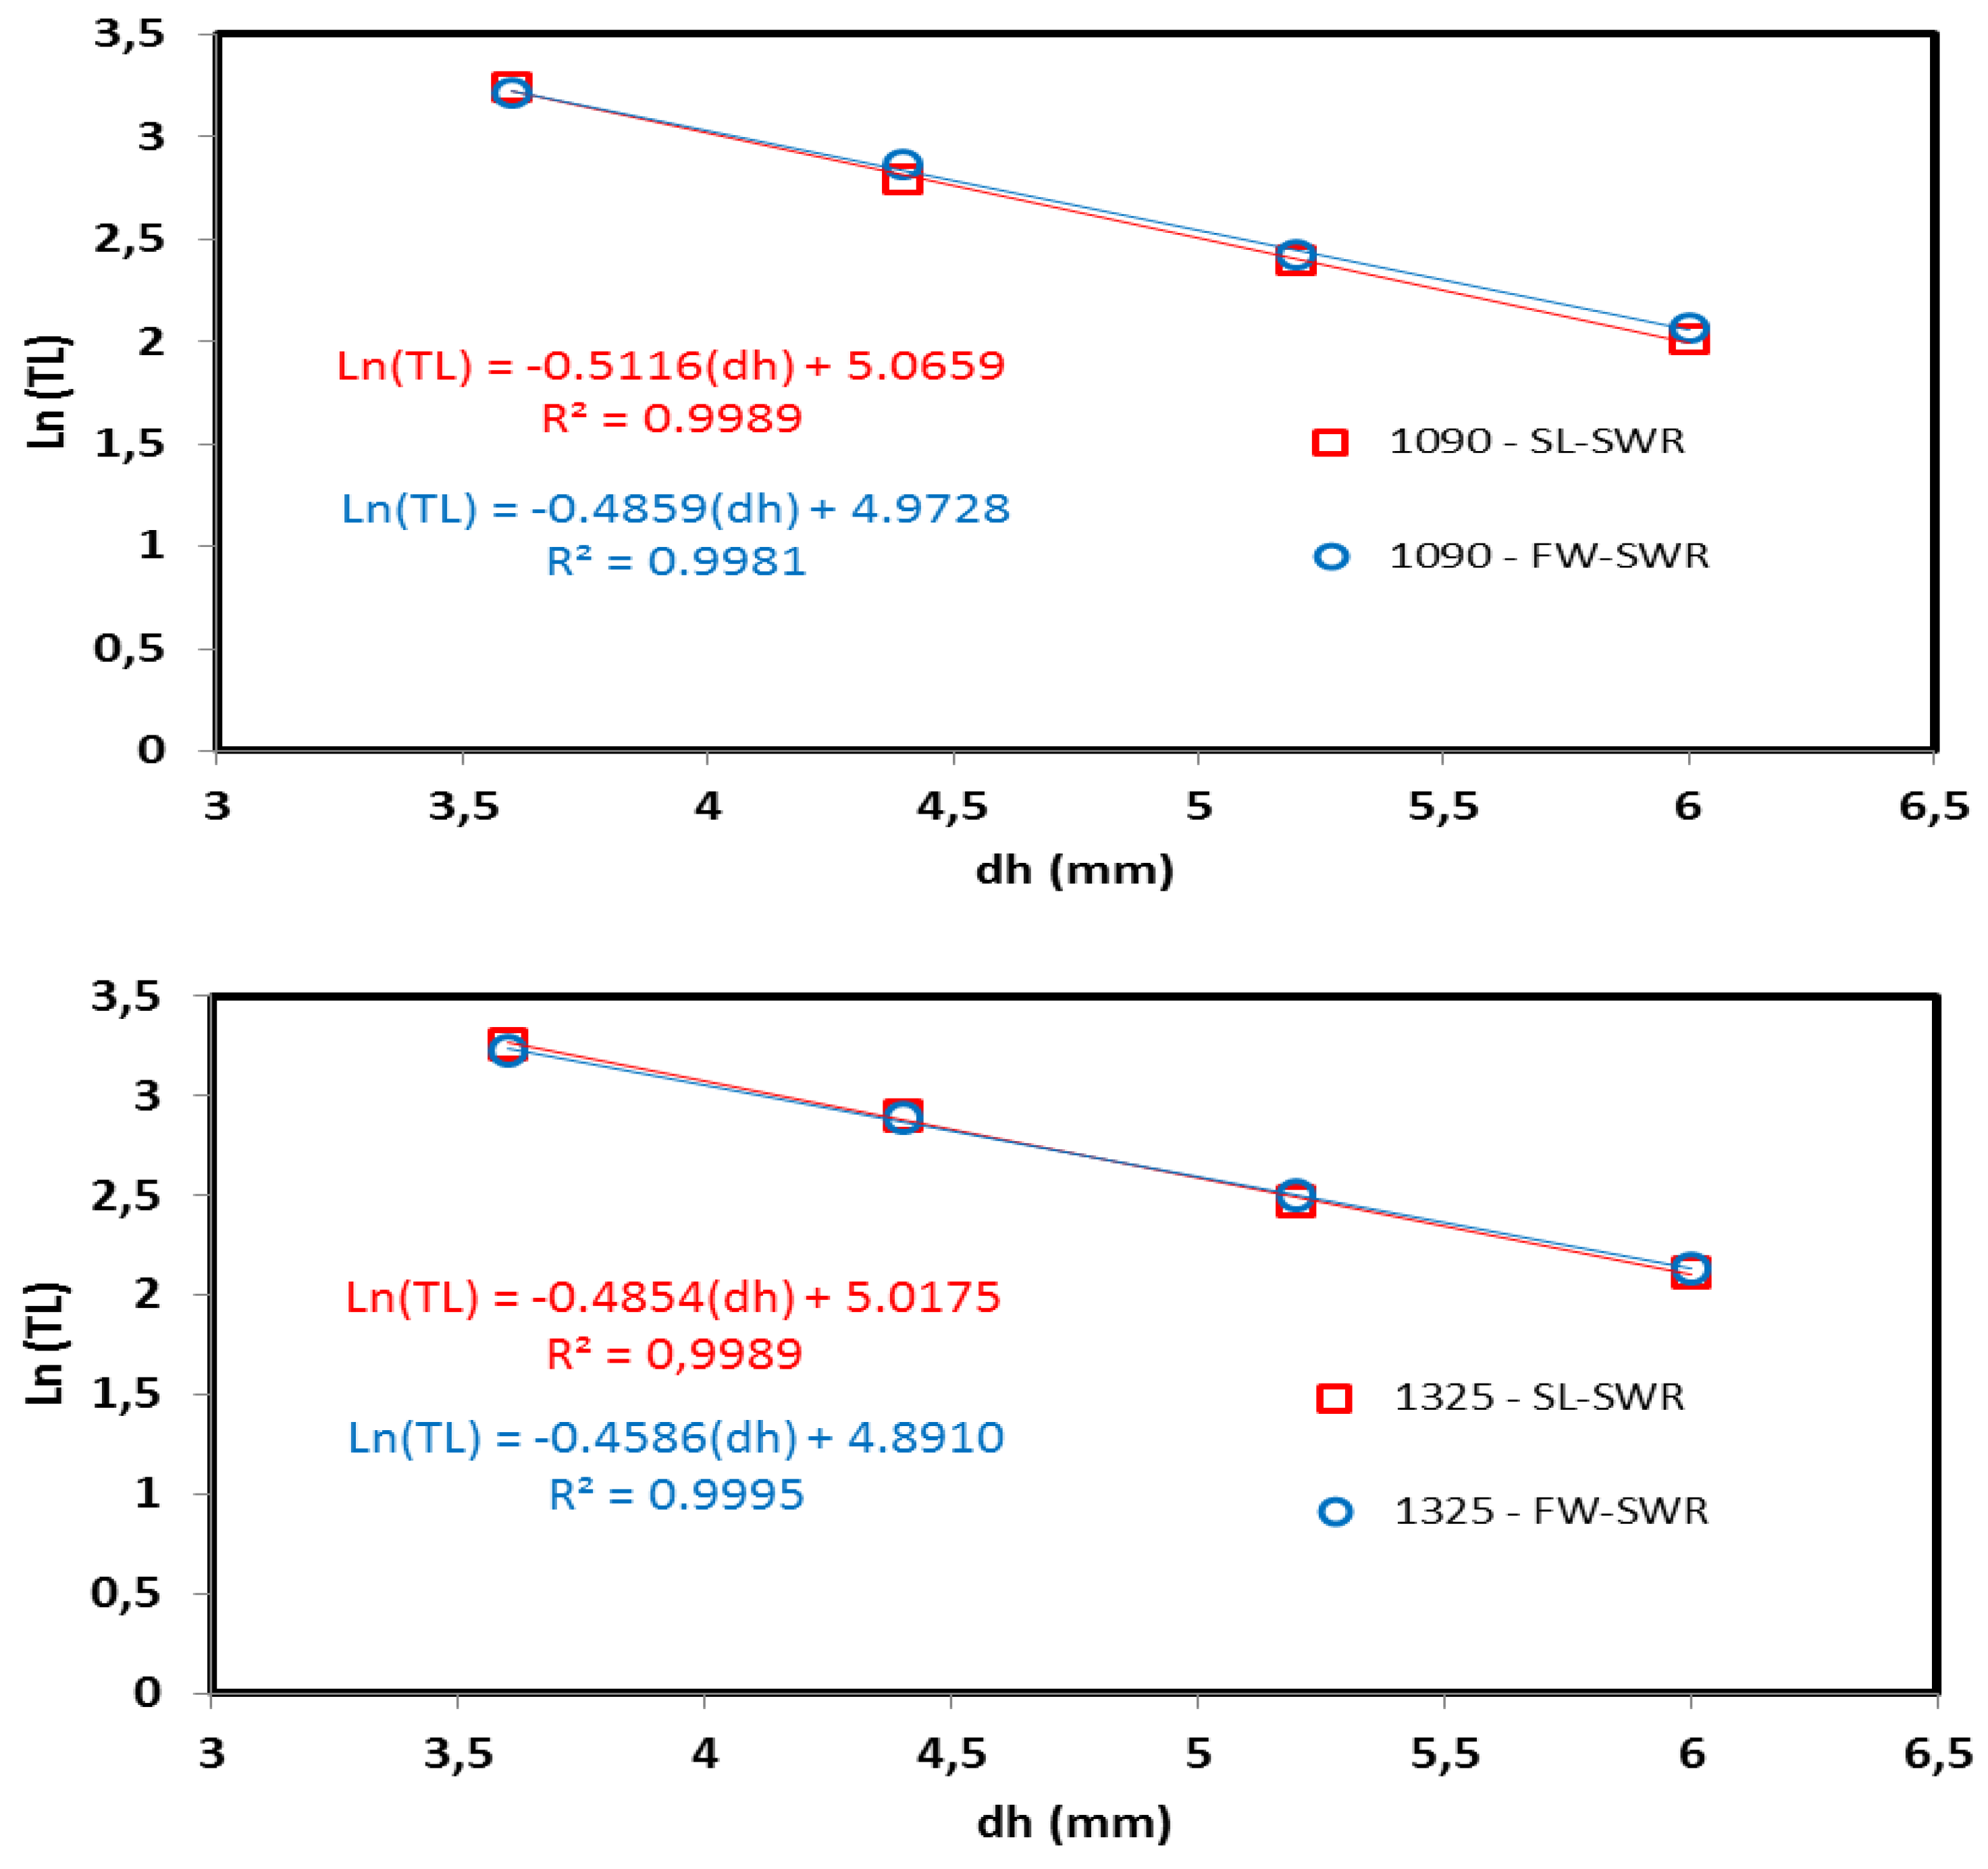
Figure 6 shows that almost no changes on the regression coefficients between the FW and SL scenarios for the seawater retreat, as well as the strong linearity of the derived equations. This finding is of great relevance from a water resources management perspective as it provides guidance for approximate predictions of the saltwater intrusion length into coastal aquifers. In a given coastal groundwater system with a homogeneous isotropic aquifer, the extent of the intrusion length could be reasonably well estimated by measuring the difference between the freshwater and saltwater boundaries. The regression coefficients of the linear relationship could readily be obtained should the logarithmic toe length be computed at any two known head differences. Once the regression coefficients are computed, the relationship could be used to estimate the extent of the saltwater wedge for other head differences.
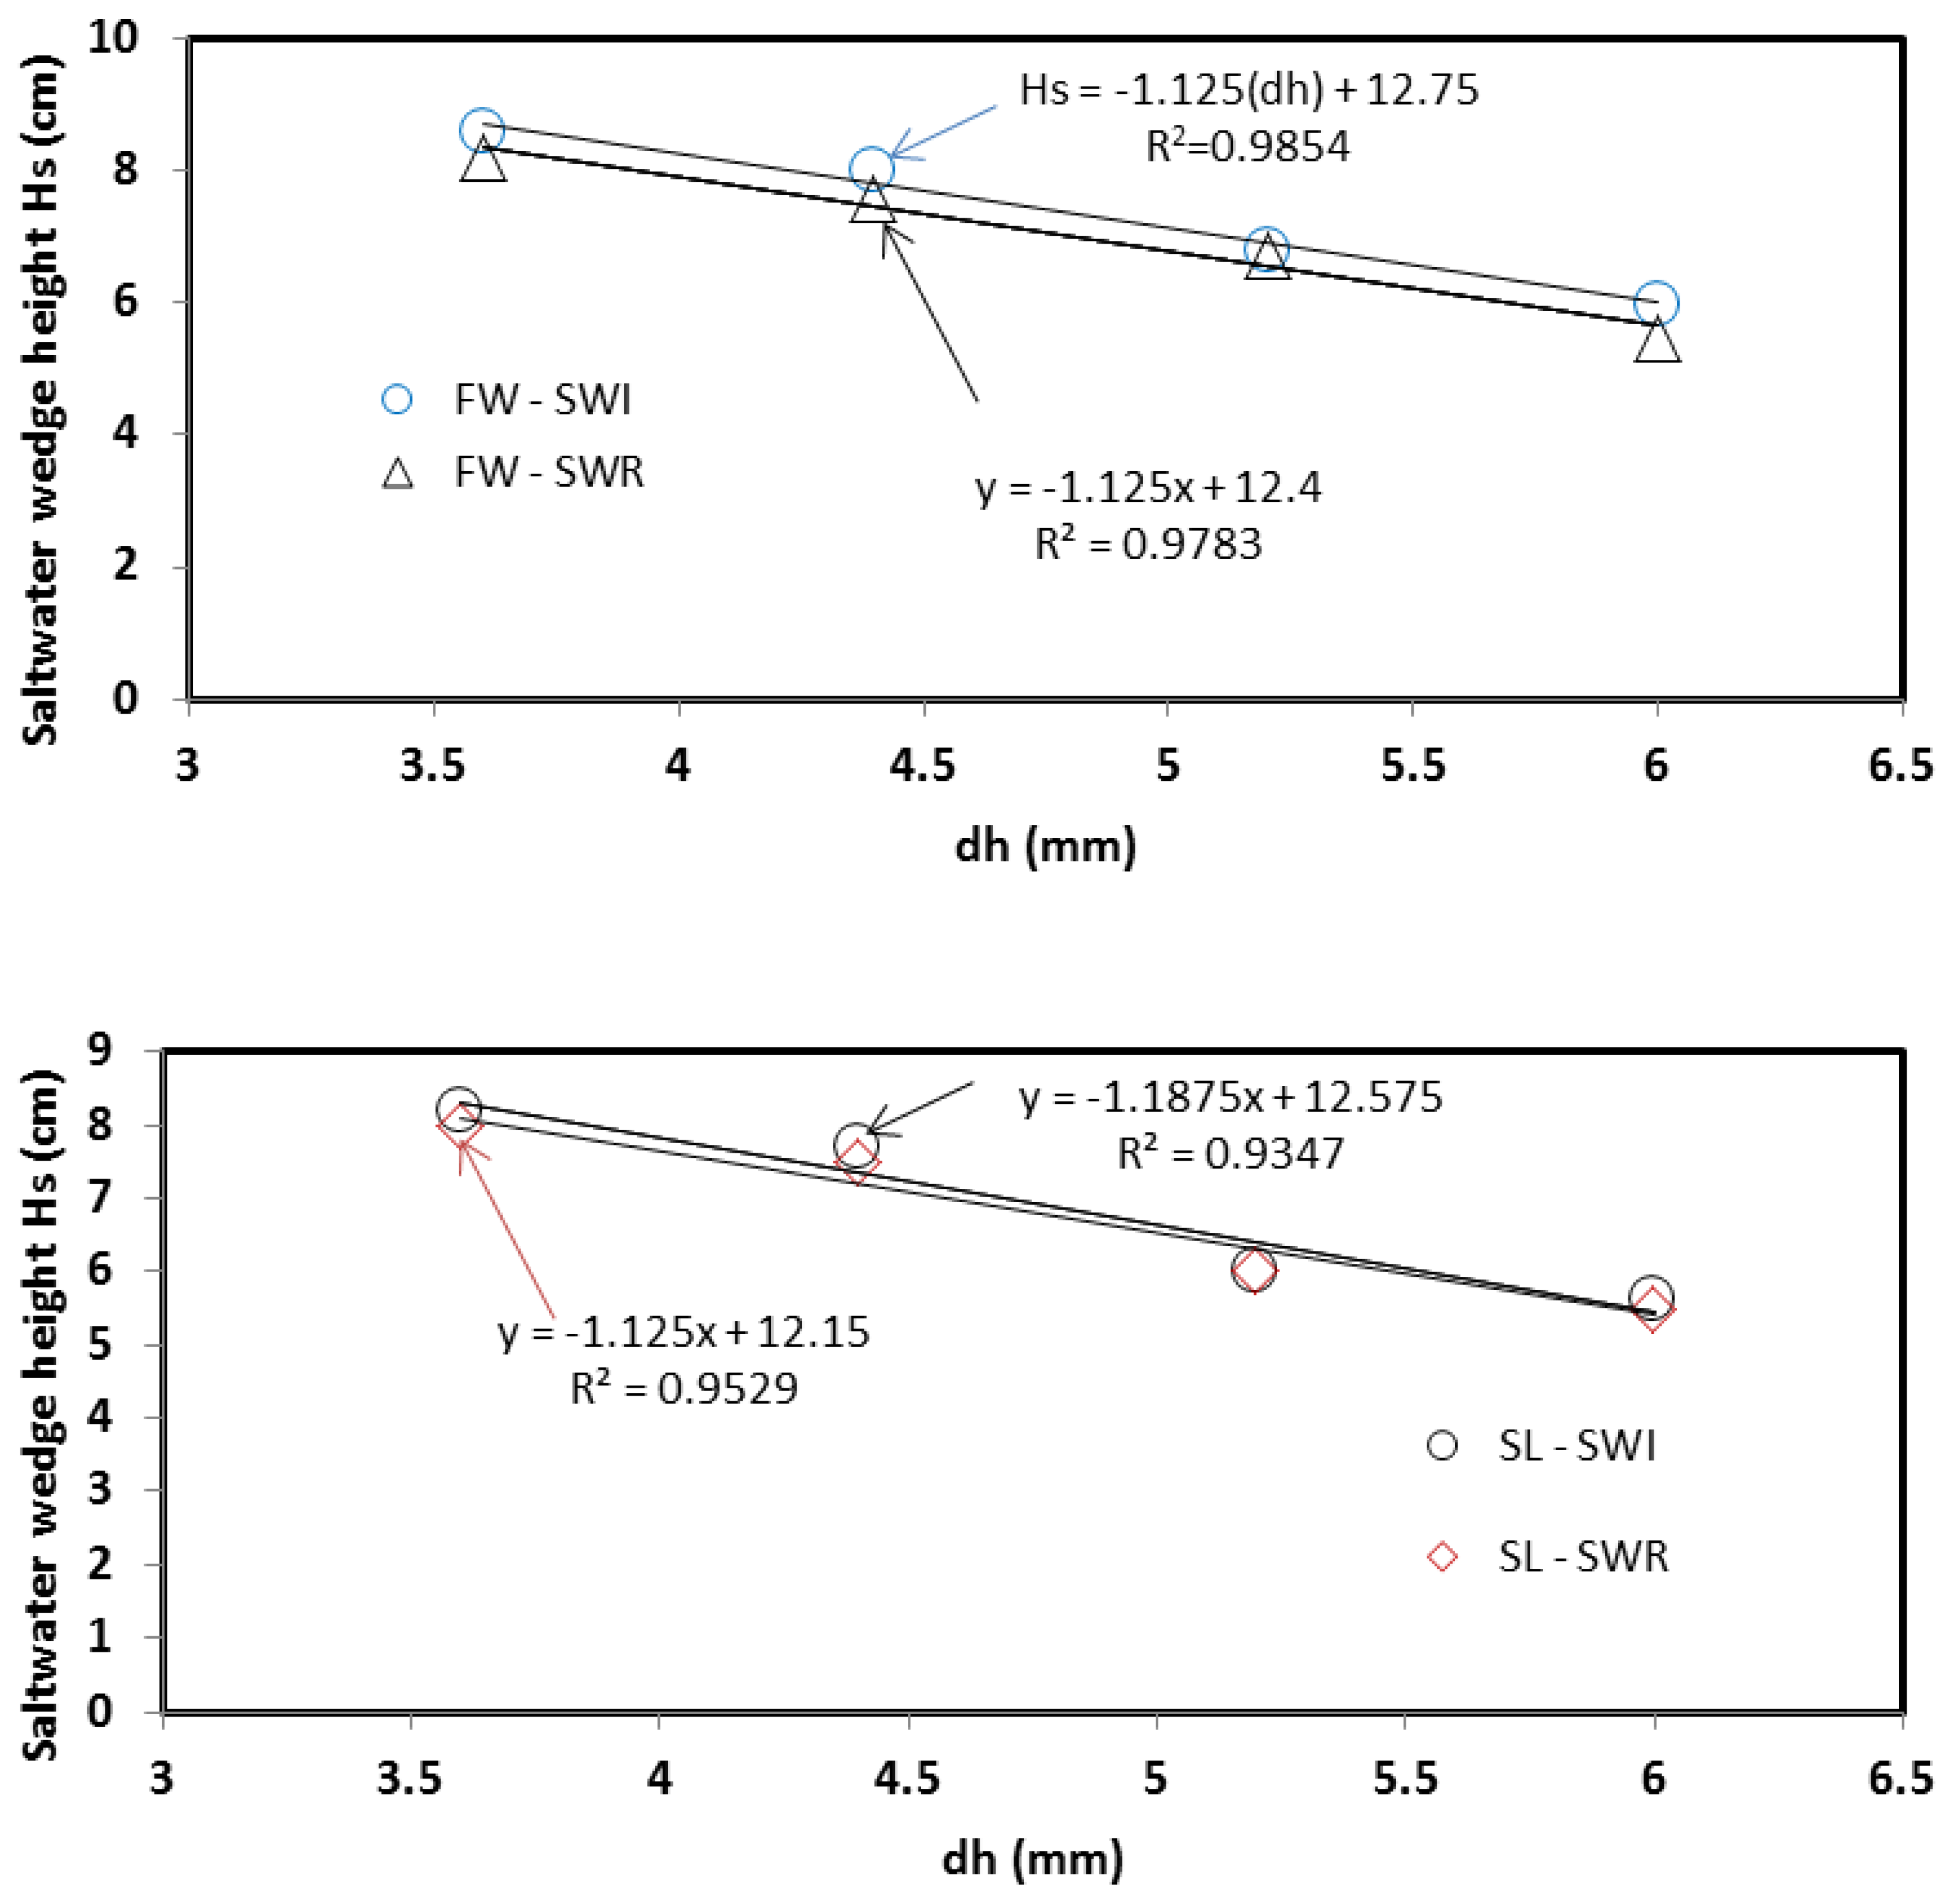
The height of the saltwater wedge along the coastline Hs (see Figure 1) is also an important metric quantifying SWI in coastal aquifers [5,13]. The current experimental data show that Hs linearly correlates with the head difference in both FW and SL scenarios (Figure 7). Again, a simple linear correlation of type Hs = c(dh) + d could be derived, with c and d being constants and depending on the system. The values of c and d for the current configuration are shown in Figure 7, with c being negative as the decreasing in dh would obviously lead to an increase in the height of the saline water along the coastline. Intuitively, decreasing the freshwater level would induce a lower resistance to the advancement of the denser saline water at the top end of the coastline boundary. The coefficient d is a limiting value corresponding to the value of Hs for dh = 0. There is almost no difference in the regression coefficients in the case 1325 (not shown for brevity) for similar head change. This suggests that the rise of the intruding saltwater along the coastline was not affected by the change in permeability of the aquifer. Note that the linearity of the relationship was demonstrated for both the advancing and retreating phases, as shown in Figure 7.
3.2. Numerical Validation
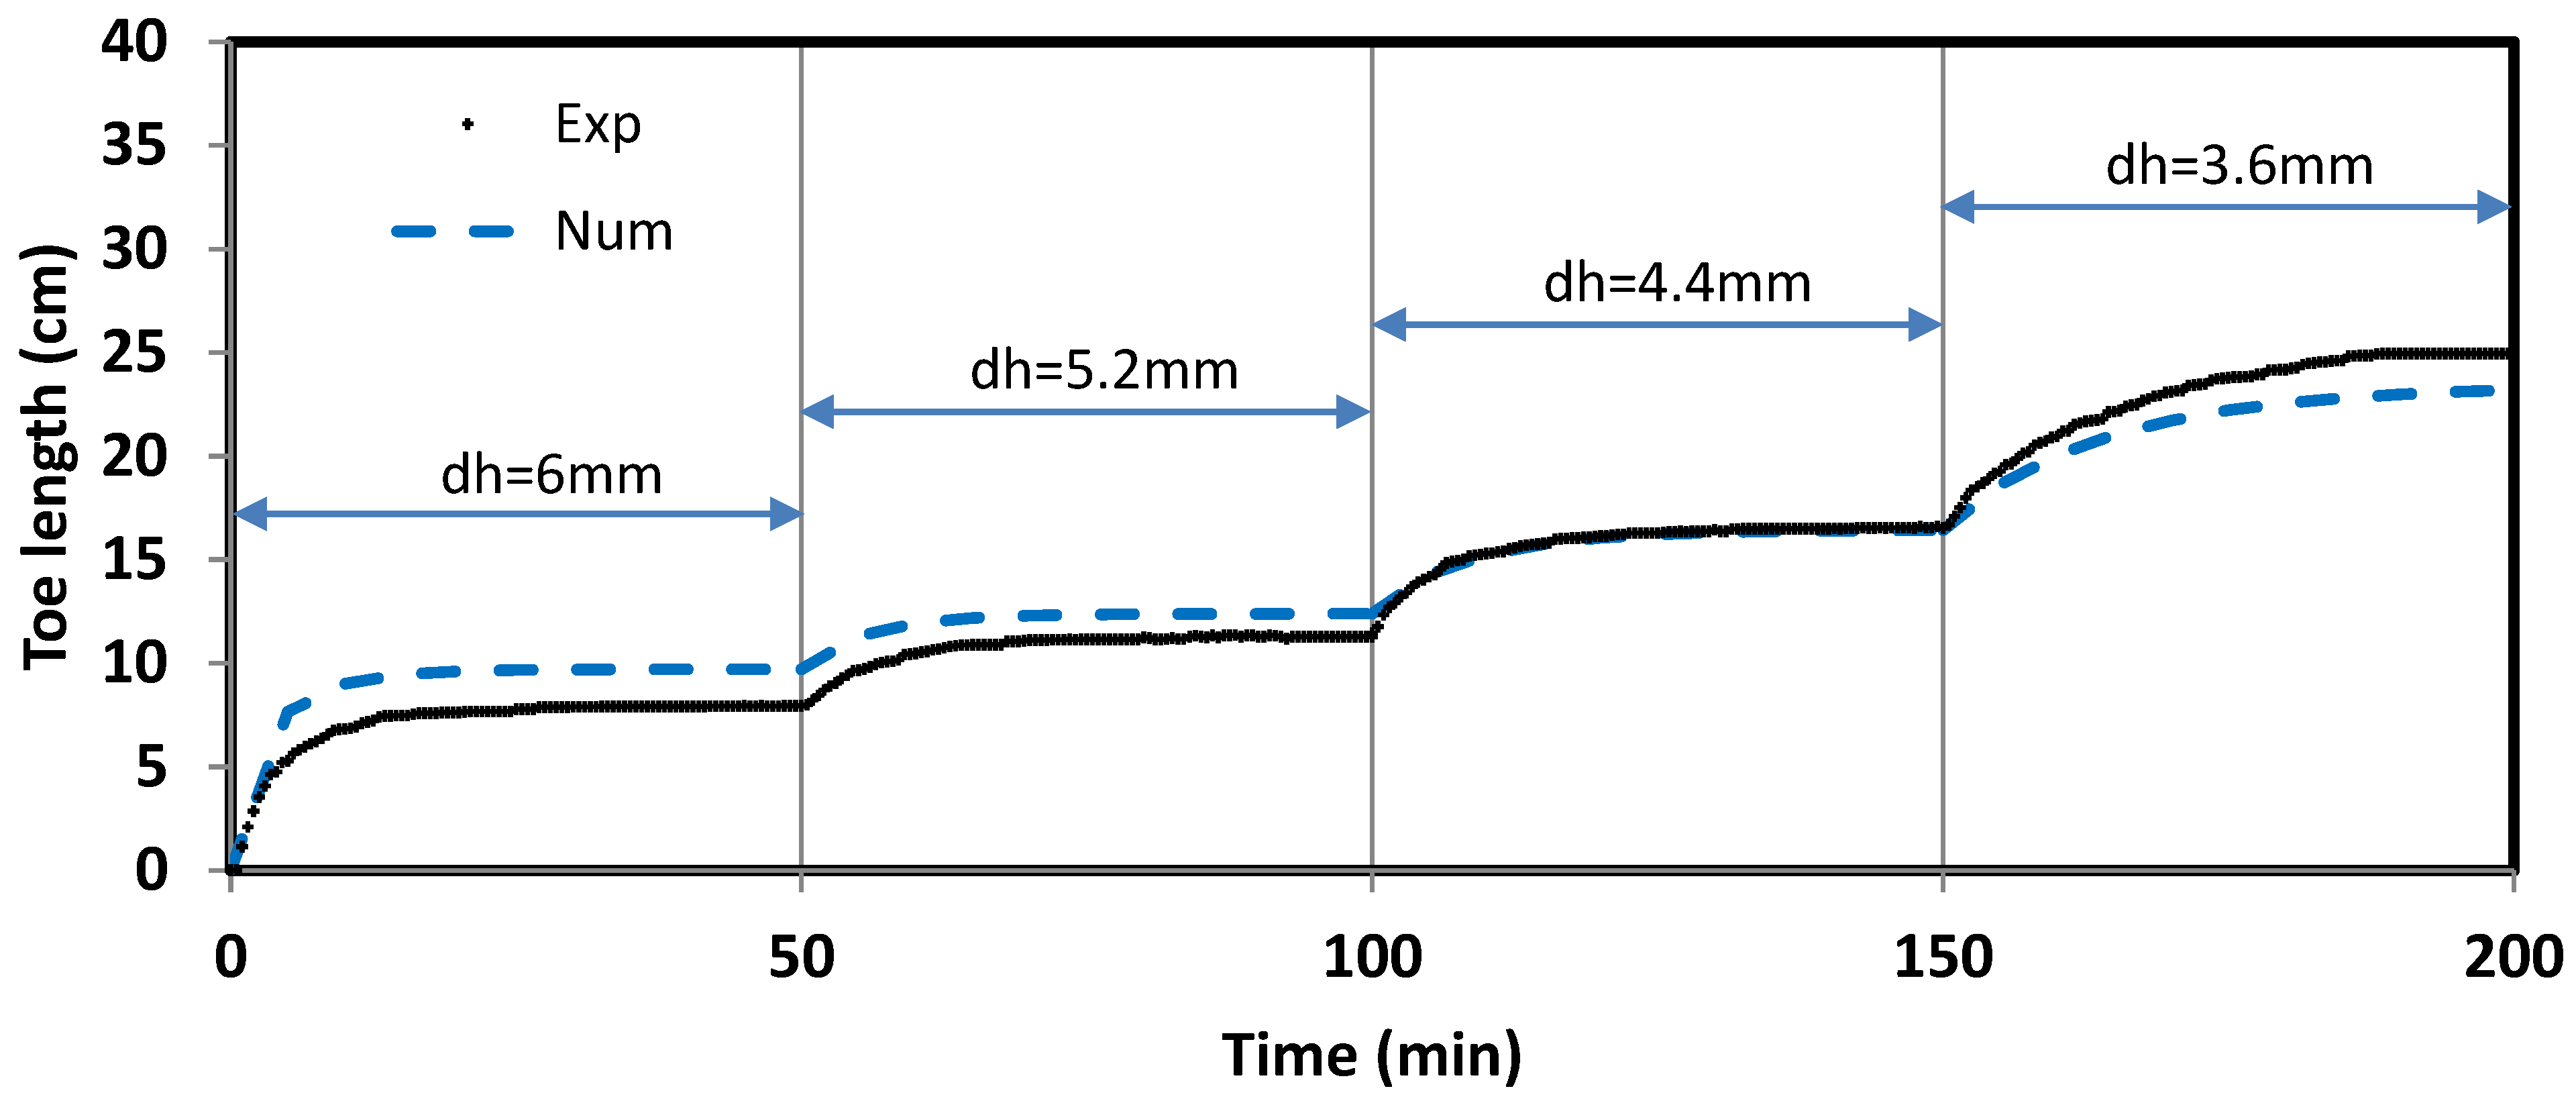
The comparison between the experimental data and the numerical simulation results is shown in Figure 8. The case 1090 FW was adopted for the validation of the model. Overall, the numerical model predicted well the transient motion of the saltwater wedge for all the hydraulic gradients applied to the system. The toe length was slightly overestimated by the model at the beginning of the intrusion (t = 0–50 min) while somewhat underestimated towards the end (t = 150–200 min). In overall, the results show that the transient toe movement was reasonably well predicted by the numerical model. The maximum percentage difference was 10, 1, and 7% for dh = 5.2, 4.4 and 3.6 mm, respectively. Some mismatch could be observed at the start of the experiment (dh = 6 mm), where the toe penetrated faster and deeper in the numerical than in the physical model, yielding a maximum percentage difference recorded of nearly 21%. These small discrepancies could be the result of some minor heterogeneities, mainly resulting from the packing of the beads, while the model assumes perfect homogeneous conditions.
3.3. Sensitivity Analysis
Additional numerical simulations were conducted to explore the effect of some hydrogeological parameters on the coefficients of the derived empirical equations. The sensitivity analysis was performed based on case 1090, and only the scenario involving inland freshwater variations (FW scenario) was considered here.
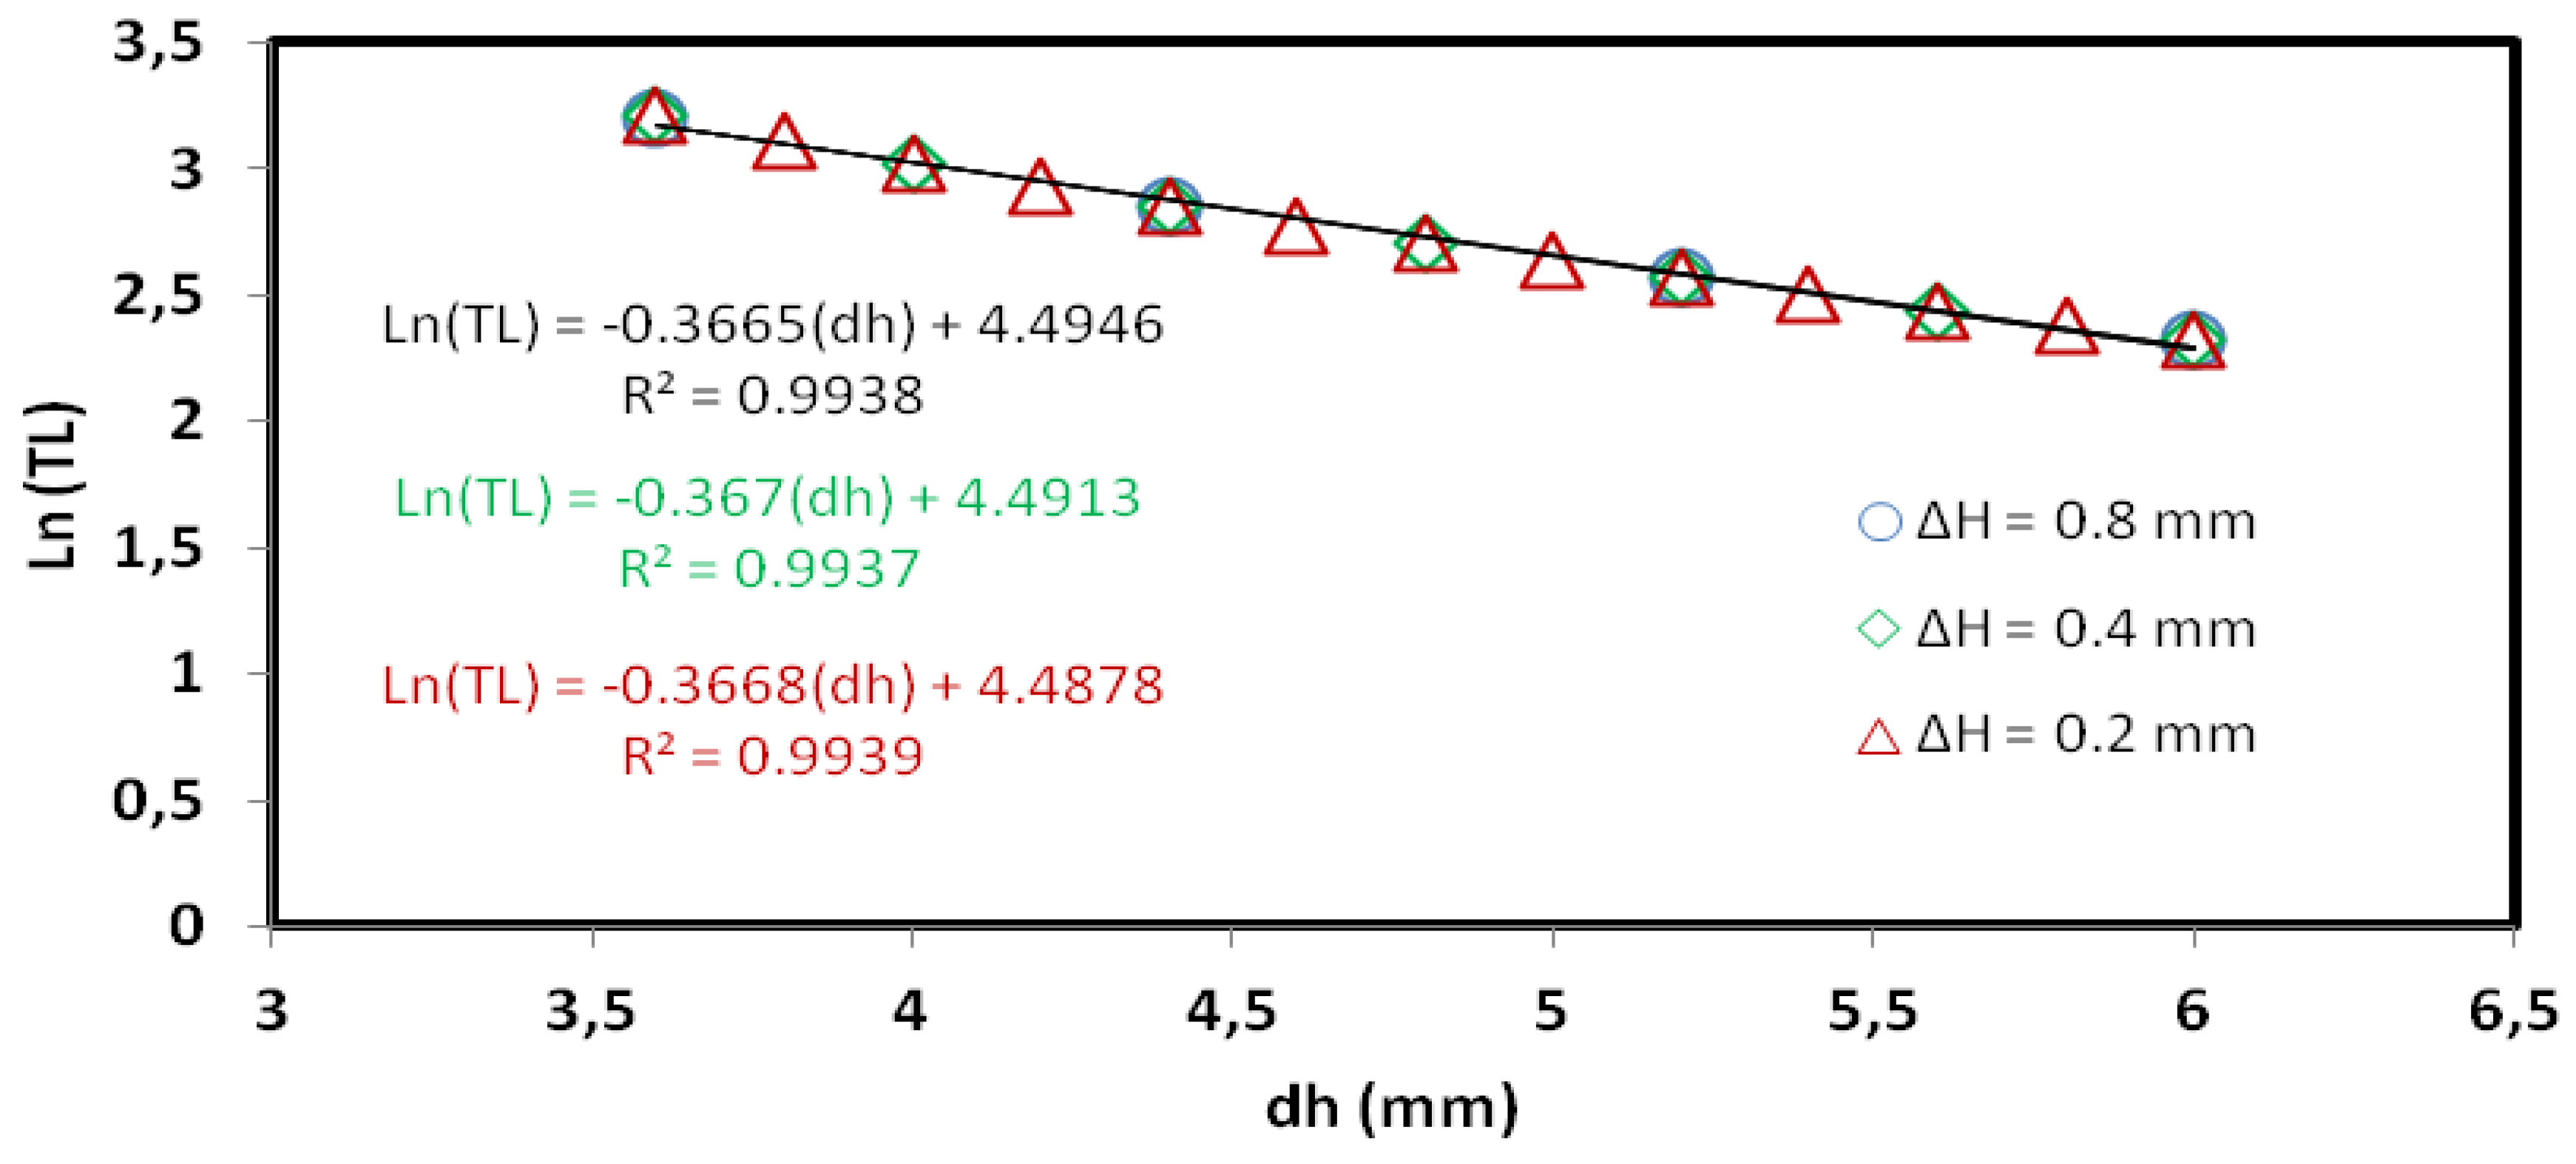
The magnitude of head incremental change ∆H was the first parameter that was investigated. The variations in the rate of inland head change induced no effect in the regression coefficient values as well as in the linearity of the correlation of the derived equations (Figure 9). Three ∆H values were tested, namely, 0.2, 0.4, and 0.8 mm. The coefficients a and b remain nearly identical for all the ∆H values, and the coefficient R2 was superior to 0.99 in all cases. The linearity of the correlation is independent of the rate of head change, which is particularly important considering that coastal groundwater are generally associated with great variations in the water table often as a result of seasonal variations or as intermittent sea-level fluctuations (tides) in the opposite scenario.
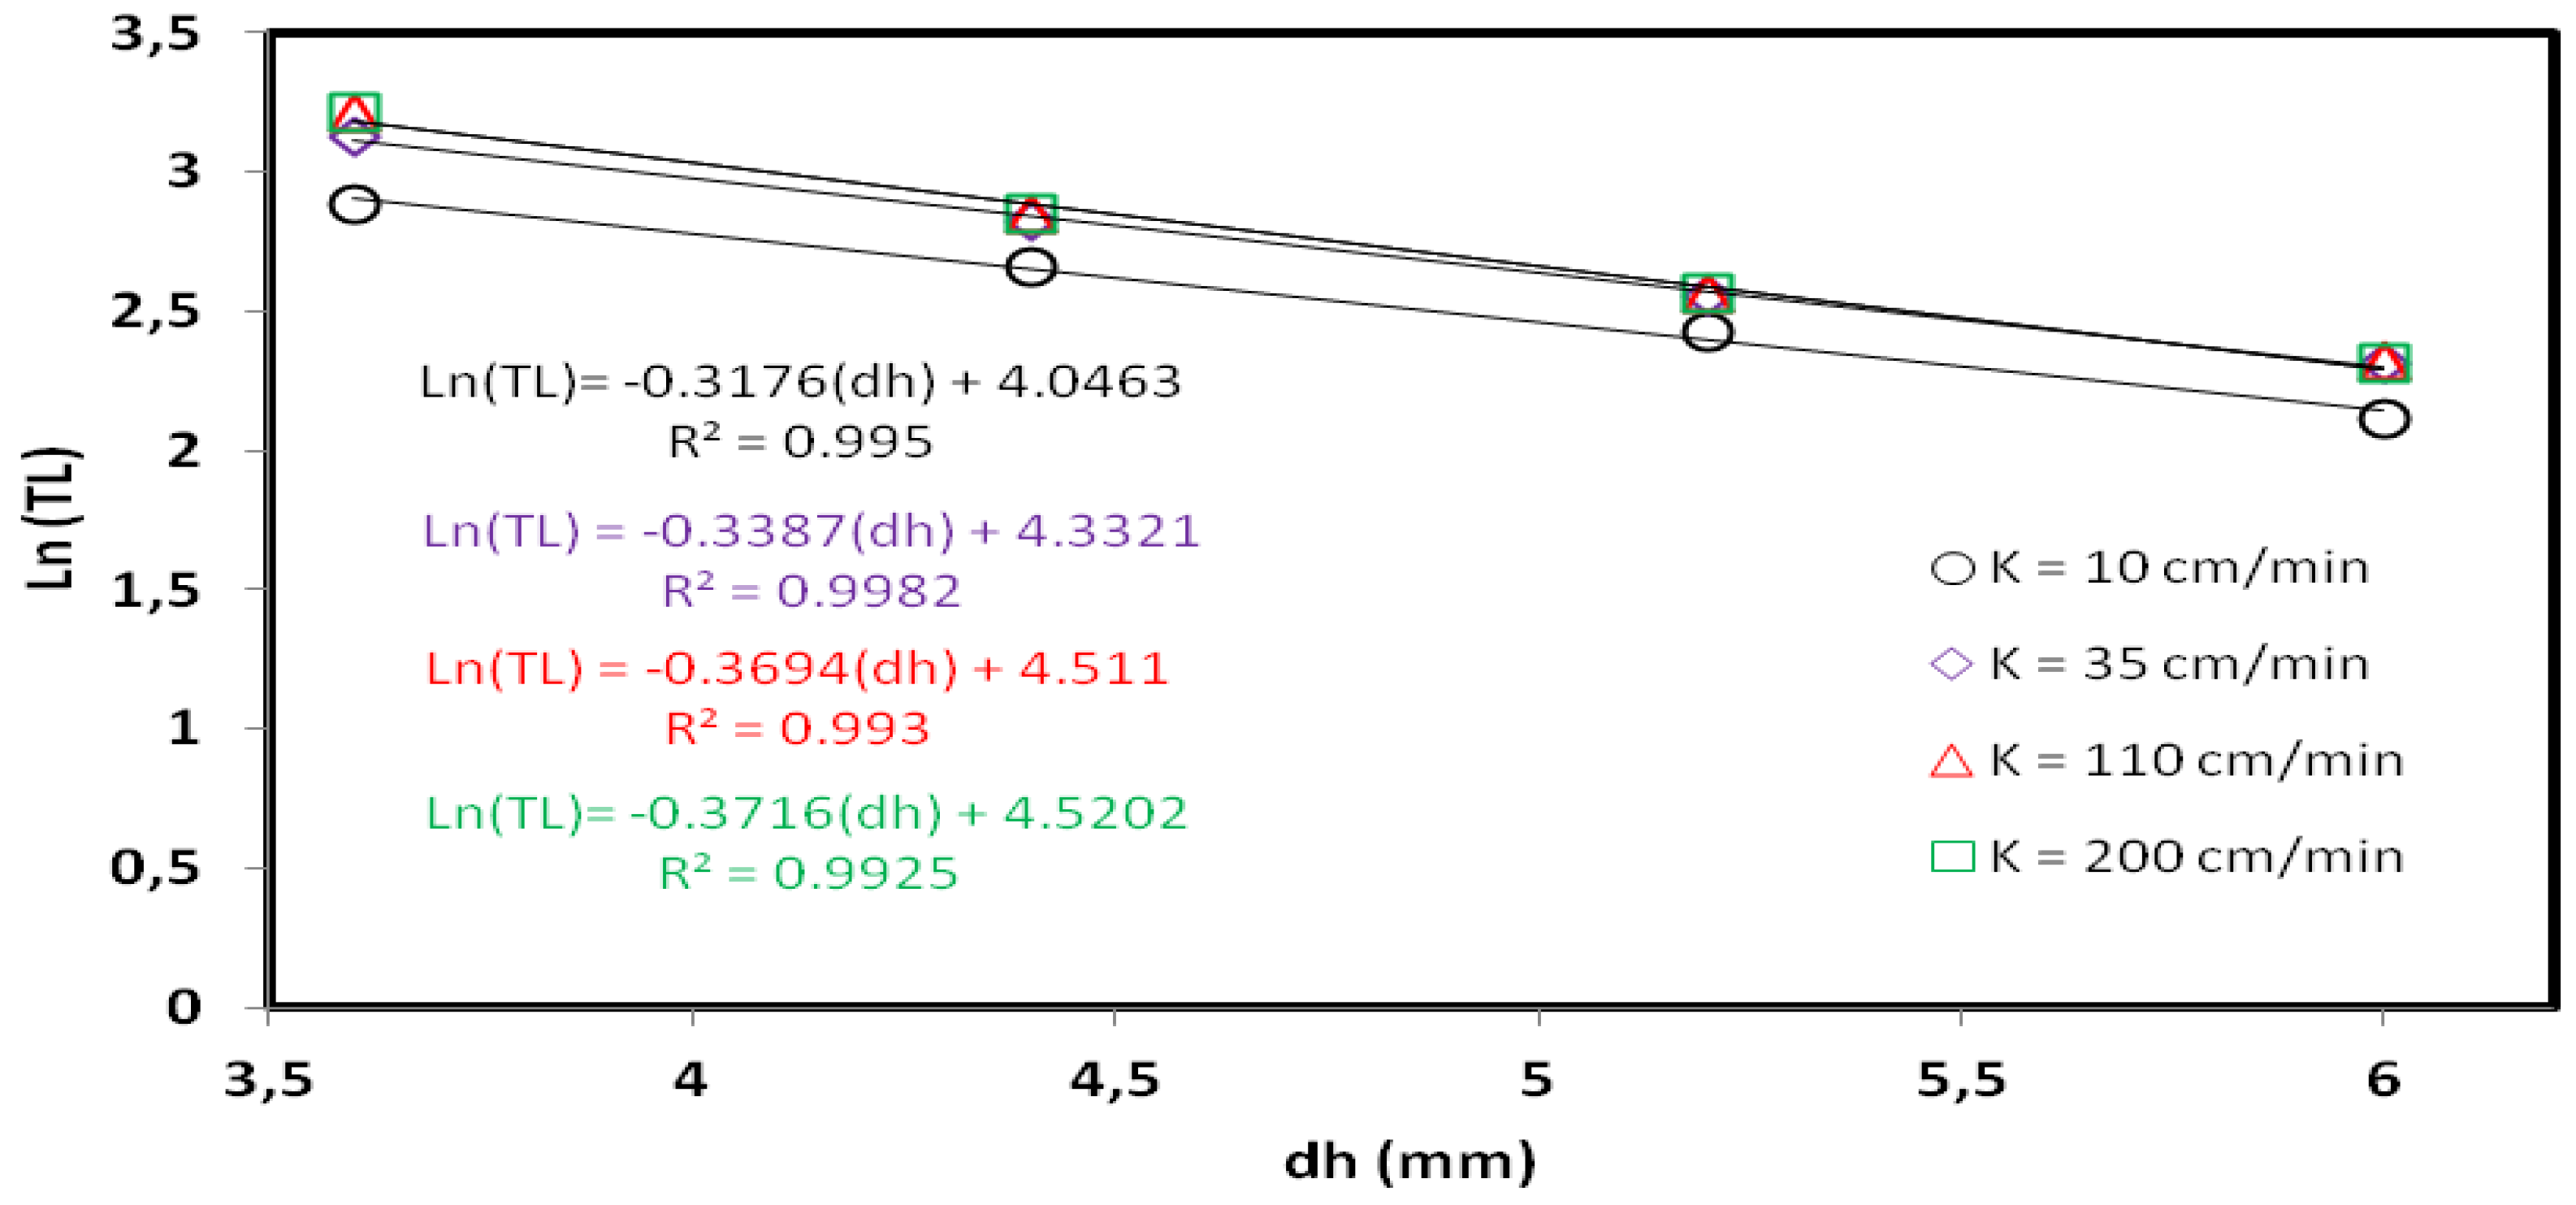
The sensitivity of the regression parameters to the hydraulic conductivity k was investigated over a range of 10–200 cm/min. The increase in the hydraulic conductivity induced a slight increase in the intrusion length and then settled for higher k values (Figure 10). Observing the trend of the coefficients, it appears that the increase in k primarily induced a continuous decrease in the constant a from −0.3176 at k = 10 cm/min to −0.3716 at k = 200 cm/min, respectively. The sensitivity of the toe length is higher for lower values of dh, as expected. The vertical movement of the slope is reflected by the coefficient b, which also increases with increasing k, but becomes constant at higher k values, which indicates faster and larger intrusion for increasing k, for equivalent dh decrements. These results are consistent with previous studies e.g., [9,13]. A good linear relationship was exhibited for all the k values tested here, as reflected by the relatively high correlation coefficient R2 values.
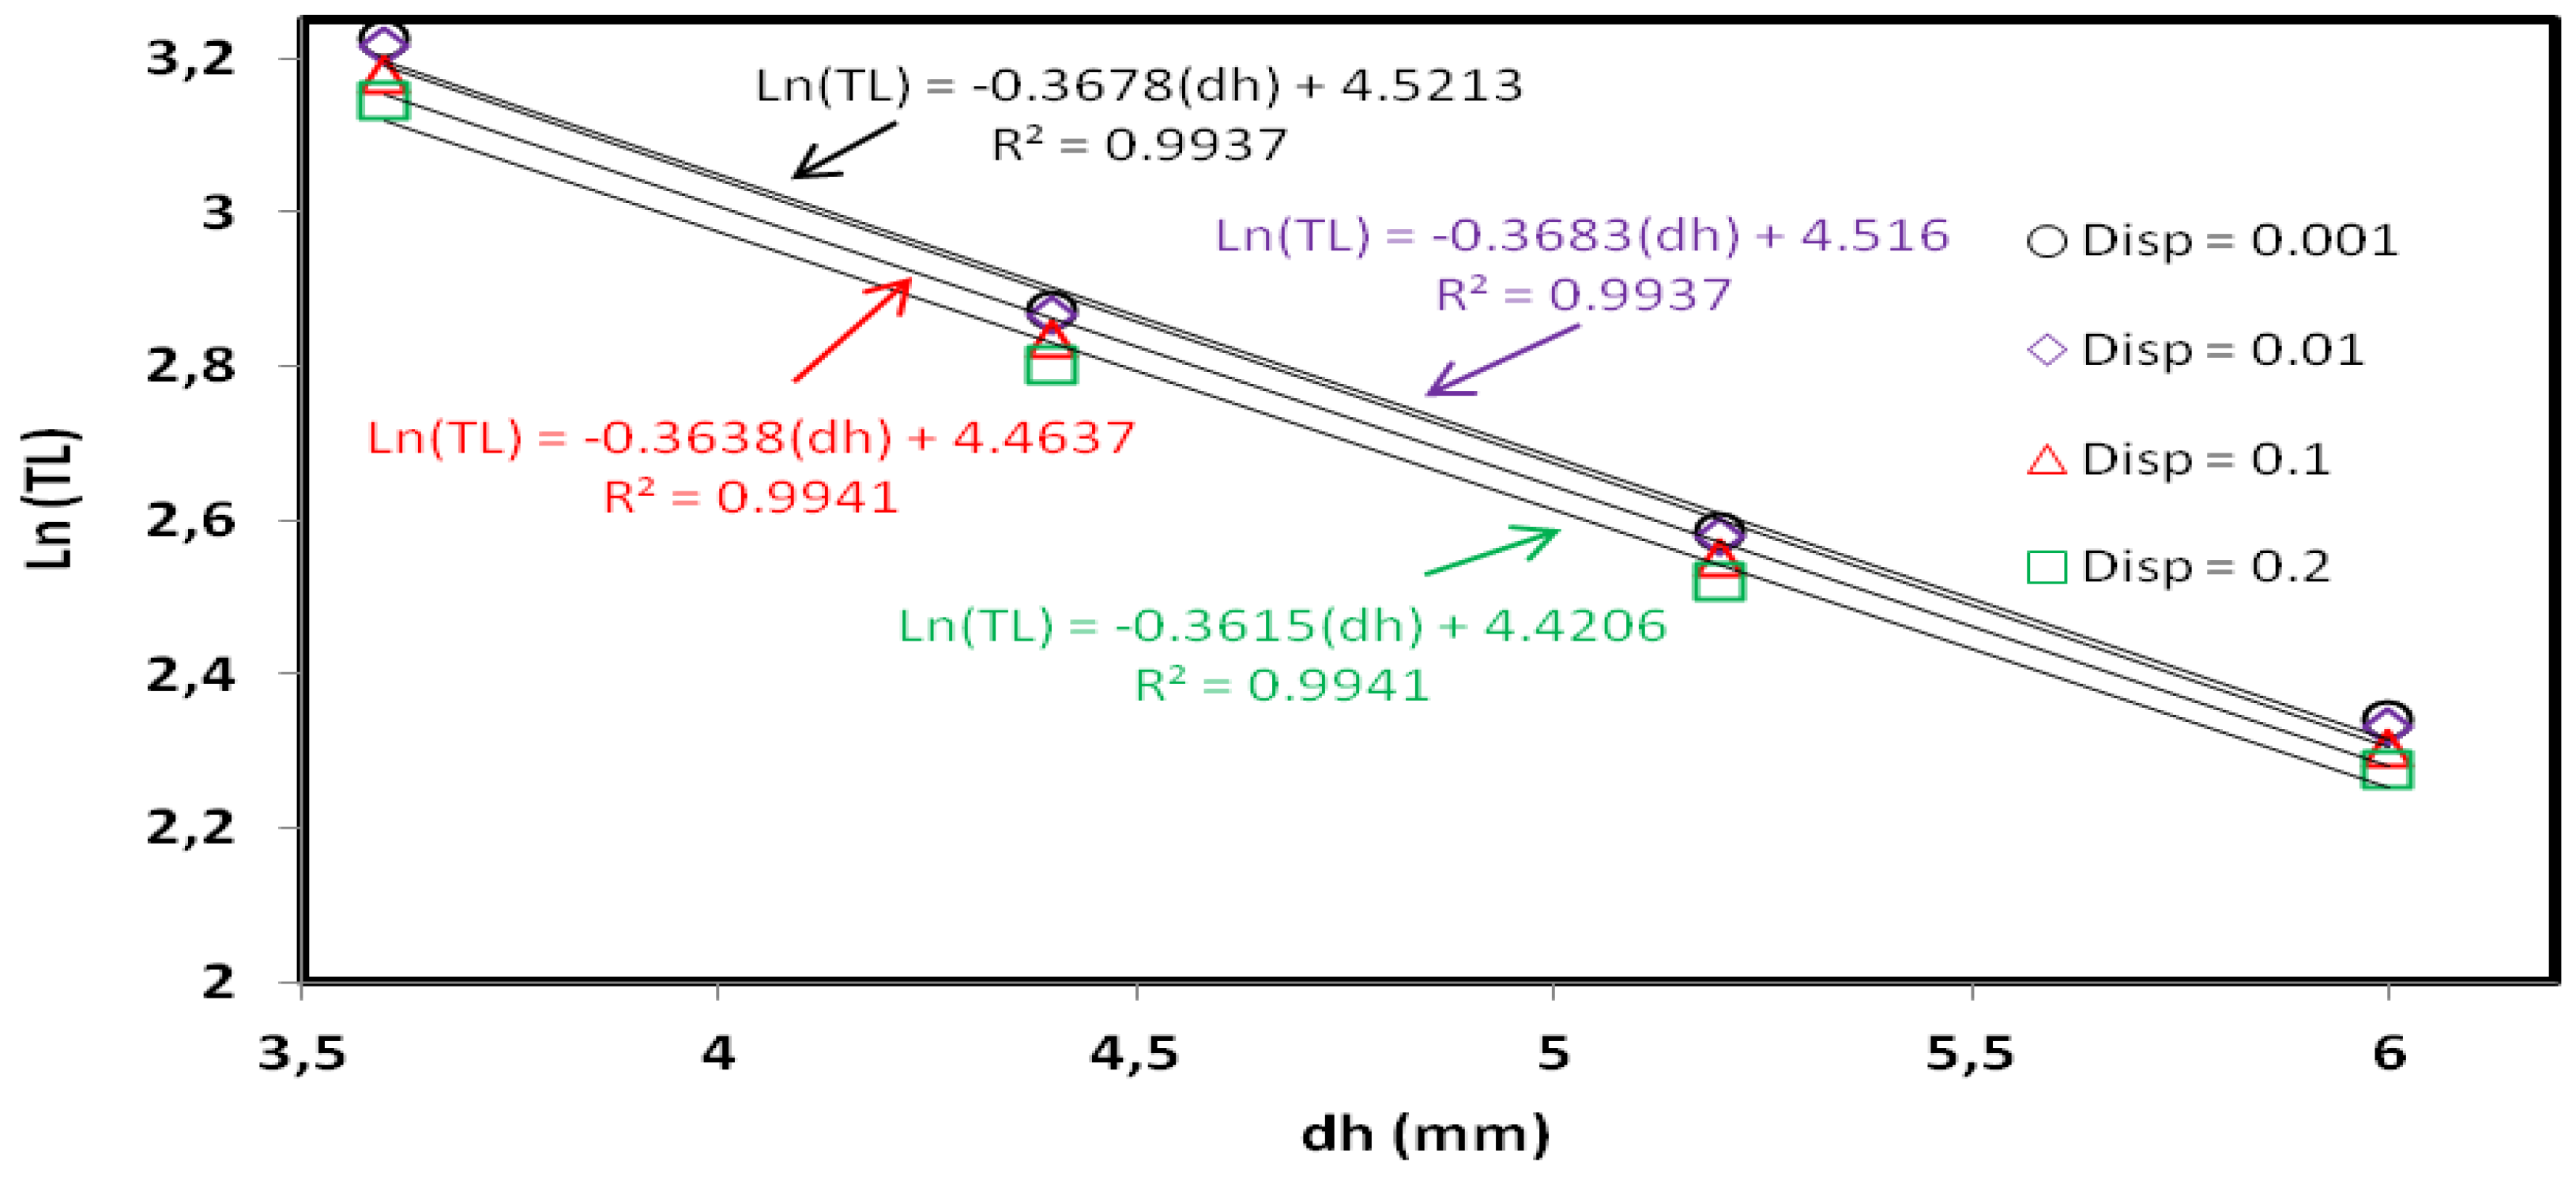
The sensitivity of the coefficients of dispersivity was also explored. The data demonstrate strong linearity of the equations derived for the various values of dispersivity tested here (Figure 11). The decrement of the dispersivity values yielded an increase in the intrusion length. The dispersivity varied in the range of 0.001–0.2 cm, from which four values were selected. The longitudinal to transverse dispersivity ratio remained constant. Modifying the dispersivity did not affect the slope of the regression lines in all cases, which is manifested by a relatively steady constant a. The coefficient b was, however, found to slightly decrease with increasing dispersivity, indicating that in response to the same head difference dh applied, smaller toe length values would be exhibited for larger values of dispersivity.
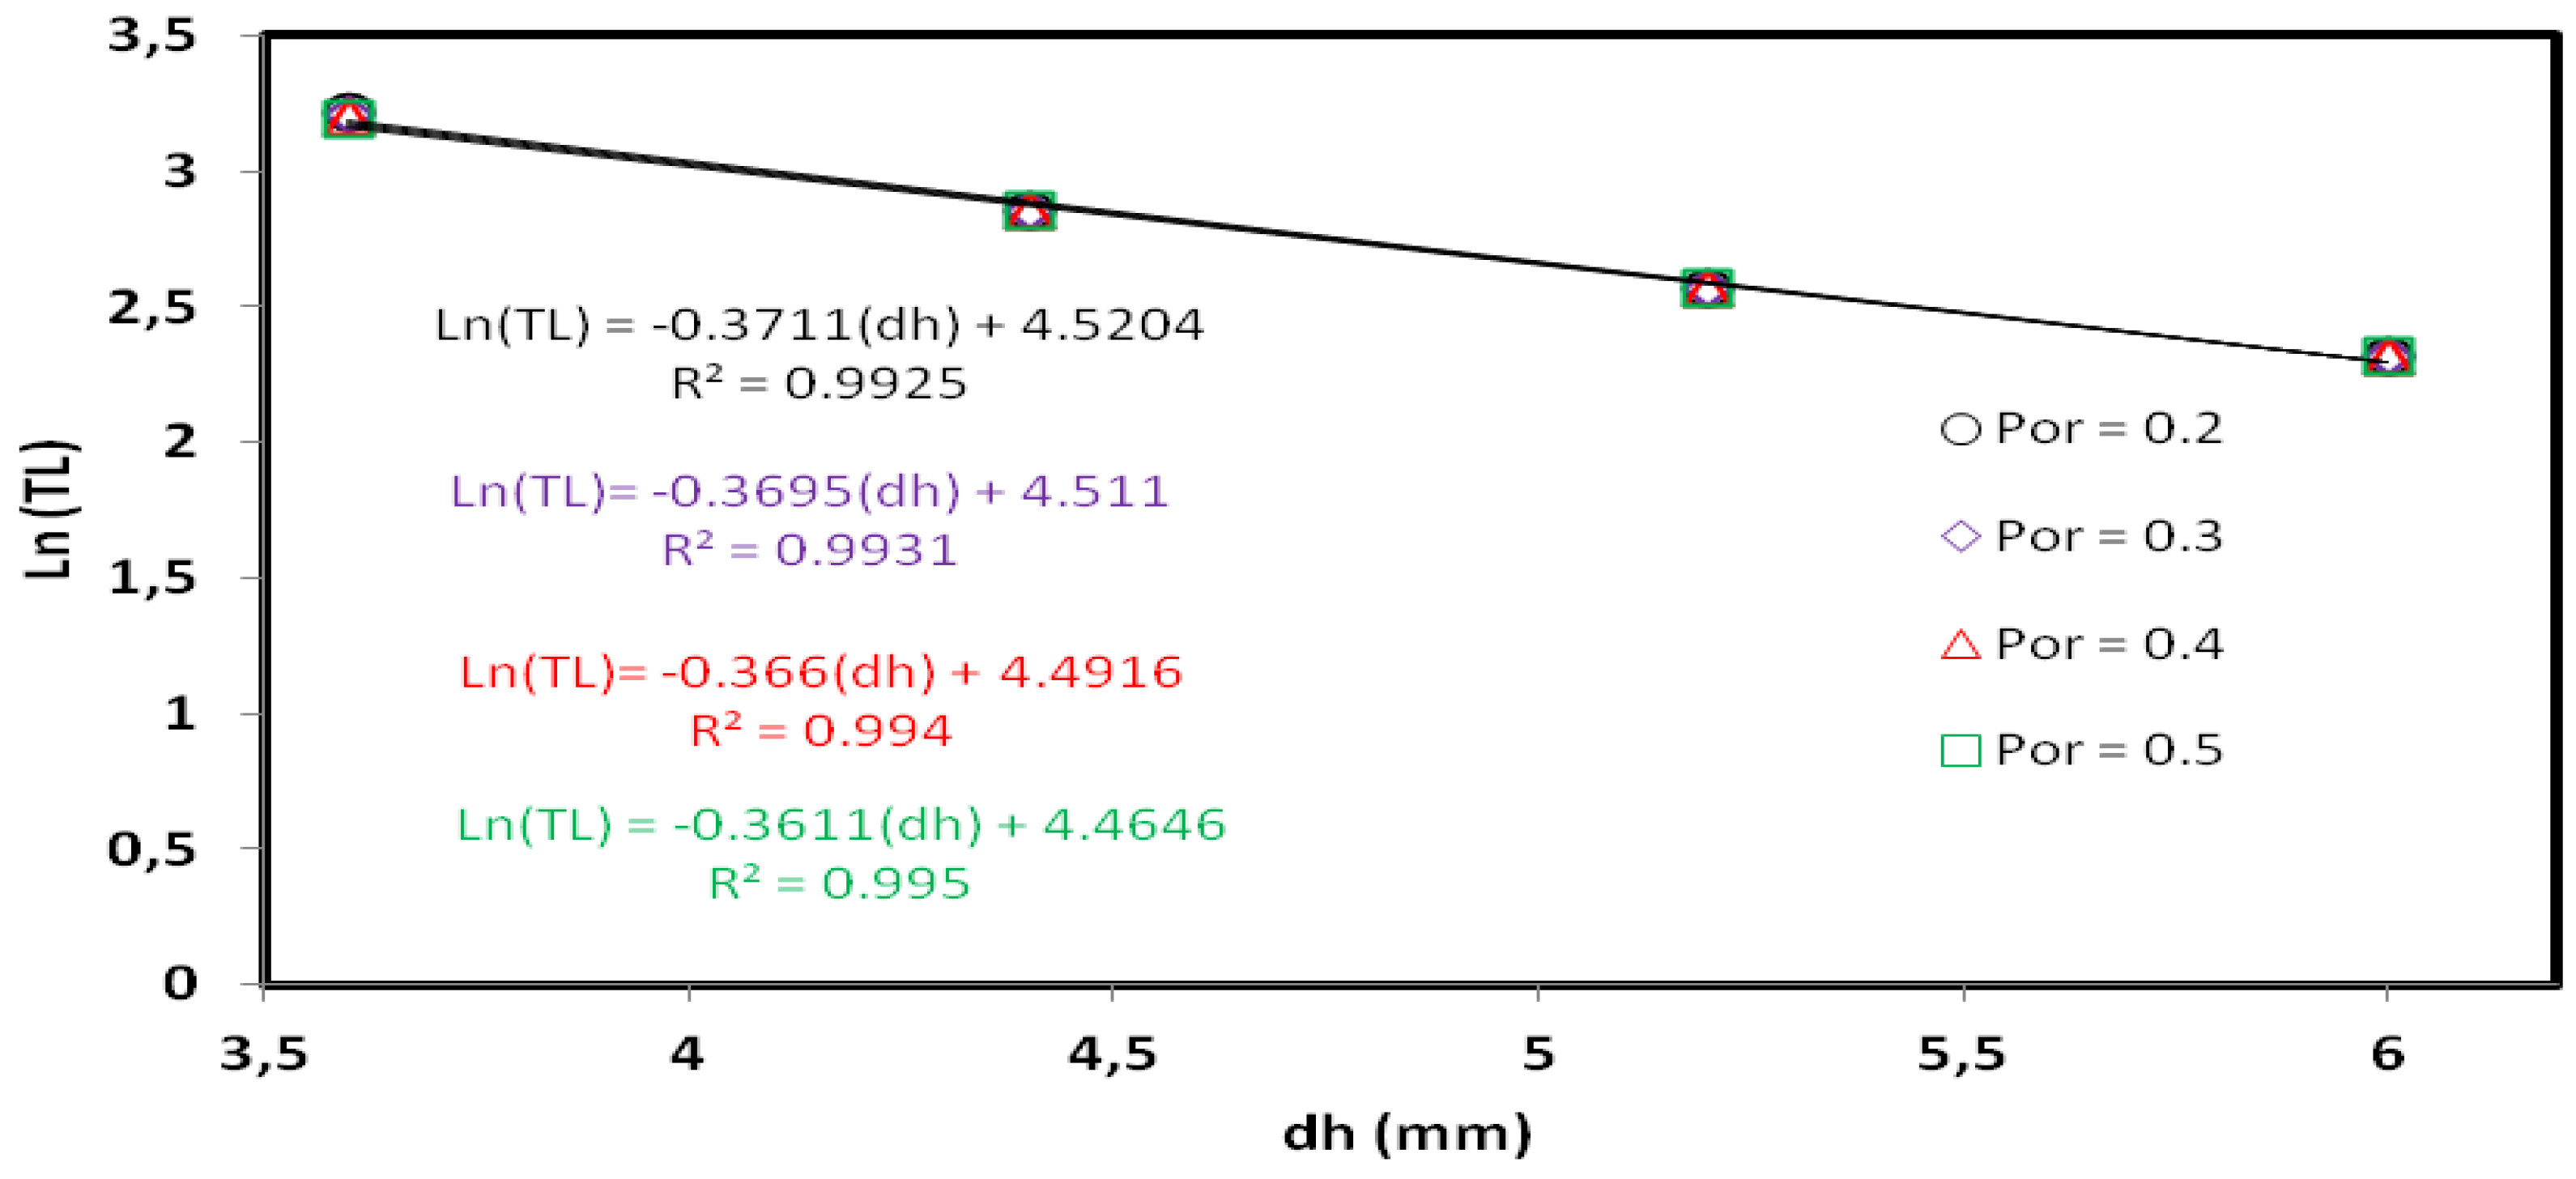
The influence of the porosity on the regression coefficients was explored in the range of 0.2–0.5 (Figure 12). The regression coefficients remain nearly the same for all the values tested and no specific trend was observed, albeit the coefficient very slightly increases with decreasing porosity value, indicating slightly larger saltwater wedge toe penetration as a result of the decreasing porosity of the system for equivalent dh decrement. This very little change, however, confirms that varying the porosity of the system has a negligible effect on the extent of the seawater wedge, which agrees with previous studies e.g., [12]. Again, a perfect linear relationship was established for the derived equation for all the values of porosity tested, reflected by the high values of the coefficient of determination R2.
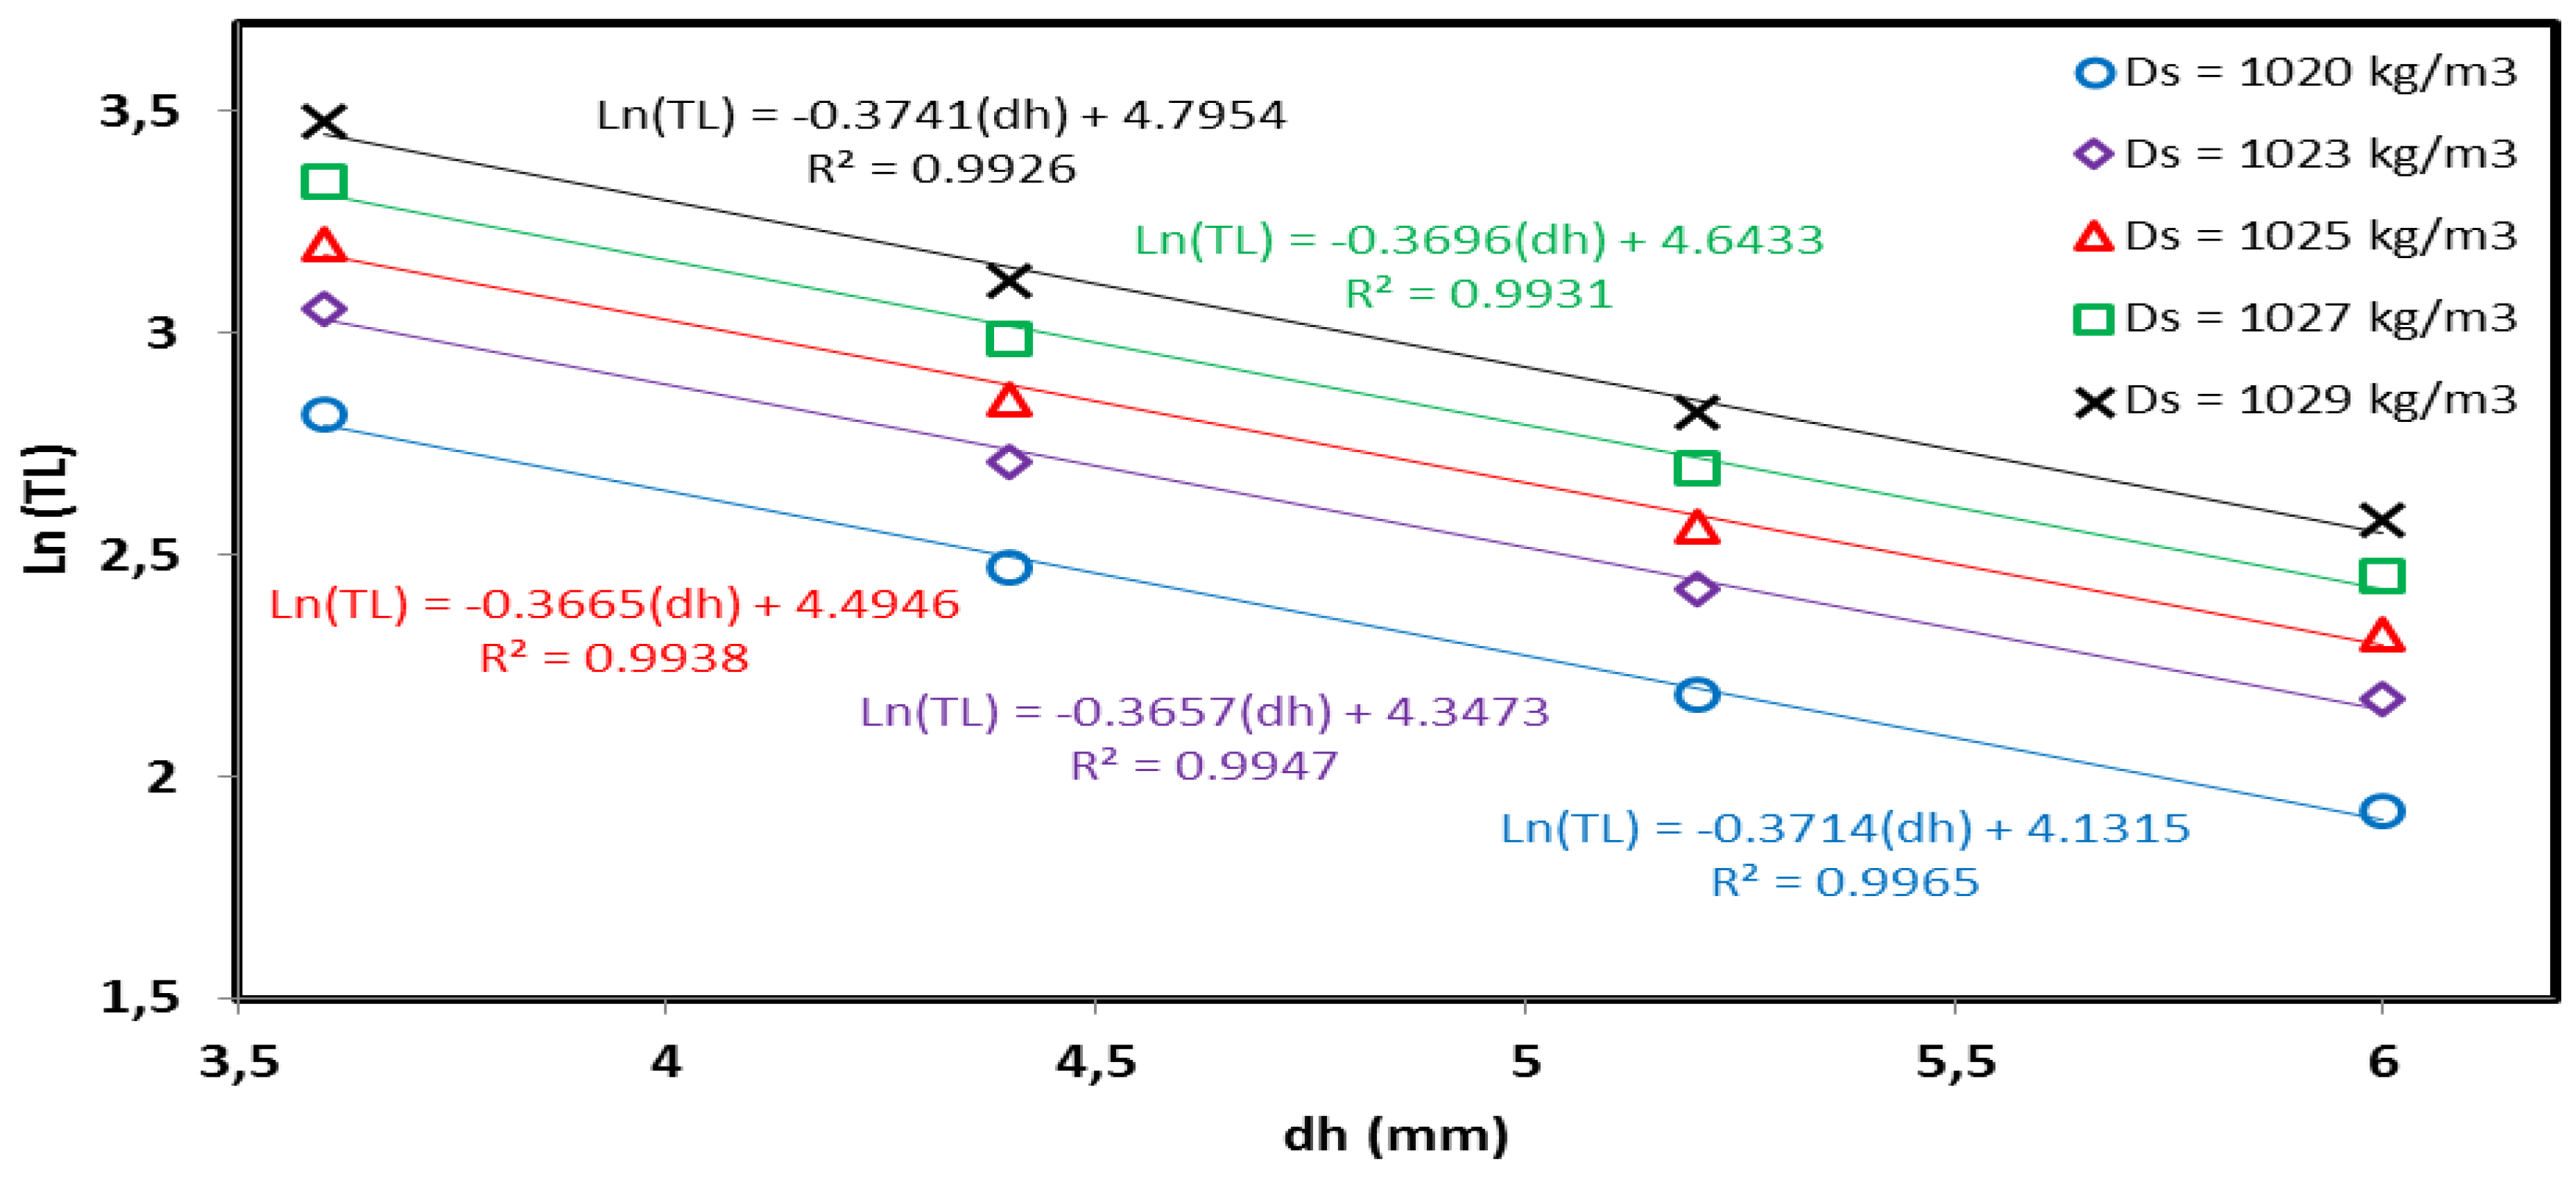
The effect of the saltwater density on the regression coefficients was explored in the range of 1020–1029 kg/m3 (Figure 13). The results demonstrate the linearity of the equations established for the various densities tested. The regression coefficients, as well as the coefficient of determination, are shown in the figure. The slope of the regression line was nearly the same in all cases, while the coefficient b continuously increased with increasing density. This result means that the intrusion length would be substantially larger for higher density values in response to a similar head difference, as expected. Likewise, a perfect linear relationship was established for the derived equations for or all the values of density tested.
3.4. Field Scale Modelling
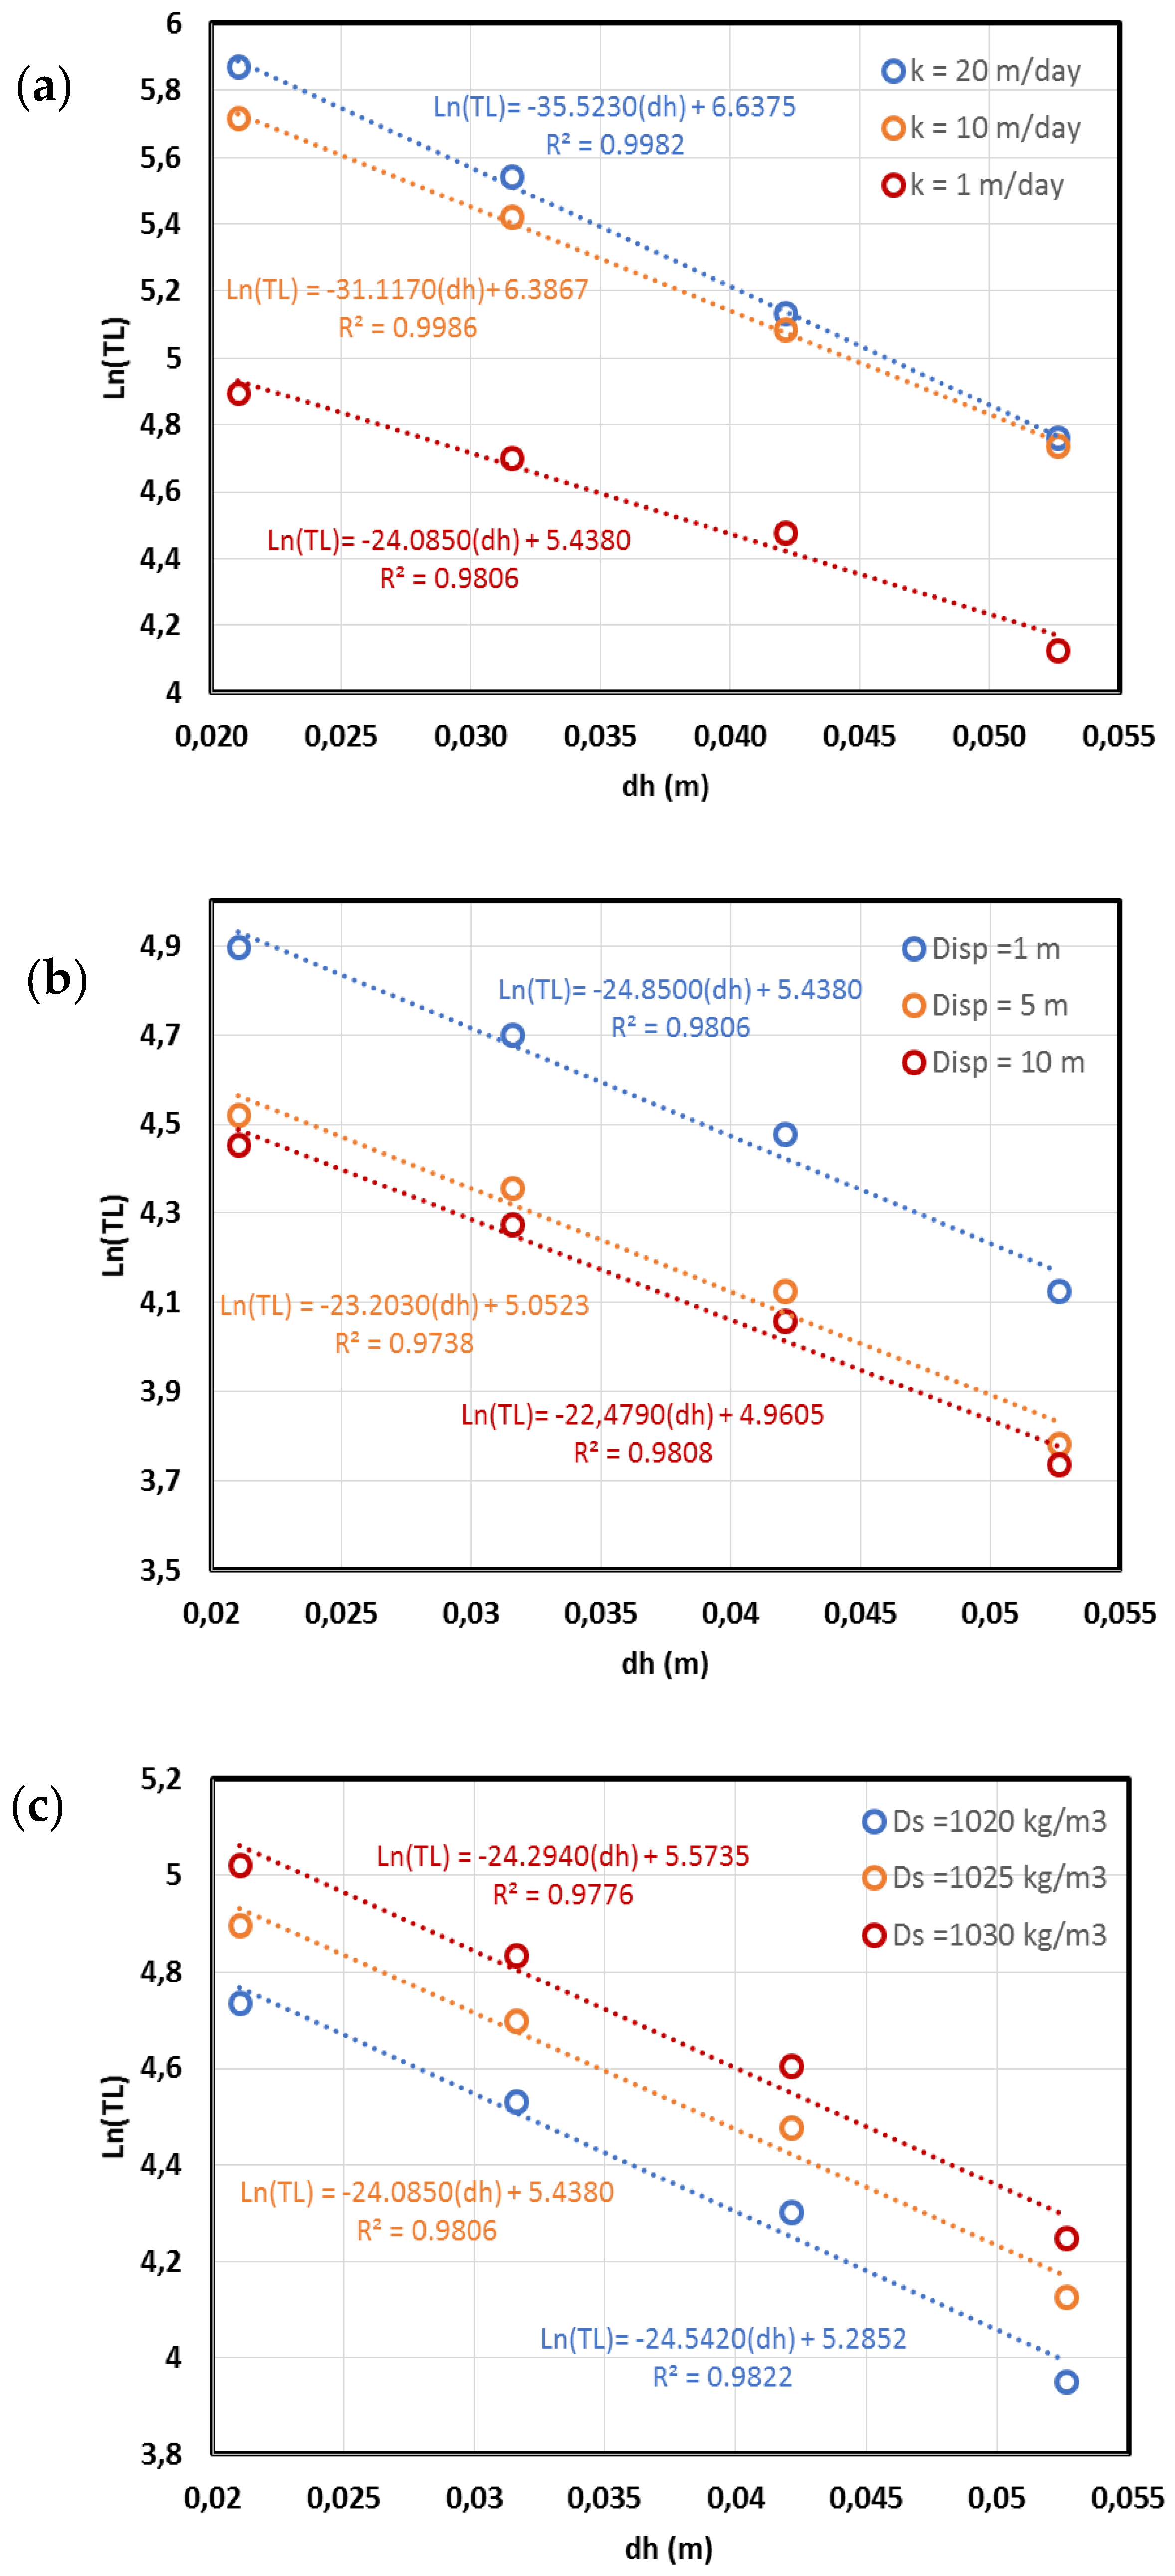
A field-scale aquifer model was developed to further examine the existence of a linear relationship between the logarithmic toe length and the head difference in realistic coastal aquifer conditions. The dimensions of the model were 400 × 1 × 20 m (x, y, z) such that x represented the horizontal length of the aquifer perpendicular to the coastline, z was the aquifer thickness, and y was the longitudinal width of the aquifer along the beach. The seawater intrusion process therefore occurred along the (x, z) plan. The grid dimensions were 2 × 1 × 1 m in the x, y, and z directions, respectively. The hydraulic conductivity of the homogeneous aquifer was set to 20 m/day. The longitudinal dispersivity was set to 1 m, with a transversal dispersity of 0.1m. The saltwater density was set to 1025 kg/m3, with the seawater head boundary fixed at 19 m. A variable head was set at the freshwater boundary, which was gradually decreased from 20 m to 19.4 m with a constant step of 0.2 m, yielding four different head differences, specifically dh = 0.053, 0.042, 0.032 and 0.021 m. The resulting saltwater wedge toe length values following the various head changes were 117, 170, 256, and 355 m, respectively. Each stress period was run for 5000 days (over 13 years) such that to ensure the system reached a quasi steady-state equilibrium. A series of simulations were subsequently conducted for different values of hydraulic conductivity, dispersivity, and saltwater density, so as to explore the linearity of the derived relationship in various hydrogeological conditions within the field-scale aquifer model (Figure 14).
The results evidence that a very good linear relationship was exhibited for all the k values tested here, as reflected by the high correlation coefficient R2 values (>0.99) (Figure 14a). As expected, the regression parameters a and b were very sensitive to the hydraulic conductivity, both of them continuously decreasing with increasing k. For a given dh applied, the increase in the toe length values was substantially greater from k = 1 m/day to k = 10m/day, than from k = 10 m/day to k = 20 m/day, despite the magnitude of k change being constant (10 m/day). Similarly, the data demonstrate the strong linearity of the derived equations for all the dispersivity values tested (Figure 14b). The results show that the slope of the regressions lines was affected by dispersivity changes, whereby decreasing dispersivity induced decreasing a values. However, the coefficient b was found to increase with decreasing dispersivity, suggesting smaller toe length values for larger dispersivity values, for an equivalent head difference, as expected. The linearity of the derived relationships was also well demonstrated for all saltwater density values tested (Figure 14c). While the slope of the regression line was nearly the same in all cases, the coefficient b continuously increased with increasing density, suggesting greater toe length values for denser saltwater for a given head difference, as expected. Likewise, the perfect linear relationship was evidenced by high correlation coefficient R2 values in for all density cases.
3.5. Discussion
This investigation provided a pure steady-state to steady-state analysis of SWI with the aim to seek a correlation between the long-term seawater intrusion response and water level difference. In addition to demonstrating the reversibility of the intrusion mechanism, the outcomes of this study show for the first time the existence of a simple linear correlation between the logarithmic toe length and the head difference, in small-scale (physical and numerical models) and field-scale models for various sets of hydrogeological parameters. The set of empirical equations derived under laboratory conditions were validated by the small scale numerical model and further confirmed in the field-scale aquifer model, where the existence of a linear relationship between the logarithmic toe length and the head difference was investigated in more realistic scenarios implying various hydrogeological aquifer conditions. For prediction purposes, a minimum of two values of toe lengths associated with two water level differences would be required to estimate the regression coefficients.
This study was built over the examination of the transient processes associated with saltwater dynamics provided in our previous study [13], where key factors responsible for the mixing zone dynamics (widening/narrowing) were discussed and the intruding and receding rates of the wedges were compared to one another considering both freshwater and saltwater level fluctuations. As such, incorporating SWI cases under transient conditions was outside the scope of this present study.
Rather, this study explored in a very systematic and quantitative manner the evolution of the saltwater wedge in advancing and receding conditions, from one steady-state to another, following, respectively, increasing and decreasing changes in the boundary head difference with constant head change magnitudes (freshwater and sea-level).
The relationships derived in this study are not only important from a water resources management perspective as they provide guidance for approximate and sound estimation of the extent of saltwater wedges in coastal aquifers submitted to periodic changes in hydrological stresses, but also contribute to the better understanding of the underlying nature of the correlation between the boundary water level variations and the principal metrics characterising seawater intrusion.
4. Summary and Conclusions
The effect of water level variations on saltwater intrusion was quantitatively and systematically analysed with the aim of seeking a correlation between the steady-state toe length and the boundary head difference. Both freshwater and saltwater levels were varied, and the experiments were conducted for two different bead sizes to examine experimentally how different boundary head changes and hydraulic conductivities affect the sought correlations. The numerical model SEAWAT was used for validation purposes and to perform additional simulations to assess the sensitivity of the derived correlations to some hydrogeological parameters. The main conclusions of this study can be summarised as follows:
- The toe length and the boundary head difference were correlated by a simple linear equation. Specifically, the logarithmic toe length was found to be a linear function of the boundary head difference. For equivalent boundary head difference, a linear relationship was observed whether the toe length was recorded in the advancing wedge phase or in the receding wedge phase. A similar relationship was also derived in the scenarios where the sea level fluctuated, with a slightly steeper slope given the greater toe length values induced by sea-level rise compared to freshwater level drop.
- The results also showed that the height of the saltwater wedge along the coastline can directly be expressed as a linear function of the boundary head difference. Interestingly, the rise of the intruding saltwater along the coastline was not affected by the increase in the hydraulic conductivity of the porous media.
- The sensitivity analysis showed a strong dependency of the derived linear relationship on the site hydrogeological conditions. The strong linearity of the correlation was well evidenced for all the hydrogeological parameter combinations tested. The results nonetheless showed that the regression coefficients were sensitive to the hydraulic conductivity, the dispersivity, and the saltwater density, while the porosity only induced negligible effects. The regression coefficients were found to be insensitive to the magnitude of boundary head change.
- The existence of a linear relationship between the logarithmic toe length and the boundary head difference was also well evidenced in a field-scale aquifer model for all the different hydrogeological aquifer conditions tested.
These findings suggest that for homogeneous coastal aquifer systems, a reasonable estimate of the logarithmic extent of the saltwater intrusion could be obtained based on the difference between the water table and the sea level. The outcomes of this study are important from a water resources management perspective, as they provide an insight on the underlying nature of the correlations between the boundary water level variations and the main SWI external metrics as well as a guidance for approximate estimation of the extent of saltwater wedges in coastal aquifers submitted to various hydrological stresses. For prediction purposes, a minimum of two values of toe lengths associated with two water level differences would be required to estimate the regression coefficients.
The study provides a first attempt in identifying the underlying nature of the correlation between the boundary water level variations and the main SWI external metrics under controlled laboratory conditions. Further investigations need to be conducted where the linearity of the relationships suggested could be tested in 3D aquifer models and through in situ measurements for real world problems, which could be a subject for future work. Additionally, investigations exploring the effects of subsurface heterogeneity on the linearity of the correlations would also be beneficial and thus worthy of further analyses.
Author Contributions
Investigation, A.A.; methodology, A.A.; software, A.A. and A.M.A.; supervision, A.A.A. and G.A.H.; validation, A.A. and A.M.A.; visualization, A.A.; writing—original draft, A.A. and A.A.A.; writing—review and editing, A.A. and A.A.A. All authors have read and agreed to the published version of the manuscript.
Funding
This research received no external funding.
Data Availability Statement
Yes, please contact the first author at [email protected].
Conflicts of Interest
The authors declare no conflict of interest.
References
- UNATLAS. Human Settlements on the Coast, The Ever More Popular Coasts, UN Atlas of the Oceans. 2012. Available online: http://www.oceansatlas.org/ (accessed on 1 November 2019).
- Intergovernmental Panel on Climate Change. Climate Change 2014–Impacts, Adaptation and Vulnerability: Regional Aspects; Cambridge University Press: Cambridge, UK, 2014. [Google Scholar]
- Felisa, G.; Ciriello, V.; Di Federico, V. Saltwater Intrusion in Coastal Aquifers: A Primary Case Study along the Adriatic Coast Investigated within a Probabilistic Framework. Water 2013, 5, 1830–1847. [Google Scholar] [CrossRef] [Green Version]
- Kerrou, J.; Renard, P.; Cornaton, F.; Perrochet, P. Stochastic forecasts of seawater intrusion towards sustainable ground-water management: Application to the Korba aquifer (Tunisia). Hydrogeol. J. 2013, 21, 1–16. [Google Scholar] [CrossRef] [Green Version]
- Goswami, R.R.; Clement, T.P. Laboratory-scale investigation of saltwater intrusion dynamics. Water Resour. Res. 2007, 43, 43. [Google Scholar] [CrossRef]
- Chang, S.W.; Clement, T.P.; Simpson, M.J.; Lee, K.-K. Does sea-level rise have an impact on saltwater intrusion? Adv. Water Resour. 2011, 34, 1283–1291. [Google Scholar] [CrossRef] [Green Version]
- Abarca, E.; Clement, T.P. A novel approach for characterizing the mixing zone of a saltwater wedge. Geophys. Res. Lett. 2009, 36, 36. [Google Scholar] [CrossRef] [Green Version]
- Robinson, G.; Ahmed, A.A.; Hamill, G.A. Experimental saltwater intrusion in coastal aquifers using automated image analysis: Applications to homogeneous aquifers. J. Hydrol. 2016, 538, 304–313. [Google Scholar] [CrossRef] [Green Version]
- Abdelgawad, A.M.; Abdoulhalik, A.; Ahmed, A.A.; Moutari, S.; Hamill, G. Transient Investigation of the Critical Ab-straction Rates in Coastal Aquifers: Numerical and Experimental Study. Water Resour. Manag. 2018, 32, 3563–3577. [Google Scholar] [CrossRef] [Green Version]
- Abdoulhalik, A.; AbdelGawad, A.M.; Ahmed, A.A. Impact of layered heterogeneity on transient saltwater upconing in coastal aquifers. J. Hydrol. 2020, 581, 124393. [Google Scholar] [CrossRef]
- Werner, A.D.; Simmons, C.T. Impact of Sea-Level Rise on Sea Water Intrusion in Coastal Aquifers. Ground Water 2009, 47, 197–204. [Google Scholar] [CrossRef] [PubMed]
- Hussain, M.S.; Javadi, A.A. Assessing impacts of sea level rise on seawater intrusion in a coastal aquifer with sloped shoreline boundary. HydroResearch 2016, 11, 29–41. [Google Scholar] [CrossRef] [Green Version]
- Abdoulhalik, A.; Ahmed, A.A. Transience of seawater intrusion and retreat in response to incremental water-level variations. Hydrol. Process. 2018, 32, 2721–2733. [Google Scholar] [CrossRef]
- Guo, W.; Langevin, C.D. User’s Guide to SEAWAT; A Computer Program for Simulation of Three-Dimensional Varia-Ble-Density Groundwater Flow; USGS: Reston, VA, USA, 2002.
- Robinson, G.; Hamill, G.A.; Ahmed, A.A. Automated Image Analysis for Experimental Investigations of Salt Water Intru-sion in Coastal Aquifers. J. Hydrol. 2015, 530, 350–360. [Google Scholar] [CrossRef] [Green Version]
- Robinson, G.; Moutari, S.; Ahmed, A.A.; Hamill, G.A. An advanced calibration method for image analysis in laboratory-scale seawater intrusion problems. Water Resour. Manag. 2018, 32, 3087–3102. [Google Scholar] [CrossRef] [Green Version]
- Etsias, G.; Hamill, G.A.; Campbell, D.; Straney, R.; Benner, E.M.; Águila, J.F.; McDonnell, M.C.; Ahmed, A.A.; Flynn, R. Laboratory and numerical investigation of saline intrusion in fractured coastal aquifers. Adv. Water Resour. 2021, 149, 103866. [Google Scholar] [CrossRef]
- Harbaugh, A.W.; Banta, E.R.; Hill, M.C.; McDonald, M.G. MODFLOW-2000, The U. S. Geological Survey Modular Ground-Water Model-User Guide to Modularization Concepts and the Ground-Water Flow Process; Open-File Report.U.S.Geological Survey; USGS: Reston, VA, USA, 2000; p. 134.
- Zheng, C.; Wang, P.P. MT3DMS: A Modular Three-Dimensional Multispecies Transport Model for Simulation of Advection, Dispersion, and Chemical Reactions of Contaminants in Groundwater Systems; Documentation and User’s Guide; U.S. Army Corps of Engineers: Washington, DC, USA, 1999.
- Riva, M.; Guadagnini, A.; Dell’Oca, A. Probabilistic assessment of seawater intrusion under multiple sources of uncertainty. Adv. Water Resour. 2015, 75, 93–104. [Google Scholar] [CrossRef]
- Abdoulhalik, A.; Ahmed, A.A. Transient investigation of saltwater upconing in laboratory-scale coastal aquifer. Estuarine, Coast. Shelf Sci. 2018, 214, 149–160. [Google Scholar] [CrossRef]
- Lu, C.; Xin, P.; Li, L.; Luo, J. Seawater intrusion in response to sea-level rise in a coastal aquifer with a general-head inland boundary. J. Hydrol. 2015, 522, 135–140. [Google Scholar] [CrossRef]
- Strack, O.D.L. A single-potential solution for regional interface problems in coastal aquifers. Water Resour. Res. 1976, 12, 1165–1174. [Google Scholar] [CrossRef]
Figure 1.
Simplified diagrams of a coastal unconfined aquifer showing the main seawater intrusion (SWI) metrics.
Figure 1.
Simplified diagrams of a coastal unconfined aquifer showing the main seawater intrusion (SWI) metrics.

Figure 2.
Schematic diagram of the laboratory tank (top). Photograph of the experimental setup (bottom). (1) Porous media chamber; (2) freshwater reservoir; (3) saltwater reservoir; (4) ultrasonic sensors; (5) high-speed camera; (6) LED lights.
Figure 2.
Schematic diagram of the laboratory tank (top). Photograph of the experimental setup (bottom). (1) Porous media chamber; (2) freshwater reservoir; (3) saltwater reservoir; (4) ultrasonic sensors; (5) high-speed camera; (6) LED lights.

Figure 3.
Experimental concentration colour maps of the aquifer system for the various head differences (dh) in case FW 1325: dh = 6mm (a) followed by freshwater drop to 5.2 mm (b), 4.4 mm (c) and 3.6 mm (d). Only one case is shown (case 1325) for one scenario (FW) for the sake of brevity. (from Abdoulhalik and Ahmed [13]).

Figure 4.
Steady-state to steady-state toe length data against the head difference dh in advancing condition for FW and SL scenarios; (a) case 1090 and (b) case 1325; (c) comparison with the analytical solution (for case 1090).
Figure 4.
Steady-state to steady-state toe length data against the head difference dh in advancing condition for FW and SL scenarios; (a) case 1090 and (b) case 1325; (c) comparison with the analytical solution (for case 1090).

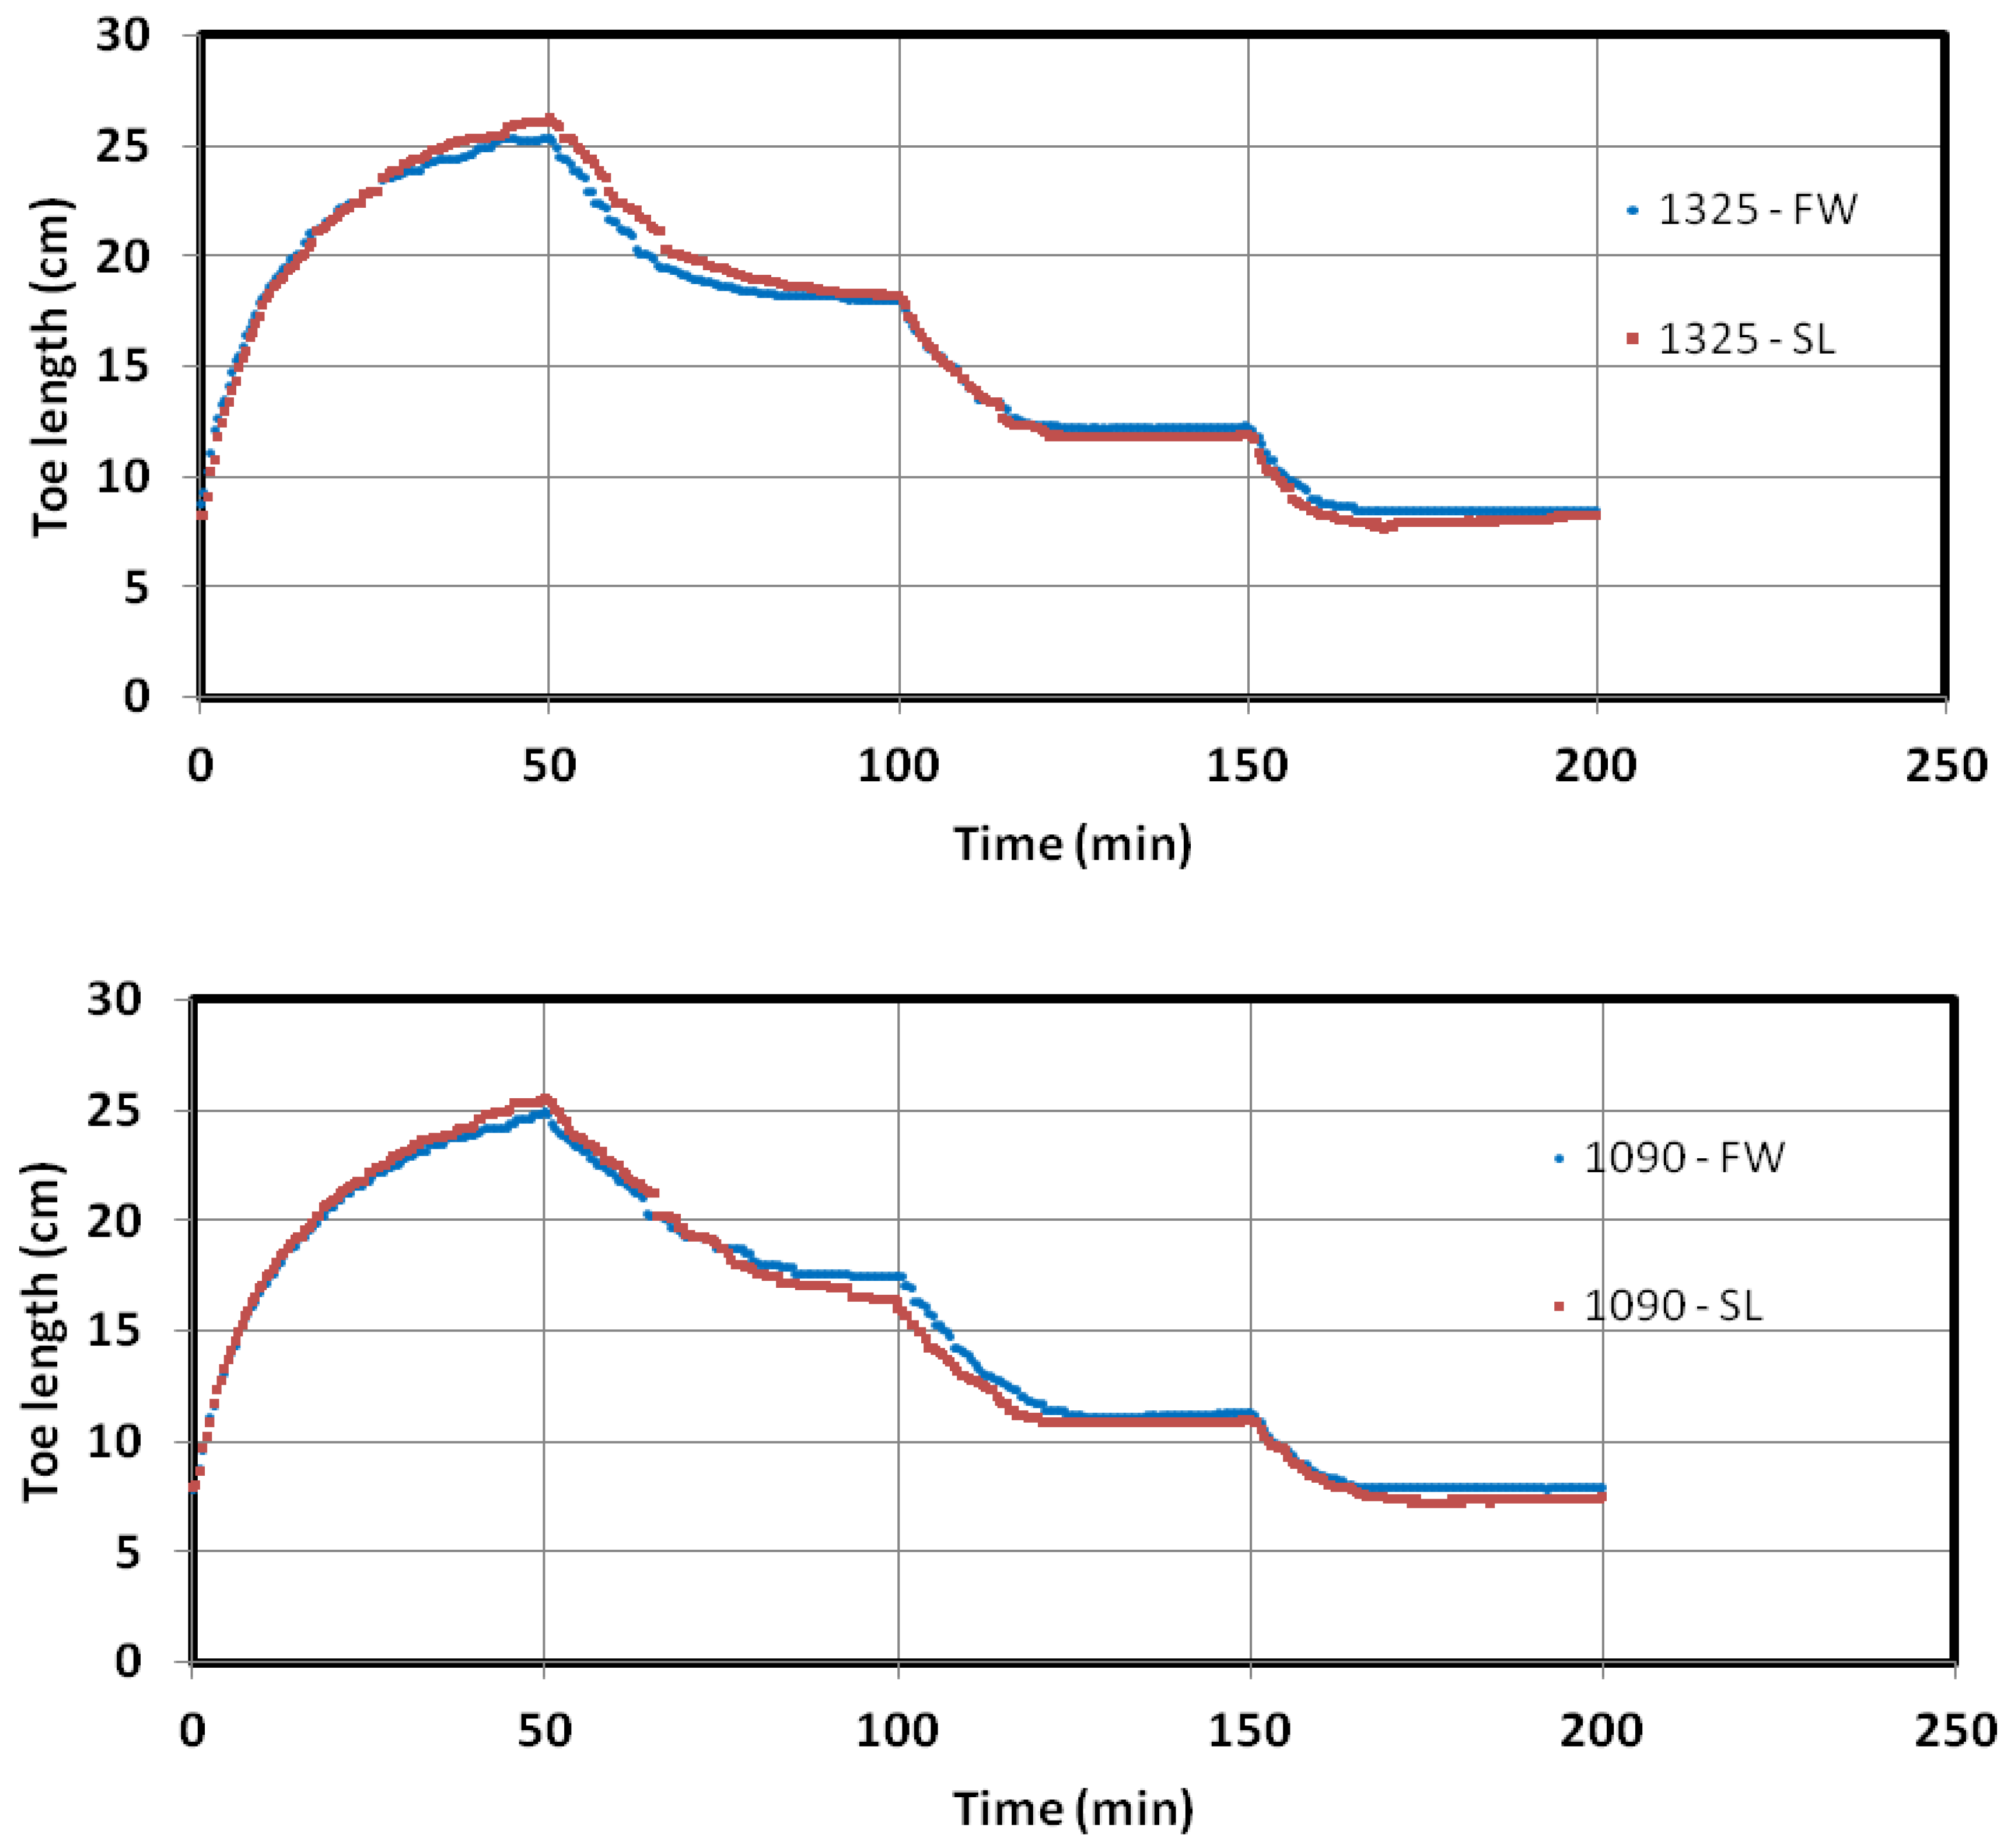
Figure 5.
Transient experimental toe length data in a receding scenario in case 1325 (top) and case 1090 (bottom) for both FW and SL scenarios
Figure 5.
Transient experimental toe length data in a receding scenario in case 1325 (top) and case 1090 (bottom) for both FW and SL scenarios

Figure 6.
Steady-state to steady-state toe length data against the head difference dh in seawater retreat (SWR) experiment in case 1090 (top) and case 1325 (bottom) for both FW and SL scenarios.
Figure 6.
Steady-state to steady-state toe length data against the head difference dh in seawater retreat (SWR) experiment in case 1090 (top) and case 1325 (bottom) for both FW and SL scenarios.

Figure 7.
Steady-state to steady-state saltwater wedge height Hs against the head difference dh in case 1090 following fluctuations of the freshwater head boundary (top) and saltwater boundary (bottom). SWR refers to saltwater retreat, while SWI refers to saltwater intrusion.
Figure 7.
Steady-state to steady-state saltwater wedge height Hs against the head difference dh in case 1090 following fluctuations of the freshwater head boundary (top) and saltwater boundary (bottom). SWR refers to saltwater retreat, while SWI refers to saltwater intrusion.

Figure 8.
Comparison between the numerical modelling results and the experimental data of the toe length in case 1090 FW.
Figure 8.
Comparison between the numerical modelling results and the experimental data of the toe length in case 1090 FW.

Figure 9.
Change of the logarithmic toe length with the head difference for different head change magnitude.
Figure 9.
Change of the logarithmic toe length with the head difference for different head change magnitude.

Figure 10.
Change of the logarithmic toe length with the head difference for different hydraulic conductivity of the aquifer.
Figure 10.
Change of the logarithmic toe length with the head difference for different hydraulic conductivity of the aquifer.

Figure 11.
Change of the logarithmic toe length with the head difference for different dispersivity values over the range 0.001–0.2 cm.
Figure 11.
Change of the logarithmic toe length with the head difference for different dispersivity values over the range 0.001–0.2 cm.

Figure 12.
Change of the logarithmic toe length with the head difference for different porosity values.
Figure 12.
Change of the logarithmic toe length with the head difference for different porosity values.

Figure 13.
Change of the logarithmic toe length with the head difference for different saltwater density values.
Figure 13.
Change of the logarithmic toe length with the head difference for different saltwater density values.

Figure 14.
Change of the logarithmic toe length with the head difference for different values of (a) hydraulic conductivity, (b) dispersivity, and (c) saltwater density.
Figure 14.
Change of the logarithmic toe length with the head difference for different values of (a) hydraulic conductivity, (b) dispersivity, and (c) saltwater density.


Table 1.
Experimental cases investigated (dh refers to the head boundary difference).
| Type of Experiment | Advancing Wedge Experiment | Receding Wedge Experiment |
|---|---|---|
| Case 1090 | ||
| FW | dh = 6, 5.2, 4.4, 3.6 and back to 6 mm | dh = 6, 3.6, 4.4, 5.2, 6 mm |
| SL | dh = 6, 5.2, 4.4, 3.6 and back to 6 mm | dh = 6, 3.6, 4.4, 5.2, 6 mm |
| Case 1325 | ||
| FW | dh = 6, 5.2, 4.4, 3.6 and back to 6 mm | dh = 6, 3.6, 4.4, 5.2, 6 mm |
| SL | dh = 6, 5.2, 4.4, 3.6 and back to 6 mm | dh = 6, 3.6, 4.4, 5.2, 6 mm |
Table 2.
Experimental toe length results in the FW and SL scenarios for the two bead sizes considered.
Table 2.
Experimental toe length results in the FW and SL scenarios for the two bead sizes considered.
| dh (mm) | TL 1090 FW (cm) | TL 1090 SL (cm) | TL 1325 FW (cm) | TL 1325 SL (cm) |
|---|---|---|---|---|
| 6 | 7.9 | 7.9 | 8.4 | 8.4 |
| 5.2 | 11.3 | 11.4 | 11.5 | 11.8 |
| 4.4 | 16.5 | 17.6 | 17.2 | 18.3 |
| 3.6 | 24.9 | 26.7 | 25.5 | 28.2 |
Publisher’s Note: MDPI stays neutral with regard to jurisdictional claims in published maps and institutional affiliations. |
© 2021 by the authors. Licensee MDPI, Basel, Switzerland. This article is an open access article distributed under the terms and conditions of the Creative Commons Attribution (CC BY) license (http://creativecommons.org/licenses/by/4.0/).
Share and Cite
MDPI and ACS Style
Abdoulhalik, A.; Ahmed, A.A.; Abdelgawad, A.M.; Hamill, G.A. Towards a Correlation between Long-Term Seawater Intrusion Response and Water Level Fluctuations. Water 2021, 13, 719. https://doi.org/10.3390/w13050719
AMA Style
Abdoulhalik A, Ahmed AA, Abdelgawad AM, Hamill GA. Towards a Correlation between Long-Term Seawater Intrusion Response and Water Level Fluctuations. Water. 2021; 13(5):719. https://doi.org/10.3390/w13050719
Chicago/Turabian StyleAbdoulhalik, Antoifi, Ashraf A. Ahmed, Abdelrahman M. Abdelgawad, and G. A. Hamill. 2021. "Towards a Correlation between Long-Term Seawater Intrusion Response and Water Level Fluctuations" Water 13, no. 5: 719. https://doi.org/10.3390/w13050719
Note that from the first issue of 2016, this journal uses article numbers instead of page numbers. See further details here.