Article

1,2-DCA Natural Attenuation Evaluation in Groundwater: Insight by Dual Isotope 13C/37Cl and Molecular Analysis Approach

by
Giovanna Carpani
1,
Massimo Marchesi
2,*,
Ilaria Pietrini
1,
Luca Alberti
2,
Luciano Massimo Zaninetta
3,
Orfan Shouakar-Stash
4 and
Francesca de Ferra
1
1
Decarbonization and Environmental R&D, Eni S.p.A., 20097 S. Donato Milanese, Italy
2
Department of Civil and Environmental Engineering, Politecnico di Milano, 20133 Milano, Italy
3
Eni Rewind S.p.A., 20097 S. Donato Milanese, Italy
4
Isotope Tracer Technologies Inc., Waterloo, ON N2V 1Z5, Canada
*
Author to whom correspondence should be addressed.
Water 2021, 13(5), 728; https://doi.org/10.3390/w13050728
Submission received: 16 December 2020 / Revised: 26 January 2021 / Accepted: 23 February 2021 / Published: 7 March 2021
(This article belongs to the Special Issue Groundwater and Soil Remediation)

Abstract

:
Natural attenuation (NA) processes represent a valuable option in groundwater remediation. At a heavily 1,2-dichloroethane (1,2-DCA) contaminated site, Compound-Specific Isotope Analysis (CSIA) in combination with Biological Molecular Tools (BMTs) were implemented as a rigorous characterization approach to evaluate the occurrence of Natural Attenuation in the proximity of the source area. By the use of microcosm experiments, the potential for natural and enhanced biodegradation under anaerobic conditions was documented, following the dichloroelimination pathway. Enrichment factors of −9.1‰ and −11.3‰ were obtained for 13C while Geobacter spp. and reductive dehalogenase genes (rdhs) were identified as main site-specific biomarkers. At pilot scale, enrichments of 13.5‰ and 6.3‰ for δ13C and δ37Cl, respectively, high levels of reductive dehalogenase (rdh group VI) along with the dominance of Geobacter spp. indicated the occurrence of significant dichloroelimination processes in groundwater under anaerobic conditions. By using the site-specific enrichment factors, degradation extents over approximately 70–80% were estimated, highlighting the relevant potential of NA in 1,2-DCA degradation in the vicinity of the source area at the site. The proposed fine-tuned protocol, including CSIA and BMTs, is proven to be effective as a groundwater remediation strategy, properly assessing and monitoring NA at site scale.

1. Introduction

Chlorinated hydrocarbons are among the most frequent groundwater contaminants in many industrialized countries, as they are used as chemical intermediates, refrigerants, solvents, cleaners etc. [1]. In particular, 1,2-dichloroethane (1,2-DCA), listed among the priority pollutants with a toxicity comparable to that of tetrachloroethane (PCE) and trichloroethane (TCE) is widely used as a precursor in the manufacture of vinyl chloride (VC) and, in the past, it was added as a scavenger to leaded gasoline [1]. It has been demonstrated that spills or leakages result in accumulation and persistence of this contaminant in the environment [2]. 1,2-DCA has also been classified as a probable human carcinogen by the U.S. Environmental Protection Agency. This classification and the tendency to collect indicate both an environmental and human health risk due to acute and long-term effects [1].
For remediation of sources and extended plumes of 1,2-DCA contamination Pump and Treat (P&T) systems are generally implemented, although they are usually expensive and not very effective in reducing the contamination, unless used on a long term basis [3]. On the contrary, attenuation processes, either natural attenuation (NA) and/or enhanced natural attenuation (ENA), are less expensive and are particularly low carbon-footprint remediation systems which can play a major role in achieving remediation, where applicable [4]. With regards to biodegradation processes, the main actors of the natural attenuation (NA) of organochlorides such as 1,2-DCA are microorganisms that can dehalogenate or oxidize/mineralize these toxic molecules because of specific enzymatic systems. In anaerobic conditions, frequently detected in aquifers and sediments, Dehalobacter spp., Dehalococcoides spp. (that is, D. mccarty strain 195) and Desulfitobacterium spp. (that is, D. dichloroeliminans strain DCA1) are primarily responsible for the conversion of 1,2-DCA, mainly using reductive dehalogenases (RDs), a class of enzymes which are capable of eliminating chlorine from molecules [5,6,7]. During reductive dehalogenation, vinyl chloride (VC) is formed as an intermediate of the dehydrodechlorination step due to the cleavage of one atom of chlorine using H as an electron donor and 1,2-DCA as a terminal electron acceptor. This step can be followed, in specific conditions, by a hydrogenolysis to ethane. Another possibility is dichloroelimination, where two chlorine atoms of 1,2-DCA are removed, converting the contaminant into ethene without production of toxic chlorinated intermediates (such as VC, which is even more toxic than the precursor). Therefore, the latter presents the favored process for the remediation of polluted groundwater. In this respect, several authors described 1,2-DCA specific RD gene clusters in the metagenome of a 1,2-DCA dehalorespiring enrichment culture from a contaminated aquifer [8,9]. Aerobic biodegradation of 1,2-DCA is also feasible, occurring via enzymatic oxidation or hydrolytic dehalogenation reactions. Xanthomonas autotrophicus GJ10 and Ancylobacter aquaticus AD20 for example are known for aerobic 1,2-DCA degradation through a hydrolytic dehalogenation pattern, whereas Pseudomonas strain DCA1 is able to degrade 1,2-DCA by means of a monooxygenase enzyme [10]. The presence of the specific catabolic gene (that is, molecular biomarker) and of the main bacterial strain (that is, taxonomic biomarker) involved in the biodegradative process can be assessed by the use of quantitative PCR (qPCR) analysis. Moreover, the characterization of the autochthonous bacterial community can be determined by the sequencing of the gene 16S rRNA through next generation sequencing (NGS) systems [11].
At present, valuable assessment of biodegradation processes can be reached by a multidisciplinary approach that combines the two Biological Molecular Tools (BMTs) cited above, with the Compound Specific Isotopic Analysis (CSIA) approach [12]. The latter is a promising methodology that permits assessing the extent, and often the type, of degradation involved in processes of NA of contaminants (that is, hydrocarbons and chlorinated solvents) in groundwater. During biodegradation, molecules containing lighter isotopes (that is, 12C, 1H, 35Cl) are favored by the microorganisms, inducing a relative enrichment of molecules containing the heavier isotope (that is, 13C, 2H, 37Cl) in the remaining contamination [13,14,15,16,17]. Such isotope fractionation (expressed by the use of enrichment factors, ε) varies based on the reaction mechanisms, and various enrichment factors ε of 1,2-DCA have been described for different degradation pathways. With regards to 13C, a wide ε range, from −3‰ to −32‰ was demonstrated for aerobic microbial degradation [10,18], while enrichment factors concerning strictly anaerobic environments from approximately −7‰ to −33‰ were reported [19,20,21]. Recently, 37Cl and 2H fractionations were also investigated [22] and the use of a multiple isotope approach has been successfully applied in laboratory and field investigations, highlighting the degradation mechanism in the field. Palau et al. [23] revealed the existence of dehalogenation processes within 1,2-DCA plumes at two field sites by the use of 13C and 37Cl.
The aim of this study is to characterize the natural attenuation processes at a contaminated site impacted by 1,2-DCA, particularly in the vicinity of the source area where the highest concentrations were detected and where a pilot scale test for enhanced bioremediation was to be implemented. At laboratory scale, microcosm experiments were carried out in order to test the potential for 1,2-DCA biodegradation, to estimate the associated δ13C fractionation, and to investigate several biological markers. At field scale, microbiological (that is, Illumina NGS sequencing) and molecular analysis (that is, quantification of the reductive dehalogenase gene (rdh)) were used in combination with the δ13C and δ37Cl isotope approach for a detailed characterization of the biodegradation processes, including potential pathways and degradation extent estimation.

2. Materials and Methods

Microcosm experiments were carried out in order to test the potential for biodegradation at the site and to estimate the related site-specific carbon enrichment factor. At field scale, groundwater samples were collected for 1,2-DCA concentration, isotope analysis including 13C-CSIA and 37Cl-CSIA, and for additional molecular and microbiological analysis.

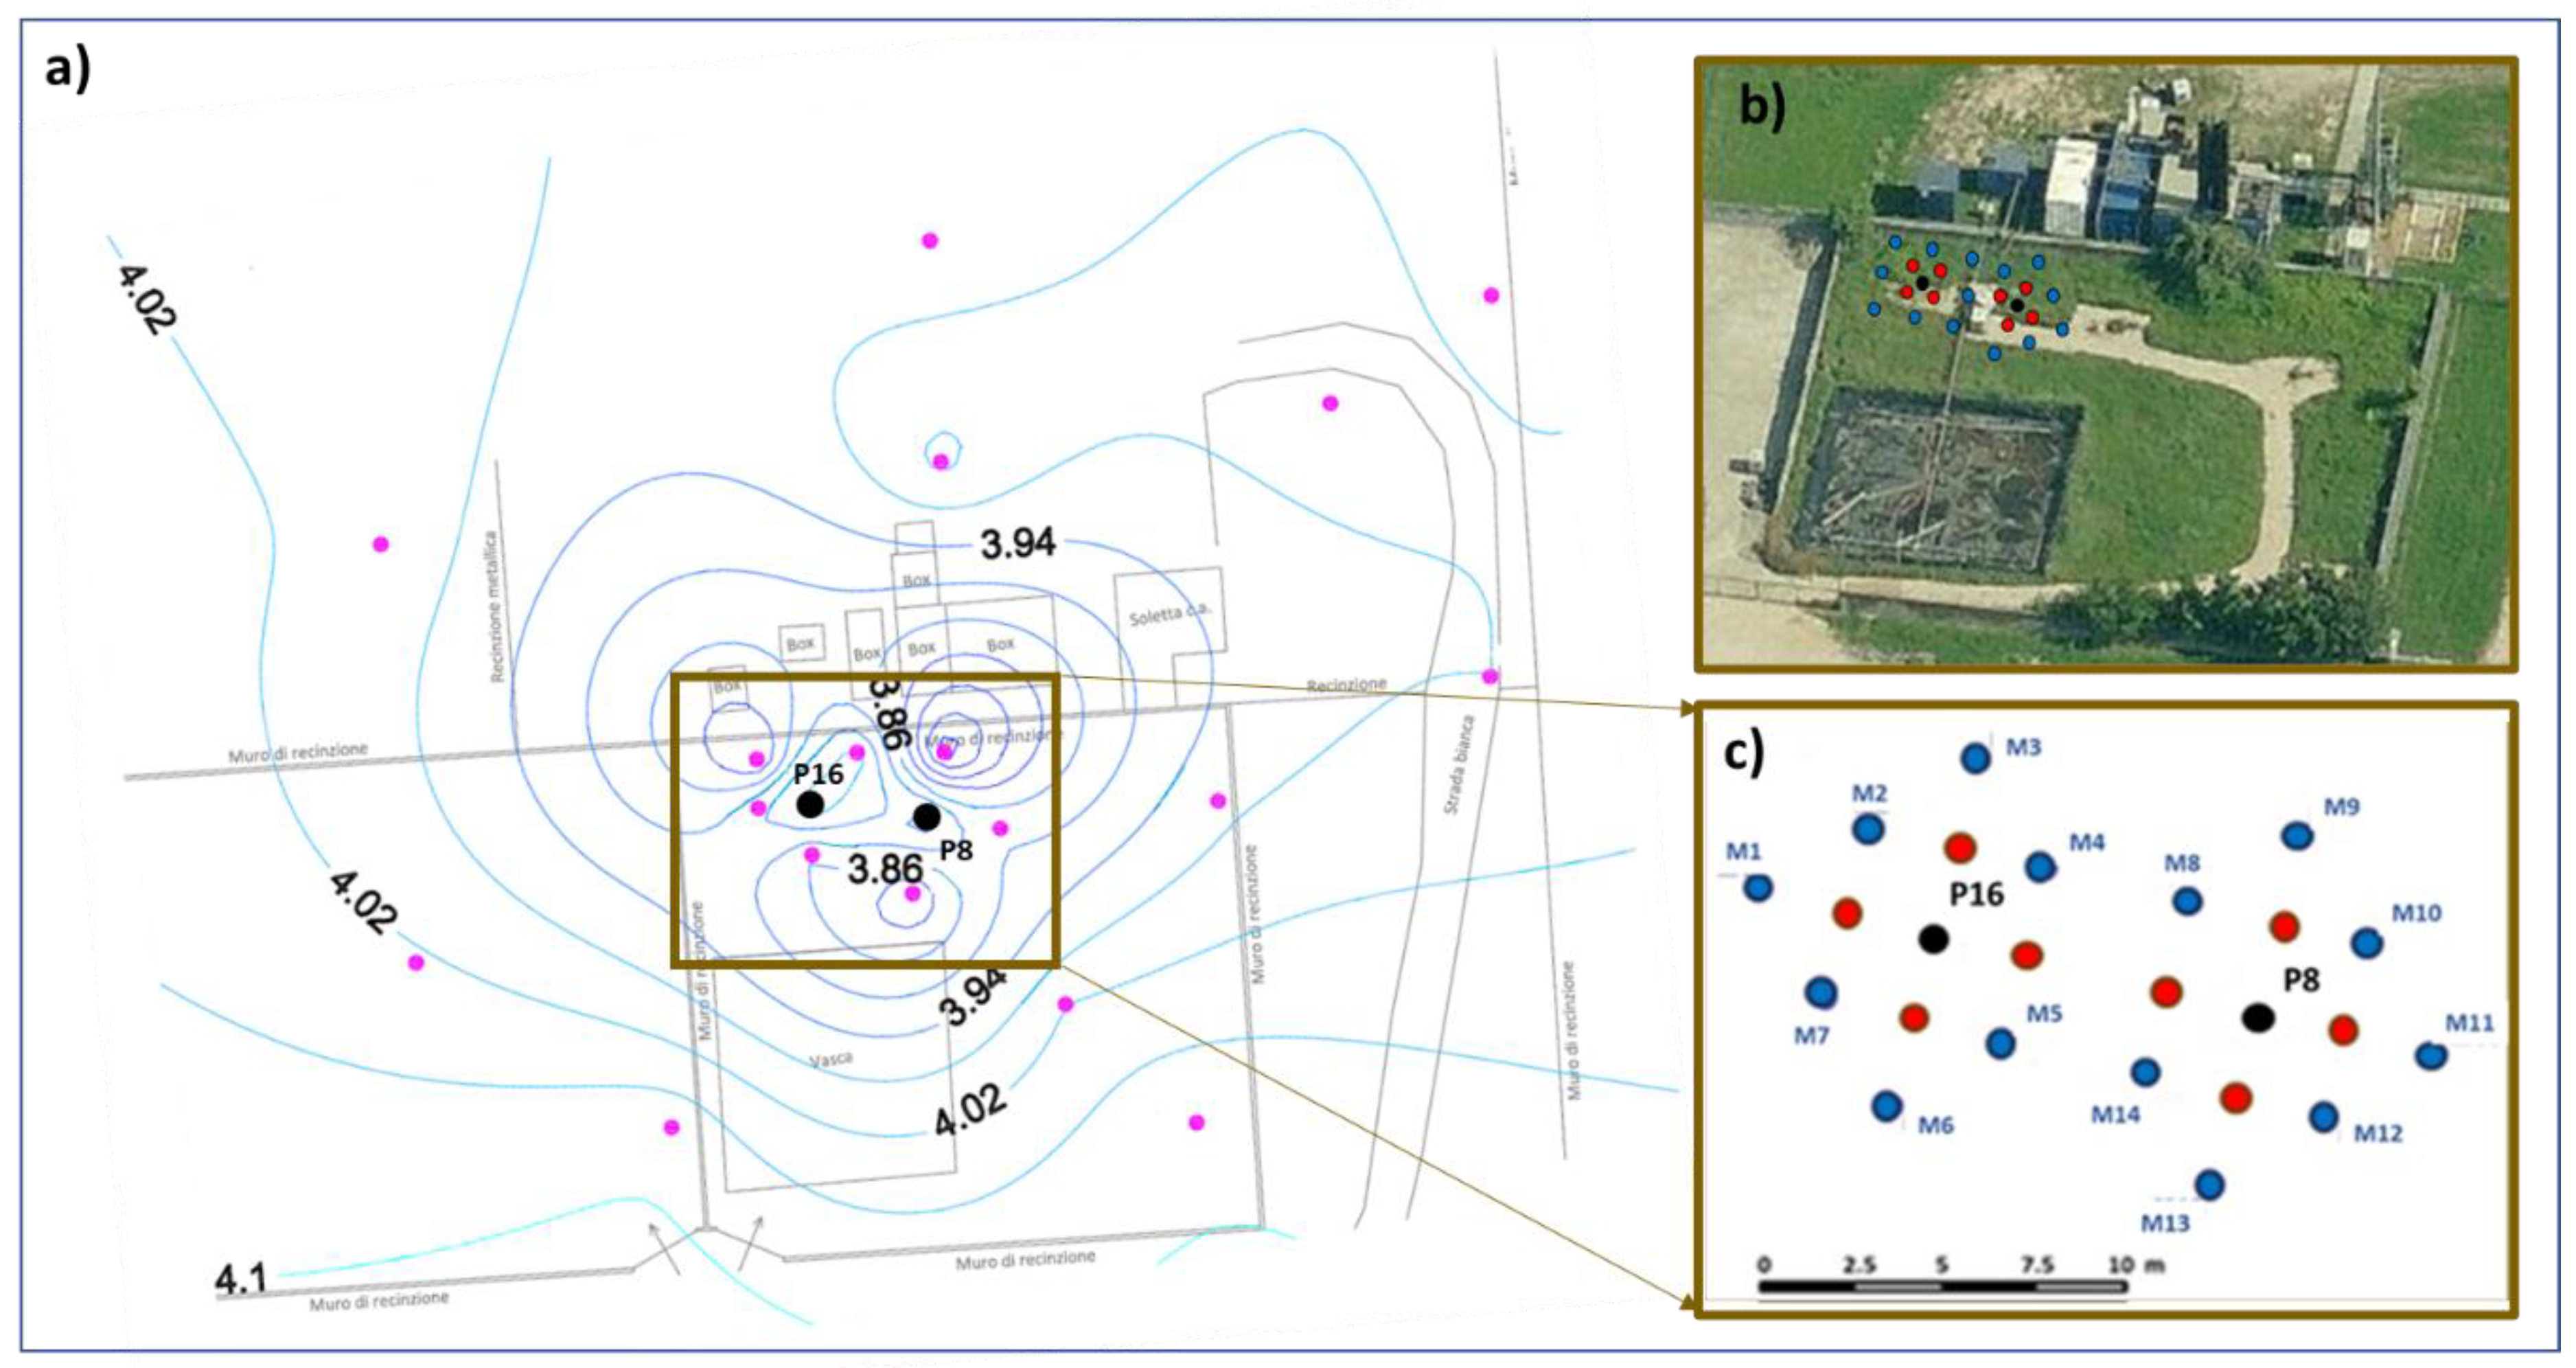
2.1. Site Description

The contaminated site is located at an industrialized area heavily contaminated with chlorinated solvents in northern Italy. The pilot area, about 200 m2, represents a historical contaminant source for 1,2-DCA linked to a storage tank (Figure 1). From ground level to 3–4 m of depth b.g.l. (below ground level), the lithology is characterized by fill material and a horizon of silty fine sand (or silty-sand), often showing unsaturated conditions and occasionally recharged by infiltration waters. The subsequent layer consists mainly of clays, extending to approximately 9 m b.g.l. From this depth, a silty fine sand (or silty-sand) horizon starts, of a variable thickness of approximately 2 m, hosting the upper confined aquifer. The impermeable base of the aquifer is made up of gray clays locally peaty reaching down to 13–15 m b.g.l., where a layer of medium and coarse sands, locally silty, hosts the lower confined aquifer. This lower confined aquifer reaches on average to a depth of 40 m b.g.l. The Plant site overview and specific monitoring wells are shown in Figure 1.
1,2-DCA has been found in high concentration, on the order of thousands mg/L, in the upper confined aquifer, with concentration decreasing over time, at least for P16, close to the source area, as shown by monitoring data from 2004 to 2015 (Figure 2a), when a pilot experiment for enhanced bioremediation was implemented in the area. Groundwater velocity within the upper confined aquifer is very low as the gradient is flat (below 0.5‰) and hydraulic conductivity ranges between 8 × 10⁻⁶ and 3 × 10⁻⁵ m/s.
Despite the high concentrations, previous studies [8,24,25] showed an intrinsic potential of degradation at the site, also indicated by a significant decrease in concentration over time for example for P8 (Figure 2a). To investigate the role of natural attenuation at the site, 14 monitoring wells, screened only on the upper confined aquifer were installed in the vicinity of P8 and P16 (Figure 1c).
The site is characterized by reducing conditions, with dissolved oxygen < 0.2 mg/L and low redox potential (that is, averaging values of −200/300 mV) in the entire pilot area, indicating a mainly anaerobic environment.
Groundwater samples for site characterization were collected from the 14 new monitoring wells, as well as from P8 and P16 in June 2015 for 1,2-DCA concentration quantification and isotope analysis, including 13C-CSIA and 37Cl-CSIA. On selected monitoring wells (M2, M4, M6, M10 and M13) additional groundwater samples were collected for molecular and microbiological analysis. For P16, molecular and microbiological analysis were also carried out during a monitoring period from 2013 to 2015.

2.2. Microcosm Experiments

A series of microcosms were prepared in order to test the biodegradation potential for natural attenuation (indicated as NA) and for further enhanced biodegradation applications (enhanced natural attenuation, indicated as ENA) and to estimate the site-specific 13C enrichment factor.
Laboratory microcosms (that is, anaerobic conditions) were performed on fresh (NA) and enrichment cultures (ENA, 39th refresh culture), prepared from water samples collected from P16, where the highest decrease in 1,2-DCA concentration over time was observed. After being withdrawn during the periodic monitoring sampling in November 2012, cultures were set up in duplicate in 50 mL serum bottles for several enrichment cycles. The groundwater was degassed under a N2 flow to eliminate all the contaminants originally present, then 0.5 mL of BTZ 100× (content of medium: ammonium chloride_NH4Cl, potassium dihydrogen phosphate_KH2PO4, magnesium chloride hexahydrate_MgCl2 × 6H2O, calcium chloride dihydrate_CaCl2 × 2H2O, and the buffer HEPES 50 mM), 1 mM cysteine, 400 µL of a 1000× vitamin solution (content of solution: 100 mg of Vitamin B12, 80 mg of p-aminobenzoic acid, 20 mg of D(+)-biotin, 200 mg of Nicotinic acid, 100 mg of Calcium pantothenate, 300 mg of Pyridoxine hydrochloride, and 200 mg of Thiamine-HCl × 2 H2O in 1 L of distilled water), and 200 µL of a 200× trace elements solution (content of solution: 12.800 g of Nitrilotriacetic acid-NTA, 1.350 g of FeCl3 × 6 H2O, 0.100 g MnCl2 × 4 H2O, 0.024 g of CoCl2 × 6 H2O, 0.100 g of ZnCl2, 0.025 g of CuCl2 × 2 H2O, 0.010 g of H3BO3, 0.024 g of Na2MoO4 × 2 H2O, 1.000 g of NaCl, 0.120 g of NiCl2 × 6 H2O, and 0.026 g of Na2SeO3 × 5 H2O in 1 L of distilled water) were added; lactate 1 mM was provided as an electron donor while 1,2-DCA was added. After checking for complete 1,2-DCA consumption, subsequent dilutions were carried out on a weekly basis, again using fresh BTZ 1× medium at a 1:2 or 1:10 dilution rate, depending on the growth and activity of the culture.
All the microcosms were prepared similarly for the enriching phase, with a proportion of 1:2 of mineral medium BTZ 1× as supplementary salt solution and sample water purged with sterile oxygen-free nitrogen, in a total volume of 50 mL. All the microcosms were amended with 1 mM cysteine, 400 µL of a 1000× vitamin solution, and 200 µL of a 200× trace elements solution. Then, soda 10 N was added to all the microcosms to reach a pH of 7.0, 1 mM of lactate was added as an electron donor, and DCA was added to reach a desired initial concentration of 100 ppm. All microcosms were immediately sealed after the last addition with Teflon-faced septa and aluminum crimp seals and incubated in the dark at 26 °C. The abiotic control microcosms were prepared by incubating parallel serum bottles containing all the amendments with an additional 1% (w/v) of a 10% stock solution of sodium azide (NaN3) as a bacteriostatic agent.
Both types of microcosms (biotic and control) were sacrificed at regular time intervals (0, 8, 16, 24, 32, 40, 44, 48, 52, 56, and 64 h) until complete consumption of 1,2-DCA. Separate aliquots for the quantification of 1,2-DCA concentration and for the 13C-CSIA analyses were collected.

2.3. 1,2-DCA Concentration, Isotope Analysis and Enrichment Factor Estimation

The concentrations of 1,2-DCA and the presence of ethene were determined by head-space gas chromatography on a 6890N Agilent gas chromatograph equipped with a FID and a DB5MS column (Agilent Tech, length 60 m × ID 0.25 mm × film thickness 0.25 µm, Cernusco sul Naviglio, Italy). During the analysis program, split mode with a ratio of 1:10 was used with an initial GC temperature hold of 35 °C for 5 min, followed by an increase to 120 °C at a rate of 10 °C/min and a final hold for 4 min. The 1,2-DCA limit of detection was about 1–2 µg/L. A five-point calibration curve was prepared prior to sample analyses using a standard solution of 1,2-DCA.
For 13C-CSIA, a gas chromatography combustion isotope ratio mass spectrometry (GC-C-IRMS) system was used (TRACE-Ultra/delta V plus, ThermoFisher Scientific, Rodano, Italy) combined with a headspace solid-phase micro extraction method (CAR/PDMS 75 μm, Supelco). The GC, equipped with a DB 624 column (Restek, Cernusco sul Naviglio, Italy) was configured in split mode (10:1) and the oven program was set initially to 40 °C for 2 min, heated to 220 °C at a rate of 10 °C/min, with a final hold of 2 min. Internal standards were used every 6 injections in order to obtain VDPB reference values, while samples were analyzed in duplicates; the overall precision of the method was 0.3‰. The analyses were performed at the Geo-Lab isotopic facility, ENI, Milan, Italy.
For 37Cl-CSIA, a method by gas chromatography continuous flow isotope ratio mass spectrometry (GC-IRMS) using a 6890 (Agilent) coupled to a MAT 253 (ThermoFisher Scientific) was adopted, again with a solid-phase micro extraction (SPME) method and a similar GC set up and conditions as used for 13C-CSIA. Internal standards were used every 6 injections in order to obtain VSMOC reference values, while samples were analyzed in duplicates; the overall precision of the method was 0.2 ‰. The method is described in [23] and the analyses were performed at the Isotope Tracer Technologies Inc. laboratories, Waterloo, ON, Canada.
Carbon and chlorine isotope ratios are expressed using the δ-notation (Equation (1)),
δ h E s a m p l e = R ( h E / l E ) s a m p l e R ( h E / l E ) s t a n d a r d 1
where R is the isotope ratio of heavy (hE) and light (lE) isotopes of an element E (13C/12C and 37Cl/35Cl), and δ values were reported in per mil (‰). The relationship between isotope fractionation and the extent of 1,2-DCA transformation in laboratory experiments was evaluated by a modified form of the Rayleigh distillation (Equation (2)):
ln R t R 0 = ln ( δ h E t + 1 δ h E o + 1 ) ε b u l k · ln f
where f is the remaining fraction and εbulk the enrichment factor.

2.4. Characterization of Microbial Communities and Quantification of the Catabolic Gene of Geobacter-spp.

2.4.1. Microbial Population Analysis. DNA Extraction and Illumina-MiSeq® Sequencing

500 mL of the groundwater collected from the selected monitoring wells were filtered employing a vacuum filtering kit (that is, flask, Buchner funnel and Orange Scientific 0.45 µm paper filter). Genomic DNA was extracted from the half part of the filter using the FastDNA® SPIN Kit for Soil (MP Biomedicals, Solon, OH, USA) following the manufacturer’s protocol.
PCR amplifications of the extracted genomic DNA were performed in two independent 50 µL reactions containing 25 µL of Green Taq® G2 Master Mix 2× (Promega, Madison, WI, USA), 5 µL of each primer (10 µM), 12.5 µL of nuclease-free water, and 2.5 µL of DNA. The amplification of the V5-V6 hypervariable region of the 16S rRNA gene (fragment length 244 bp) employed primers 783F and 1027R with a barcode, a specific 6-bp sequence that allows the differentiation of samples, at the 5′ position. Cycling conditions for the amplifications were 94 °C for 5 min, 29 cycles of 94 °C for 50 s, 47 °C for 30 s, 72 °C for 30 s, followed by 72 °C for 5 min. Subsequently, the amplification products were separated by electrophoresis on EtBr stained 1% agarose gel and the specific bands were excised and purified using Wizard SV Gel and a PCR Clean-UP System (Promega, Madison, WI, USA) kit following the manufacturer’s protocol. Finally, the concentration (ng/μL) of the purified DNA was determined using a Qubit® 2.0 Fluorimeter. Once all the libraries were prepared, the sequencing was carried out at Parco Tecnologico Padano (Lodi, Italy) using the Illumina-MiSeq® platform. The sequences of the amplified fragment (subdivided into samples in different FastQ format text files) were subsequently processed using a pipeline based on Usearch software [26], the Ribosomal Database Project (RDP) classifier [27], and an “in-house” Python script developed to describe the structure of the bacterial community.
Since the sequenced fragment has a length of 290 bp, the sequences of the two 250 bp reads were superimposed to obtain a single sequence of the entire fragment. This operation was performed using the fastsh_mergepairs tool of Usearch that produces the reverse-complement sequence of one of the two reads and aligns it to the other read under the perfect alignment condition. Reads that did not perfectly match were discarded. The fastq_mergepairs tool of Usearch was also used to remove low quality score sequences (number of uncorrected bases > 0.5) according to the information reported in the FASTQ file. Moreover, the sequences were converted into FASTA format. Then, the Usearch cluster_otus command was used to combine the sequences obtained from all samples in a single file and representative sequences for each OTU were defined (cluster). Singletons (that is, sequences that occur only once in the entire dataset) were removed and the representative sequences were defined with a 97% similarity cut-off.
The representative sequences of OTUs were classified by the Bayesian Ribosomal Database Project (RDP) classifier.
The abundance of each OTU within a microbial community was estimated by aligning sequences of each sample with representative ones and assigning them to the most similar OTU sequence. The processing was carried out using the usearch_global tool of Usearch. Finally, a script (count_illumina.py) described in [28] was used to convert the output generated by the Usearch_global command into a tab-delimited text file where each OTU was related to its respective abundance in each sample.

2.4.2. Quantitative Polymerase Chain Reaction (qPCR) for Dehalogenase (rdh) Gene Determination

The presence and the quantification of the catabolic gene rdh in the genomic DNA extracted from the sampled groundwater and from the enrichment cultures of well P16 was estimated by quantitative PCR (qPCR)-amplification with primers 552F (5′-ATGACCAATGAAATAGCTAATGA-3′) and 625R (5′- TGTTGGCCTTGTTGTCGCACACT-3′). The qPCR was performed in a total mix volume of 30 μL, composed of 15 μL of FluoCycleII Sybr reaction mix (Euroclone, Pero, Italy), 0.3 µL (1 µM) of each primer, 11.4 μL of nuclease-free water, and 3 μL of genomic DNA. Cycling conditions for the amplifications were 95 °C for 4 min, followed by 40 cycles of 95 °C for 15 s, 52 °C for 30 s, and 56 °C for 45 s, with acquisition of the fluorescence at the end of each 72 °C elongation step.
The relative concentration of Geobacter spp. was further assessed by quantitative gene amplification with specific primers designed on the rRNA Geobacter 16S sequence (sequence GeoQ1F: 5′-CCTCAGTTGCCATCATTAAGT-3′; sequence GeoQ2R. 5′-GGTATCGCAACTCTTTGTAC-3′) of the genomic DNA extracted from the enrichment cultures of well P16. This qPCR was performed in a total mix volume of 30 μL, composed of 15 μL of FluoCycleII Sybr reaction mix (Euroclone, Pero, Italy), 0.3 µL (1 µM) of each primer, 10.4 μL of nuclease-free water, and 4 μL of genomic DNA. Cycling conditions for these amplifications were 95 °C for 5 min, followed by 40 cycles of 95 °C for 20 s, 56 °C for 20 s, and 60 °C for 45 s, with acquisition of the fluorescence at the end of each 60 °C elongation step.

3. Results and Discussion

3.1. 1,2-DCA δ13C Fractionation in Microcosms

The periodical evaluation of 1,2-DCA concentration by GC-FID analyses showed almost complete consumption of the contaminant within 64 h for all the stimulated microcosms ENA (Figure 3, top). Complete 1,2-DCA consumption was also observed for the microcosms without amendment (natural conditions, NA), although it required a longer experimental time of about 15 days (Figure 3, bottom). These trends confirmed the high potential of biodegradation of the native consortium in the aquifer under natural conditions and particularly after lactate amendment (in accordance with [8,24]). Abiotic controls also showed a slight decrease in 1,2-DCA concentrations for NA microcosms only throughout the incubation period (15% maximum over 15 days, data not shown), most likely due to volatilization processes; such decrease in concentration due to abiotic process was taken into consideration during estimation of the kinetic parameters and enrichment factors. The calculated first-order constant rate values (k) of 1,2-DCA degradation kinetics and half-life (t1/2) values are 0.039 h−1 and 18 h, respectively, for the stimulated experiments and 0.011 h−1 and 66 h for those under natural conditions.
The metabolic pathway followed during 1,2-DCA degradation shows that the consumption of this contaminant can be associated to the direct formation of ethene, which, in the case of the amended experiments, reached its maximum concentration after several hours of incubation time; after reaching the peak, the ethene concentration started to decrease again (data not shown). Such a decrease appears to be the result of biodegradation. It is reasonable to suppose that, given the low residual concentration of 1,2-DCA, the bacterial consortium began to consume ethene. In many cases, 1,2-DCA dehalogenating bacteria are known to transform 1,2-DCA into vinyl chloride (VC) first, and to ethene in a second stage. In the present case, the absence of VC formation leads to the hypothesis that the degradation pathway involves a dihaloelimination mechanism, which favors the removal of the two halogen atoms at the same time, leading to the direct formation of the non-toxic compound.
With regards to the δ13C results, data from abiotic controls did not present any fractionation over time (data not shown), confirming the absence of any degradation processes over the incubation period. For the stimulated and natural conditions experiments, the consistent decrease in 1,2-DCA concentration was accompanied by a significant δ13C enrichment, with values up to +9.0‰ and +6.1‰, respectively (Figure 3).
Average enrichment factors of −11.3 ± 0.3‰ and −9.1 ± 0.3‰ with good linear correlation were obtained (R2 > 0.95) (Figure 3) respectively for the stimulated (ENA) and natural condition experiments (NA). Compared to the wide range for 1,2-DCA biodegradation enrichment factors, such a slight difference suggests similar degradation pathways either for the enriched or fresh cultures respectively during the stimulated (ENA) and natural condition (NA) experiments. Most likely the key microorganisms responsible for the contaminant degradation have not changed significantly during the enrichment cycles, other than being present in higher concentration and hence resulting in faster degradation rates.
Results from the microcosm experiments fall within the large range of enrichment factors documented in literature and associated to 1,2-DCA biodegradation, from approximately −3‰ to −33‰ [10,19,20,21,23]. While significantly higher than those related to an oxidation pathway (ranging from −3‰ to −5‰ [10]), the estimated enrichment factors were lower than those reported for dihaloelimnation pathways in the presence of Dehalogenimonas-containing culture and Dehalococcoides spp. (enrichment factors from −26‰ to −33‰, [21,23]). Hirschorn et al. [20] documented enrichment factors similar to those obtained in the present study in anaerobic enrichment cultures originating from contaminated sites, with values from −7.3 ± 0.2‰ to −16.7 ± 0.5‰; lactate stimulation was applied and the dihaloelimination reaction mechanism was identified as the predominant pathway responsible for biodegradation. Additionally, high ethene concentrations were measured similarly to those measured in the present study. These authors hypothesize that different enzymes or enzymatic reaction pathways (stepwise versus concerted dihaloelimination) may control isotopic fractionation during 1,2-DCA dihaloelimination. The enrichment factors were significantly higher than those related to an oxidation pathway characterized by the activity of monooxygenase and ranging from −3‰ to −5‰ [10].
The enrichments factors calculated in the present study can be used to characterize the 1,2-DCA isotopic signatures associated to dechlorination due to natural attenuation and for future biostimulation actions planned at the site (enhanced attenuation).

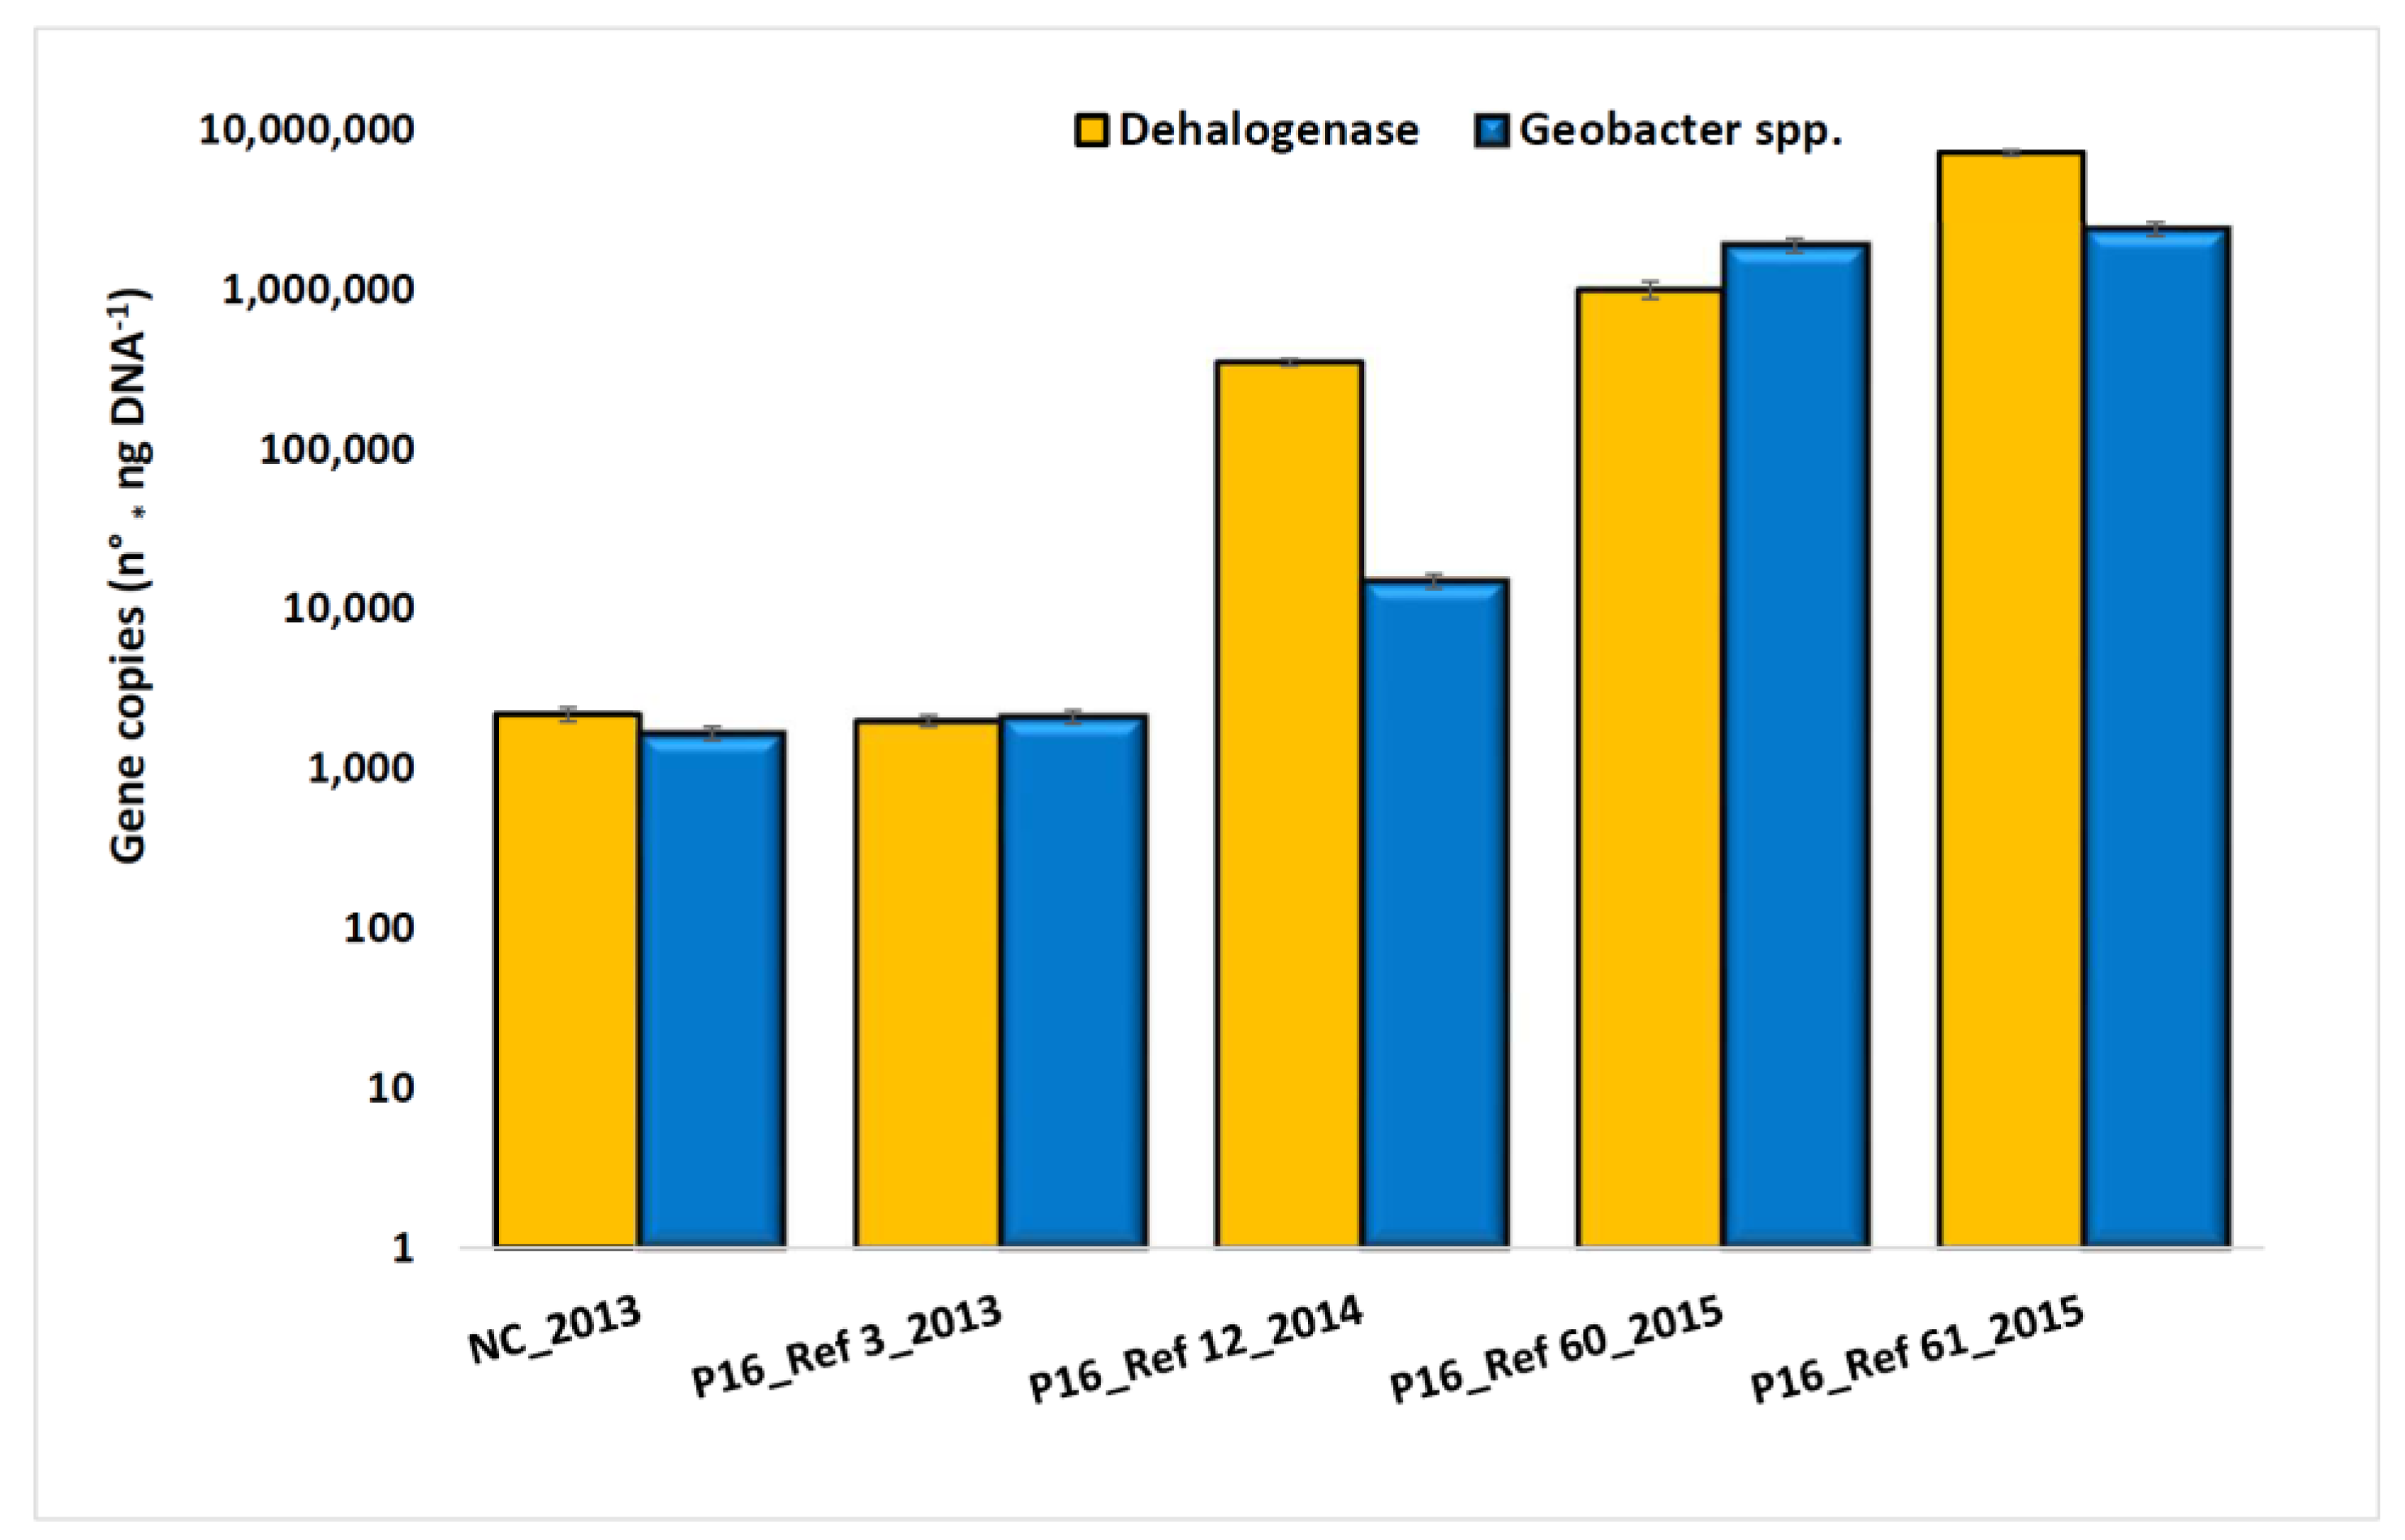
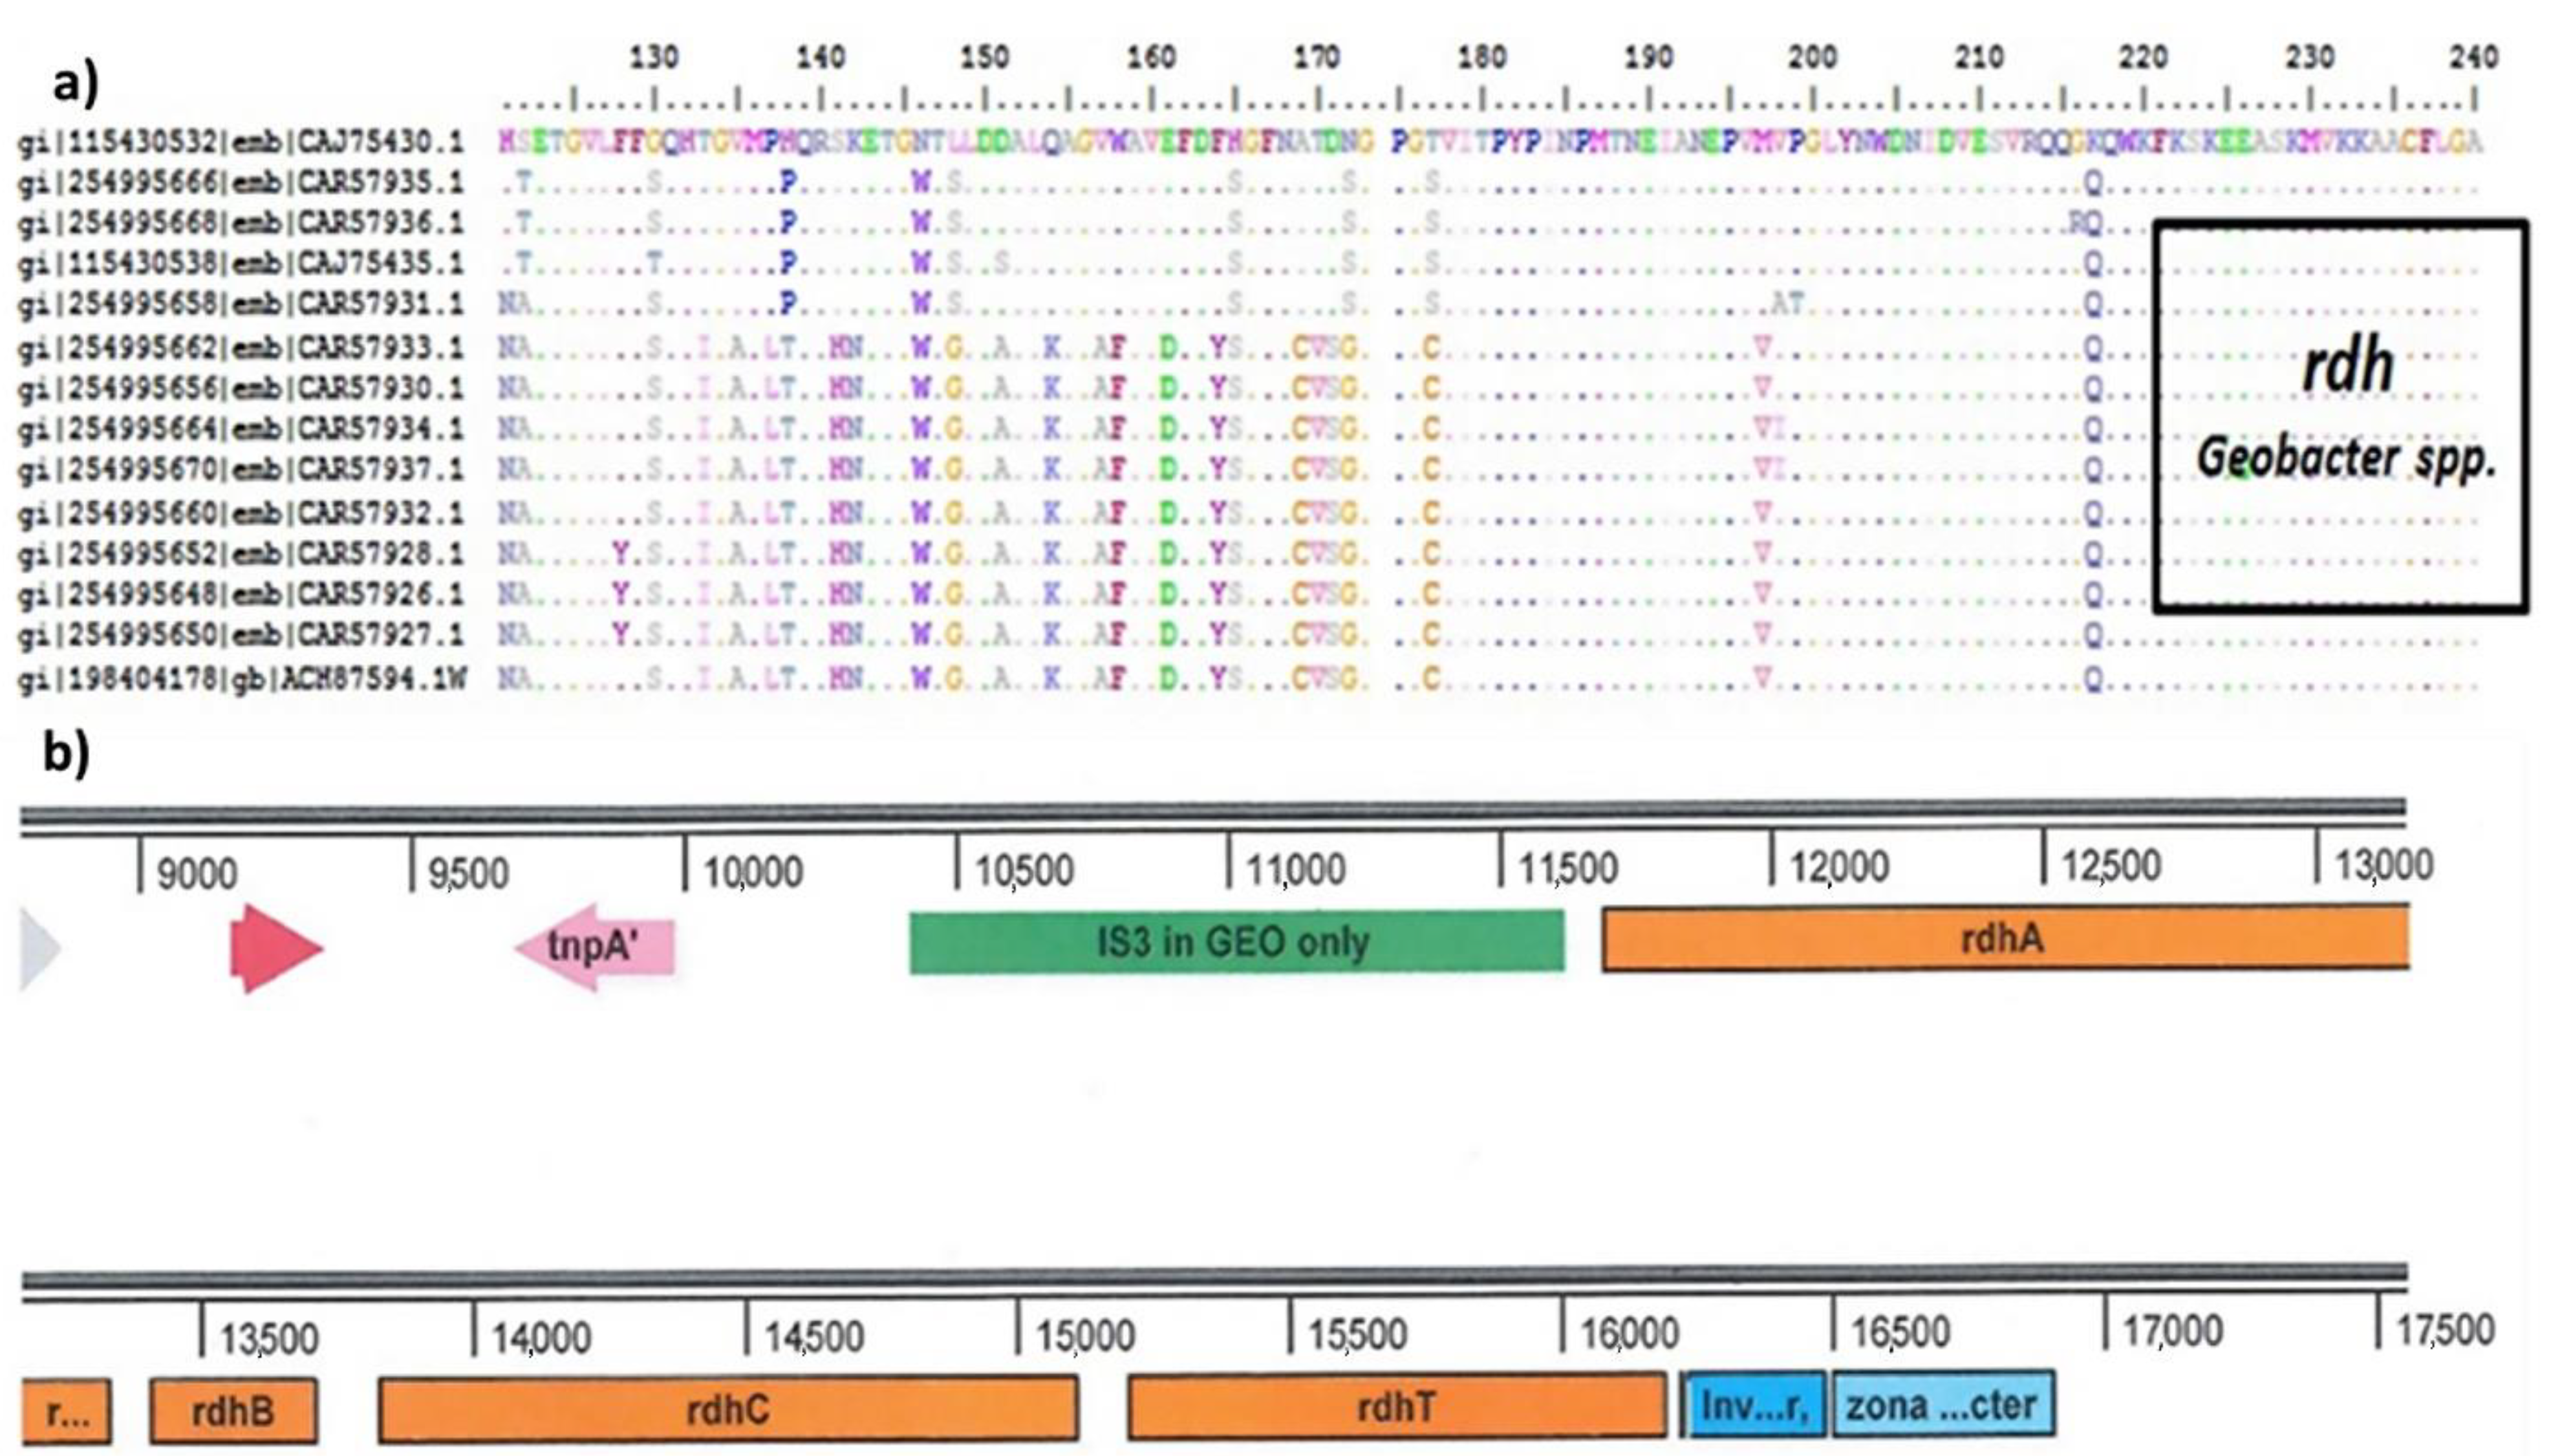
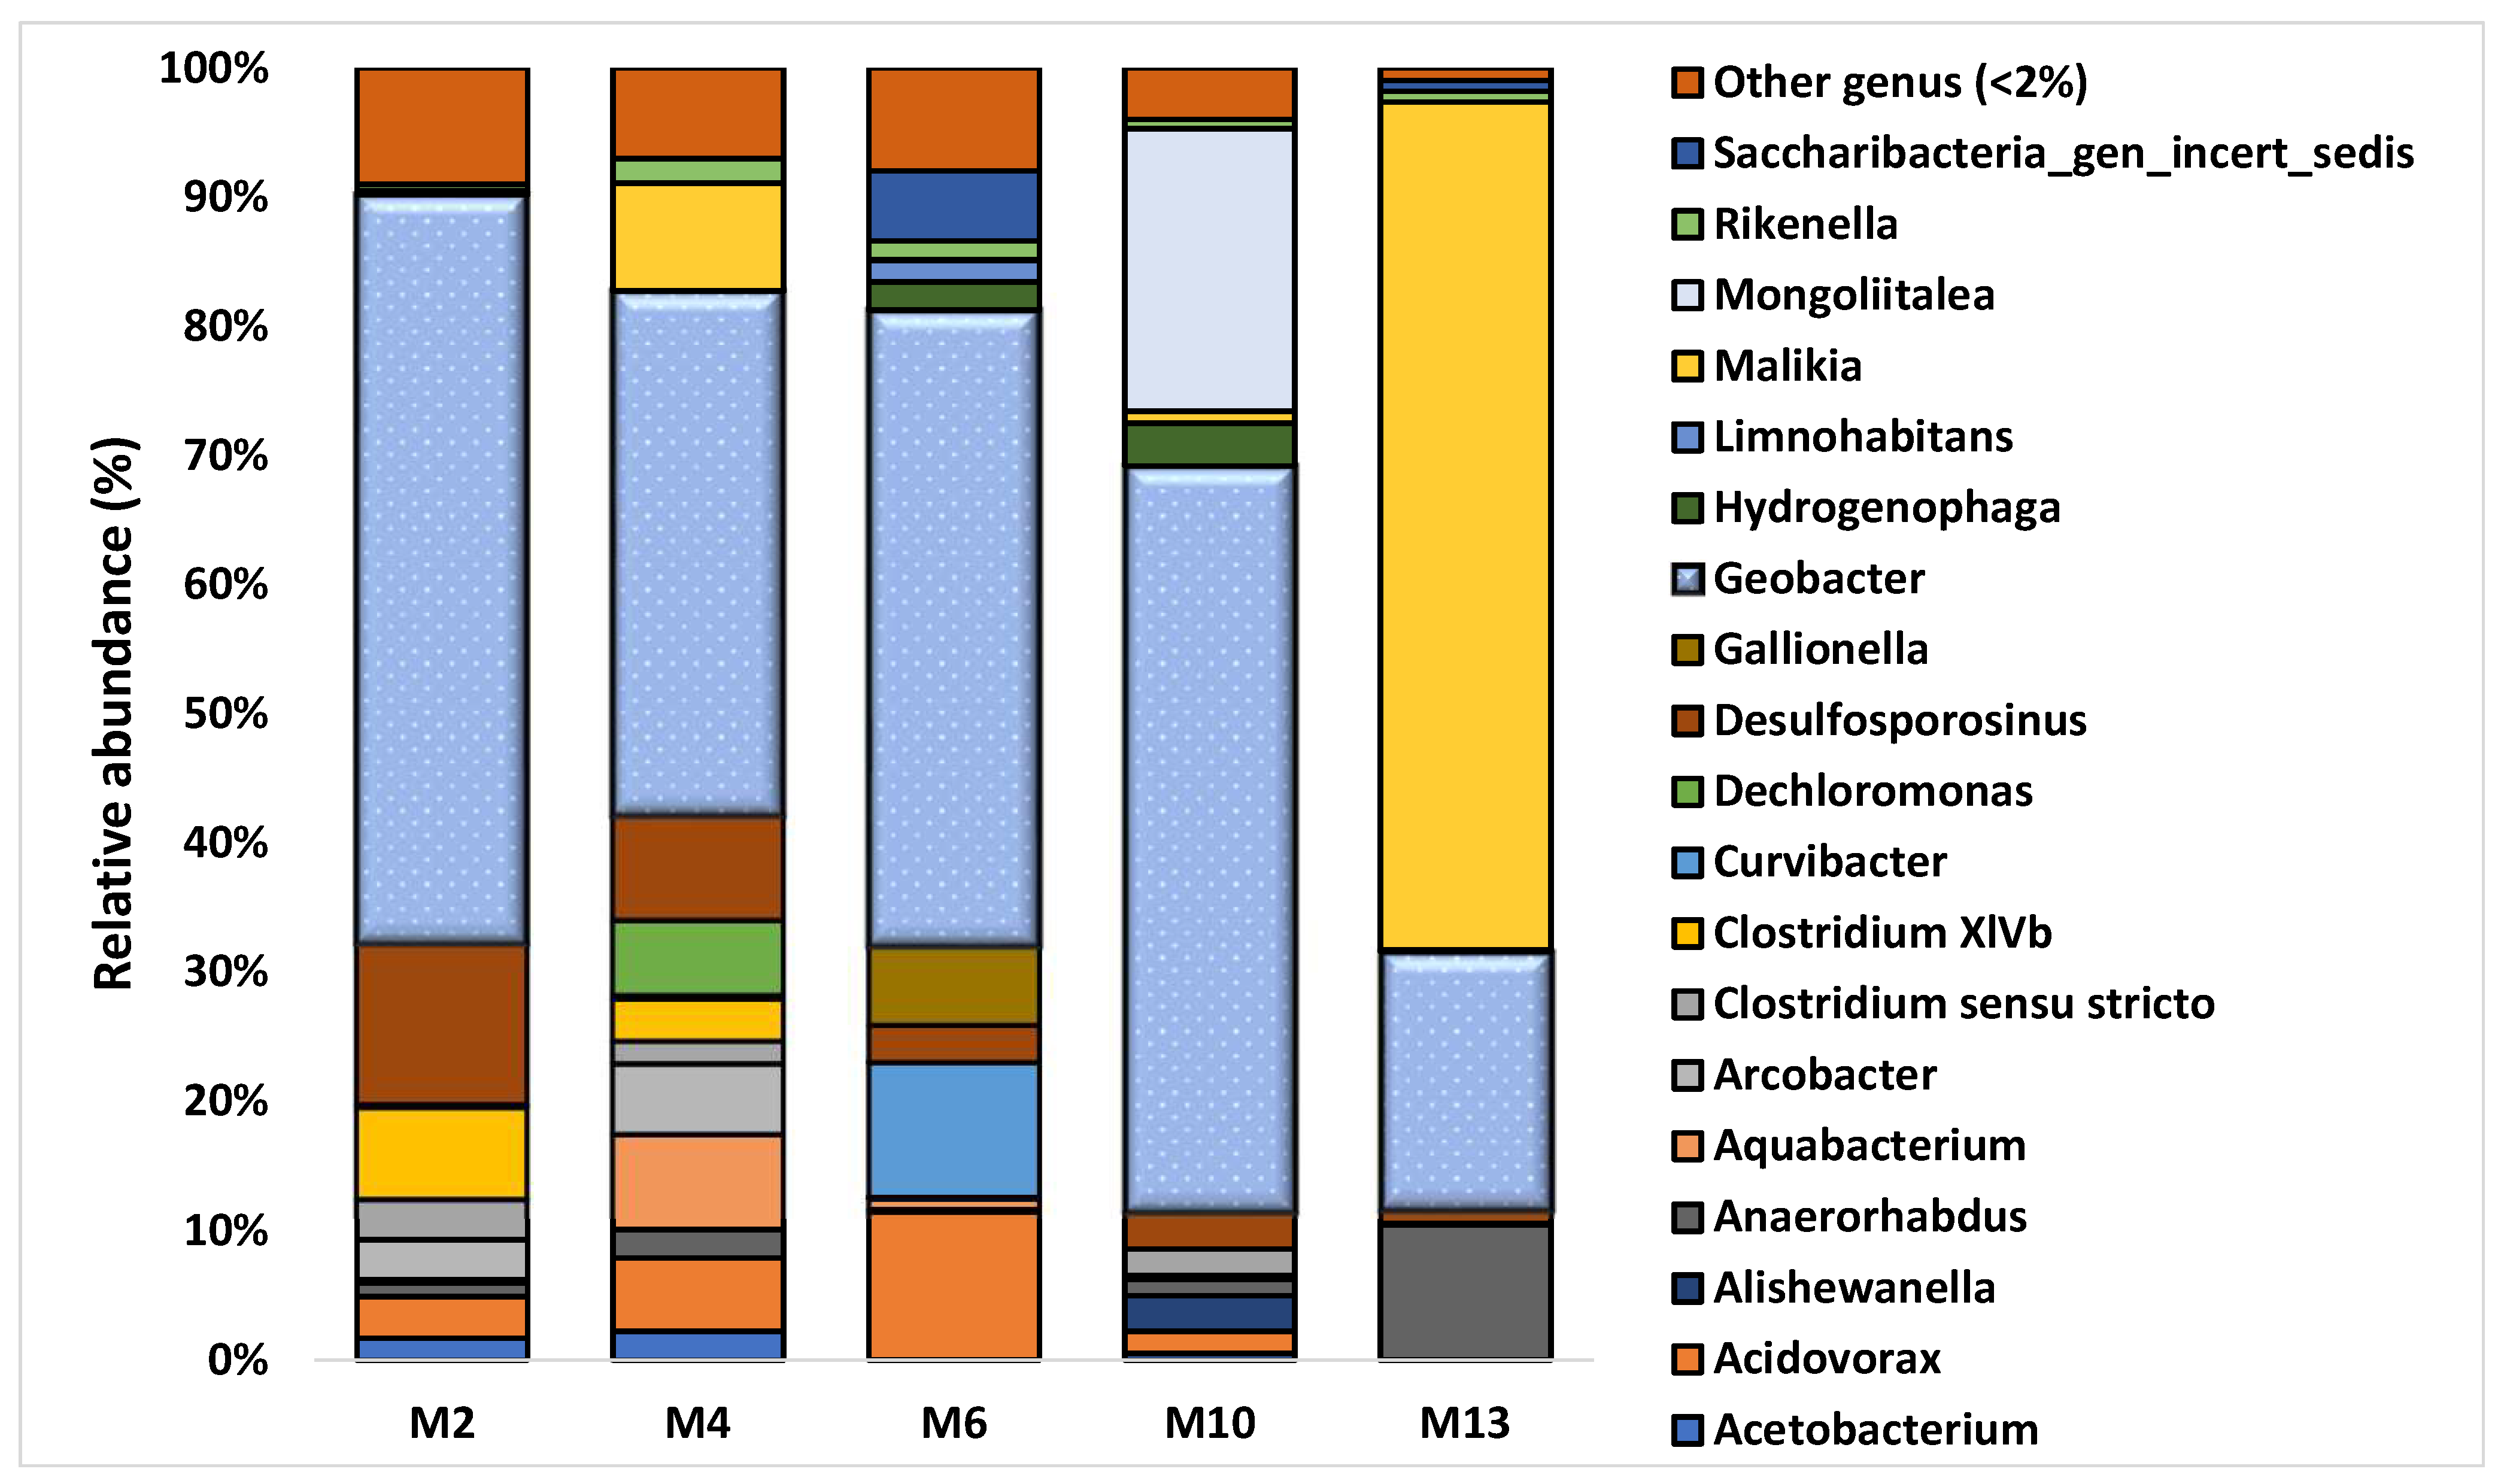
3.2. Characterization of Microbial Communities and Quantification of the Catabolic Gene and of Geobacter spp. from Microcosm Experiments

With the aim of a complete protocol for monitoring the attenuation processes in the pilot field trial, the presence of the catabolic gene rdh was determined in the genomic DNA extracted from the enriched cultures of the well P16 (Figure 4). During the experiments, the values of the number of copies of the gene increased from an order of 103 in natural condition to an order of 106 in the enriched cultures. Interestingly, in the enriched cultures the distribution pattern of this gene is consistent with the presence at similar levels of the Geobacter spp. (that is, number of copies of the specie increase from an order of 103 in the first refresh to an order of 105–106 in the last two refreshed cultures). The presence and quantity of other dehalogenating strains that could lead to a similar pathway (that is, Dehalococcoides spp. and Dehalogenimonas spp.) were also investigated, showing concentrations under the threshold value associated to real activity (that is, 103).
In addition to this evidence, the following metagenomic sequencing indicates a physical linkage of the reductive dehalogenase gene to the Geobacter chromosome (see Figure 5a,b). These results, also reported in the international application patent (WO2018/137798 A1), represent a deeper interpretation of the first results described in [29].

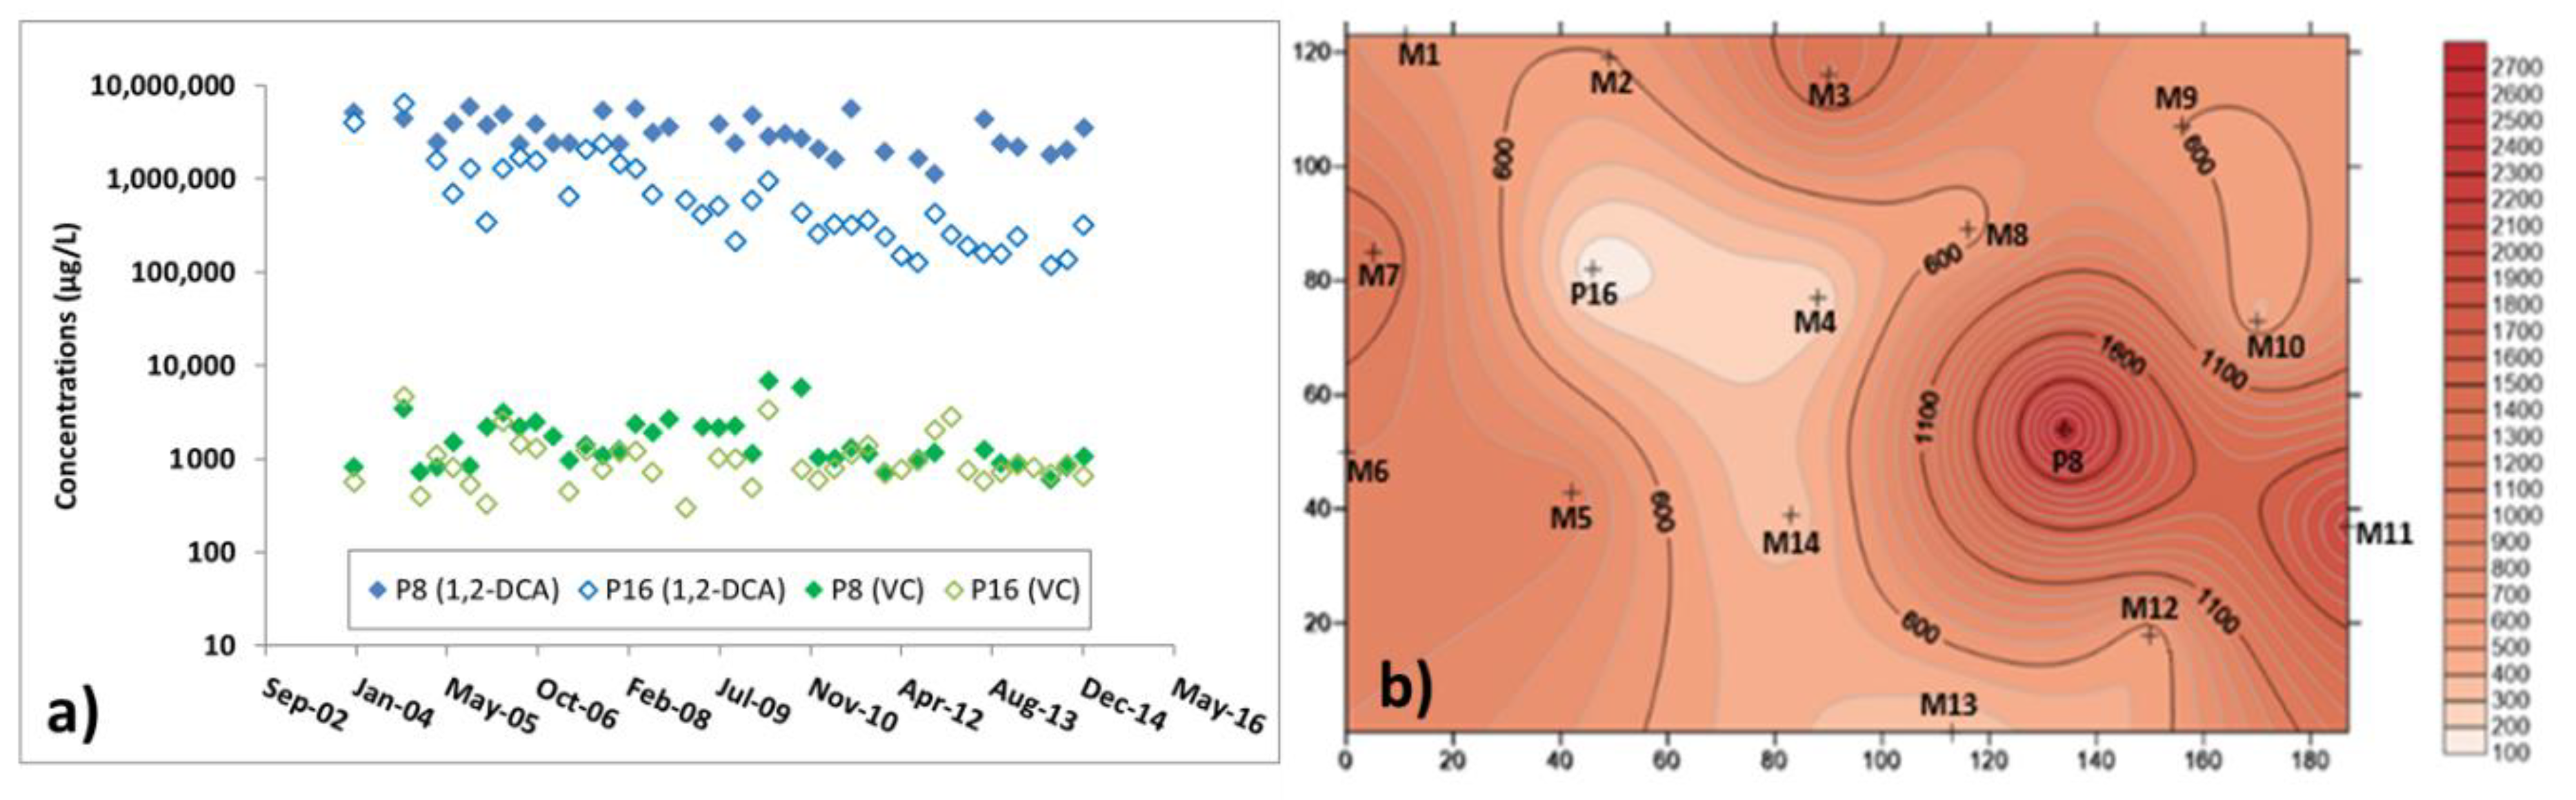
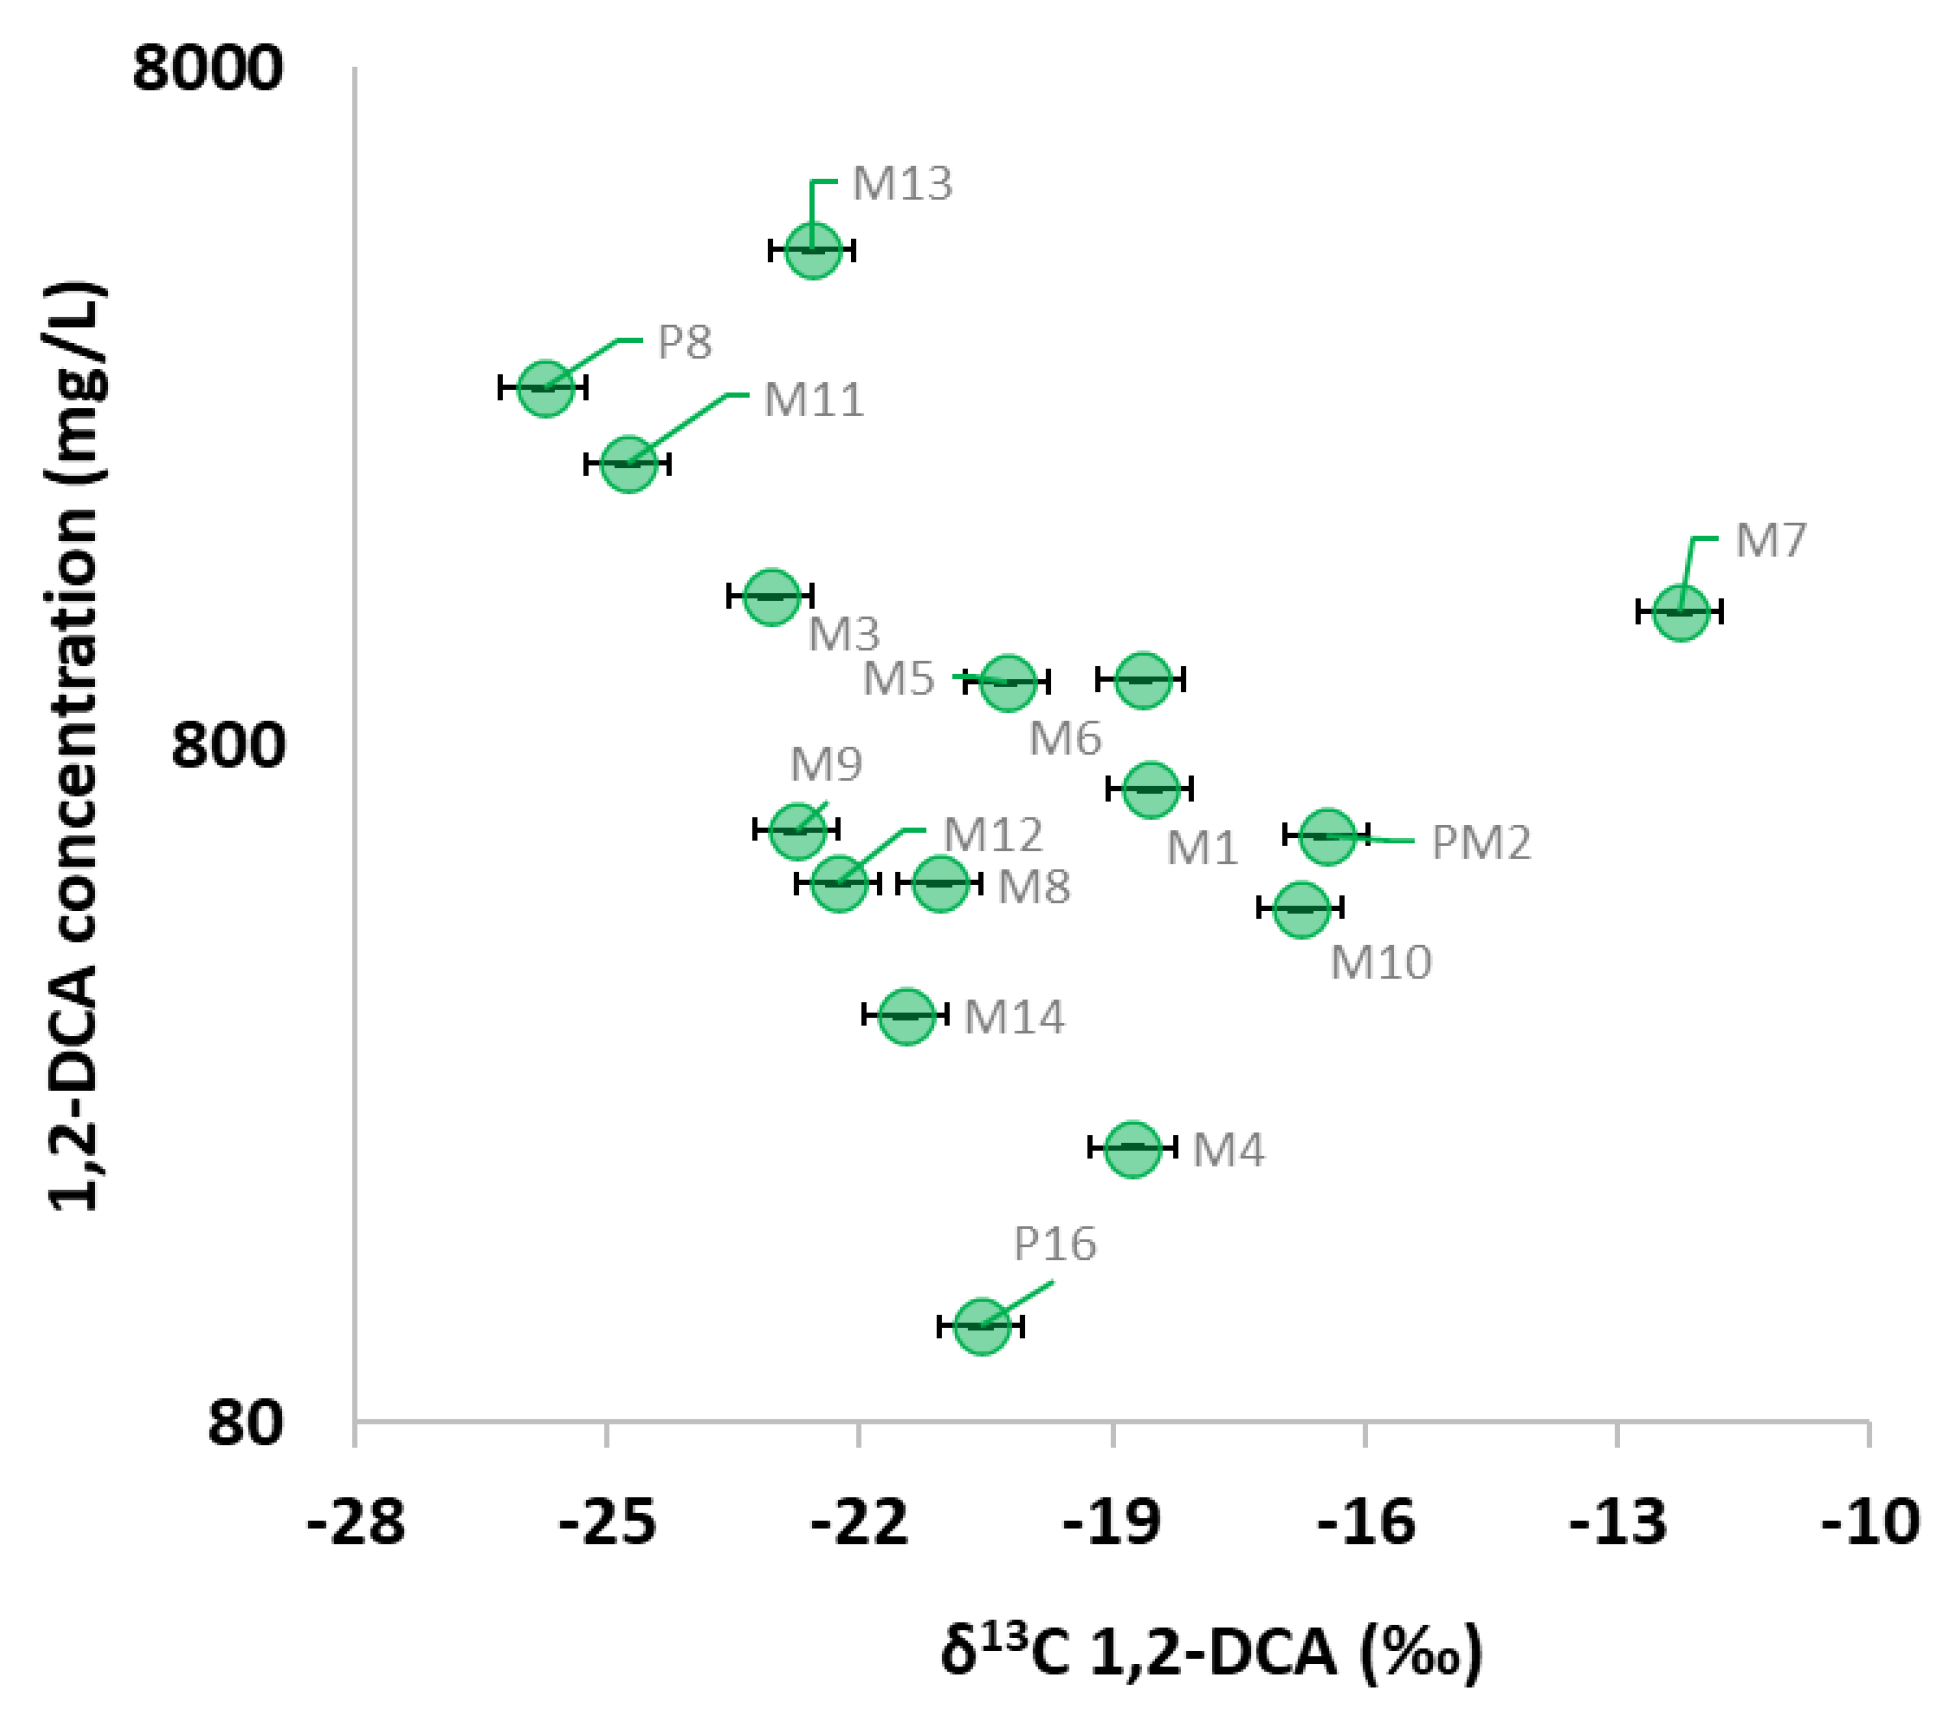
3.3. Microbiological and Isotopic Results from the Pilot Area

1,2-DCA concentration varied significantly in the pilot area between the monitoring points, for example, decreasing from 4300 mg/L to 111 mg/L within 8 m distance. Furthermore, concentrations do not follow a clear spatial trend or delineate or distribute along a plume direction (Figure 3). Concentrations are most likely affected not only by degradation processes but also by other processes, such as diffusion, due to the proximity to the source area and due to the low permeability materials characterizing the aquifer.
Nevertheless, significant enrichment of 13C has been measured. 13C values vary from −25.8‰ to −12.3‰, toward more enriched values at lower 1,2-DCA concentrations (Figure 6). The only exceptions are represented by M13, with a trend toward enriched 13C values but with increased concentrations and M7, with a relatively higher 13C enrichment compared to other monitoring points. These differing trends could be related to the presence of a dissolution process from the nearby source and/or attenuation by non-degradative process(es), related for example to 1,2-DCA transport along the aquifer. It also cannot be excluded that different biodegradation processes are insisting in the vicinity, as indicated by a completely different biological and molecular characterization at least for M13 (Figure 7).
Hence P8, which showed almost no reduction in 1,2-DCA concentrations between 2004 to 2015 (Figure 2a), presents the most depleted 13C value of -25.8‰. On the contrary P16, where the 1,2-DCA concentrations historically showed a decrease over time (Figure 2a), an enriched δ13C value of −20.6‰ suggests the existence of a biodegradation process in containing and reducing 1,2-DCA concentrations at the site.
While most of the literature on CSIA applications to chlorinated solvents addresses characterization issues related to groundwater contaminant plumes, few studies have investigated CSIA application within source areas. On a pilot scale experiment, Morrill et al. [30] demonstrated that continuous dissolution processes in the vicinity of a PCE source prevent the use of 13C for biodegradation estimation. On the contrary, the present study shows larger δ13C enrichment for 1,2-DCA within several meters from the suspected source, hence demonstrating that δ13C data can still be possibly used to estimate biodegradation processes in the case of 1,2-DCA in the vicinity of a source area: this possibility probably derives from the high degradation rates for 1,2-DCA compared to PCE.
By using the site-specific enrichment factors of −9.1‰ and −11.3‰ obtained by the microcosm experiments, degradation extents over approximately 70 to 80% were estimated, highlighting the importance of natural attenuation processes in reducing 1,2-DCA concentrations in the vicinity of the source.
With regards to the microbiological results, the study on the bacterial population determined by Illumina sequencing confirms the presence of an anaerobic aquifer environment. In fact, the species distribution of the native consortia showed that Geobacter spp. (an iron and manganese reducing bacterium) is the prevalent species at the site, with a relative abundance ranging from 20% (well M13) to 58% (wells M2 and M10) of the total rRNA 16S gene (Table 1 and Figure 7). Furthermore, a sulphate-reducing species (that is, relative abundance of Desulfosporosinus spp. equal to 12% in well M2 and 8% in well M4) and other anaerobic bacteria such as Clostridium spp. (relative abundance of 10% in well M2 and 5% in well M4), are consistently present. As reported in different studies [31,32,33], all bacteria belonging to these groups can play a role in both hydrocarbons and chlorinated solvents degradation. On the other hand, in this environment methanogens do not appear to have a significant role and the detection of low levels of Dehalogenimonas spp. (group included in the cluster “Other genus < 2%”), suggesting a possible minor role of this organohalide-respirer at the site.
Conversely, the prevalence of Malikia spp. in well M13 (relative abundance of 66%), that belongs to the aerobic family Comamonadaceae, could be considered anomalous in this predominantly anaerobic environment. However, the close co-existence of anaerobes and aerobes has been shown in similar heterogeneous aquifer environments and it has been demonstrated to occur in liquid culture by Aburto et al. [34].
To confirm the findings obtained in the microcosms, the presence of both the dehalogenase catabolic gene rdh and the rRNA gene indicating the presence of Geobacter spp. were determined in the genomic DNA extracted from groundwater collected in 2015 (June) in the selected area (M2, M4, M6, M10 and M13). Both markers were detected at the site with the gene rdh concentration (gene associated to the dihaloelimination pathway) present at values ranging from 105 to 106 of gene copy number (Table 1). These values are similar to those assessed in the last enriched cultures set up with samples originating from well P16 (Figure 4). Moreover, the values of the rdh gene copy number in the groundwater sampled from the area closely matched the level of 1,2-DCA, with the highest value of the copies of the gene in monitoring well M6, which also shows the highest concentration of 1,2-DCA equal to 1000 ppm (Table 1). On the other hand, the relative abundance of Geobacter spp. is almost the same in all the native microbial communities of the different wells, with the only exception for sample M13, where the lowest Geobacter rRNA gene copy number value was recorded.
The results obtained separately through molecular and isotopic analyses show good agreement, confirming the combination of the proposed techniques as an excellent monitoring method in cases of application of bioremediation as remediation treatment.
Robust natural attenuation was demonstrated by the presence and activity of biological markers such as dehalogenases (novel rdh genes and their RNA expression), species-specific markers (detected and quantified by qPCR and metagenomics) and 1,2-DCA isotopic analysis in cultures and in situ. Data from laboratory cultures, from well water, and from stable consortia defined the reactions occurring and optimal amendments to accelerate them.
Site characterization by molecular techniques revealed that Geobacter spp. appears as the primary species responsible for this degradation process. This result was combined with the amount of RD genes (rdhs) determined by quantitative PCR (qPCR), to evaluate the possible contribution of NA at the site. Furthermore, in order to proceed with a pilot test of enhanced natural attenuation (ENA), an integrative monitoring protocol including isotopic (that is, δ13C), microbiological (that is, Illumina sequencing) and molecular analysis (that is, quantification of gene rdh) was adopted.

3.4. Additional Insights from the Dual 13C and 37Cl Isotopic Approach at the Pilot Area

With regards to 37Cl, values from +2.0‰ to +8.6‰ were measured. A trend similar to that of 13C is observed, with 37Cl moving toward more enriched values at lower 1,2-DCA concentrations (data not shown), confirming the importance of biodegradation processes at the site. By plotting 13C over 37Cl data, results correlate quite consistently to a linear trend (Figure 8). Such behavior indicates possibly a major, or multiple releases over time of 1,2-DCA (but characterized by similar 13C and 37Cl values) followed by biodegradation. Most likely, in the case of different sources, scattered 13C/37Cl values would have been found; such constraint, among several other conditions, is very important for estimating biodegradation extents at contaminated sites via application of the Rayleigh equation.
By considering the dual-isotope approach using δ37Cl and δ13C, a linear correlation with a Λ of 1.9 ± 0.5 was obtained, although with a low R2 (<0.90), (results from M13 and the nearby M12 were not considered because of the different microbiological results). One of the reasons for such low correlation is that the measured fractionations still remain restrained, compared to potentially larger fractionations, for example for carbon there were large enrichment factors of −9.1‰ and −11.3‰ estimated from the microcosm experiments. The obtained Λ of 1.9 ± 0.5 is very similar to the Λ of 2.1 ± 0.1 documented by other authors also at field site conditions [23]. By comparing the obtained Λ to measured Λ for specific pathways some considerations can still be made. The obtained Λ is significantly different from the Λ indicated in the case of biodegradation processes by Dehalococcoides spp. containing microcosms, characterized by higher Λ of 6.8 ± 0.2, confirming that Dehalococcoides spp. activity may not be relevant at the site. A difference also with oxidation processes in the case of Pseudomonas spp. is suggested, although because of the restrained fractionation such evidence cannot be ruled out by isotopic evidence only. Oxidation containing Pseudomonas spp. microcosm experiments [23] showed a Λ of 0.78 ± 0.03., smaller than the Λ of 1.9 ± 0.5 measured in this study. In accordance with this, biological and molecular analysis did not exhibit a significant presence of Dehalococcoides spp., nor Pseudomonas spp., this latter is frequently detected along with other aerobic oxidative species in subsoil. On the contrary, Λ is similar to the Λ of 1.89 ± 0.02 available in literature for dihaloelimination by Dehalogenimonas spp. containing microcosms. The dihaloelimination pathway is confirmed by the absence of VC (or presence only in trace concentration) and also by the formation solely of ethene instead of VC during the microcosm biodegradation experiments. Still, no significant Dehalogenimonas spp. were revealed by the biological and molecular analyses; thus, other species must be responsible for 1,2-DCA dihaloelimination in the field. Since Geobacter spp. showed a large enrichment during the refresh microcosm experiments phase and was shown to be among the dominant species within the characterized wells and initial fresh microcosms, it is proposed that Geobacter spp. may be the main species responsible for 1,2-DCA biodegradation. Because analogues δ 37Cl and δ13C fractionations (similar Λ) were observed, it is possible that Geobacter spp. dihaloelimination mechanisms could be similar to that proposed in [23] for Dehalogenimonas spp., namely a concerted mechanism with similar reduction mechanism of the halogenated substrate via halogen-cobalt bond formation in microbial reductive dehalogenases [35].

4. Conclusions

The potential for natural and enhanced attenuation was demonstrated by the use of anaerobic microcosm experiments, which showed almost complete degradation within 15 days and several hours by the use of native (fresh) and enriched cultures under natural (NA) and stimulated conditions (ENA) respectively. Degradation occurs by dichloroelimination hence no other chlorinated compounds (in particular VC, more toxic) are produced.
As part of an integrated monitoring protocol BMTs, techniques such as qPCR and NGS, as well as CSIA were developed from the laboratory experiments. Geobacter spp. as well as high levels of rdh were selected as indicative of biodegradation activity since they appear linked and responsible for the biodegradation pathway. Carbon stable isotope analysis confirms to be a proper tracer, with enrichment factors of −9.1‰ and −11.3‰ obtained for natural and enhanced conditions, respectively.
Significant enrichment on 13C but also 37Cl in combination with relative high presence of Geobacter spp. were documented in the field, at a detailed characterization level within the pilot area. The revealed decrease in concentration in the vicinity of the source area denoted efficient NA processes, hence reducing both 1,2-DCA concentrations and plume spreading at the natural conditions.
Dichloroelimination was confirmed to occur at the pilot scale by the combined use of 13C and 37Cl, moreover site specific 13C enrichment factors led to estimate an extended degradation up to 70 to 80%.
The described coupled approach allows reducing any interpretative uncertainties. While CSIA itself can provide evidence for biodegradation processes and may be used for both qualitative and quantitative estimation, the interpretation is strengthened by the integration with BMTs, which are powerful tools to gain insights into the structure of the microbial community. By identifying the strain involved, BMTs offer the possibility of confirming the presence of microbial communities suitable for those natural attenuation processes assessed by the use of stale isotopes. Moreover, the functional biomarkers identification allow identifying the most likely degradation pathways occurring; such information is crucial when using stable isotope data to evaluate natural attenuation processes as fractionations are intimately related to the site specific degradation pathways.
This paper highlights the relevance of the here proposed fine-tuned protocol in characterizing and estimating natural attenuation processes among groundwater remediation practices; moreover, by coupling BMTs and CSIA, lab and field results advocate the NA processes’ role in reducing contaminant concentrations in the vicinities of source areas and not only along groundwater contaminants’ plumes.

Author Contributions

G.C., F.d.F. and I.P. were involved both in the design of the study and in the processing of all the biological parts of the study, mainly focused on the set-up of the several microcosms including the chemical monitoring of the contaminant. L.A., M.M. and O.S.-S. developed the hydrogeological aspects and the isotopic part. All the above authors made fairly equal contributions to the writing of the paper. L.M.Z. was the referent for all the field activities and documentation. All authors have read and agreed to the published version of the manuscript.

Funding

This research was funded by Eni Rewind S.p.A. within the two projects “Novel Water treatment Processes”-Line “Chloro-organics biodegradation” and “Fingerprinting project”.

Institutional Review Board Statement

Not applicable.

Informed Consent Statement

Informed consent was obtained from all subjects involved in the study.

Data Availability Statement

All the data are represented in figures. No others databases area available.

Acknowledgments

Thanks also to Umberto Traldi, Thermo Fisher Scientific, and all the staff from the isotopic facility of ENI S.p.a., in particular Corrado Barbieri, for their kind help and assistance with regard to the isotope analysis.). Thanks also to Parco Tecnologico Padano (Lodi, Italy) that carried out the Illumina-MiSeq® sequencing.

Conflicts of Interest

The authors declare no conflict of interest. The funders had no role in the design of the study, in the analyses and interpretation of data and in the writing of the manuscript.

References

  1. United States Environmental Protection Agency. Proposed Designation of 1,2-Dichloroethane (CASRN 107-06-2) as a High-Priority Substance for Risk Evaluation; U.S. EPA.: Washington, DC, USA, 22 August 2019.
  2. Falta, R.W.; Bulsara, N.; Henderson, J.K.; Mayer, R.A. Leaded-Gasoline Additives Still Contaminate Groundwater. Environ. Sci. Technol. 2005, 39, 378A–384A. [Google Scholar] [CrossRef]
  3. Voudrias, E.A. Pump-and-Treat Remediation of Groundwater contaminated by Hazardous Waste: Can it really be achieved? Global Nest J. 2001, 3, 1–10. [Google Scholar]
  4. Chen, Q.; Fan, G.; Na, W.; Liu, J.; Cui, J.; Li, H. Past, Present, and Future of Groundwater Remediation Research: A Scien-tometric Analysis. Int. J. Environ. Res. Public Health 2019, 16, 3975. [Google Scholar] [CrossRef] [Green Version]
  5. De Wildeman, S.; Diekert, G.; Van Langenhove, H.; Verstraete, W. Stereoselective Microbial Dehalorespiration with Vicinal Dichlorinated Alkanes. Appl. Environ. Microbiol. 2003, 69, 5643–5647. [Google Scholar] [CrossRef] [Green Version]
  6. Duhamel, M.; Edwards, E.A. Microbial composition of chlorinated ethene-degrading cultures dominated by Dehalococ-coides. FEMS Microbiol. Ecol. 2006, 58, 538–549. [Google Scholar] [CrossRef] [PubMed]
  7. Duhamel, M.; Edwards, E.A. Growth and yields of dechlorinators, acetogens, and methanogens during reductive dechlo-rination of chlorinated ethenes and dihaloelimination of 1,2-dichloroethane. Environ. Sci. Technol. 2007, 41, 2303–2310. [Google Scholar] [CrossRef]
  8. Marzorati, M.; Balloi, A.; de Ferra, F.; Corallo, L.; Carpani, G.; Wittebolle, L.; Verstraete, W.; Daffonchio, D. Bacterial di-versity and reductive dehalogenase redundancy an a 1,2-dichloroethane-degradaing bacterial consortium enriched from a contaminated aquifer. Microb. Cell Fact. 2010, 9, 12. [Google Scholar] [CrossRef] [PubMed] [Green Version]
  9. Grostern, A.; Edwards, E.A. Characterization of a Dehalobacter Coculture That Dechlorinates 1,2-Dichloroethane to Eth-ene and Identification of the Putative Reductive Dehalogenase Gene. Appl. Environ. Microbiol. 2009, 75, 2684–2693. [Google Scholar] [CrossRef] [Green Version]
  10. Hirschorn, S.K.; Dinglasan, M.J.; Elsner, M.; Mancini, S.A.; Lacrampe-Couloume, G.; Edwards, E.A.; Lollar, B.S. Path-way dependent isotopic fractionation during aerobic biodegradation of 1,2-dichloroethane. Environmen. Sci. Technol. 2004, 38, 4775–4781. [Google Scholar] [CrossRef] [PubMed]
  11. Ansorge, W.J. Next-generation DNA sequencing techniques. New Biotechnol. 2009, 25, 195–203. [Google Scholar] [CrossRef] [PubMed]
  12. Marchesi, M.; Alberti, L.; Shouakar-Stash, O.; Pietrini, I.; de Ferra, F.; Carpani, G.; Aravena, R.; Franzetti, A.; Stella, T. 37Cl-compound specific isotope analysis and assessment of functional genes for monitoring monochlorobenzene (MCB) bio-degradation under aerobic conditions. Sci. Total Environ. 2018, 619–620, 784–793. [Google Scholar] [CrossRef]
  13. Hunkeler, D.; Aravena, R.; Butler, B.J. Monitoring Microbial Dechlorination of Tetrachloroethene (PCE) in Groundwater Using Compound-Specific Stable Carbon Isotope Ratios: Microcosm and Field Studies. Environ. Sci. Technol. 1999, 33, 2733–2738. [Google Scholar] [CrossRef] [Green Version]
  14. Meckenstock, R.U.; Morasch, B.; Griebler, C.; Richnow, H.H. Stable isotope fractionation analysis as a tool to monitor biodegradation in contaminated aquifers. J. Contam. Hydrol. 2004, 75, 215–255. [Google Scholar] [CrossRef] [PubMed]
  15. Hunkeler, D.; Meckenstock, R.U.; Sherwood Lollar, B.; Schmidt, T.C.; Wilson, J.T. CSIA EPA “A Guide for Assessing Bio-Degradation and Source Identification of Organic Groundwater Contaminants Using Compound Specific Isotope Analysis (CSIA)”; EPA 600/R-08/148; U.S. Environmental Protection Agency: Washington, DC, USA, 2008.
  16. Carter, J.F.; Barwick, V.J. Good Practice Guide for Isotope Mass Spectrometry; FIRMS: Bristol, UK, 2011; ISBN 978-0-948926-31-0. [Google Scholar]
  17. Alberti, L.; Marchesi, M.; Trefiletti, P.; Aravena, R. Compound-Specific Isotope Analysis (CSIA) Application for Source Apportionment and Natural Attenuation Assessment of Chlorinated Benzenes. Water 2017, 9, 872. [Google Scholar] [CrossRef] [Green Version]
  18. Hunkeler, D.; Aravena, R. Evidence of Substantial Carbon Isotope Fractionation among Substrate, Inorganic Carbon, and Biomass during Aerobic Mineralization of 1,2-Dichloroethane byXanthobacter autotrophicus. Appl. Environ. Microbiol. 2000, 66, 4870–4876. [Google Scholar] [CrossRef] [PubMed] [Green Version]
  19. Hunkeler, D.; Aravena, R.; Cox, E. Carbon Isotopes as a Tool to Evaluate the Origin and Fate of Vinyl Chloride: La-boratory Experiments and Modeling of Isotope Evolution. Environmen. Sci. Technol. 2002, 36, 3378–3384. [Google Scholar] [CrossRef] [PubMed] [Green Version]
  20. Hirschorn, S.K.; Dinglasan-Panlilio, M.J.; Edwards, E.A.; Lacrampe-Couloume, G.; Lollar, B.S. Isotope analysis as a natural reaction probe to determine mechanisms of biodegradation of 1,2-dichloroethane. Environ. Microbiol. 2007, 9, 1651–1657. [Google Scholar] [CrossRef]
  21. Schmidt, M.; Lege, S.; Nijenhuis, I. Comparison of 1,2-dichloroethane, dichloroethene and vinyl chloride carbon stable isotope fractionation during dechlorination by two Dehalococcoides strains. Water Res. 2014, 52, 146–154. [Google Scholar] [CrossRef]
  22. Palau, J.; Shouakar-Stash, O.; Mortan, S.H.; Yu, R.; Rosell, M.; Marco-Urrea, E.; Freedman, D.L.; Aravena, R.; Soler, A.; Hunkeler, D. Hydrogen Isotope Fractionation during the Biodegradation of 1,2-Dichloroethane: Potential for Pathway Identification Using a Multi-element (C, Cl, and H) Isotope Approach. Environ. Sci. Technol. 2017, 51, 10526–10535. [Google Scholar] [CrossRef]
  23. Palau, J.; Yu, R.; Mortan, S.H.; Shouakar-Stash, O.; Rosell, M.; Freedman, D.L.; Sbarbati, C.; Fiorenza, S.; Aravena, R.; Marco-Urrea, E.; et al. Distinct Dual C–Cl Isotope Fractionation Patterns during Anaerobic Biodegradation of 1,2-Dichloroethane: Potential To Characterize Microbial Degradation in the Field. Environ. Sci. Technol. 2017, 51, 2685–2694. [Google Scholar] [CrossRef] [Green Version]
  24. Marzorati, M.; De Ferra, F.; Van Raemdonck, H.; Borin, S.; Allifranchini, E.; Carpani, G.; Serbolisca, L.; Verstraete, W.; Boon, N.; Daffonchio, D. A Novel Reductive Dehalogenase, Identified in a Contaminated Groundwater Enrichment Culture and in Desulfitobacterium dichloroeliminans Strain DCA1, Is Linked to Dehalogenation of 1,2-Dichloroethane. Appl. Environ. Microbiol. 2007, 73, 2990–2999. [Google Scholar] [CrossRef] [Green Version]
  25. Marzorati, M.; Borin, S.; Brusetti, L.; Daffonchio, D.; Marsilli, C.; Carpani, G.; De Ferra, F. Response of 1,2-dichloroethane-adapted microbial communities to ex-situ biostimulation of polluted groundwater. Biogeochemistry 2005, 17, 41–56. [Google Scholar] [CrossRef]
  26. Edgar, R.C. Search and clustering orders of magnitude faster than BLAST. Bioinformatics 2010, 26, 2460–2461. [Google Scholar] [CrossRef] [Green Version]
  27. Wang, Q.; Garrity, G.M.; Tiedje, J.M.; Cole, J.R. Naïve Bayesian classifier for rapid assignment of rRNA sequences into the new bacterial taxonomy. Appl. Environ. Microbiol. 2007, 73, 5261–5267. [Google Scholar] [CrossRef] [PubMed] [Green Version]
  28. Espinoza-Tofalos, A.; Daghio, M.; Palma, E.; Aulenta, F.; Franzetti, A. Structure and Functions of Hydrocarbon-Degrading Microbial Communities in Bioelectrochemical Systems. Water 2020, 12, 343. [Google Scholar] [CrossRef] [Green Version]
  29. Merlino, G.; Balloi, A.; Marzorati, M.; Mapelli, F.; Rizzi, A.; Lavazza, D.; de Ferra, F.; Carpani, G.; Daffonchio, D. Di-verse Reductive Dehalogenases Are Associated with Clostridiales-Enriched Microcosms Dechlorinating 1,2-Dichloroethane. BioMed Res. Int. 2015, 2015, 242856. [Google Scholar] [CrossRef] [PubMed] [Green Version]
  30. Morrill, P.L.; Sleep, B.E.; Seepersad, D.J.; McMaster, M.L.; Hood, E.D.; LeBron, C.; Major, D.W.; Edwards, E.A.; Sherwood Lollar, B. Variations in expression of carbon isotope fractionation of chlorinated ethenes during biologically en-hanced PCE dissolution close to a source zone. J. Contam. Hydrol. 2009, 110, 60–71. [Google Scholar] [CrossRef]
  31. Yuan, S.Y.; Chang, B.V. Anaerobic degradation of five polycyclic aromatic hydrocarbons from river sediment in Taiwan. J. Environ. Sci. Health B 2007, 42, 63–69. [Google Scholar] [CrossRef] [PubMed]
  32. Foght, J. Anaerobic Biodegradation of Aromatic Hydrocarbons: Pathways and Prospects. J. Mol. Microbiol. Biotechnol. 2008, 15, 93–120. [Google Scholar] [CrossRef]
  33. Xu, X.; Liu, W.; Tian, S.; Wang, W.; Qi, Q.; Jiang, P.; Gao, X.; Li, F.; Li, H.; Yu, H. Petroleum Hydrocarbon-Degrading Bacteria for the Remediation of Oil Pollution Under Aerobic Conditions: A Perspective Analysis. Front. Microbiol. 2018, 9, 2885. [Google Scholar] [CrossRef]
  34. Aburto, A.; Fahy, A.; Coulon, F.; Lethbridge, G.; Timmis, K.N.; Ball, A.S.; McGenity, T. Mixed aerobic and anaerobic microbial communities in benzene-contaminated groundwater. J. Appl. Microbiol. 2009, 106, 317–328. [Google Scholar] [CrossRef] [PubMed]
  35. Payne, K.A.P.; Quezada, C.P.; Fisher, K.; Dunstan, M.S.; Collins, F.A.; Sjuts, H.; Levy, C.; Hay, S.; Rigby, S.E.J.; Leys, D. Reductive dehalogenase structure suggests a mechanism for B12-dependent dehalogenation. Nat. Cell Biol. 2015, 517, 513–516. [Google Scholar] [CrossRef] [PubMed] [Green Version]
Figure 1. (a,b) Plan view of the site, with detail (c) of the pilot area including the monitoring well distribution: the monitoring wells P8 and P16 are in black while the monitoring wells for the detailed pilot area characterization of are in blue (red points indicate other wells not used for the purpose of this study); blue lines (a) are piezometric lines of the upper confined aquifer.
Water 13 00728 g001
Figure 2. 1,2-dichloroethane (1,2-DCA) and vinyl chloride (VC) concentrations during the monitoring period from 2004 to 2013 for P8 and P16 (a). The absence of VC formation confirms a dihaloelimination mechanism; map distribution of 1,2-DCA concentration (mg/L) during the sampling campaign in 2015 (b).
Water 13 00728 g002
Figure 3. Microcosm experiments results: 1,2-DCA concentrations and δ13C results over time for enhanced natural attenuation (ENA) microcosm experiments; numbers 1–3 indicate experiment number) and natural attenuation (NA) (microcosm experiments; numbers 1–3 indicate experiment number) on the left; Ln (f) and Ln (Rt/R0) for enrichment factor estimation (on the right).
Water 13 00728 g003
Figure 4. Quantitative PCR (qPCR) experiments results: determination of the reductive dehalogenase gene (rdh) and Geobacter spp. 16SrRNA copy number in subsequent enrichment cultures. NC is the non-enriched culture (that is, no refresh) microcosm at the beginning.
Water 13 00728 g004
Figure 5. (a) Sequence of the area surrounding the rdh gene in an enrichment culture of Geobacter spp. and (b) characterization of the reductive dehalogenase operon.
Water 13 00728 g005
Figure 6. δ13C and concentrations data from the pilot area.
Water 13 00728 g006
Figure 7. Illumina sequencing results: composition and relative abundance of the species identified in five representative wells in the pilot test area. Geobacter spp. (light blue with white points) is the strain mainly represented.
Water 13 00728 g007
Figure 8. Dual isotope approach reporting the variation of δ13C and δ37Cl for the pilot area; Λ values for oxidation, dichloroelimination and Dehalococcoides sp. are the values reported in Palau et al., 2017a.
Water 13 00728 g008
Table 1. Comparison between 1,2-DCA concentration values (ppm), rdh gene copy number and relative abundance (% of the total species) of Geobacter spp. in different monitoring wells of the pilot test area.
M2M4M6M10M13
1,2-DCA concentration (ppm)3492041000460255
rdh gene copies (n° * ng DNA-1)5.63 × 1056.81 × 1051.42 × 1061.07 × 1061.78 × 105
Relative abundance of Geobacter spp. (%) 5841495820
Publisher’s Note: MDPI stays neutral with regard to jurisdictional claims in published maps and institutional affiliations.

