
Stratigraphic Analysis of Firn Cores from an Antarctic Ice Shelf Firn Aquifer


1
Centro de Estudios Avanzados en Zonas Áridas (CEAZA), Raúl Bitrán 1305, La Serena 1700000, Chile
2
Laboratorio de Análisis Isotópico, Universidad Andrés Bello, Viña del Mar 2531015, Chile
*
Author to whom correspondence should be addressed.
†
Now at: Asiaq—Greenland Survey, Qatserisut, Nuuk 3900, Greenland.
Water 2021, 13(5), 731; https://doi.org/10.3390/w13050731
Submission received: 5 February 2021
/
Revised: 24 February 2021
/
Accepted: 3 March 2021
/
Published: 8 March 2021
(This article belongs to the Special Issue Review and Progress in Hydrological and Meteorological Monitoring of Glaciers)
Abstract
:In recent decades, several large ice shelves in the Antarctic Peninsula region have experienced significant ice loss, likely driven by a combination of oceanic, atmospheric and hydrological processes. All three areas need further research, however, in the case of the role of liquid water the first concern is to address the paucity of field measurements. Despite this shortage of field observations, several authors have proposed the existence of firn aquifers on Antarctic ice shelves, however little is known about their distribution, formation, extension and role in ice shelf mechanics. In this study we present the discovery of saturated firn at three drill sites on the Müller Ice Shelf (67°14′ S; 66°52′ W), which leads us to conclude that either a large contiguous or several disconnected smaller firn aquifers exist on this ice shelf. From the stratigraphic analysis of three short firn cores extracted during February 2019 we describe a new classification system to identify the structures and morphological signatures of refrozen meltwater, identify evidence of superficial meltwater percolation, and use this information to propose a conceptual model of firn aquifer development on the Müller Ice Shelf. The detailed stratigraphic analysis of the sampled cores will provide an invaluable baseline for modelling studies.
1. Introduction
Liquid water plays key roles in the cryosphere, for example: the flow of land ice is predominately controlled by the quantity of liquid water present (e.g., [1]); energy fluxes in snowpacks are influenced by the presence and behaviour of liquid water (e.g., [2]); and many theories of ice shelf disintegration involve the presence and action of water (e.g., [3]). While the hydrological system on land-based glaciers is well defined, very few direct field observations have been carried out on ice shelves (e.g., [4]).
Understanding the distribution of liquid and refrozen water on ice shelves is important for understanding ice mechanics and ice shelf dynamics [5,6]. Liquid water can cause hydrofracturing (when increased pressure is exerted by water on the tips of vertical fractures) [3,7] and when accumulated into ponds, can cause bending stresses and fracture formation from rapid drainage events [3,8,9,10,11,12]. On ice sheets, the refreezing of liquid water in superficial firn [13] can cause the impedance of water percolation, therein enhancing either runoff or internal ponding. Comparatively, on Antarctic ice shelves, [14] identified such a refrozen surface on the Larsen C ice shelf using geophysical surveys, [6] reported from remotely sensed images meltwater being exported via a supraglacial stream network and [4] described the hydrological properties of a firn aquifer on the Wilkins Ice Shelf. The diversity of hydrological system structures, and possible impacts makes realistic modelling of ice sheet and ice shelf processes difficult [15,16]. This is further exacerbated by the dearth of field measurements of the mechanical and hydrological properties of ice shelves.
Several authors have proposed the existence of firn aquifers on Antarctic ice shelves (e.g., [4,17]), however little is known about their distribution, formation, extension and role in ice shelf mechanics. In this study we present the discovery of fully saturated firn on the Müller Ice Shelf, which leads us towards the conclusion of at least one large firn aquifer or disconnected smaller firn aquifers on this ice shelf. We will present results based on the stratigraphic analysis of three short firn cores extracted during February 2019. In particular, this study aims to develop a classification system to identify the structures and morphological signatures of refrozen meltwater, identify evidence of superficial meltwater percolation, and use this information to construct a conceptual understanding firn aquifers on the Müller Ice Shelf.
2. Materials and Methods
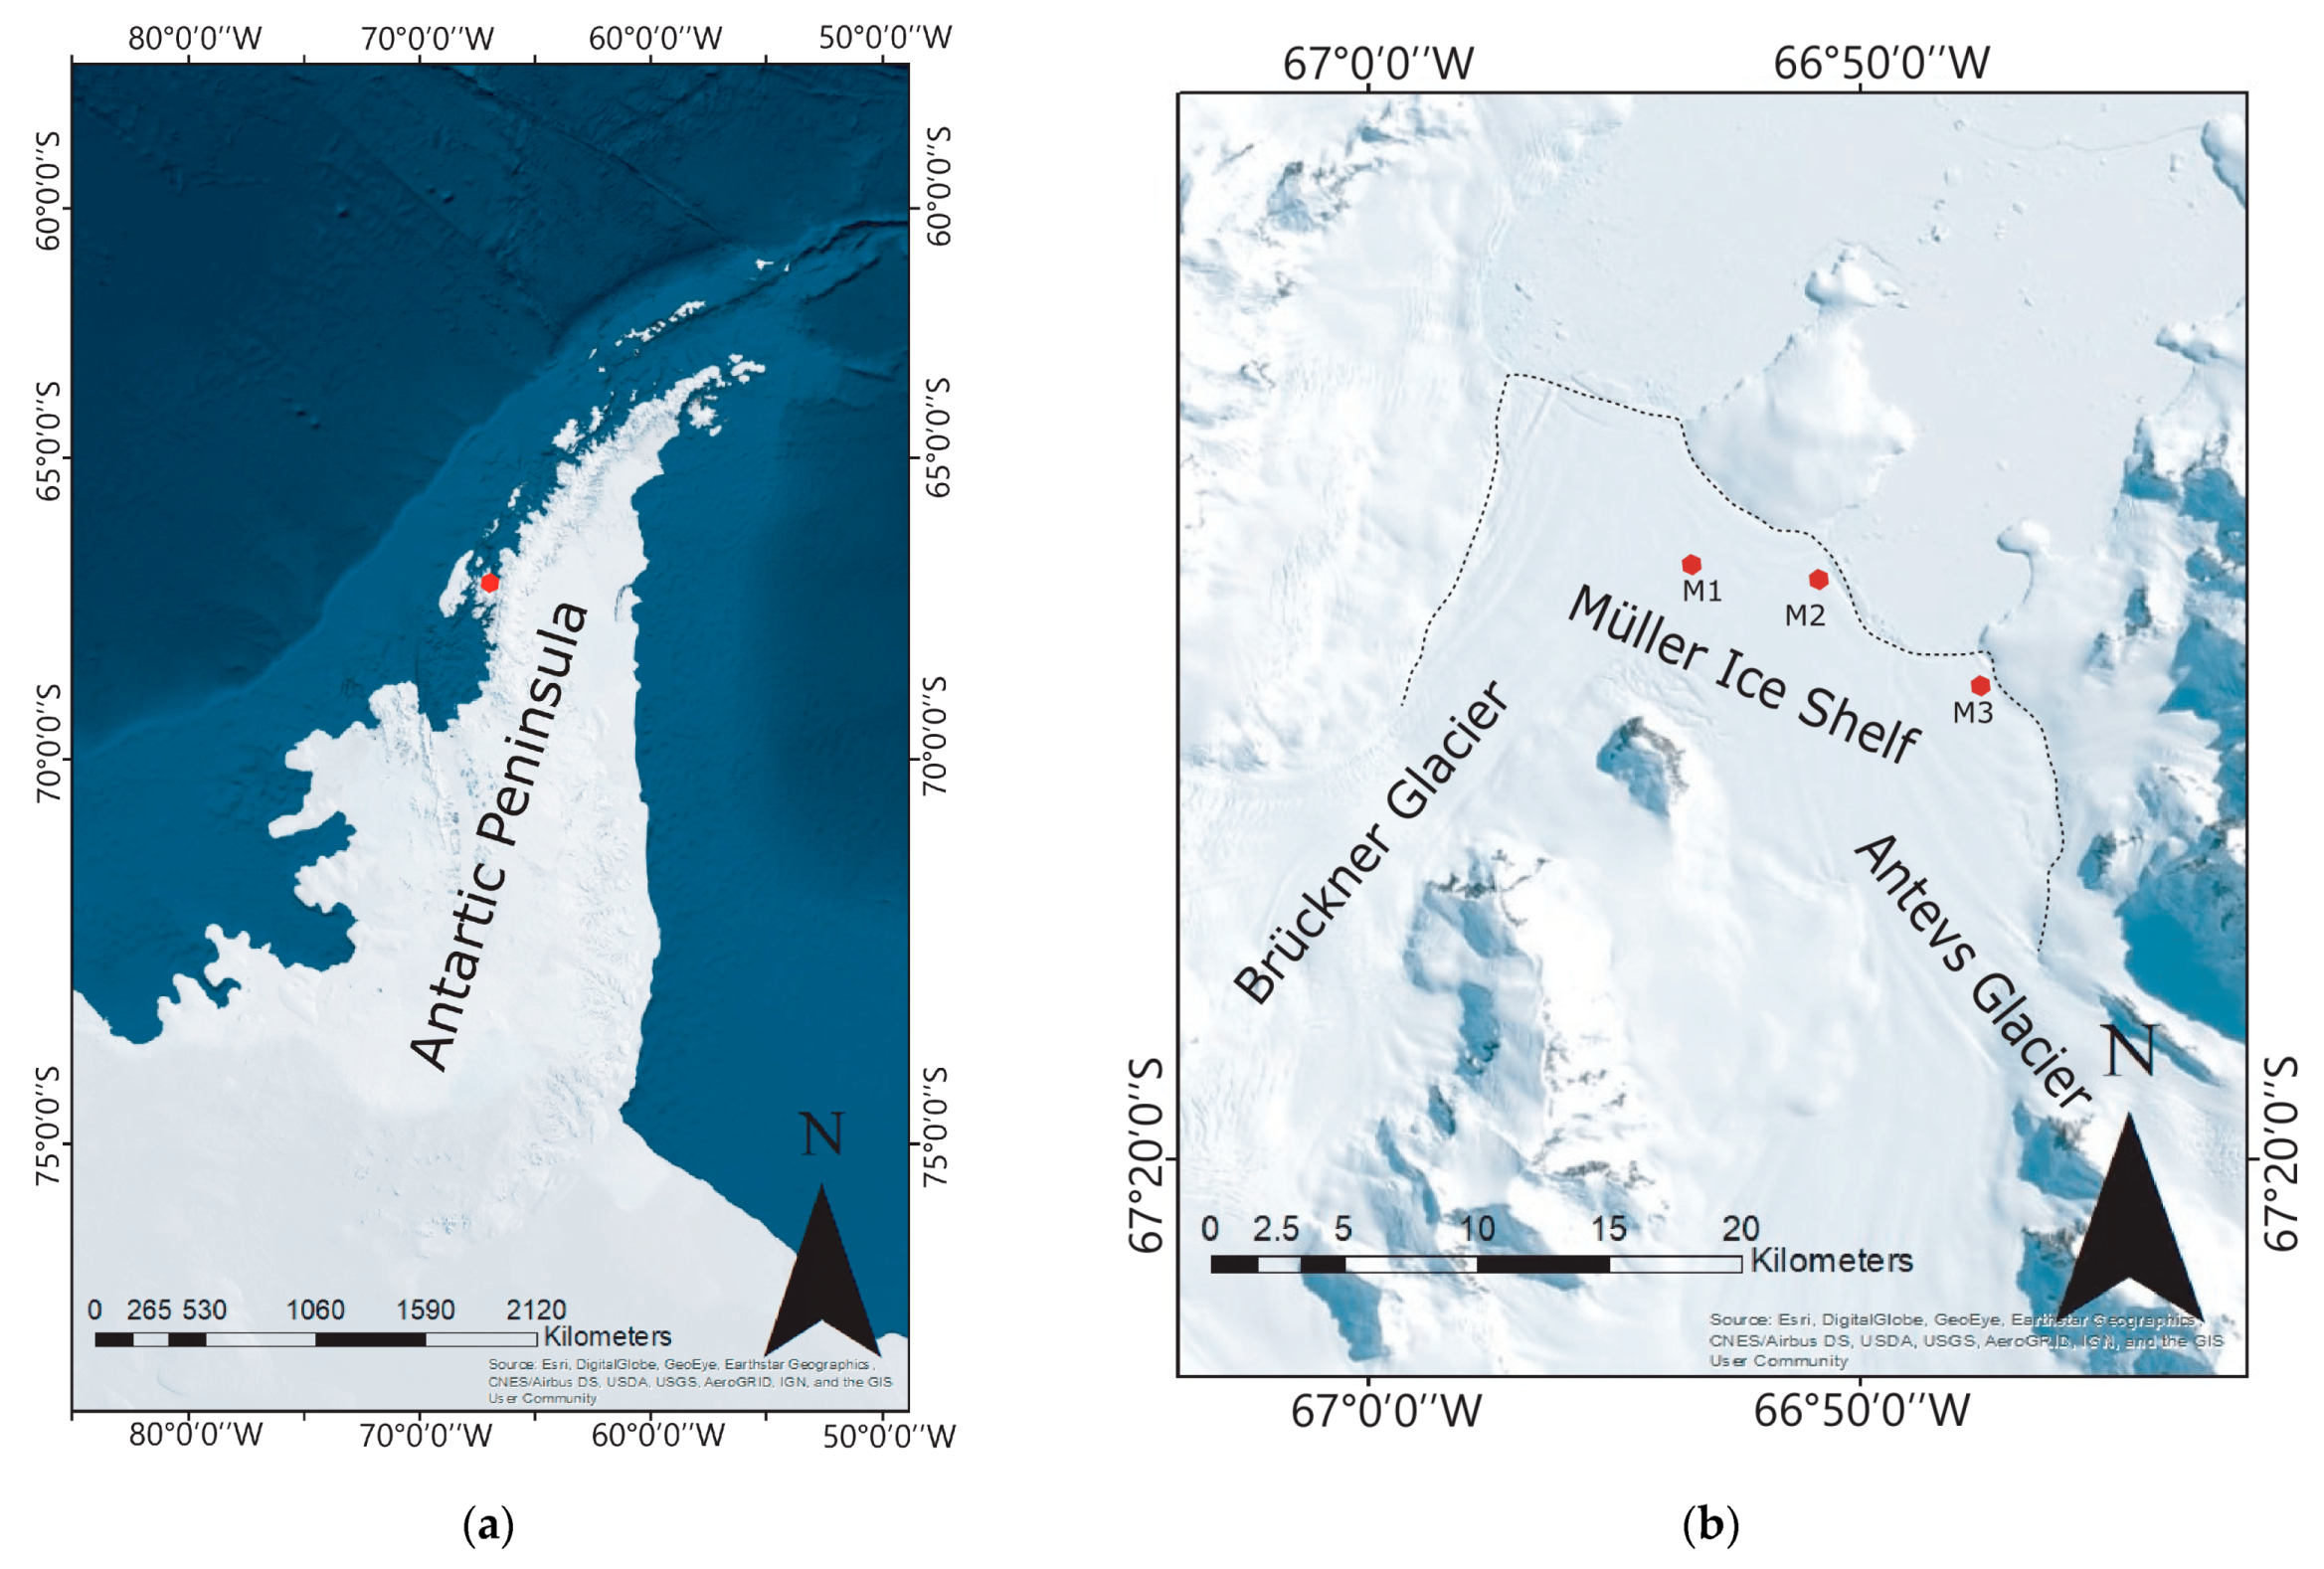
2.1. Study Area
The Müller Ice Shelf is the northern-most ice shelf on the Antarctic Peninsula (AP) (67°14′ S; 66°52′ W) (Figure 1). It is located on the western side of the AP and drains the Arrowsmith Peninsula. It is fed by the Brückner and Antevs glaciers and terminates in the Lallemand Fjord. The ice shelf is relatively small (40 km2) and has been experiencing phases of advance and retreat since at least the Little Ice Age [18], and now covers approximately 50% of the area recorded in 1957 [19]. An important question is why the Müller Ice Shelf remains extant, whereas its neighbours (e.g., Jones Ice shelf) have collapsed [19]. Hypotheses related to ice shelf geometry, the amount of ice discharge relative to catchment size as well as protection from the ocean have been proposed, but the relationship between the ice shelf, climate and ocean processes remain unclear.
2.2. Sample Collection and Handling
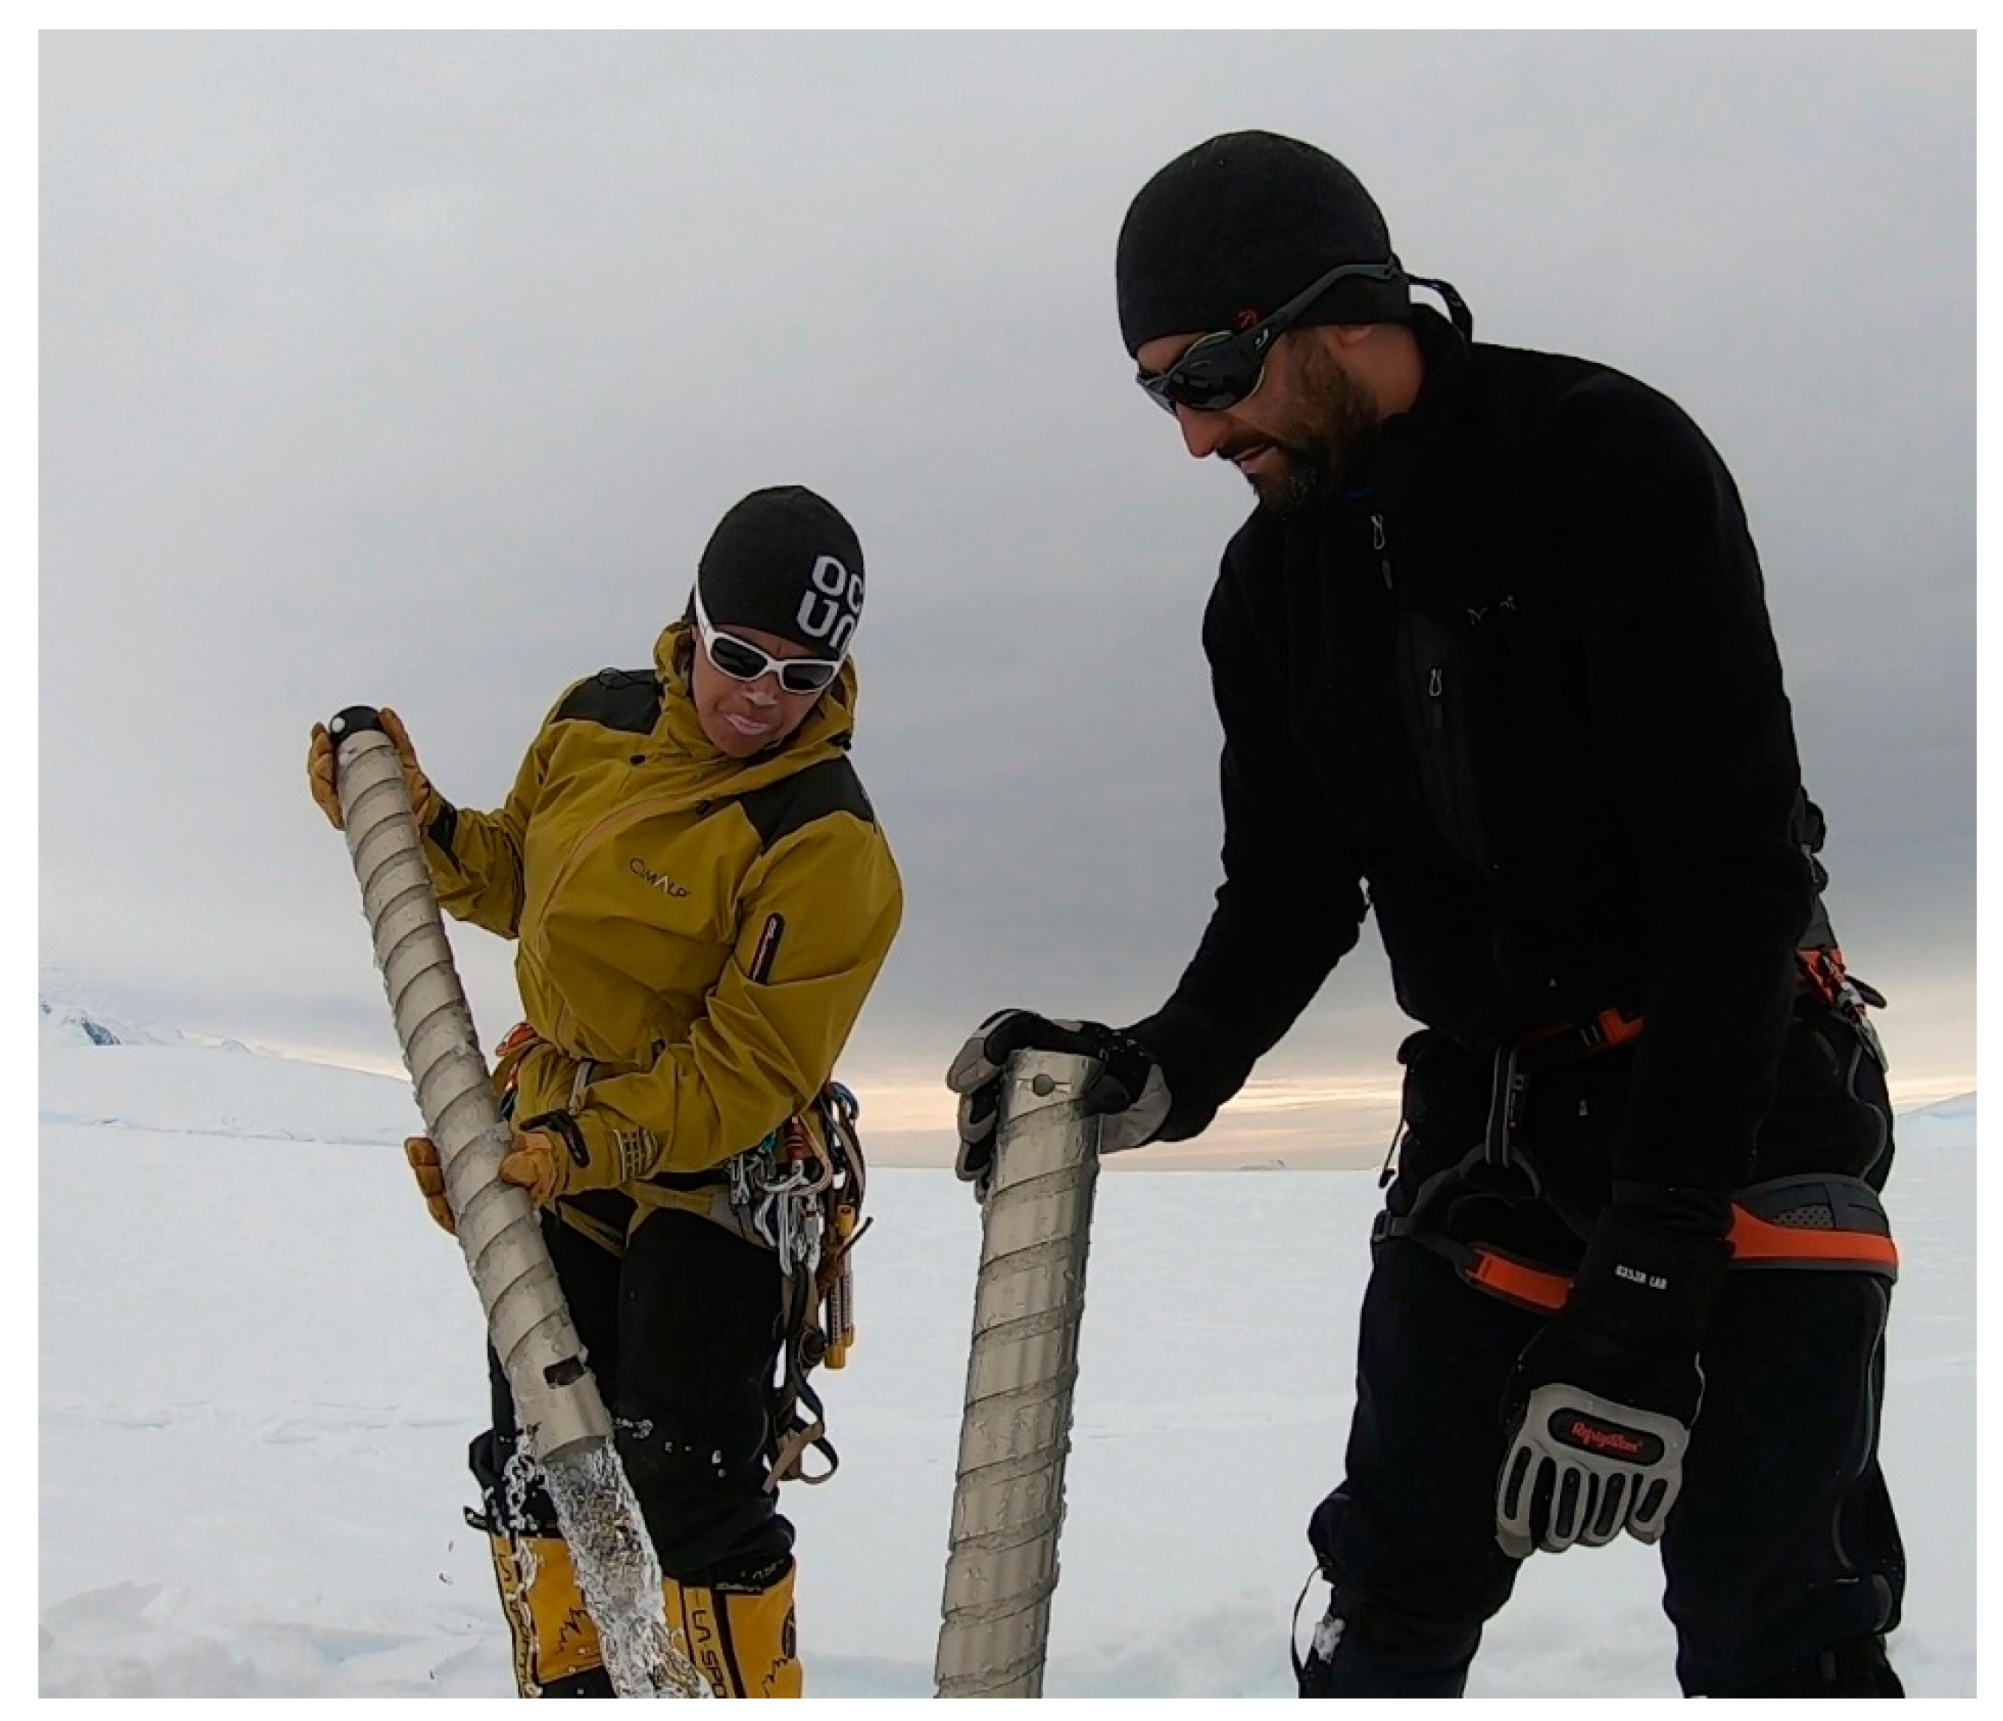
A series of three short firn cores were collected from the Müller Ice Shelf between 20 and 22 February 2019 (Figure 1 and Figure 2). The drill used had a maximum reach of 20 m, but ultimately core lengths were determined by the presence of saturated material impeding the deeper penetration of the device. The core M1 was located at the confluence of the Brückner and Antevs glaciers (67°15′15.5″ S; 66°53′44.5″ W) and reached a depth of 16.72 m. M2 was located near the centre of the ice shelf in the area fed by the Antevs Glacier (67°15′16.8″ S; 66°50′59.8″ W), and was 18.54 m long. Comparatively, M3 was 3.72 m long and was extracted near the eastern limit of the ice shelf also fed by the Antevs Glacier (67°15′37.6″ S; 66°48′22.3″ W). The three cores were extracted using a 5.7 cm diameter electric drill (Icedrill.ch AG), and were immediately weighed, measured and bagged for storage in insulated cold store boxes. At the same time, firn temperatures were recorded and a visual analysis of relative saturation, possible melt layers and textual characteristics were recorded. The cores were flown by helicopter to the Betanzos research vessel and were subsequently stored on the ship at −20 °C until arriving at Punta Arenas, Chile. From Punta Arenas the cores were flown to the Universidad Andrés Bello, Viña del Mar where they were stored in a purpose-built cold facility at −20 °C.
2.3. Laboratory Analysis
To analyse the collected cores, and to provide a platform for future work, a purpose-built cold store facility was built at the Universidad Andrés Bello. This enabled the clean processing of the collected cores. As part of the constructed space, we built an area to cut and handle cores, as well as a light box (Figure 3) to facilitate the visualization of ice crystal configurations within the core.
Firn core processing consisted in firstly re-measuring and weighing the individual sections of each core to re-calculate the associated density. Subsequently the cores were longitudinally cut in half using a Bauker circular saw, and one half was used in this study, and the other section was retained for future analyses. A continuous stratigraphic analysis was then undertaken on the core which consisted in recording a visual description of each section, including variations in grain size and morphology, ice lens morphology and size, and interface characteristics between identified units. High resolution photographs were also taken along the length of each core to facilitate post-processing. To avoid confusing ice that was refrozen in transport or storage from ice that was refrozen in situ, sections that presented a solid ice layer near the border with no bubbles were discarded as being identified as refrozen post-extraction.
3. Results
3.1. Field Observations
At each of the three core sites, a mix of damp and dry firn was encountered, and at the base of each drilled hole, the firn was saturated. However, at site M3, the recovered core was saturated to the point that the drill filled with liquid water (Figure 4; Video S1). This saturated section was found at a shorter distance (3.72 m) from the surface than the other two sites (16.72 m and 18.54 m), which is likely due to its lower elevation with respect to the other two drill locations. To analyse the provenance of the water, the conductivity of the lower half of the M1 core was analysed in the lab and found to be <22.5 mS along the length of the measured core which corresponds to fresh water. This suggests that the liquid water found at each site was due to snow and firn melting as opposed to saltwater intrusion. In addition, the temperature recorded in the firn along the length of each core was between −0.1 °C and 0.4 °C, and in the case of M1 and M3, the highest temperatures were recorded at the base of each core (0.4 °C), whereas the base of M2 was at the melting point (0.0–0.1 °C). The recorded temperatures suggest that melting is the likely source of water found in the cores.
3.2. Framework to Describe Firn Stratigraphy
In order to standardise the comparison of the firn core stratigraphies, a new framework was developed based on the analysed cores. We classified the structures into three classes each of granulometry, contacts and recrystalized structures.
3.2.1. Granulometry
The granulometry classification is based on three grain size bins: fine (<1 mm), medium (1–2 mm), and large (>3 mm) (Figure 5). The differentiation between predominant grain sizes was assessed using the light box (Figure 4). Fine grained sections are easily detected using the lightbox, as little light is able to penetrate through tightly packed fine crystals. Comparatively more light is refracted through medium grain sections, and finally, much more light is able to pass through large grained sections.
Fine grains were found throughout the cores, without an apparent order or organisation. However, the structure was not homogeneous, and a range of small-scale conduits were present within fine-grained sections of crystals. Medium-sized grains are also heterogeneously distributed throughout the cores, with no apparent order. Unlike fine grains, medium-sized ones have likely undergone some degree of metamorphosis. Refrozen ice conduits were found throughout these sections. Finally, the large-scale grains corresponded to highly metamorphosed sections which contained several large refrozen conduits, with diameters from mm to cm. Overall, this grain size was less widespread throughout the cores.
3.2.2. Contacts between Layers and at the Boundaries of Recrystalised Structures
In environments with temporally well-separated precipitation events, contacts (or layer boundaries) in snowpacks and firn predominantly demarcate the boundary between individual deposition events. As the precipitation rate in the Müller Ice Shelf sector is relatively high at approximately 2.4 m a−1 [20] and consistent throughout the year, the contacts between layers are likely more representative of post-depositional processes such as meltwater generation, percolation and refreezing. Expressed within the core, contacts can be visualised as an ice layer or as a marked change in grain size. It should be noted that within the core, most contacts contained some icy component, both related to in situ refreezing, as well as the refreezing of liquid water in the ice core post extraction. It is important to note that refreezing post extraction is most likely to influence the relative ice concentration in a contact space, as opposed to its form.
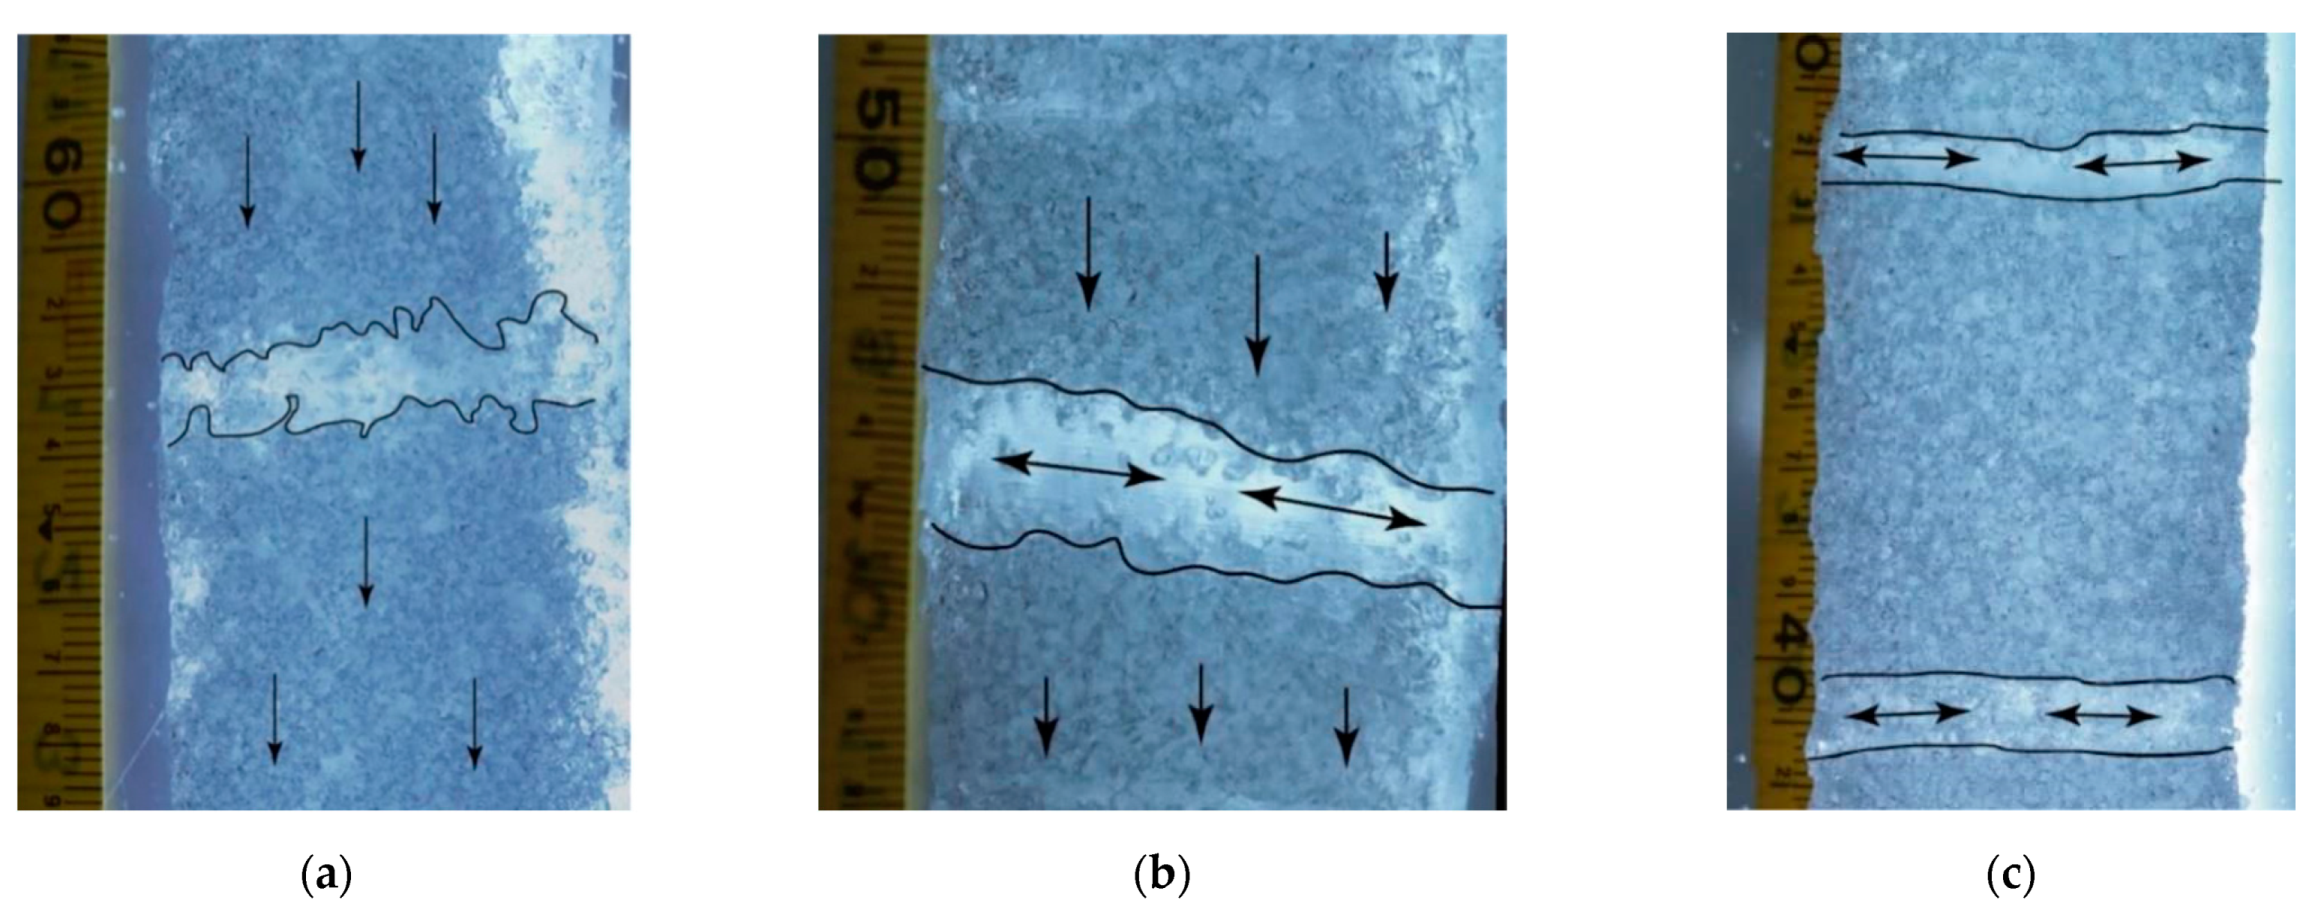
On the basis of our analysis, we define three classes of contacts: diffuse; sinuous, and planar (Figure 6). In general, the contacts cover the width of the corresponding ice core. Diffuse contacts are found directly above or below sections characterised by refreezing morphologies (i.e., larger grain sizes, or ice layers), and maintain a non-aligned, diffuse contact between sections, thereby suggesting possible percolation of water through the contact. Conversely, sinuous contacts have a smoother texture, and are highly continuous across a core, and are generally sub-horizontal. Lastly, the planar contacts are near-horizontal features that are smooth and continuous across a core.
3.2.3. Recrystalized Structures
In addition to the categorization of contact form, several continuous and discontinuous morphological features were described which relate to post-depositional processes. These structures include: ice lenses; fine-scale ice lenses; fine interlayering of firn and ice; and small-scale conduits.
Ice lenses are defined here as a largely impermeable mass of recrystalised water that has been generated by the percolation and refreezing of liquid water along an internal barrier. They are at least 10 mm thick and extend horizontally or near horizontally in a lateral direction. The density of ice lenses is much higher than the surrounding snow or firn, and in many cases air bubbles are trapped during the freezing process. Ice lens contacts are often planar at their base, and may be planar, sinuous or diffuse at the upper contact (Figure 7).
Fine-scale ice lenses are also prevalent throughout the ice cores and are defined as being continuous ice layers less than 10 mm thick. Thin lenses have fewer visible bubbles than thick ones. These thin layers can present any type of contact and are more permeable than thicker ice lenses (Figure 8).
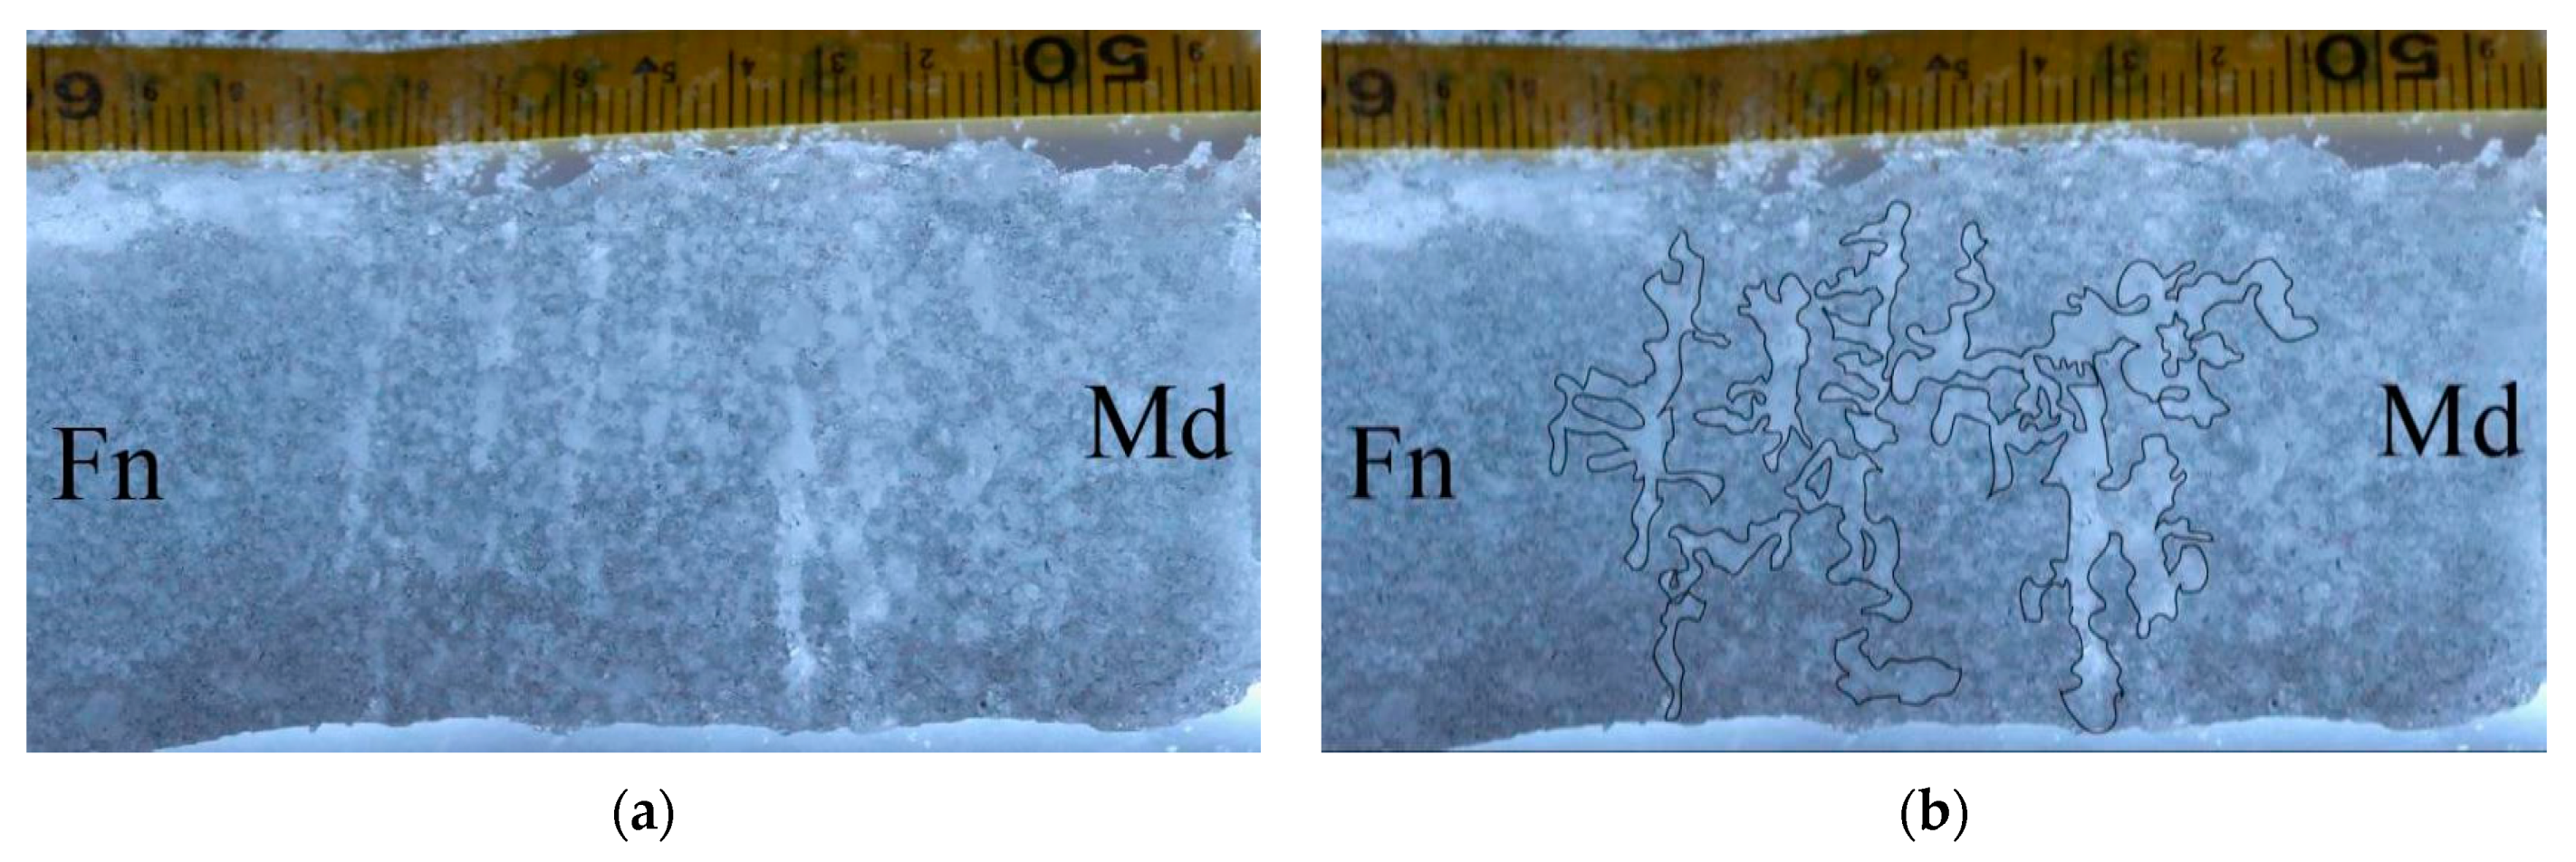
Fine interlayering of firn and ice was observed along the length of the cores. Interlayering in this context is where thin, horizontal layers of firn and ice are found sandwiched together. The thickness and frequency of firn and ice layers within these interlayered sections were generally consistent (mm-scale), and contacts included all types (Figure 9). It should be mentioned that in many examples of interlayering, layers were found to be connected by small conduits.
Small scale conduits are found in firn interfaces and form dendritic networks both horizontally and vertically in the direction of the ice shelf base (Figure 10). Horizontal conduits display restricted, slightly bulbous channels that are occasionally accompanied by other smaller, laterally expanding conduits. In contrast, vertical small scale conduits display vertical to sub-vertical conduits that often terminate in ice lenses. As these features are controlled by the crystal structure, they are highly irregular forms that may or may not be continuous across the diameter of a core. From observations made in the lab, many small scale conduits were discontinuous, and somewhat disconnected. It should be remembered that these observations correspond to one face of the core, and that small scale conduits may be connected in other planes.
3.3. Observed Stratigraphy
The identified structures can then be analysed at a core scale in order to identify both depositional and post-depositional processes, with the goal of understanding aquifer development and its impact on ice shelf mechanics. In this section we systematically combine the granulometry results together with the description of contacts, and morphological features present. To aid core interpretation, we also include, a qualitative comparison of relative saturation recorded in the field, and density measurements taken in the laboratory.
3.3.1. Müller 1
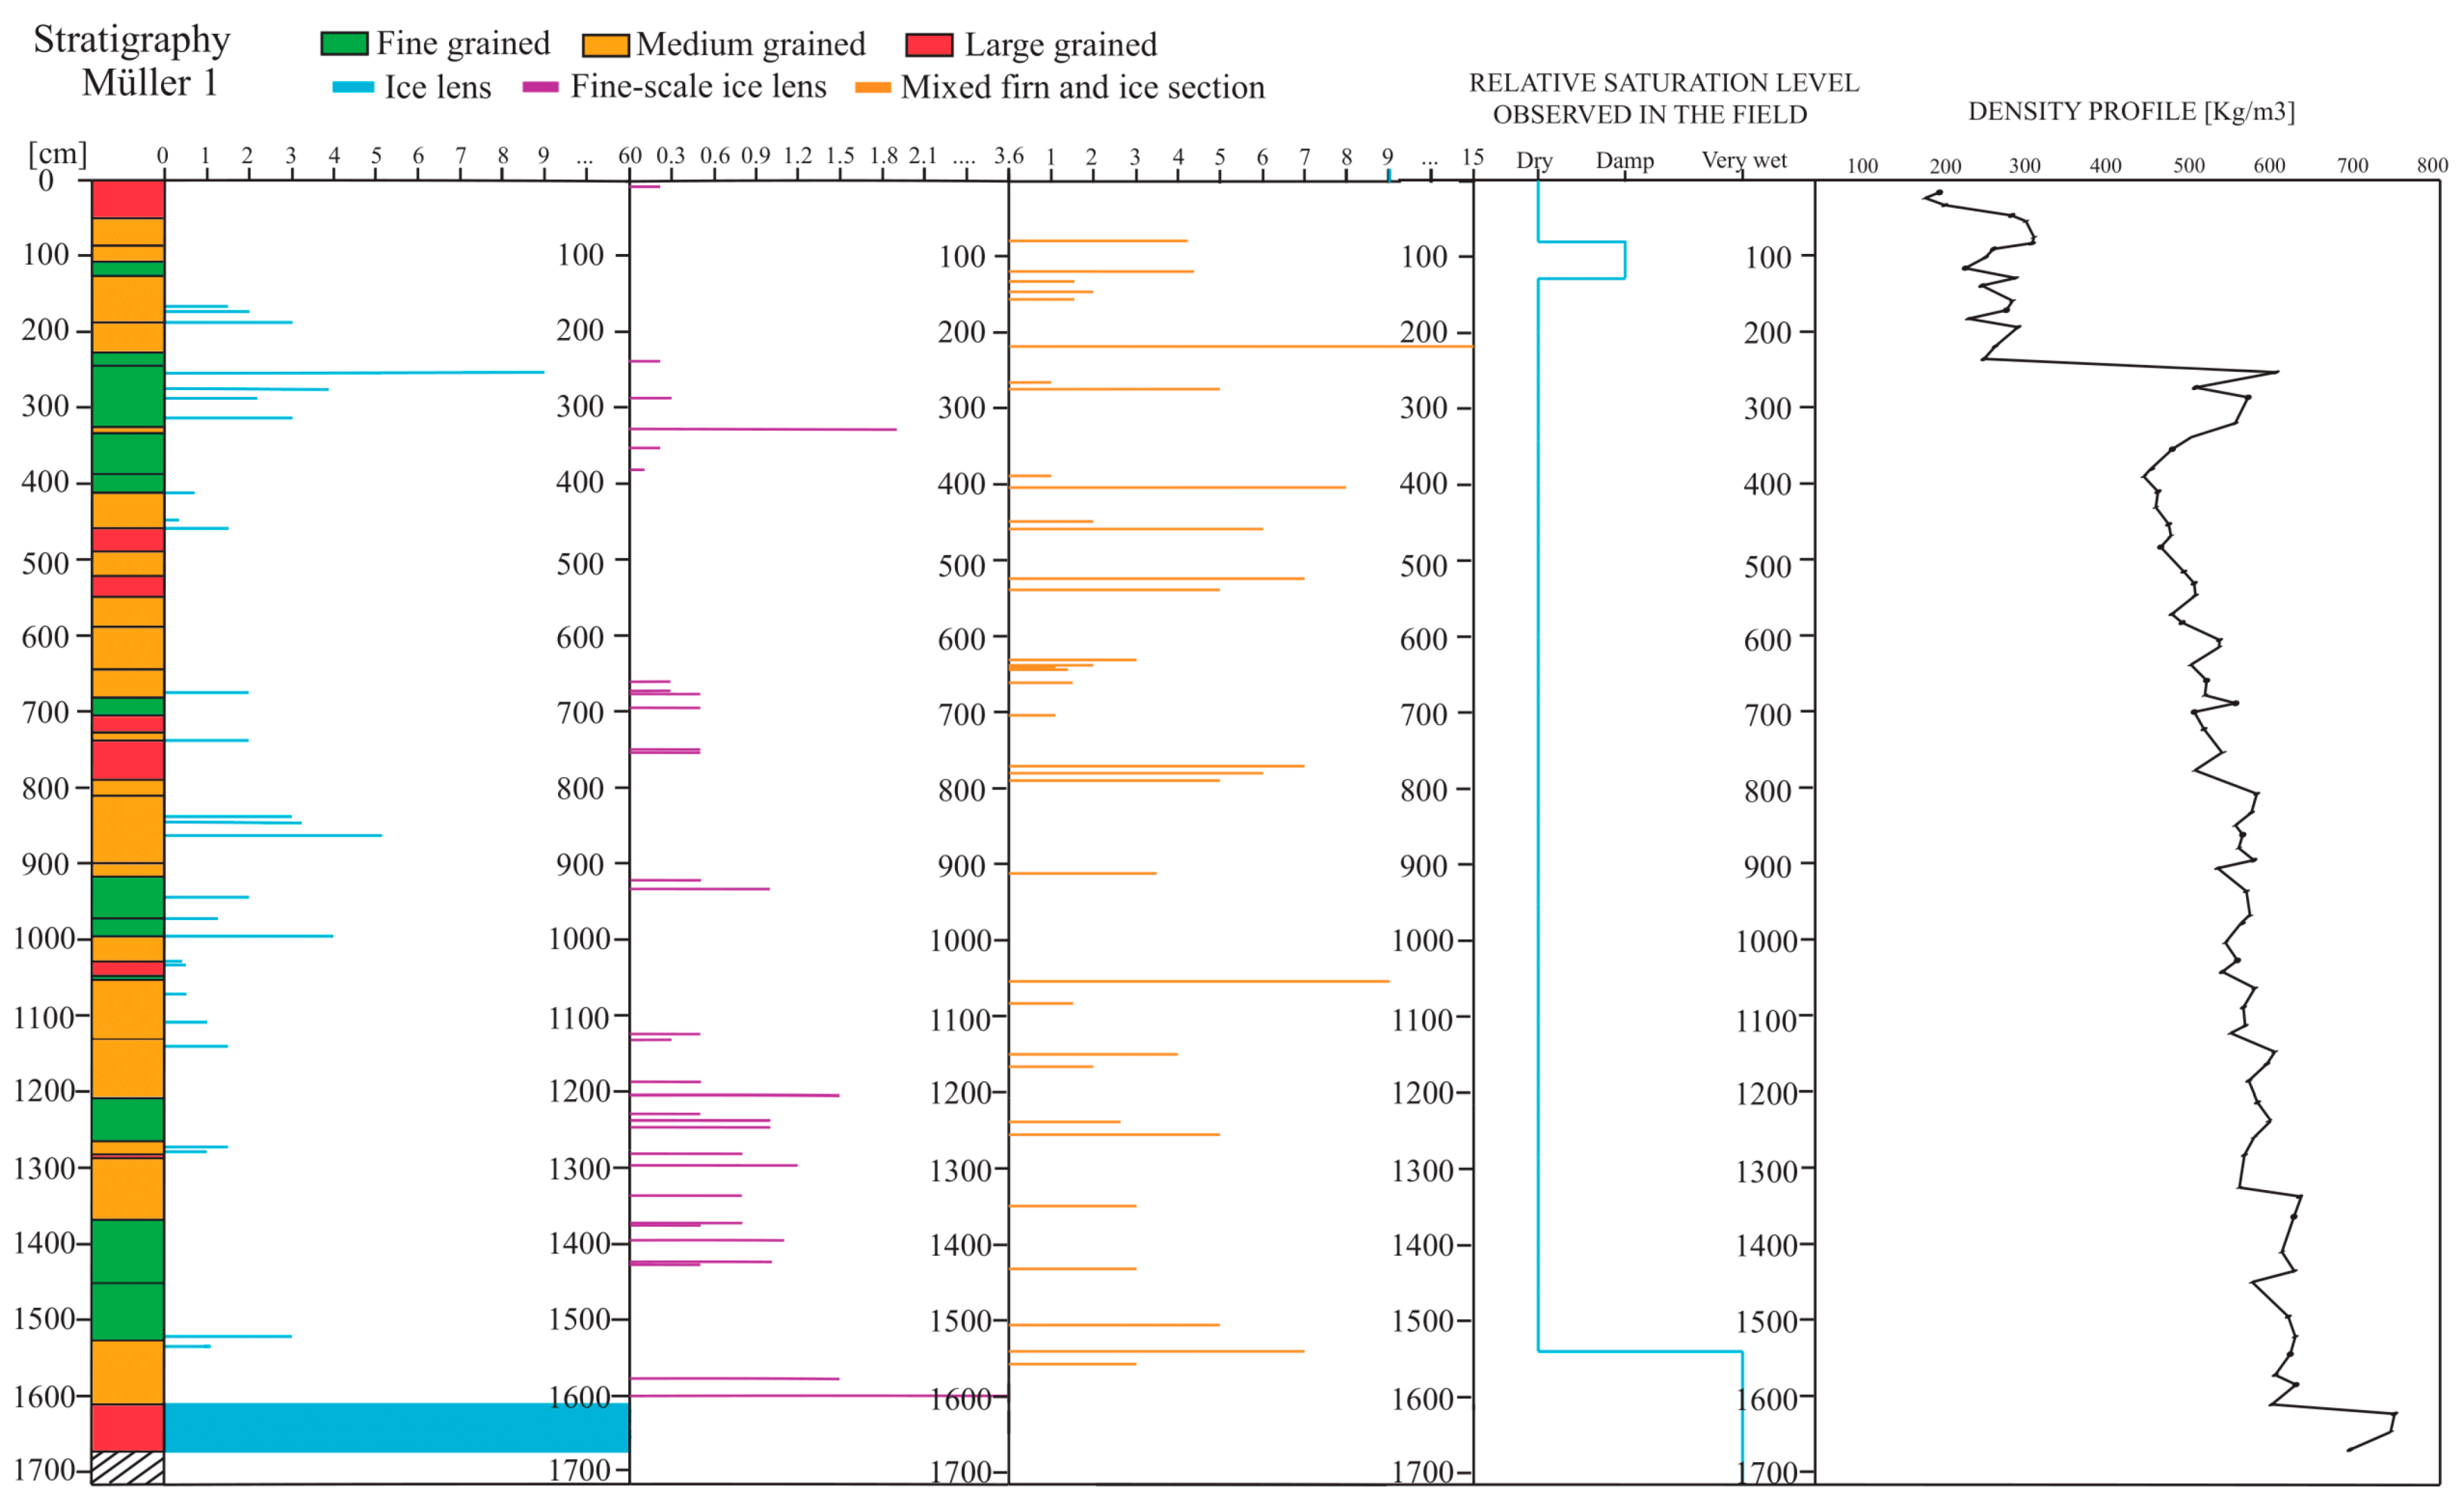
Figure 11 presents the Müller 1 stratigraphy results. The core consists predominately of medium sized crystals, but there are also large sections of fine and coarse-grained crystals. Interlayered ice and firn layers are found along the whole length of the core. There are two sections where ice lenses dominate, between 150–300 cm depth and 730–1000 cm depth. Fine-scaled ice lenses are prevalent between 1100–1420 cm depth. Below 1610 cm depth, there was complete saturation of the core when extracted, which corresponds to a large ice lens observed in the laboratory. This section of the core was therefore not included in the core intercomparison. Along the core, an abundance of air bubbles, signalling refrozen water, was also noted in the laboratory which included water refrozen in situ and during transportation.
To further identify refrozen ice that was principally formed during transportation, the relative saturation observations taken in the field were compared with the core stratigraphy. In terms of relative saturation, the first 86 cm of the core where dry, before encountering a somewhat humid layer between 86 and 115 cm depth. The rest of the core was dry until the final section of the core. The upper dry section (0–86 cm) matched with a relatively low-density section, which in the field appeared to be relatively fresh snow. However, a thin ice lens was recorded near the surface, which suggests that this section had already undergone a small amount of melt and refreezing post-deposition and pre-extraction. Between 86–115 cm, the sampled snow was damp, and a corresponding rise in density was noted as well as the occurrence of ice lenses, and the start of mixed ice and firn layers (interlayering). Below 115, the core was relatively dry until the saturated layer was encountered at 1610 cm, which suggests little melting at these depths in the days leading up to extraction, and that the structures encountered were relatively ‘old’ (i.e. correspond to when these depths were closer to the surface).
3.3.2. Müller 2
Only a thin (ca. 10 cm) dry upper section corresponding to fresh snow was encountered in the Müller 2 core (Figure 12). Below this section, the core was humid, or very humid until 950 cm depth, and dry from there to the base of the core at 1800 cm, where the firn was saturated with liquid water. Below 110 cm, there was an abundance of interleaved firn and ice layers throughout the core, and several relatively thick ice layers. The density of the core was largely uniform over its length. The stratigraphy of Müller 2 was largely consistent with that seen in Müller 1, however the amount of liquid water observed in the field was much higher.
3.3.3. Müller 3
Fine-grained crystals were less prevalent in the Müller 3 core than the other two, and no fine-grained material was observed below 130 cm (Figure 13). The extracted core was much shorter than the other two, as highly saturated material was found at a 295 cm depth, limiting further perforations at this site. The density of the material gradually increased with depth, from approximately 400 kg m−3 near the surface, to 760 kg m−3 at depth.
3.3.4. Stratigraphic Correlations
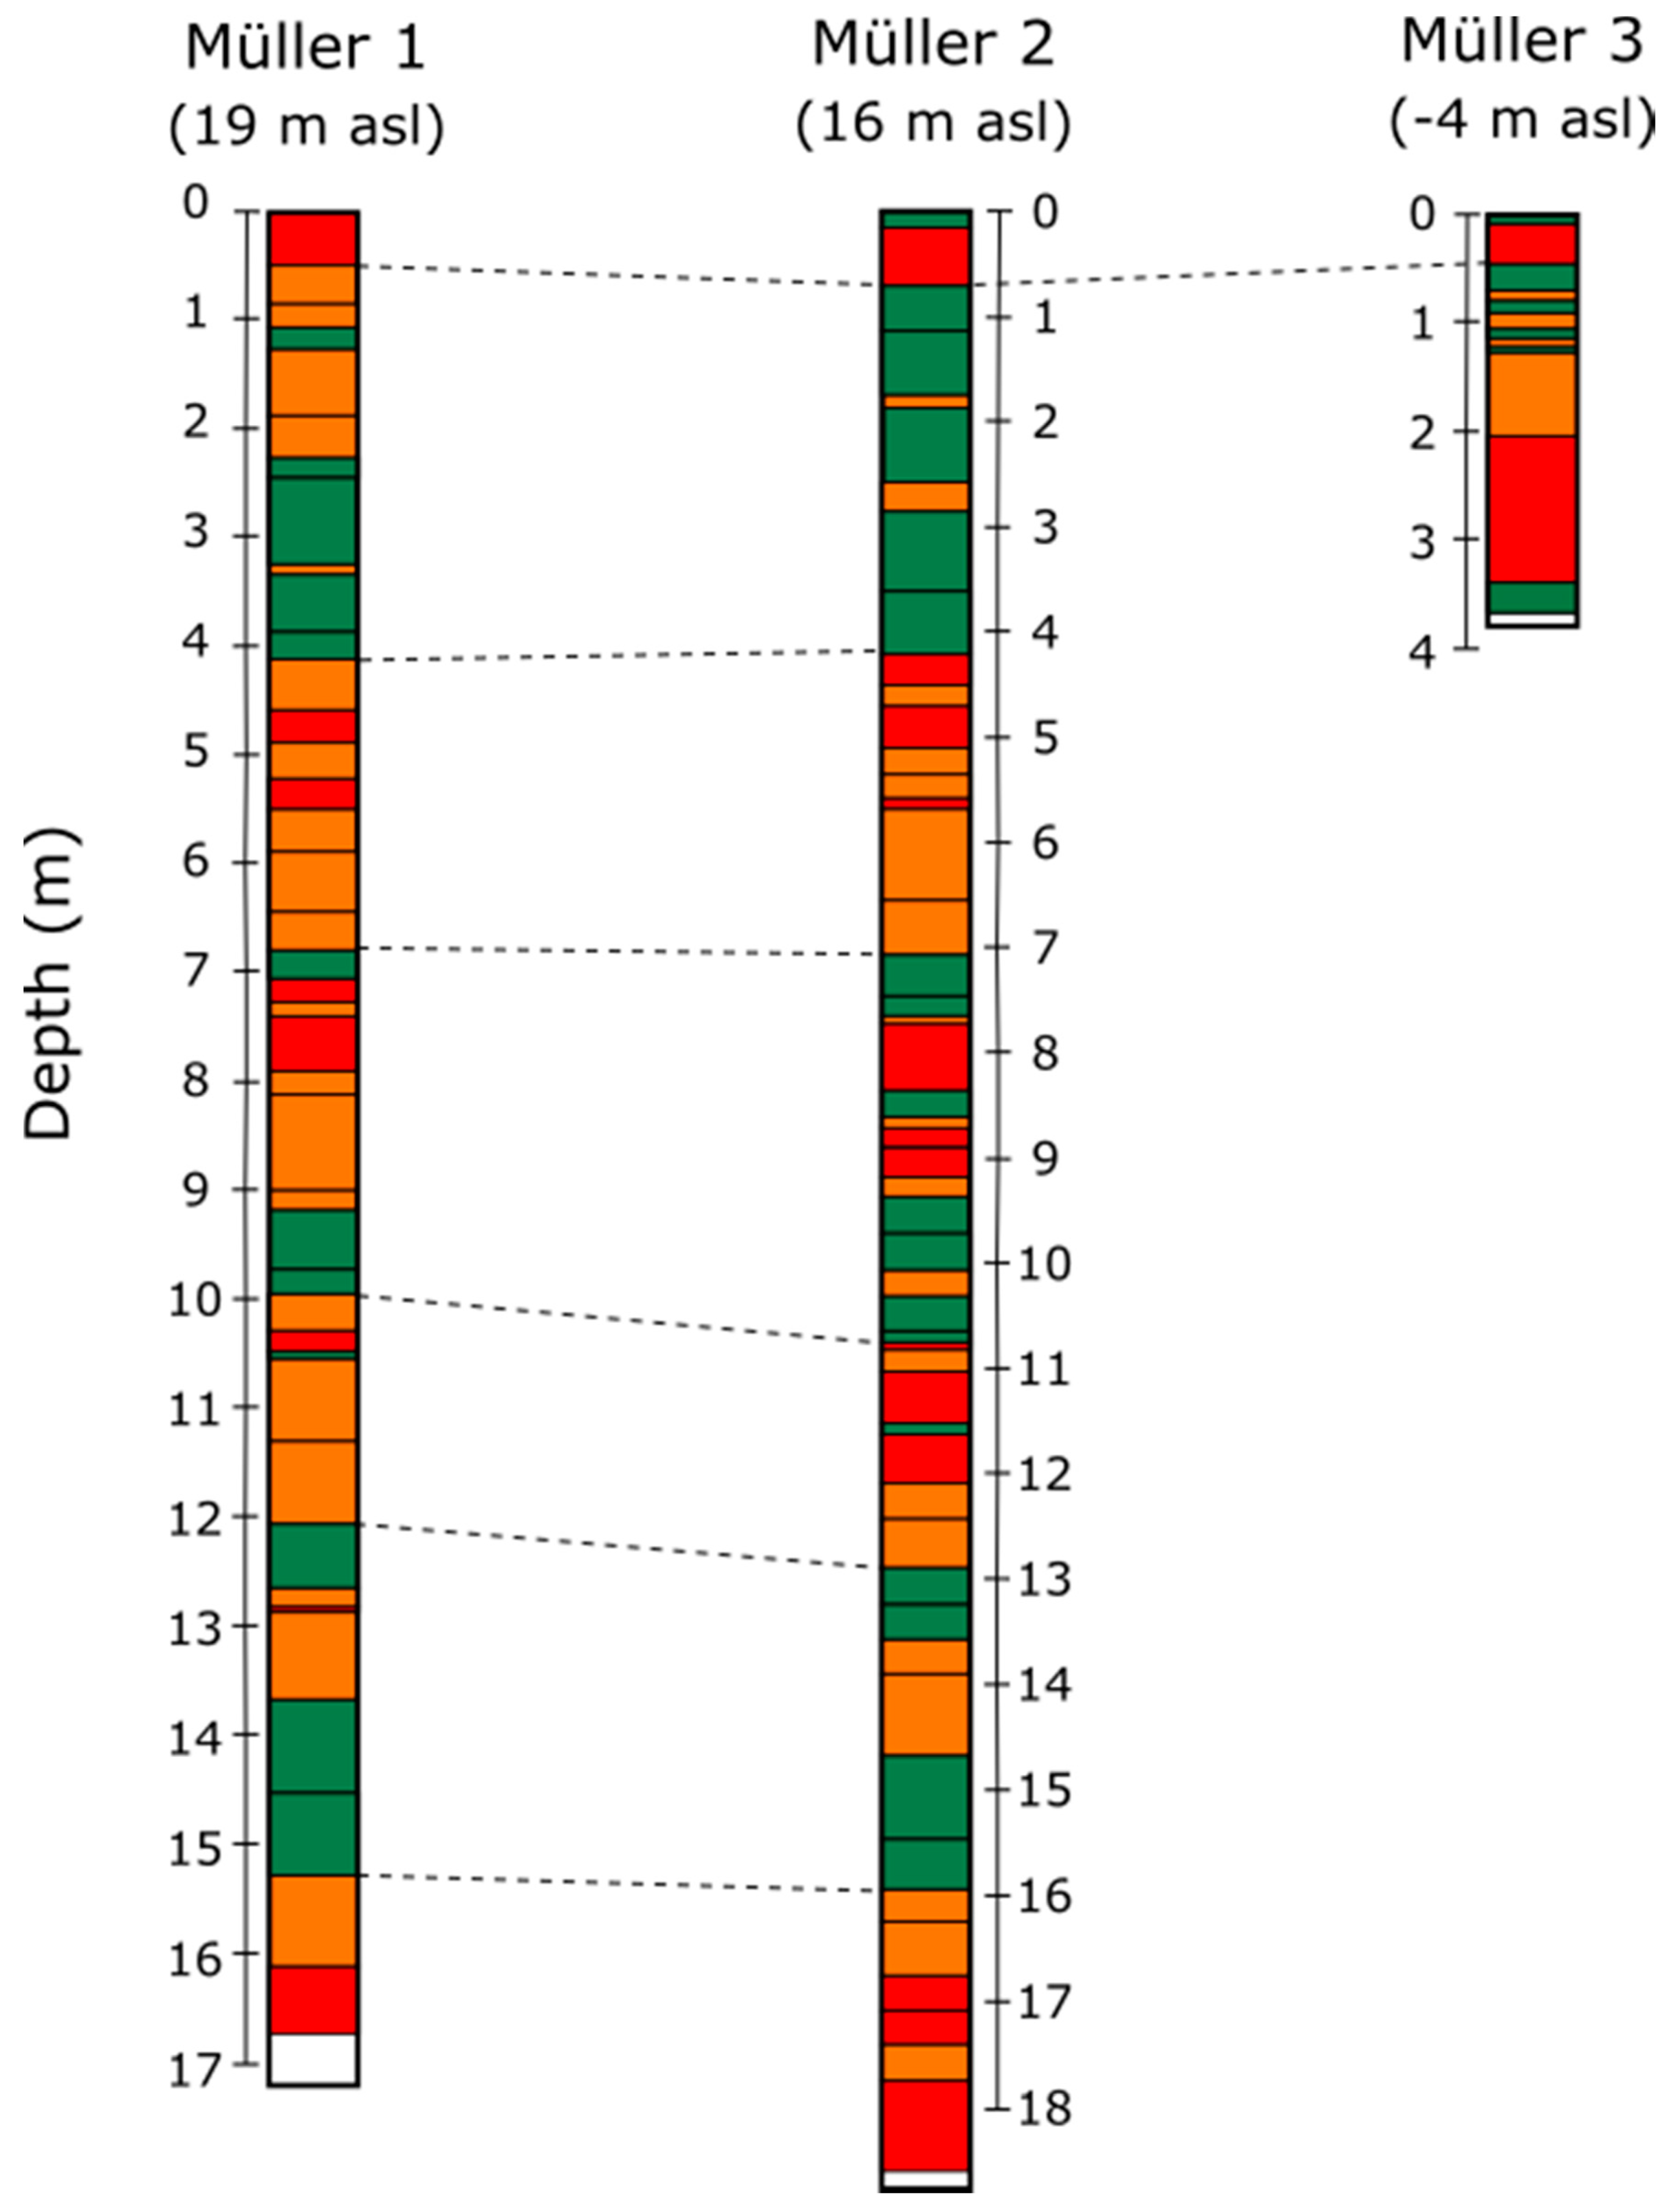
We qualitatively correlated the three cores using the results of the measured grain sizes (Figure 14). The correlation shows that Müller 1 and Müller 2 have very similar stratigraphic profiles, which suggests that they have been exposed to similar processes, whereas the Müller 3 core does not exhibit a similar grain size distribution.
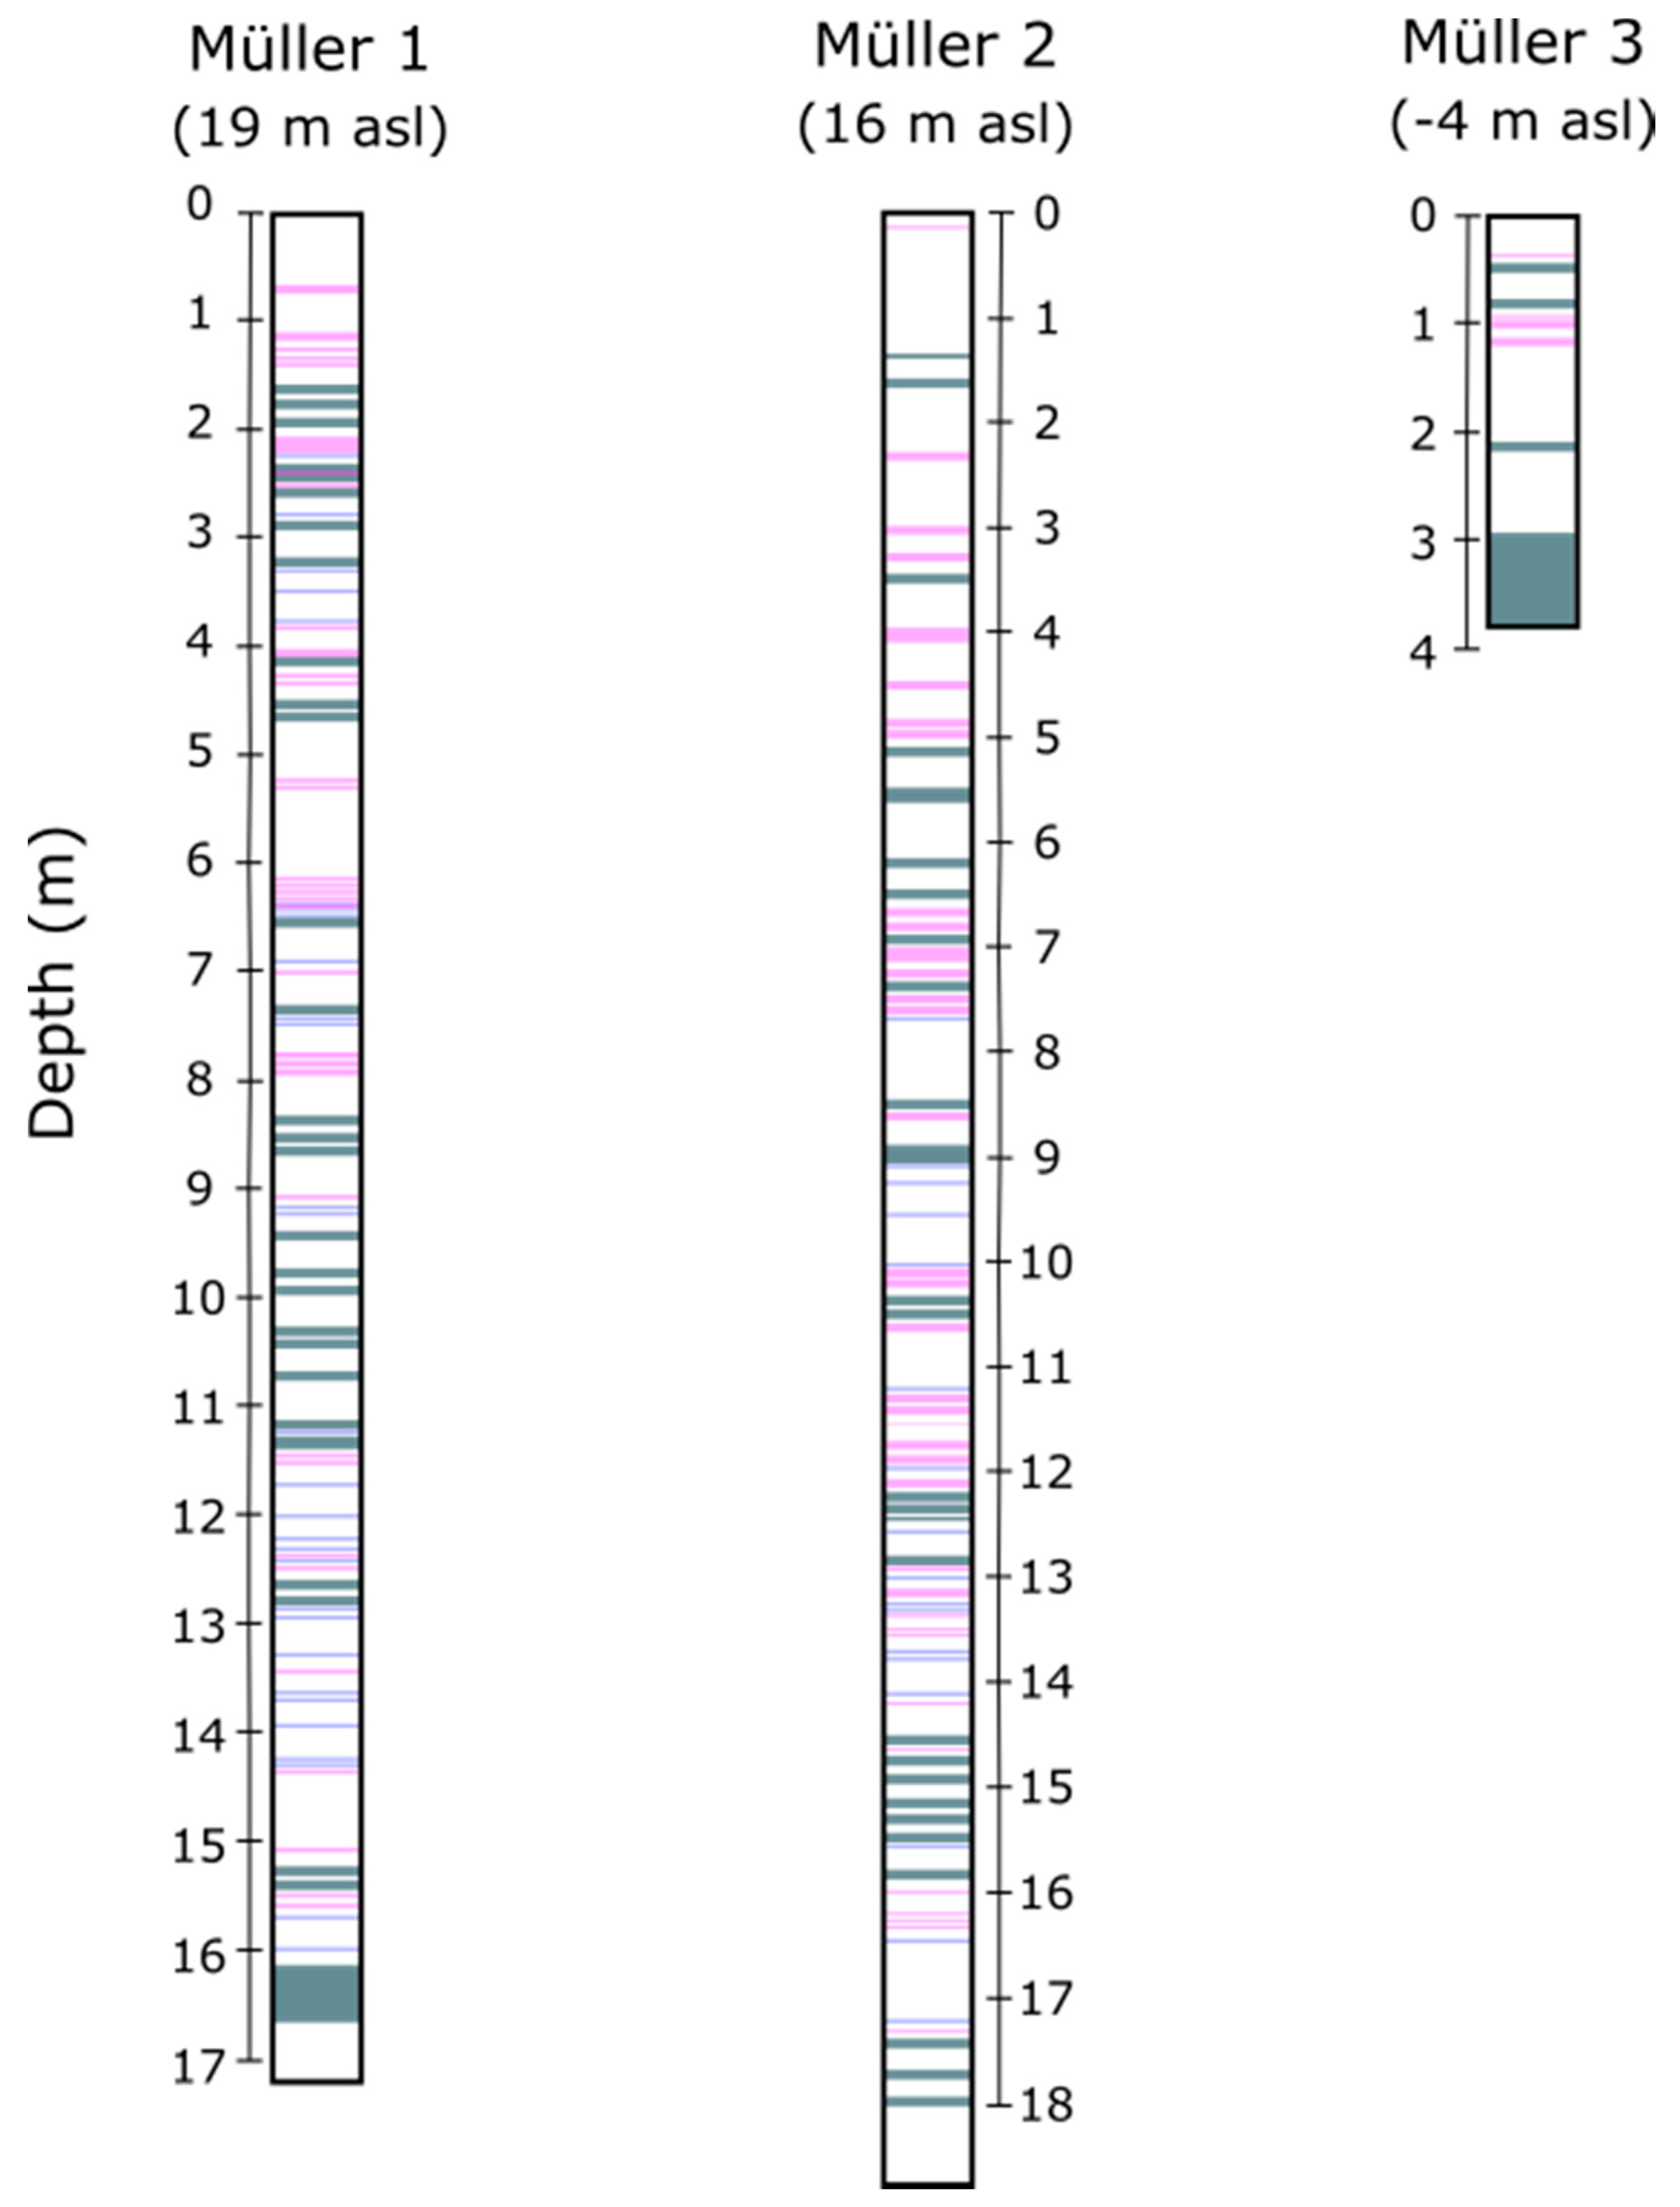
While the granulometry observations were similar between the three cores (Figure 14), the distribution of recrystalized structures (including ice lenses, fine-scale ice lenses and interlayering of ice and firn) was not (Figure 15). This suggests that whilst broad depositional events and processes are relatively consistent, at least in the central section of the ice shelf, the post-depositional modifications are site specific. One communality between the three cores, however, is that refreezing can be observed along the length of the core sections at all three locations, and melt-freeze processes across the ice shelf are ubiquitous.
4. Discussion
4.1. Framework to Describe Firn Stratigraphy
The classification strategy combined a simplified representation of crystal size, layer contact morphologies and different refrozen structures to respond to two principal motivations. Firstly, to observe whether there was evidence of water drainage, storage and refreezing within the profiles, and secondly to produce detailed structural information that could be used to inform hydrological modelling, which is often restricted to using simplified measures such as density to model routing. The goal was to provide a sufficient range of categories to cover the diversity of observed structures, without creating unnecessary categories to complicate interpretation and utility of the generated information.
In a generalised hydrological system, the flow of water through a porous medium is determined by the porosity, permeability and hydraulic gradient of the matrix [21]. Calculating flow is dependent on understanding the baseline properties of the system, but also the homogeneity and isotropy of both the profile and individual layers. Within a snowpack or firn layer, there are four principal features that modify the way water will move through the matrix: capillary imbibition, conductive pathways, grain structure discontinuities and refrozen structures [22]. Since all of these features are subject to potential change through time due to the phase changes of water, the baseline assessment of effective porosity in a snow/firn/ice matrix is more complex than in a medium such as soil or rock. Additionally, whilst grain size is important for determining bulk flow rates, it is likely that the distribution of structures such as ice lenses (which act to restrict liquid water flow) or conduits (which likely facilitate flow) is more important than grain morphology. This means that the structural considerations (such as grain size and contacts), must also be complemented with observations of relative saturation to determine probable pathways.
Therefore, to better inform future modelling efforts of drainage and aquifer development on ice shelf surfaces, we recommend as a minimum the collection of detailed measurements of grain size, contacts and recrystalized structures, together with bulk values of density and relative saturation. We also recommend the evaluation of how the morphology of contacts between layers enhances or hinders water movement through the profile.
4.2. A Conceptual Firn Aquifer Model Based on Firn Core Analysis
The analysis of three firn cores showed that the distribution of grain size was fairly consistent in the central region of the ice shelf (M1 and M2), and that similar recrystalization structures were observed between sites. Even though the exact distribution of recrystalized structures was not the same between cores, the types and quantity of features was similar, which suggest that the snow that arrives to the surface undergoes similar metamorphic processes, however the exact expression is site specific. Throughout the cores, several ice lenses were identified that are likely to inhibit vertical flow through the profile, although the existence of small-scale conduits will enhance water movement. This enhancement of movement is however unlikely to facilitate the movement of large volumes of water. At the central sites, the wetted fringe was observed at a similar depth (17–18 m) and given the similar structures and the confirmation that the water was of meltwater origin, it suggests that the saturated regions come from the ice shelf itself but are unlikely to be input from the overlying snowpack, and more likely to arrive laterally from upstream sources. On this ice shelf, ponds can be periodically observed in satellite data in upglacier regions which may contribute some of the observed water, but this needs to be further investigated. Additionally, whilst we cannot assess the continuity of the aquifer across the ice shelf from the firn cores, the similarities suggest that this is either an extensive aquifer, or the firn and/or energy properties enable the development of aquifers or transfer of water at a similar depth profile. The discovery of very saturated material at <4 m depth (M3) was unexpected. Further work needs to be undertaken to determine whether such shallow water masses are localised near the ice shelf margins or widespread phenomena, and under which conditions they form.
These conclusions are similar to those reached by the description of a firn aquifer on Wilkins ice shelf presented by [4], which combined measurements of the density, hydraulic conductivity and specific discharge. Their identified aquifer was found at a 13.4 m depth, which is several meters shallower than the aquifer identified at M1 and M2 on the Müller Ice Shelf. However, they also do not describe the presence of shallow saturated firn, such as that found at M3. Similarly to the field observations on Müller Ice Shelf, [4] did not record core temperatures significantly different to 0 °C, which suggests the thermal conditions within each ice shelf was very similar. We recommend that a combination of geophysical and direct observational information (i.e., drilling of firn cores or boreholes) data should be gathered simultaneously. Such strategy could lead to a better high-resolution and higher spatial distribution characterization of possible sub-surface liquid water bodies.
4.3. Future Application of Firn Core Analyses in Hydrological Modelling
There are several possible applications of the core descriptions included in this work. One possible use if as input for modelling water flow through, and storage within, frozen porous media. Whilst such models are outside the scope of this study, here we briefly describe the suite of parameters needed to facilitate the use of such models in a complex matrix, such as snow or firn.
To model flow through a porous medium, apart from the amount of meltwater that is supplied to the section, one also needs to know:
- Porosity
- Permeability
- Saturated fraction
Absolute porosity is defined as the ratio of pore volume to bulk volume and is differentiated from effective porosity which considers the interconnectedness of the pores. In snowpacks, porosity is often calculated from snow density [23], and the level of interconnectedness is largely ignored. The bulk density of snow combined with grain classification are basic datasets used to characterise snow layers; however density by itself only gives a coarse representation of the snow microstructure [23]. Depending on the final use of the information, we recommend including grain size into the calculation, and also discretizing the profile into largely homogeneous segments, as opposed to integrating the whole profile into a single calculation.
Permeability is dependent on both the volume and the connectedness of voids between crystals, and so an understanding of grain size, compaction and the presence of associated structures (such as small-scale conduits) is needed to characterise relative permeability, and eventually classify areas according to the dominance of primary/secondary permeability. From an analysis of the prevalence of different structures, such as ice lenses, interlayering and small-scale conduits, it is possible to indirectly estimate the:
- depth of the permeable layer
- likelihood of connections between layers
- presence of conduits or spaces within layers
Finally, the level of saturation within the matrix prior to the addition of ‘new’ water is necessary to model water flow through the medium. Precise water volumes in ice and firn are difficult to measure in the field and can only be approximately determined in the laboratory; however, estimates of relative saturation can be used to inform modelling strategies. We recommend the incorporation of geophysical measurements to determine possible wetting fronts and assess the continuity of saturated layers.
This study presents the detailed analysis of firn cores extracted from an Antarctic ice shelf, which provides profiles of granulometry and recrystalised structures that can be used as baseline information in hydrological models. The observed structures support the idea that aquifers are filled laterally as opposed to vertically and are likely formed at similar depths across the ice shelf in central regions. To expand on these conclusions, we recommend the incorporation of geophysical measurements and advanced glacio-hydrological modelling to assess the spatial distribution, overall structure and continuity of aquifers on the ice shelf, as well as hydrological system dynamics.
A better understanding of sub-surface dynamics of the ice shelves in regions like the Antarctic Peninsula is critical to assess their future stability under a warming scenario. This has been proven a difficult task presently due to technical and logistical difficulties and represents a key feature to generate more accurate models of future glacier dynamics [24].
Supplementary Materials
The following are available online at https://www.mdpi.com/2073-4441/13/5/731/s1, Video S1: MacDonell_Muller_saturated_core.MP4.
Author Contributions
Conceptualization, S.M., F.F. and A.H.; methodology, S.M. and F.F.; fieldwork, S.M., F.F. and A.H.; investigation, all co-authors; formal analysis, S.M., F.F. and P.V.; writing—original draft preparation, S.M.; writing—review and editing, all co-authors; project administration, S.M.; funding acquisition, S.M. All authors have read and agreed to the published version of the manuscript.
Funding
This research was funded by ANID-FONDECYT 1181540 and logistical support and funding was provided by the Instituto Antártico Chileno (INACH).
Institutional Review Board Statement
Not applicable.
Informed Consent Statement
Not applicable.
Data Availability Statement
The data presented in this study are available on request from the corresponding author.
Acknowledgments
We greatly acknowledge the field support provided by Tamara Muñoz, and the III Turkish Antarctic Expedition.
Conflicts of Interest
The authors declare no conflict of interest. The funders had no role in the design of the study; in the collection, analyses, or interpretation of data; in the writing of the manuscript, or in the decision to publish the results.
References
- Iken, A. The Effect of the Subglacial Water-Pressure on the Sliding Velocity of a Glacier in an Idealized Numerical-Model. J. Glaciol. 1981, 27, 407–421. [Google Scholar] [CrossRef] [Green Version]
- Reijmer, C.H.; van den Broeke, M.R.; Fettweis, X.; Ettema, J.; Stap, L.B. Refreezing on the Greenland ice sheet: A comparison of parameterizations. Cryosphere 2012, 6, 743–762. [Google Scholar] [CrossRef] [Green Version]
- Banwell, A.F.; MacAyeal, D.R.; Sergienko, O.V. Breakup of the Larsen B Ice Shelf triggered by chain reaction drainage of supraglacial lakes. Geophys. Res. Lett. 2013, 40, 5872–5876. [Google Scholar] [CrossRef] [Green Version]
- Montgomery, L.; Miège, C.; Miller, J.; Scambos, T.A.; Wallin, B.; Miller, O.; Solomon, D.K.; Forster, R.; Koenig, L. Hydrologic Properties of a Highly Permeable Firn Aquifer in the Wilkins Ice Shelf, Antarctica. Geophys. Res. Lett. 2020, 47. [Google Scholar] [CrossRef]
- Banwell, A. Ice-shelf stability questioned. Nature 2017, 544, 306–307. [Google Scholar] [CrossRef]
- Bell, R.E.; Chu, W.; Kingslake, J.; Das, I.; Tedesco, M.; Tinto, K.J.; Zappa, C.J.; Frezzotti, M.; Boghosian, A.; Lee, W.S. Antarctic ice shelf potentially stabilized by export of meltwater in surface river. Nature 2017, 544, 344–348. [Google Scholar] [CrossRef]
- Scambos, T.; Fricker, H.A.; Liu, C.-C.; Bohlander, J.; Fastook, J.; Sargent, A.; Massom, R.; Wu, A.-M. Ice shelf disintegration by plate bending and hydro-fracture: Satellite observations and model results of the 2008 Wilkins ice shelf break-ups. Earth Planet. Sci. Lett. 2009, 280, 51–60. [Google Scholar] [CrossRef]
- MacAyeal, D.R.; Sergienko, O.V. The flexural dynamics of melting ice shelves. Ann. Glaciol. 2017, 54, 1–10. [Google Scholar] [CrossRef] [Green Version]
- Banwell, A.F.; Caballero, M.; Arnold, N.S.; Glasser, N.F.; Mac Cathles, L.; MacAyeal, D.R. Supraglacial lakes on the Larsen B ice shelf, Antarctica, and at Paakitsoq, West Greenland: A comparative study. Ann. Glaciol. 2014, 55, 1–8. [Google Scholar] [CrossRef] [Green Version]
- Buzzard, S.C.; Feltham, D.L.; Flocco, D. A Mathematical Model of Melt Lake Development on an Ice Shelf. J. Adv. Modeling Earth Syst. 2018, 10, 262–283. [Google Scholar] [CrossRef] [Green Version]
- Kingslake, J.; Ely, J.C.; Das, I.; Bell, R.E. Widespread movement of meltwater onto and across Antarctic ice shelves. Nature 2017, 544, 349–352. [Google Scholar] [CrossRef] [Green Version]
- Kingslake, J.; Ng, F.; Sole, A. Modelling channelized surface drainage of supraglacial lakes. J. Glaciol. 2017, 61, 185–199. [Google Scholar] [CrossRef] [Green Version]
- Forster, R.R.; Box, J.E.; van den Broeke, M.R.; Miège, C.; Burgess, E.W.; van Angelen, J.H.; Lenaerts, J.T.M.; Koenig, L.S.; Paden, J.; Lewis, C.; et al. Extensive liquid meltwater storage in firn within the Greenland ice sheet. Nat. Geosci. 2013, 7, 95–98. [Google Scholar] [CrossRef]
- Hubbard, B.; Luckman, A.; Ashmore, D.W.; Bevan, S.; Kulessa, B.; Kuipers Munneke, P.; Philippe, M.; Jansen, D.; Booth, A.; Sevestre, H.; et al. Massive subsurface ice formed by refreezing of ice-shelf melt ponds. Nat. Commun. 2016, 7, 11897. [Google Scholar] [CrossRef] [PubMed] [Green Version]
- Siegert, M. Vulnerable Antarctic ice shelves. Nat. Clim. Chang. 2016, 7, 11–12. [Google Scholar] [CrossRef]
- Buzzard, S.; Feltham, D.; Flocco, D. Modelling the fate of surface melt on the Larsen C Ice Shelf. Cryosphere 2018, 12, 3565–3575. [Google Scholar] [CrossRef] [Green Version]
- Lenaerts, J.T.M.; Lhermitte, S.; Drews, R.; Ligtenberg, S.R.M.; Berger, S.; Helm, V.; Smeets, C.J.P.P.; van de Broeke, M.R.; van de Berg, W.J.; van Meijgaard, E.; et al. Meltwater produced by wind–albedo interaction stored in an East Antarctic ice shelf. Nat. Clim. Chang. 2016, 7, 58–62. [Google Scholar] [CrossRef] [Green Version]
- Domack, E.W.; Ishman, S.E.; Stein, A.B.; McClennen, C.E.; Jull, A.J.T. Late Holocene Advance of the Muller Ice Shelf, Antarctic Peninsula—Sedimentological, Geochemical and Paleontological Evidence. Antarct. Sci. 1995, 7, 159–170. [Google Scholar] [CrossRef]
- Cook, A.J.; Vaughan, D.G. Overview of areal changes of the ice shelves on the Antarctic Peninsula over the past 50 years. Cryosphere 2010, 4, 77–98. [Google Scholar] [CrossRef] [Green Version]
- Carrasco, J.E.; Cordero, R.R. Analyzing Precipitation Changes in the Northern Tip of the Antarctic Peninsula during the 1970–2019 Period. Atmosphere 2020, 11, 1270. [Google Scholar] [CrossRef]
- Freeze, R.A.; Cherry, J.A. Groundwater; Prentice-Hall: Englewood Cliffs, NJ, USA, 1979; p. 604. [Google Scholar]
- Pfeffer, W.T.; Humphrey, N.F. Determination of timing and location of water movement and ice-layer formation by temperature measurements in sub-freezing snow. J. Glaciol. 1996, 42, 292–304. [Google Scholar] [CrossRef] [Green Version]
- Fierz, C.; Armstrong, R.L.; Durand, Y.; Etchevers, P.; Greene, E.; McClung, D.M.; Nishimura, K.; Satvawali, P.K.; Sokratov, S.A. The International Classification for Seasonal Snow on the Ground. In IHP-VII Technical Documents in Hydrology 83; UNESCO-IHP: Paris, France, 2009. [Google Scholar]
- Siegert, M.; Atkinson, A.; Banwell, A.; Brandon, M.; Convey, P.; Davies, B.; Downie, R.; Edwards, T.; Hubbard, B.; Marshall, G.; et al. The Antarctic Peninsula Under a 1.5 degrees C Global Warming Scenario. Front. Environ. Sci. 2019, 7, 102. [Google Scholar] [CrossRef]
Figure 1.
Map of the study area. (a) shows the position on the Antarctic Peninsula, (b) shows the wider Müller Ice Shelf region, and the red points correspond to the ice core extraction sites.
Figure 1.
Map of the study area. (a) shows the position on the Antarctic Peninsula, (b) shows the wider Müller Ice Shelf region, and the red points correspond to the ice core extraction sites.

Figure 2.
Photograph of core handling on the Müller Ice Shelf. Two team members operated the electric drill, whilst the other two members bagged and recorded the extracted cores.
Figure 2.
Photograph of core handling on the Müller Ice Shelf. Two team members operated the electric drill, whilst the other two members bagged and recorded the extracted cores.

Figure 3.
Photograph of the constructed light box. The displayed core is approximately 90 cm in length.
Figure 3.
Photograph of the constructed light box. The displayed core is approximately 90 cm in length.

Figure 4.
Water being drained from the upper section of the drill after the extraction of the lower section of M3. In Video S1, a video of the extraction of the lower section of core is included.
Figure 4.
Water being drained from the upper section of the drill after the extraction of the lower section of M3. In Video S1, a video of the extraction of the lower section of core is included.

Figure 5.
Examples of the (a) fine (core reference: M2-4), (b) medium (core reference: M2-10), and (c) large grains (core reference: M2-11) found in the ice cores. NB: The measuring tape used for scale in each image is in cm units with mm subintervals.
Figure 5.
Examples of the (a) fine (core reference: M2-4), (b) medium (core reference: M2-10), and (c) large grains (core reference: M2-11) found in the ice cores. NB: The measuring tape used for scale in each image is in cm units with mm subintervals.

Figure 6.
Examples of paired upper and lower contact morphologies. (a) Diffuse (core reference: M2-13), (b) sinuous (core reference: M1-17), and (c) planar (core reference: M16) contacts found in the ice cores. NB: The measuring tape used for scale in each image is in cm units with mm subintervals.
Figure 6.
Examples of paired upper and lower contact morphologies. (a) Diffuse (core reference: M2-13), (b) sinuous (core reference: M1-17), and (c) planar (core reference: M16) contacts found in the ice cores. NB: The measuring tape used for scale in each image is in cm units with mm subintervals.

Figure 7.
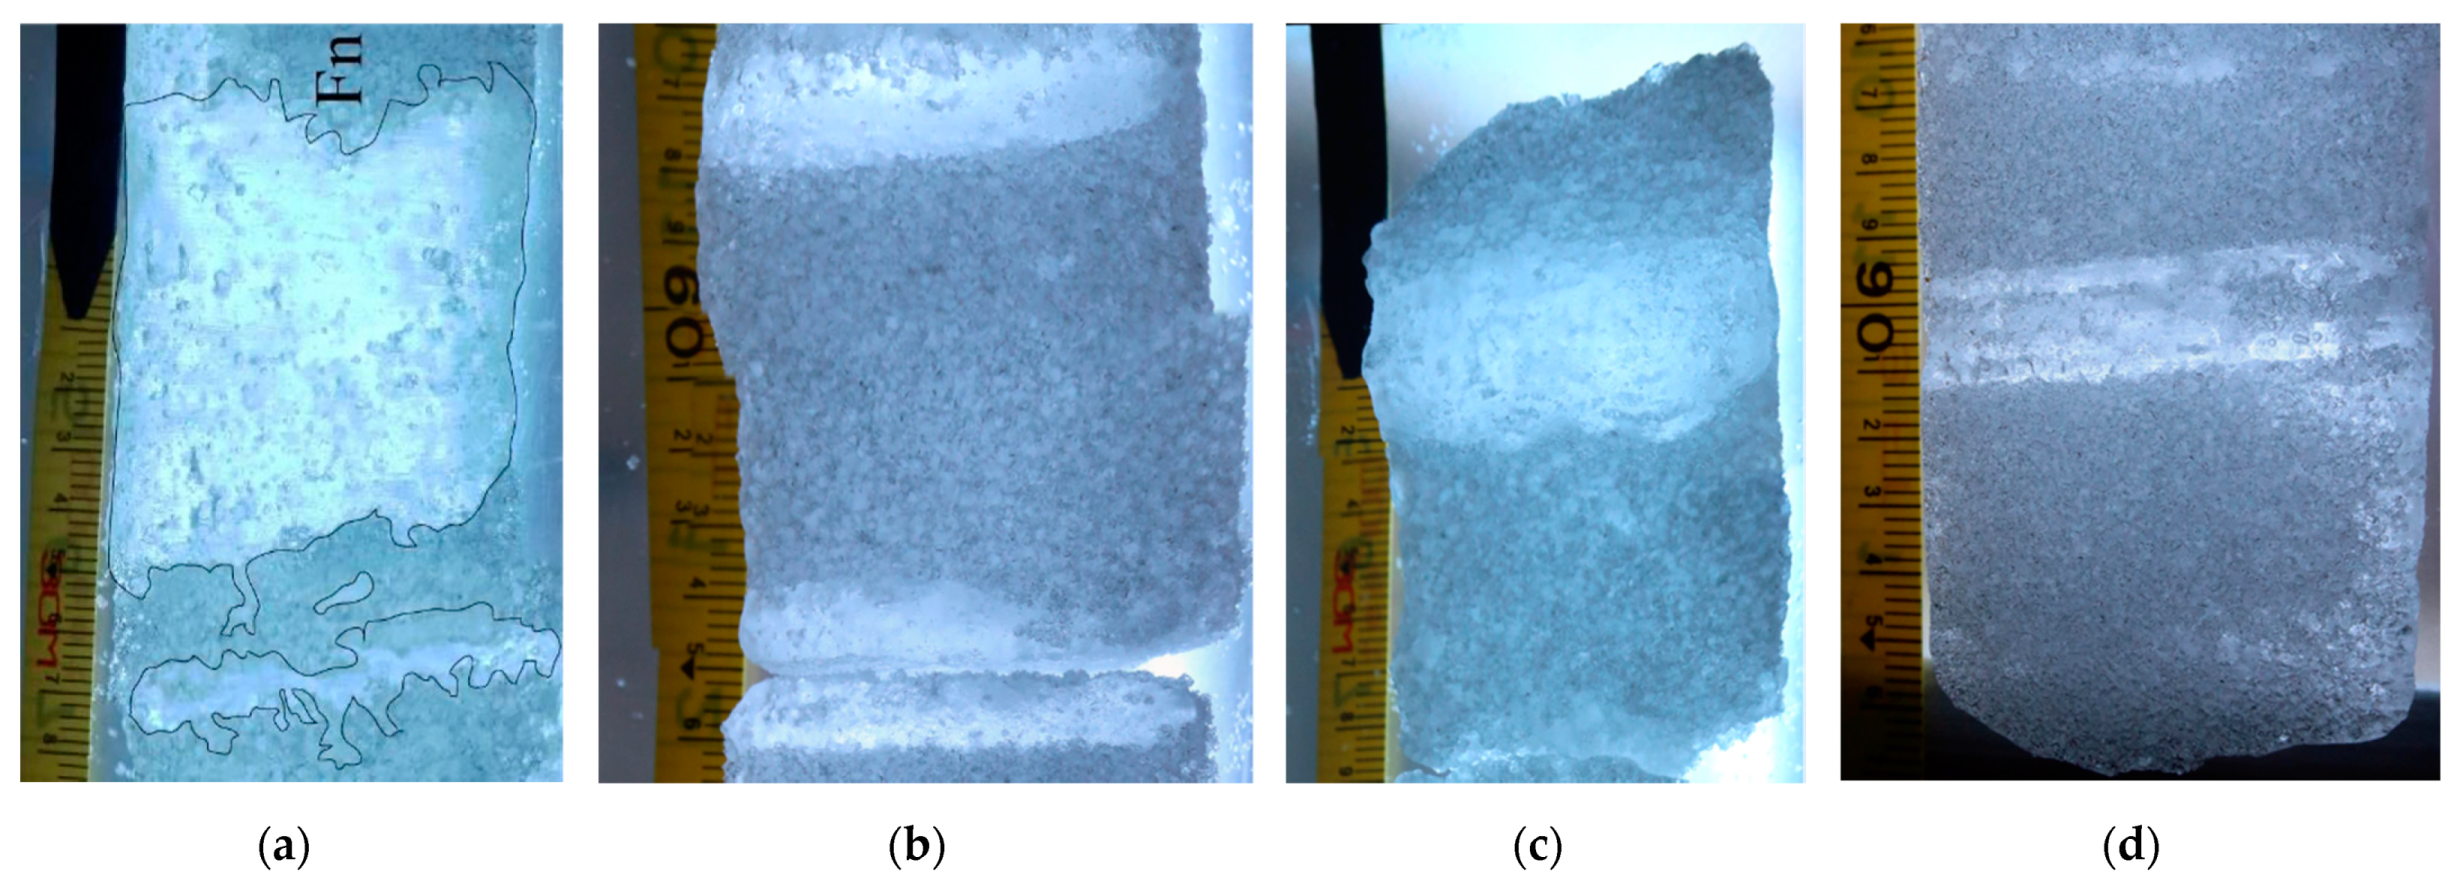
Examples of ice layers found in the ice cores. (a) is ice core section M2-13. In this section an ice lens overlays a fine ice lens (8 mm thick). A thin black line has been added to indicate how contacts between layers were visualised. (b) corresponds to section M1-3, which includes planar contacts at the base, and diffuse upper contacts. (c) shows section M1-4 which includes an ice lens with a sinuous contact at the base, and a diffuse upper contact. (d) is section M2-5 which has planar upper and lower contacts. NB: The measuring tape used for scale in each image is in cm units with mm subintervals.
Figure 7.
Examples of ice layers found in the ice cores. (a) is ice core section M2-13. In this section an ice lens overlays a fine ice lens (8 mm thick). A thin black line has been added to indicate how contacts between layers were visualised. (b) corresponds to section M1-3, which includes planar contacts at the base, and diffuse upper contacts. (c) shows section M1-4 which includes an ice lens with a sinuous contact at the base, and a diffuse upper contact. (d) is section M2-5 which has planar upper and lower contacts. NB: The measuring tape used for scale in each image is in cm units with mm subintervals.

Figure 8.
Examples of fine ice lenses identified in the ice cores. (a) corresponds to section M1-6. The stippled line indicates a fine scale ice lens with planar contacts. (b) is section M1-18 which contains several fine-scale ice lenses that have diffuse contacts. NB: The measuring tape used for scale in each image is in cm units with mm subintervals.

Figure 9.
An example of interlayering in section M2-10. Both (a,b) show the same section, however in (b), the fine-scale ice lenses and conduits are outlined in black. NB: The measuring tape used for scale in each image is in cm units with mm subintervals.
Figure 9.
An example of interlayering in section M2-10. Both (a,b) show the same section, however in (b), the fine-scale ice lenses and conduits are outlined in black. NB: The measuring tape used for scale in each image is in cm units with mm subintervals.

Figure 10.
Horizontal (continuous line) and vertical (dashed line) small scale conduits identified in section M2-3. (a) shows the core section without interpretation, and (b) with interpretation. NB: The measuring tape used for scale in each image is in cm units with mm subintervals.
Figure 10.
Horizontal (continuous line) and vertical (dashed line) small scale conduits identified in section M2-3. (a) shows the core section without interpretation, and (b) with interpretation. NB: The measuring tape used for scale in each image is in cm units with mm subintervals.

Figure 11.
The stratigraphy recorded from the Müller 1 core. Granulometry is divided into fine (green), medium (orange) and coarse (red) grain sizes and the ice severely impacted by post extraction refreezing is shown as a hashed box. Recrystalized structures are divided into ice lenses (blue), fine-scale ice lenses (purple) and interlaying of firn and ice). Ice conduits are not presented as these small-scale features where not continuous across the core. Additionally, relative humidity as observed in the field, and density as measured in the laboratory are presented.

Figure 12.
The stratigraphy recorded from the Müller 2 core. Granulometry is divided into fine (green), medium (orange) and coarse (red) grain sizes and the ice severely impacted by post extraction refreezing is shown as a hashed box. Recrystalized structures are divided into ice lenses (blue), fine-scale ice lenses (purple) and interlaying of firn and ice). Ice conduits are not presented as these small-scale features where not continuous across the core. Additionally, relative humidity as observed in the field, and density as measured in the laboratory are presented.

Figure 13.
The stratigraphy recorded from the Müller 3 core. Granulometry is divided into fine (green), medium (orange) and coarse (red) grain sizes and the ice severely impacted by post extraction refreezing is shown as a hashed box. Recrystalized structures are divided into ice lenses (blue), fine-scale ice lenses (purple) and interlaying of firn and ice). Ice conduits are not presented as these small-scale features where not continuous across the core. Additionally, relative humidity as observed in the field, and density as measured in the laboratory are presented.

Figure 14.
Approximate correlation between cores based on grain size. Red indicates coarse grain size, orange medium grain size and green indicates fine grain size. Uncoloured areas indicate saturated firn that was too modified post extraction to analyse precisely. Dashed lines indicate interpreted similarities between cores. Indicated elevations were recorded using a Garmin eTrex 30x handheld unit, so should be treated as indicative only.

Figure 15.
Indicative distribution of recrystalized structures in each core (recrystalised features are not to scale). Dark grey indicates ice lenses, purple indicates fine ice lenses and pink indicates interlayered firn and ice sections.
Figure 15.
Indicative distribution of recrystalized structures in each core (recrystalised features are not to scale). Dark grey indicates ice lenses, purple indicates fine ice lenses and pink indicates interlayered firn and ice sections.

Publisher’s Note: MDPI stays neutral with regard to jurisdictional claims in published maps and institutional affiliations. |
© 2021 by the authors. Licensee MDPI, Basel, Switzerland. This article is an open access article distributed under the terms and conditions of the Creative Commons Attribution (CC BY) license (http://creativecommons.org/licenses/by/4.0/).
Share and Cite
MDPI and ACS Style
MacDonell, S.; Fernandoy, F.; Villar, P.; Hammann, A. Stratigraphic Analysis of Firn Cores from an Antarctic Ice Shelf Firn Aquifer. Water 2021, 13, 731. https://doi.org/10.3390/w13050731
AMA Style
MacDonell S, Fernandoy F, Villar P, Hammann A. Stratigraphic Analysis of Firn Cores from an Antarctic Ice Shelf Firn Aquifer. Water. 2021; 13(5):731. https://doi.org/10.3390/w13050731
Chicago/Turabian StyleMacDonell, Shelley, Francisco Fernandoy, Paula Villar, and Arno Hammann. 2021. "Stratigraphic Analysis of Firn Cores from an Antarctic Ice Shelf Firn Aquifer" Water 13, no. 5: 731. https://doi.org/10.3390/w13050731
Note that from the first issue of 2016, this journal uses article numbers instead of page numbers. See further details here.