
Developing Real-Time Nowcasting System for Regional Landslide Hazard Assessment under Extreme Rainfall Events

1
National Center for Research on Earthquake Engineering, Taipei 106219, Taiwan
2
Department of Civil Engineering, National Central University, Taoyuan 320317, Taiwan
*
Author to whom correspondence should be addressed.
Water 2021, 13(5), 732; https://doi.org/10.3390/w13050732
Submission received: 31 December 2020
/
Revised: 3 March 2021
/
Accepted: 4 March 2021
/
Published: 8 March 2021
(This article belongs to the Special Issue Rainfall-Induced Shallow Landslides Modeling and Warning)
Abstract
:In this research, a real-time nowcasting system for regional landslide-hazard assessment under extreme-rainfall conditions was established by integrating a real-time rainfall data retrieving system, a landslide-susceptibility analysis program (TRISHAL), and a real-time display system to show the stability of regional slopes in real time and provide an alert index under rainstorm conditions for disaster prevention and mitigation. The regional hydrogeological parameters were calibrated using a reverse-optimization analysis based on an RGA (Real-coded Genetic Algorithm) of the optimization techniques and an improved version of the TRIGRS (Transient Rainfall Infiltration and Grid-based Regional Slope-Stability) model. The 2009 landslide event in the Xiaolin area of Taiwan, associated with Typhoon Morakot, was used to test the real-time regional landslide-susceptibility system. The system-testing results showed that the system configuration was feasible for practical applications concerning disaster prevention and mitigation.
1. Introduction
During 7–10 August 2009, Typhoon Morakot brought strong southwesterly winds and extremely heavy rainfall. Hourly rainfall exceeded 50 mm, with a cumulative total of more than 2500 mm. The extreme duration and intensity of the rainfall caused many landslides in the mountainous area near the village of Xiaolin. The village was destroyed and buried by debris from a deep-seated landslide, resulting in the loss of 500 lives. This was the most serious landslide tragedy in the history of Taiwan, which caused great public concern. A real-time regional landslide forecasting system for extreme-rainfall conditions would contribute to the development of a nation-wide early warning system to prevent such a landslide disaster.
Early warning systems for rainfall-induced landslides have now been established in many countries. Baum and Godt [1] reviewed the development history of early warning systems for landslides and debris flows and the system currently operating in the United States. The US Geological Survey (USGS), in cooperation with the National Weather Service (NWS), operated an experimental landslide warning system in the San Francisco Bay area of California in 1985–1995 [2]. The system used groundwater level monitoring, antecedent rainfall, and rainfall intensity–duration thresholds as alert indicators to support alerts being issued via broadcast media. However, the system was closed due to a lack of funding. The Oregon Department of Geology and Mineral Industries built a real-time landslide warning system in western Oregon, USA, which has been in operation since 1997. The system uses antecedent rainfall monitoring, landslide hazard maps from Hoffmeister et al. [3], and rainfall intensity–duration thresholds as alert indicators to enable alerts to be issued via the news media and Internet. The USGS has operated a real-time landslide warning system for potential debris flows in parts of the Appalachians since 2004 [4]. That system uses landslide hazard maps from Radbruch-Hall et al. [5] and rainfall intensity–duration thresholds as alert indicators to issue alerts via the Internet. In cooperation with the NWS and the City of Seattle, the USGS has operated a landslide warning system in Seattle under an informal agreement since 2002 [6]. That system uses real-time monitoring of rainfall, NWS quantitative precipitation forecasts, soil moisture and pore pressure monitoring, cumulative rainfall thresholds, rainfall intensity–duration thresholds, and landslide hazard maps from Harp et al. [7] as alert indicators.
To develop a landslide early warning system in Italy, Segoni et al. [8] built an automatic forecasting chain for the spatial and temporal prediction of shallow landslides in the framework Landslides Platform Service 2. This service used soil saturation estimates and regional rainfall layers, produced from actual rainfall station data and radar rainfall maps. The data were used as inputs for a hydrogeological model, C-DRiFt, to calculate the distribution of factors of safety over the entire basin. All outputs were shown in a Web-GIS system so that end-users could interactively access and download data to find out about the safety of areas of concern. Montrasio et al. [9] performed real-time landslide-potential forecasts using a SLIP (Shallow Landslides Instability Prediction) model for one year in the Emilia Romagna region of northern Italy to confirm the utility of the landslide warning model. Federici et al. [10] implemented an automatic rainfall-induced regional landslide prediction procedure in the GIS GRASS system for the Santo Stefano d’Aveto region, Italy. The procedure used an integrated hydrological-geotechnical (IHG) model and an infinite slope analysis to produce landslide-susceptibility raster maps.
In Asia, the Geotechnical Engineering Office (GEO) in Hong Kong, in cooperation with the Hong Kong Observatory (HKO), has operated a regional landslide warning system since 1977 [11]. This system integrates the real-time rain gauge network with a statistical model for predicting landslide susceptibility extracted from Yu et al. [12]. After the results had been examined by the experts, the warning information would be issued to the public. Chen et al. [13] developed a real-time landslide warning system, GRAPES-LFM (GRAPES: Global and Regional Assimilation and PrEdiction System; LFM: Landslide Forecast Model), in China. The system integrated a meteorological model, GRAPE, and the TRIGRS (Transient Rainfall Infiltration and Grid-based Regional Slope-Stability) model from Baum et al. [14] to predict rainfall-induced landslides. The system was tested in Dehua County, Fujian Province, where Typhoon Bilis triggered regional landslides in 2006. In Taiwan, Lin et al. [15] developed a rainfall-induced landslide warning system on a Web-GIS platform. That system used real-time rainfall forecast data from a QPESUMS (Quantitative Precipitation Estimation and Segregation Using Multiple Sensors) model developed by the Central Weather Bureau, static landslide potential calculated using a logistic regression analysis model, and the landslide cumulative rainfall thresholds calculated using a deterministic method to produce a dynamic landslide-risk prediction and issue the results using the Web Mapper Service (WMS). Tang et al. [16] integrated a deterministic model, TRIGRS, and optimization techniques to develop a regional rainfall-induced landslide-potential analysis model. This model can be used to predict the time, scale, and spatial distribution of rainfall-induced shallow landslides in watersheds. Chien et al. [17] used rainfall data from a QPESUMS model, TRIGRS from Baum et al. [18], and landslide cumulative rainfall thresholds to produce a rainfall-induced shallow landslide warning system for the development of disaster-related policies.
The proper determination of geotechnical and hydrogeological parameters is very important to any landslide stability analysis model. Traditionally, these parameters are determined by suitable laboratory and in situ tests for site-specific landslide problem. However, the test methodology may not suitable to regional landslide analysis model due to the high variability of the parameters [19] or insufficiency of test data. Therefore, other approaches have been used in the regional analysis model. For example, Han et al. [20] used the probabilistic approach to consider the variability of the hydraulic conductivity into the slope stability model. Park et al. [21] applied Monte Carlo simulation in their infinite slope model to consider the inherent uncertainty and variability of input parameters to assess shallow landslide susceptibility over an extensive area. The idea of the study is to use optimization techniques to calibrate the parameters from some available test values and inventories of the antecedent rainfall events to forwardly predict the landslide development of the next rainfall event.
Based on our review of landslide early warning systems, it seems rare that systems can consider the effect of infiltration of actual recent rainfall on slope stability, use real-time susceptibility-display services, and include a regional hydrogeological parameter calibration module. The aim of this research was to integrate a real-time rainfall data retrieving system, a landslide-susceptibility analysis program (TRISHAL), and a real-time landslide-potential display system to implement a real-time nowcasting system for regional landslides. The Morakot-induced landslide event in the Xiaolin area was used for system testing. The system is intended to provide users with a service allowing access to information about the real-time landslide susceptibility of areas of concern, and provide suggestions relating to disaster prevention.
2. Materials and Methods
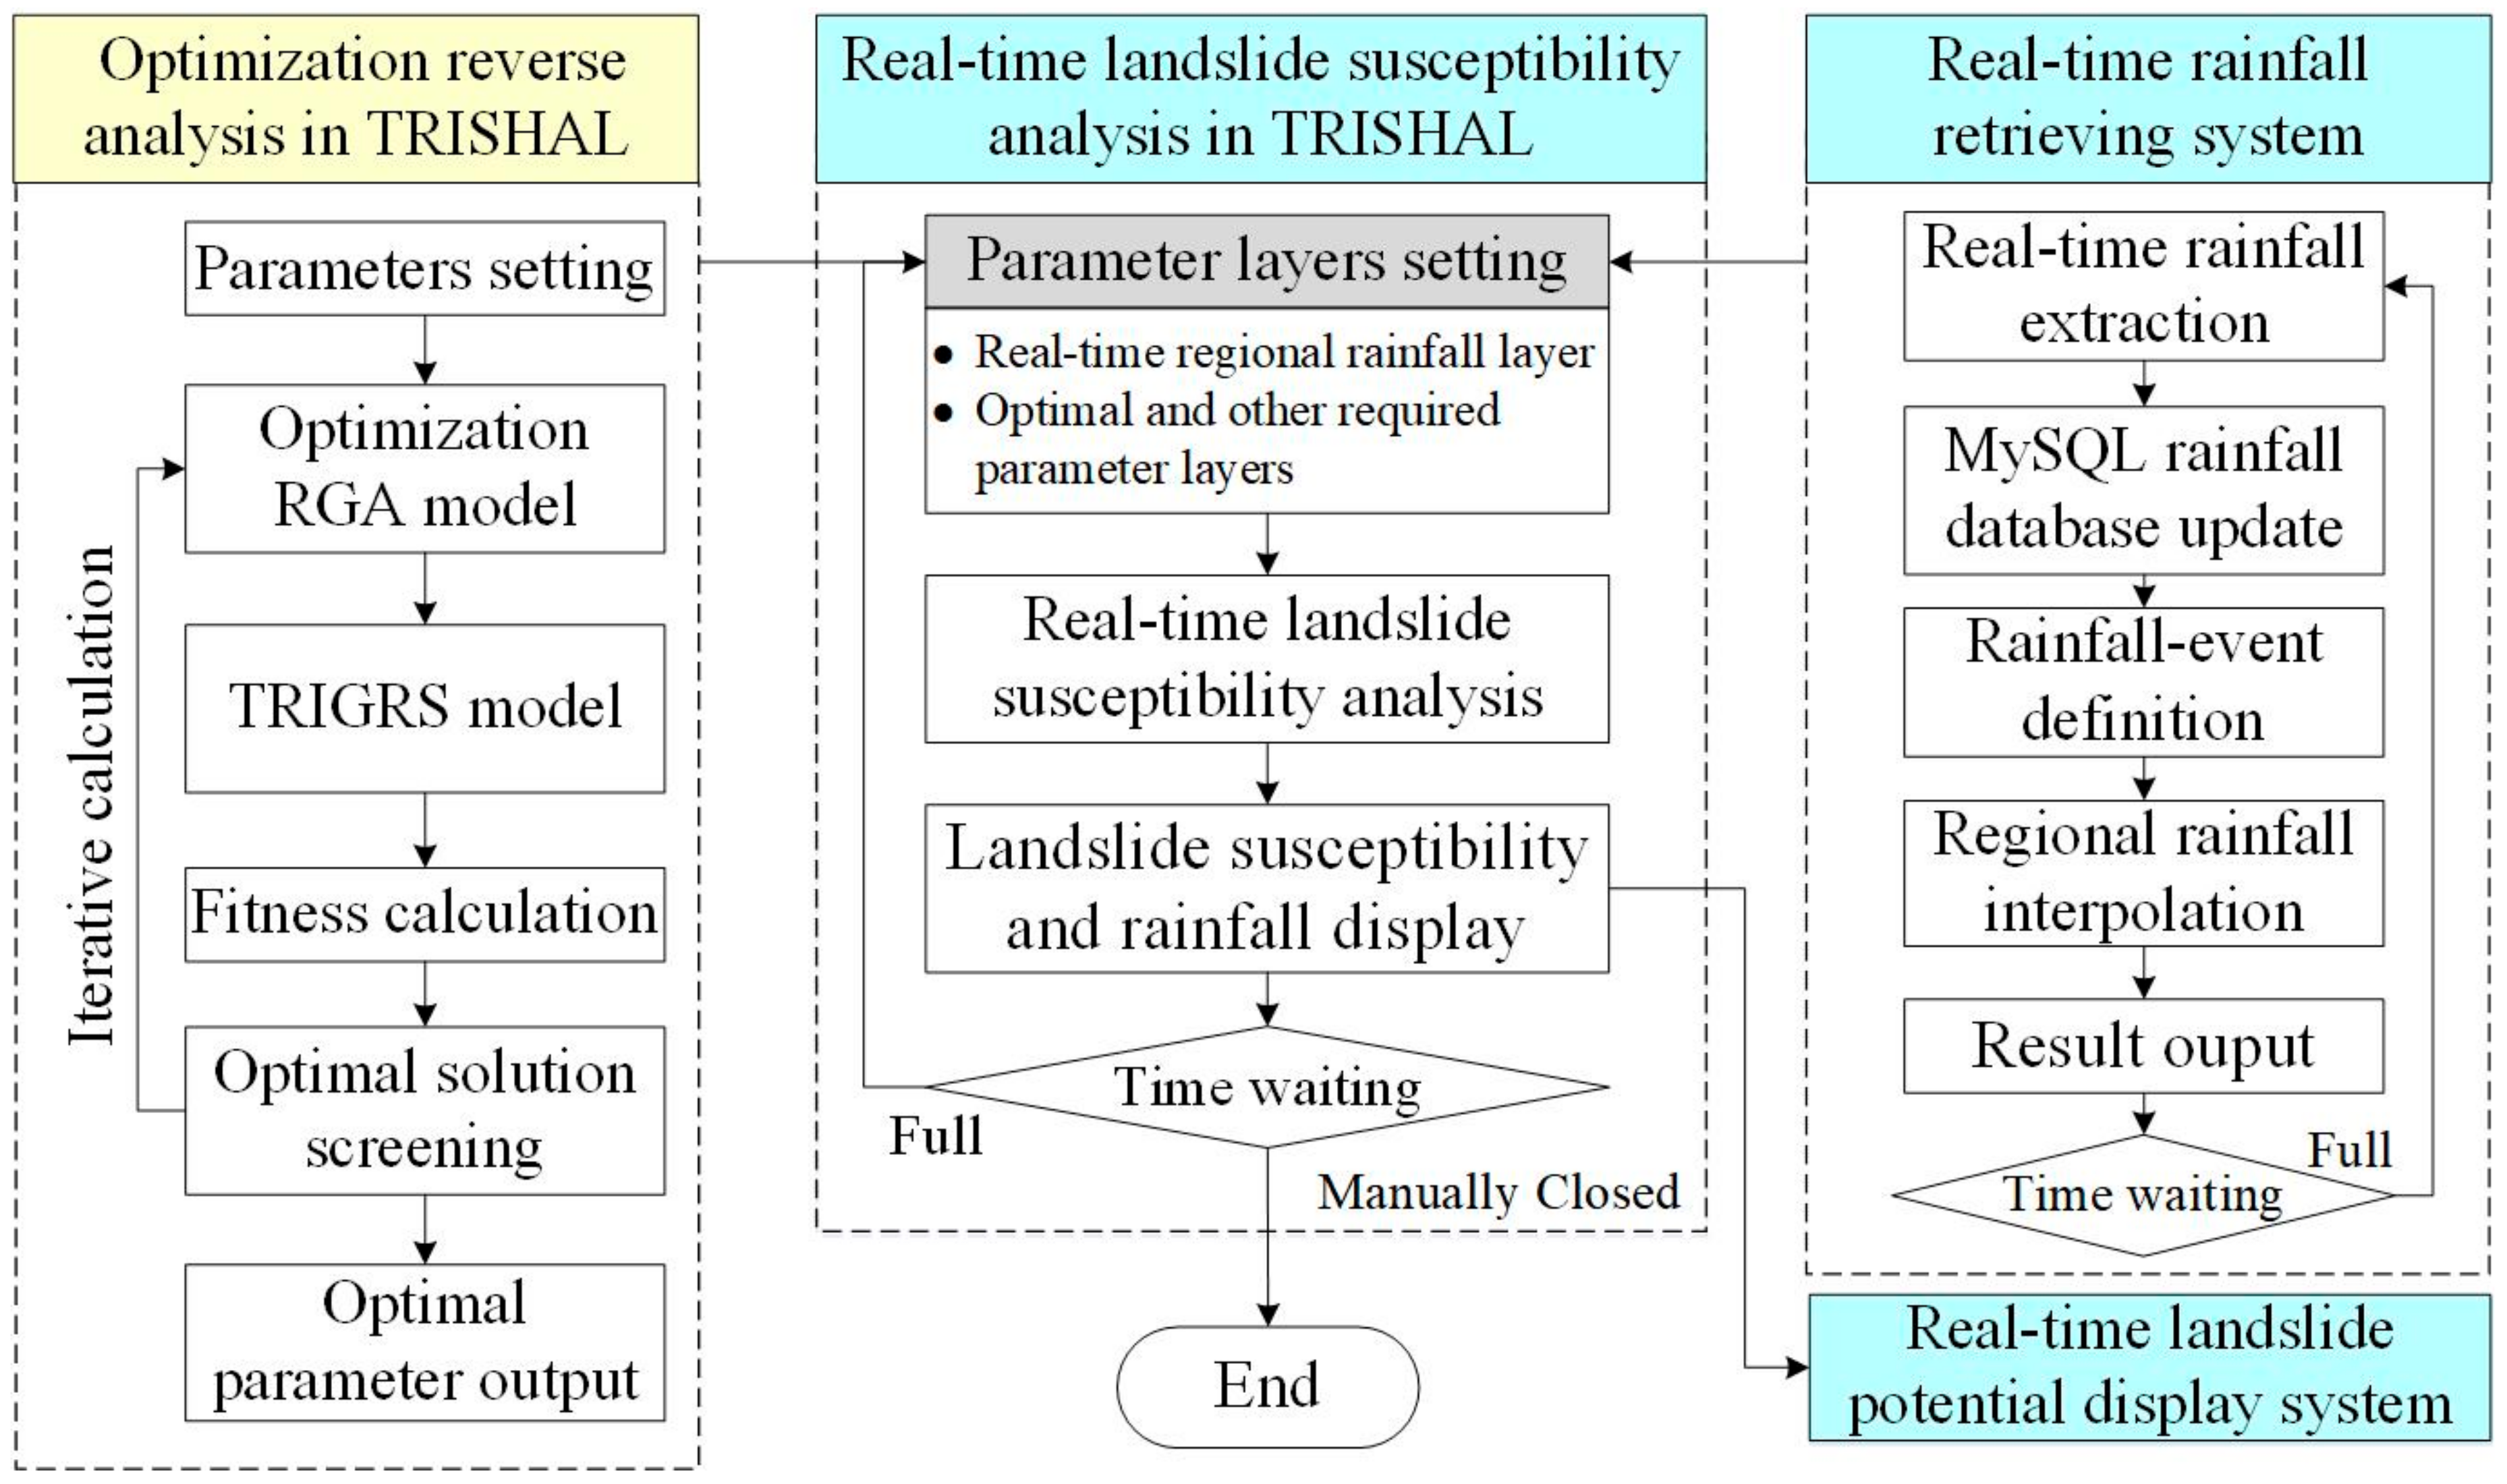
In this research, the regional landslide real-time nowcasting system integrated a real-time rainfall data retrieving system, a landslide-susceptibility analysis program (TRISHAL), and a real-time landslide-potential display system. The system configuration is shown in Figure 1, which illustrates how the data are transferred between the systems to perform the landslide-susceptibility analysis, displaying the output under real-time rainfall. Each subsystem is described below.
2.1. Real-Time Rainfall Data Retrieving System
The real-time rainfall data retrieving system was implemented in an ArcGIS environment, which is a geographic information system developed by Esri. The procedure was coded in the built-in ArcGIS program language, using ArcGIS object functions and a Windows API function library to extract real-time rainfall information from the public website of the Central Weather Bureau (CWB). The extracted data were then inserted and updated in the real-time rainfall database. Rainfall-event definition and regional interpolation functions would then be executed to produce the regional rainfall layers used by the landslide-susceptibility analysis program (TRISHAL). The functioning of the real-time rainfall database, the rainfall-event definition, and real-time regional rainfall production are described below.
2.1.1. Real-Time Rainfall Database Implementation
The aim of the real-time rainfall database was to store the real-time rainfall data extracted from the CWB website and provide a connection to the real-time rainfall data retrieving system. The main tasks were implementing the MySQL rainfall database, ensuring timely extraction of the real-time rainfall data, and ensuring that database updating proceeded. To ensure the robustness and accessibility of the system, the professional database program MySQL was used to store the real-time rainfall data. The rainfall database architecture included the spatial information from the weather stations as well as the real-time rainfall data, both stored in table format. The attribute fields of the spatial information table were the station coordinates, location, elevation, affiliated basin, and the station identifier codes. This table had to be maintained manually. The attribute fields of the real-time rainfall table were the station identifier codes, rainfall time, and the corresponding hourly rainfall data. The two tables were linked via the station identifier codes for subsequent spatial information processing. The system used the timer function from the Windows API function library to extract and analyze the real-time rainfall information from the CWB website. The extraction data would then be automatically inserted into the MySQL database via the built-in database functions (such as “select”, “update”, and “insert”) for subsequent analysis.
2.1.2. Rainfall-Event Definition
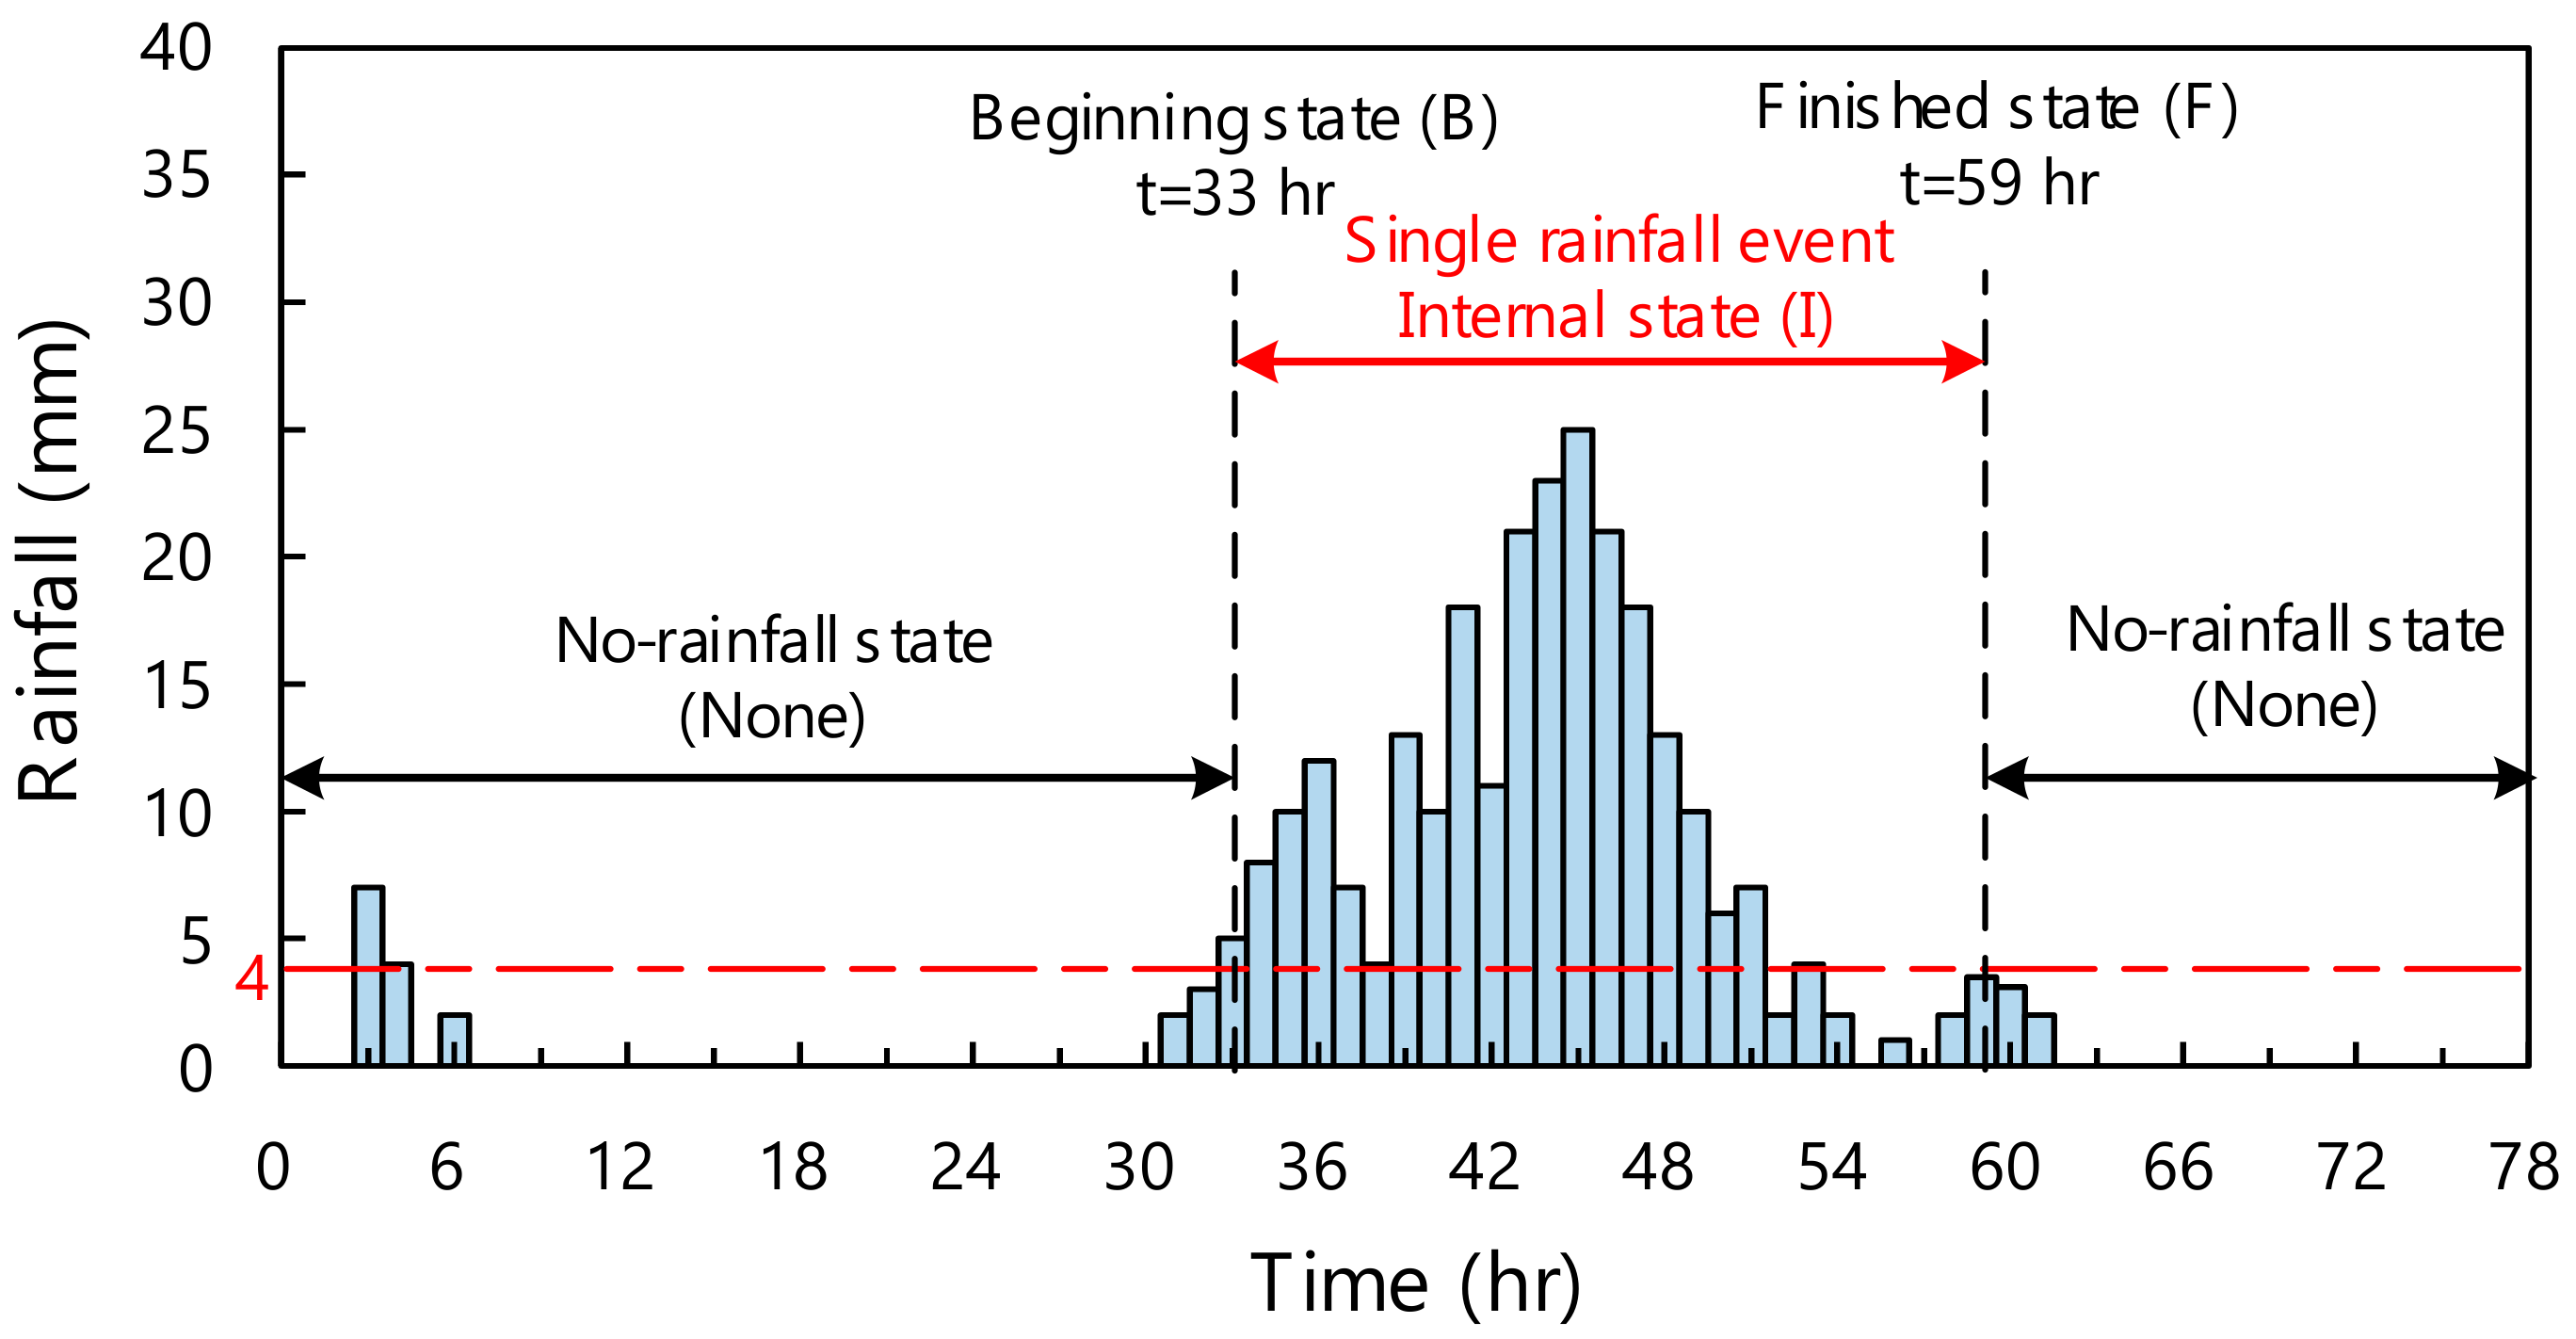
To prevent unnecessary analysis, this system used the effective rainfall-event definition on a single rainfall station proposed by Lee et al. [22]. A schematic diagram of this definition is shown in Figure 2. In the time series rainfall data, when the hourly rainfall increased to over 4 mm, this was defined as the rainfall-beginning state (B). In the subsequent rainfall series, when the hourly rainfall was less than 4 mm for six consecutive hours and did not increase again, this was called the rainfall-finished state (F). In the rainfall series, a single rainfall event was defined as the period from the onset of the beginning state to the end of the finished state. The rainfall state between the beginning and finished states was denoted the internal state (I). The no-rainfall state (None) was everything that occurred outside of single rainfall events. For each rainfall event, a cumulative rainfall total was calculated. The rainfall station located closest to the center of the analysis region was considered to be representative of the regional rainfall-event definition. Regional rainfall layers would be produced during rainfall events and would not be produced during the no-rainfall state.
2.1.3. Real-Time Regional Rainfall Production
The real-time rainfall data retrieving system would produce regional rainfall layers during rainfall events. The system was connected to the MySQL rainfall database to retrieve the real-time hourly rainfall data for the region of interest for interpolation analysis. The regional rainfall layers were produced by using the interpolation object function in ArcGIS. The setting used for the interpolation analysis was the Ordinary Kriging method. The output file format for the regional rainfall layers was in ASCII file format for use in the real-time landslide-susceptibility analysis in the TRISHAL program.
2.2. Real-Time Landslide-Susceptibility Analysis Program
The real-time landslide-susceptibility analysis program, TRISHAL, used two modules to execute the landslide-susceptibility analysis. One was the real-time landslide-susceptibility analysis procedure, which ran the TRIGRS program to analyze the real-time stability of the regional slopes during rainfall after confirming the production of the real-time regional rainfall layers. The other module was the reverse-optimization procedure, which calibrated the regional parameters used in the real-time landslide-susceptibility analysis. The theoretical basis of the TRIGRS model, the techniques used for the real-time landslide-susceptibility analysis, and the optimization inverse analysis of the regional parameters are described below.
2.2.1. Theoretical Basis of the TRIGRS Model
The TRIGRS model was developed by Baum et al. in 2002 [14]. It combines a hydrologic infiltration model with an infinite slope stability model. The infiltration model was based on an approximate analytic solution of Richards’ equation using a wet initial condition to compute the pressure head induced by the rainfall [23]. The calculated pressure head was used in the infinite-slope stability formulation by Iverson [23] to give time- and depth-dependent factors of safety that were incorporated on a cell-by-cell basis into a grid-based GIS framework of rainfall-induced initiation of shallow landslides.
The code for calculating the pressure head in the TRIGRS program was updated by Baum et al. in 2008 [18]. Deng and Hwang [24] confirmed that this updated code for calculating the total pressure head under wet initial conditions that had been developed by Baum et al. [18] corresponded to the correct analytic solution equations. We therefore used the 2008 version of the TRIGRS model as the analysis core of the landslide-susceptibility analysis. The equations for the total pressure head differed according to the boundary conditions of the slope bedrock, which could be either infinite-depth or finite-depth. The assumption in the infinite slope stability model was that the depth of the grid cells was less than their width. The predictions yielded were more accurate where conditions favored planar failure. The stability model used the factor of safety, FS, calculated as the ratio of the resisting basal Coulomb friction to the gravitationally induced downslope basal driving stress (Equation (1)) to represent the landslide susceptibility in the region. Failure was predicted where FS < 1, and stability held where FS ≥ 1. The detailed theoretical formula derivation and notes in the program referred to Baum et al. [14], Baum et al. [18], Iverson [23], Deng and Hwang [24], and Deng [25].
In Equation (1), where is the saturated soil unit weight, is the soil cohesion for effective stress, is the soil friction angle for effective stress, is the unit weight of groundwater, is the analysis depth, is the factor of safety, is the total pressure head, is time, and is the slope gradient of the slope grids.
2.2.2. Techniques of Real-Time Landslide-Susceptibility Analysis
TRIGRS analyzed the stability of the regional slopes when a pressure-head build-up was induced by rainfall infiltration, based on the actual rainfall history. The TRIGRS program downloaded from the USGS website did not provide an automatic rainfall setting function to execute the real-time landslide-susceptibility analysis for regional slopes. Therefore, to execute the real-time TRIGRS analysis for the practical application of disaster prevention, we developed a real-time landslide-susceptibility analysis interface coded in Visual Basic programming language. The system used the timer function to run the real-time landslide-susceptibility analysis after confirming that the real-time regional rainfall and parameter layers required for the TRIGRS analysis had been produced.
The program execution time is a critical factor for developing a real-time landslide-susceptibility analysis for practical applications. The TRIGRS system developed by the USGS considered the computer’s memory limitations and the analysis settings using an arbitrary number of periods with different rainfall intensities. The program would release the memory matrix that could then be used for the next period of different rainfall intensity. This greatly reduced the memory usage required for long-term analysis, but required the complex code for calculating the transient pressure head to be calculated repeatedly when there were many periods with different rainfall intensities. The analysis time would then be proportional to the square of the number of periods with different rainfall intensities. This program structure made the original TRIGRS program difficult to use in a real-time warning context.
The computer technology available now is more advanced than the development environment of the original program, with much larger memory capacities. We were therefore able to increase the execution speed of the program by improving the program structure and using the memory matrix to store the repeated calculation variables. The program structure of the landslide-susceptibility analysis was improved in accordance with the equal time intervals in the real-time rainfall data downloaded from the CWB website.
The fundamental transient pressure head equation with the finite-depth boundary condition in TRIGRS program is shown in Equation (2). The memory matrix for the transient pressure head could store the non-repetitive transient pressure head variables for every period with a different rainfall intensity in each rainfall event (Equation (3)) in the finite-depth boundary condition. The elements of the memory matrix were extracted to calculate the transient pressure head caused by each period of past rainfall, as per Equation (4). For the hourly rainfall interval used in the real-time landslide-susceptibility analysis example, the transient pressure head of the first hour could be expressed as per Equation (5).
In Equation (2), where is the transient pressure head, is the saturated hydraulic conductivity, is the surface flux of a given intensity for the nth time interval, is the Heaviside step function, , is the saturated hydraulic diffusivity, is the equal rainfall interval, is the order of the rainfall periods, is the depth of the impermeable basal boundary, is the cumulative integer variable represents the item of series solution, and is the formulation of the complementary error function. is the variable in the complementary error function.
The execution time for a landslide-susceptibility analysis covering a wide area with a large number of periods with different rainfall intensities was still lengthy when using the above improvement. We then used shared memory in a parallel computing technique to improve computing efficiency. We used the multi-core computing technique in standalone mode, which was suitable for independent analysis of each of the grid cells in the regional slopes. With this multi-core improvement, the TRIGRS program was recompiled into a 64-bit application using the Intel Visual Fortran Compiler and executed in a Microsoft 64-bit operating system equipped with sufficient memory.
2.2.3. Optimization Inverse Analysis for Regional Parameters
The soil measured parameters showed a relatively high variability for different lithologies [19]. The representative parameters for regional slopes were difficult to acquire purely from geologic borings and laboratory tests. In order to get good match with the landslide inventory and improve the calibration efficiency, we therefore developed an optimization inverse analysis module to calibrate the regional hydrogeological parameters. This module integrated the RGA (Real-coded Genetic Algorithm) proposed by Holland [26] and the TRIGRS model to analyze the regional parameters in reverse. The module was used to introduce a global random search and the iteration characteristics of RGA into the TRIGRS model to iteratively calculate the landslide susceptibility of different random sets of hydrogeological parameters under the specific rainfall event concerned. The random values of hydrogeological parameters in each lithology zone were automatically searched by RGA in the reasonable physical intervals based on the records of literatures [25]. The optimization searching zones were defined by the lithology zones of the geological map due to the close relation between soil and lithologies. The objective prediction of the landslide distribution based on the optimized set of parameters was close to the actual landslide distribution in the landslide inventory.
To evaluate the performance of the calibration parameters, this module used the confusion matrix classification types shown in Table 1, which were proposed by Stehman [27]. was a total of actual landslide cells which were predicted as landslides successfully. was a total of actual landslide cells which were predicted as non-landslide cases. was a total of actual non-landslide cells which were predicted as landslides. was a total of actual non-landslide cells which were predicted as non-landslide cases successfully. Table 1 was used to calculate the following evaluation indexes: the success rate of prediction of landslide cells (), the false rate of prediction of landslide cells (), the false rate of prediction of non-landslide cells (), and the total success rate of prediction () using Equations (6) to (9). In addition, we used an AUC index, area under the prediction rate curve from Chung and Fabbri [28] for auxiliary assessment of the prediction quality.
The optimization model used the fitness function of the static penalty method to transfer a constrained problem into the unconstrained state by weighting the objective and constrained functions via mathematical programming. The fitness function (Equation (10)) considers the evaluation indexes based on Table 1, the initial stability, extreme FS values, and the reasonability of the landslide failure history. The lower the fitness value, the better the performance of the calibrated regional parameters. In the optimization model, the random-search setting of which hydrogeological parameters would be used could be changed by users depending on the degree of uncertainty. The random-search hydrogeological variables available in this module were effective cohesion , internal friction angle , saturated hydraulic conductivity , saturated hydraulic diffusivity , and steady (initial) surface flux . The detailed calculation process of the RGA was based on Holland [26].
In Equation (10), where is the fitness value, the expected search direction is toward to low fitness values. represents the initial failure before a rainfall event, and the expected search direction is toward solutions with initial stability. represents the false rate of prediction of landslide cells, and the expected search direction is toward low values. represents the false rate of prediction of non-landslide cells, and the expected search direction is toward low values. represents the degree of instability in the failure grids, and the expected search direction is toward critical stability. represents the degree of stability in the failure grids, and the expected search direction is toward critical stability. represents the correlation between the cumulative rainfall history and the cumulative landslide grids, and the expected search direction is toward a high correlation. is the penalty coefficient.
2.3. Real-Time Landslide-Potential Display System
The real-time landslide-potential display system was implemented in the ArcGIS environment. The system was coded in the built-in ArcGIS program language. It used ArcGIS object functions and a Windows API function library to display the real-time landslide-susceptibility maps in the ArcMap window, after the real-time landslide-potential maps had been confirmed. The color of the grid cells with a risk of landslide, i.e., FS < 1, was red, and the color of the stable grid cells, i.e., FS ≥ 1, was green. The real-time visual display function allowed users to observe dynamic slope stability for the rainfall event of concern.
3. Results
3.1. System-Testing Case
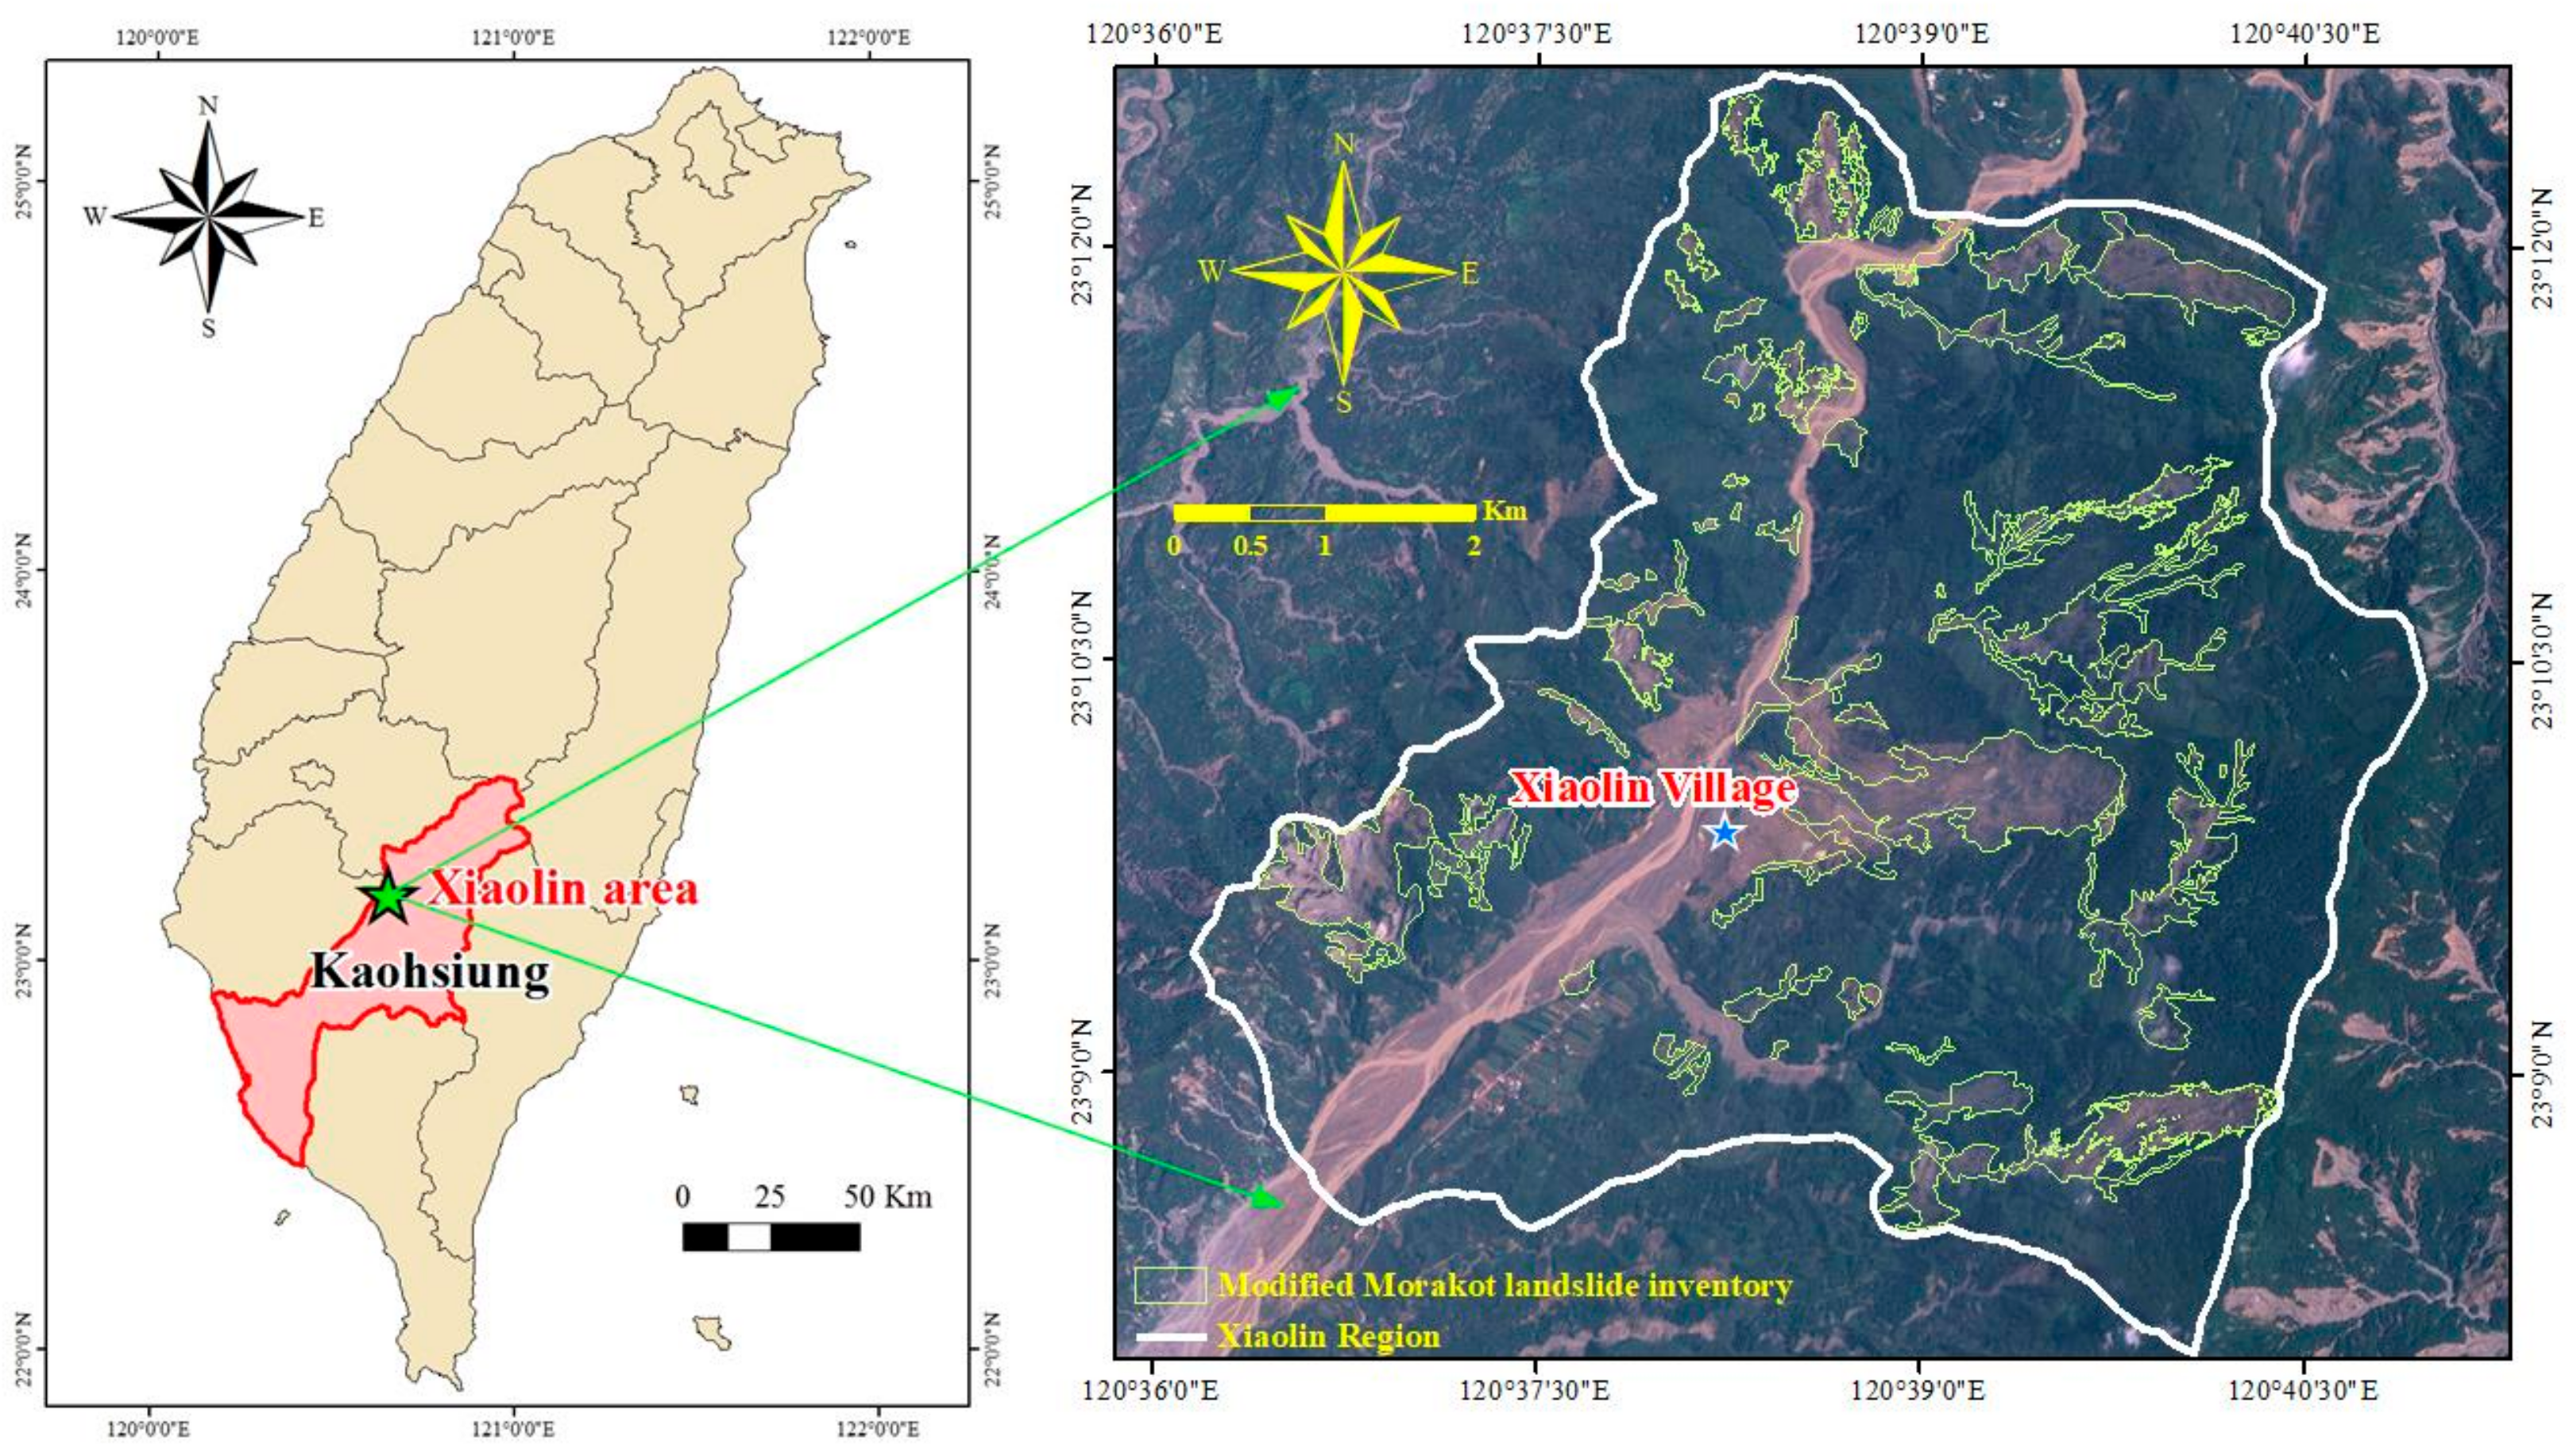
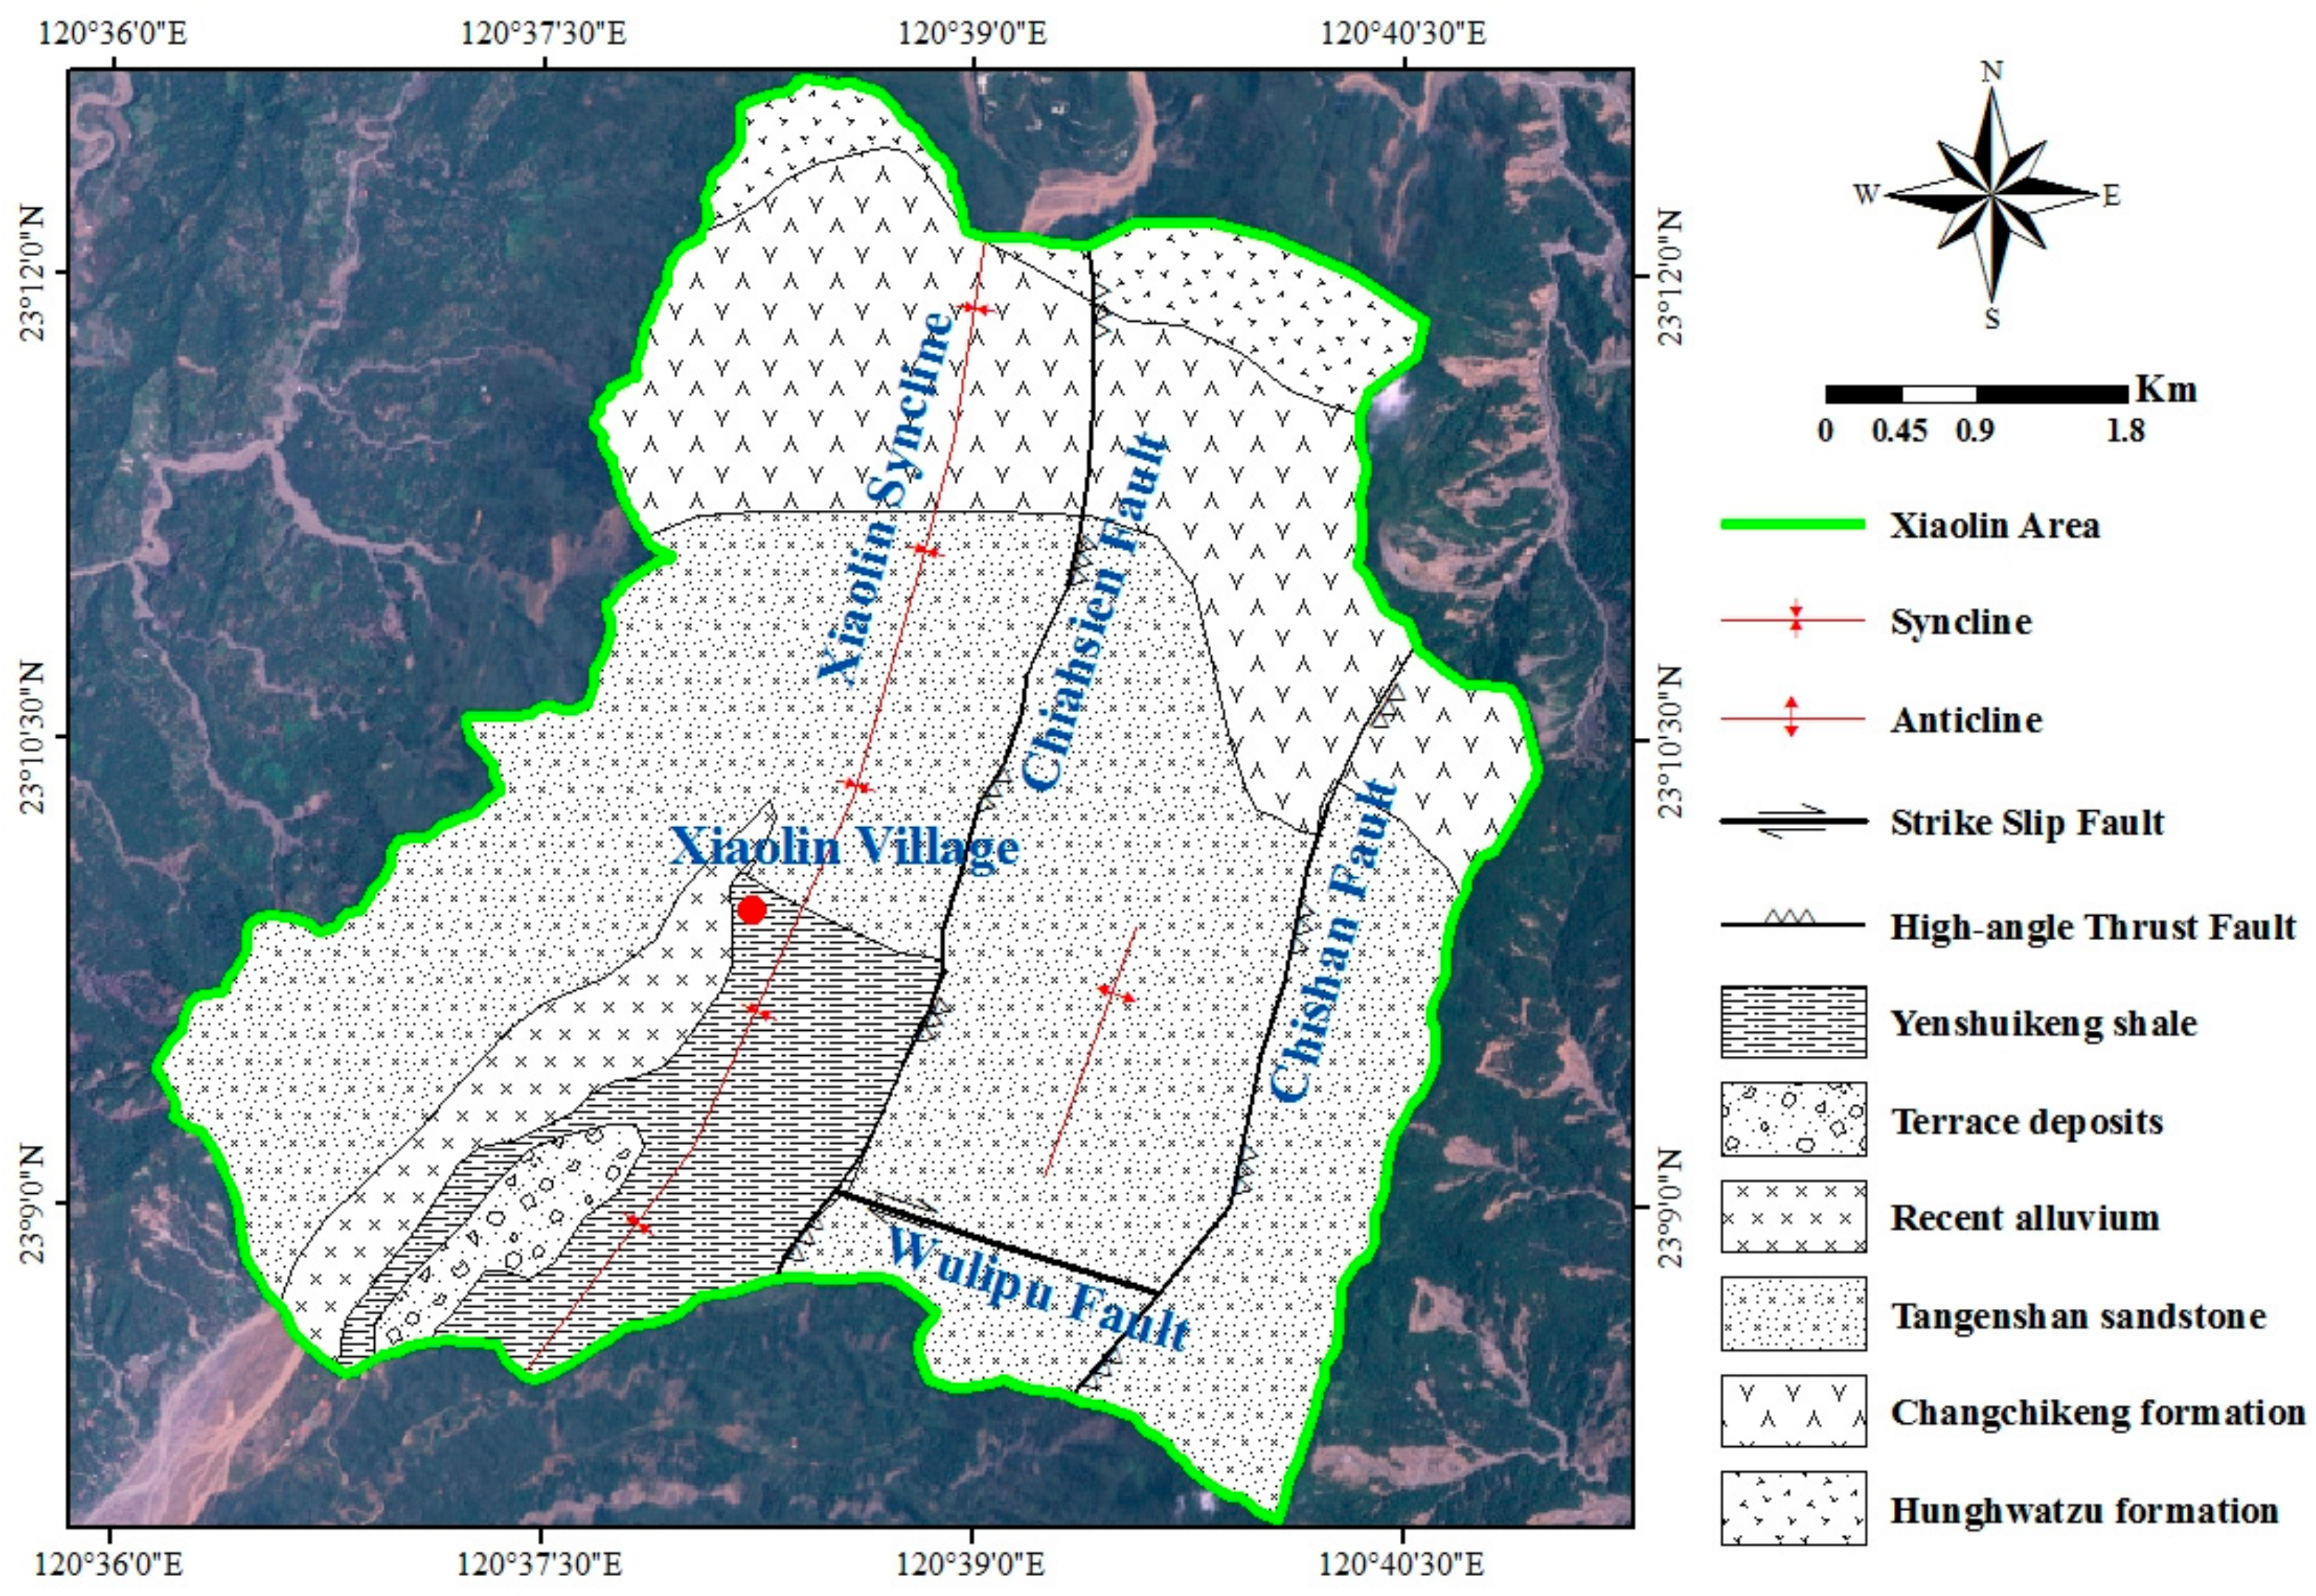
Xiaolin is located in the Jiasian District, Kaohsiung City, southern Taiwan (Figure 3). The area belongs to the Western Foothills geological zone, and the regional geology is rather complex. The geological formations, as shown in Figure 4, include the Hunghwatzu formation (thick-bedded siltstone and alternating thick siltstone and sandstone), Yenshuikeng shale (massive shale), Tangenshan sandstone (thick-bedded sandstone and muddy sandstone), the Changchikeng formation (alternation of sandstone and shale), terrace deposits, and recent alluvium. The thickness of overburden was about 0.3–1.8 m [29]. The types of soil properties were silt, sand, and clay with rock debris [29].
The Xiaolin syncline passes the high river terrace east of Xiaolin village. The strike of the fold axis runs north-northeast to south-southwest (NNE–SSW), and the dip runs toward the south, where part of the area is dip slope. The Chiahsien fault passes through the east side of the syncline at a distance of about 800–900 m. Two kilometers eastward, another major fault, the Chishan, passes through the area. The Xiaolin area has many fractured zones as a result of these various geological structures (e.g., the syncline and the faults). During 7–10 August 2009, Typhoon Morakot attacked in Taiwan. The extreme duration and intensity of the rainfall caused many landslides in the mountainous area near the village of Xiaolin. Ultimately, the village was completely destroyed and buried by debris from a deep-seated landslide, resulting in the loss of 500 lives.
The modified inventory of Morakot-induced landslides (Figure 3) was calibrated by Deng et al. [30] using a semi-automatic method and visual interpretation. The magnitude characteristics of the landslide distribution is shown in Table 2 and briefly described as below. Total landslide area was 623.9 ha, comprising 144 separate landslides. The separate landslides contained 16 large-scale slides and 128 small-scale slides. The large-scale slides contributed 57.3% of the total landslide area. The small-scale slides occupied 42.7% of the total landslide area [30]. Most landslides occurred on slopes of 20–40° [30]. The geological characteristic of landslides mainly distributed in Tangenshan sandstone and Changchikeng formation [30]. Factors related to stream systems had the strongest influence on the landslides. Most landslides of the Xiaolin area were belong to shallow debris slide [29]. The detailed investigation of Xiaolin village main landslide was performed by Lee et al. [31]. The sliding source area of the Xiaolin village landslide was 57 ha. The landslide was classified into the deep-seated landslides class due to its average sliding thickness was 40 m. The slide volume was approximately 2.39 × 10⁷ m3, and its material was composed of Tangenshan sandstone, Yenshuikeng shale, and colluvium. Of course, this deep-seated landslide is not suitable to the infinite slope stability model. However, this area can also be predicted by TRIGRS model with 61.5% success rate of slide area.
In the present study, we used the rainfall-induced landslide event in the Xiaolin area to test the system (Figure 3). Total study area was 4005 ha. This system testing was intended to simulate and display real-time regional slope stability in the Xiaolin area during Typhoon Morakot. The results of the testing are discussed below.
3.2. Real-Time Rainfall Setting
The real-time rainfall data used for the system testing was the hourly rainfall history of Typhoon Morakot from 00:00 on 7 August to 00:00 on 10 August. In order to produce real-time regional rainfall layers, we collected the spatial information for and rainfall history data from a total of 58 rainfall stations in the Gaoping River basin, in which the Xiaolin area is situated. The data collected were input into the MySQL real-time rainfall database in advance of the system testing. The real-time rainfall data retrieving system would then connected to the MySQL database to extract the specific rainfall data to produce the regional rainfall layers that would support the real-time landslide-susceptibility analysis conducted during Typhoon Morakot.
3.3. Required Parameter Layers for TRIGRS
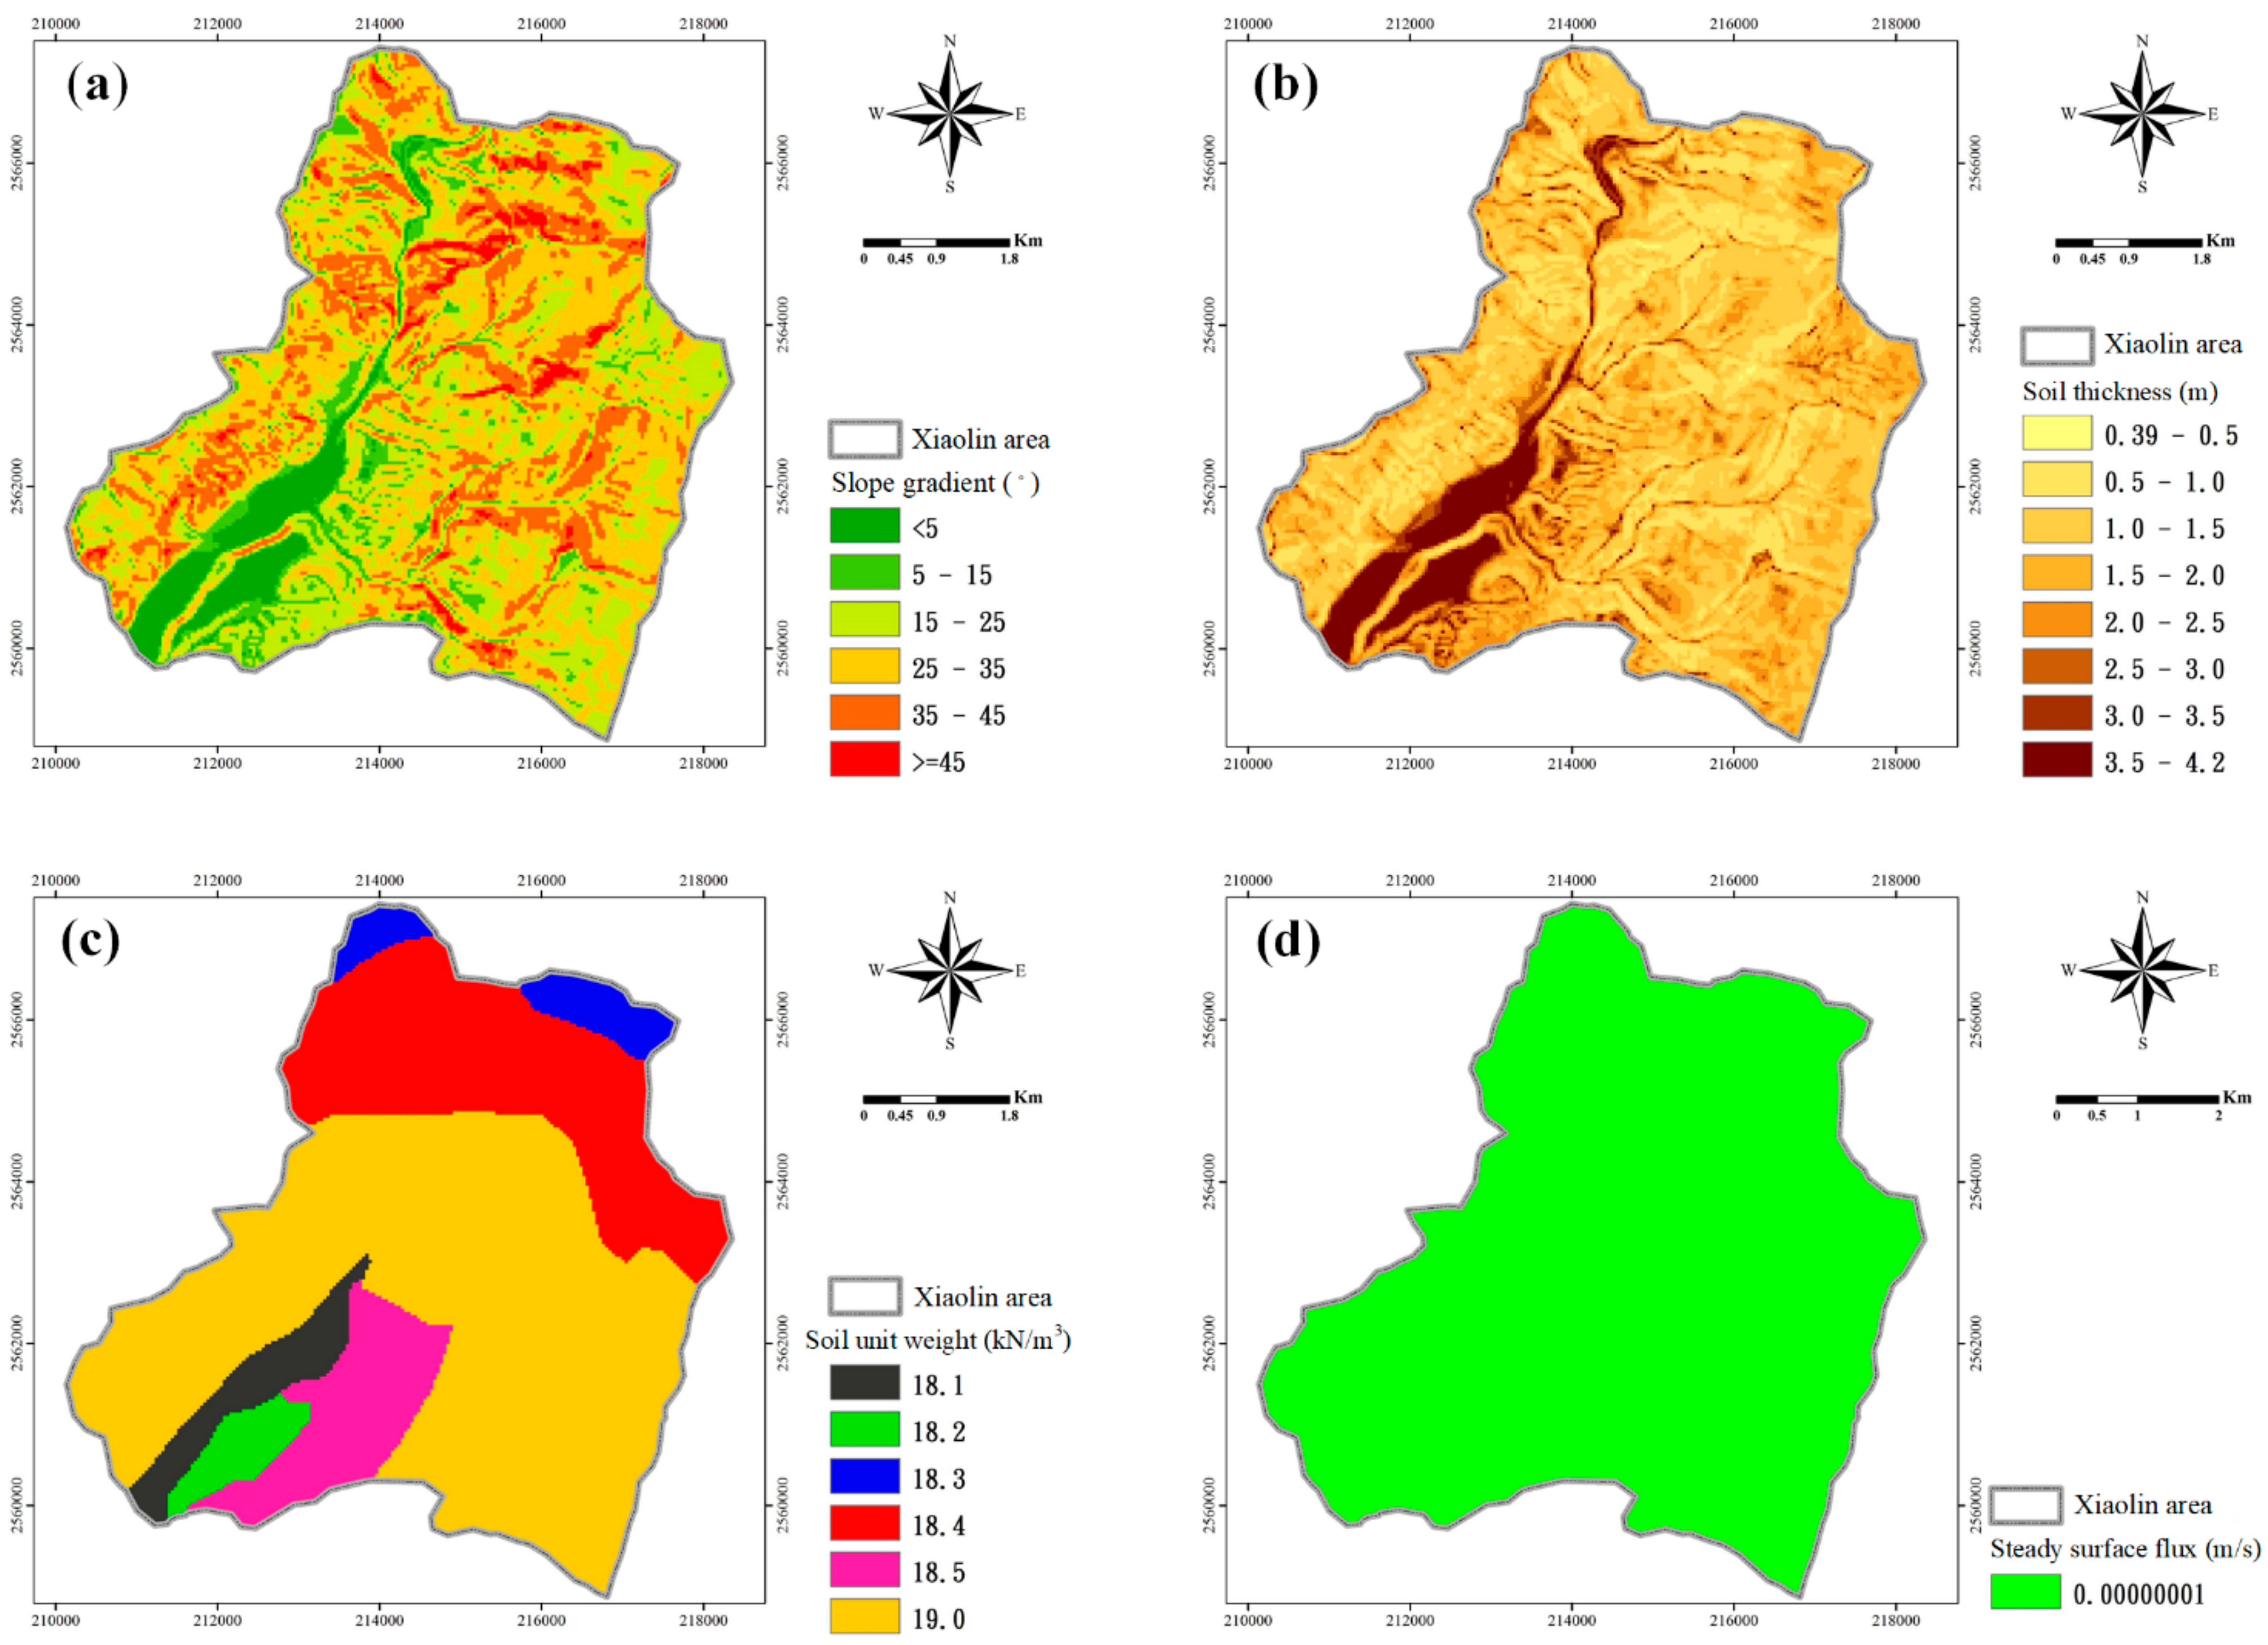
The regional parameter layers that had to be set manually before executing the real-time landslide-susceptibility analysis were the slope gradient , the saturated soil unit weight , the depth of the impermeable basal boundary , the depth of the initial ground water table , the saturated hydraulic conductivity , the saturated hydraulic diffusivity , the soil cohesion for effective stress , the soil friction angle for effective stress , and the steady (initial) surface flux . The slope gradient layer was calculated using the actual elevation of the Xiaolin area in ArcGIS (Figure 5a). The depth of the impermeable basal boundary was the same as the soil thickness. The soil thickness for each grid cell with the size of 40 m × 40 m was evaluated using an empirical formula based on a soil-thickness survey of the Gaoping River basin by Tang et al. [16], as shown in Equation (11). The evaluated soil thickness values were based on the actual slope gradient for each grid cell (Figure 5b). The initial groundwater level was set at the soil–rock interface, with the same distribution as for (Figure 5b). The saturated soil unit weight layer is shown in Figure 5c. The layer was set as 10−8 m/s to reduce the feasible optimal solution region (Figure 5d).
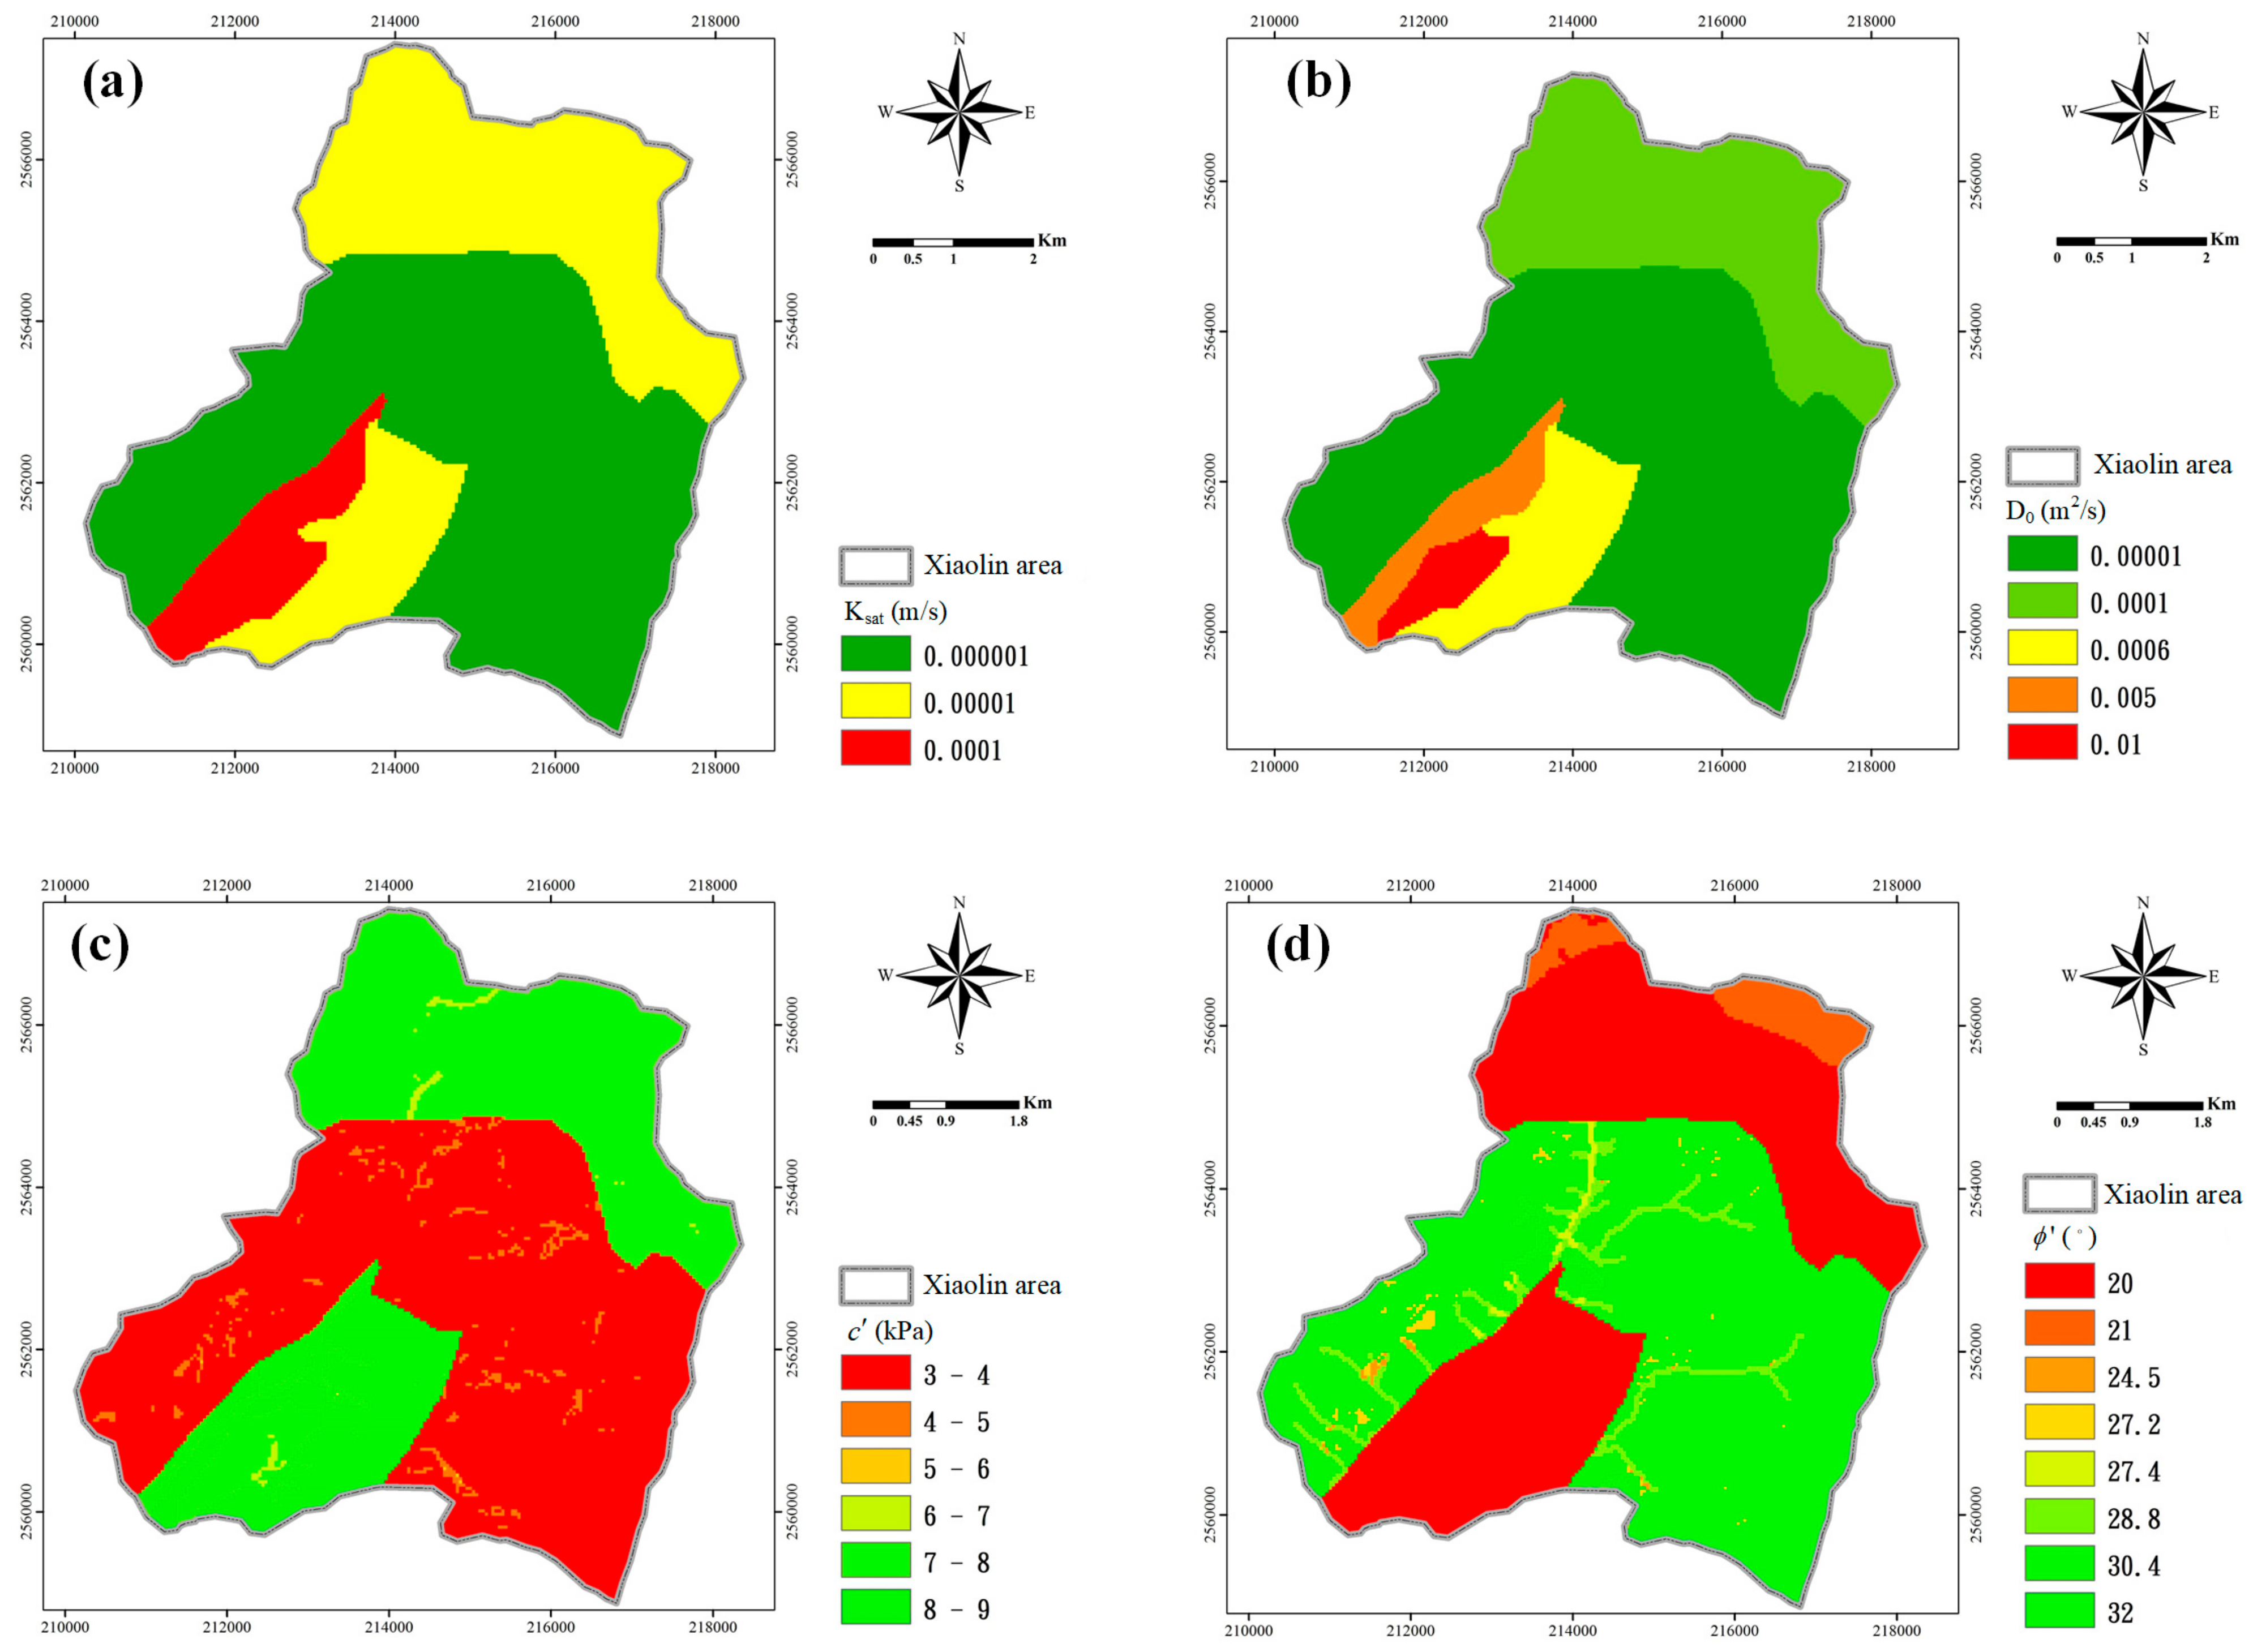
The hydrogeological parameters , , , and were set using the calibrated results from the reverse-optimization analysis in TRISHAL (Figure 6). The landslide event used to calibrate the parameters was Typhoon Toraji. In the evaluation of the calibrated performance, the was 64.4%. The was 80.7% and the AUC was 0.78.
The hydrogeological measured parameters of shallow materials in the study area based on Sinotech Engineering Consultants, Inc. (Taipei, Taiwan) [29], Wu et al. [32] and Chen [33] are shown in Table 3. The calibrated parameters by optimization are also listed in Table 3 in comparison to the test values. It was found the unit weight of calibrated values in general less than, but close to the test values. Although the calibrated soil cohesions in Tangenshan sandstone and Hunghwatzu formation are higher than the measured values, however, the calibrated friction angles are lower than the measured values in general. Since both cohesion and friction angle contribute to the shear strength of soils; thus, the calibrated shear strengths will not differ from the test values much. The measured saturated hydraulic conductivities from tests are very scattered. The calibrated values are in between the range of the measures values. There are no test values of saturated hydraulic diffusivity and initial steady surface flux in the study area. Only the estimated parameters are reported by Sinotech Engineering Consultants, Inc. [29]. The calibrated and are larger than the above estimated values in general. The authors have tried to use the measured and estimated parameters from above literatures to perform forward predictions. However, the results were not acceptable. The results indicated that the calibrated parameters could then be applied preliminarily in the system testing.
3.4. Real-Time Landslide Nowcasting in the Xiaolin Area
The Morakot-induced landslide event in the Xiaolin area was used to test the system for real-time nowcasting of regional landslide susceptibility. The system timers were activated to automatically run the real-time landslide warning procedure hour by hour. The total time of the analysis under Typhoon Morakot was 72 h, from 00:00 on 7 August to 00:00 on 10 August. The regional rainfall layers in ASCII file format were produced using the real-time rainfall data retrieving system. The real-time safety factor maps were produced using the real-time landslide-susceptibility analysis function using the TRIGRS with finite boundary condition in the TRISHAL program, after confirming the existence of the regional rainfall layer at each specific time and of the required layers for the TRIGRS program. Finally, the FS maps were displayed in the ArcMap window, using the real-time display system, to show the dynamic regional slope stability of the Xiaolin area during Typhoon Morakot. Simultaneously, the hourly and cumulative rainfall history at the rainfall station concerned, along with the maximum cumulative rainfall at the time of display, was shown in the interface of the TRISHAL program. For each new hourly rainfall data, the execution time of the nowcasting scheme in Figure 1 was about 2 min in average for the study area.
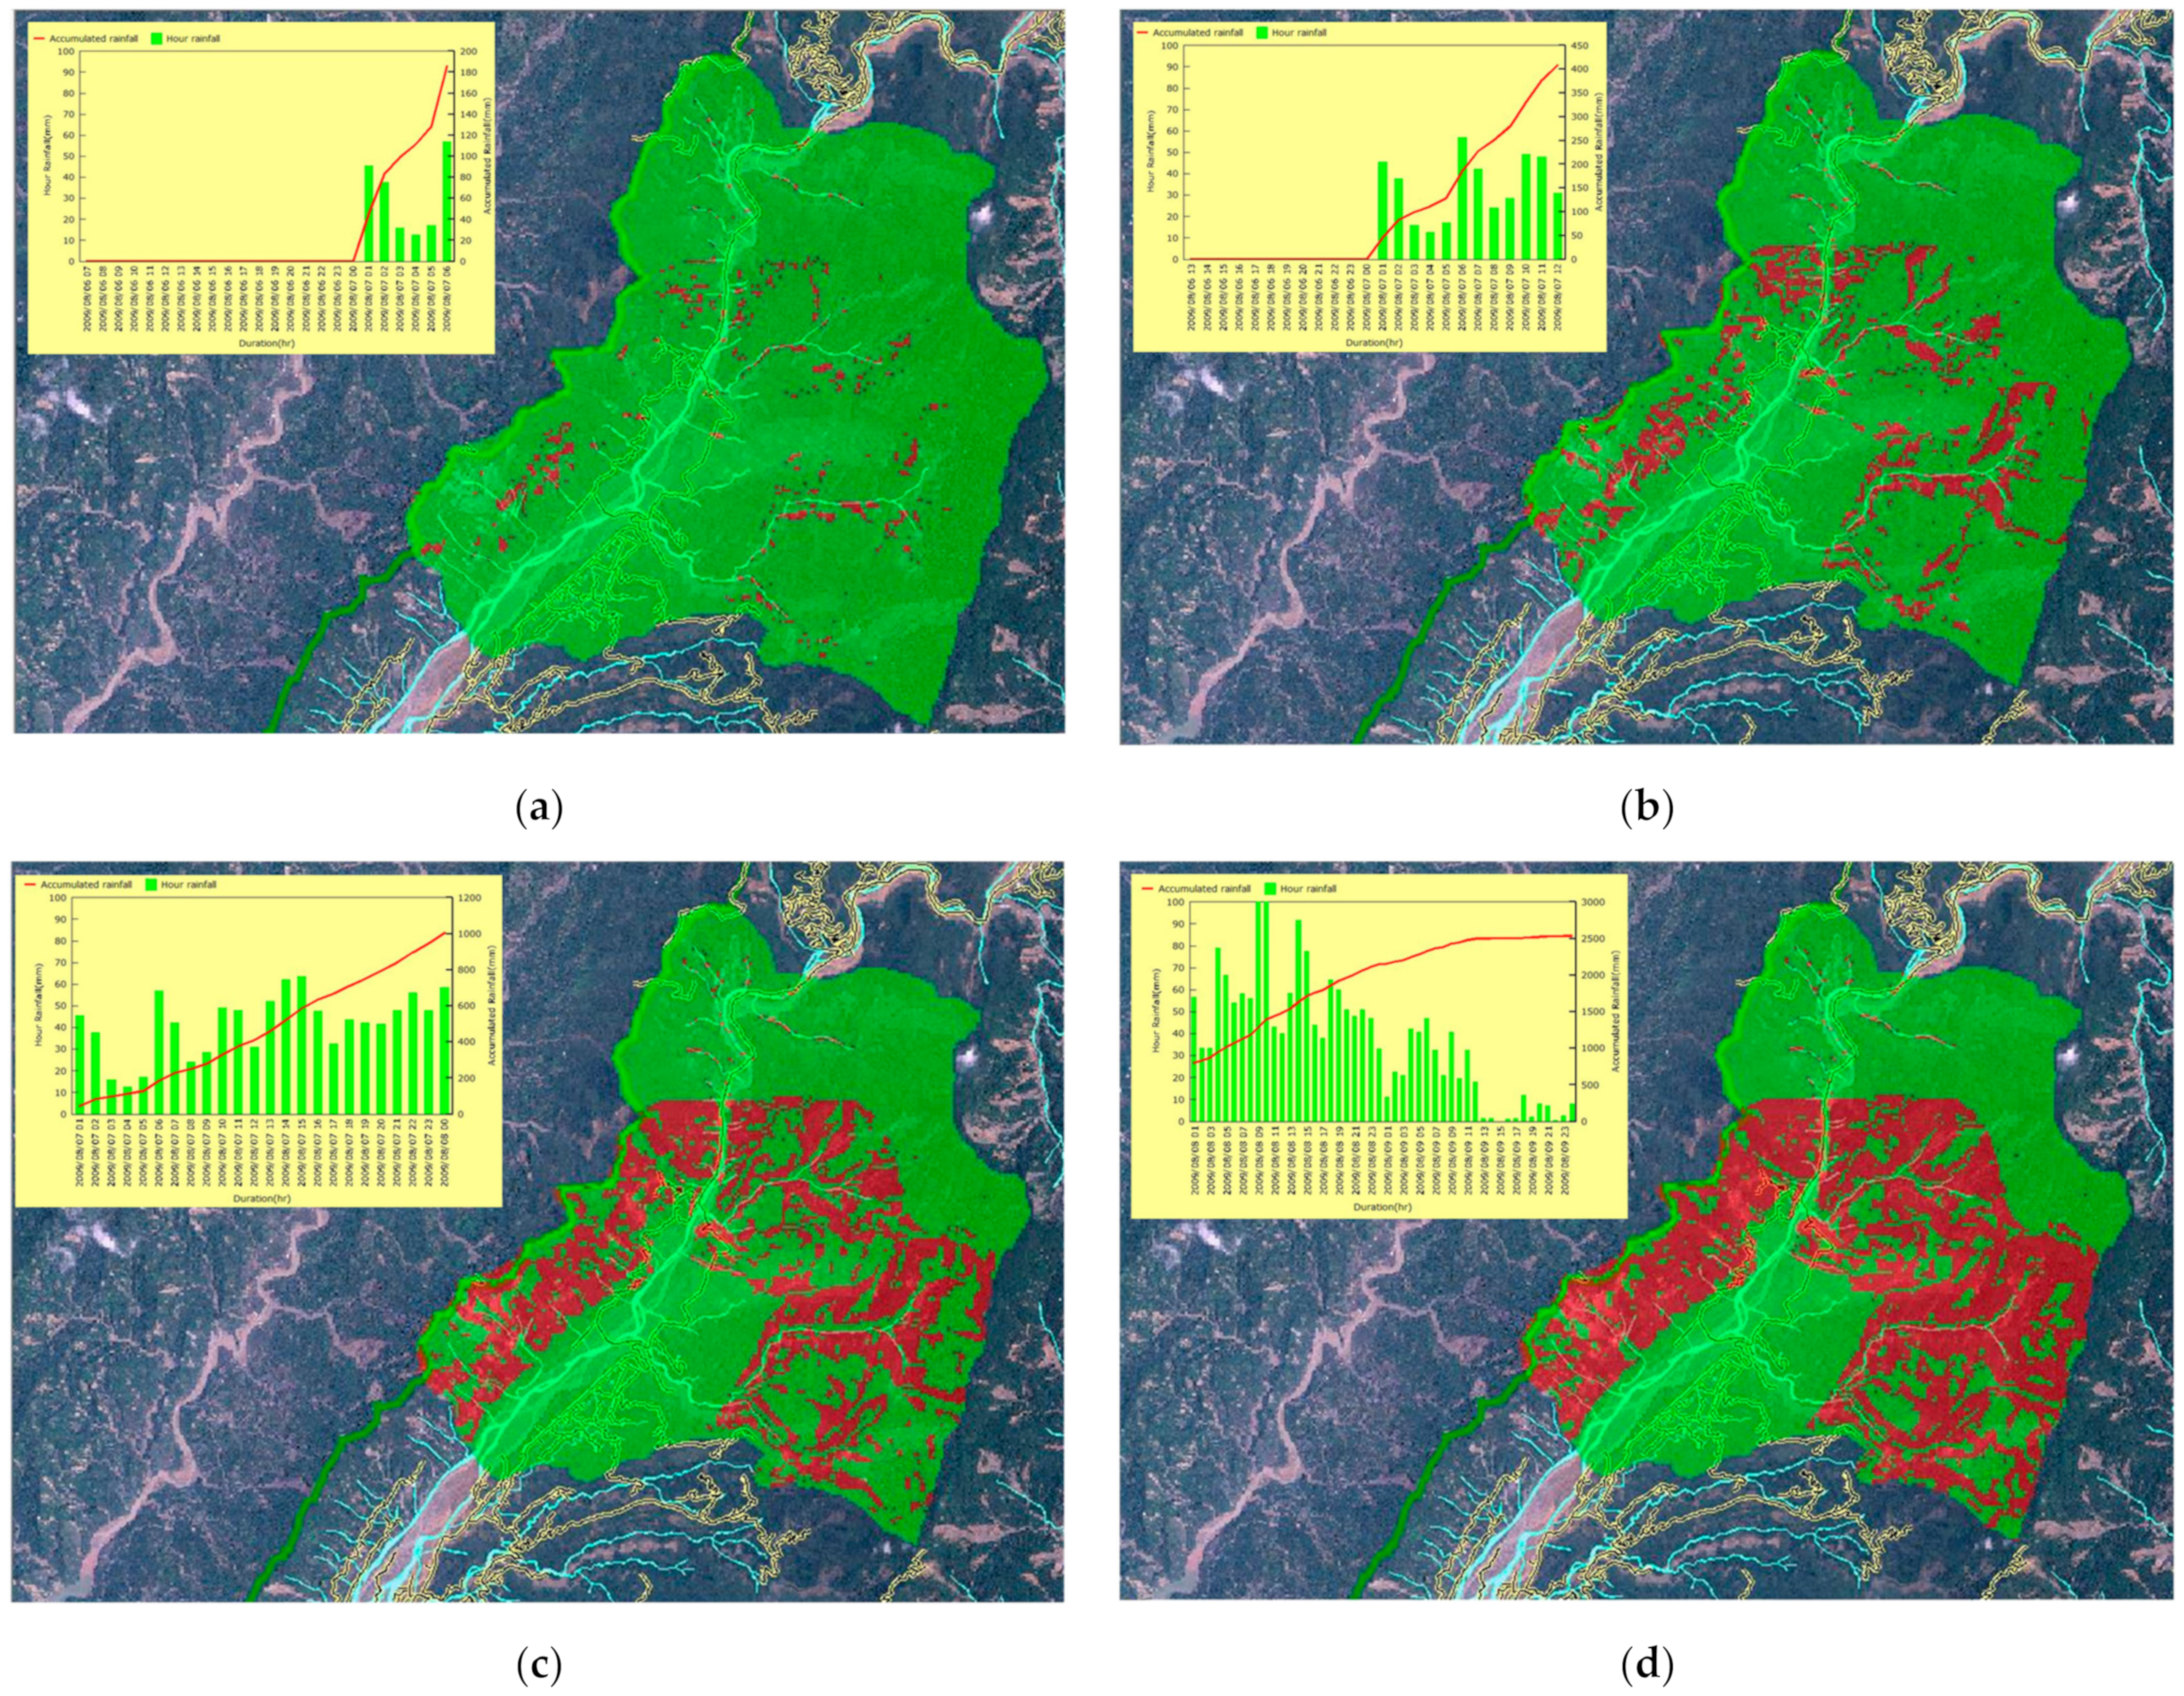
The system-testing results obtained from the real-time nowcasting system for landslide susceptibility in the Xiaolin area during Typhoon Morakot are shown in Figure 7. The figure simultaneously shows the hourly rainfall history, the cumulative rainfall history and the landslide-susceptibility maps. Areas shaded green in the maps have FS ≥ 1, i.e., they are stable, and those shaded red have FS < 1, i.e., they are unstable. At 01:00 on 7 August, during the initial stages of Typhoon Morakot, the slopes are still stable. By 06:00 on 7 August, failure-risk grid cells are beginning to appear over the whole area, including the main area of collapse around Xiaolin Village (Figure 7a). At this time, the station with the most cumulative rainfall is Shangdewun, with a cumulative rainfall of 185.5 mm and a maximum hourly rainfall of 57 mm. As the duration of the rainfall event increases, the number of grid cells with a risk of landslides increases (Figure 7b). By 00:00 on 8 August, there is a large number of unstable grid cells in the area of collapse around Xiaolin Village (Figure 7c). Again, the station with the most cumulative rainfall is Shangdewun, with a cumulative rainfall of 1003 mm and a maximum hourly rainfall of 63.5 mm. By 12:00 on 8 August, the distribution of the grid cells with a risk of failure is approaching the final result. The unstable grid cells in the main area of collapse around the Xiaolin Village are distributed in the source and flow areas, not in the deposition area. The station with the most cumulative rainfall is once again Shangdewun, with a cumulative rainfall of 1576 mm and a maximum hourly rainfall of 80 mm. The final map of landslide susceptibility, for 00:00 on 10 August, is shown in Figure 7d. At this stage, the station with the most cumulative rainfall is Weiliaoshan, with a cumulative rainfall of 2540 mm and a maximum hourly rainfall of 117 mm.
These system-testing results demonstrate the practical feasibility of the real-time landslide-nowcasting system developed in this study. This system could thus be used in the further development of practical disaster prevention and mitigation systems.
4. Discussion
The real-time nowcasting system for regional landslide-hazard assessment was initially integrated, and our system testing showed its performance to be feasible. The limitations and suggestions for improvement of the system are discussed here. The real-time rainfall data source for the landslide-susceptibility analysis was the current hourly rainfall observations of the rainfall stations, with the data extracted from the public CWB website. Since time is of the essence in disaster-prevention and -mitigation decision-making, we focused on improving the timeliness of the results in our system optimization, to ensure the practical applicability of the system. The use of radar-based rainfall data and rainfall-forecast data from relevant government agencies could increase the buffer time and enhance the system’s early-warning capabilities. The setting of rainfall parameters could be directly interfaced with the standard regional rainfall raster layers provided by the government, which could reduce the uncertainty and increase the reliability of the landslide-susceptibility warning results.
The landslide prediction was more accurate where conditions favored planar failure, due to the assumptions of the TRIGRS model. The rising of the water table and the lateral flow conditions were not considered in the model. It was difficult to get the ideal concept of the theoretical model to agree with the actual slope data, due to the high level of uncertainty regarding slopes in the area. The resolution of the landslide-susceptibility maps produced by the system was therefore low. This resolution could be useful for disaster-prevention and -mitigation planning, but would not be useful for engineering design.
This research selected the area around Xiaolin Village as the study area has four following reasons. (a) The area suffered most serious landslide events. It is possible to collect more extensive and detailed investigation reports around the area. (b) This study used google earth and satellite image to carefully check and delineate the correct landslide area manually (not include transport and deposit region). It needs about one month to finish the work for this area. (c) If the study area is too large, more computer resources were needed. It may be unaffordable for us. (d) This study is just a beginning to demonstrate such a unique landslide warning system is workable or not.
Regional landslide stability model cannot analyze the deep-seated landslide neighboring Xiaolin Village. Since the deep-seated landslide is a kind of site-specific problem, its prediction requires more detailed parameters and data which are unable to obtain in regional analysis. However, in general conditions, the infinite slope analysis model used in TRIGRS computes lower factors of safety than more rigorous methods of stability in areas where failure surfaces tend to be non-planar [14,18]. This means the infinite slope analysis model is conservative when apply to the cases of deep-seated landslide.
The hydrogeological parameters used in the system testing were well calibrated. The system’s performance was evaluated by comparing the predicted landslide susceptibility in Figure 7d with the actual inventory of Morakot-induced landslides. The was 48.5%, the was 60%, and the AUC index was 0.59. In this study, the parameters of such large regional area were calibrated by one antecedent rainfall event only. The training is not enough. Therefore, it is difficult to obtain very good match to the landslide results of next rainfall event. Although the calculation model cannot be used to predict deep-seated landslide. It also can predict 61.5% failure ratio of Xiaolin deep landslide area. Moreover, the failure grid cells covered 80% of the grid cells in which actual landslides occurred. Although the performance of the calibrated hydrogeological parameters was only potentially acceptable for application in the nowcasting system, the accuracy of these parameters, which were produced by the reverse-optimization analysis, could be further improved by more training events and more proper geotechnical characterization of overburdens of different lithologies in future research.
This research has provided the concepts for developing the system and the results of the system testing, and it confirms the feasibility of a real-time regional landslide-susceptibility warning system. For practical application in disaster prevention, it is necessary for the system to operate stably over long periods. This is closely linked to the robustness of the system operating environment, the development software, and system maintenance. Potential upgrades of the system would improve the integration interface and the system’s operating environment to provide stability in the analysis of real-time landslide susceptibility for decision-making in disaster-mitigation contexts.
The system used safety-factor maps based on regional slopes to predict landslide susceptibility. This was a preliminary demonstration of the practical application and use of the system in disaster-prevention planning. The display maps produced by the system could be overlapped with maps of settlements and traffic hubs to provide warning information concerning the safety of communities and road traffic to the relevant authorities. An advanced application of the system could be to contribute to the establishment of practical landslide-disaster warning criteria and protection strategies.
5. Conclusions
In this study, we have successfully integrated a real-time rainfall data retrieving system, a landslide-susceptibility analysis program (TRISHAL), and a real-time landslide-potential display system to establish an automated real-time regional landslide-nowcasting system. This system could be used to observe the changing stability of regional slopes under extreme rainfall for the purposes of disaster prevention and mitigation.
The reverse-optimization analysis function was integrated into the RGA of the optimization techniques and the improved TRIGRS model to calibrate the regional hydrogeological parameters. The calibrated parameters could then be used in the real-time landslide-susceptibility analysis because they considered the physical mechanisms of landslides and the actual landslide inventory.
The calculation speed of the real-time landslide-susceptibility analysis was upgraded by improving the program structure of the TRIGRS model and introducing the technique of parallel computing. This improvement could be used to enhance the timeliness of disaster-prevention measures and the analysis of big data in future research.
Author Contributions
Conceptualization, Y.-C.D. and J.-H.H.; methodology, Y.-C.D. and J.-H.H.; software, Y.-C.D., J.-H.H. and Y.-D.L.; validation, Y.-C.D.; formal analysis, Y.-C.D.; investigation, Y.-C.D. and J.-H.H.; data curation, Y.-C.D.; writing—original draft preparation, Y.-C.D.; writing—review and editing, Y.-C.D. and J.-H.H. All authors have read and agreed to the published version of the manuscript.
Funding
This research was funded by “Aim for Top University Project” in National Central University from Ministry of Education in Taiwan.
Data Availability Statement
Available on request from corresponding author.
Acknowledgments
The authors sincerely thank SINOTECH Engineering Consultants, Taiwan, and the Center for Space and Remote Sensing Research, National Central University, Taiwan, for providing the technical support and the digital geological and geotechnical information. We would like to thank National Center for Research on Earthquake Engineering for the finance support of editing and publishing this paper, and Uni-edit for editing and proofreading this manuscript. We appreciate four anonymous reviewers and academic editors on prior versions of this paper.
Conflicts of Interest
The authors declare no conflict of interest.
References
- Baum, R.L.; Godt, J.W. Early warning of rainfall-induced shallow landslides and debris flows in the USA. Landslides 2009, 7, 259–272. [Google Scholar] [CrossRef]
- Keefer, D.K.; Wilson, R.C.; Mark, R.K.; Brabb, E.E.; Brown, W.M.; Ellen, S.D.; Harp, E.L.; Wieczorek, G.F.; Alger, C.S.; Zatkin, R.S. Real-Time Landslide Warning During Heavy Rainfall. Science 1987, 238, 921–925. [Google Scholar] [CrossRef]
- Hoffmeister, R.J.; Miller, D.J.; Mills, K.A.; Hinkle, J.C.; Beier, A.E. GIS Overview Map of Potential Rapidly Moving Landslide Hazards in Western Oregon; Interpretive Map Series IMS-22; Oregon Department of Geology and Mineral Industries: Portland, OR, USA, 2002. [Google Scholar]
- A NOAA–USGS Demonstration Flash-Flood and Debris-Flow Early-Warning System. Available online: https://pubs.usgs.gov/fs/2005/3104/pdf/FS-2005-3104.pdf (accessed on 30 October 2020).
- Radbruch-Hall, D.H.; Colton, R.B.; Davies, W.E.; Lucchitta, I.; Skipp, B.A.; Varnes, D.J. Landslide Overview Map of the Conterminous United States; Professional Paper 1183; U.S. Geological Survey: Reston, VA, USA, 1982. [Google Scholar]
- Chleborad, A.F.; Baum, R.L.; Godt, J.W.; Powers, P.S. A prototype system for forecasting landslides in the Seattle, Washington, area. In Landslides and Engineering Geology of the Seattle, Washington, Area; Baum, R.L., Godt, J.W., Highland, L., Eds.; Geological Society of America: Boulder, CO, USA, 2008; pp. 103–120. [Google Scholar]
- Harp, E.L.; Michael, J.A.; Laprade, W.T. Shallow landslide hazard map of Seattle, Washington; In Engineering geology and landslides of the Seattle, Washington, area. In Geological Society of America Reviews in Engineering Geology; Baum, R.L., Godt, J.W., Highland, L.M., Eds.; Geological Society of America: Boulder, CO, USA, 2008; pp. 67–82. [Google Scholar]
- Segoni, S.; Leoni, L.; Benedetti, A.I.; Catani, F.; Righini, G.; Falorni, G.; Gabellani, S.; Rudari, R.; Silvestro, F.; Rebora, N. Towards a definition of a real-time forecasting network for rainfall induced shallow landslides. Nat. Hazards Earth Syst. Sci. 2009, 9, 2119–2133. [Google Scholar] [CrossRef] [Green Version]
- Montrasio, L.; Valentino, R.; Losi, G.L. Towards a real-time susceptibility assessment of rainfall-induced shallow landslides on a regional scale. Nat. Hazards Earth Syst. Sci. 2011, 11, 1927–1947. [Google Scholar] [CrossRef] [Green Version]
- Federici, B.; Bovolenta, R.; Passalacqua, R. From rainfall to slope instability: An automatic GIS procedure for susceptibility analyses over wide areas. Geomat. Nat. Hazards Risk 2014, 6, 454–472. [Google Scholar] [CrossRef]
- Wong, A.C.W.; Ting, S.M.; Shiu, Y.K.; Ho, K.K.S. Latest Developments of Hong Kong’s Landslip Warning System. In Proceedings of the Landslide Science for a Safer Geoenvironment; Springer: Berlin, Germany, 2014; pp. 613–618. [Google Scholar]
- Yu, Y.F.; Lam, J.S.; Siu, C.K. Interim Report on Review of Landslip Warning Criteria 2003 (Special Project Report SPR 4/2003); Geotechnical Engineering Office: Hong Kong, China, 2003. [Google Scholar]
- Chen, Y.-L.; Chen, D.-H.; Li, Z.-C.; Huang, J.-B. Preliminary studies on the dynamic prediction method of rainfall-triggered landslide. J. Mt. Sci. 2016, 13, 1735–1745. [Google Scholar] [CrossRef]
- Baum, R.L.; Savage, W.Z.; Godt, J.W. TRIGRS—A Fortran Program for Transient Rainfall Infiltration and Grid-Based Regional Slope-Stability Analysis; Professional Paper 1183; U.S. Geological Survey: Reston, VA, USA, 2002. [Google Scholar]
- Lin, Y.H.; Cheng, C.T.; Wei, L.W.; Lin, H.H.; Chi, C.C.; Yang, B. Preliminary development of early warning system for rainfall-induced landslide hazard on Web-GIS. In Proceedings of the TGIS, Taichung, Taiwan, 20 June 2012; pp. 27–28. [Google Scholar]
- Tang, C.H.; Lyu, Y.D.; Chi, S.Y.; Fei, L.Y. Regional landslide potential analysis using a deterministic dynamic model integrated with optimization techniques. Sino-Geotechnics 2011, 129, 63–74. [Google Scholar]
- Chien, L.-K.; Hsu, C.-F.; Yin, L.-C. Warning Model for Shallow Landslides Induced by Extreme Rainfall. Water 2015, 7, 4362–4384. [Google Scholar] [CrossRef] [Green Version]
- Baum, R.L.; Savage, W.Z.; Godt, J.W. TRIGRS—A Fortran Program for Transient Rainfall Infiltration and Grid-Based Regional Slope-Stability Analysis, Version 2.0; US Geological Survey: Reston, VA, USA, 2008. [Google Scholar]
- Tofani, V.; Bicocchi, G.; Rossi, G.; Segoni, S.; D’Ambrosio, M.; Casagli, N.; Catani, F. Soil characterization for shallow landslides modeling: A case study in the Northern Apennines (Central Italy). Landslides 2017, 14, 755–770. [Google Scholar] [CrossRef] [Green Version]
- Han, T.H.; Liu, L.; Li, G. The influence of horizontal variability of hydraulic conductivity on slope stability under heavy rainfall. Water 2020, 12, 2567. [Google Scholar] [CrossRef]
- Park, H.J.; Lee, J.H.; Woo, I. Assessment of rainfall-induced shallow landslide susceptibility using a GIS-based probabilistic approach. Eng. Geol. 2013, 161, 1–15. [Google Scholar] [CrossRef]
- Lee, M.H. A Rainfall-Based Debris-Flow Warning Analysis and Its Application. Ph.D. Thesis, National Chung Hsing University, Taichung, Taiwan, September 2006. [Google Scholar]
- Iverson, R.M. Landslide triggering by rain infiltration. Water Resour. Res. 2000, 36, 1897–1910. [Google Scholar] [CrossRef] [Green Version]
- Deng, Y.C.; Hwang, J.H. Analytical solutions of one dimensional rainfall infiltration for slope stability—Discussions on TRIGRS programs. Sino-Geotechnology 2019, 160, 71–80. [Google Scholar]
- Deng, Y.C. Development of a Real-Time Forecasting System for Regional Landslide Hazard Assessment under Extreme Rainfall Events. Ph.D. Thesis, National Central University, Zhongli, Taiwan, 26 January 2018. [Google Scholar]
- Holland, J.H. Outline for a Logical Theory of Adaptive Systems. J. ACM 1962, 9, 297–314. [Google Scholar] [CrossRef]
- Stehman, S.V. Selecting and interpreting measures of thematic classification accuracy. Remote Sens. Environ. 1997, 62, 77–89. [Google Scholar] [CrossRef]
- Chung, C.-J.F.; Fabbri, A.G. Validation of Spatial Prediction Models for Landslide Hazard Mapping. Nat. Hazards 2003, 30, 451–472. [Google Scholar] [CrossRef]
- Sinotech Engineering Consultants, Inc. Geological Survey and Database for Upstream Watersheds of Flood-Prone Areas (Phase 2, 2009)—Effect of Hydrogeology on Slope Stability (2/3) Result Report; S.E.C., Inc.: Taipei, Taiwan, 2009. [Google Scholar]
- Deng, Y.C.; Tsai, F.; Hwang, J.H. Landslide characteristics in the area of Xiaolin Village during Morakot typhoon. Arab. J. Geosci. 2016, 9, 1–16. [Google Scholar] [CrossRef]
- Lee, C.T.; Dong, J.J.; Lin, M.L. Geological investigation on the catastrophic landslide in Siaolin Village, southern Taiwan. Sino-Geotechnology 2009, 122, 87–94. [Google Scholar]
- Wu, J.-H.; Chen, J.-H.; Lu, C.-W. Investigation of the Hsien-du-Shan rock avalanche caused by typhoon Morakot in 2009 at Kaohsiung county, Taiwan. Int. J. Rock Mech. Min. Sci. 2013, 60, 148–159. [Google Scholar] [CrossRef]
- Chen, J.H. The Characteristics of Geological Structures and Material Properties of Hsien-Du-Shan Rock Avalanche at Hsiaolin, Chiahsien, Kaohsiung. Master’s Thesis, The National Cheng Kung University, Tainan, Taiwan, August 2011. [Google Scholar]
Figure 1.
The configuration of the real-time nowcasting system for regional landslide events.

Figure 2.
Schematic diagram of the rainfall-event definition used in the system.

Figure 3.
Typhoon Morakot landslide inventory for the Xiaolin area.

Figure 4.
Geological map of the Xiaolin area.

Figure 5.
Required fundamental parameter layers for the Transient Rainfall Infiltration and Grid-based Regional Slope-Stability (TRIGRS) model: (a) Slope gradient; (b) Soil thickness; (c) Saturated soil unit weight; (d) Initial steady surface flux.
Figure 5.
Required fundamental parameter layers for the Transient Rainfall Infiltration and Grid-based Regional Slope-Stability (TRIGRS) model: (a) Slope gradient; (b) Soil thickness; (c) Saturated soil unit weight; (d) Initial steady surface flux.

Figure 6.
The calibrated parameter layers produced by the optimization reverse analysis: (a) Saturated hydraulic conductivity; (b) Saturated hydraulic diffusivity; (c) Soil cohesion for effective stress; (d) Soil friction angle for effective stress.
Figure 6.
The calibrated parameter layers produced by the optimization reverse analysis: (a) Saturated hydraulic conductivity; (b) Saturated hydraulic diffusivity; (c) Soil cohesion for effective stress; (d) Soil friction angle for effective stress.

Figure 7.
The real-time regional landslide-susceptibility display during Typhoon Morakot. (a) 06:00 on 7 August 2009. (b) 12:00 on 7 August 2009. (c) 00:00 on 8 August 2009. (d) 00:00 on 10 August 2009.
Figure 7.
The real-time regional landslide-susceptibility display during Typhoon Morakot. (a) 06:00 on 7 August 2009. (b) 12:00 on 7 August 2009. (c) 00:00 on 8 August 2009. (d) 00:00 on 10 August 2009.


Table 1.
The classification of the confusion matrix.
| Confusion Matrix | Predicted Class | ||
|---|---|---|---|
| Actual class | Landslide () | ||
| Non-landslide () | |||
Table 2.
Magnitude characteristics of the landslides in the Xiaolin area [30].
Table 2.
Magnitude characteristics of the landslides in the Xiaolin area [30].
| Size Class | Number of Landslides | Total Area (ha) | Proportion of Total Number (%) | Proportion of Total Area (%) |
|---|---|---|---|---|
| Large (>10 ha) | 16 | 357.6 | 11.1 | 57.3 |
| Small (<10 ha) | 128 | 266.3 | 88.9 | 42.7 |
Table 3.
The hydrogeological measured and calibrated parameters of shallow overburdens in the Xiaolin area.
Table 3.
The hydrogeological measured and calibrated parameters of shallow overburdens in the Xiaolin area.
| Geological Setting | The Parameters of Shallow Overburdens | |||||
|---|---|---|---|---|---|---|
(kN/m3) | (kPa) | (°) | (10−6 m/s) | (×10−4 m2/s) | (×10−8 m/s) | |
| Tangenshan sandstone | 18–24.3 b (19) | 0 a,b (3.1–5.2) | 30 a 21.4 b (24.5–32) | 0.15–595 b (1) | 0.24–0.28 (10) | 0.08–0.09 (1) |
| Yenshuikeng shale | - (18.5) | 0–10 b (6.9–9) | 23.2–25.5 b (20) | 1.68–495 b (10) | 0.21–0.24 (6) | 0.07–0.08 (1) |
| Changchikeng formation | - (18.4) | - (6.8~8) | - (20) | - (10) | 0.45–0.52 (1) | 0.15–0.17 (1) |
| Hunghwatzu formation | - (18.3) | 0 a (7.2–8) | 31.5 a (20~21) | - (10) | 0.3–0.35 (1) | 0.1–0.12 (1) |
| Terrace Deposits | 21.4 a (18.2) | - (6.8~8) | - (20) | - (100) | 1.8–2.2 (100) | 0.63–0.74 (1) |
| Recent Alluvium | 19.7–20.9 a (18.1) | - (7.3–8.5) | - (20) | - (100) | 75–88 | 25–29 (1) |
| (50) | ||||||
Publisher’s Note: MDPI stays neutral with regard to jurisdictional claims in published maps and institutional affiliations. |
© 2021 by the authors. Licensee MDPI, Basel, Switzerland. This article is an open access article distributed under the terms and conditions of the Creative Commons Attribution (CC BY) license (http://creativecommons.org/licenses/by/4.0/).
Share and Cite
MDPI and ACS Style
Deng, Y.-C.; Hwang, J.-H.; Lyu, Y.-D. Developing Real-Time Nowcasting System for Regional Landslide Hazard Assessment under Extreme Rainfall Events. Water 2021, 13, 732. https://doi.org/10.3390/w13050732
AMA Style
Deng Y-C, Hwang J-H, Lyu Y-D. Developing Real-Time Nowcasting System for Regional Landslide Hazard Assessment under Extreme Rainfall Events. Water. 2021; 13(5):732. https://doi.org/10.3390/w13050732
Chicago/Turabian StyleDeng, Yuan-Chang, Jin-Hung Hwang, and Yu-Da Lyu. 2021. "Developing Real-Time Nowcasting System for Regional Landslide Hazard Assessment under Extreme Rainfall Events" Water 13, no. 5: 732. https://doi.org/10.3390/w13050732
Note that from the first issue of 2016, this journal uses article numbers instead of page numbers. See further details here.