
Nitrogen Leaching and Nitrogen Balance under Differing Nitrogen Fertilization for Sugarcane Cultivation on a Subtropical Island


1
Tropical Agriculture Research Front, Japan International Research Center for Agricultural Sciences, 1091-1 Maezato-Kawarabaru, Ishigaki, Okinawa 907-0002, Japan
2
Kyushu Okinawa Agricultural Research Center, National Agriculture and Food Research Organization, Suya 2421, Koshi, Kumamoto 861-1192, Japan
*
Author to whom correspondence should be addressed.
Water 2021, 13(5), 740; https://doi.org/10.3390/w13050740
Submission received: 26 January 2021
/
Revised: 4 March 2021
/
Accepted: 5 March 2021
/
Published: 9 March 2021
(This article belongs to the Section Water Quality and Contamination)
Abstract
:Fertilizer application during sugarcane cultivation is a main source of nitrogen (N) loads to groundwater on small islands in southwestern Japan. The aim of this study was to quantify the effect of reducing the N fertilizer application rate on sugarcane yield, N leaching, and N balance. We conducted a sugarcane cultivation experiment with drainage lysimeters and different N application rates in three cropping seasons (three years). N loads were reduced by reducing the first N application rate in all cropping seasons. The sugarcane yields of the treatment to which the first N application was halved (T2 = 195 kg ha−1 N) were slightly lower than those of the conventional application (T1 = 230 kg ha−1 N) in the first and third seasons (T1 = 91 or 93 tons ha−1, T2 = 89 or 87 tons ha−1). N uptake in T1 and T2 was almost the same in seasons 1 (186–188 kg ha−1) and 3 (147–151 kg ha−1). Based on the responses of sugarcane yield and N uptake to fertilizer reduction in two of the three years, T2 is considered to represent a feasible fertilization practice for farmers. The reduction of the first N fertilizer application reduced the underground amounts of N loads (0–19 kg ha−1). However, application of 0 N in the first fertilization would lead to a substantial reduction in yield in all seasons. Reducing the amount of N in the first application (i.e., replacing T1 with T2) improved N recovery by 9.7–11.9% and reduced N leaching by 13 kg ha−1. These results suggest that halving the amount of N used in the first application can improve N fertilizer use efficiency and reduce N loss to groundwater.
1. Introduction
Nitrogen (N) is an important plant nutrient. However, 50% of the N fertilizers applied to agricultural fields end up as pollution or are wasted due to denitrification that results in the release of N2 [1]. Excess use of N can cause soil acidification by nitrification and the loss of nitrate (NO3−) by leaching into groundwater. In particular, N leaching into downstream watersheds, including surface waters, affects drinking water supplies and poses a considerable risk to human health [2]. The World Health Organization (WHO) guideline value for nitrate of 50 mg L−1 as NO3− (or 11 mg L−1 if reported as nitrate–N [NO3-N]) in drinking water [3] is acceptable for adults as well as bottle-fed infants. This guideline reported that NO3− levels in drinking water derived from surface water do not exceed 10 mg L−1 in most countries, although NO3− levels in well water often exceed 50 mg L−1 [3]. Therefore, it is crucial to improve N use efficiency for crops and reduce N loads to groundwater.
On small islands, groundwater is an essential resource for agricultural and domestic use because of the limitations on available water. In recent years, NO3−N contamination of groundwater from agricultural activities has become a critical issue on small islands in the humid Asian Pacific [4,5,6]. The islands located in southwestern Japan can be divided into two geographic groups: “low” and “high” islands [7]. Mountainous “high” islands have well-developed river systems with a high annual precipitation of approximately 2000 mm due to the monsoon and typhoons. On “low” islands, the majority of the rainfall percolates immediately into the ground because of the low-lying topography and highly permeable limestone. Groundwater in “low” islands is highly susceptible to eutrophication due to anthropogenic effects. One such island is Miyako Island, which, owing to the flatness of the landscape and the lack of mountainous terrain, is characterized by intensive land use, and the rate of cultivation and population density are high [8]. NO3–N from human activities, such as fertilizer use and domestic wastewater discharge, becomes a source of N loads to the groundwater and, thus, to coastal areas.
Sugarcane cultivation in Japan is concentrated on the islands of Okinawa and Kagoshima prefectures, i.e., the southwestern islands [9]. Sugarcane is highly adaptable to the severe weather conditions of the southwestern islands, such as typhoons and droughts [10]. The sugarcane industry plays a key role in the local economy. In sugarcane cultivation in Okinawa prefecture, N fertilizers are commonly used in the range of 190–270 kg ha−1 season−1 in three split applications (1 or 1.5 years) [11]. Nakanishi [12] reported that the timing of elevated NO3–N concentrations in groundwater in Miyako Island coincided with the period of intensive chemical fertilizer application in the early sugarcane growth stages. Yamane et al. [13] investigated the NO3–N concentrations in groundwater in the Amami region and reported high concentrations on islands with high sugarcane cultivation rates. These results suggest that N fertilizers applied to sugarcane fields are a source of underground N loads on small and “low” islands.
Sugarcane growth is slow and N uptake by plants is low during the early growth stage [14,15,16]. Numerous reports show that sugarcane does not efficiently recover the applied N fertilizer, with recovery values ranging from 23–45% [17]. Kaji and Nagatomo [18] found that the N use efficiency of sugarcane varied between a basal N utilization of 26% and a supplemental N fertilizer utilization of 64% in spring planting. The N fertilizer utilization efficiency of the first application, which is applied immediately after planting, was as low as 4%, and the NO3–N concentration in the soil solution became high in deeper soil layers below the root zone before the second application in the Philippines [19]. Sugarcane cultivation is practiced in a 2 to 3-year cycle (plant crop to ratoon or plant crop to first and second ratooning) in the typhoon-prone southwestern islands of Japan; however, there is limited information on N leaching during a multi-year fertilization cycle.
In the present study, the lysimeter method was used for direct measurements of the water balance and water-soluble substances in the soil and for the development of a sustainable fertilizer and irrigation management in the agricultural field. Drainage lysimeters, i.e., large soil tanks, allow for an accurate calculation of the water lost from the soil. Martin et al. [20] presented the usefulness of drainage lysimeters in evaluating N and irrigation management strategies with respect to soil water drainage and N leaching. The aim of the present study was to examine the effect of reducing N fertilizer application rates on sugarcane yield, N leaching, and the N balance. Lysimeter experiments were conducted on sugarcane cultivation under different N management and N leaching observations. The amount of applied N was based on the current N fertilization application rate (230 kg ha−1) used in Okinawa prefecture. We evaluated the effects of reductions in the N application rates of the first, second, and third applications on sugarcane growth and N leaching.
2. Materials and Methods
2.1. Study Site and Lysimeters
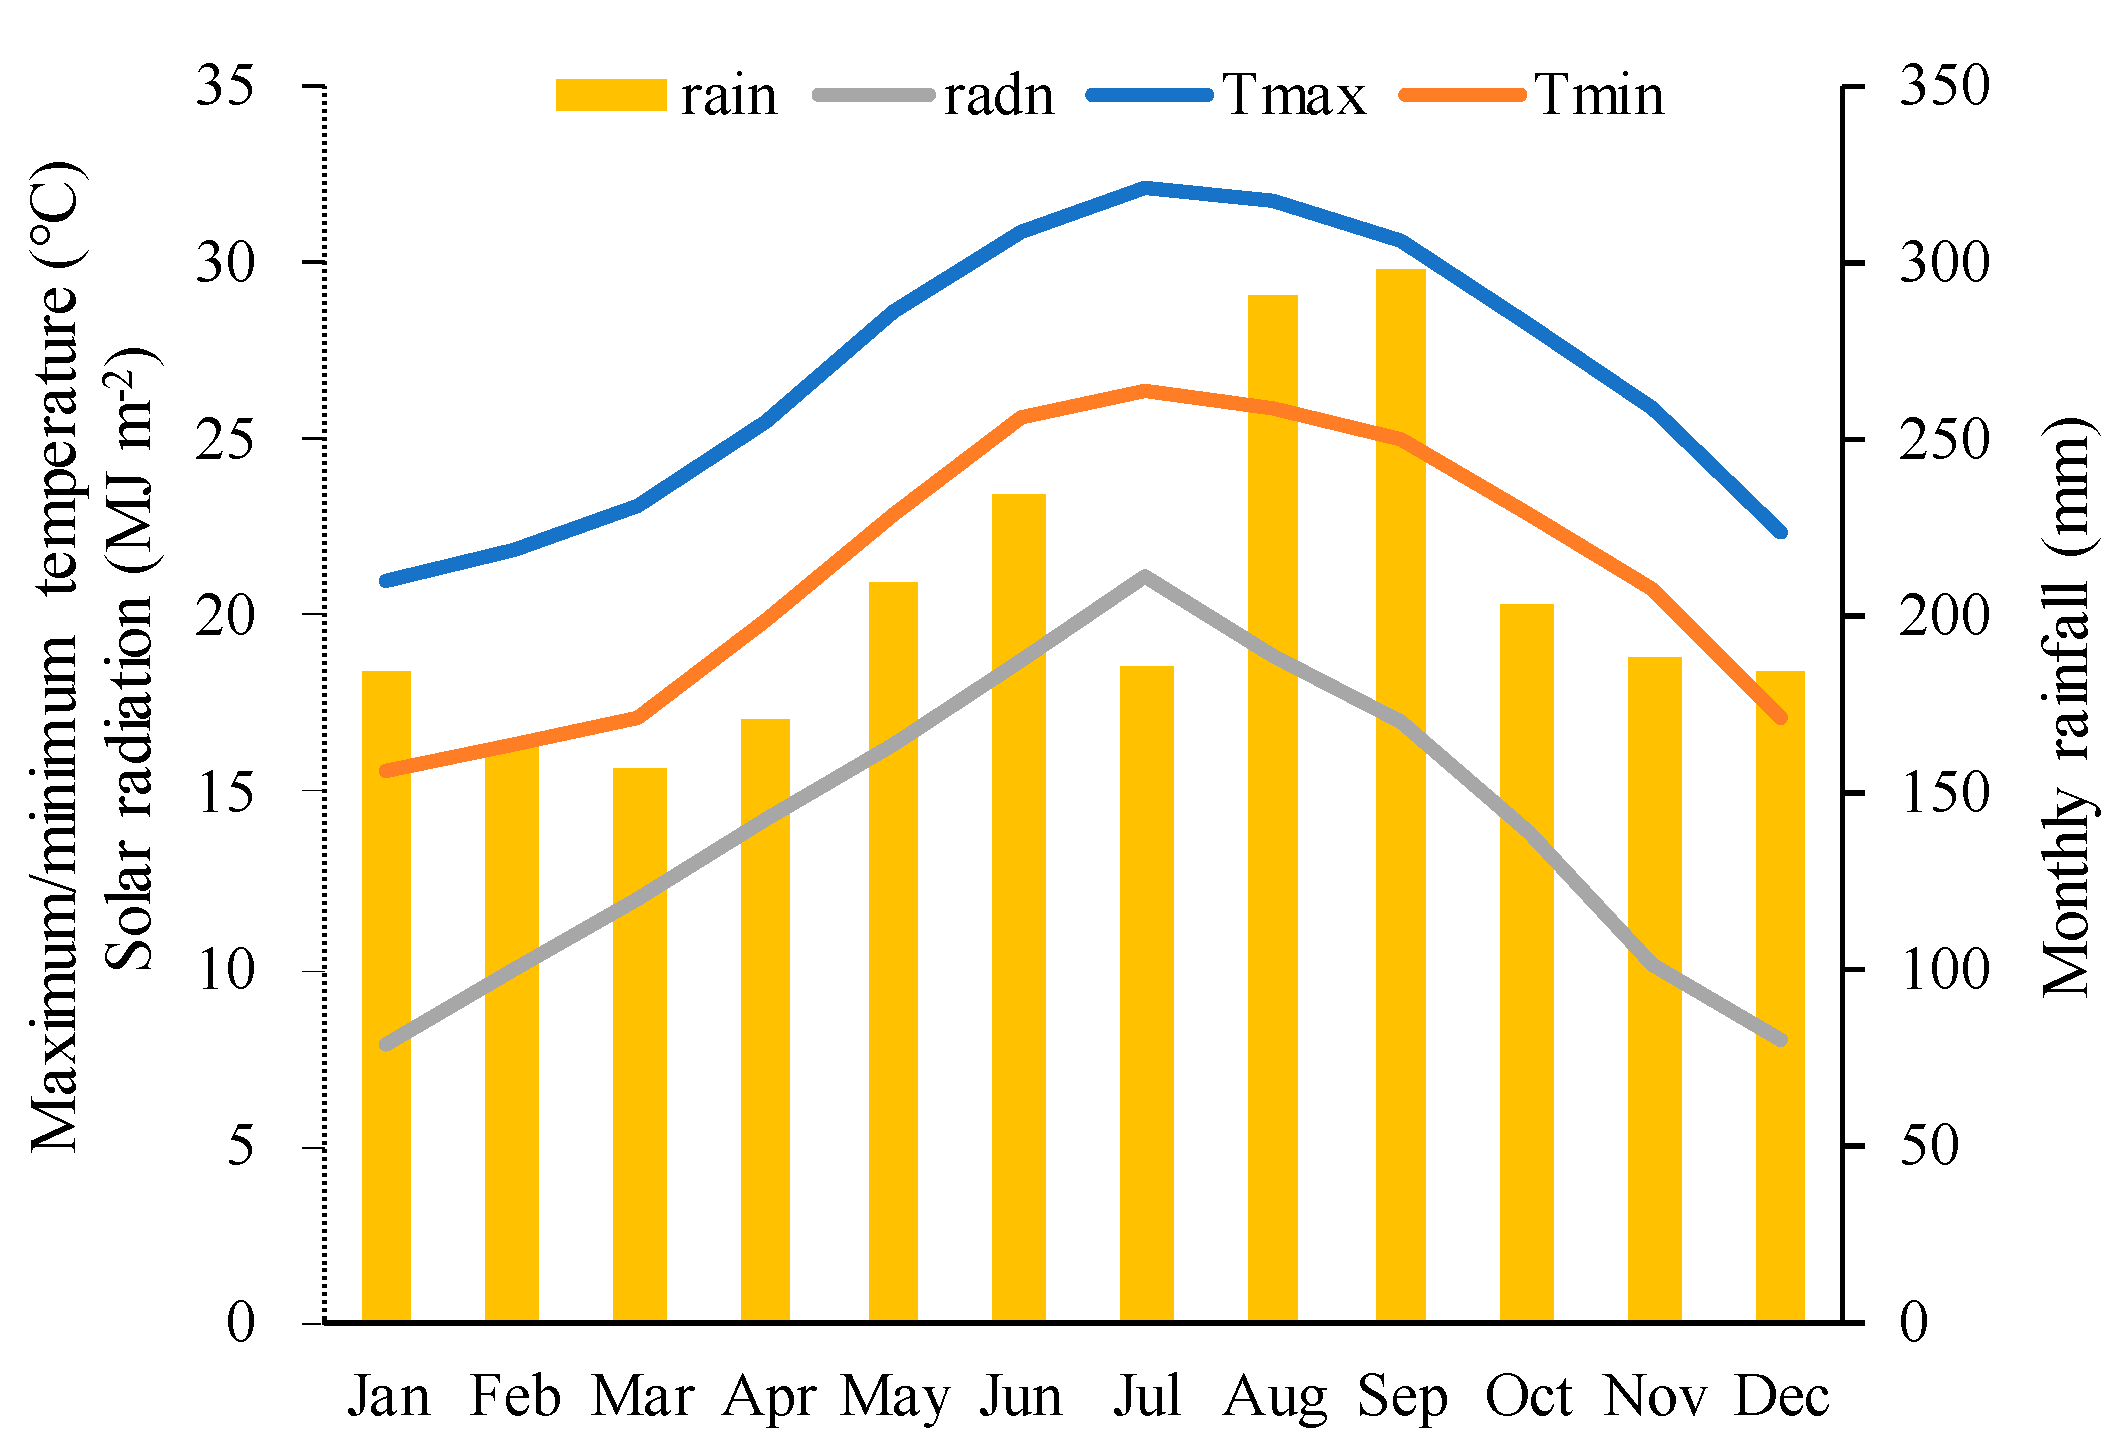
Our research site was the Japan International Research Center for Agricultural Sciences of Tropical Agricultural Research Front (JIRCAS–TARF, N 24°2243″, E 124°1141″), located on Ishigaki Island, Japan. According to meteorological observations from 2004 to 2019 in the JIRCAS-TARF, a considerable amount of rainfall occurs throughout the year on Ishigaki Island, i.e., above 150 mm per month, even in the driest month (March) (Figure 1). The mean daily maximum and minimum temperatures and solar radiation reached a maximum in July and a minimum in January. This climate is classified as a humid subtropical climate (Cfa) in the Köppen classification. The average annual rainfall was 2500 mm and the average annual temperature was 24.0 °C.
The JIRCAS-TARF has 14 units of concrete outdoor lysimeters with a 10 m2 area and a 2-m depth. Each lysimeter was filled with dark red soil, i.e., Shimajiri Maji [21]. The physical and chemical soil characteristics are given in Table 1. The side-top of the lysimeters was approximately 15 cm above the ground. Surface runoff did not occur during the experimental period, based on the observation of short-term maximum rainfall events (78 mm h−1).
2.2. Sugarcane Cultivation
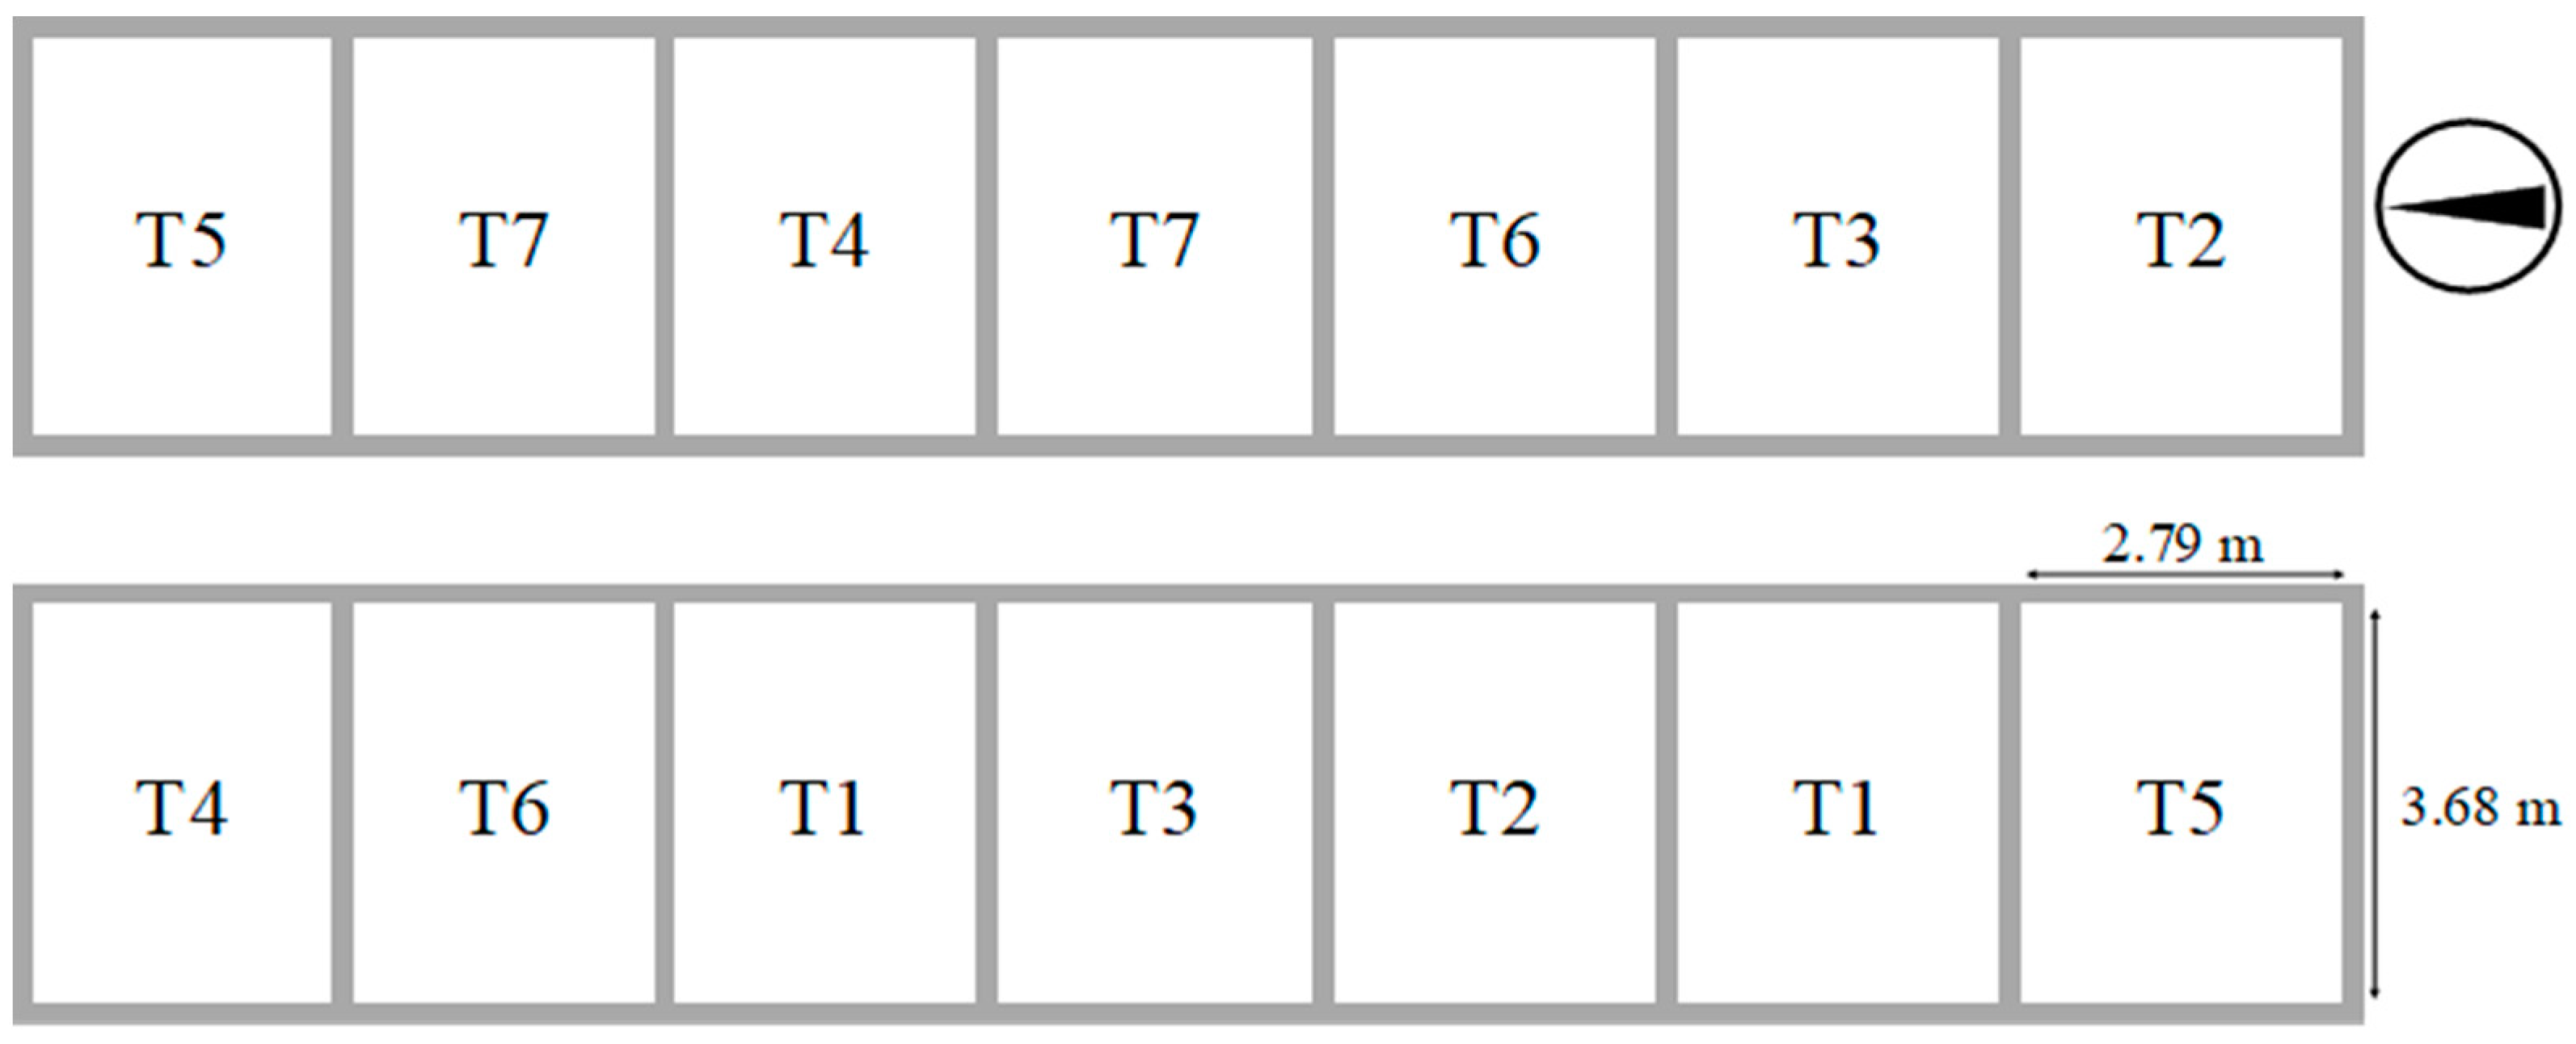
Sugarcane cultivation experiments were conducted using drainage lysimeters during three cropping seasons under different N fertilizer application rates. Sugarcane (variety NiF-8) was planted at 1.2-m spacings (five plants per line) in December 2016 and grown without irrigation. Harvest dates were 16 January 2018, in the plant cropping season (season 1), 4 December 2018, in the first ratooning season (season 2), and 29 October 2019, in the second ratooning season (season 3). Fertilizer was applied on 16 January, 12 April, and 12 June in 2017 in season 1; on 12 February, 12 April, and 12 May in 2018 in season 2; and on 9 January, 4 March, and 4 April in 2019 in season 3. The average temperature and solar radiation during the cultivation experiment were 23.4 °C and 13.3 MJ m−2 in season 1, 24.3 °C and 15.6 MJ m−2 in season 2, and 24.7 °C and 14.2 MJ m−2 in season 3, respectively. Seven treatments were prepared for the experiment. The experimental design was a randomized block with two replications of a 3 × 2 factorial design and an unfertilized control (i.e., without N fertilizer), totaling 14 plots (Figure 2). The first factor was the N rates of the first application (0, 35, or 70 kg N ha−1) and the second factor was the total N rates of the second and third applications (80 or 160 kg N ha−1) (Table 2). The standard amount of N fertilizer (urea; 46% N) used in this study was 230 kg ha−1 (T1), which is approximately half of the standard N fertilizer application amount used in spring and summer plantings according to the Okinawa prefectural sugarcane fertilization rates. Lime superphosphate and potassium chloride were applied at the same rates, i.e., 34 kg ha−1 and 30 kg ha−1 for the first application, 23 kg ha−1 and 24 kg ha−1 for the second application, and 46 kg ha−1 and 42 kg ha−1 for the third application, respectively. All fertilizers were applied at a 10-cm depth on one side of the line where sugarcane was planted and were covered with soil. We measured the fresh weight, dry weight, and N uptake of sugarcane stalks, leaves, and tops at harvest. Four stems were collected from each of the two sugarcane plants from each lysimeter. Dry matter and partial weight were measured from two stems, and the N content was measured from the remaining two stems using an NC analyzer (NC22-F, SUMIGRAF). The fresh weight of stems (yield) was also measured for all sugarcane plants in each lysimeter. Prior to the experiment, sugarcane was harvested in February 2016, and the lysimeter was then fallowed for 10 months. To remove as much of the NO3-N derived from the previous cultivation as possible, all lysimeters were waterlogged and drained three times during the fallow period until the NO3-N concentration in drainage water was <1 mg L−1.
2.3. Observations of Water and NO3-N Movement in Lysimeters
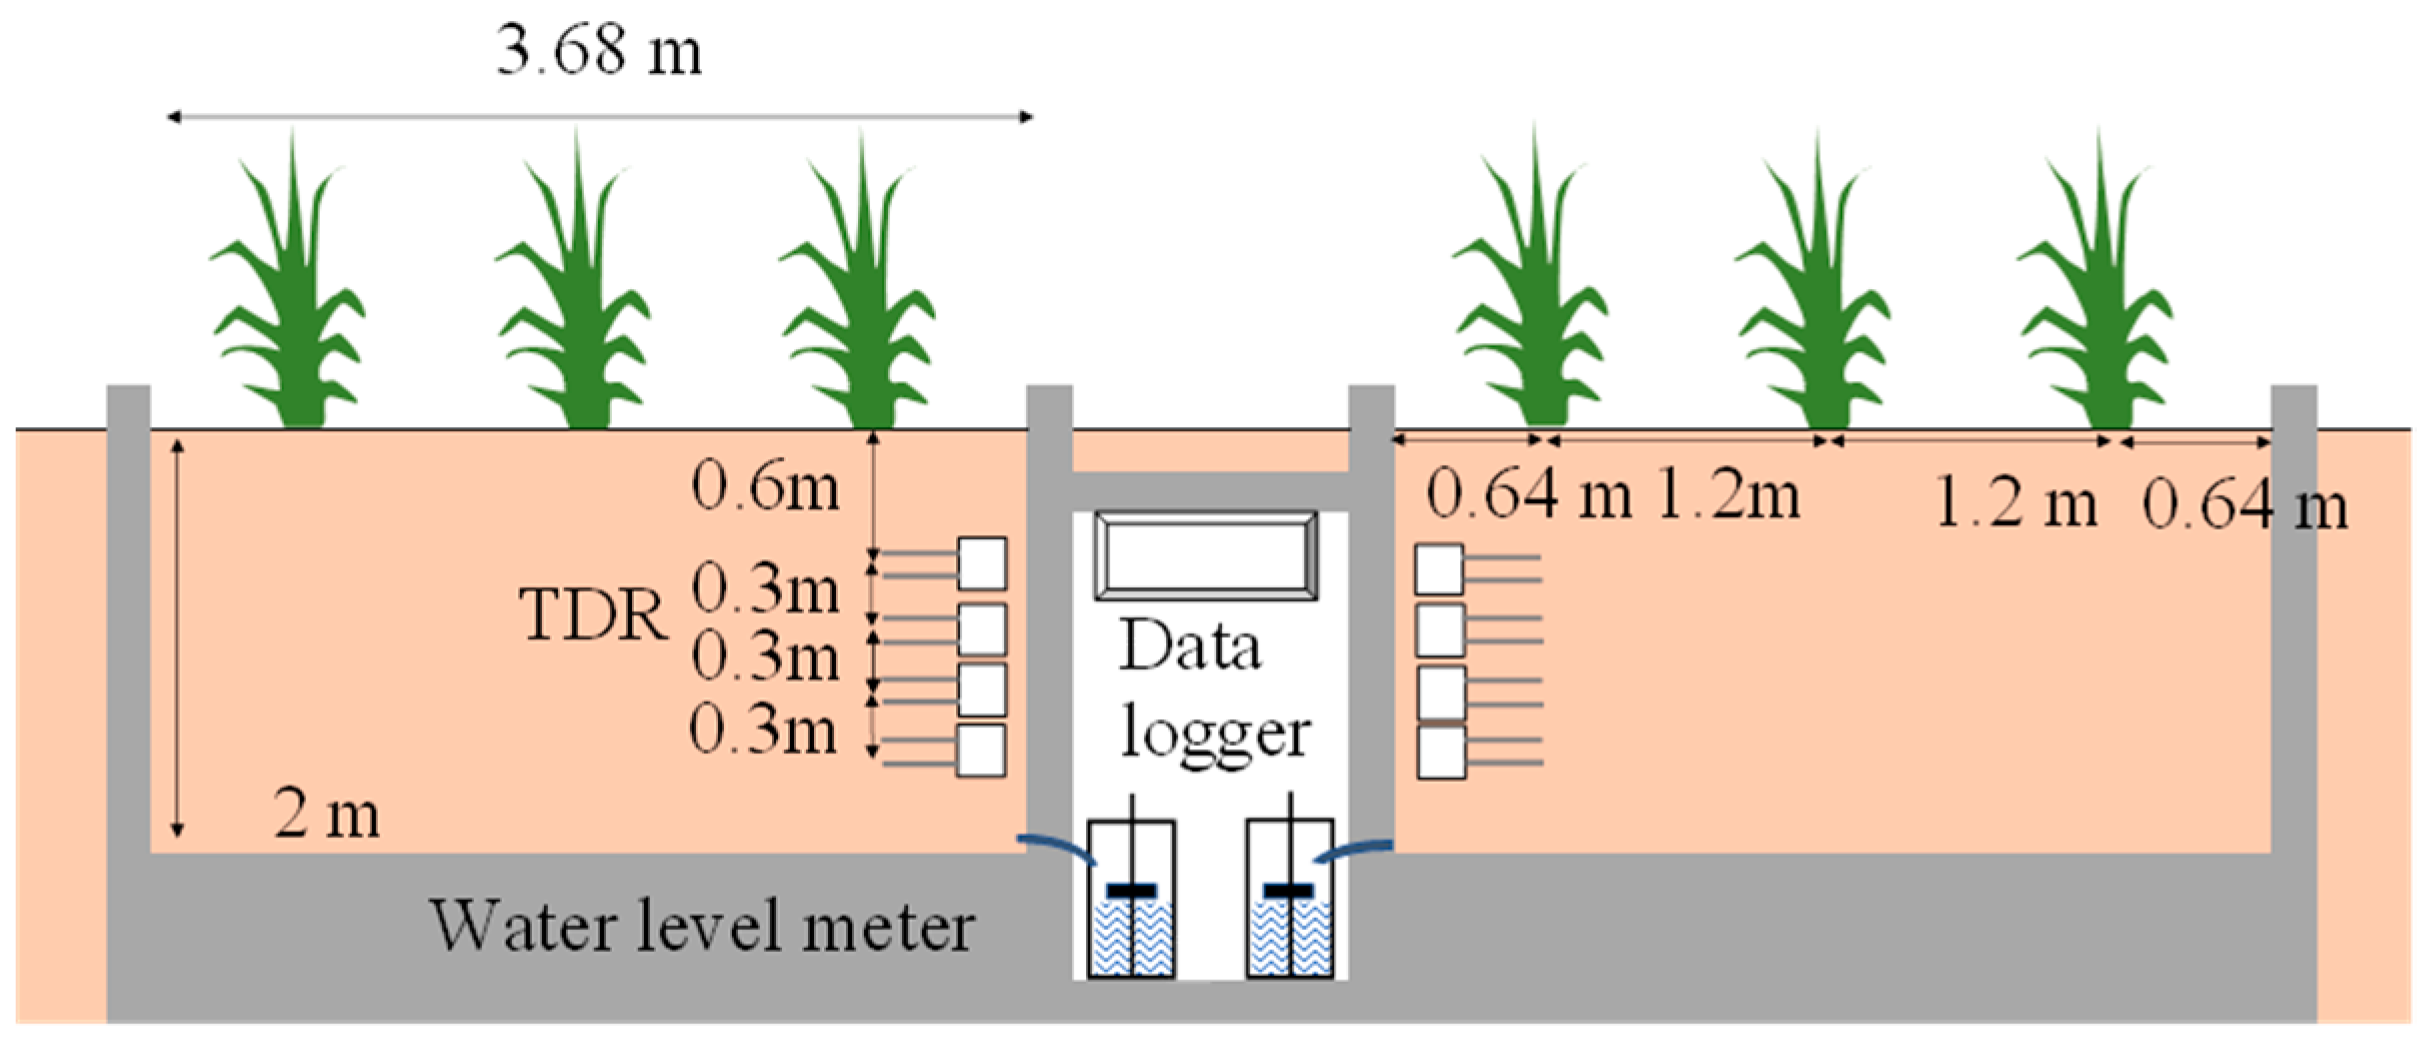
The time domain reflectometry (TDR) sensors (CS616, Campbell Sci. Inc., Logan, UT, USA) were used to monitor soil moisture changes in seasons 1, 2, and 3, and were installed at depths of 60, 90, 120, and 150 cm in the lysimeters (Figure 3). Soil moisture change was calculated from the difference in the average volumetric water content of all layers between planting and harvesting. Drainage water from the bottom of the lysimeters was received by a cylindrical column equipped with a solenoid valve (AB41-04-08-D2G-DC12V, CKD Corporation, Komaki, Japan). We installed a water level meter (GYLT-01-300-BR-M8-CN, SANTEST. Co. Ltd., Osaka, Japan) inside the column. Soil moisture and drainage water data were recorded by a data logger (CR10X, Campbell Sci., Inc.) at 1-h intervals. Samples of drainage water for NO3–N analysis were collected daily in 50-mL poly bottles. The collected samples were transported to the JIRCAS-TARF laboratory, and the NO3–N concentrations (mg L−1) were measured using a spectrophotometer (Hitachi U-2000, Hitachi, Tokyo, Japan). N loads in the groundwater (kg ha−1) were calculated from the NO3–N concentration, volume of drainage water, and area of lysimeters.
2.4. Estimation of N Balance and N Use Efficiency
The seasonal N balance (kg ha−1) was calculated as follows:
where ΔN is the soil nitrogen balance (kg ha−1); N fertilizer is the amount of applied N fertilizer (kg ha−1); N uptake is the N uptake by plants (kg ha−1); and N load is the NO3–N in deep drainage water from the bottom of the lysimeter (kg ha−1). The NO3–N concentration in rainfall was regarded as 0.5 mg L−1 [22] and was multiplied by the amount of precipitation to calculate N rain. N fixation, and N emissions from denitrification were included in ΔN soil. Therefore, the N balance in Equation (1) is a partial N balance. N recovery (%) was calculated as follows [23]:
where N uptake T1–T6 is the total N uptake (kg ha−1) in sugarcane crops from N-fertilized treatments (T1–T6); N uptakeT7 is the total N uptake (kg ha−1) in sugarcane crops from the 0 N treatment (T7); and N fertilizer is the N fertilizer application rate (kg ha−1).
ΔN soil = N rain + N fertilizer-N uptake-N load
N recovery = ([N uptakeT1–T6–N uptakeT7]/N fertilizer) × 100,
2.5. Statistical Analysis
Statistical indices were calculated on a seasonal basis. Analysis of variance (ANOVA) was used to test for significant differences in drainage water, soil water change, and N loadings over the seasonal and whole periods, as measured by each N fertilizer application. Statistical analyses were performed using the R software version 3.6.1 [24].
3. Results
3.1. Deep Drainage and Soil Moisture
The rainfall for each season ranged from 2332 to 2797 mm, which is comparable to the research center’s average annual rainfall of 2501 mm (Table 3, Table 4 and Table 5). The rainfall patterns for seasons 1 and 3 coincided well, with rainfall evenly distributed throughout the cropping season (Figure 4). On the other hand, in season 2, the average daily rainfall was much lower at 2.7 mm day−1 from the first to the third fertilization day (116DAP). In the following period of season 2, six typhoons occurred at the study site (4.3 annual average), resulting in a higher average daily rainfall of 9.25 mm d−1. In contrast, the amount of rainfall from the first to the third applications was 6.9 mm day−1 in season 1 and 6.7 mm day−1 in season 3.
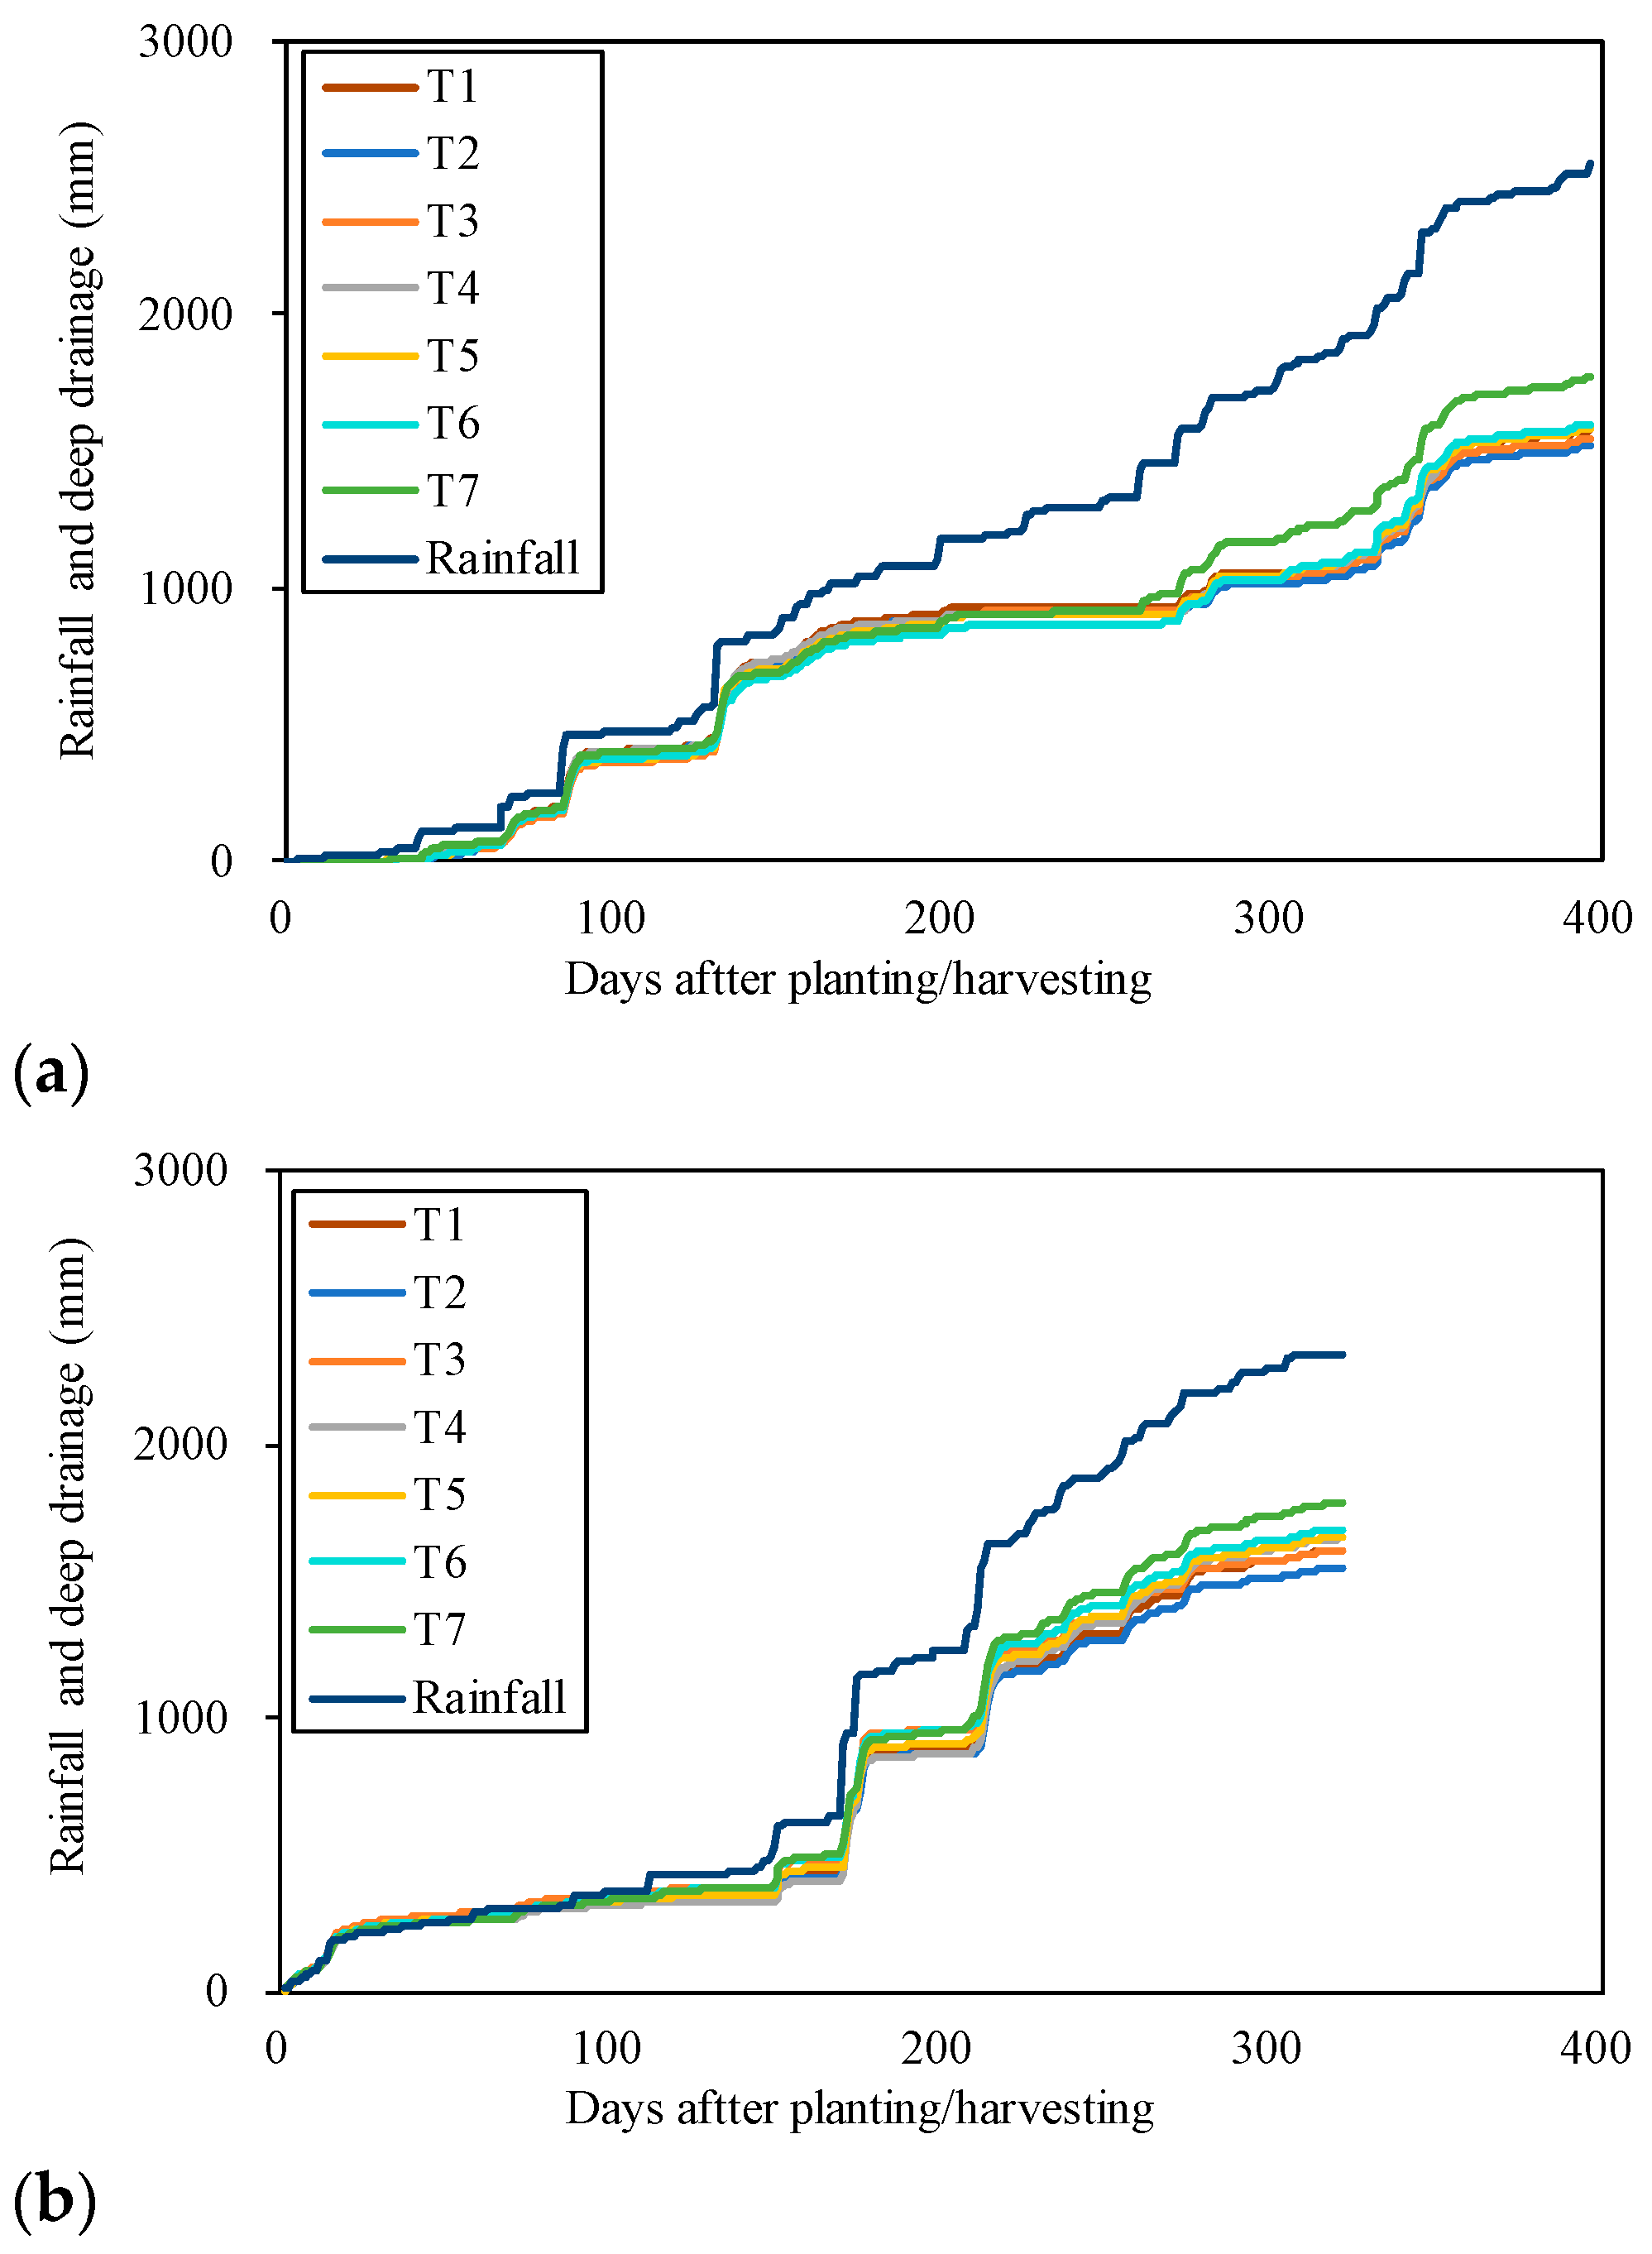
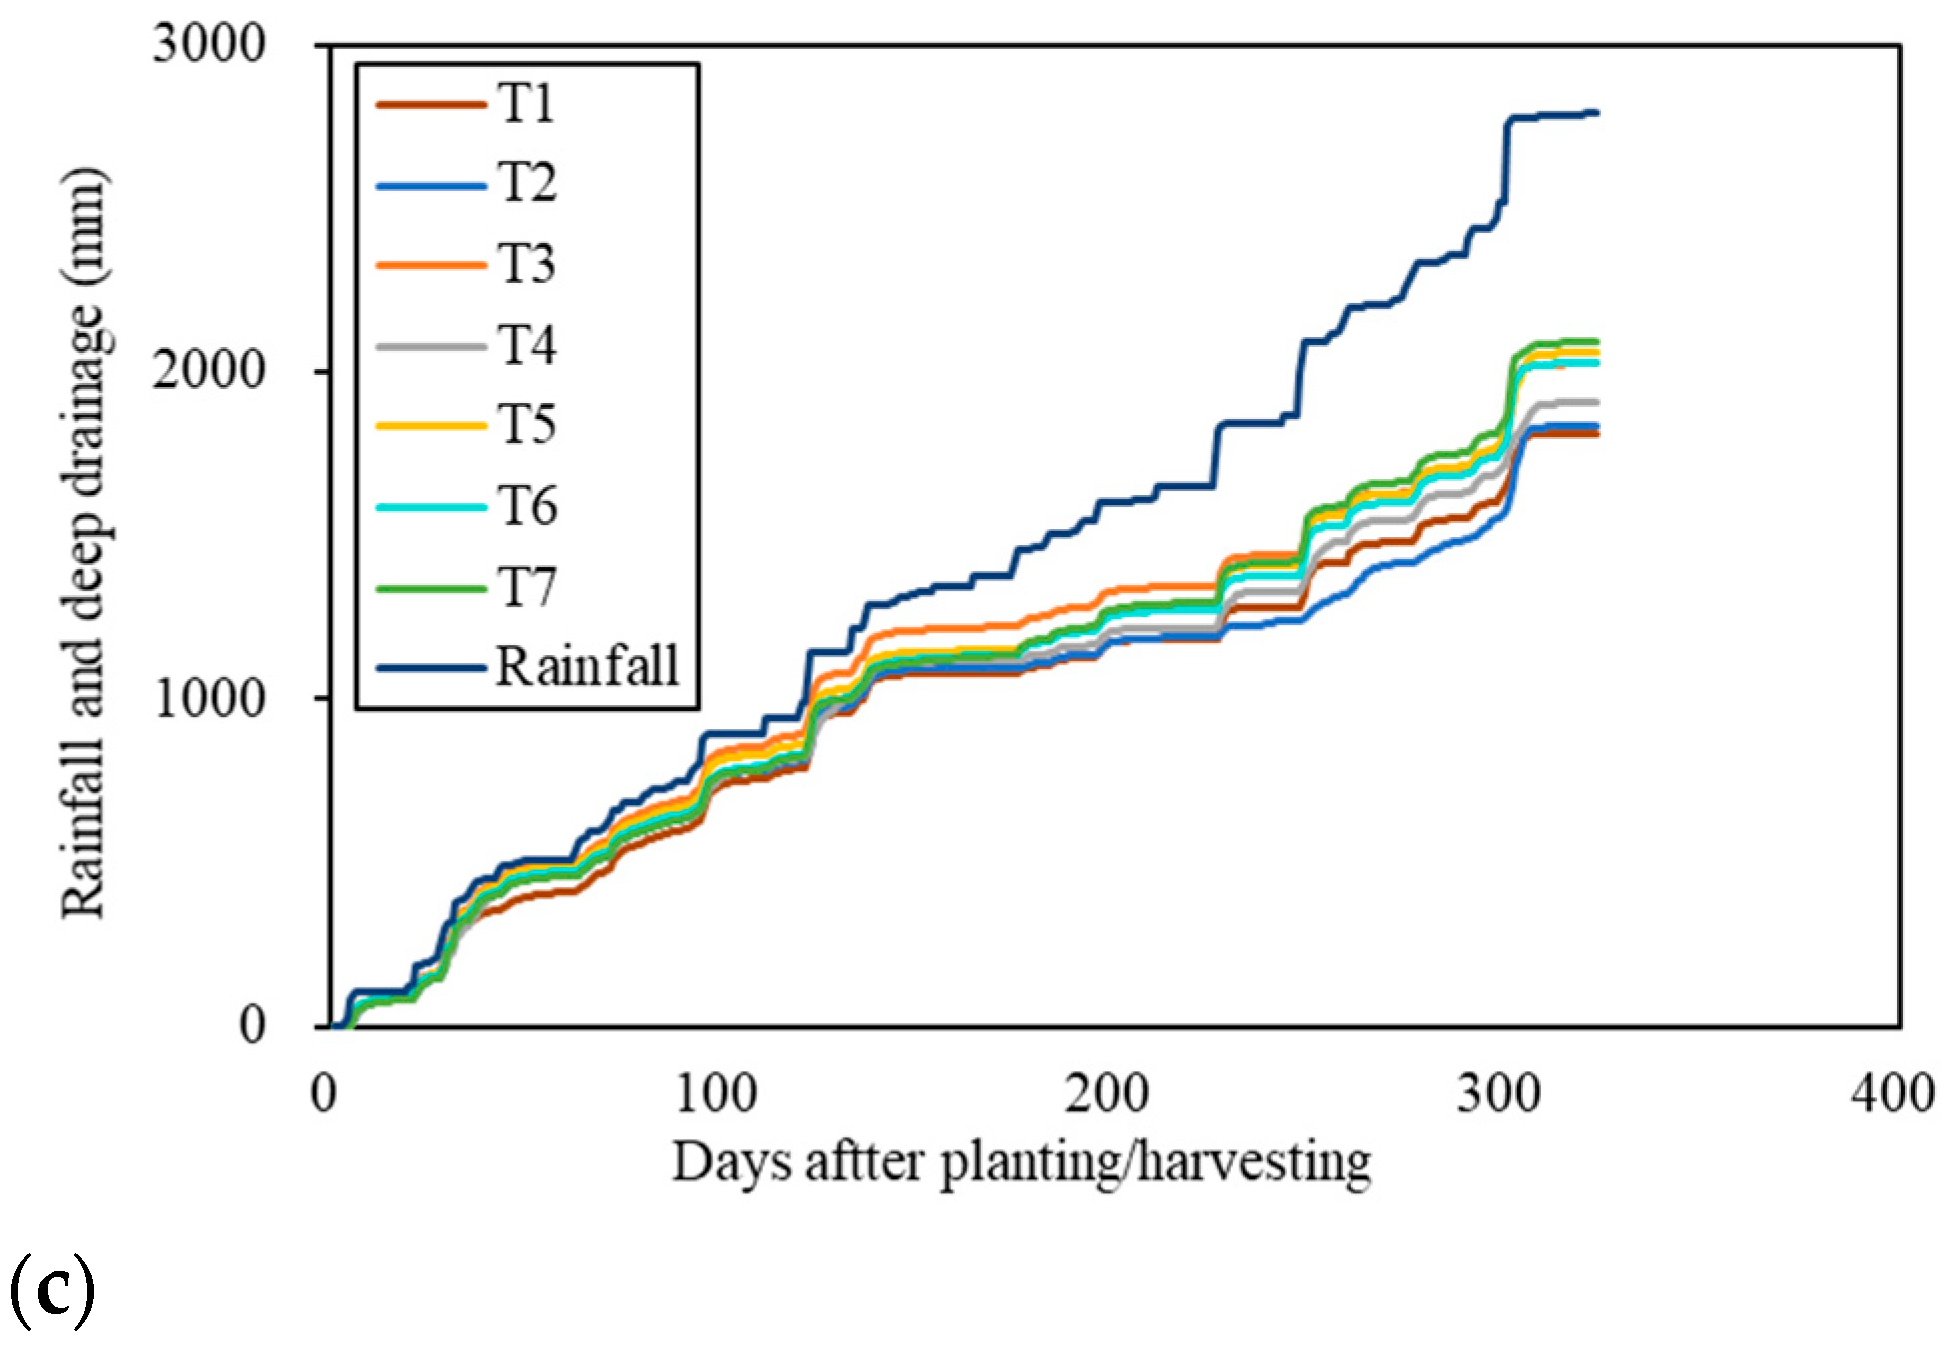
The 2-m deep drainage for each treatment ranged from 1522 to 1769 mm in season 1, 1548–1786 mm in season 2, and 1815–2094 mm in season 3 (Table 3, Table 4 and Table 5). The amounts of drainage water in T1–T6 were lower than those in the control treatment (T7) in all seasons. Significant differences in the infiltration water could not be detected by ANOVA among the different N fertilizer treatments during the three cropping seasons. However, in the medium-term (whole period), reductions in the second and third applications of N affected the infiltration rates (Table 6). During the entire period, deep drainage was synchronized with an increasing accumulated rainfall. Figure 4 shows that most of the rainfall drained into the deep layers, especially until the 3rd application.
The differences in soil moisture in each treatment at the beginning and end of the cropping seasons were not largely affected by differences in the N fertilization rates over the whole period. Soil moisture decreased in season 1 (−63 to −16 mm), increased in season 2 (18 to 33 mm), and decreased in season 3 (−35 to −22 mm). These slight increases or decreases may have been caused by rainfall just prior to planting and harvesting. The soil moisture change in relation to total rainfall (7679 mm) ranged from 0.8 to 1.2% (−63 to −16 mm). In short- and medium-terms, differences in N fertilizer application practices appeared to have little effect on changes in soil moisture, but had a significant impact on the amount of drainage of sugarcane fields.
3.2. NO3–N Concentrations and N Loads in Deep Drainage
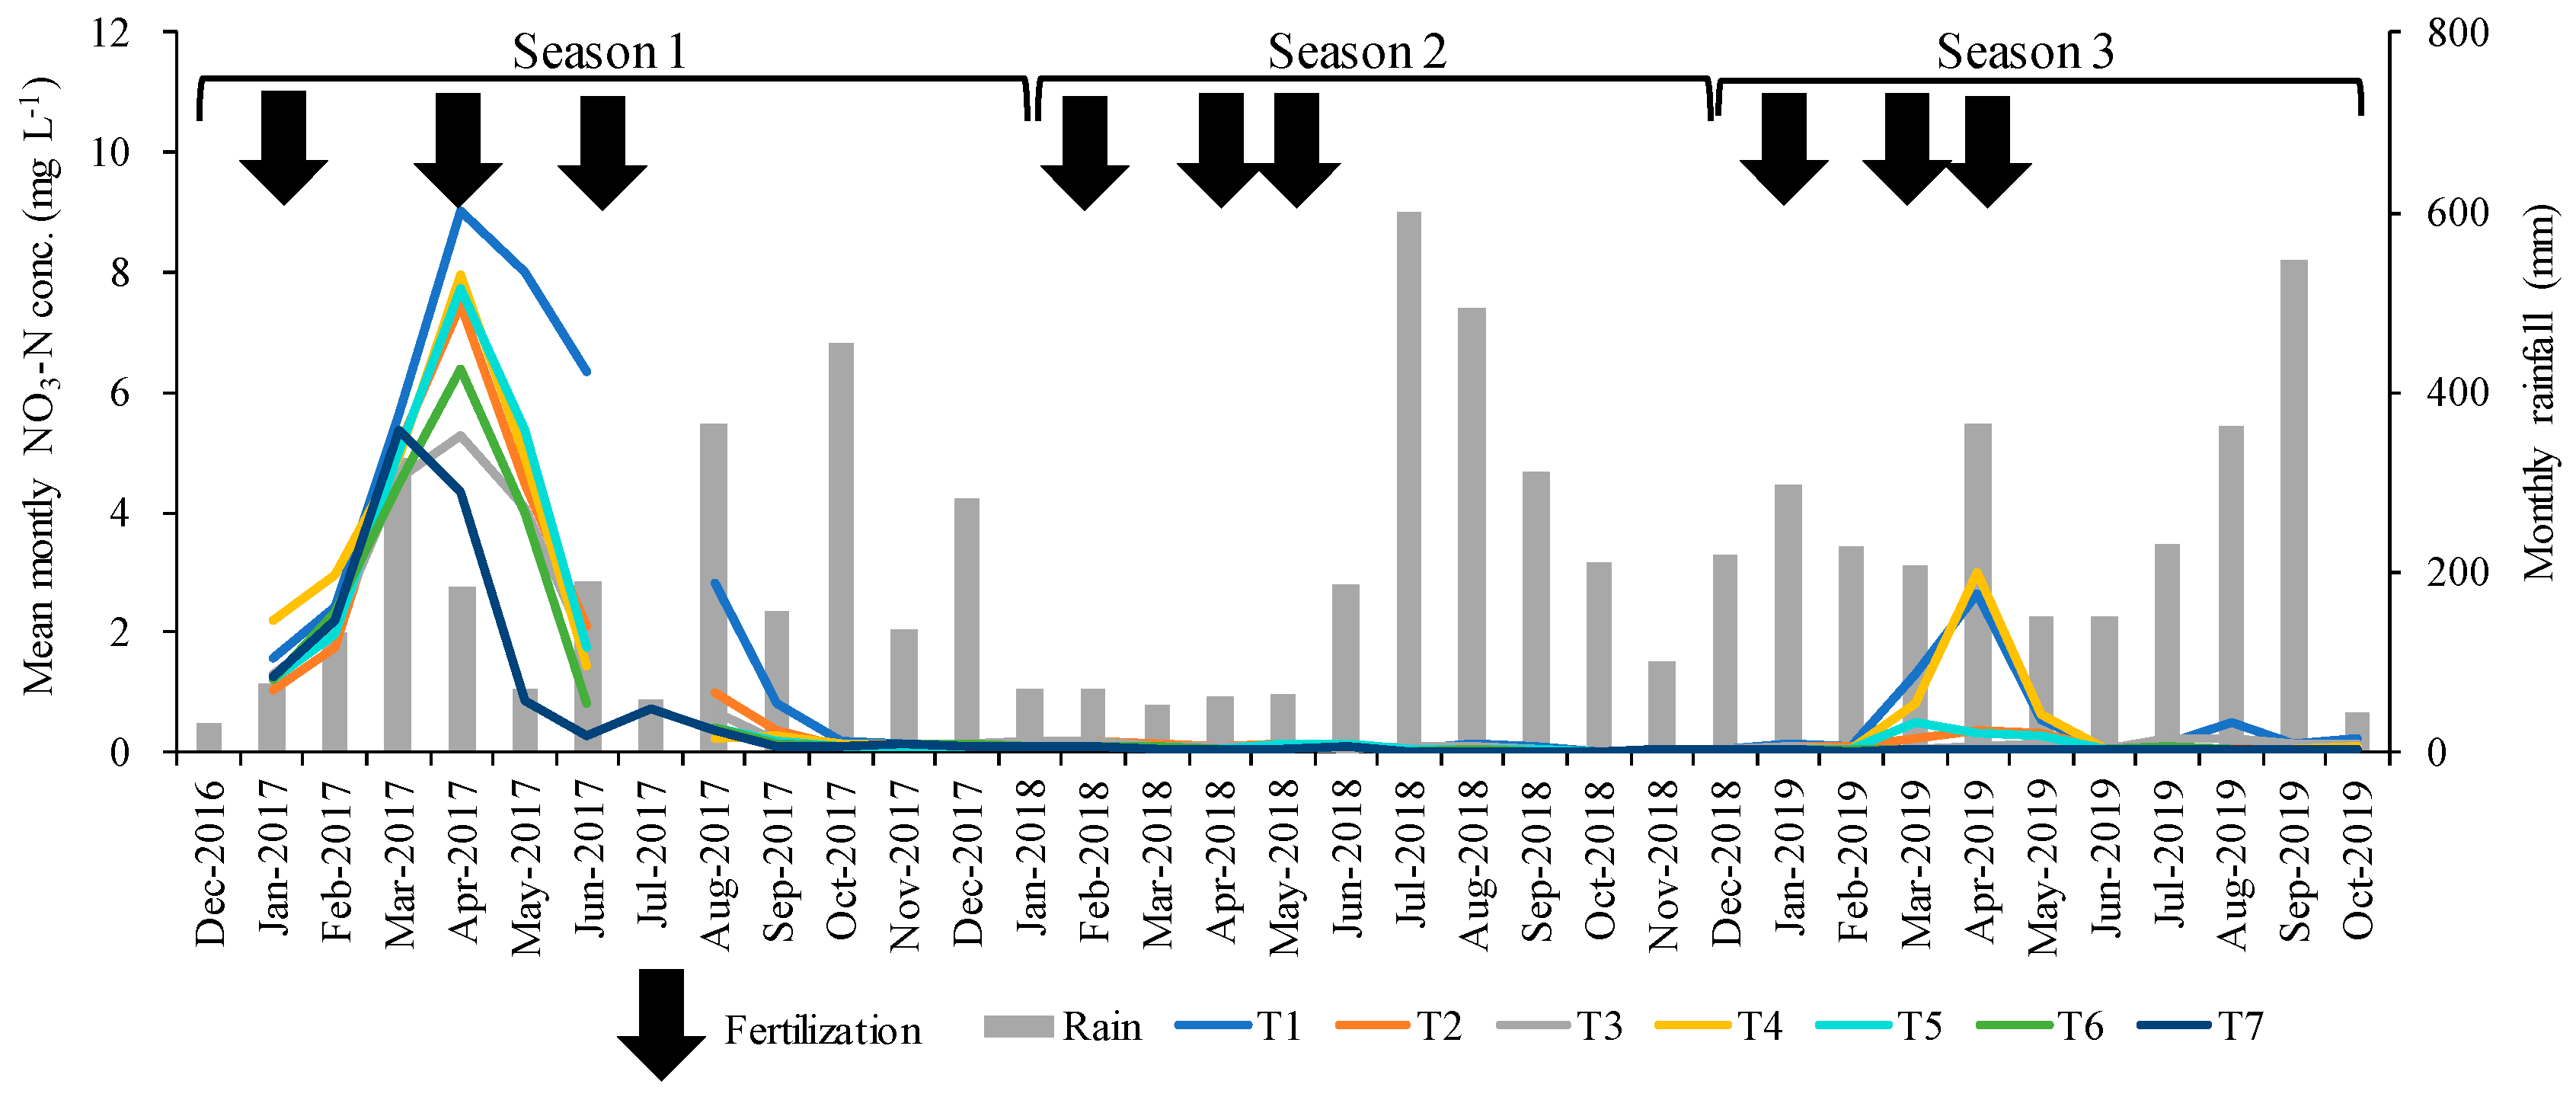
NO3–N concentrations in the deep drainage were widely distributed from 0.0 mg L−1 to 14.8 mg L−1 (daily data not shown). The time course of the NO3–N concentration in each treatment is shown in Figure 5 as monthly average values, since the NO3–N concentration was highly variable even in the two replicates. NO3–N concentrations in all treatments were higher in season 1 than in seasons 2 and 3 and lower after the third application. In March of season 1, the NO3–N concentration in drainage water from the control treatment (T7) increased to approximately 5.0 mg L−1, similar to the increased concentrations in the other treatments. In season 1, NO3–N concentrations peaked in May for all treatments, with values of approximately 8.0 mg L−1 for T1, T2, T4, and T5. In contrast, the NO3–N concentrations in season 2 were less than 0.2 mg L−1 during this period. In season 3, NO3–N concentrations in the deep drainage of T1 and T4 increased from March and reached a peak (approximately 3.0 mg L−1) in April 2019.
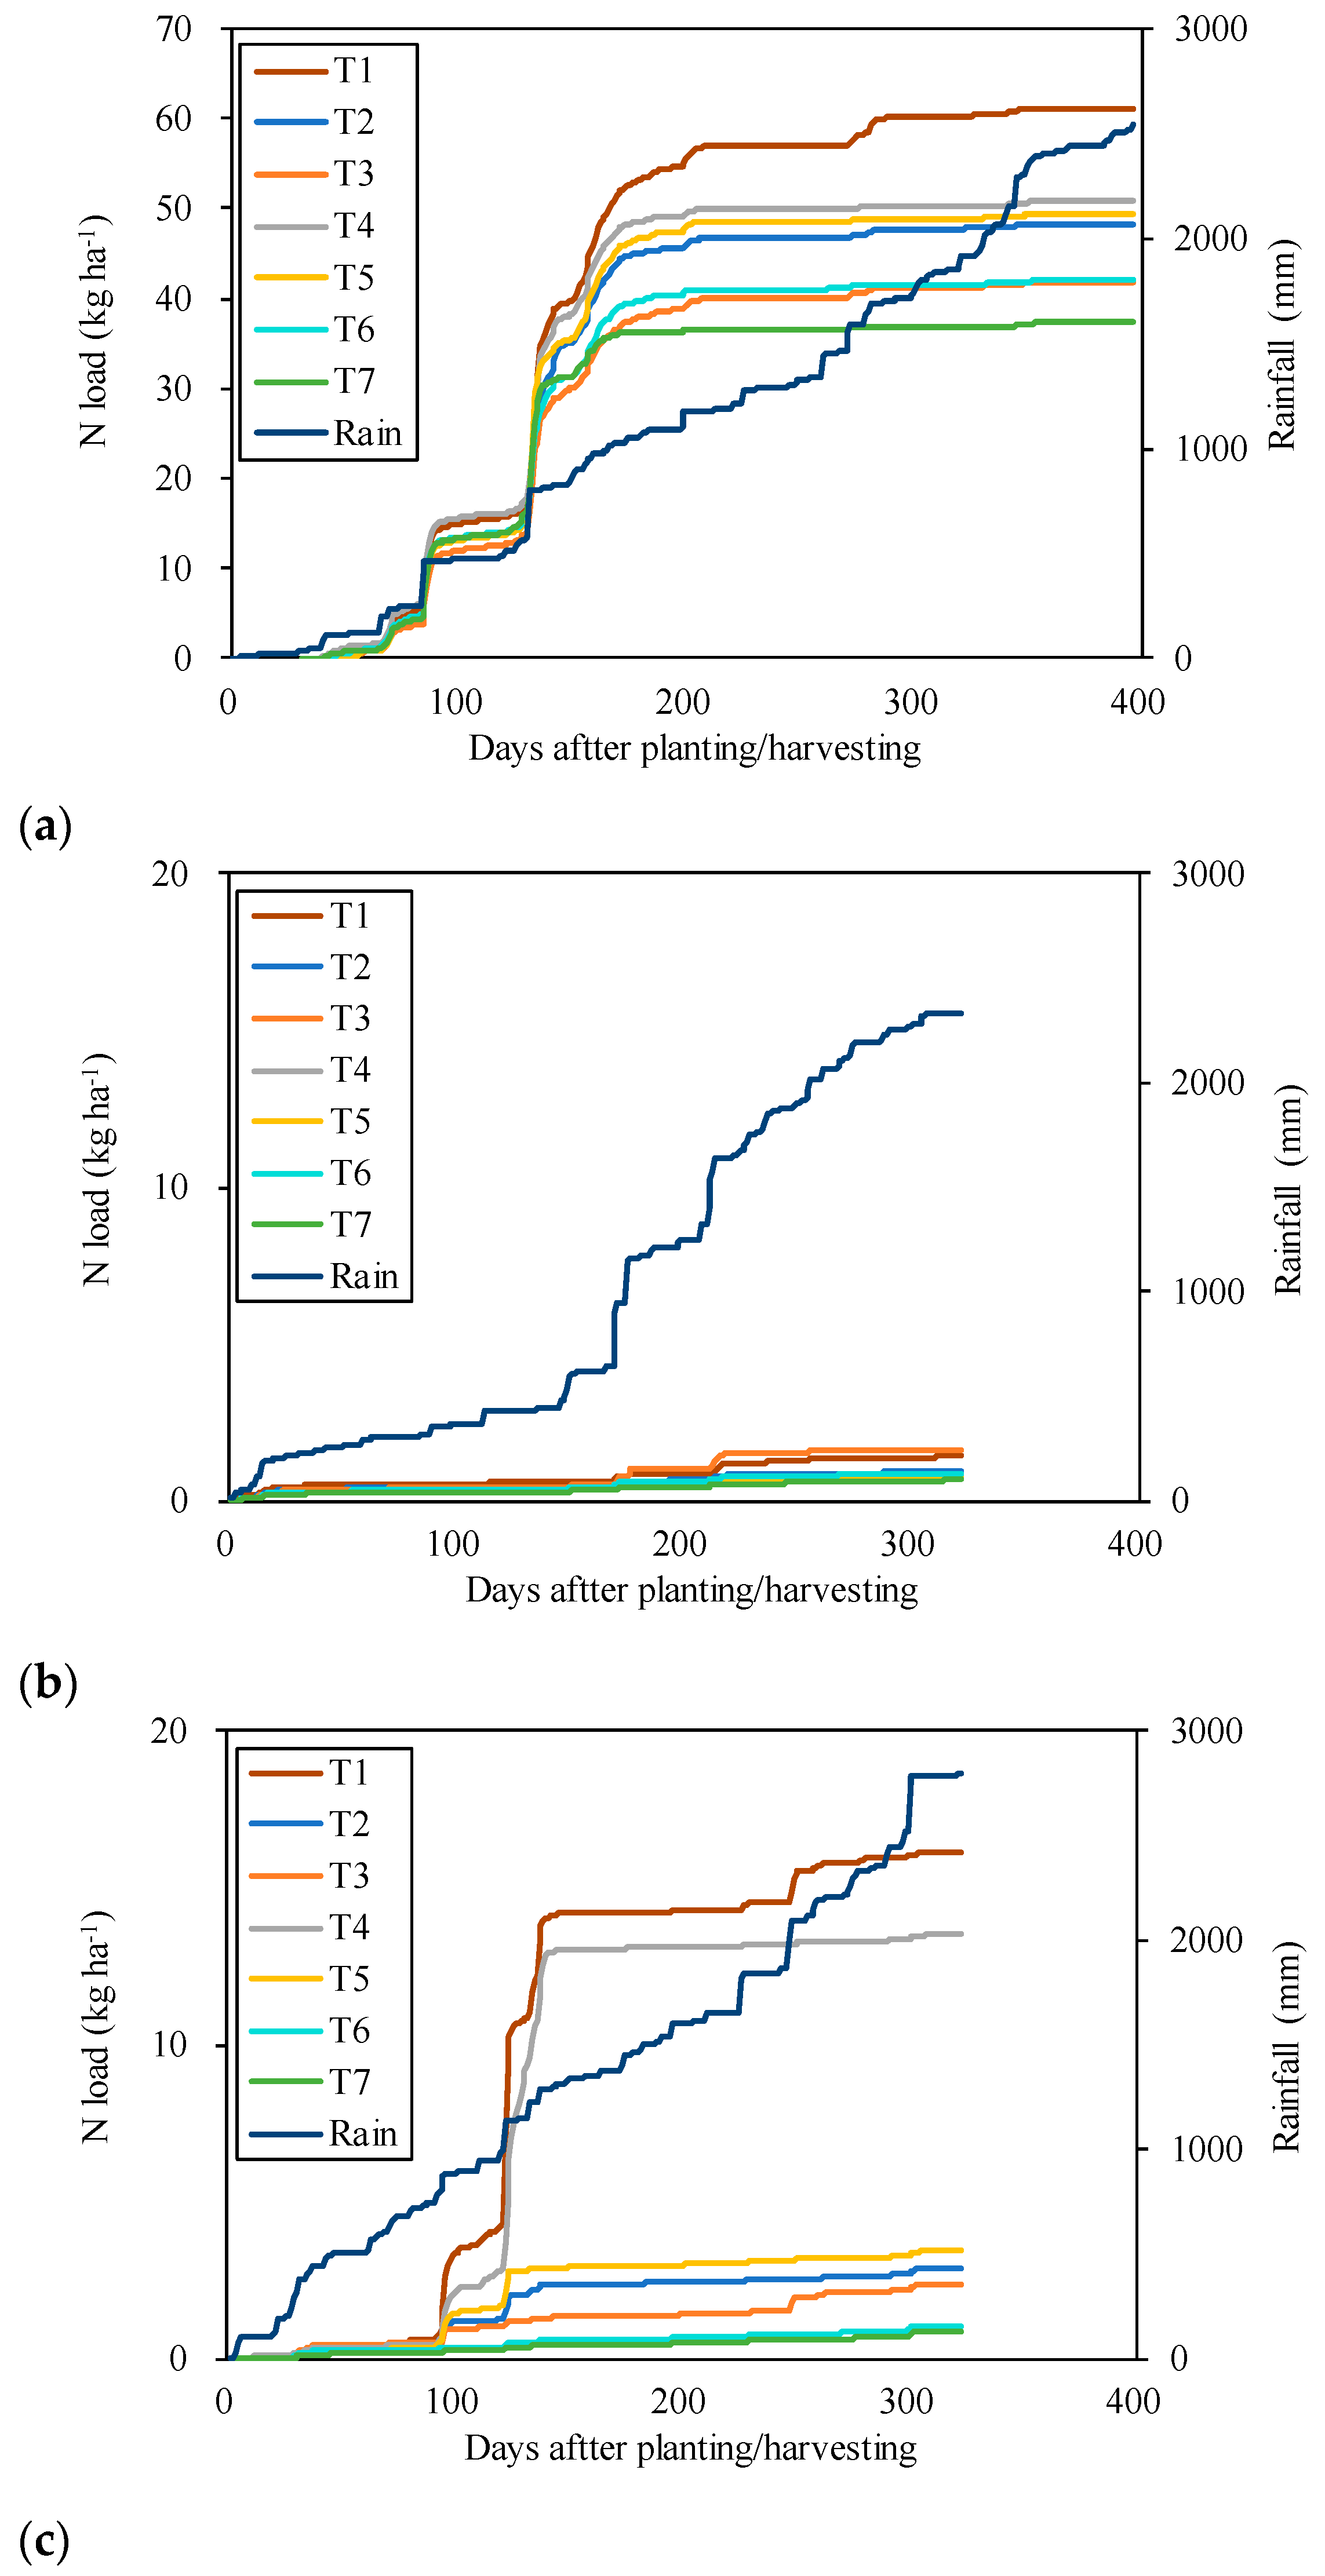
N leached downward below a depth of 2 m and ranged between 37.4–61.1 kg ha−1 in season 1, 0.7–1.6 kg ha−1 in season 2, and 0.9–16.1 kg ha−1 in season 3 (Table 3, Table 4 and Table 5). The total amounts of N loads and the time variations were quite different between the seasons. In season 1, N loads increased with increasing rainfall until around the time of the third application period (178DAP) (Figure 6). The highest N loads were in the T1 and T4 treatments, in which the recommended amount of N in the first application had been adapted. T2 and T5, in which half the amount of N in the first application was applied, and T3 and T6, in which 0 N in the first application was applied, had similar N loads. In season 2, the accumulated N loads were less than 1.6 kg ha−1 in all treatments. In season 3, the N loads of T1, T2, T4, and T5 increased rapidly after a 72.5-mm rainfall event in 95DAP, while those of T1 and T4 also increased after a 149.5-mm rainfall event in 122DAP. The ANOVA detected significant differences in N loads between treatments with different N rates used in the first application. The effects of reduced N rates of the first application affected the reductions of N loads in both single and whole cropping seasons (Table 6).
3.3. Sugarcane Yield and N Balance
Sugarcane yields over the three seasons ranged from 27.0 to 88.0 tons ha−1 (Table 7). The average yields for all treatments were 75.1 tons ha−1 in season 1, 54.1 tons ha−1 in season 2, and 68.9 tons ha−1 in season 3. The average yield in season 2 was lower than the average yield of 66.0 tons ha−1 on Ishigaki Island (2006–2015). As previously mentioned, this may be due to drought stress caused by low rainfall until the third fertilization period and typhoons that occurred during the period of high growth and high temperatures from June to October. The average N uptake for season 2 (66 kg ha−1) was also lower than those for seasons 1 and 3 (149 kg ha−1 and 98 kg ha−1, respectively). Except for the control treatment (T7), N fertilizer accounted for the dominant portion of the N input; however, N input accompanied by rainfall contributed 5–14% of the total N input. The soil N balance was negative in all treatments in season 1, and in T7 in seasons 2 and 3. In seasons 1 and 3, the average seasonal N recoveries were at the same level (56.3% in season 1 and 57.4% in season 3), whereas this value in season 2 was lower than that in season 2.
4. Discussion
There was little difference in total drainage water from 2 m depth in each season with different N fertilizer management. In the medium term, accumulated drainage water with full N application rates in the second and third applications (T1–T3) increased compared to the treatments in which the N application rates were halved in the second and third applications (T4–T6). This may be because crop growth and high yield were positively affected by an increased transpiration in T1–T3. In particular, the control treatment (T7) had extremely low yields and large infiltration rates compared to the other treatments.
NO3–N concentrations in drainage water at the 2-m depth reached a maximum approximately 60–90 days after the first fertilizer applications in seasons 1 and 3. During sugarcane cultivation in Australia in an area with approximately 2800 mm of annual rainfall, NO3–N concentrations in drainage water from lysimeters at a 1-m depth reached a peak approximately 50–70 days after fertilization and, subsequently, gradually decreased [25]. The measured NO3–N concentrations in the present study were very close to those previously reported in Australia and Brazil (1.7–5.0. mg L−1, [25,26]). In season 1, T3 and T6 (i.e., with 0 N first application) had similar peak concentrations as the control treatment (T7; approximately 5 mg L−1). NO3–N in deep drainage is likely to be affected by previous cultivation in the early growth stages of a new planting, as this phenomenon was not observed in ratoon cultivation in seasons 2 or 3. In season 3, N leaching in T1 and T4 (in which the full N fertilizer application rate was used at the first application) was greater than that in the other treatments. These results suggest that the first N application may cause an increase in the NO3–N concentration in drainage water below the sugarcane root zone. In particular, peak NO3–N concentrations were likely to exceed the threshold of the WHO water quality standards (11 mg L−1) in the plant cropping season (season 1).
N loads have been reported to be 42.1–59.4 kg ha−1 for new plantings with an application of 180 kg ha−1 of N fertilizer and 2.61–7.44 kg ha−1 for ratoon cropping with an application of 200 kg ha−1 of N fertilizer on Tokunoshima Island, which is one of the southwest islands in Japan [27]. The results of our study showed similarly low N loads in ratoon plantings (1–16 kg ha−1) compared to new plantings (37–61 kg ha−1). The N loads in this study (2–241 kg ha−1) were lower than those reported for high N inputs (144–247 kg ha−1) during sugarcane cultivation in Australia [28,29]. Especially in the early sugarcane growth stages in season 1, N leaching occurred in the 0 N application treatment (T7). Therefore, it is important to properly apply N fertilizer immediately after planting in new plantings. Our results showed that the reduction of the first N fertilizer application reduced the underground amounts of N loads (0–19 kg ha−1). However, application of 0 N in the first fertilization would lead to a substantial reduction in yield in all seasons. Because of the large change in the annual rainfall distribution at the time of fertilizer applications, it is considered desirable to establish a cultivation system that uses slow-release N fertilizers and organic materials. These N sources release their N more slowly than urea. Therefore, they would correspond to the N absorption characteristics of sugarcane, which absorbs less N in the early growth stage.
Yield and N uptake were low in season 2 when there was little rainfall from the first to the third applications, followed by typhoons in the high growth season from May–September [30], compared to seasons 1 and 3; hereafter, the discussion regarding seasons 1 and 3 are based on these patterns. The yield of T2 with the applications of half the N application rate for the first application in seasons 1 and 3 was approximately 5% lower than that of T1. The yield of T3 with 0 N used for the first N application was approximately 15% lower than that of T1 (Table 7). Halving the N application rates in the supplementary fertilizer (T4–T6) reduced yields by 9–41%, and yields could not be consistently maintained throughout the three seasons. Except for T7, the levels of N uptake of aboveground sugarcane in this study were higher than the 55.9–68.1 kg ha−1 reported by Chen et al. [31]. N uptake of T1 and T2, as well as sugarcane yields, were at similar levels in seasons 1 (186–188 kg ha−1) and 3 (147–151 kg ha−1). N recovery in our study was higher than that reported in a previous study [17], except for season 2.
Based on the responses of sugarcane yield and N uptake to fertilizer reduction in two of the three years, T2 (with the application of half the amount of basal fertilizer) is considered to be a feasible fertilization practice for farmers in Okinawa prefecture. Reducing the amount of N in the first application (i.e., replacing T1 with T2) improved the N recovery by 9.7–11.9% and reduced N leaching by 13 kg ha−1. These results suggest that the half-reduction of N in the first application contributed to improving the efficiency of N fertilizer use and reducing N loss.
Author Contributions
Conceptualization, methodology, K.O., S.G., T.A., and S.A.; software, validation, formal analysis, K.O.; investigation, K.O. and S.G.; resources, data curation, writing—original draft preparation, K.O.; writing—review and editing, K.O., S.G., T.A., and S.A.; visualization, K.O.; supervision, S.A.; project administration, K.O. and S.G.; funding acquisition, K.O., S.G., T.A., and S.A. All authors have read and agreed to the published version of the manuscript.
Funding
This research received no external funding.
Institutional Review Board Statement
Not applicable.
Informed Consent Statement
Not applicable.
Data Availability Statement
The data presented in this study are available in the article.
Acknowledgments
We would like to express our sincere gratitude to Yoshifumi Terajima of the Japan International Research Center for Agricultural Sciences (JIRCAS) for providing materials and advice on this study, and to Masahide Maetsu of the Technical Support Office of JIRCAS for cooperation in maintaining the observation equipment.
Conflicts of Interest
The authors declare no conflict of interest.
References
- Sutton, M.A.; Oenema, O.; Erisman, J.W.; Leip, A.; van Grinsven, H.; Winiwarter, W. Too much of a good thing. Nature 2011, 472, 159–161. [Google Scholar] [CrossRef] [PubMed] [Green Version]
- Van Grinsven, H.J.; Tiktak, A.; Rougoor, C.W. Evaluation of the Dutch implementation of the nitrates directive, the water framework directive and the national emission ceilings directive. Njas-Wagening. J. Life Sci 2016, 78, 69–84. [Google Scholar] [CrossRef] [Green Version]
- WHO. Guidelines for Drinking-Water Quality, 4th ed.; World Health Organization: Geneve, Switzerland, 2011; pp. 398–403. [Google Scholar]
- Goto, S.; Ando, S.; Anzai, T. Estimation of nitrogen load at sugarcane cultivation area in northern Negros Island, the Philippines. J. Jpn. Agric. Syst Soc. 2017, 33, 57–63. (In Japanese) [Google Scholar]
- Iizumi, Y.; Nitta, N.; Omori, K. Groundwater chemistry and pollution by nitrate-nitrogen: The current situation and potential countermeasures on Majuro Atoll, Republic of the Marshall Islands. J. Jpn. Assoc. Hydrol. Sci. 2018, 48, 81–93. (In Japanese) [Google Scholar] [CrossRef]
- Nakanishi, Y.; Yamamoto, Y.; Park, K.; Kato, S.; Kumazawa, K. Estimation and verification of origins of groundwater nitrate by using δ15N values. J. Sci Soil Manure 1995, 66, 544–551. (In Japanese) [Google Scholar]
- Mezaki, S. Minamishima no Chikei, 2nd ed.; Okinawa Shuppan: Okinawa, Japan, 2008; pp. 4–7. (In Japanese) [Google Scholar]
- Nakanishi, Y. Effective fertilizer application in sugarcane cultivation to reduce eutrophication and acidification of coral reef seas. J. Jpn. Coral Reef Soc. 2017, 19, 109–118. (In Japanese) [Google Scholar] [CrossRef] [Green Version]
- Hiyane, S. Sugarcane cultivation. In JIRCAS International Agriculture Series, A Guide for Sugarcane in Japan, 1st ed.; Takagi, H., Sato, M., Matuoka, M., Eds.; Japan International Research Center for Agricultural Science (JIRCAS): Ibaraki, Japan, 2005; Volume 14, pp. 154–196. [Google Scholar]
- Matsuoka, M. Sugarcane cultivation and sugar industry in Japan. Sugar Tech. 2006, 8, 3–9. [Google Scholar] [CrossRef]
- Department of Agriculture, Forestry and Fisheries, Okinawa Prefectural Government. Manual Guide for Sugarcane Cultivation; Okinawa Prefectural Government: Okinawa, Japan, 2018; pp. 10–12. (In Japanese)
- Nakanishi, Y. Correlation between actual fertilizing to sugarcane and nitrate concentration in groundwater of Miyako Island, Okinawa. Jpn. J. Soil Sci Plant. Nutr 2001, 72, 499–504. (In Japanese) [Google Scholar]
- Yamane, I.; Kume, T.; Gotou, S. Research on the actual condition of underground water in the Amami Islands. Kyushu Agric. Res. 2004, 66, 66–68. (In Japanese) [Google Scholar]
- Terauchi, T.; Matsuoka, M. Ideal characteristics for the early growth of sugarcane. Jpn. J. Crop. Sci 2000, 69, 286–292. (In Japanese) [Google Scholar] [CrossRef] [Green Version]
- Terauchi, T. State of sugarcane production and problem for sugar yield improvement. Jpn. J. Crop. Sci 2002, 71, 297–307. (In Japanese) [Google Scholar] [CrossRef]
- Fukuzawa, Y.; Kawamitsu, Y.; Komiya, Y.; Ueno, M. Biomass production characteristics of sugarcane at initial growth stage. Jpn. J. Crop. Sci 2008, 77, 54–60. (In Japanese) [Google Scholar] [CrossRef]
- Kingstone, G. Mineral nutrition of sugarcane. In Sugarcane: Physiology, Biochemistry, and Functional Biology, 1st ed.; Moore, P., Botha, F., Eds.; John Wiley & Sons, Inc.: Hoboken, NJ, USA, 2014; Volume 1, pp. 85–120. [Google Scholar]
- Kaji, T.; Nagatomo, M. Utilization of nitrogen applied on sugarcane using 15N tracer technique. Bull. Kagoshima Prefect. Inst. Agric. Development. 2008, 2, 43–51. (In Japanese) [Google Scholar]
- Anzai, T.; Goto, S.; Ando, S.; Inosako, K.; Espanto, B.P.; Saito, T. Utilization of nitrogen fertilizer in the early growth stage of sugarcane and leaching of nitrate-nitrogen: A case study on Negros Island, the Philippines. Trop Agr Dev. 2017, 61, 184–193. [Google Scholar]
- Martin, E.C.; Loudon, T.L.; Ritchie, J.T.; Werner, A. Use of drainage lysimeters to evaluate nitrogen and irrigation management strategies to minimize nitrate leaching in maize production. Trans. Asae 1994, 37, 79–83. [Google Scholar] [CrossRef]
- Hossain, A.; Yoshinaga, A.; Gibo, S.; Sakai, K. Determination of the critical pF level for optimum water use in sugarcane (Saccharum officinarum L.) production. Trans. Jpn. Soc. Irrig Drain. Reclam Eng. 2002, 220, 454–464. [Google Scholar]
- Tashiro, Y.; Takahira, K. Long term trend of nitrogen emission and nitrogen concentration of groundwater in Miyako Island, Okinawa. J. Jpn. Soc. Water Environ. 2001, 24, 733–738. (In Japanese) [Google Scholar] [CrossRef] [Green Version]
- Varvel, G.E.; Peterson, T.A. Nitrogen fertilizer recovery by corn in monoculture and rotation systems. Agron J. 1990, 82, 935–938. [Google Scholar] [CrossRef]
- R Core Team. R: A Language and Environment for Statistical Computing; R Foundation for Statistical Computing: Vienna, Austria; Available online: https://www.R-project.org/ (accessed on 25 November 2019).
- Armour, J.D.; Nelson, P.N.; Danieles, J.W.; Rasiah, V.; Inman-Bamber, N.G. Nitrogen leaching from the root zone of sugarcane and bananas in the humid tropics of Australia. Agric. Ecosyst Environ. 2013, 180, 68–78. [Google Scholar] [CrossRef]
- Gihberto, P.J.; Libardi, P.L.; Brito, A.S.; Trivelin, P.C.O. Leaching of nutrients from a sugarcane crop growing on an ultisol in Brazil. Agric. Water Manag 2009, 96, 1443–1448. [Google Scholar] [CrossRef]
- Inoue, K. Investigation of sugarcane cultivation practices with regard to different varietal characteristics and soil types. Bull. Kagoshima Prefect Inst. Agric. Dev. 2018, 12, 31–89. [Google Scholar]
- Stewart, L.K.; Charlesworth, P.B.; Bristow, K.L.; Thorburn, P.J. Estimating deep drainage and nitrate leaching from the root zone under sugarcane using APSIM-SWIM. Agric. Water Manag. 2006, 81, 315–334. [Google Scholar] [CrossRef]
- Thorburn, P.J.; Biggs, J.S.; Attard, S.J.; Kemei, J. Environmental impacts of irrigated sugarcane production: Nitrogen lost through runoff and leaching. Agric. Ecosyst. Environ. 2011, 144, 1–12. [Google Scholar] [CrossRef]
- Miyazato, K. Satoukibi to Sonosaibai; Nihon Bunmitsutou Kougyoukai: Okinawa, Japan, 1986; pp. 257–294. (In Japanese) [Google Scholar]
- Chen, Y.; Shinogi, Y.; Taira, E. Influence of biochar use on sugarcane growth, soil parameters, and groundwater quality. Aust. J. Soil Res. 2010, 48, 526–530. (In Japanese) [Google Scholar] [CrossRef]
Figure 1.
Average monthly climate data of the Japan International Research Center for Agricultural Sciences of Tropical Agricultural Research Front (JIRCAS–TARF) (2004–2019); rain, mean monthly rainfall (mm); radn, mean daily solar radiation (MJ m−2); Tmax, mean daily maximum temperature (°C); Tmin, mean daily minimum temperature (°C).

Figure 2.
Layout of lysimeters with N treatments. Treatments (T1–T7) refer to the different N fertilizer application treatments shown in Table 2.
Figure 2.
Layout of lysimeters with N treatments. Treatments (T1–T7) refer to the different N fertilizer application treatments shown in Table 2.

Figure 3.
Outline of observations of soil moisture and drainage water.

Figure 4.
Cumulative rainfall and deep drainage under different N treatments (T1–T7) in: (a) season 1; (b) season 2; and (c) season 3. Treatments refer to the different N application rates shown in Table 2.
Figure 4.
Cumulative rainfall and deep drainage under different N treatments (T1–T7) in: (a) season 1; (b) season 2; and (c) season 3. Treatments refer to the different N application rates shown in Table 2.


Figure 5.
Mean monthly NO3–N concentrations in the drainage water of different treatments (T1–T7) and monthly rainfall. Treatments refer to the different N fertilizer application rates shown in Table 2.
Figure 5.
Mean monthly NO3–N concentrations in the drainage water of different treatments (T1–T7) and monthly rainfall. Treatments refer to the different N fertilizer application rates shown in Table 2.

Figure 6.
Cumulative rainfall and N loads in deep drainage under different N treatments: (a) season 1; (b) season 2; and (c) season 3. Treatments (T1–T7) refer to the different N application rates shown in Table 2.
Figure 6.
Cumulative rainfall and N loads in deep drainage under different N treatments: (a) season 1; (b) season 2; and (c) season 3. Treatments (T1–T7) refer to the different N application rates shown in Table 2.


Table 1.
Bulk density (BD), hydraulic conductivity (KS), particle size distribution (sand, silt, clay), total carbon (C), and total N of soil samples.
Table 1.
Bulk density (BD), hydraulic conductivity (KS), particle size distribution (sand, silt, clay), total carbon (C), and total N of soil samples.
| Depth | BD | KS | Sand | Silt | Clay | Total C | Total N |
|---|---|---|---|---|---|---|---|
| (cm) | (g cm−3) | (cm sec−1) | (%) | (%) | (%) | (%) | (%) |
| 0–15 | 1.53 | 1.28 × 10⁻² | 68 | 20 | 12 | 0.417 | 0.040 |
| 15–30 | 1.52 | 1.07 × 10⁻² | 71 | 17 | 12 | 0.433 | 0.040 |
| 30–60 | 1.34 | 1.57 × 10⁻² | 57 | 17 | 26 | 0.353 | 0.034 |
| 60–90 | 1.26 | 9.41 × 10⁻³ | 55 | 18 | 27 | 0.252 | 0.036 |
| 90–120 | 1.34 | 5.53 × 10⁻³ | 53 | 17 | 30 | 0.304 | 0.039 |
Table 2.
N fertilizer application rates used in the first, second, and third applications for each treatment (T1–T7).
Table 2.
N fertilizer application rates used in the first, second, and third applications for each treatment (T1–T7).
| Treatment | N Application Rate (kg ha−1) | |||
|---|---|---|---|---|
| 1st | 2nd | 3rd | Total | |
| T1 | 70 | 60 | 100 | 230 |
| T2 | 35 | 60 | 100 | 195 |
| T3 | 0 | 60 | 100 | 160 |
| T4 | 70 | 30 | 50 | 150 |
| T5 | 35 | 30 | 50 | 115 |
| T6 | 0 | 30 | 50 | 80 |
| T7 | 0 | 0 | 0 | 0 |
Table 3.
Effects of reductions of the first, second, and third N fertilizer application rates on drainage, initial soil water at the beginning of the season (Initial SW), soil water change (SW change), and N load in season 1.
Table 3.
Effects of reductions of the first, second, and third N fertilizer application rates on drainage, initial soil water at the beginning of the season (Initial SW), soil water change (SW change), and N load in season 1.
| Rainfall and Fertilization Conditions | Drainage | Initial SW | SW Change | N Load | |
|---|---|---|---|---|---|
| Total Rainfall (mm) | Treatments | (mm) | (mm) | (mm) | (kg ha−1) |
| 2550 | T1 | 1579 | 446 | −63 | 61.1 |
| T2 | 1522 | 414 | −56 | 48.4 | |
| T3 | 1549 | 417 | −44 | 41.8 | |
| T4 | 1586 | 438 | −45 | 50.9 | |
| T5 | 1587 | 426 | −28 | 49.5 | |
| T6 | 1600 | 442 | −46 | 42.2 | |
| T7 | 1769 | 462 | −16 | 37.4 | |
| Analysis of variance | |||||
| First N rates | N.S. | N.S. | N.S. | * | |
| Second and third N rates | N.S. | N.S. | N.S. | N.S. | |
| First N rates × second and third N rates | N.S. | N.S. | N.S. | N.S. | |
Treatments (T1–T7) refer to the different N application rates shown in Table 2. N.S. represents non-significant. *, **, and *** indicate significant differences at p < 0.05, p < 0.01, and p < 0.001, respectively.
Table 4.
Effects of reductions of the first, second, and third N fertilizer application rates on drainage, initial soil water at the beginning of the season (Initial SW), soil water change (SW change), and N load in season 2.
Table 4.
Effects of reductions of the first, second, and third N fertilizer application rates on drainage, initial soil water at the beginning of the season (Initial SW), soil water change (SW change), and N load in season 2.
| Rainfall and Fertilization Conditions | Drainage | Initial SW | SW Change | N Load | |
|---|---|---|---|---|---|
| Total Rainfall (mm) | Treatments | (mm) | (mm) | (mm) | (kg ha−1) |
| 2332 | T1 | 1612 | 412 | 33 | 1.4 |
| T2 | 1548 | 387 | 30 | 0.9 | |
| T3 | 1611 | 401 | 27 | 1.6 | |
| T4 | 1655 | 411 | 26 | 0.9 | |
| T5 | 1661 | 417 | 30 | 0.8 | |
| T6 | 1690 | 420 | 18 | 0.9 | |
| T7 | 1786 | 433 | 22 | 0.7 | |
| Analysis of variance | |||||
| First N rates | N.S. | N.S. | N.S. | ** | |
| Second and third N rates | N.S. | N.S. | N.S. | *** | |
| First N rates × second and third N rates | N.S. | N.S. | N.S. | ** | |
Treatments (T1–T7) refer to the different N application rates shown in Table 2. N.S. represents non-significant. *, **, and *** indicate significant differences at p < 0.05, p < 0.01, and p < 0.001, respectively.
Table 5.
Effects of reductions of the first, second, and third N fertilizer application rates on drainage, initial soil water at the beginning of the season (Initial SW), soil water change (SW change), and N load in season 3.
Table 5.
Effects of reductions of the first, second, and third N fertilizer application rates on drainage, initial soil water at the beginning of the season (Initial SW), soil water change (SW change), and N load in season 3.
| Rainfall and Fertilization Conditions | Drainage | Initial SW | SW Change | N Load | |
|---|---|---|---|---|---|
| Total Rainfall (mm) | Treatment | (mm) | (mm) | (mm) | (kg ha−1) |
| 2797 | T1 | 1815 | 386 | −35 | 16.1 |
| T2 | 1834 | 365 | −30 | 2.9 | |
| T3 | 2026 | 381 | −27 | 2.4 | |
| T4 | 1906 | 387 | −28 | 13.5 | |
| T5 | 2060 | 390 | −27 | 3.5 | |
| T6 | 2029 | 407 | −29 | 1.1 | |
| T7 | 2094 | 416 | −22 | 0.9 | |
| Analysis of variance | |||||
| First N rates | N.S. | N.S. | N.S. | *** | |
| Second and third N rates | N.S. | N.S. | N.S. | N.S. | |
| First N rates × second and third N rates | N.S. | N.S. | N.S. | N.S. | |
Treatments (T1–T7) refer to the different N application rates shown in Table 2. N.S. represents non-significant. *, **, and *** indicate significant differences at p < 0.05, p < 0.01, and p < 0.001, respectively.
Table 6.
Effects of reductions of the first, second, and third N fertilizer application rates on drainage, initial soil water in the beginning of the season (initial SW), soil water change (SW change), and N load in the whole season.
Table 6.
Effects of reductions of the first, second, and third N fertilizer application rates on drainage, initial soil water in the beginning of the season (initial SW), soil water change (SW change), and N load in the whole season.
| Rainfall and Fertilization Conditions | Drainage | Initial SW | SW Change | N Load | |
|---|---|---|---|---|---|
| Total Rainfall (mm) | Treatments | (mm) | (mm) | (mm) | (kg ha−1) |
| 7679 | T1 | 5006 | 446 | −63 | 78.7 |
| T2 | 4904 | 414 | −56 | 52.2 | |
| T3 | 5185 | 417 | −44 | 45.8 | |
| T4 | 5147 | 438 | −45 | 65.3 | |
| T5 | 5308 | 426 | −28 | 53.7 | |
| T6 | 5319 | 442 | −46 | 44.1 | |
| T7 | 5649 | 462 | −16 | 38.9 | |
| Analysis of variance | |||||
| First N rates | N.S. | N.S. | N.S. | ** | |
| Second and third N rates | ** | N.S. | N.S. | N.S. | |
| First N rates × second and third N rates | N.S. | N.S. | N.S. | N.S. | |
Treatments (T1–T7) refer to the different N application rates shown in Table 2. N.S. represents non-significant. *, **, and *** indicate significant differences at p < 0.05, p < 0.01 and p < 0.001, respectively.
Table 7.
Sugarcane yield (Yield), N balance (N rain, N fertilizer [N fer], N uptake by crops [N upt], N loads, soil N change [ΔN soil]), and N recovery.
Table 7.
Sugarcane yield (Yield), N balance (N rain, N fertilizer [N fer], N uptake by crops [N upt], N loads, soil N change [ΔN soil]), and N recovery.
| Season/ | Yield | N Balance (kg ha−1) | N Recovery | ||||
|---|---|---|---|---|---|---|---|
| Treatment | (tons ha−1) | N Rain | N Fer | N Upt | N Loads | ΔN Soil | (%) |
| S1/T1 | 91 | 13 | 230 | 186 | 61 | −5 | 47.8 |
| S1/T2 | 89 | 13 | 195 | 188 | 48 | −29 | 57.5 |
| S1/T3 | 77 | 13 | 160 | 168 | 42 | −37 | 57.2 |
| S1/T4 | 83 | 13 | 150 | 153 | 51 | −41 | 51.1 |
| S1/T5 | 75 | 13 | 115 | 148 | 49 | −69 | 62.1 |
| S1/T6 | 72 | 13 | 80 | 126 | 42 | −75 | 62.1 |
| S1/T7 | 40 | 13 | 0 | 76 | 37 | −101 | - |
| S2/T1 | 81 | 12 | 230 | 112 | 1 | 128 | 39.0 |
| S2/T2 | 66 | 12 | 195 | 91 | 1 | 114 | 35.1 |
| S2/T3 | 59 | 12 | 160 | 71 | 2 | 99 | 29.9 |
| S2/T4 | 60 | 12 | 150 | 61 | 1 | 100 | 25.6 |
| S2/T5 | 50 | 12 | 115 | 60 | 1 | 66 | 32.2 |
| S2/T6 | 45 | 12 | 80 | 45 | 1 | 46 | 27.4 |
| S2/T7 | 18 | 12 | 0 | 23 | 1 | −12 | - |
| S3/T1 | 93 | 14 | 230 | 147 | 16 | 81 | 54.9 |
| S3/T2 | 87 | 14 | 195 | 151 | 3 | 55 | 66.8 |
| S3/T3 | 81 | 14 | 160 | 131 | 2 | 41 | 68.8 |
| S3/T4 | 73 | 14 | 150 | 93 | 14 | 57 | 48.3 |
| S3/T5 | 70 | 14 | 115 | 82 | 3 | 44 | 53.3 |
| S3/T6 | 55 | 14 | 80 | 62 | 1 | 30 | 52.3 |
| S3/T7 | 23 | 14 | 0 | 21 | 1 | −8 | - |
| S1/Ave 1 | 75 | 13 | 133 | 149 | 47 | −51 | 56.3 |
| S2/Ave | 54 | 12 | 133 | 66 | 1 | 77 | 31.5 |
| S3/Ave | 69 | 14 | 133 | 98 | 6 | 43 | 57.4 |
1 Ave refers to the mean arithmetic average between treatments in the same season.
Publisher’s Note: MDPI stays neutral with regard to jurisdictional claims in published maps and institutional affiliations. |
© 2021 by the authors. Licensee MDPI, Basel, Switzerland. This article is an open access article distributed under the terms and conditions of the Creative Commons Attribution (CC BY) license (http://creativecommons.org/licenses/by/4.0/).
Share and Cite
MDPI and ACS Style
Okamoto, K.; Goto, S.; Anzai, T.; Ando, S. Nitrogen Leaching and Nitrogen Balance under Differing Nitrogen Fertilization for Sugarcane Cultivation on a Subtropical Island. Water 2021, 13, 740. https://doi.org/10.3390/w13050740
AMA Style
Okamoto K, Goto S, Anzai T, Ando S. Nitrogen Leaching and Nitrogen Balance under Differing Nitrogen Fertilization for Sugarcane Cultivation on a Subtropical Island. Water. 2021; 13(5):740. https://doi.org/10.3390/w13050740
Chicago/Turabian StyleOkamoto, Ken, Shinkichi Goto, Toshihiko Anzai, and Shotaro Ando. 2021. "Nitrogen Leaching and Nitrogen Balance under Differing Nitrogen Fertilization for Sugarcane Cultivation on a Subtropical Island" Water 13, no. 5: 740. https://doi.org/10.3390/w13050740
Note that from the first issue of 2016, this journal uses article numbers instead of page numbers. See further details here.