
Virtual Water Trade in the Yellow River Economic Belt: A Multi-Regional Input-Output Model


School of Economics & Management, Huazhong Agricultural University, Wuhan 430070, China
*
Authors to whom correspondence should be addressed.
Water 2021, 13(6), 748; https://doi.org/10.3390/w13060748
Submission received: 2 February 2021
/
Revised: 26 February 2021
/
Accepted: 5 March 2021
/
Published: 10 March 2021
Abstract
:The sustainable and efficient use of water resources has gained wide social concern, and the key point is to investigate the virtual water trade of the water-scarcity region and optimize water resources allocation. In this paper, we apply a multi-regional input-output model to analyze patterns and the spillover risks of the interprovincial virtual water trade in the Yellow River Economic Belt, China. The results show that: (1) The agriculture and supply sector as well as electricity and hot water production own the largest total water use coefficient, being high-risk water use sectors in the Yellow River Economic Belt. These two sectors also play a major role in the inflow and outflow of virtual water; (2) The overall situation of the Yellow River Economic Belt is virtual water inflow, but the pattern of virtual water trade between eastern and western provinces is quite different. Shandong, Henan, Shaanxi, and Inner Mongolia belong to the virtual water net inflow area, while the virtual water net outflow regions are concentrated in Shanxi, Gansu, Xinjiang, Ningxia, and Qinghai; (3) Due to higher water resource stress, Shandong and Shanxi suffer a higher cumulative risk through virtual water trade. Also, Shandong, Henan, and Inner Mongolia have a higher spillover risk to other provinces in the Yellow River Economic Belt.
1. Introduction
The sustainable and efficient use of water resources has gained wide social concern [1,2]. On the one hand, rapid economic development, population growth, and changes in lifestyles have led to a higher demand for freshwater [3,4,5], and the increasing modern agriculture and irrigation systems exacerbated water consumption [6,7]. A report by the Organization for Economic Cooperation and Development (OECD) showed that the global water demand is projected to increase by 55% by 2050, which will exacerbate the global water insufficiency. On the other hand, freshwater resources have increasingly become scarce, especially in northern China [8]. As Wang et al. [9] estimated, the lower reach of the Yellow River (the second largest river in China) dried up for 226 days and significantly influenced socio-economic activities in downstream rivers of China. In recent years, extreme climate disasters [10], vegetation destruction, and excessive reclamation have been considered as other important drivers of water scarcity [5,7,11]. Scarcity may cause water crises, potential water conflicts, and even water wars, which can pose significant threats to water security and food production around the world [12,13,14,15]. Omer et al. [16] argued that the quantity of freshwater will decrease in many areas under climate change due to more frequent and more pronounced drought events. Zeitoun et al. [17] emphasized the importance of virtual water trade and dry farming in water security. Therefore, it is crucial to optimize the allocation of water resources.
The first step is to investigate the amount of water resources used by economic sectors, and the flow of water resources attached to sectors. Allan [18] introduced the concept of “virtual water” to map the water demand and consumption of products, which is similar to the concept of water footprint. Virtual water refers to the amount of water used in the production process of products or services, namely the volume of virtual water embodied in the product [18]. Based on the concepts of virtual water, virtual water trade was also proposed and widely used for allocating regional water flow, saving water resources [3,18], and alleviating water shortage [19,20]. According to trade theory, regions can gain welfare from trade if they specialize in producing goods and services with a comparative advantage. Therefore, the export of water-intensive commodities from water-abundant to water-scarce regions can allow the latter to gain more water resources. Hoekstra [21] found that global water interdependencies and overseas externalities are increasing with the increase of globalization of trade. The interregional flow of virtual water could also alleviate the mismatch in the spatial distribution of domestic water resources and water requirements [22]. Antonelli and Greco [23] analyzed the relationship between water and food security through a comprehensive, multidisciplinary approach. It shows that the sustainability of water depends on the extent to which societies recognize and take into account the value of water and its contribution to grain production.
However, virtual water trade might also increase the water scarcity risk of exporting regions [24]. For example, some studies indicated that, surprisingly, the water-scarce regions in northern China export water-intensive goods to the water-rich southern China. It may be exacerbating water scarcity in northern China [25]. As Tian et al. [2] noted, most provinces of northern China are in moderate or extreme water shortage where the water resource per capita is much less than 2000 m3. The local hydrological ecology will be damaged if they maintain the net virtual water export. Therefore, it is essential to investigate the virtual water trade of the water-scarcity region.
There has been abundant research on virtual water trade in recent years. From the quantitative perspective of virtual water trade, two kinds of methods are generally used to calculate the amount of virtual water trade. The first is a volume of virtual water trade embodied in the food trade [26,27,28]. For example, Hoekstra and Chapagain [26] quantified the volumes of virtual water flows between nations related to international crop trade and found the annual average virtual water flows was 695 Gm3 during the period 1995–1999. Lamastra et al. [29] investigated the virtual water trade of agri-food products from Italian–Chinese relations and found that China could save water about 1559.78 million m3 through food trade with Italy, and 95% of virtual water imported is related to animal products. However, this approach cannot be easily applied to industrial and tertiary products [2].
Another method is input-output analysis. The advantage of the input-output model is that it could efficiently distinguish the direct virtual water consumption from indirect virtual water consumption and consider the intermediate input of products to avoid repeated count [21,30,31,32]. This approach can be further classified into single-regional input-output model and multi-regional input-output model [33]. The former assumes that imported goods and services are being produced with the same technology as the domestic technology in the same sector for simplicity, thus will cause larger uncertainty [34,35]. Moreover, based on the single regional input-output table, it is impossible to calculate interprovincial virtual water flow. Multi-regional input-output analysis is a more comprehensive tool for clarifying the interdependent connections between economic sectors among different regions [33,35]. It depends on the regional economic input–output tables and trade data, that can the flows of resources derived from source (produced in one region) to destination (consumed in another region) [36,37]. Therefore, recent research extended the single-regional input-output model into multi-regional input-output to consider the trade relationship between multiple areas [22,38,39,40]. Qasemipour et al. [41] adopted this approach to assess the virtual water flows in Iran. Based on the virtual water trade, some recent studies further estimated the spillover risk of virtual water trade [42,43]. For example, Qu et al. [44] discussed the impact of the risk of local water shortage on global virtual water trade. Liu and Chen [32] combined a multi-regional input-output analysis with a network environment analysis to assess the risk of water scarcity in the trading system.
In this paper, we seek to estimate the virtual water trade in the Yellow River Economic Belt (YREB), China. YREB is one of the most severely water-scarce areas in China, and water scarcity has directly affected the sustainable development of the economy and society. However, to the best of our knowledge, limited research has investigated the intraregional and interregional virtual water flow of YREB. Therefore, we select nine provinces of the YREB to assess the virtual water flow in YREB using the multi-regional input-output model. First, we calculate the water use coefficient of YREB, and then estimate the virtual water trade between different sectors and provinces. Second, based on the virtual water trade, we construct a cumulative risk index of spillover to investigate the spillover risk of provincial trade in YREB.
2. Materials and Methods
2.1. Study Area
The YREB is one of the greatest comprehensive economic regions in northern China with a total area of about 4.76 million km2. The total GDP of the YREB reached 12,338.05 billion RMB in 2012. The region covers nine provinces, including Henan, Shandong, Shanxi, Shaanxi, Inner Mongolia, Ningxia, Gansu, Qinghai, and Xinjiang [8,31]. With 23.78% of China’s GDP and 25.83% of China’s population, the YREB is not only related to the green and circular economic development of northern China but also bound up with regional water security and food security [45]. In recent years, with the decline of groundwater level, water resources tensions in this region have become increasingly severe. Furthermore, with the instability of precipitation, the increase of temperature, and the aggravation of drought frequency, the sustainability of water resources is threatened [46,47].
The distribution of water resources in YREB is spatial unbalanced. As shown in Table 1, Xinjiang has the maximal water resources with 900.60 × 10² million m3, followed by Qinghai (895.2 × 10² million m3) and Inner Mongolia (510.3 × 10² million m3). Ningxia owns the least amount of water resources, only accounting for about 0.29% of YREB water resources. At the same time, the supply and demand of water resources in some provinces are not matched. For example, the total water consumption in Ningxia is 69.40 × 10² million m3, far exceeding gross water resources of 10.80 × 10² million m3. Gross water resources in Shaanxi, Inner Mongolia, Qinghai, and other places are much larger than the total water consumption. In addition, the amount of water resources is not in harmony with regional economic development level in the YREB. Water resources in the entire economic belt account for 12.3% of the country’s total, but GDP output value accounts for 23.78%. Among provinces, Xinjiang’s GDP output value per unit of water consumption is only 11.05 RMB/m3, and it is far behind Shandong and Henan (RMB is the legal currency of the people’s Republic of China).
2.2. Multi-Regional Input-Output Model
We adopt a multi-regional input-output model to investigate the virtual water flow. The model was first proposed by Leontief [48] to capture the direct and indirect relations between industrial sectors. Thus, we compile the multi-regional input-output table of the YREB based on the data of the multi-regional input-output table of 30 provinces in China in 2012. The table covers 10 regions (the 9 provinces in the YREB occupy 9 regions, and the other provinces of China are regarded as 1 region), and each region contains 30 economic sectors. The input-output balanced formula of region R is calculated as follows:
where is the total output of the i economic sector in the R region. is the input of economic sector in R region to final demand of S region. is the direct input coefficient, which represents the direct input of i economic sector of R region to j economic sector of S region, and is the outflow of the i economic sector in R region.
The matrix form of Equation (1) can be expressed as:
where is the total output matrix, I is the unit matrix, is the direct input coefficient matrix; −1 is the inverse matrix, is the final demand matrix, and is the export matrix. The water resources of each economic sector are drawn into the multi-regional input-output model. And the direct water use coefficient is used to express the direct water consumption of the i economic sector in the R region. The calculation formula is as follows:
where is the total output of the i economic sector in the R region, is the direct water consumption of the i economic sector in the R region. is the direct water use coefficient of the i economic sector in the R region. The direct water use coefficients of all economic sectors constitute the line vector H of direct water use in a single region. And the direct water use coefficient matrix F is composed of the direct water use coefficient vectors of 10 regions as shown in Table 2.
The total water use coefficient matrix Q is calculated by multiplying the direct water use coefficient matrix F and the Leontief inverse matrix. The formula can be expressed as
According to the multi-regional input-output model of YREB, we can calculate the virtual water trade from R region to S region. The calculation of virtual water trade among nine provinces in YREB is as follows:
The calculation of virtual water trade between nine provinces in YREB and other regions is as follows:
where is the virtual water input from other provinces of YREB, and is the virtual water output from YREB to other regions.
2.3. Spillover Risk Analysis of Interprovincial Virtual Water Trade
Spillover risk means that S region will spill the risk of local water shortage to R region if S region consumes water resources in R region through interprovincial trade [42,43,49]. Therefore, quantitative analysis of spillover risk can further explore the causes of water shortage in a region and understand how the water shortage is caused by imports from other areas when the area is a supplier of water-intensive products. According to Meng et al. [42], the spillover risk index can be written as:
where is the spillover risk index from S region to R region, is the amount of virtual water inflow from R region to S region, is the amount of virtual water outflow from R region, and is the water stress index calculated by White et al. [50].
2.4. Data Sources
The input-output table data used in this work is “China’s 30 provinces (autonomous regions, municipalities) multi-regional input-output table in 2012” compiled by the China Emission Accounts and Datasets (CEADs), covering 30 economic sectors. This multi-regional input-output table is a relatively new input-output data in China, including 1 agricultural sector, 24 industrial sectors and 5 service sectors. The water consumption data of the agriculture sector of provinces in YREB is available from the China Statistical Yearbook of 2013. The water consumption data of various industrial and service sectors are accessible by applying the method suggested by Zhang et al. [22]. According to the water consumption of industrial and service sectors in different industries in the “China Economic Census Yearbook 2008”, the water consumption of various industrial and service sectors in 2012 is calculated by using the economic growth rate. Moreover, the water stress index (WSI) of each province in YREB employed in this paper is estimated by Pfister et al. [51]. Detailed data can be found in Supplementary Materials.
3. Results
3.1. Water Use Coefficient of Sectors in the Yellow River Economic Belt
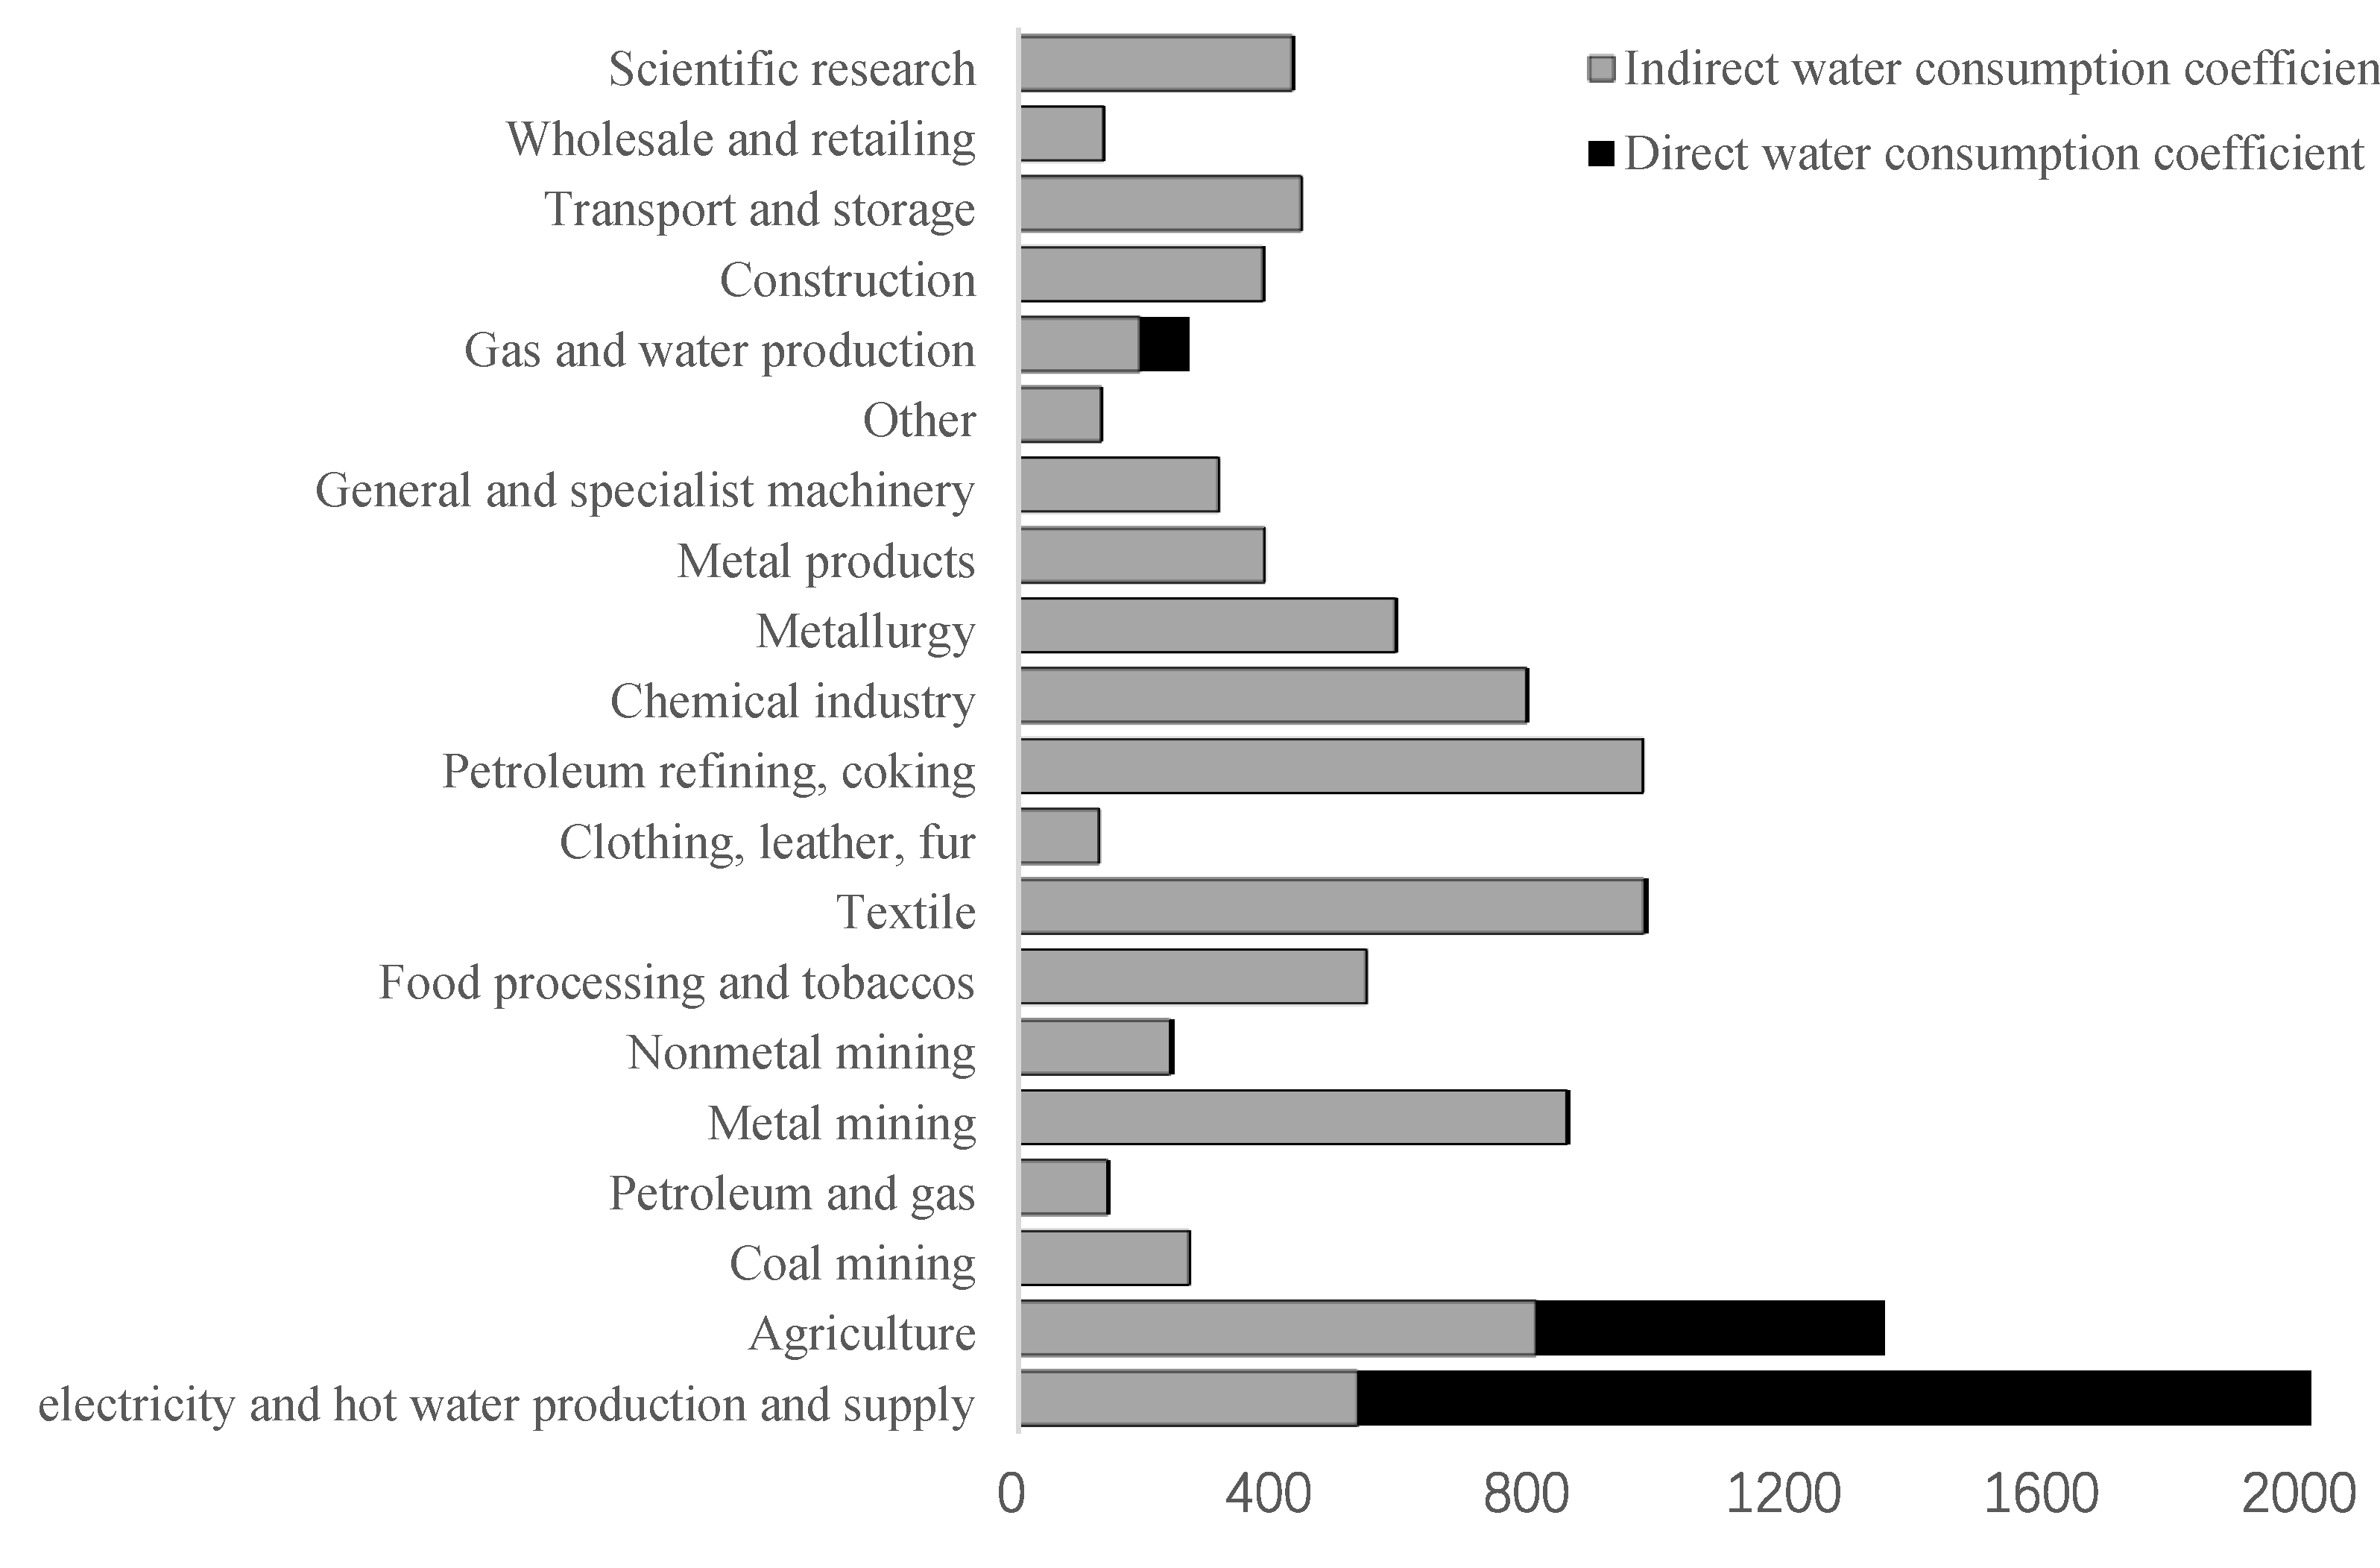
We first estimate the water use coefficients of different sectors in YREB. Direct water use coefficient and total water use coefficient can both identify the water use risk level of different sectors. The former reflects the direct demand for water resources of the regional economic sector, while the latter shows the direct and indirect economic relation of water resources among various sectors.
Figure 1 shows the water use coefficient of 30 economic sectors throughout YREB. Specifically, the total water use coefficients of electricity, hot water production, and supply sector and agriculture sector in YREB exceed 1000 m3 per 1000 RMB. These two sectors are high-risk water use sectors. It is consistent with the study by Zhang et al. [52] who showed that these sectors export more virtual water in intermediate products and more virtual water in final products. The total water use coefficients of metal mining, chemical industry, petroleum refining and coking industry are at the medium level, all exceeding 500 m3 per 1000 RMB. Sectors with smaller total water use coefficients include papermaking, printing, transportation equipment, wood processing, furniture services, instruments, hotels and restaurants, all of which are lower than 30 m3 per 1000 RMB. This reflects a low water risk level. We divide the total water use coefficient into direct water use coefficient and indirect water use coefficient. In electricity and hot water production and supply sector, the direct water use coefficient is far greater than the indirect water use coefficient, while the indirect water use coefficient in other sectors is much higher than the direct water use coefficient.
Matlab is a commercial mathematical software produced by MathWorks Company (Natick, MA, USA).
3.2. Virtual Water Trade of Sectors in the Yellow River Economic Belt
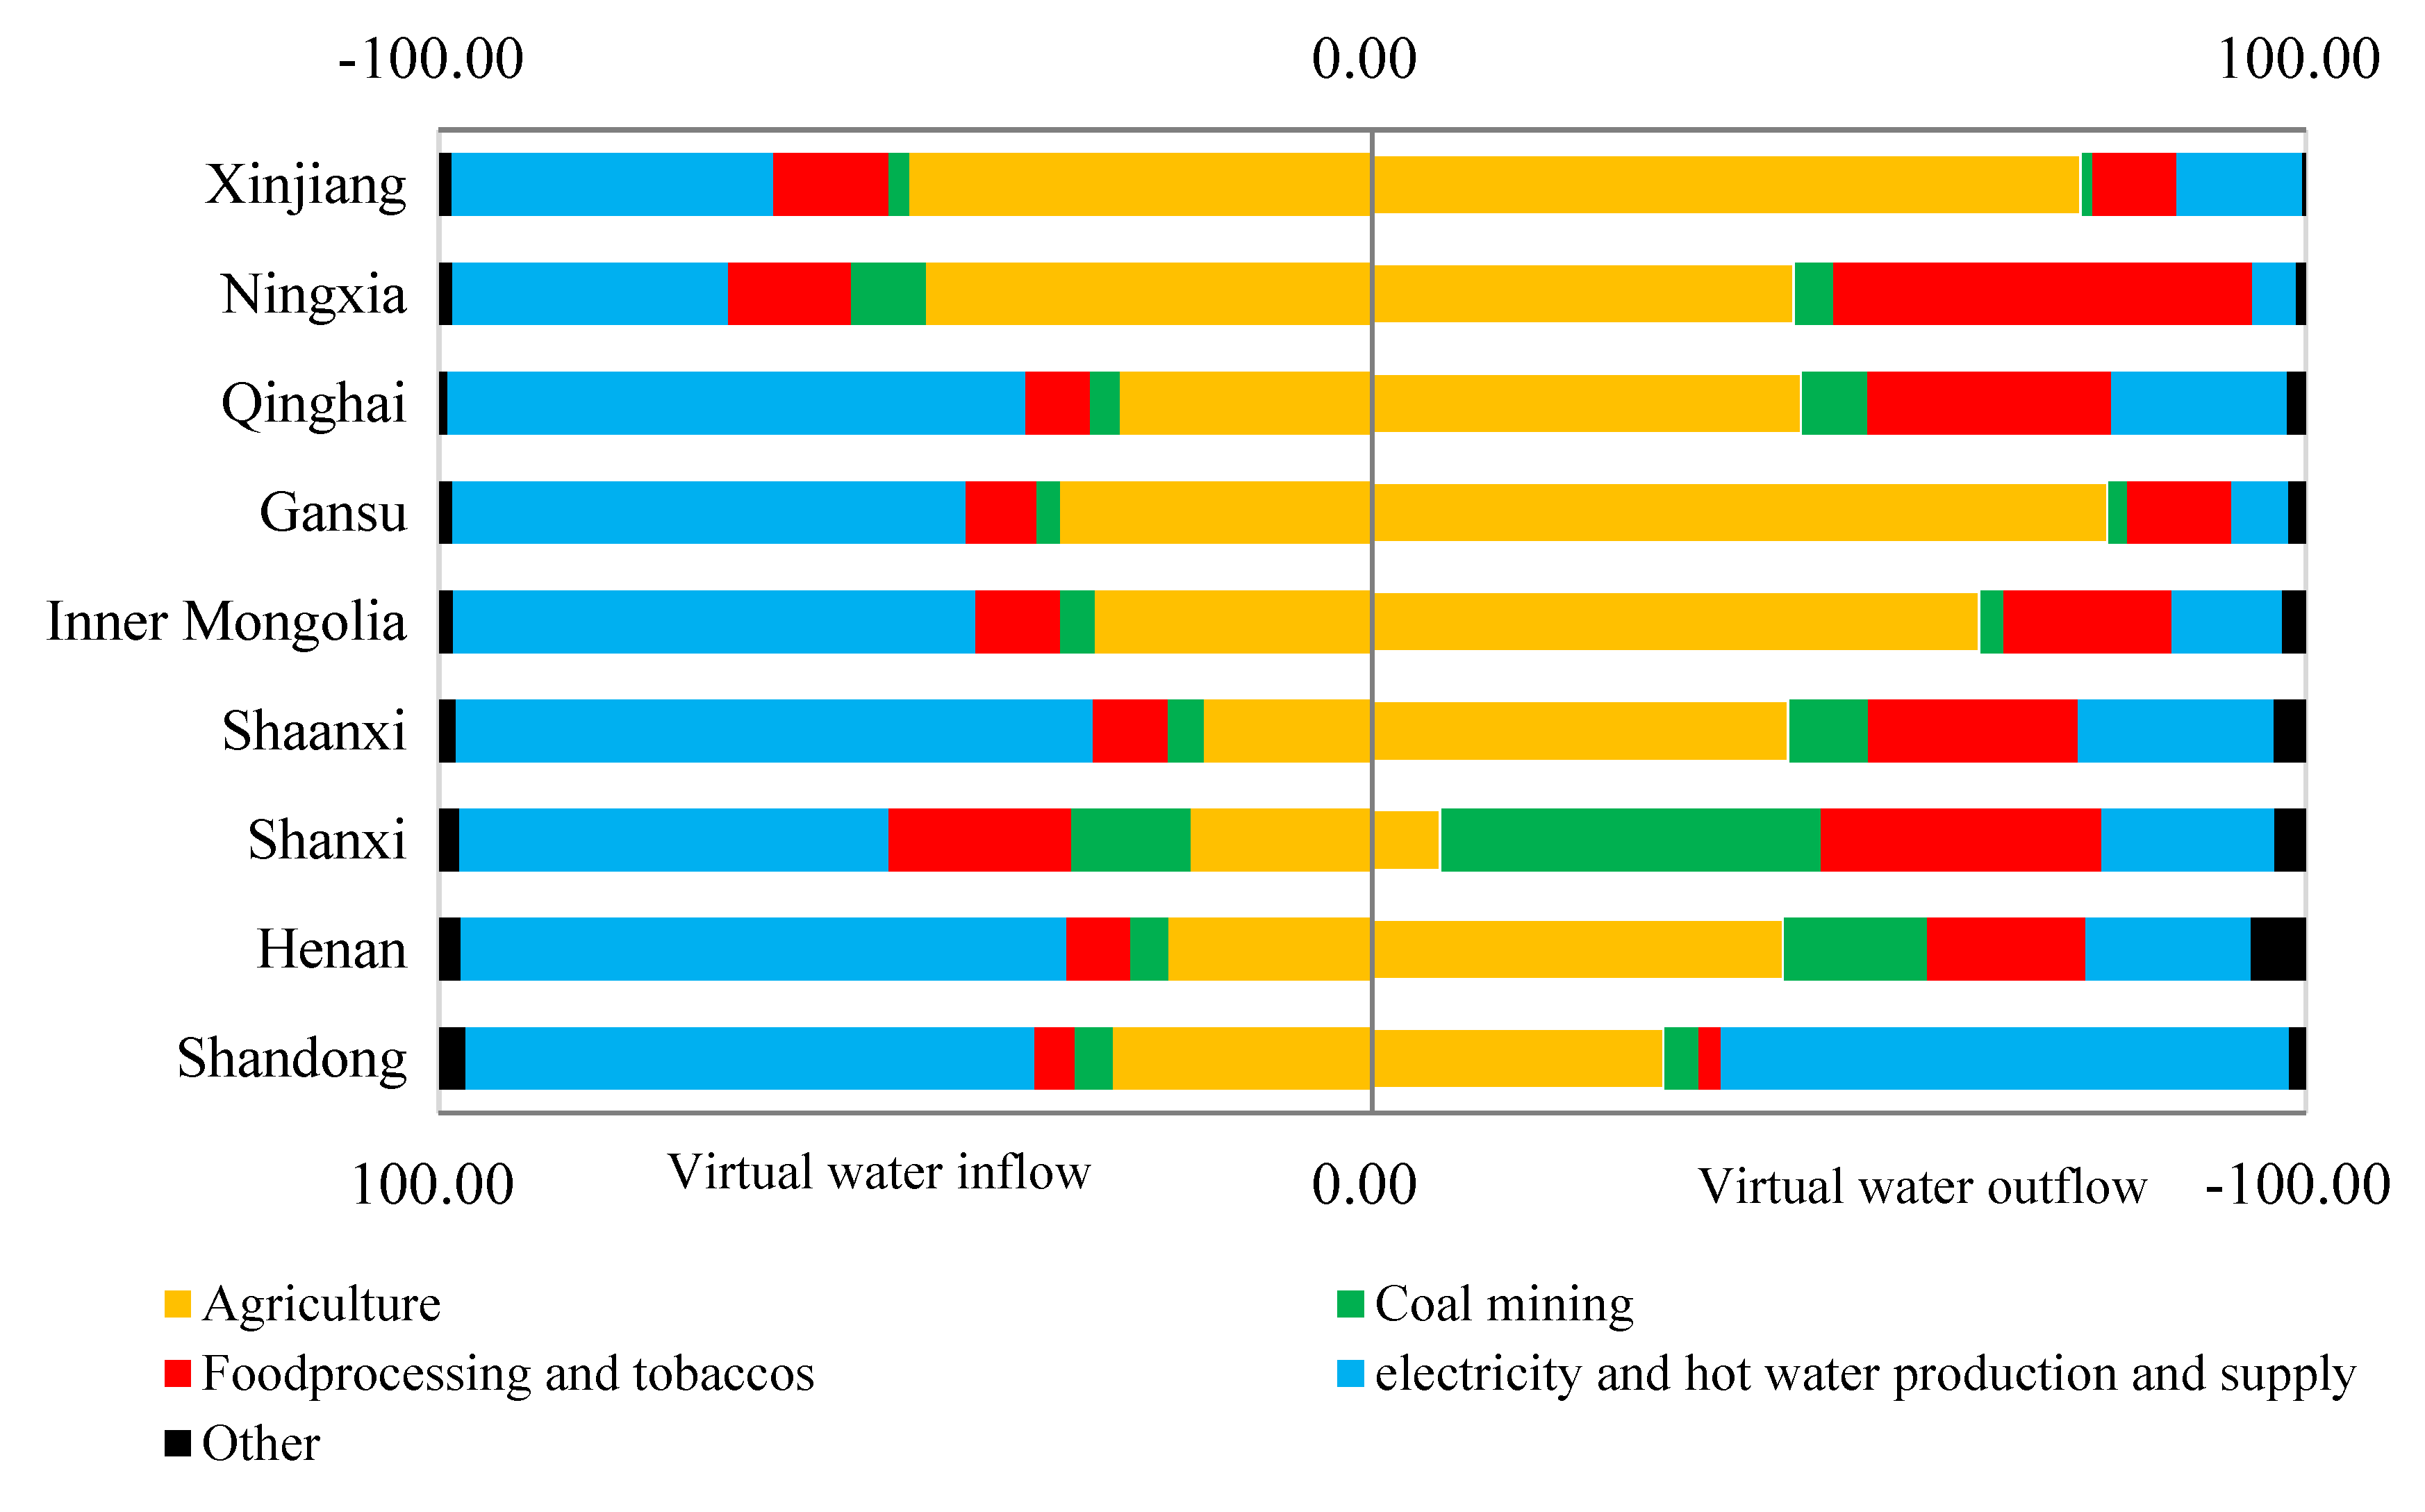
Based on the water use coefficient, we then calculate the virtual water trade flows of sectors. Comprehending the industry structure differences in virtual water trade could improve the water use efficiency and implement effective water resources policies. Figure 2 presents the inflow and outflow volume of virtual water among different economic sectors. On the virtual water inflow, agriculture sector, and electricity, and hot water production supply sector play a major role among all sectors in YREB. For example, the virtual water inflow of agriculture in Xinjiang and Ningxia exceeds that of electricity and hot water production and supply sector, accounting for 49.65% and 47.82%, respectively. In addition to Xinjiang and Ningxia, electricity and hot water production and supply sector in the other seven provinces have become the largest sector of virtual water inflow. Among these seven provinces, Shaanxi maintains the highest proportion of 68.7%. Henan and Qinghai rank second and third, respectively, accounting for more than 60%. Also, the exploitation and utilization of coal mines make the mining and manufacturing industries in Shanxi consume a higher proportion of water resources, accounting for 12.78% and 19.61%, respectively. Other sectors such as food processing and the tobacco industry are relatively small in the virtual water inflow.
Matlab is a commercial mathematical software produced by MathWorks Company in Natick, Massachusetts (for USA).
From virtual water outflow perspective, the agriculture sector, and electricity and hot water production and the supply sector are the major economic sectors with the maximum virtual water outflow in all provinces. Specifically, the virtual water outflow of the agriculture sectors in Xinjiang, Ningxia, Qinghai, Gansu, Inner Mongolia, Shaanxi, and Henan has the highest proportion among all sectors. This is consistent with the study by Guan and Hubacek [53] who found that northern China as a water scarce region still exports virtual water to south China by grain trade. Electricity and hot water production and supply sector is the largest component of Shandong’s virtual water outflow, accounting for 60.84%. The possible reason is that the economy of Shandong Province is relatively prosperous in YREB, and the developed electric power industry makes the department have more transactions with other provinces.
3.3. Virtual Water Trade Pattern among Provinces in the Yellow River Economic Belt
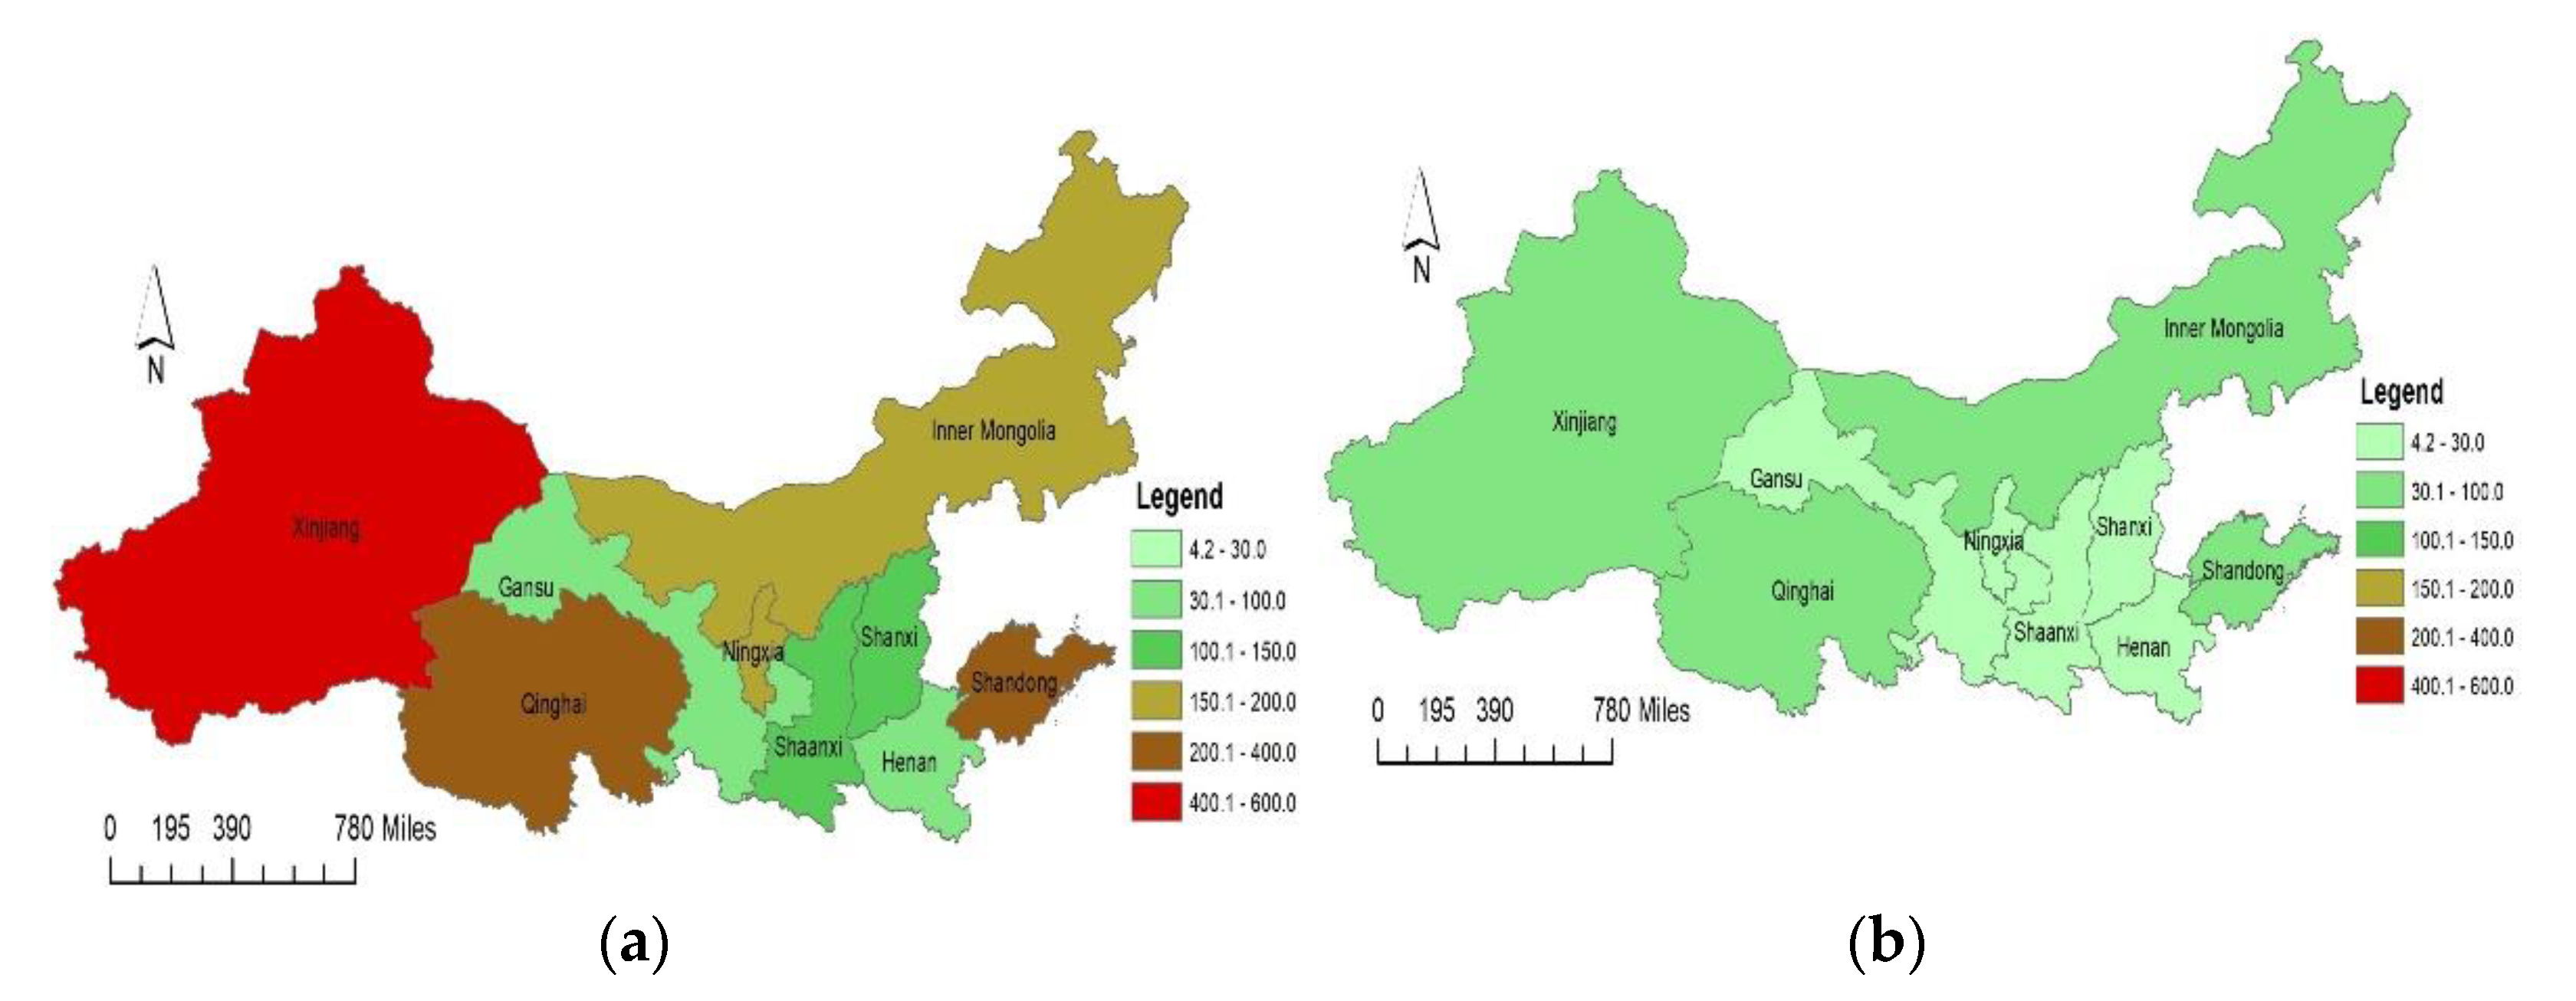
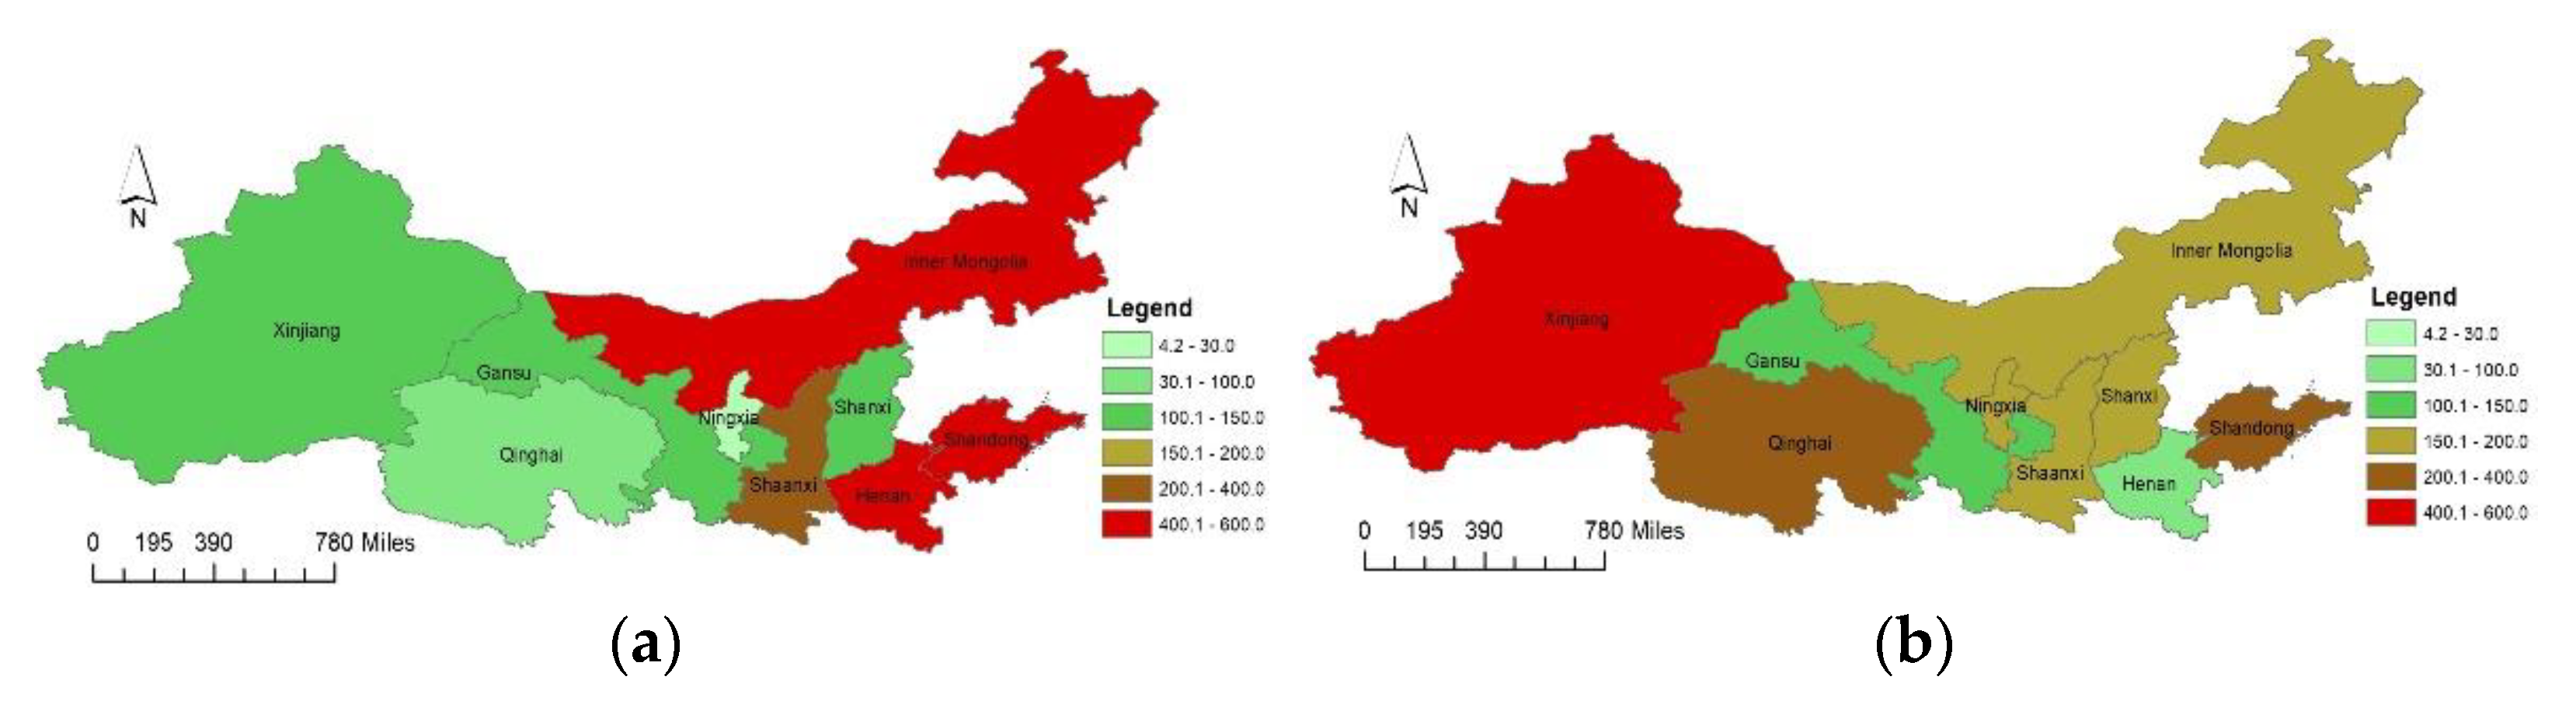
As shown in Figure 3, Figure 4 and Figure 5, the virtual water inflow, outflow between western and eastern provinces are also different in YREB. Across the whole economic belt, the total amount of virtual water inflow and outflow are 240.16 billion m3 and 197.39 billion m3, respectively, which indicates 42.77 billion m3 net inflow in the virtual water. From the perspective of regional distribution, the eastern provinces, including Shandong, Henan, Shaanxi, and Inner Mongolia, are the main virtual water inflow regions. Among them, Henan has the maximal virtual water inflow, which is 45.87 billion m3. At the same time, western provinces expect Gansu are all virtual water outflow areas, including Qinghai, Ningxia and Xinjiang. For example, Xinjiang has the largest net outflow of virtual water at 43.17 billion m3. The inflow and outflow of virtual water in Gansu and Shanxi are relatively balanced.
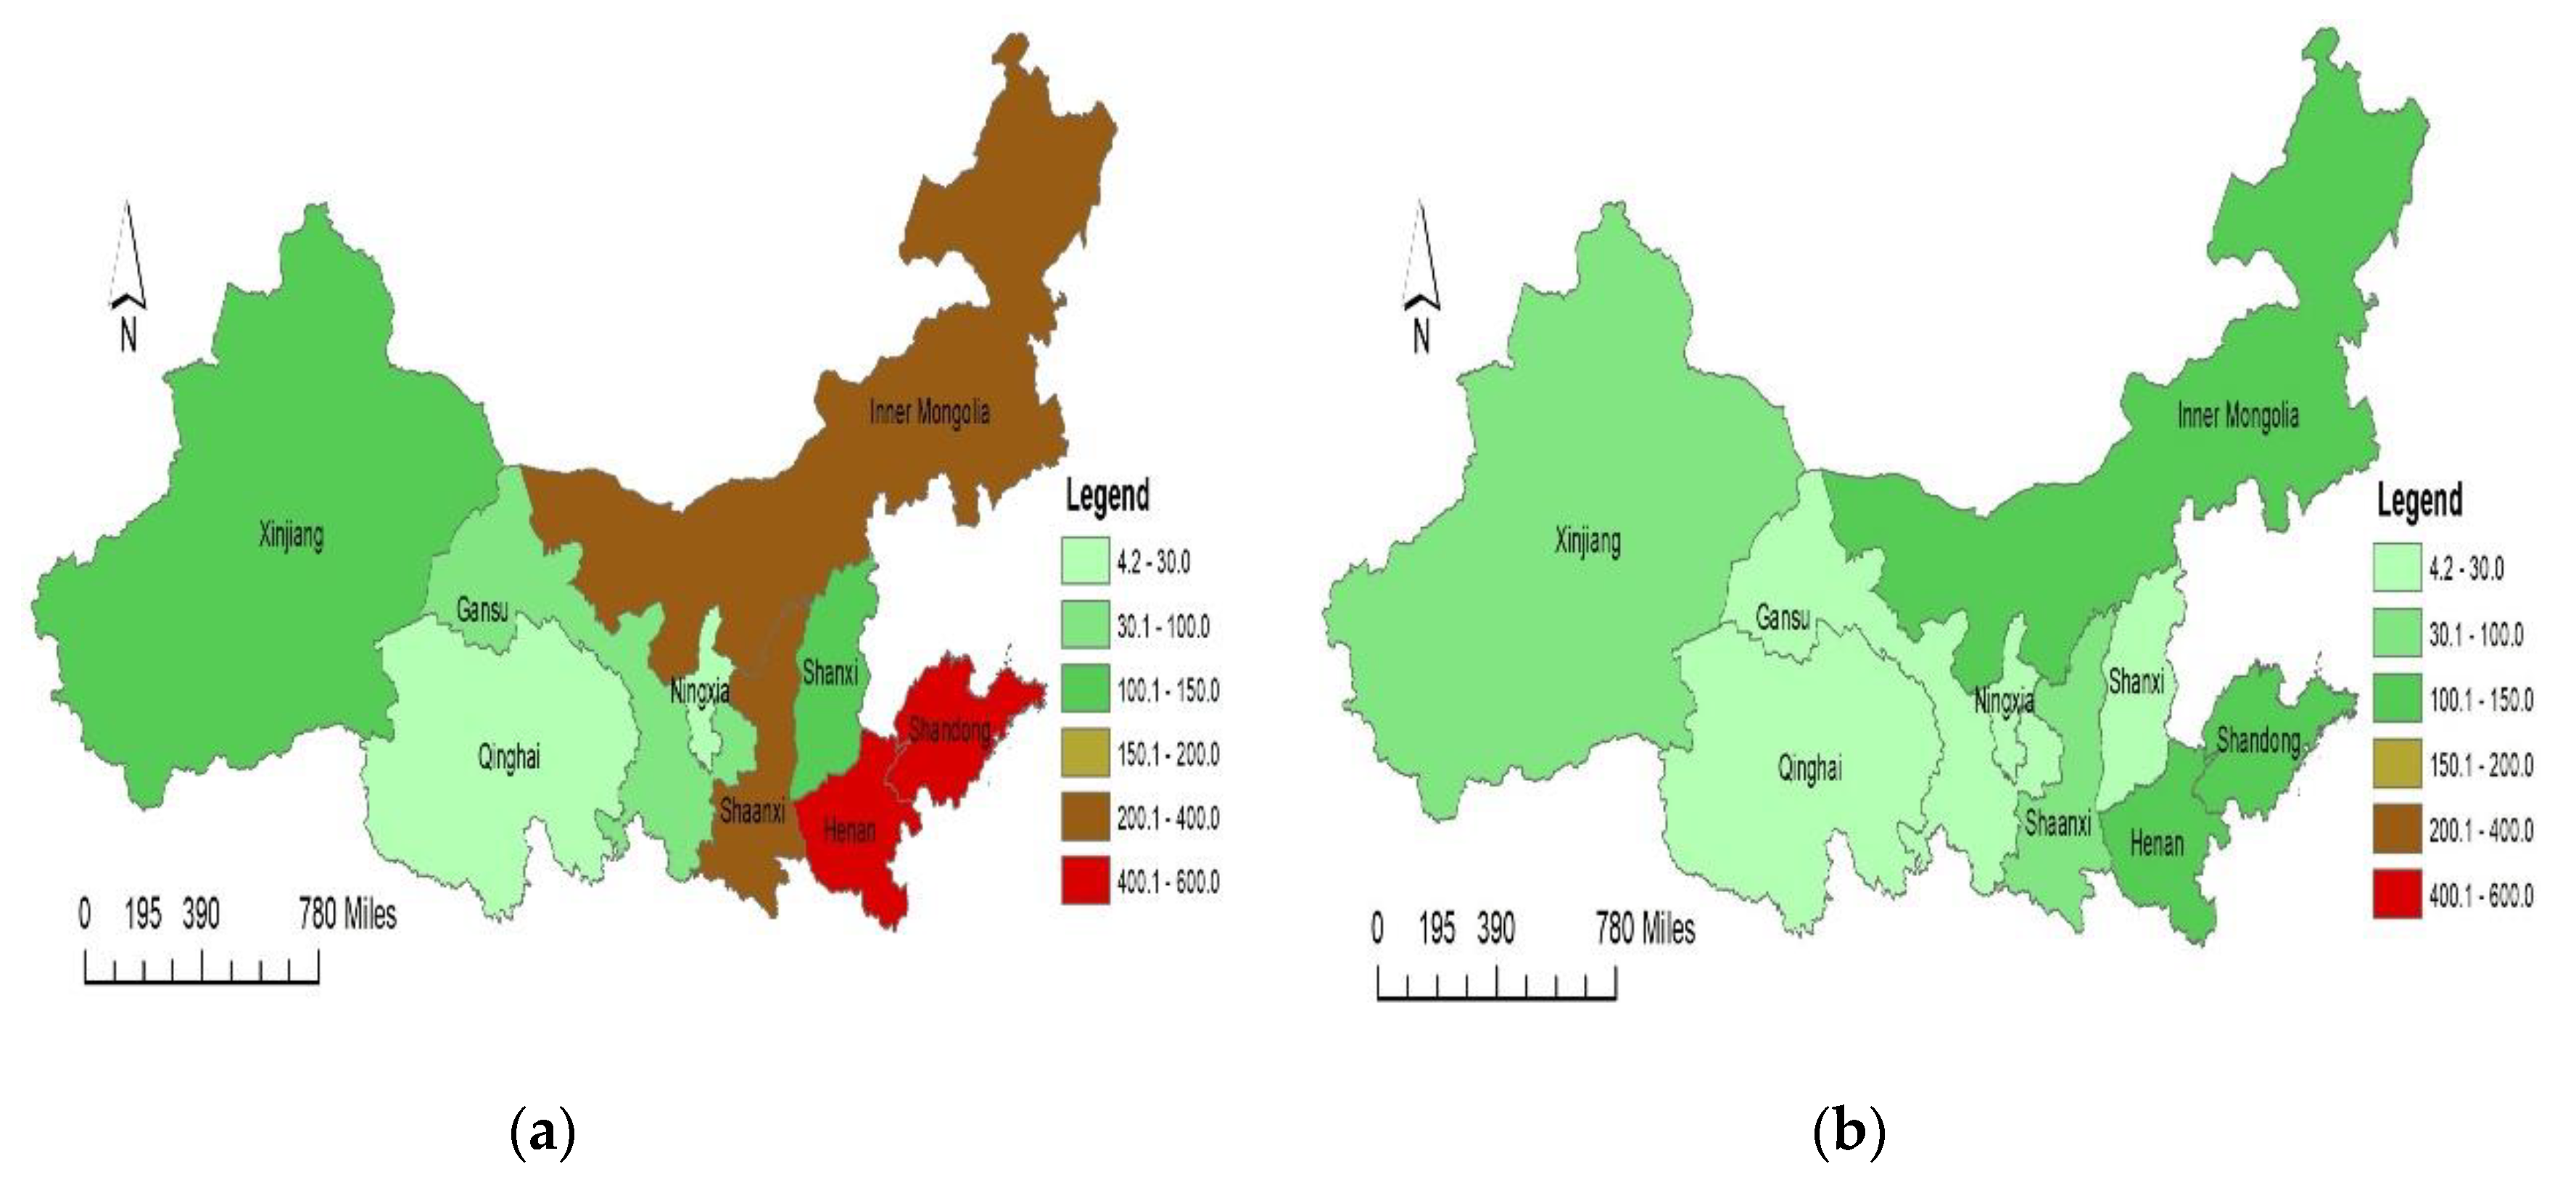
The virtual water trade in YREB has obvious geographical distribution characteristics, that is, western provinces mainly flow into eastern provinces, while eastern provinces flow out to provinces outside the economic belt. From the perspective of virtual water inflow, Shandong and Henan are more active within YREB, which is much higher than that of other provinces. For the virtual water inflow from provinces outside YREB, Henan and Shandong rank the top two of virtual water inflow, with 11.83 billion m3 and 10.14 billion m3, respectively. In terms of virtual water outflow, the virtual water trade within YREB is frequent, while the virtual water trade between YREB and external provinces is relatively small. And Xinjiang, Qinghai, Inner Mongolia and Shandong have relatively more virtual water trade connections with the outside world, mainly due to the vastness of the territory and more neighboring provinces, although their amounts are still relatively small compared to the trade within YREB. In the flow of virtual water within YREB, Xinjiang, Qinghai, and Shandong make great contributions to the virtual water outflow.
Based on the virtual water trade, the water resources carrying capacity in the YREB, especially in eastern provinces, is not optimistic. Liu et al. [54] divided the water resources carrying capacity of each province in YREB using the comprehensive index of water resources carrying capacity and argued that Qinghai is rich in water resources endowment; Shaanxi, Inner Mongolia, and Xinjiang are water-stressed regions; Shandong, Henan, Shanxi, and Gansu are water shortage regions; but Ningxia is an area with severe water scarcity. Combined with the virtual water flow and water resources carrying capacity of each province calculated by Liu et al. [54], we found that Xinjiang and Ningxia have entered the stage of water-stressed and severe water scarcity, respectively, but they still export a large amount of virtual water. This can easily aggravate the pressure on water resources utilization. Therefore, the incoordination between water resources carrying capacity and regional virtual water trade in the two provinces has further intensified.
3.4. Virtual Water Trade Pattern within the Yellow River Economic Belt
As shown in Table 3, the virtual water trade relationship within YREB is closely related to the geographical distribution of the Yellow River Basin. The amount of virtual water flowing into Shandong, Henan, Inner Mongolia, and Shaanxi from other provinces located in YREB is greater than that of other provinces. Among them, the net inflow of virtual water from Henan and Shandong ranks in the top two, with 398.39 × 10² million m3 and 250.52 × 10² million m3, respectively, which are consistent with the economic development level of the downstream regions. Xinjiang, Qinghai, and Shandong are the provinces that export the most virtual water to other provinces within YREB. Among them, Xinjiang has the highest virtual water outflow with 673.98 × 10² million m3. However, this is unbalanced with its owned water resources. Shanxi, Gansu, and Ningxia also suffer the same pressure.
In addition, the virtual water flow in the central and western provinces is smaller than that in the eastern region. Specifically, Shandong and Henan in the east play a critical role in importing virtual water from other provinces, and the regional virtual water trade in the eastern provinces is higher and more frequent. Xinjiang has become the main source of virtual water inflow in these provinces. Western provinces, including Gansu and Qinghai, have fewer virtual water trade with the central and eastern provinces in YREB.
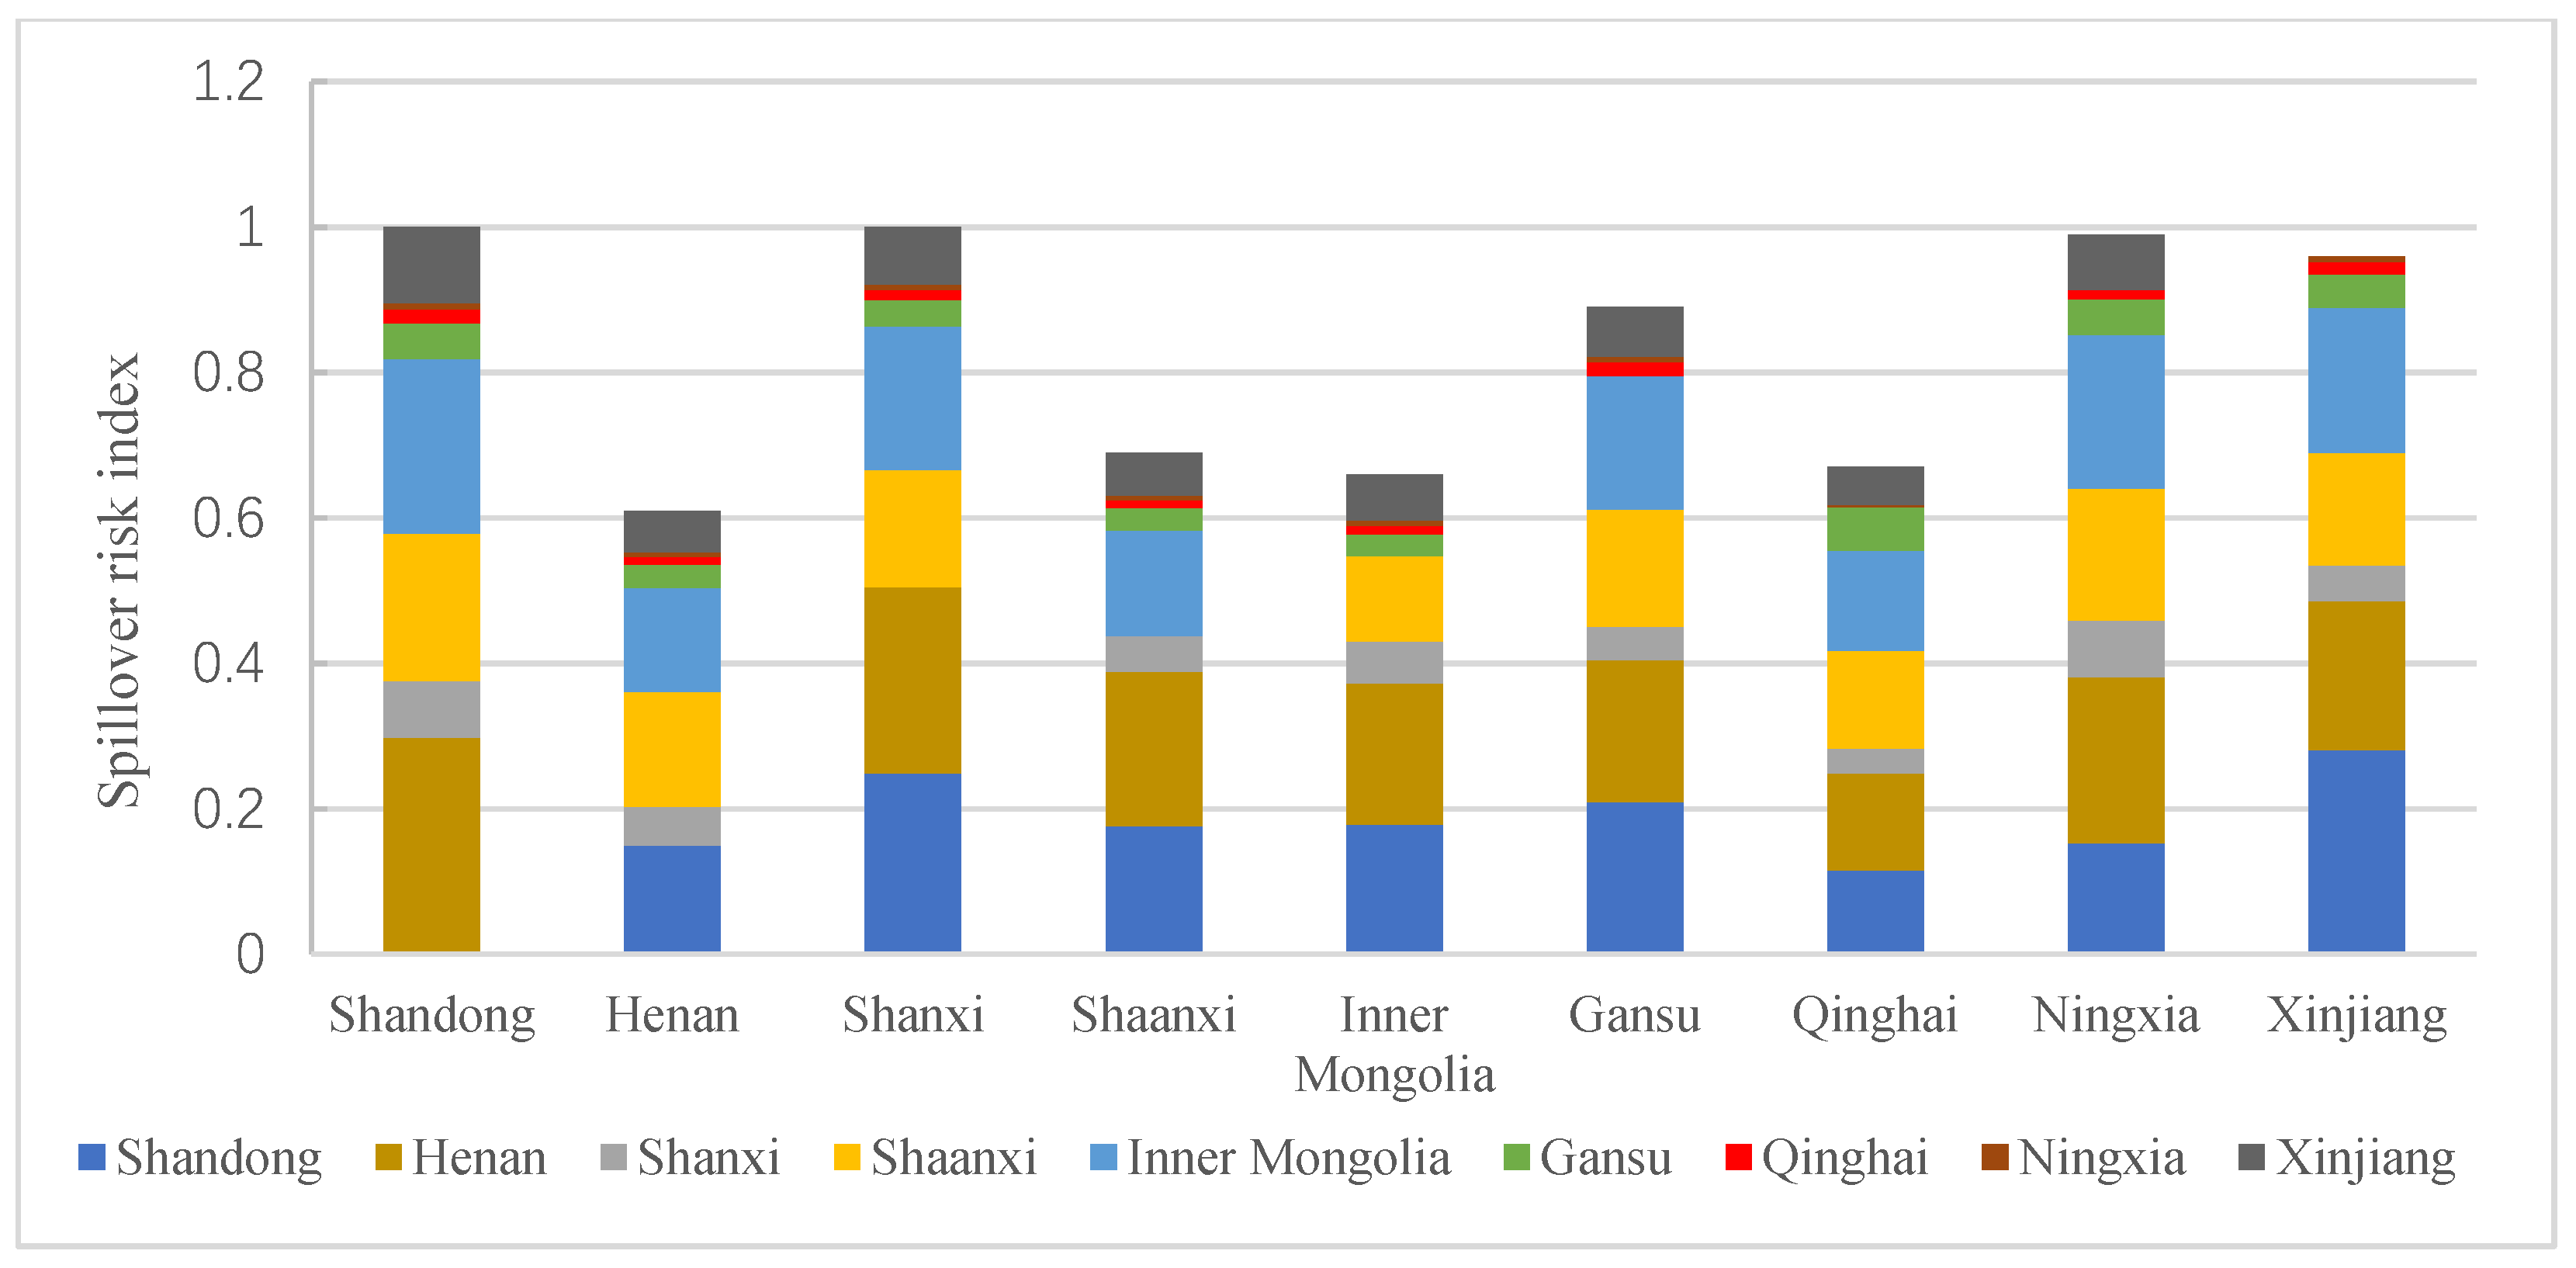
3.5. Spillover Risk Analysis of Interprovincial Virtual Water Trade
Table 4 reports the water stress index (WSI) of each province in YREB. The index was proposed by Pfister et al. [51] and its range is 0 (no water stress) to 1 (maximum water stress), where 0.5 represents the threshold between moderate and severe water stress. The WSI refers to the deprivation of the portion of the water used by other users of freshwater, that is, the degree of “water shortage”, to show the pressure of renewable water resources. According to the research of Pfister et al. [51], the water stress index of the YREB is between 0.6–1, which belongs to bad water stress. Specifically, Shandong and Shanxi have a WSI with 1, reaching the maximum water stress. The WSI of Ningxia and Xinjiang is close to the maximum water stress, and the lowest is Henan, with a WSI of 0.61.
Combined with the research findings of Pfister et al. [51] and Figure 6, we found that the cumulative spillover risk index from other provinces to Shandong and Shanxi through virtual water trade is the highest, followed by Ningxia and Xinjiang. The main explanation is the severity of water stress in four provinces. At the same time, Shandong, Henan and Inner Mongolia have higher spillover risk indexes than other provinces in YREB, while Gansu, Qinghai, and Ningxia have relatively low spillover risks. Due to the increasing interdependence of neighboring provinces and closer trade relations, the risk of virtual water trade between neighboring provinces is relatively high. For example, compared with Shandong, the highest spillover risk index of virtual water trade comes from Henan.
4. Conclusions
The sustainable and efficient use of water resources has gained wide social concern. It is essential to investigate the virtual water trade of the water-scarcity region and optimize water resources allocation. In this paper, we use a multi-regional input-output model to analyze the water use coefficients of different economic sectors in the Yellow River Economic Belt (YREB). The water use coefficient of different economic sectors in YREB is significantly different. Agriculture sector, and electricity and hot water production and the supply sector both have the largest total water use coefficient, and these two sectors are high-risk water use sectors. The direct water use coefficient of electricity and hot water production and supply sector is far greater than the indirect water use coefficient, while the indirect water use coefficient in other sectors is larger. Moreover, the agriculture sector, electricity and hot water production and supply sector play a major role in the inflow and outflow of virtual water in the YREB.
As agriculture sector is an important industry in most provinces of YREB, the adjustment and of water resources utilization need to promote the water use efficiency of agricultural production, including adjusting the planting structure of agricultural products (reduce water intensive products), improving agricultural water-saving technology, strengthening the monitoring of water efficiency of the whole industrial chain, and advocating water-saving from the whole product life cycle. For water scarcity provinces, the water use quotas policy could be considered to promote the water-saving irrigation and optimize the water and land allocation between different crops.
We further investigate the total virtual water trade and the spillover risk of interprovincial virtual water trade between provinces. The results show that the overall situation of YREB is virtual water inflow, but the pattern of virtual water trade between eastern and western provinces is very different. Shandong, Henan, Shaanxi, and Inner Mongolia belong to the virtual water net inflow area, while the virtual water net outflow regions are concentrated in Shanxi, Gansu, Xinjiang, Ningxia, and Qinghai. This means that virtual water trade in the YREB has obvious geographical distribution characteristics: western provinces mainly flow into eastern provinces, while eastern provinces flow out to provinces outside the economic belt. In addition, Shandong and Shanxi suffer a higher cumulative risk through virtual water trade due to higher water resource stress. Also, the spillover risk index of Shandong, Henan and Inner Mongolia to other provinces of YREB is relatively high.
Based on the pattern and spillover risk of virtual water trade, a policy implication is that environmental policies should not only commit to reducing water consumption in water-scarce areas, but also prevent water-stressful regions from becoming water-scarce by keeping a sustainable state. First, it is feasible to reduce the virtual water out flow, and even increase the virtual water inflow in some high water- consumption industries in YREB. This could efficiently help some eastern provinces, including Shandong and Henan, alleviate the water scarcity. Second, it is also notable the net outflow of virtual water attached in Agriculture sectors in Ningxia and Xinjiang should be controlled to protect the local ecological development and water balance. For example, the flow part water-intensive agricultural products from Xinjiang to other provinces could be reduced. The finding of this study hopes to provide a reference based on water sustainability when optimizing trade structures, although trade structure not only depends on water resource endowment.
This study also has some limitations need to be addressed in the future. First, the input-output data in this study is for the year 2012, which does not reflect the latest situation. In the future, more input-output tables will be adopted to investigate the spatial-temporal evolution of virtual water trade. Second, we mainly focus more on inter-regional water flows in YREB, while does not estimate the international virtual water flow embodied in international products and service trade.
Supplementary Materials
The following are available online at https://www.mdpi.com/2073-4441/13/6/748/s1.
Author Contributions
Conceptualization, M.L., Q.T. and C.L.; methodology, M.L. and Q.T.; software, M.L. and Q.T.; validation, M.L. and Q.T.; formal analysis, Y.Y. and Q.T.; investigation, Y.Y. and Y.X.; resources, M.L. and Q.T.; data curation, M.L. and Q.T.; writing—original draft preparation, M.L. and Q.T.; writing—review and editing, M.L., Q.T., Y.Y. and Y.X.; visualization, M.L. and Q.T.; supervision C.L.; project administration, C.L.; funding acquisition, C.L. All authors have read and agreed to the published version of the manuscript.
Funding
This research was supported by the National Natural Science Foundation of China (Grant Nos. 71673103 and 71873051). Hubei Province Humanities and Social Sciences Key Research Base Dabie Mountain Tourism Economy and Cultural Research Center (grant no. 202014504).
Institutional Review Board Statement
Not applicable.
Informed Consent Statement
Not applicable.
Data Availability Statement
The data presented in this study are available in Supplementary Materials here.
Conflicts of Interest
The authors declare no conflict of interest.
References
- Hoekstra, A.Y.; Mekonnen, M.M. The water footprint of humanity. Proc. Natl. Acad. Sci. USA 2012, 109, 3232–3237. [Google Scholar] [CrossRef] [PubMed] [Green Version]
- Tian, G.; Han, X.; Zhang, C.; Li, J.; Liu, J. Virtual Water Flows Embodied in International and Interprovincial Trade of Yellow River Basin: A Multiregional Input-Output Analysis. Sustainability 2020, 12, 1251. [Google Scholar] [CrossRef] [Green Version]
- Mubako, S.; Lahiri, S.; Lant, C. Input–output analysis of virtual water transfers: Case study of California and Illinois. Ecol. Econ. 2013, 93, 230–238. [Google Scholar] [CrossRef]
- Chouchane, H.; Krol, M.S.; Hoekstra, A.Y. Virtual water trade patterns in relation to environmental and socioeconomic factors: A case study for Tunisia. Sci. Total Environ. 2017, 613–614, 287–297. [Google Scholar] [CrossRef] [PubMed] [Green Version]
- Hussein, H. Lifting the veil: Unpacking the discourse of water scarcity in Jordan. Environ. Sci. Policy 2018, 89, 385–392. [Google Scholar] [CrossRef]
- Ma, X.; Ma, Y. The spatiotemporal variation analysis of virtual water for agriculture and livestock husbandry: A study for Jilin Province in China. Sci. Total Environ. 2017, 586, 1150. [Google Scholar] [CrossRef]
- Edwards, G.A.S. Shifting constructions of scarcity and the neoliberalization of Australian water governance. Environ. Plan. A 2013, 45, 1873–1890. [Google Scholar] [CrossRef]
- Wang, J.; Li, Y.; Huang, J.; Yan, T.; Sun, T. Growing water scarcity, food security and government responses in China. Glob. Food Secur. 2017, 14, 9–17. [Google Scholar] [CrossRef]
- Wang, Y.; Zhao, W.; Wang, S.; Feng, X.; Liu, Y. Yellow River water rebalanced by human regulation. Sci. Rep. 2019, 9, 1–10. [Google Scholar] [CrossRef] [Green Version]
- Munir, A.; Hanjra, M.; Qureshi, E. Global water crisis and future food security in an era of climate change. Food Policy 2010, 35, 365–377. [Google Scholar]
- Sowers, J.; Vengosh, A.; Weinthal, E. Climate change, water resources, and the politics of adaptation in the Middle East and North Africa. Clim. Chang. 2011, 104, 599–627. [Google Scholar] [CrossRef]
- Mehta, L. Whose scarcity? Whose property? The case of water in western India. Land Use Policy 2007, 24, 654–663. [Google Scholar] [CrossRef]
- Van Eeden, A.; Mehta, L.; Van Koppen, B. Whose waters? Large-scale agricultural development and water grabbing in the Wami-Ruvu River Basin, Tanzania. Water Altern. 2016, 9, 608–626. [Google Scholar]
- Karandish, F.; Hogeboom, R.J.; Hoekstra, A.Y. Physical versus virtual water transfers to overcome local water shortages: A comparative analysis of impacts. Adv. Water Resour. 2021, 147. [Google Scholar] [CrossRef]
- Silva, V.D.; Oliveira, S.D.; Hoekstra, A.Y.; Neto, J.D.; Holanda, R.D. Water Footprint and Virtual Water Trade of Brazil. Water 2016, 8, 517. [Google Scholar] [CrossRef] [Green Version]
- Abubaker, O.; Ma, Z.; Zheng, Z.; Farhan, S. Natural and anthropogenic influences on the recent droughts in Yellow River Basin, China. Sci. Total Environ. 2020, 704. [Google Scholar] [CrossRef]
- Zeitoun, M.; Allan, J.A.; Mohieldeen, Y. Virtual water ‘flows’ of the Nile Basin, 1998–2004: A first approximation and implications for water security. Glob. Environ. Chang. 2010, 20, 229–242. [Google Scholar] [CrossRef]
- Allan, J.A. Fortunately there are substitutes for water otherwise our hydro-political futures would be impossible. In Priorities for Water Resources Allocation and Management; Overeas Development Administration: London, UK, 1993. [Google Scholar]
- Zhao, X.; Yang, H.; Yang, Z.; Chen, B.; Qin, Y. Applying the Input-Output Method to Account for Water Footprint and Virtual Water Trade in the Haihe River Basin in China. Environ. Sci. Technol. 2010, 44, 9150. [Google Scholar] [CrossRef]
- Konar, M.; Dalin, C.; Suweis, S. Water for food: The global virtual water trade network. Water Resour. Res. 2011, 47. [Google Scholar] [CrossRef] [Green Version]
- Hoekstra, A.Y. Water Footprint Assessment: Evolvement of a New Research Field. Water Resour. Manag. 2017, 31, 3061–3081. [Google Scholar] [CrossRef] [Green Version]
- Zhang, C.; Anadon, L.D. A multi-regional input–output analysis of domestic virtual water trade and provincial water footprint in China. Ecol. Econ. 2014, 100, 159–172. [Google Scholar] [CrossRef]
- Antonelli, M.; Greco, F. The Water We Eat: Combining Virtual Water and Water Footprints; Springer: Berlin, Germany, 2015. [Google Scholar]
- Zhang, Z.; Yang, H.; Shi, M. Analyses of water footprint of Beijing in an interregional input–output framework. Ecol. Econ. 2011, 70, 2494–2502. [Google Scholar] [CrossRef]
- Wang, Z.; Huang, K.; Yang, S.; Yu, Y.J. An input–output approach to evaluate the water footprint and virtual water trade of Beijing, China. J. Clean. Prod. 2013, 42, 172–179. [Google Scholar] [CrossRef]
- Hoekstra, A.Y.; Chapagain, A.K. Water footprints of nations: Water use by people as a function of their consumption pattern. Water Resour. Manag. 2007, 21, 35–48. [Google Scholar] [CrossRef]
- Zhang, Y.; Zhang, J.H.; Tian, Q.; Liu, Z.; Zhang, H. Virtual water trade of agricultural products: A new perspective to explore the Belt and Road. Sci. Total Environ. 2017, 622–623, 988–996. [Google Scholar] [CrossRef] [PubMed]
- Qasemipour, E.; Abbasi, A. Virtual Water Flow and Water Footprint Assessment of an Arid Region: A Case Study of South Khorasan Province, Iran. Water 2019, 11, 1755. [Google Scholar] [CrossRef] [Green Version]
- Lamastra, L.; Miglietta, P.P.; Toma, P.; Leo, F.D.; Massari, M. Virtual water trade of agri-food products: Evidence from italian-chinese relations. Sci. Total Environ. 2017, 599–600, 474–482. [Google Scholar] [CrossRef]
- Fang, D.; Chen, B. Linkage analysis for the water–energy nexus of city. Appl. Energy 2017, 189, 770–779. [Google Scholar] [CrossRef]
- Zhang, Y.; Chen, Y.; Huang, M. Water Footprint and Virtual Water Accounting for China Using a Multi-Regional Input-Output Model. Water 2019, 11, 34. [Google Scholar] [CrossRef] [Green Version]
- Liu, Y.; Chen, B. Water-energy scarcity nexus risk in the national trade system based on multiregional input-output and network environ analyses. Appl. Energy 2020, 268, 114974. [Google Scholar] [CrossRef]
- Dong, H.; Geng, Y.; Hao, D.; Yu, Y.; Chen, Y. Virtual water flow feature of water-rich province and the enlightenments: Case of Yunnan in China. J. Clean. Prod. 2019, 235, 328–336. [Google Scholar] [CrossRef]
- Chen, W.; Wu, S.; Lei, Y.; Li, S. Virtual water export and import in China’s foreign trade: A quantification using input-output tables of China from 2000 to 2012. Resour. Conserv. Recycl. 2017, 132, 278–290. [Google Scholar] [CrossRef]
- Dong, H.; Geng, Y.; Fujita, T.; Jacques, D.A. Three accounts for regional carbon emissions from both fossil energy consumption and industrial process. Energy 2014, 67, 276–283. [Google Scholar] [CrossRef]
- Nawab, A.; Liu, G.; Meng, F.; Hao, Y.; Zhang, Y.; Hu, Y.; Casazza, M. Exploring Urban Energy-Water Nexus Embodied in Domestic and International Trade: A Case of Shanghai. J. Clean. Prod. 2019, 223, 522–535. [Google Scholar] [CrossRef]
- Wang, S.; Chen, B. Energy–water nexus of urban agglomeration based on multiregional input–output tables and ecological network analysis: A case study of the Beijing–Tianjin–Hebei region. Appl. Energy 2016, 178, 773–783. [Google Scholar] [CrossRef]
- Lin, L.; Chen, Y.D.; Hua, D.; Liu, Y.; Yan, M. Provincial virtual energy-water use and its flows within China: A multi-regional input-output approach. Resour. Conserv. Recycl. 2019, 151. [Google Scholar] [CrossRef]
- Ren, Y.; Huang, K.; Yu, Y.; Hu, J. Inter-Regional Agricultural Virtual Water Flow in China Based on Volumetric and Impact-Oriented Multi-Regional Input-Output (MRIO) Approach. Water 2020, 12, 251. [Google Scholar] [CrossRef] [Green Version]
- Gao, D.; Long, A.; Yu, J.; Xu, H.; Zhao, X. Assessment of Inter-Sectoral Virtual Water Reallocation and Linkages in the Northern Tianshan Mountains, China. Water 2020, 12, 2363. [Google Scholar] [CrossRef]
- Qasemipour, E.; Tarahomi, F.; Pahlow, M.; Sadati, M.; Abbasi, A. Assessment of Virtual Water Flows in Iran Using a Multi-Regional Input-Output Analysis. Sustainability 2020, 12, 7424. [Google Scholar] [CrossRef]
- Meng, B.; Xue, J.; Feng, K.; Guan, D. China’s inter-regional spillover of carbon emissions and domestic supply chains. IDE Discuss. Pap. 2012, 61, 1305–1321. [Google Scholar] [CrossRef] [Green Version]
- Fang, D.; Chen, B.; Hubacek, K.; Ni, R.; Chen, L.; Feng, K.; Lin, J. Clean air for some: Unintended spillover effects of regional air pollution policies. Sci. Adv. 2019, 5, eaav4707. [Google Scholar] [CrossRef] [PubMed] [Green Version]
- Qu, S.; Liang, S.; Konar, M.; Zhu, Z.; Chiu, A.S.F.; Jia, X.; Xu, M. Virtual Water Scarcity Risk to the Global Trade System. Environ. Sci. Technol. 2018. [Google Scholar] [CrossRef]
- Gou, T.; Lu, W. Study on the Development Quality Evaluation and Spatial Differentiation of the Yellow River Eco-Economic Belt. J. Qinghai Norm. Univ. (Philosophy and Social Sciences Edition) 2019, 41, 7–15. [Google Scholar]
- Sediqi, M.N.; Shiru, M.S.; Nashwan, M.S.; Ali, R.; Abubaker, R.; Wang, X.; Ahmed, K.; Shahid, S.; Asaduzzaman, M.; Manawi, S.M.A. Spatio-Temporal Pattern in the Changes in Availability and Sustainability of Water Resources in Afghanistan. Sustainability 2019, 11, 5836. [Google Scholar] [CrossRef] [Green Version]
- Lisowski, S.; Berger, M.; Caspers, J.; Mayr-Rauch, K.; Bauml, G.; Finkbeiner, M. Criteria-Based Approach to Select Relevant Environmental SDG Indicators for the Automobile Industry. Sustainability 2020, 12, 8811. [Google Scholar] [CrossRef]
- Wassily, W.L. Quantitative input and output relations in the economic system of the United States. Rev. Econ. Stat. 1936, 105–125. [Google Scholar] [CrossRef] [Green Version]
- Shao, W.; Li, F.; Ye, Z.; Tang, Z.; Xie, W.; Bai, Y.; Yang, S. Inter-regional spillover of carbon emissions and employment in China: Is it positive or negative? Sustainability 2019, 11, 3622. [Google Scholar] [CrossRef] [Green Version]
- White, D.J.; Feng, K.; Sun, L.; Hubacek, K. A hydro-economic MRIO analysis of the Haihe River Basin’s water footprint and water stress. Ecol. Model. 2015, 318, 157–167. [Google Scholar] [CrossRef]
- Pfister, S.; Koehler, A.; Hellweg, S. Assessing the environmental impacts of freshwater consumption in LCA. Environ. Sci. Technol. 2009, 43, 4098–4104. [Google Scholar] [CrossRef] [Green Version]
- Wen, Z.; Xing, F.; Liu, Y.; Wang, S.; Chen, B. Spillover risk analysis of virtual water trade based on multi-regional input-output model—A case study. J. Environ. Manag. 2020, 275. [Google Scholar] [CrossRef]
- Guan, D.; Hubacek, K. Assessment of regional trade and virtual water flows in China. Ecol. Econ. 2007, 61, 159–170. [Google Scholar] [CrossRef] [Green Version]
- Liu, J.; Dong, S.; Li, Z. Comprehensive Evaluation of China’s Water Resources Carrying Capacity. J. Nat. Resour. 2011, 26, 258–269. [Google Scholar]
Figure 1.
Direct, indirect and total water use coefficient of sectors in the Yellow River Economic Belt. (Source: Authors’ own calculation/conception, based on MATLAB software).
Figure 1.
Direct, indirect and total water use coefficient of sectors in the Yellow River Economic Belt. (Source: Authors’ own calculation/conception, based on MATLAB software).

Figure 2.
Virtual water trade pattern of sectors of in the Yellow River Economic Belt. (Source: Authors’ own calculation/conception, based on MATLAB software).
Figure 2.
Virtual water trade pattern of sectors of in the Yellow River Economic Belt. (Source: Authors’ own calculation/conception, based on MATLAB software).

Figure 3.
Virtual water inflow of each province in the Yellow River Economic Belt. (left-Inflow within the Yellow River Economic Belt (a) and on the right (b) Inflow from provinces outside the Yellow River Economic Belt.
Figure 3.
Virtual water inflow of each province in the Yellow River Economic Belt. (left-Inflow within the Yellow River Economic Belt (a) and on the right (b) Inflow from provinces outside the Yellow River Economic Belt.

Figure 4.
Virtual water outflow of each province in the Yellow River Economic Belt. ((a) Outflow within the Yellow River Economic Belt (b) Flowing into provinces outside the Yellow River Economic Belt).
Figure 4.
Virtual water outflow of each province in the Yellow River Economic Belt. ((a) Outflow within the Yellow River Economic Belt (b) Flowing into provinces outside the Yellow River Economic Belt).

Figure 5.
Virtual water trade of each province in the Yellow River Economic Belt ((a) Total virtual water inflow and (b) Total virtual water outflow). Source: Authors’ own calculation/conception, based on MATLAB and ArcGIS software.
Figure 5.
Virtual water trade of each province in the Yellow River Economic Belt ((a) Total virtual water inflow and (b) Total virtual water outflow). Source: Authors’ own calculation/conception, based on MATLAB and ArcGIS software.

Figure 6.
Spillover risk index of interprovincial virtual water trade within the Yellow River Economic Belt. (Source: Authors’ own calculation/conception, based on MATLAB software).
Figure 6.
Spillover risk index of interprovincial virtual water trade within the Yellow River Economic Belt. (Source: Authors’ own calculation/conception, based on MATLAB software).


Table 1.
Water resources and economic development of the Yellow River Economic Belt (YREB) in 2012.
| Province | Total Water Consumption (100 million m3) | Total Water Resources (100 million m3) | GDP (100 million RMB) | GDP/Water Consumption (RMB/m3) | Population/Water Consumption (person/10000 m3) |
|---|---|---|---|---|---|
| Shandong | 221.80 | 274.30 | 45,429.99 | 204.82 | 43.67 |
| Henan | 238.60 | 265.50 | 27,598.98 | 115.67 | 39.42 |
| Shanxi | 73.40 | 106.20 | 11,235.10 | 153.07 | 49.20 |
| Shaanxi | 88.00 | 390.50 | 12,266.76 | 139.40 | 42.65 |
| Inner Mongolia | 184.40 | 510.30 | 11,517.81 | 62.46 | 13.50 |
| Gansu | 123.10 | 267.00 | 5090.82 | 41.36 | 20.94 |
| Qinghai | 27.40 | 895.20 | 1636.59 | 59.73 | 20.91 |
| Ningxia | 69.40 | 10.80 | 2085.40 | 30.05 | 9.32 |
| Xinjiang | 590.10 | 900.60 | 6519.07 | 11.05 | 3.78 |
| The Yellow River Economic Belt | 1616.20 | 3620.40 | 123,380.52 | 76.34 | 21.64 |
| China | 6131.20 | 29,528.80 | 518,942.10 | 84.64 | 22.08 |
Source: China Statistical Yearbook in 2013 and China water resources bulletin 2013.
Table 2.
Input and output of multiple regions in the Yellow River Economic Belt.
| Item | Intermediate Use | Final Demand | Export | Gross Output | ||||||
|---|---|---|---|---|---|---|---|---|---|---|
| Shandong | … | Xinjiang | Other Regions | Shandong…Xinjiang | Other Regions | |||||
| Sector1…Sector30 | Sector1…Sector30 | Sector1…Sector30 | ||||||||
| Intermediate input | Shandong | Sector1 | … | … | … | … | ||||
| … | … | … | … | … | … | … | … | … | ||
| Sector30 | … | … | … | … | ||||||
| … | … | … | … | … | … | … | … | … | … | |
| Xinjiang | Sector1 | … | … | … | … | |||||
| … | … | … | … | … | … | … | … | … | ||
| Sector30 | … | … | … | … | ||||||
| Sector1 | … | … | … | … | … | |||||
| other regions | … | … | … | … | … | … | … | … | … | |
| Sector30 | … | … | … | … | … | |||||
| Import | … | … | … | … | ||||||
| Gross input | … | … | … | … | ||||||
Table 3.
Virtual water flow of each province in the Yellow River Economic Belt (100 million m3).
| Shandong | Henan | Shanxi | Shaanxi | Inner Mongolia | Gansu | Qinghai | Ningxia | Xinjiang | Outflow | |
|---|---|---|---|---|---|---|---|---|---|---|
| Shandong | / | 65.06 | 17.13 | 44.35 | 52.37 | 10.83 | 4.11 | 1.91 | 22.86 | 218.62 |
| Henan | 22.96 | / | 8.22 | 24.38 | 21.93 | 5.05 | 1.52 | 1.12 | 8.69 | 93.87 |
| Shanxi | 41.69 | 42.78 | / | 27.05 | 33.07 | 5.98 | 2.49 | 1.19 | 13.15 | 167.40 |
| Shaanxi | 46.46 | 55.65 | 12.99 | / | 38.01 | 8.12 | 3.01 | 1.41 | 15.63 | 181.28 |
| Inner Mongolia | 58.28 | 63.41 | 18.66 | 38.48 | / | 9.71 | 3.9 | 2.31 | 20.61 | 215.36 |
| Gansu | 29.46 | 27.56 | 6.5 | 22.69 | 25.96 | / | 2.7 | 0.94 | 9.64 | 125.45 |
| Qinghai | 43.02 | 49.56 | 12.42 | 50.21 | 51.1 | 21.97 | / | 1.52 | 19.08 | 248.88 |
| Ningxia | 29.8 | 44.78 | 15.25 | 35.47 | 41.11 | 9.71 | 2.5 | / | 14.86 | 193.48 |
| Xinjiang | 197.47 | 143.46 | 34.78 | 108.17 | 140.17 | 32.6 | 12.14 | 5.19 | / | 673.98 |
| Inflow | 469.14 | 492.26 | 125.95 | 350.80 | 403.72 | 103.97 | 32.27 | 15.59 | 124.52 | / |
| Net inflow | 250.52 | 398.39 | −41.45 | 169.52 | 188.36 | −21.48 | −216.61 | −177.89 | −549.46 | / |
Source: Authors’ own calculation/conception, based on MATLAB software.
Table 4.
Water stress index of each province in the Yellow River Economic Belt.
| Province | WSI | Province | WSI |
|---|---|---|---|
| Shandong | 1.00 | Gansu | 0.89 |
| Henan | 0.61 | Qinghai | 0.67 |
| Shanxi | 1.00 | Ningxia | 0.99 |
| Shaanxi | 0.69 | Xinjiang | 0.96 |
| Inner Mongolia | 0.66 |
Source: Pfister et al. (2009).
Publisher’s Note: MDPI stays neutral with regard to jurisdictional claims in published maps and institutional affiliations. |
© 2021 by the authors. Licensee MDPI, Basel, Switzerland. This article is an open access article distributed under the terms and conditions of the Creative Commons Attribution (CC BY) license (http://creativecommons.org/licenses/by/4.0/).
Share and Cite
MDPI and ACS Style
Li, M.; Tian, Q.; Yu, Y.; Xu, Y.; Li, C. Virtual Water Trade in the Yellow River Economic Belt: A Multi-Regional Input-Output Model. Water 2021, 13, 748. https://doi.org/10.3390/w13060748
AMA Style
Li M, Tian Q, Yu Y, Xu Y, Li C. Virtual Water Trade in the Yellow River Economic Belt: A Multi-Regional Input-Output Model. Water. 2021; 13(6):748. https://doi.org/10.3390/w13060748
Chicago/Turabian StyleLi, Ming, Qingsong Tian, Yan Yu, Yueyan Xu, and Chongguang Li. 2021. "Virtual Water Trade in the Yellow River Economic Belt: A Multi-Regional Input-Output Model" Water 13, no. 6: 748. https://doi.org/10.3390/w13060748
Note that from the first issue of 2016, this journal uses article numbers instead of page numbers. See further details here.