
Evaluation of Combined Sewer System Operation Strategies Based on Highly Resolved Online Data
by
 , , and
Anna Bachmann-Machnik
1,* ,
,
Yannic Brüning
2,
Amin Ebrahim Bakhshipour
1 ,
,
Manuel Krauss
2 and
Ulrich Dittmer
1 1
Department of Civil Engineering, Institute of Urban Water Management, University of Kaiserslautern, Paul-Ehrlich-Str. 14, 67663 Kaiserslautern, Germany
2
Institute for Sanitary Engineering, Water Quality and Solid Waste Management, University of Stuttgart, Bandtäle 2, 70569 Stuttgart, Germany
*
Author to whom correspondence should be addressed.
Water 2021, 13(6), 751; https://doi.org/10.3390/w13060751
Submission received: 27 January 2021
/
Revised: 5 March 2021
/
Accepted: 7 March 2021
/
Published: 10 March 2021
(This article belongs to the Section Urban Water Management)
Abstract
:Operational and structural interventions in the field of stormwater management are usually planned based on long-term simulations using rainfall-runoff models. The simulation results are often highly uncertain due to imperfections of the model structure and inevitable uncertainties of input data. The trend towards monitoring of combined sewer overflows (CSO) structures produces more and more data which can be used to replace parts of the models and reduce uncertainty. In this study we use highly resolved online flow and quality monitoring data to optimize static outflow settings of CSO tanks. In a second step, the additional benefit of real time control (RTC) strategies is assessed. In both cases the aim is the reduction of CSO emissions. The methodology is developed on a conceptual drainage system with two CSO tanks and then applied to a case study area in Southern Germany with six tanks. A measured time series of six months is sufficient for reliable optimization results in the conceptual catchment as well as in the case study area system. In the investigated system the choice of the optimization objective (minimum overflow volume or total suspended solids (TSS) load) had no significant influence on the result. The presented method is particularly suitable for areas in which reliable monitoring data are available, but hydrological parameters of the catchment areas are uncertain. One strength of the proposed approach lies in the accurate representation of the distribution of emissions between the individual CSO structures over an entire system. This way emissions can be fitted to the sensitivity of the receiving water body at the specific outlets.
1. Introduction
Combined sewer overflows (CSO) during rain events can severely impact the ecological and chemical status of surface waters (e.g., [1,2,3]). High peak flows, oxygen depletion due to excessive organic loads from single events, ecotoxic concentrations of ammonia (NH3), and siltation of the water body by fine sediments are the most relevant impacts of combined sewer discharges on receiving waters [4,5,6]. Especially when the receiving water body is small and sensitive, CSOs can cause significant damage to the aquatic ecosystem [7,8,9,10]. Emitted volumes and loads of CSOs are often of similar, or greater magnitude than the emissions from wastewater treatment plants (e.g., [11,12,13]).
Storage volumes within sewer systems lower the hydraulic load of the wastewater treatment plant (WWTP) and reduce combined sewer discharges to surface waters. Conventionally operated urban drainage systems are very rigid [14]. Adjusting the controlled outflows from storage structures within the sewer system is the only way to modify and enhance the sewer system performance in an existing system without capital intensive construction measures. In addition, changing precipitation characteristics due to climate change and surface sealing due to ongoing urbanization will further increase the impact of CSOs and their negative consequences (e.g., [15,16,17]).
Nowadays, many urban water management systems try to find a favored decision from a list of options. In recent years, mathematical optimization techniques have been exploited broadly to aid these decision-making procedures by assessing the performance of different alternatives [18,19,20]. These techniques’ applications include the optimal planning and design of urban drainage systems (UDSs) (e.g., [21,22,23,24,25]) optimal UDS retrofitting and rehabilitation strategies (e.g., [26,27,28,29,30,31,32,33,34]), and optimizing control and the operation of UDSs (e.g., [35,36,37,38,39,40]). As the main domain of the present study is optimizing the operation of UDSs, in the following paragraphs we review previous studies in this field.
Previous studies have shown that the static optimization of controlled outflows in the system and dynamic real-time control can help in adapting the drainage system to changing boundary conditions and thus effectively reduce emissions (e.g., [41,42,43]).
The controlled outflows from the CSO tanks in the sewer system determine how much combined sewage is transported to the treatment plant, how much water is retained in the CSO tank, and what portion is ultimately discharged into the receiving water. Therefore, the operational efficiency of the storage units within sewer system depends on the controlled outflow settings. Optimizing these outflow settings is therefore an important contribution to reduce emissions from CSOs without building additional storage structures or treatment facilities. In complex systems with many distributed storage units, the optimization of controlled outflow settings is a challenging task.
In practice, as well as in research, this optimization is almost exclusively done based on sewer system models (e.g., [44,45,46]).
Physically-based modelling is the most common approach to simulating sewer networks and combined sewer overflows. Physically-based models characterize the entire sewer system including catchment areas, dry weather flow patterns, transport within sewer systems, and other physical model components. Corresponding model parameters are often hard to determine and high uncertainties are inevitable [47].
During the last decades, data-driven modelling has been used increasingly in sewer system modelling. Neural networks are designed to “learn” the relationship between input and output data [48]. Neural networks are black-box models which do not require characterization of the simulated system. However, the model parameters lack physical interpretation. The neural network is mainly trained to predict the flows based on measured rainfall (e.g., [49,50,51,52]). For optimization and control approaches, a description of system dynamics is required in most cases [53] limiting the use of these models in the optimization and control of sewer networks.
Real-time control (RTC) can be an effective measure to reduce emissions from CSOs (e.g., [41,42,43,54]). However, determining optimal control and operation strategies remains a challenging task. Model predictive control provides adaptive control strategies where the optimal control is calculated recursively with incoming information as rainfall forecasts [55]. These advanced techniques are highly promising for future developments, for example, in smart cities, but too demanding to implement in existing conventionally operated sewer systems.
Evaluation of the efficiency of RTC strategies is often done solely based on simulation results (e.g., [43,56]). However, these modelling results are highly uncertain [57,58]. A major source of uncertainty of sewer system models is the representation of the subcatchments in the hydrological model part (runoff generation and overland flow). Previous studies have identified the effective impervious area as particularly sensitive for stormwater runoff simulations (e.g., [59,60,61,62]). The effective impervious area connected to the sewer is often not, or only vaguely, known in conventionally operated sewer systems. For planning purposes specific scenarios are simulated that reflect the expected development at a given time (10 or 15 years). In reality, the connected area and its hydrological characteristics vary constantly with every construction activity in the catchment. The real development often deviates strongly from the planned development. The situation is becoming increasingly complex with the trend toward low-impact drainage such as permeable pavements and green roofs.
Additionally, pollutant loads, which often are the target of optimization and RTC, are represented insufficiently within sewer system models. The observed high levels of uncertainty in stormwater quality modelling may lead to biased results and—as a consequence—to non-optimal decisions in design and operation.
Previous data evaluation, as well as in the presented study, show major differences between modelling results and measured data [63]. Calibrating sewer system models to measured data can reduce model uncertainties [64]. However, considerable uncertainties inevitably remain due to the model structure. To ensure the continuous accuracy of the model, this calibration has to be performed repeatedly, which is rarely done in practice. In addition, the planning process is based on an assumed development of the catchment within planning horizons >15 years. Based on the simulation for the planned state of the catchment, the static outflows of the CSO tanks are adjusted. This results in an operation lasting several years for a future state of the system. Not only is it uncertain if that state is ever attained, the dynamic development of the catchment is neglected entirely. This adds to the uncertainties in the planning and operation of CSO tanks.
Several types of sensors have reached a mature stage and are well applicable in urban drainage systems [65]. The political will, at least in some German federal states, also calls for broad equipment of CSO structures with measuring devices [63,66]. Therefore, a general trend towards more and continuous monitoring of combined sewer overflow structures is developing, providing an ever-growing database to improve design and operation. This development will further increase the number of use cases of the presented methodology.
We present and evaluate a new methodology for optimizing the operation of wastewater systems based on measured discharge and quality time series as an alternative to conventional sewer network modelling. Instead of calibrating the model with measured data, we replace the hydrological model part by the measured flow and quality time series as input to a transport model. This approach excludes all uncertainties from hydrological modelling and replaces them with the uncertainties of the measured data itself.
In practice, although continuous monitoring in sewer systems is increasing, measured data are only available for limited periods of time and can only reflect the current status. The sewer networks are changing constantly due to construction measures within the sewer system and connected catchment areas. For data-based optimization of the sewer system, a uniform system behavior must be ensured. All sensors have to be operating without disruptions and no exceptional operating conditions (e.g., maintenance work or malfunctions) should occur. Therefore, it is important to know the lengths of the required time series to gain reliable and robust optimization results.
Conventional modeling can predict various scenarios of land development, but optimization of the current state is often more uncertain. So why not optimize the existing status in regular time intervals instead of modelling an uncertain future development state? The databased optimization method decouples the highly uncertain hydrological model from the more accurate transport model and still allows evaluation of different operational scenarios under real runoff regimes. Considering that measurement of overflows is mandatory in some German federal states, this offers a wide range of applications for this robust and pragmatic method for optimizing combined sewer system operation. The use cases for the methodology are small systems which have no existing infrastructure or staff to operate high maintenance RTCs.
The scope of this work includes an assessment of the robustness and applicability of the new methodology. The research questions of this work are:
- How long are time series required to be to produce robust and reliable optimization results?
- What influence does the optimization objective have on the results?
- How great is the realistic optimization potential in conventionally operated sewer systems?
- What additional benefit does RTC bring in terms of reducing emissions?
2. Materials and Methods
2.1. Measured Data
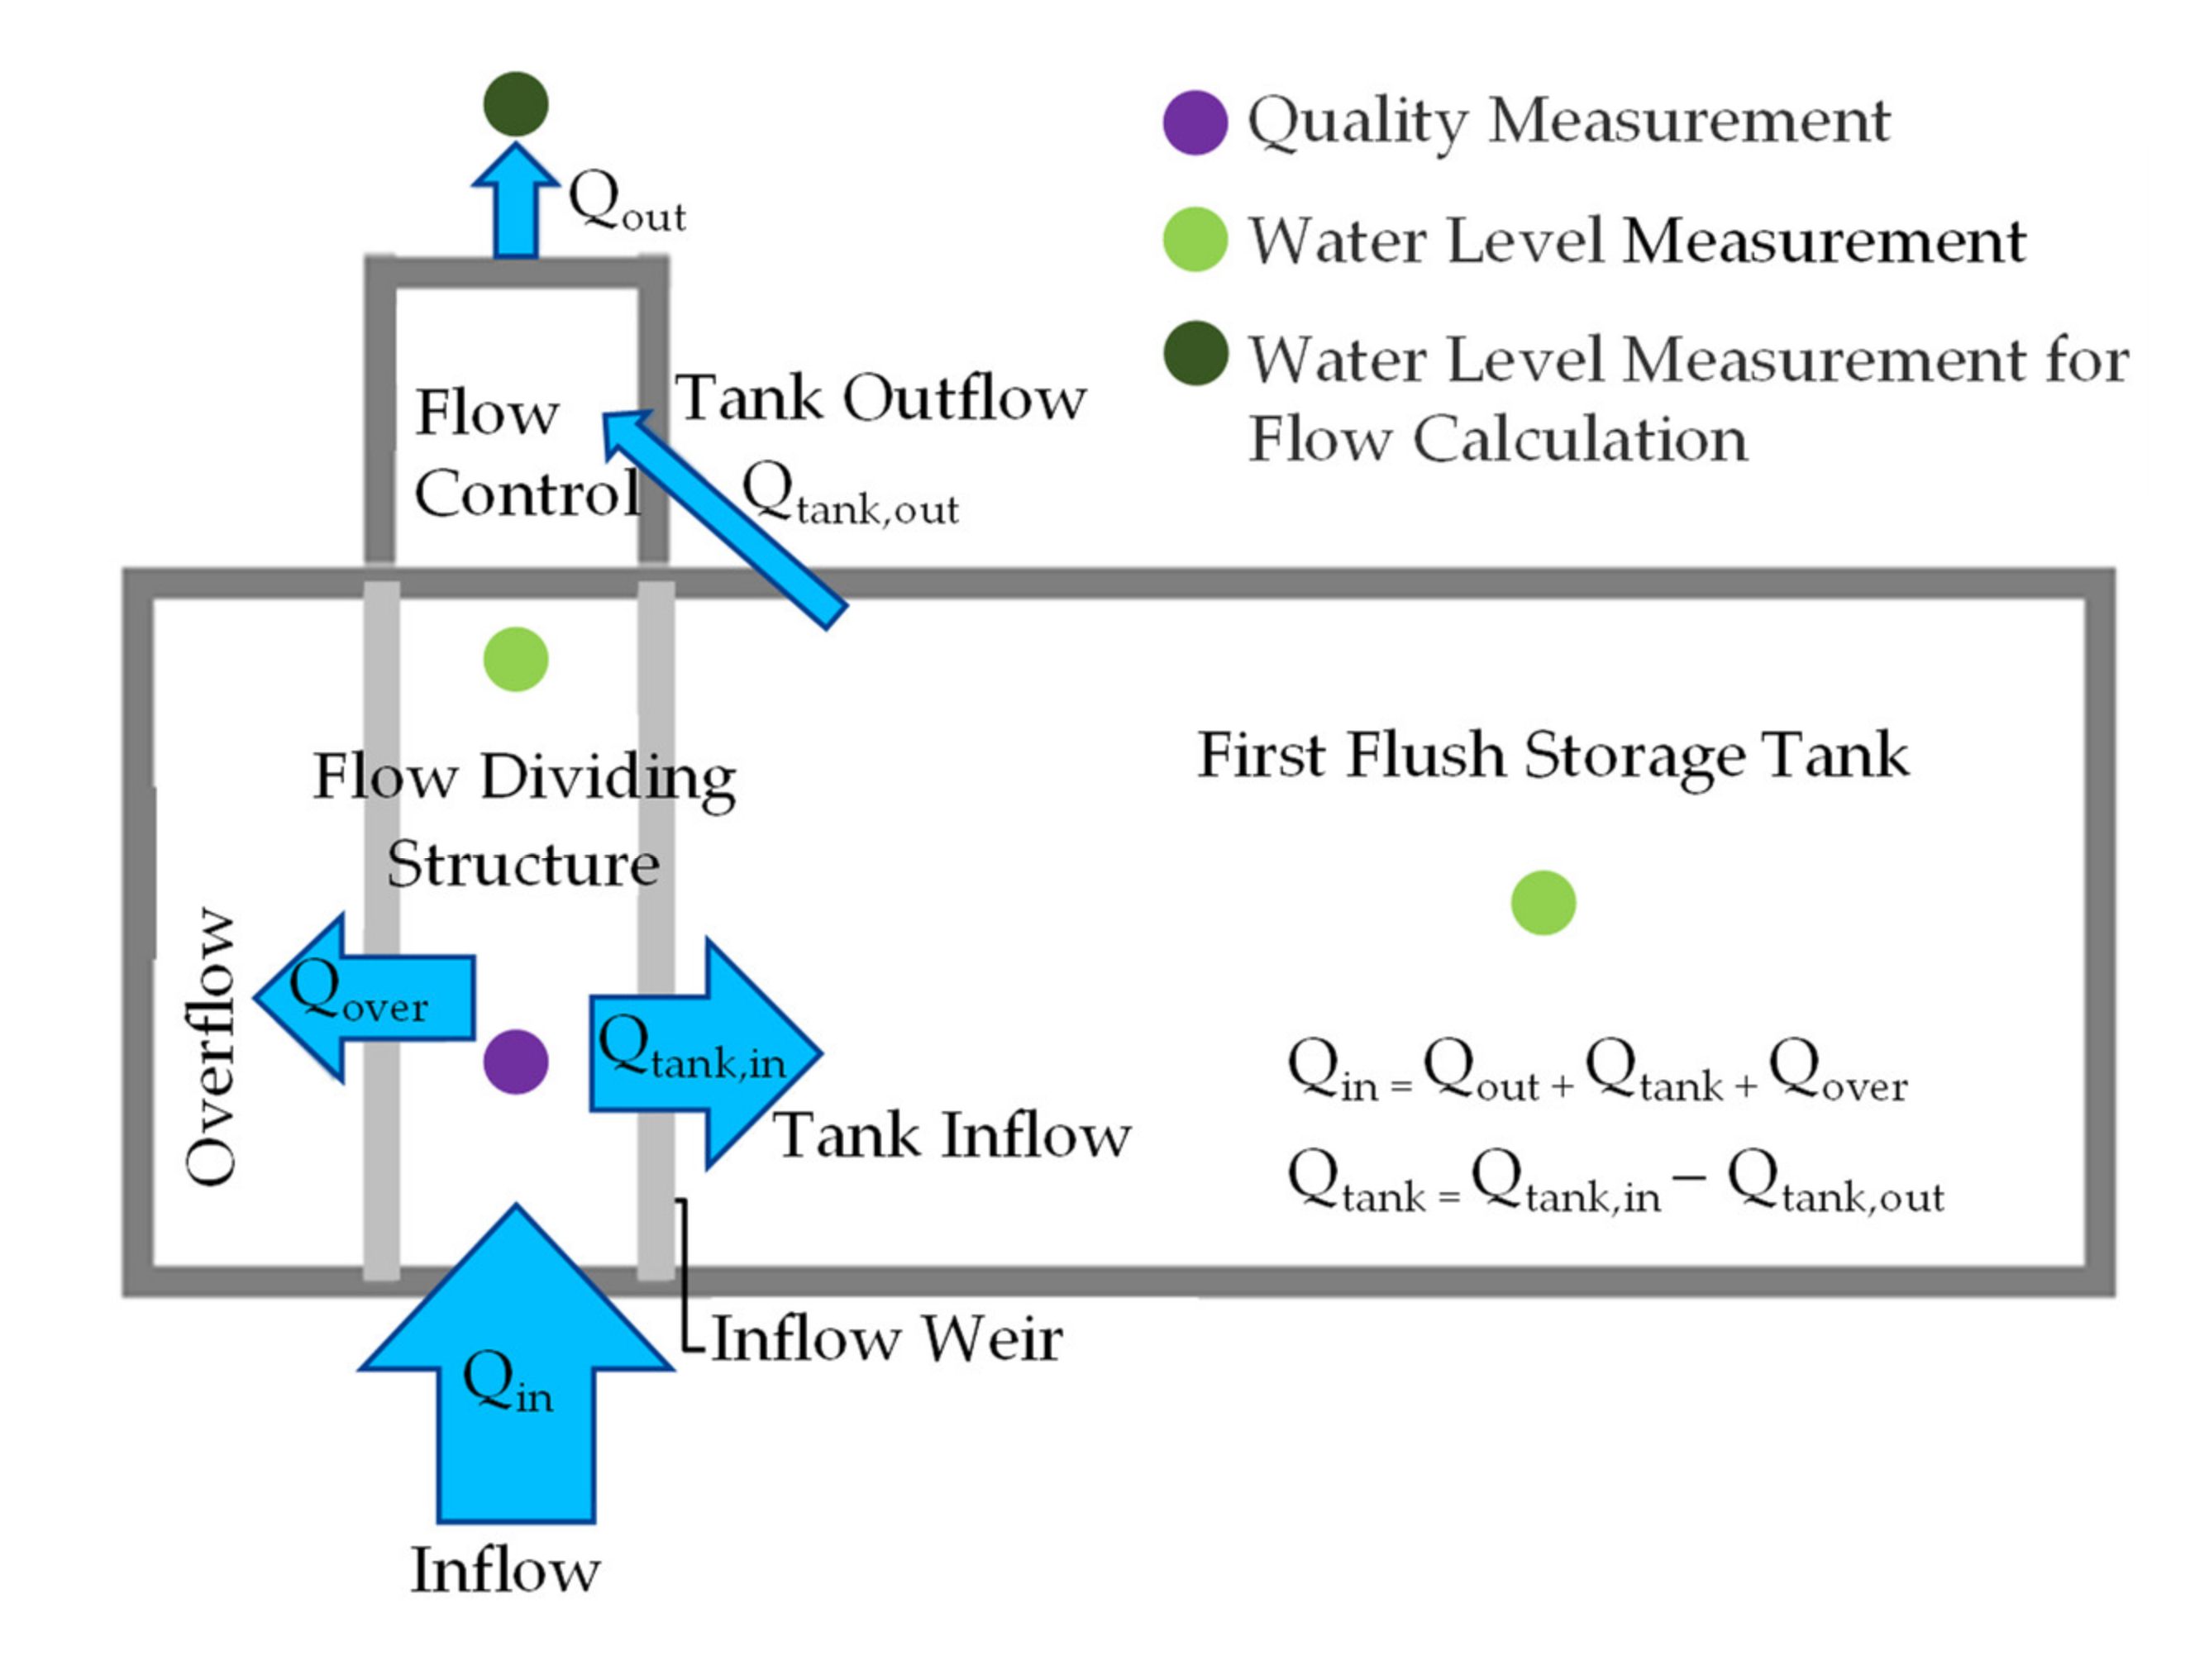
Two combined sewer overflow tanks in southern Germany were equipped with online spectrometer probes for two years. Hydrometric measurements and precipitation data at the CSO tanks were provided by the operator of the sewer system. The catchment and CSO tank characteristics for both subcatchments are given in Table 1. Effective impervious areas were determined by evaluating rainfall-runoff balances for the measured data from August 2014 until June 2016. Controlled outflows were chosen proportional to the effective impervious area.
Inflow from the subcatchments was calculated based on controlled outflow measurements and water level changes within the tanks according to Figure 1. Concentrations for total suspended solids (TSS) were not measured directly, but absorption spectra were recorded and from these spectra equivalent concentrations for TSS were calculated. The TSS equivalent concentrations were monitored in the flow-dividing structure of the CSO tanks by online UV/Vis spectrometer probes (s::can spectro::lyser, 200–750 nm; optical path length 2 mm) in 5 min intervals. The global sensor calibration “Inflow Wastewater Treatment Plant” provided by the manufacturer was used. Flow and water level data were measured in 1 min intervals. Quality and flow time series from the inflow of both tanks were available for 680 days from August 2014 until June 2016.

2.2. Data Based Static Optimization
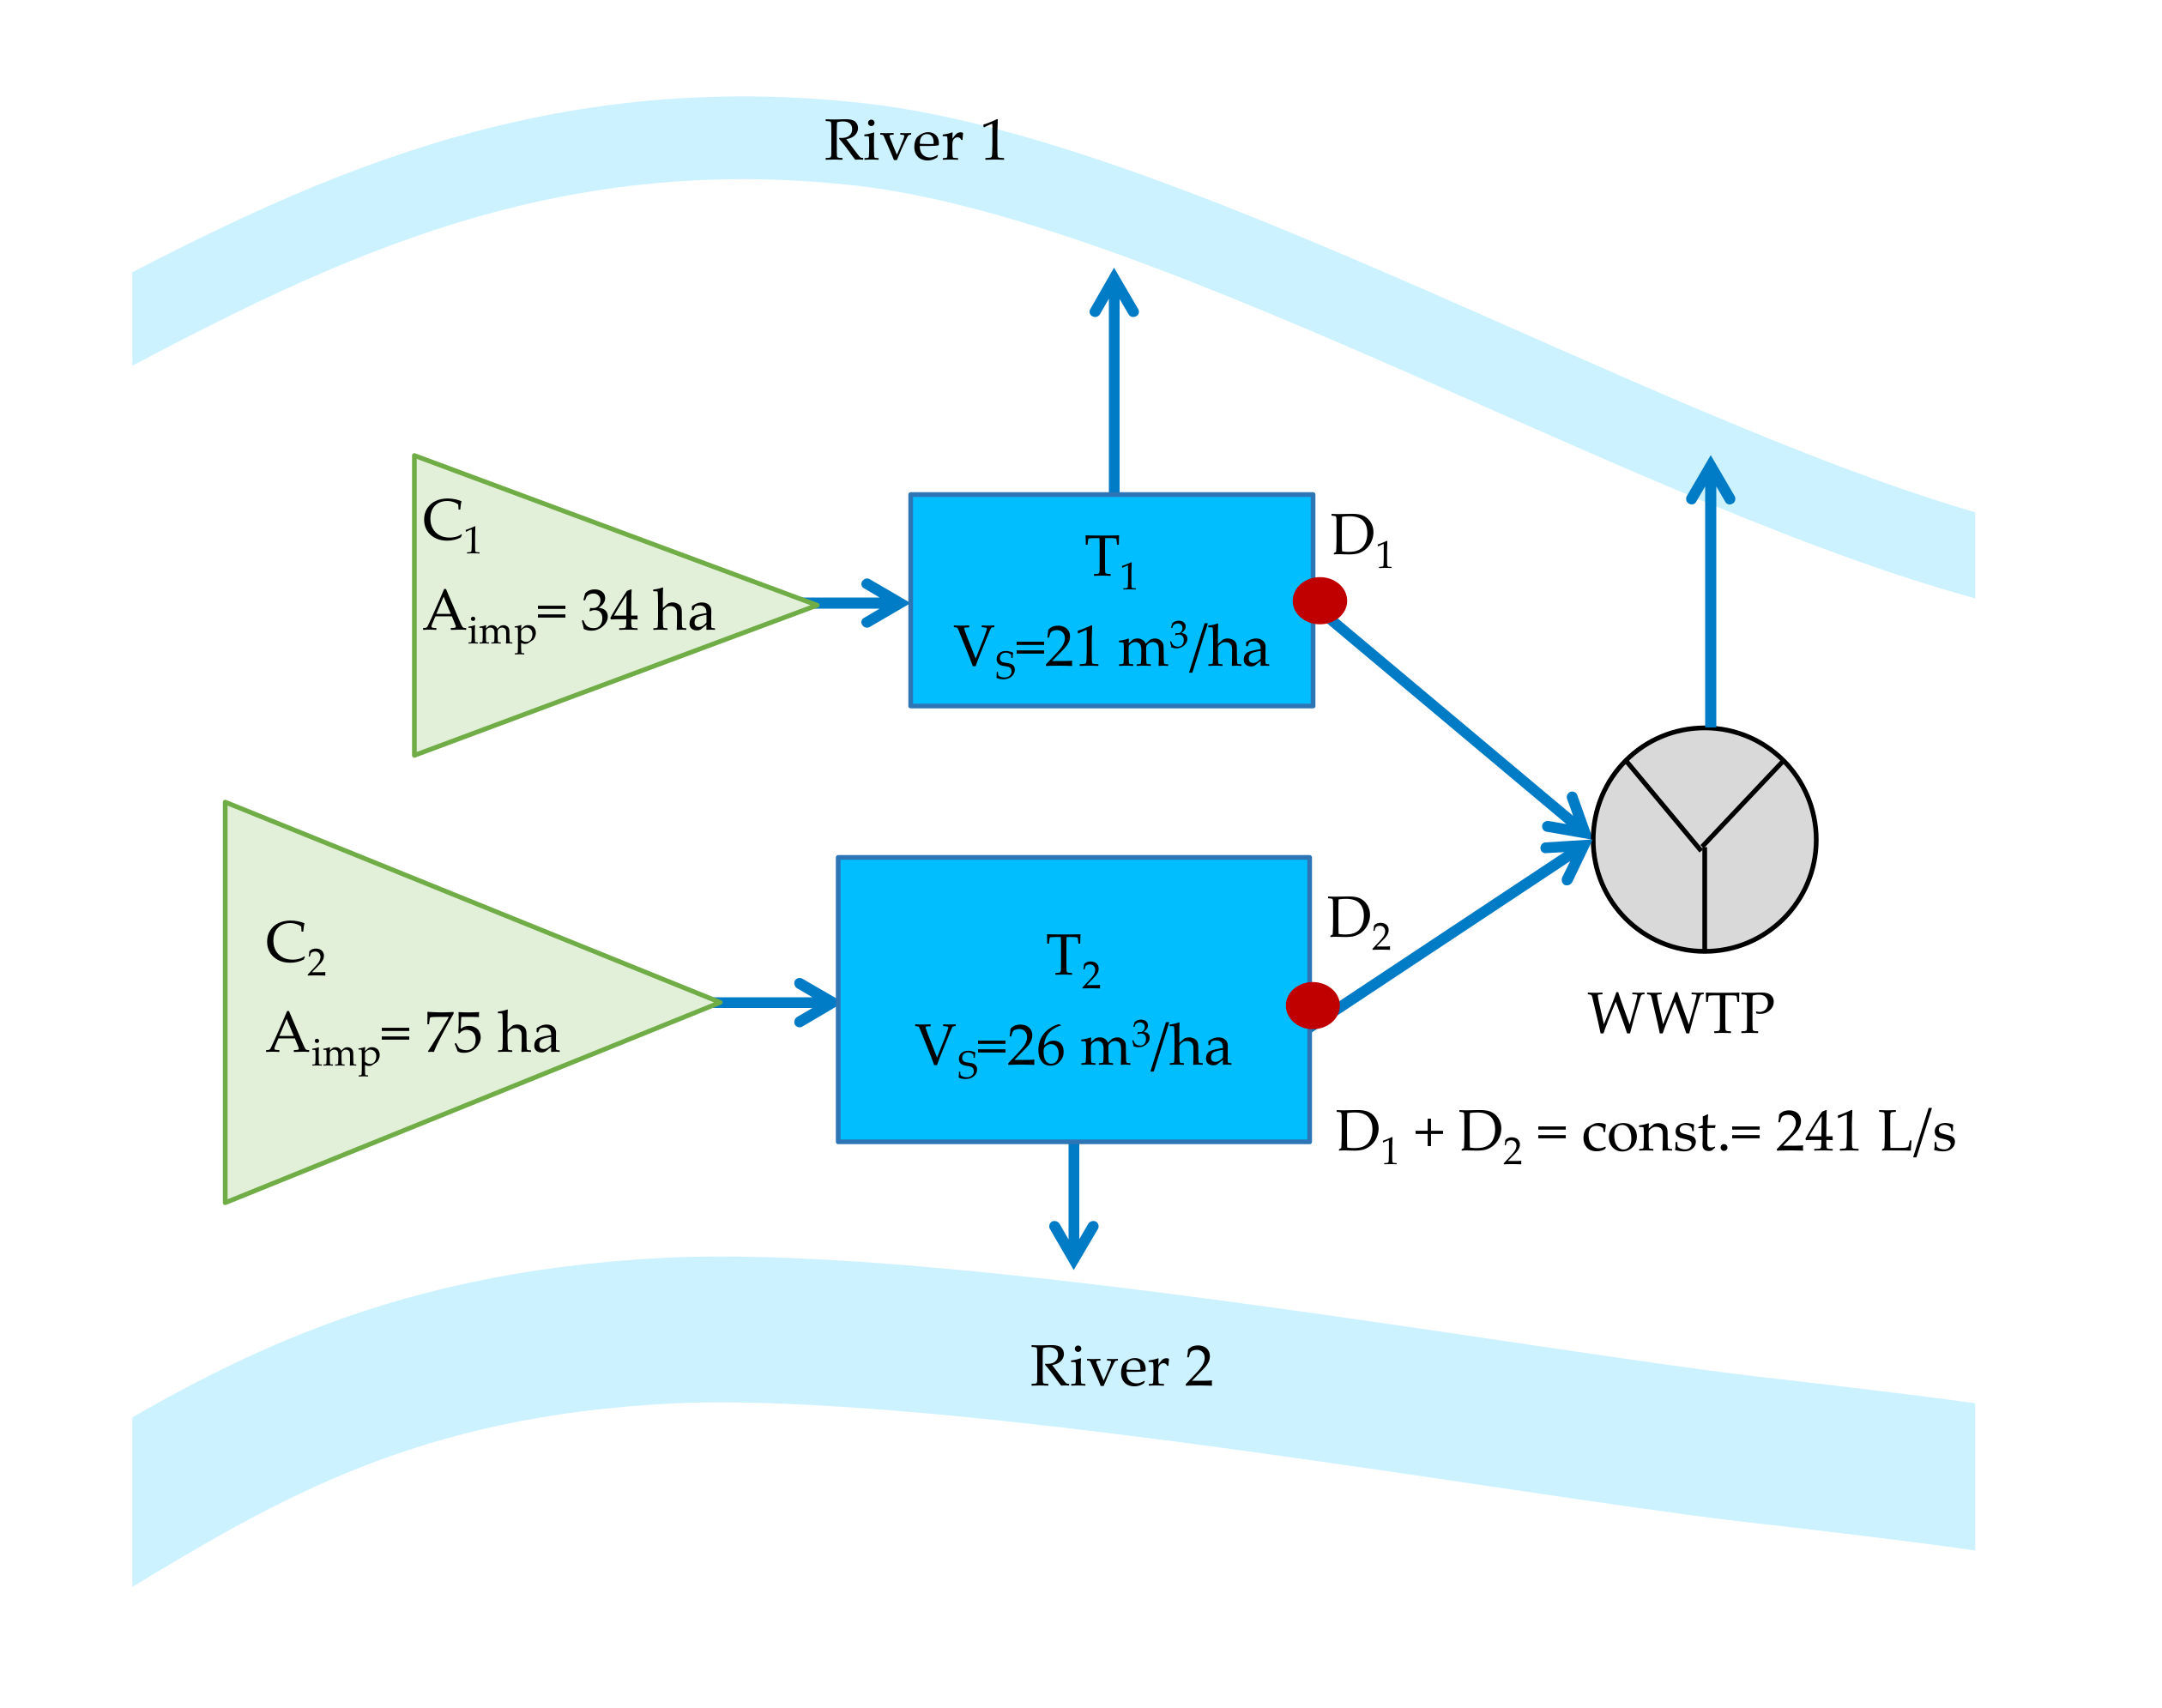
For data-based optimization, the system described was conceptualized. Tank sizes and geometries were adapted from the two existing CSO tanks for which the measured time series were obtained from (see Figure 2). To evaluate the method’s applicability and understand the general relationships, the additional CSO tanks in the real sewer system were not considered. Instead, the two CSO tanks were connected directly to the WWTP. The combined outflow of both tanks was restricted by the treatment capacity and therefore limited to 241 L/s.
The system was set up in the Storm Water Management Model (SWMM) version 5.1.007 (United States Environmental Protection Agency, Washington, DC, USA) [69] without implementation of subcatchments and rain gauges in the hydrological model part (see input file in Supplementary Material). Instead, measured inflow and TSS concentration time series were inserted directly into the model as inflow at the nodes for a total simulation period of 680 days from August 2014 until June 2016. Simulations were run under kinematic wave flow routing.
The controlled outflows from the two CSO tanks are the decision variables. Outflow settings for minimum emissions were determined using the simulated annealing algorithm in MATLAB [70] with a total of 16 months of measurement data as input. In all evaluated scenarios the sum of the controlled outflows from both tanks (D1 + D2 = inflow to WWTP) was kept constant. The following optimization objectives were assessed:
- Minimization of total overflow volume from both tanks
- Minimization of total TSS overflow load from both tanks
- Minimization of total overflow duration from both tanks
Mathematically, the optimal controlled outflows of the CSO tanks in this study can be formulated as
where dopt is the optimal choice for the decision variables d that define the controlled outflow of each tank Di. d is the vector of decision variables generated by the optimization engine and S is the feasible search space where all constraints are satisfied.
The quality of the optimization results depends on the measured data used for optimization. Therefore, different durations of the measured data times series were taken as input for the data-based optimization to determine minimum timeseries lengths for robust optimization results. Additionally, different error types were imprinted on the time series to evaluate the influence on the optimization results.
2.3. Data Based Evaluation of Dynamic RTC Strategies
Dynamic RTC strategies were programmed in SWMM’s internal control editor. Both, volume and quality based RTC strategies based on the results of static outflow optimization were evaluated. In the volume-based RTC scenario a rule-based control algorithm was implemented depending on the tanks’ water levels: Starting from optimal static outflow settings for minimum total CSO volume, the controlled outflow at tank 1 is increased by 31 L/s and the outflow of tank 2 is reduced by 31 L/s correspondingly if tank 1 is filled more than 87.5% and tank 2 is filled less than 50%. If tank 2 is filled more than 87.5% and tank 1 is filled less than 50% the controlled outflow from tank 2 is increased by 35 L/s and the outflow of tank 1 is decreased by 35 L/s (Volume Based Control Rule in Supplementary Material).
The quality-based RTC scenario additionally took online TSS measurements into account by directly reading the TSS inflow concentration time series: Starting from static optimal controlled outflows for minimum emitted load, the inflow concentration from tank 1 is increased by 66 L/s and the outflow from tank 2 is decreased by 66 L/s if the inflow concentration to tank 1 exceeds 100 mg/L TSS while the concentration at tank 2 is less 100 mg/L. If the TSS inflow concentration to tank 2 exceeds 100 mg/L while the concentration at tank 1 is below 100 mg/L, the controlled outflow of tank 2 is increased by 33 L/s and the outflow from tank 2 is decreased by 33 L/s, respectively.
The advanced quality-based scenario additionally considers the remaining capacity within the sewer system. The above-described comparison of the inflow concentrations is only performed if at least one of the CSO tanks is currently spilling into the receiving water (Advanced Quality Based Control Rule in Supplementary Material).
As a benchmark for the evaluation of optimization results and RTC strategies, the theoretical potential of the volume-based RTC was assessed by allocating the storage volume of the two CSO tanks in one central tank combining both tank volumes (see [71,72]). This approach allows determining of the minimum overflow volumes under a perfect control strategy. This theoretical optimum represents an upper limit for the effectiveness of an RTC. Hydraulic restrictions or flow times between the tanks are not taken into account [71].
2.4. Case Study
To evaluate the applicability and potential for the reduction of overflows, the presented static optimization approach was applied to a real combined sewer system in southern Germany. The system consists of six CSO tanks conveying the combined wastewater to a pumping station (PS), serving as the limitation for the combined controlled outflows (see Figure 3). The data set consists of four years of high resolution (≤5 min) time series of water level and outflow measurements for five of the six tanks. The sixth tank solely contains a water level measurement and a Q/h-relationship between water level and outflow. Based on the measured outflows and water levels the runoff conveyed to the CSO tanks (Qin) was calculated as follows:
where Qout is the measured outflow or a function of the outflow and water level in the tank. During the filling phase, the runoff exceeding the outflow is represented by the change in water volume in the tank over time (dV/dt). Once the tank is discharging into the receiving water the overflow (QOver) is calculated with the free overflow equation by Poleni–Weisbach. Time periods with technical failures or flooding by the receiving water were excluded entirely. Resulting in inflow time series of 1159 days with undisturbed operation for all six tanks in the investigated system.
As a first step, the conventional hydrologic model (including rainfall-runoff simulation) for the study area was reviewed to ensure high quality input data. A calibration of this model was not performed. This model was used as a reference to evaluate the capabilities and limitations of both approaches.
Secondly, the system was optimized based on the measured time series using the method described above. By optimizing the controlled outflows based on sections of the time series (1–12 months) the robustness of the optimization approach and the required lengths of a measured time series were investigated. Additionally, repetitive optimizations were carried out to evaluate the capability of the data based optimization to find a near global optimum.
Furthermore, weighting factors were implemented in the optimization algorithm to be able to prioritize specific tanks. Using these factors, the reduction of overflow activity at the weighted tank is emphasized in the optimization results. This allows for an aimed reduction of overflow activity at the weighted CSO tank.
3. Results and Discussion
After approximately 200 iterations in the conceptual catchment, the termination criterion (50 iterations with no significant (<10−3) change in optimization objective) for the simulated annealing was met and optimal static controlled outflow settings were reached.
Optimized outflows of tank 1 for a minimum emitted load or volume were very similar with 66 L/s and 70 L/s, respectively (see Table 2). These controlled outflows resulted in less than 0.2% difference for total emitted load and volume. A minimization of total overflow duration led to an increased emitted TSS load during the simulation period of 1% and 0.2% increased total emitted volume. This confirms previous findings that no major variations in first flush characteristics have been observed within this system [68].
In an ideally operated sewer system, the controlled flows should be weighted by the effective impervious area to evenly utilize the storage volume during rain events. This results in an even filling, spilling, and emptying of the storage tanks and therefore minimizes emitted volumes. Effective impervious area-weighted controlled outflows as reference can be found in Table 1.
The area weighted controlled outflows generated 0.9% increase in emitted volume and 0.3% increase in load compared to the measured data-based optimization results. Therefore, area-weighted controlled outflow settings are almost optimal for minimizing CSO emissions, indicating an even spatial distribution of rainfall heights throughout the sewer system.
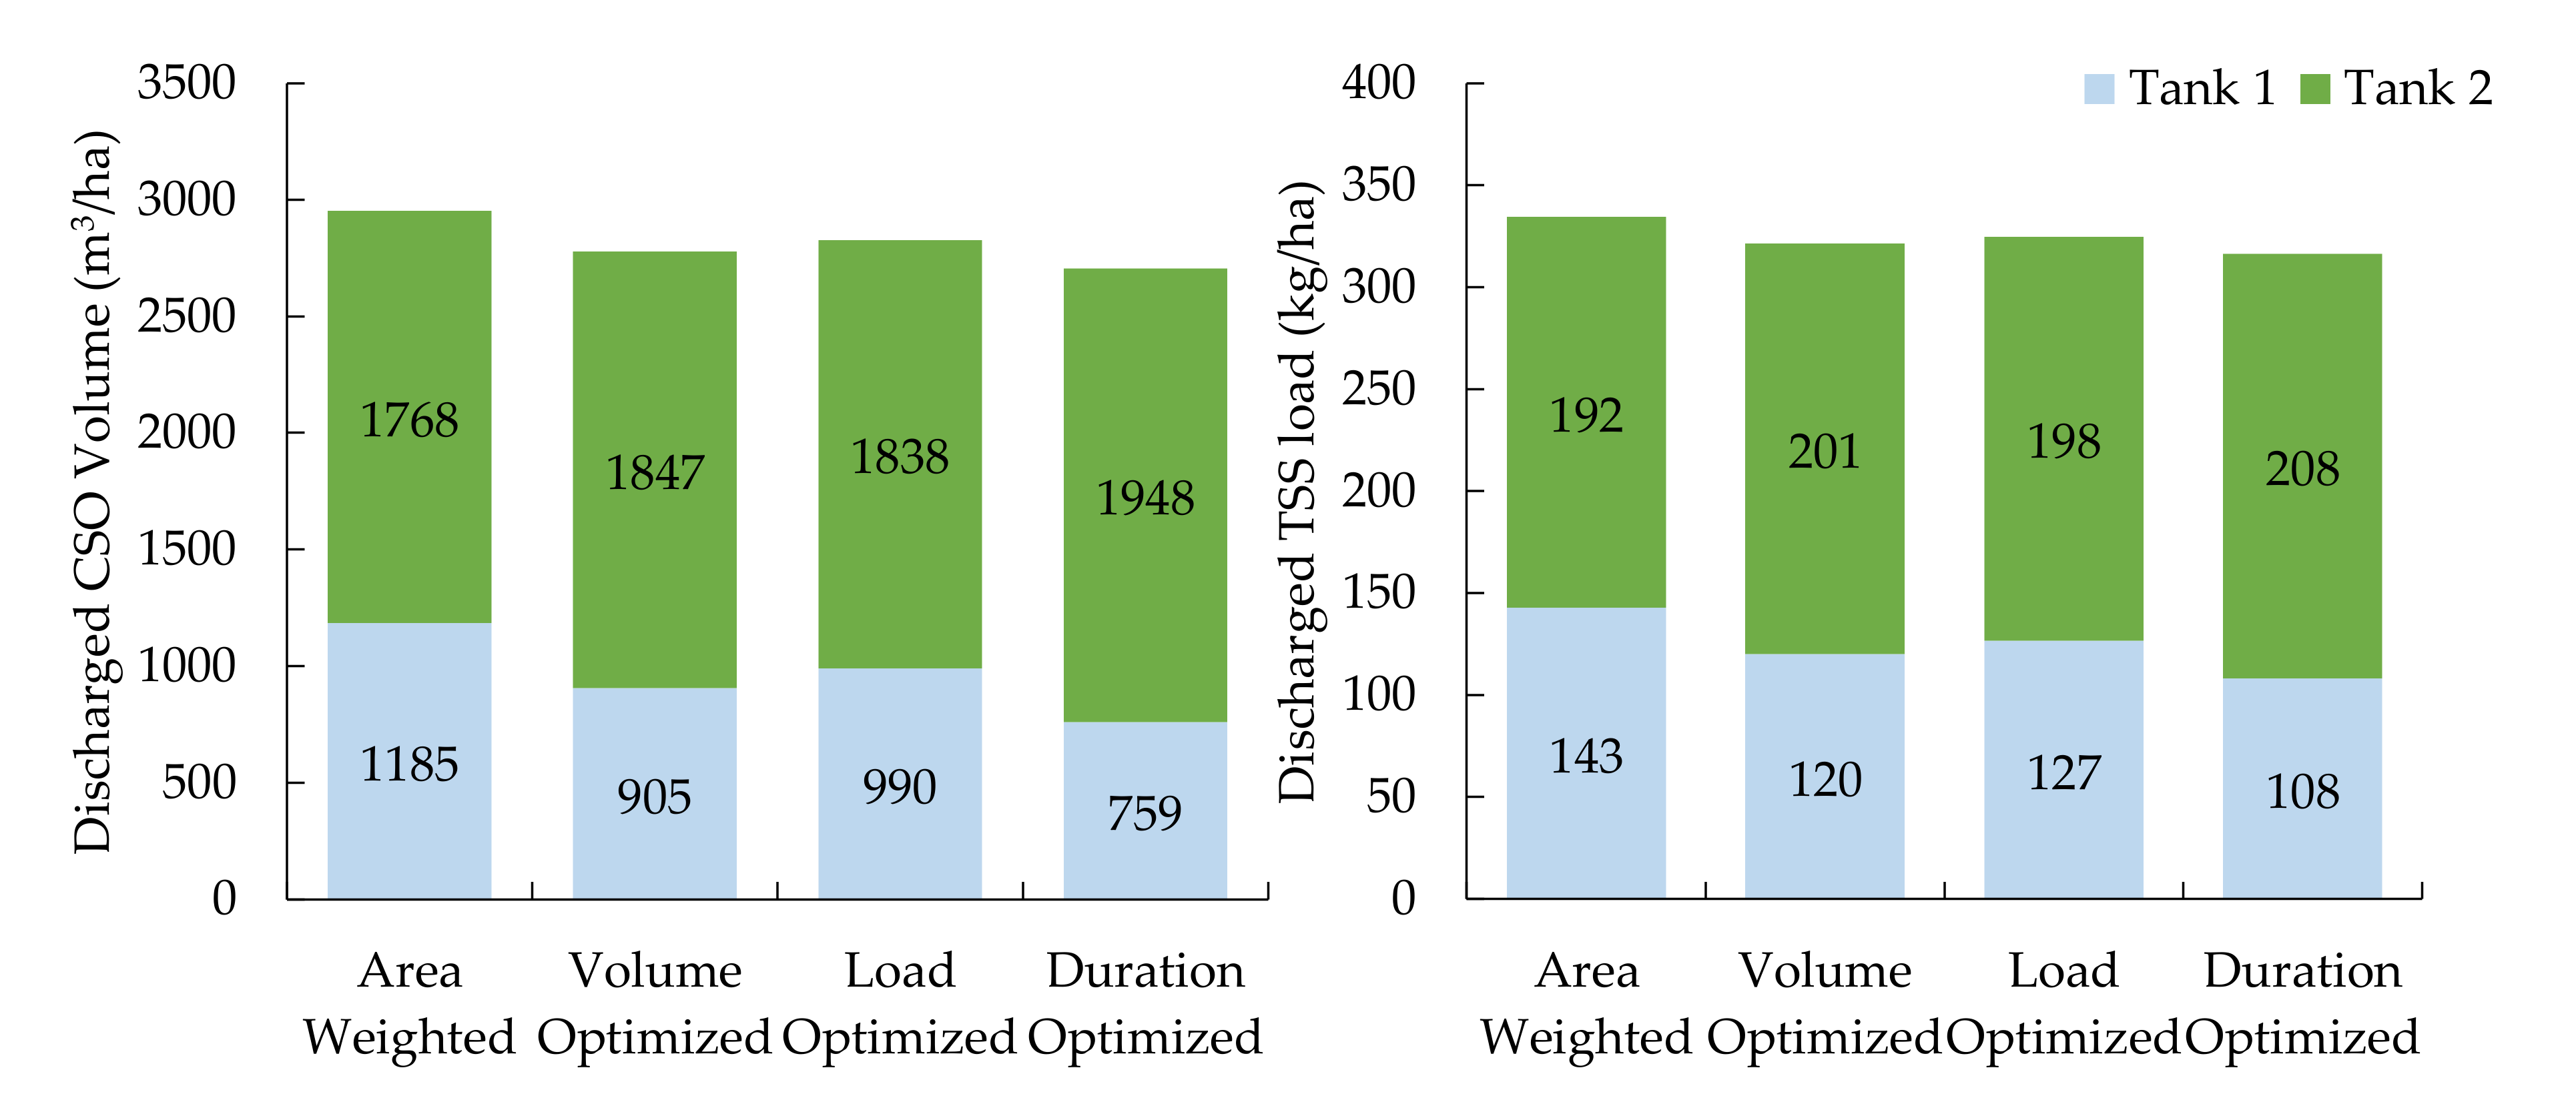
Figure 4 displays the discharged CSO volume and load from both CSO tanks per ha of connected impervious area for the area-weighted controlled outflows and for the optimized controlled outflows under different optimization objectives. The emitted area specific volume and load via CSO tank 2 is 1.5–2 times higher than from tank 1. This cannot be explained by an imbalance of the specific storage volume of the tanks. With 21 m3/ha for tank 1 and 26 m3/ha for tank 2, the storage volume is distributed evenly through the system. This effect is caused by the hydrologic response of the system itself and cannot be considered in planning processes unless measured data is available.
The results also show that a shift of emissions from one tank to another can be achieved by changing the controlled outflows of the tanks with only minor increase of total emissions. A change of the controlled outflow at tank 1 from 70 L/s (volume optimized outflow Figure 4) to 78 L/s (duration optimized outflow) increases the total emitted volume by only 0.3%. At the same time, the emitted volume at tank 1 reduces by 16% from 33,662 m3 to 25,800 m3. In a system where one tank discharges in a particularly sensitive stream, this may by a beneficial management option.
3.1. Robustness of Optimization Results
For data-based optimization of sewer network operation, the length of the underlying measurement time series is of particular importance. For this reason, the system was optimized for different lengths of the measured time series.
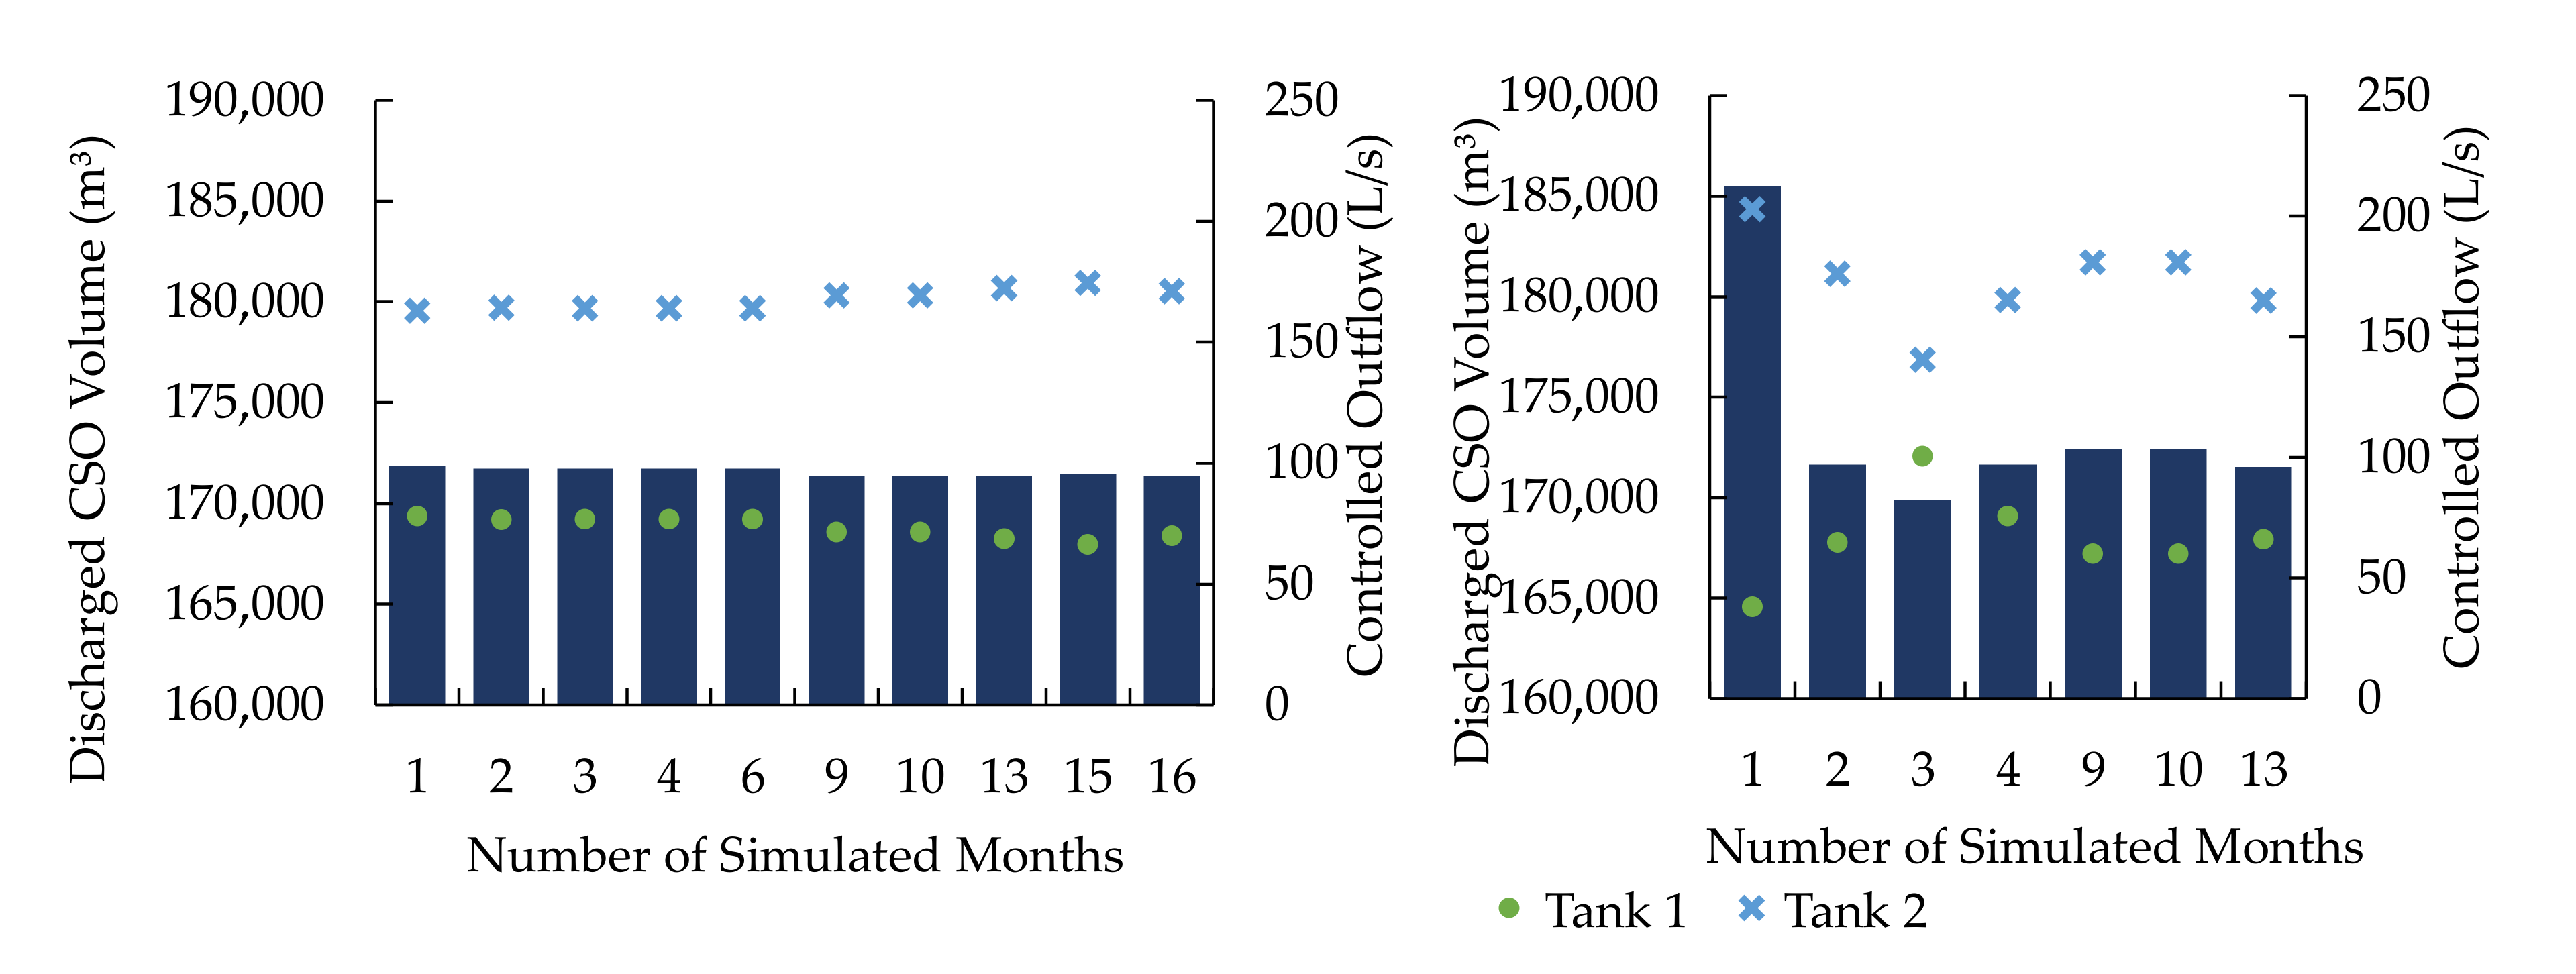
The results of the optimization with the goal to minimize the total emitted load of TSS depend much more on the length of the underlying time series than the volume-based optimization (see Figure 5). An optimization with the aim to minimize emitted CSO volume, therefore, delivers more robust results. With increasing time-series lengths, the optimization results of the load and volume-based optimization approximate each other.
A time series input of four months is sufficient for sewer system optimization in the conceptual system. Using this database, robust optimal controlled outflows for both CSO tanks can be obtained. The number of overflow or rain events during this optimization period does not seem to have a major influence on optimization results as long as a minimum of 10 rain events within the measured data period is exceeded. The expected correlation between number of events and goodness of optimization results was not found (see Figure S1 in Supplementary Material).
One aim of the sewer system optimization based on measured data was to exclude errors and uncertainties caused by the hydrological model during conventional sewer system modelling. However, the measured data itself is also subject to uncertainties and measurement errors. Only if these are not significant, can robust optimization results be obtained with the measured data-based approach. To evaluate the influence of these errors on the optimization results, different error types were imprinted artificially on the measured data before sewer system optimization. The influence of different error types on the optimization results is shown in Table 3.
Undirected random errors have only minor influence on optimization results. Systematic errors show a stronger influence. However, the optimization still generates controlled outflows close to the optimum. A combination of errors further increases the impact.
Lack of overflow volume measurements at the CSO tanks can lead to simplified inflow balancing. Neglecting flow components in inflow balancing did not lead to satisfactory optimization results. Optimization without considering overflow volumes resulted in equal controlled outflows for both CSO tanks. By neglecting the overflow volumes, almost no overflow events occur anymore and thus the optimization based on volume minimization is not successful. Instead of minimizing the total emitted CSO volume, the optimization objective could be to minimize the deviation of the levels of the CSO tanks from each other. This could improve the optimization results if the overflow quantities are not directly measured.
An optimization with the objective to minimize the deviation of filling levels between both tanks neglecting the overflow component as input data led to controlled outflows of 65 L/s for tank 1 and 176 L/s for tank 2. The emitted volume increased 0.2% compared to the static overflow settings resulting from the minimization of overflow volumes using the complete time series as input. Whether this generally applies in other systems remains to be tested.
Every error type that changed the inflow ratio between both tanks has an impact on the optimization results proportional to the change in the relationship. Consequently, in a system where inflows are changed by the same factor, for example, using a measurement probe with the same systematic error at both sites, the optimization result remains identical.
3.2. Evaluation of RTC Strategies
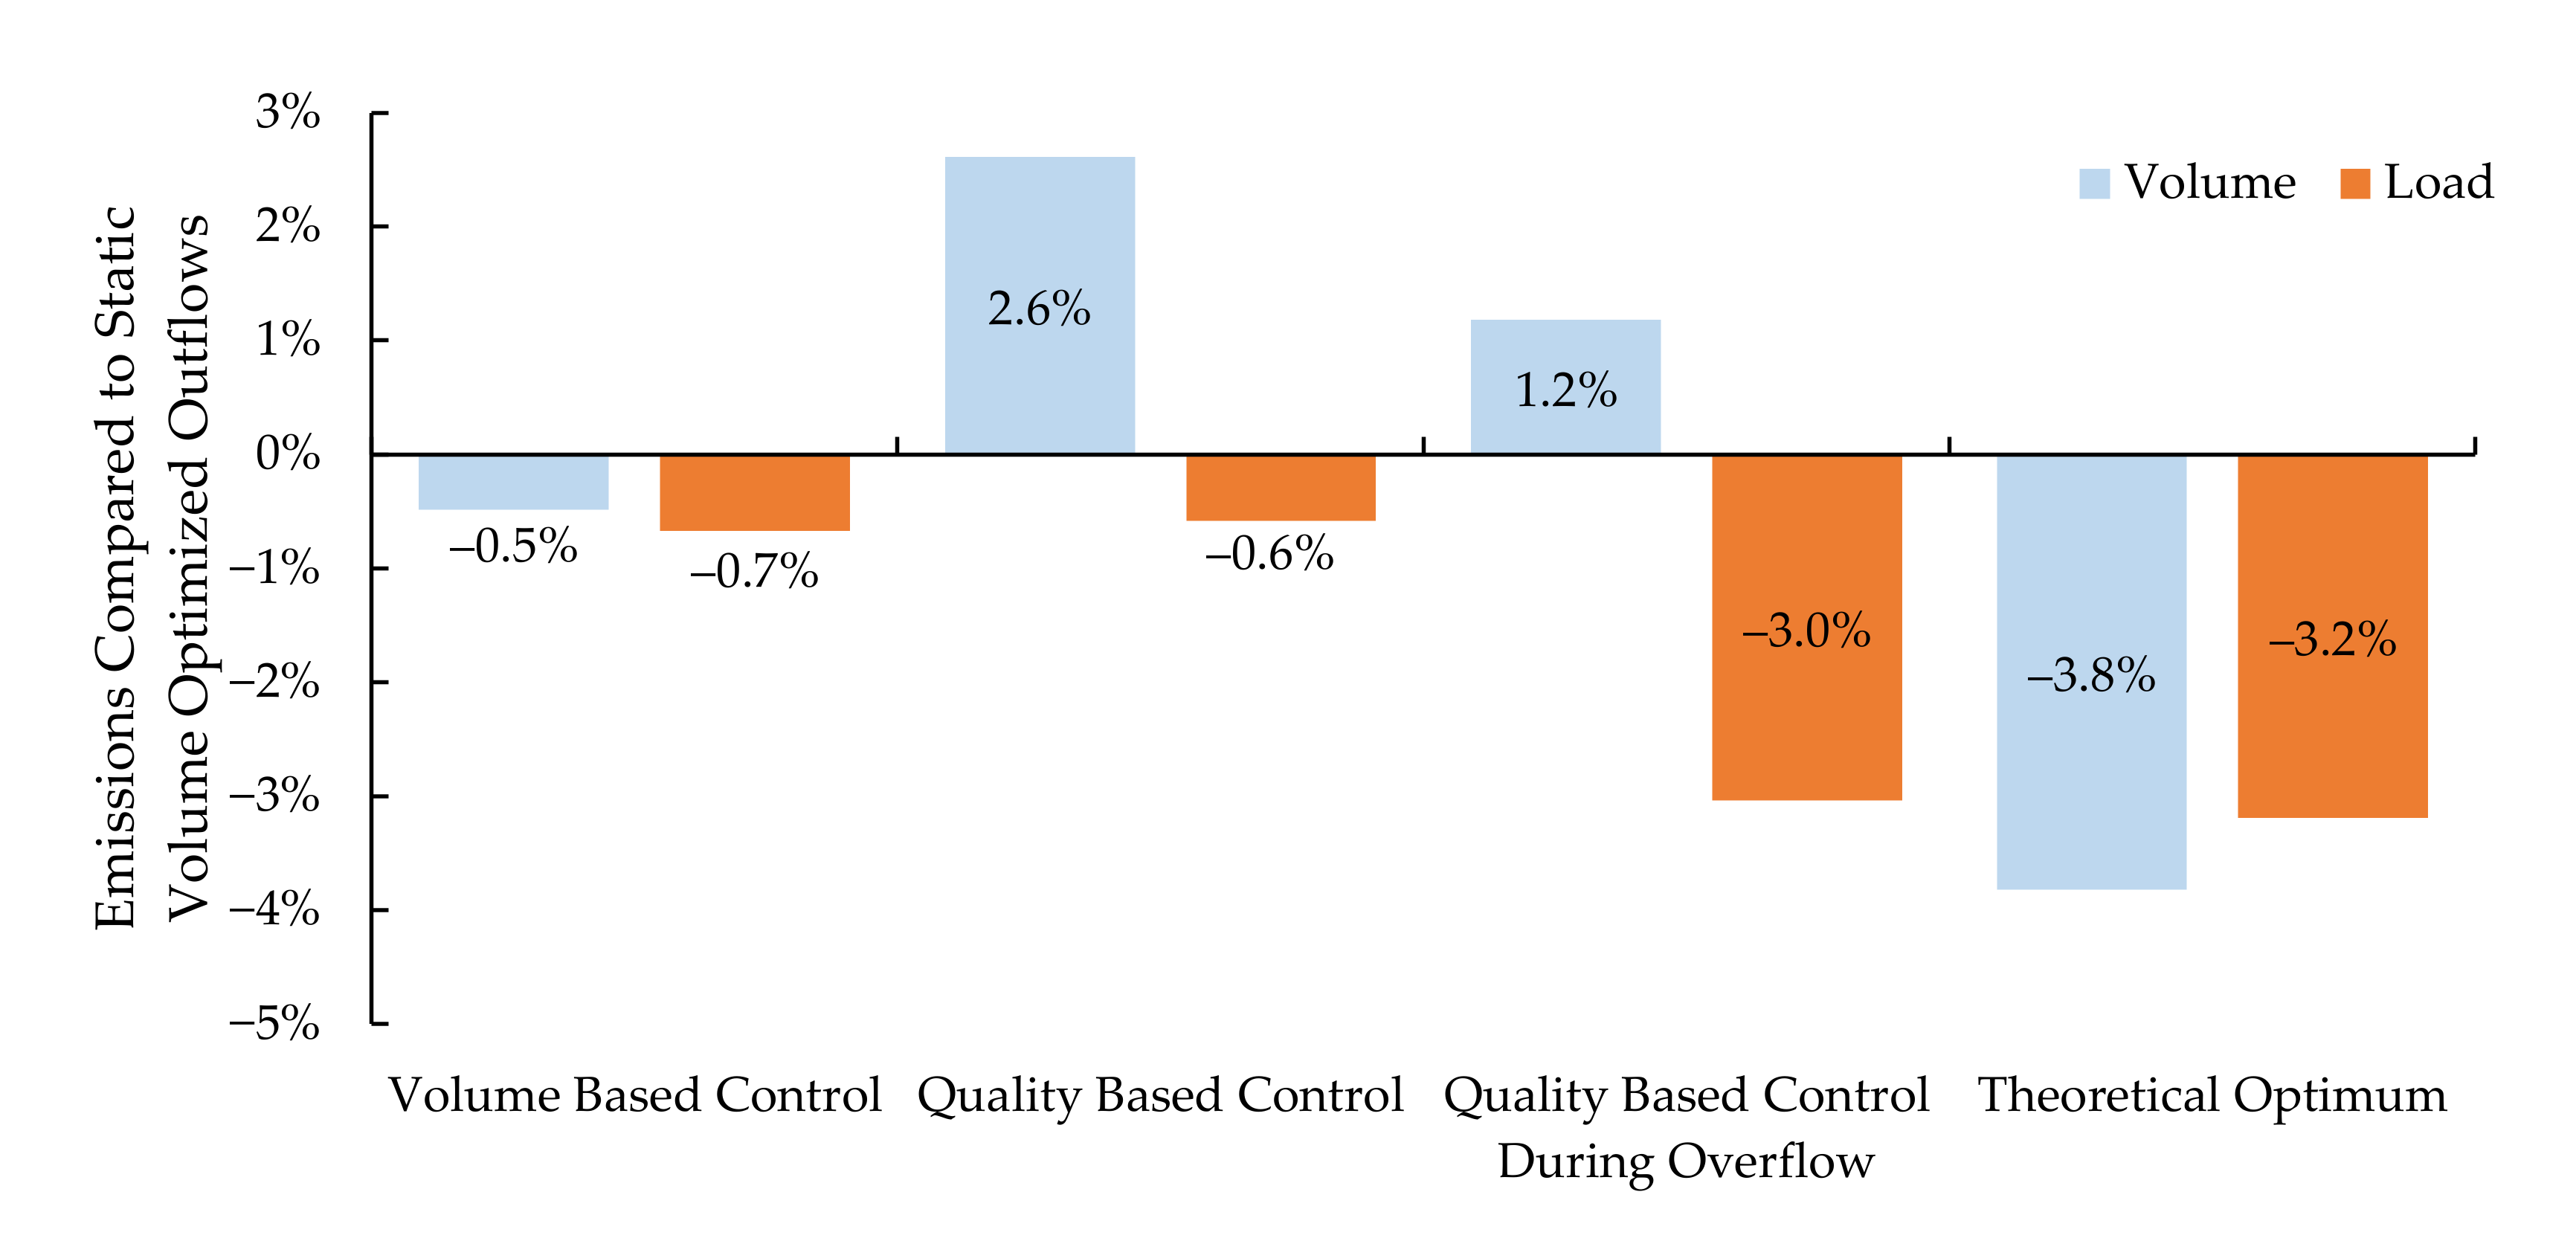
The measured data-based simulation allows the comparison of different control strategies. Figure 6 shows the emission reduction of the different dynamic RTC strategies compared to static controlled outflows optimized for minimum discharged CSO volume. The maximum theoretical potential of a volume-based control is only 3–4% compared to a system with statically optimized controlled outflows. In reality, this theoretical potential cannot be achieved due to flow times between the tanks and the hydraulic capacity of the connected sewer network. Therefore, the real control potential is even lower.
Compared to results from international studies (e.g. [41,43,56,73,74]) the emission reduction potential determined by dynamic control strategies is very low. A comparably low RTC potential was found by [44] for CSO reduction in Barcelona of up to 3%. Low RTC potential was also presented by [75] depending on the respective climatic conditions. Taking uncertainties into account, [76] also found only very small effects of control strategies on the number of CSOs and spilled volumes.
A reason for the small RTC potential in this study could be the small study area comprised of only two CSO tanks. The RTC reduction potential may be higher in larger catchment areas. Furthermore, in most studies, the emission reduction potential of RTC strategies of controls is only given in relation to an arbitrary initial system state. No static optimization of controlled outflows is conducted prior to simulating RTC scenarios. This is a major shortcoming of many studies on RTC potential because the effectiveness of the RTC is often overestimated. In this study the RTC potential is assessed compared to an already statically optimized system.
The assessed volume-based control strategy saves 0.5% of the total emitted CSO volume and 0.7% of the total emitted load. The quality-based control strategies are more effective than the volume-based strategy regarding emitted load. With a permanently running quality-based RTC, 0.6% of the discharged solids can be saved compared to optimized static outflows resulting in 2.6% more emitted volume.
The wear of the throttle devices due to permanent changes in the setpoints is an operational disadvantage of an RTC. A quality-based control strategy, which only intervenes under high system utilization, for example, during overflows as assessed in this study, protects the throttle devices in comparison to a permanently operating control. With such a strategy (quality-based control during overflow in Figure 6), the emitted TSS load can be reduced by up to 3% with only 1% increase in volume emissions. For quality-based control strategies, the hydraulic system utilization should therefore always be taken into account.
In all the assessed RTC scenarios, a reduction of overflow volume also led to a reduction of emitted TSS load. In the examined catchment area, volume-based RTC or volume-based static outflow optimizations are therefore always beneficial for the receiving waters. Conversely, a reduction of TSS load does not necessarily lead to a reduction in the overflow volume. Emitting more CSO volume is not generally problematic for the receiving water. In the investigated catchment CSO flows are far below the hydraulic peak in the rivers. However, for dissolved substances, which were not considered in this study, this increase in discharged volume can have a significant impact on peak concentrations of dissolved components within the receiving water. Considering the precautionary principle, the reduction of CSO volume should also be defined as a management goal. From this point of view, volume-based optimization or RTC strategies should be preferred over quality dependent measures.
The total emission reduction by RTC strategies depends very much on control ranges of the tank outflows. The higher the control range, the higher the emission reduction. However, the hydraulic capacity of the sewer network below must be considered in any case for the selection of the maximum controlled outflows in sewer systems. At the same time, with larger deviations from the optimal static outflow settings during RTC operations, the effects of possibly wrong control decisions become greater.
The ecological benefit of the volume-based RTC strategy may be higher than suggested by the 0.5% total reduction in the emitted volumes. As shown in the event-wise evaluation of the CSO volumes (Figure 7) the reduction for the single overflow events ranges from 0 to 100% with an average over all events of 11%. In two events the RTC strategy generates additional 0.4% CSO volume. Especially during small overflow events, the RTC shows its benefit with particularly high emission reduction percentages. Since the water level of the receiving water is usually lower during small overflow events and the CSO volume is less diluted this may bring additional ecological benefits. These aspects suggest larger positive ecological effects of the RTC strategies for the receiving streams than the numerical values might indicate.
The data-based optimization of controlled outflows could also be used in a semi-static approach. Semi-static control strategies automatically optimize controlled outflows in the system at regular intervals. However, these time horizons with a duration of several months are significantly larger than those for real-time controls. The advantage of this type of control is the automatic adaptation of the system to changing boundary conditions, without the technical effort and wear on the throttle devices when operating RTCs. In addition, since the control decisions do not have to be made in real-time, additional security can be achieved by postprocessing the data. This subsequent data preparation step can be particularly useful for measurements that are relatively susceptible to measurement errors such as online quality measurements. If a catchment area is still developing, optimizing the system on a regular basis or after significant changes in the catchment enables operators to achieve an efficient protection of water bodies.
3.3. Estimation of Optimization Potential
The optimization potential in combined sewer systems operated with area weighted controlled outflows is low if effective impervious areas are known precisely. However, in practice the effective impervious areas are often unknown and therefore the sewer systems are not operated under optimal conditions. To assess the true optimization potential, emissions under optimized controlled outflows were compared to a reference scenario in the conceptual catchment. The controlled outflows in the reference scenario reflect an uneven system development. As data analyses from real systems in Germany have shown, this represents a realistic practical operation of the system [63].
The specific controlled outflow at CSO tank 1 was set to 6.6 L/(s·ha) (= 126 L/s) and to 1.4 L/(s·ha) (= 115 L/s) at CSO tank 2. The remaining tank characteristics were not changed and can be found in Table 1.
In the reference scenario, a large proportion of the emitted volume is discharged by CSO tank 2. At CSO tank 1, 10,000 m3 of combined sewage is discharged into the receiving water during 10 overflow events. At CSO tank 2, with 196,000 m3, 20 times the volume is discharged during 47 overflow events. This represents 95% of the emitted volume and 90% of the emitted loads of the entire system. With 82% of the total volume and 79% of the total load, the emissions in the measured data-based optimized system are less emphasized on CSO tank 2. The remaining higher proportion of the total emissions by CSO tank 2 is caused by the overall larger connected catchment area and storage volume of tank 2.
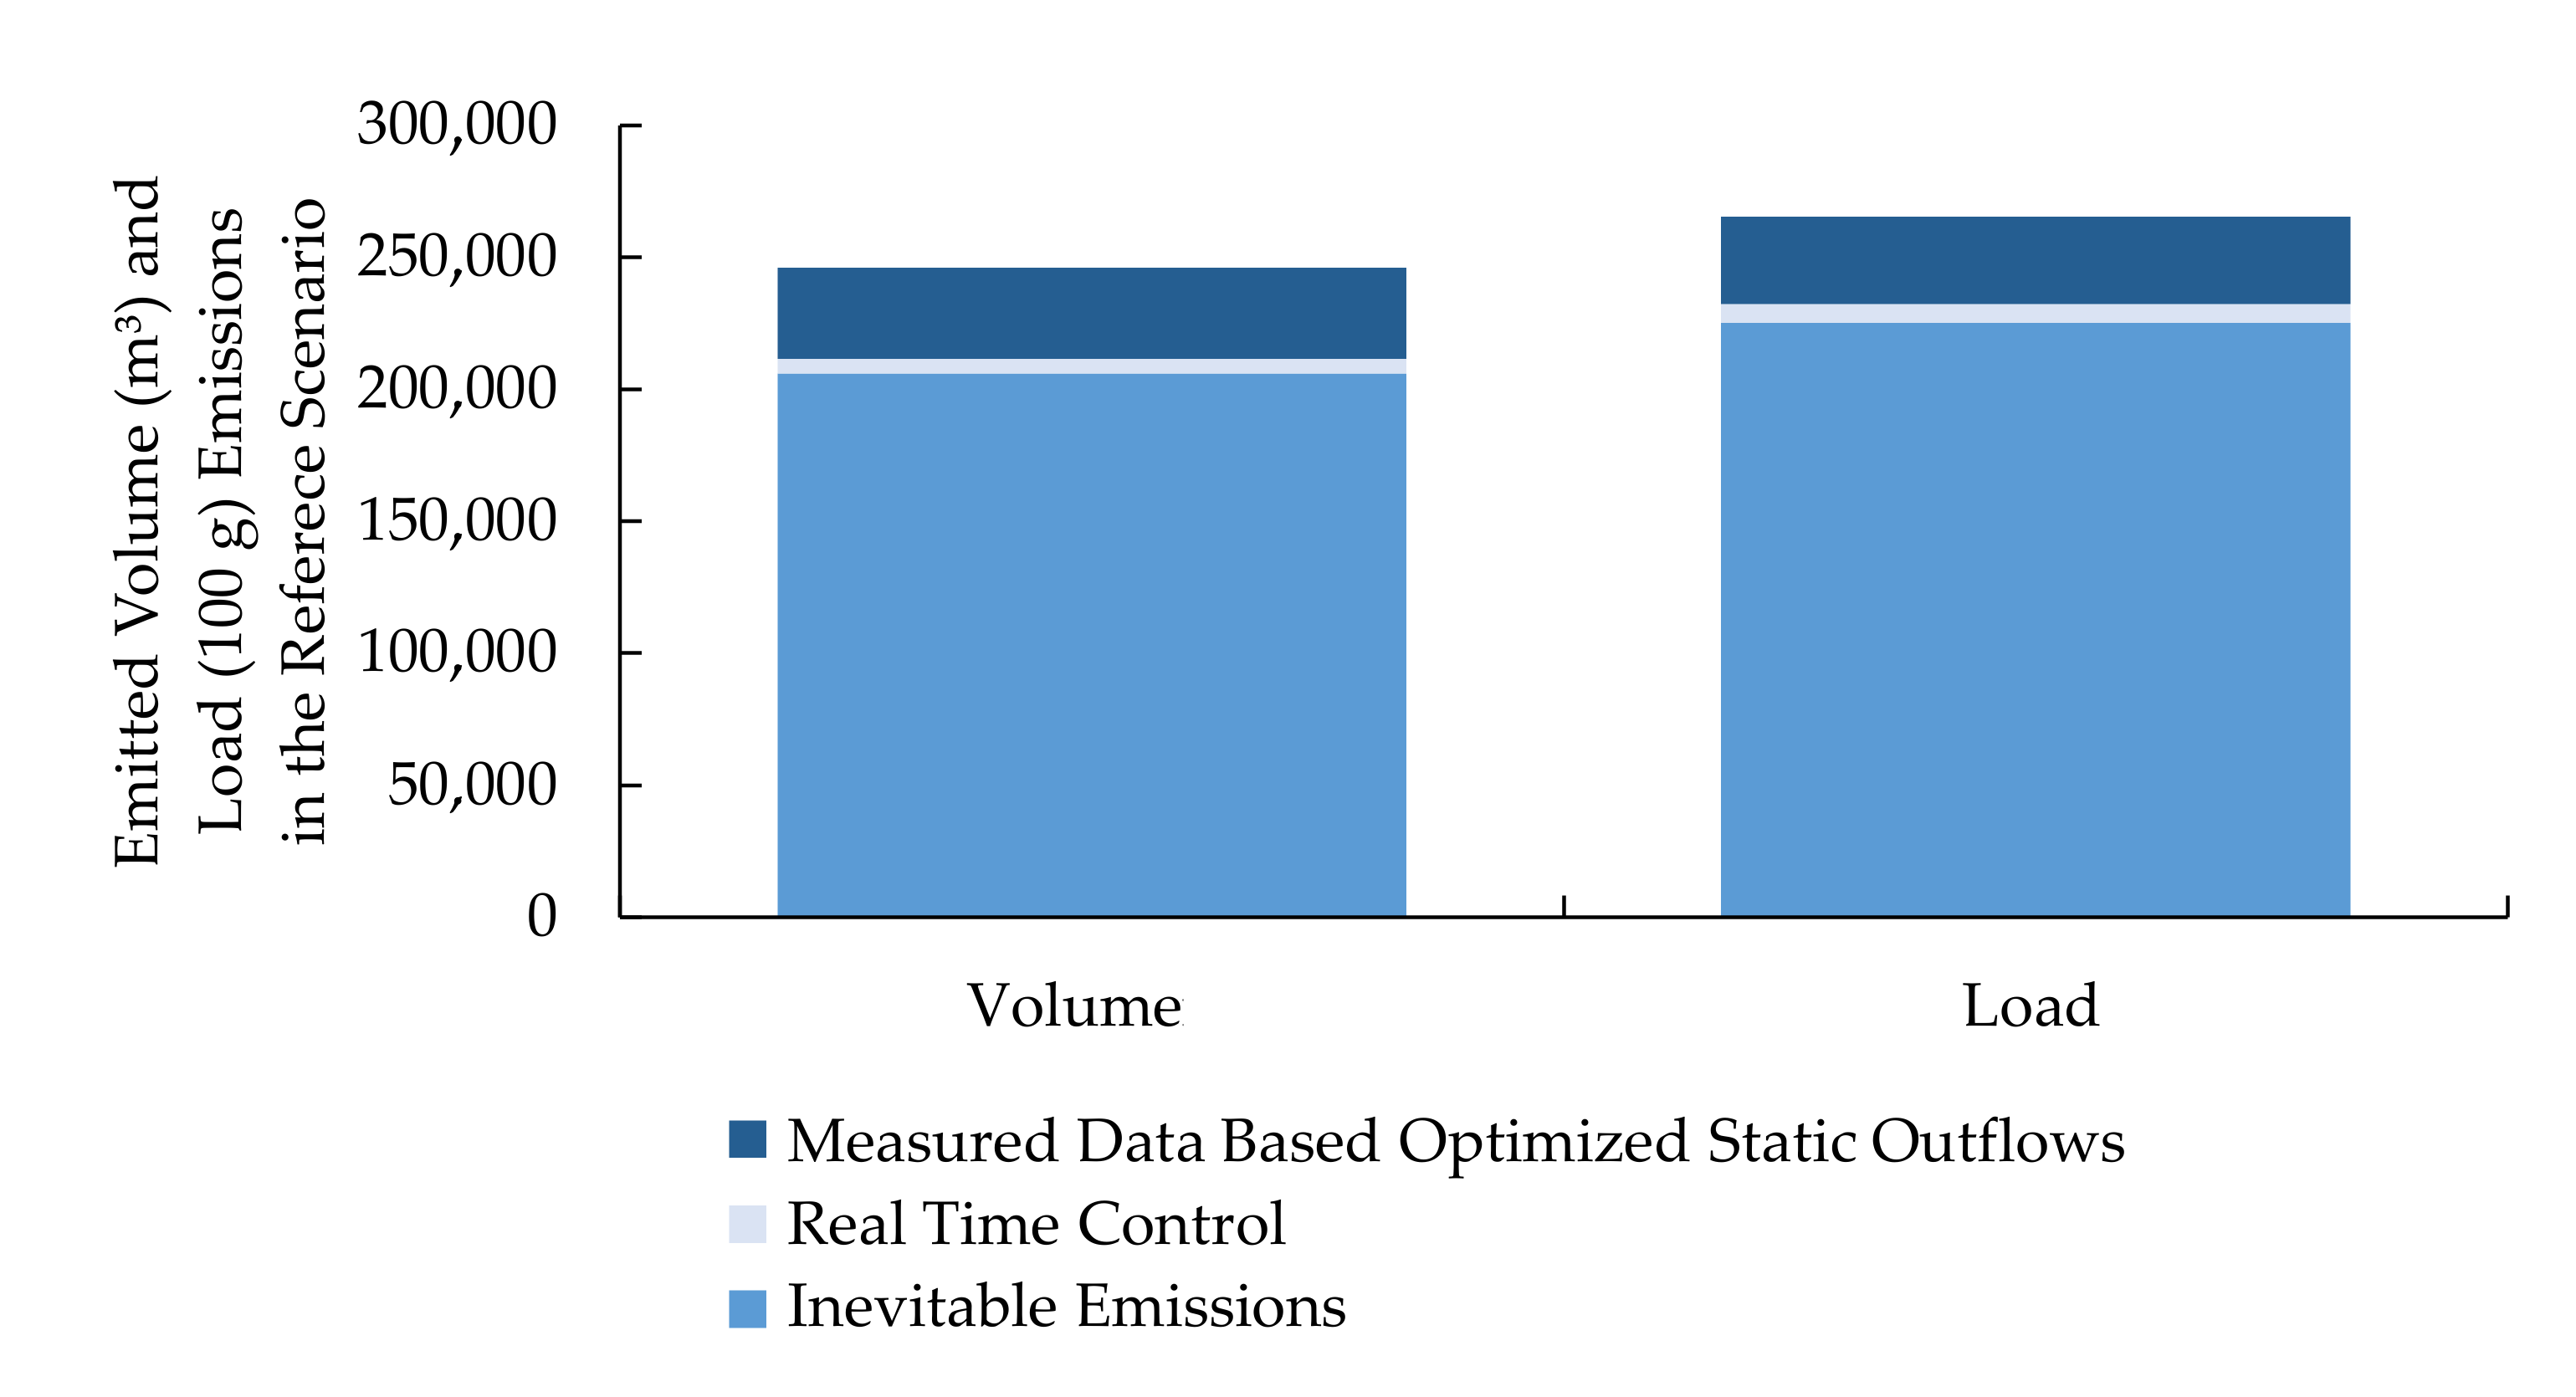
Figure 8 shows the total emitted load and volume in the reference scenario as well as under data-based optimized outflows and volume-based RTC. Under optimized outflow conditions, 17% of the total emitted volume and 15% of the total emitted load can be reduced. Thus, around 1/6 of the relevant emissions can be saved by a static adjustment of the throttle outflows.
With an optimal RTC of the controlled outflows, 20% of the emitted volume can be reduced, adding only 3% to the emission reduction compared to the statically-optimized system. However, as described in Section 2.3, the optimal RTC is a theoretical optimum for one central tank and not achievable in a real system.
Identifying in which sewer systems optimization is particularly profitable is the main question before optimization studies. Therefore, the treatment performance of the wastewater treatment plant and the available specific storage volume in the combined sewer were varied to assess the impact on the overall optimization potential. Since an optimization towards minimization of emitted CSO volume and load gave very similar results, only volume-based optimizations were carried out.
In an ideal catchment area, storage volumes are distributed evenly and proportional to the connected impervious area. If the expected development of the catchment area during the planning process does not take place, this results in an uneven distribution of the specific storage volumes throughout the sewer system. Our results show that the optimization potential increases with an increasing imbalance (uneven distribution) of the specific storage volumes. However, the effect of a four-times larger specific storage volume of tank 2 to tank 1 leads to only a 5% increased optimization potential regarding discharged CSO volume.
To assess the influence of the existing storage capacity of the sewer system on the optimization potential, controlled outflows in catchment areas with evenly distributed specific storage volumes were optimized. To know in which systems the highest optimization potential can be expected helps to prioritize suitable catchment areas for sewer system optimization in practice. Specific storage volumes from 10 to 40 m3/ha were evaluated. The optimization potential is highest for an average specific storage volume around 20 m3/ha (see Figure S2 in Supplementary Material). The reason for the smaller effect of an optimization in particularly small-sized systems is the relatively little free volume which can be activated by changing the controlled outflows. In systems with higher specific storage volumes, there is enough free volume that there is enough buffer in the system to compensate for unfavorable controlled outflow settings. Thus, the optimization potential is greatest in systems with a medium specific storage volume. This hypothesis is confirmed by changing the maximum combined sewer inflow to the WWTP. The highest optimization potential was shown by a medium to low treatment capacity.
3.4. Case Study
Figure 9 shows the standardized measured and conventionally simulated annual discharge frequencies. The hydrological model KOSIM [77], which is widely applied in Germany, was used for conventional rainfall-runoff simulation [78]. The simulation was run with a 30-year stochastic rainfall time series generated by NiedSim 3 [79].
The frequencies of each tank are normalized to the annual average of the entire system to visualize the discharge distribution and avoid the influence of natural variations in the annual precipitation. The comparison with the measured overflow activity in the study area has shown that the conventional model is capable of optimizing the overall discharged volumes of the system. However, the actual distribution of CSO discharges along the system could not be represented to a satisfactory extend. With T2 discharging into a sensitive water body and T3 being one of the biggest tanks in the system, with significant overflow volumes, the discharges of two relevant tanks are overestimated in the conventional model. Operational decisions based on the simulation results might lead to unexpected or unwanted changes in the overflow distribution. Thus, for an efficient protection of the receiving water body, knowledge about the distribution of discharges is vital.
A global optimum of controlled outflows for the study area could not be identified in the unweighted optimization approach. The equifinality of the hydraulic system leads to several optimal settings of the controlled outflows leading to similar total overflow volumes. This effect has been already observed in the conceptual system with two tanks. On average, the reduction potential for the study area was 2% for the overflow volume and 6% for the overflow duration. With a well monitored and operated system as a case study, the optimization potential was expected to be low in this particular case. However, further investigation of the underlying input data gave valuable insights regarding the applicability of this approach in practice.
The required time series to generate robust optimization results for the study area consists of approximately six months containing a minimum of 200 mm cumulated rainfall (see Figure 10). These findings suggest that it is not necessary to conduct long-term investigations/simulations to identify an optimum for a system. Shorter time series in high quality and resolution seem to be more valuable for a practical sewer system optimization. The early convergence of the optimization results shows that the supposed advantage of the long-term simulation covering longer simulation periods is not relevant. Further studies are required to draw general conclusions regarding the amount of data required for the optimization in relation to system or operational characteristics. It is expected that system characteristics (e.g., slope, specific storage volumes, flow times, etc.) strongly influence the amount of data required for robust optimization results.
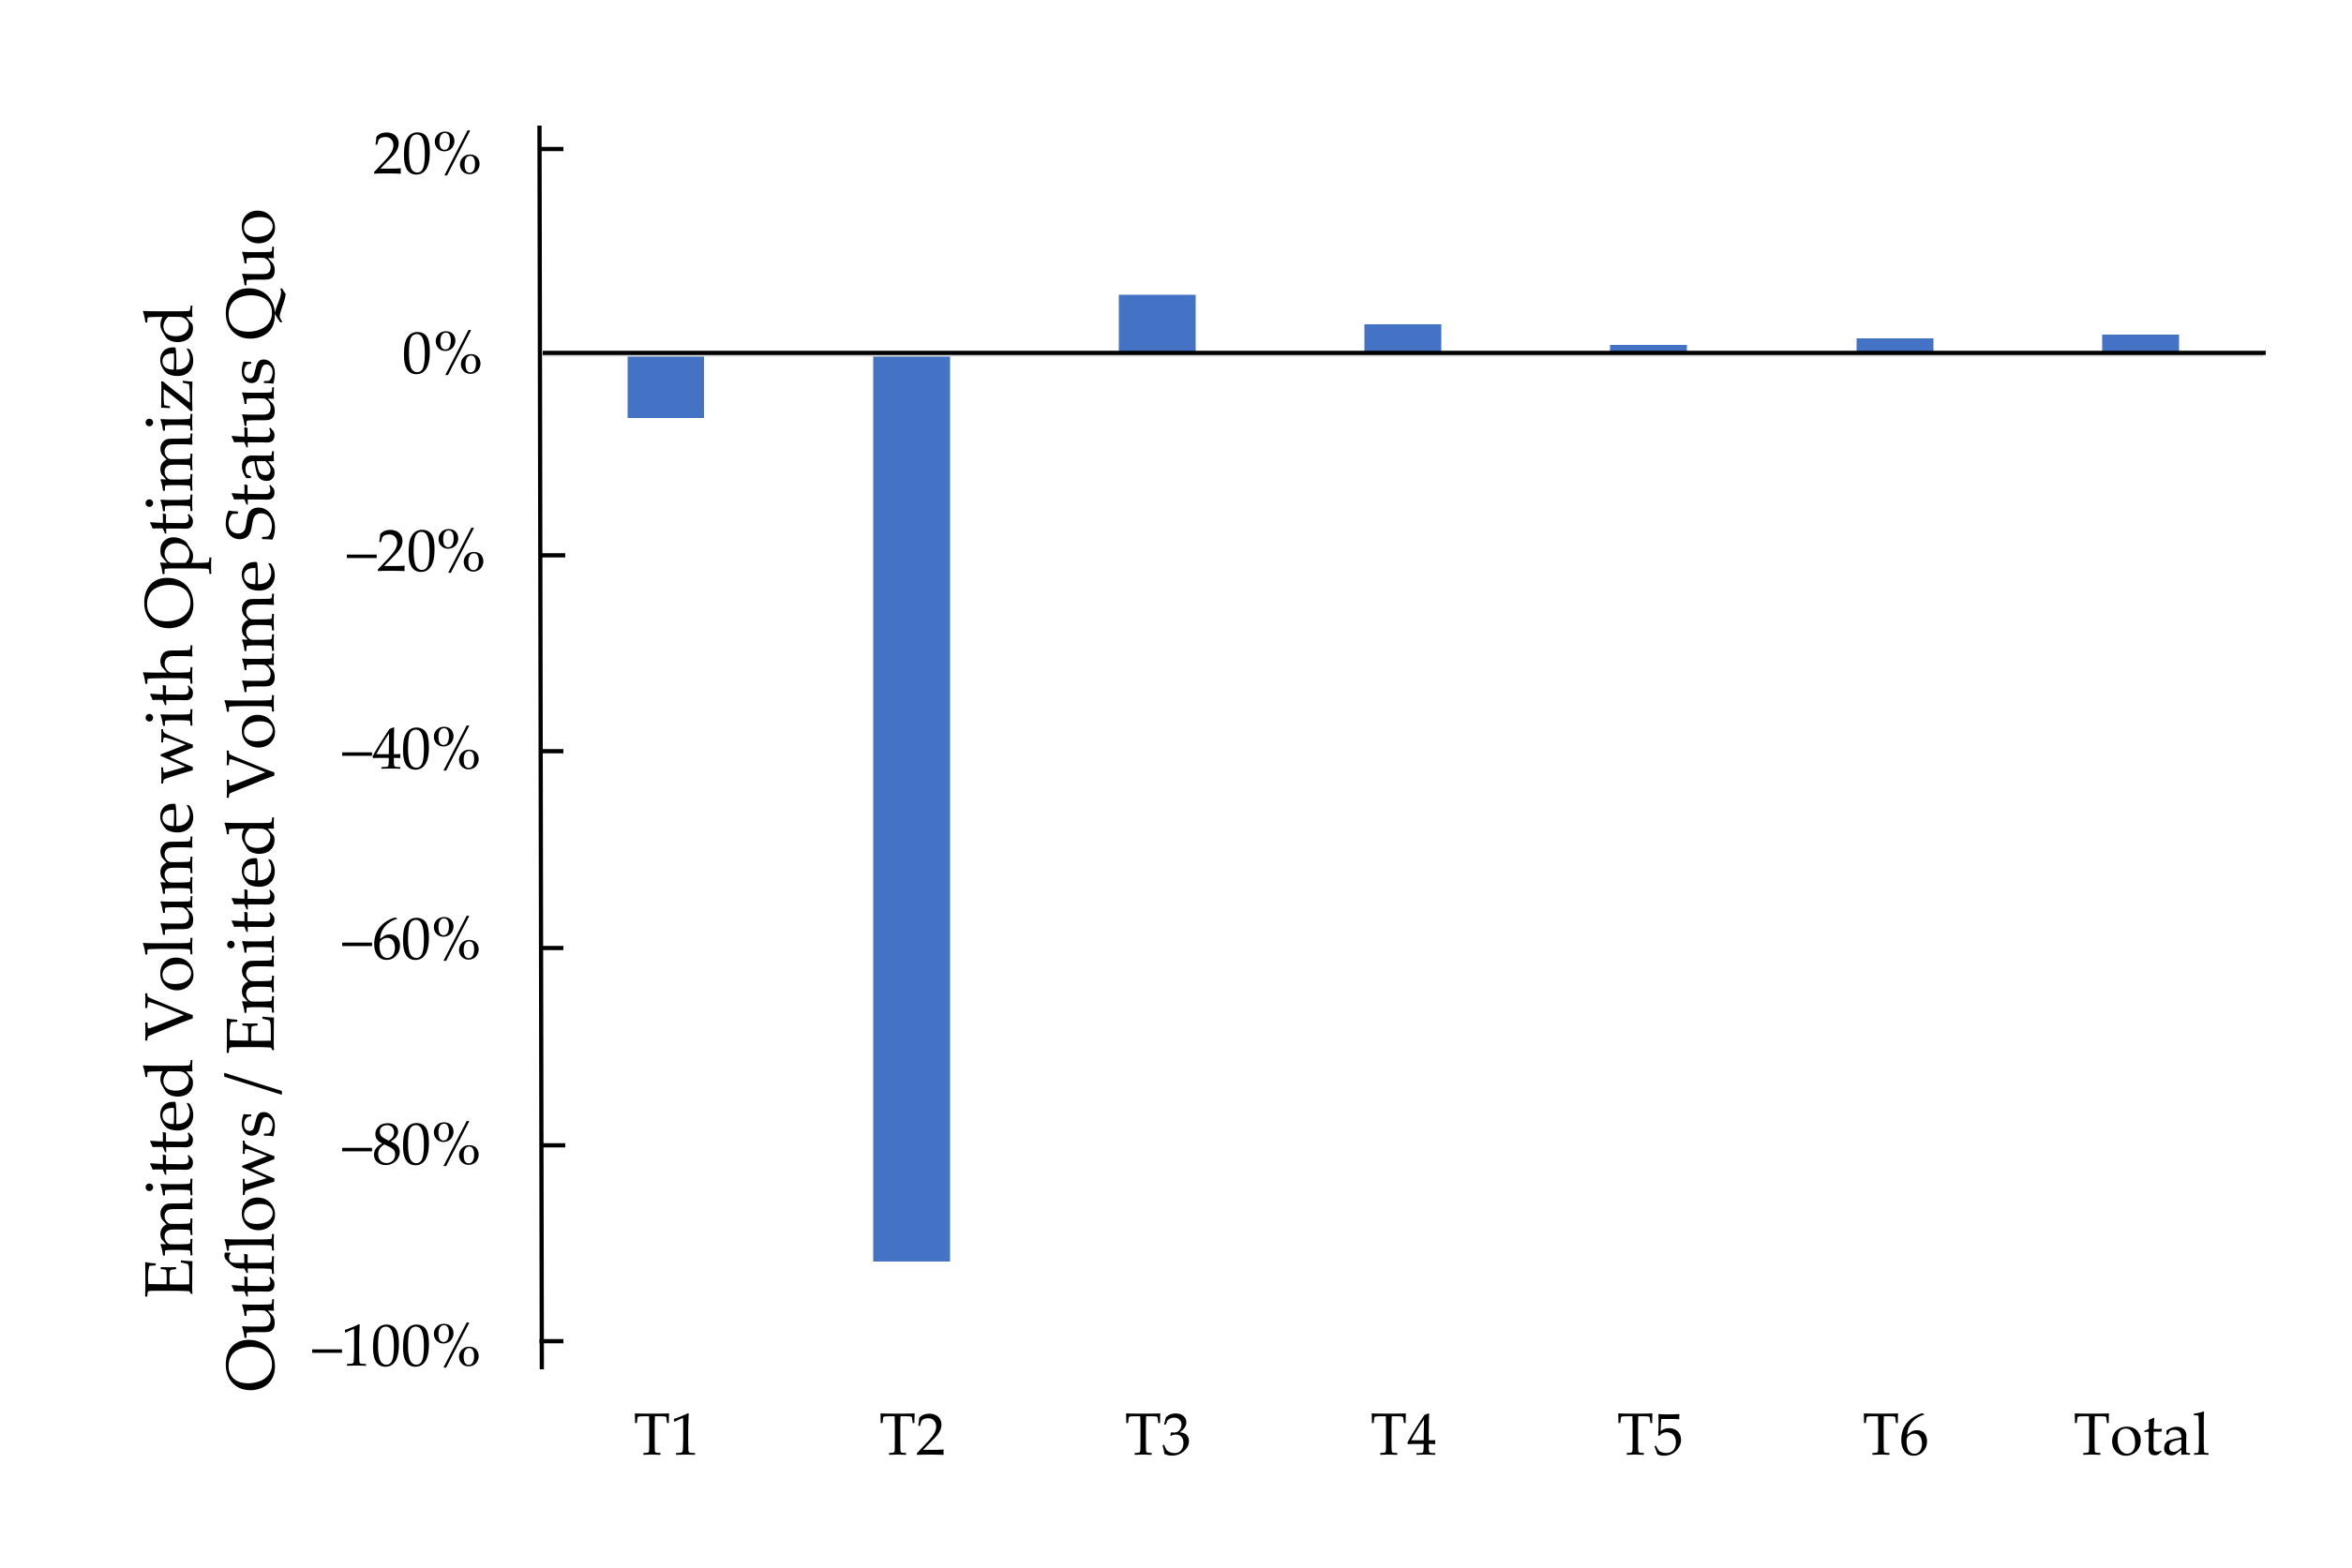
Implementing weighting factors in the optimization, allows a targeted reduction of overflow volume or duration at certain CSO tanks. In the study area it was possible to reduce the overflow volume of T2 by 95% without increasing the total emissions of the system compared to the status quo of the system (Figure 11). Depending on the size and relevance of a tank within a system the specific reduction potential and its influence on the total emissions vary significantly. The targeted optimization allows the investigation of different strategies to protect the receiving water bodies under the real runoff behavior in the catchment. Firstly, it allows an estimation of how effective a change in the controlled outflow would be for the receiving water and secondly it demonstrates its influence on the overall overflow behavior of the system.
4. Conclusions
Optimization of controlled outflows from CSO tanks based on measured data was readily applicable to both a conceptual catchment and an existing system and provided reliable results. The data-based approach provides an alternative to hydrological modelling of the catchments. The true system overflow behavior during rain events can be reproduced more realistically than in conventional sewer system modelling. Any intervention downstream of the measurement point can be considered in simulation scenarios (e.g., expansion of storage volumes, enhanced CSO treatment).
- In conventionally operated sewer systems, a simple static measured data-based optimization of the controlled outflows can reduce a major part of the emissions to the receiving water body (up to 17% of the emitted volume in the conceptual catchment).
- From a total emission perspective, the additional benefit of RTC compared to optimal static outflow settings is low (maximum 3% theoretical potential in this study). Therefore, a static outflow optimization should always be the first step of any operational improvement measured in sewer systems. Considering event-wise reductions, the real ecological benefit of RTC strategies may be higher.
- Data-based optimization has the largest benefit in sewer systems where the actual degree of development is unknown. In these systems, sensitive and hard to determine parameters required for hydrologic modelling, such as effective impervious area, are highly uncertain. With increasing use, low impact development (LID) parameters are even harder to determine since the degree of imperviousness can hardly be determined. However, to gain reliable results, the measured input data for the transport model has to be of good quality.
- An additional indicator for the optimization potential of a sewer system is the buffer capacity in the form of specific storage volumes. Systems with medium to low specific storage capacity have a larger optimization potential and should therefore be prioritized when performing optimization measures.
- For a reliable optimization of controlled outflows all flow components of the CSO tanks have to be considered. Neglecting components such as overflow volumes leads to invalid optimization results when optimizing the system for minimum CSO volumes.
- Different optimization objectives like minimization of overflow duration, load, and volume gave similar results in this study. Therefore, the additional benefit that costly quality measurements bring with them is usually not justified.
- In the investigated conceptual system, a time series of about four months with medium precipitation characteristics and about 10 precipitation events is sufficient. The investigation in the case study areas resulted in six months and a minimum of 200 mm cumulated rainfall. Further studies will show general conclusions regarding the influence of catchment and system characteristics on the required time series length.
- Instead of a uniform utilization of the storage volumes within sewer systems and an even distribution of overflows, the goal of sewer system operation may be the protection of particularly sensitive water bodies. A shift of the emission fractions from one CSO tank to another can be achieved by targeting a reduction at the relevant tank within the optimization. This can lead to a significant emission reduction at one CSO without major impact on total emissions.
Supplementary Materials
The following are available online at https://www.mdpi.com/2073-4441/13/6/751/s1, Figure S1: Influence of the number of rain and overflow events and average event precipitation on optimization results, Figure S2: Influence of (evenly distributed) specific storage volume on volume based optimization potential compared to area weighted controlled outflows.
Author Contributions
Conceptualization, A.B.-M., Y.B., and U.D.; methodology, A.B.-M., Y.B., A.E.B., and U.D.; software, A.B.-M., Y.B., and A.E.B.; validation, A.B.-M. and Y.B.; formal analysis, A.B.-M. and Y.B.; investigation, A.B.-M. and Y.B.; resources, A.B.-M.; writing—original draft preparation, A.B.-M.; writing—review and editing, A.B.-M., A.E.B., Y.B., M.K., and U.D.; visualization, A.B.-M. and Y.B.; supervision, U.D. All authors have read and agreed to the published version of the manuscript.
Funding
The work on optimizing of the conceptual system was funded by the German Federal Environmental Foundation (DBU). The investigations in the study area were funded by the Ministry of the Environment, Climate Protection and Energy Sector Baden-Württemberg.
Institutional Review Board Statement
Not applicable.
Informed Consent Statement
Not applicable.
Data Availability Statement
The data presented in this study are available on request from the corresponding author. The data are not publicly available due to privacy.
Acknowledgments
The database used for this study was collected within the joint research project SAMUWA (Fkz. 033W004A) (Steps towards an Adaptive Management of the Urban Water Cycle) within the funding measure “Smart and Multifunctional Infrastructural Systems for Sustainable Water Supply, Sanitation and Stormwater Management” (BMBF INIS). Furthermore, the Ministry of the Environment, Climate Protection and the Energy Sector Baden-Württemberg financed the research in the case study area within the funding program “Aktionsprogramm Jagst M3-3”. The authors would also like to thank UFT for providing the sewer system model of the case study area.
Conflicts of Interest
The authors declare no conflict of interest.
References
- Borchardt, D.; Fischer, J.; Mauch, E. Auswirkungen von Mischwassereinleitungen auf den Stoffhaushalt und die Biozönose von Fließgewässern. Gwf Wasser-Abwasser 1998, 139, 342–395. [Google Scholar]
- Burton, G.A.; Pitt, R. Stormwater Effects Handbook: A Toolbox for Watershed Managers, Scientists, and Engineers; Lewis Pulishers: Boca Raton, FL, USA, 2002; ISBN 9780873719247. [Google Scholar]
- Ellis, J.; Hvitved-Jacobsen, T. Urban drainage impacts on receiving waters. J. Hydraul. Res. 1996, 34, 771–783. [Google Scholar] [CrossRef]
- Miskewitz, R.; Uchrin, C. In-Stream Dissolved Oxygen Impacts and Sediment Oxygen Demand Resulting from Combined Sewer Overflow Discharges. J. Environ. Eng. 2013, 139, 1307–1313. [Google Scholar] [CrossRef]
- David, T.; Borchardt, D.; Von Tümpling, W.; Krebs, P. Combined sewer overflows, sediment accumulation and element patterns of river bed sediments: A quantitative study based on mixing models of composite fingerprints. Environ. Earth Sci. 2013, 69, 479–489. [Google Scholar] [CrossRef]
- Borchardt, D.; Sperling, F. Urban stormwater discharges: Ecological effects on receiving waters and consequences for technical measures. Water Sci. Technol. 1997, 36, 173–178. [Google Scholar] [CrossRef]
- Casadio, A.; Maglionico, M.; Bolognesi, A.; Artina, S. Toxicity and pollutant impact analysis in an urban river due to combined sewer overflows loads. Water Sci. Technol. 2010, 61, 207–215. [Google Scholar] [CrossRef] [Green Version]
- Ellis, J. Risk assessment approaches for ecosystem responses to transient pollution events in urban receiving waters. Chemosphere 2000, 41, 85–91. [Google Scholar] [CrossRef]
- Passerat, J.; Ouattara, N.K.; Mouchel, J.-M.; Rocher, V.; Servais, P. Impact of an intense combined sewer overflow event on the microbiological water quality of the Seine River. Water Res. 2011, 45, 893–903. [Google Scholar] [CrossRef] [PubMed]
- Willems, P.; Einfalt, T. Rainfall extremes and urban drainage. In Global Trends & Challenges in Water Science, Research and Management: A Compendium of Hot Topics and Features from IWA Specialist Groups; Li, H., Ed.; The International Water Association: London, UK, 2012; pp. 83–84. [Google Scholar]
- Gasperi, J.; Zgheib, S.; Cladière, M.; Rocher, V.; Moilleron, R.; Chebbo, G. Priority pollutants in urban stormwater: Part 2—Case of combined sewers. Water Res. 2012, 46, 6693–6703. [Google Scholar] [CrossRef] [Green Version]
- Launay, M.; Dittmer, U.; Steinmetz, H. Contribution of combined sewer overflows to micropollutant loads dis-charged into urban receiving water. In Proceedings of the Novatech 9th International Conference: Planning and Technologies for Sustainable Urban Water Management, Lyon, France, 28 June–1 July 2016. [Google Scholar]
- Scherer, U.; Fuchs, S.; Behrendt, H.; Hillenbrand, T. Emissions of heavy metals into river basins of Germany. Water Sci. Technol. 2003, 47, 251–257. [Google Scholar] [CrossRef] [PubMed]
- García, L.; Gómez, J.B.; Escobar, E.; Tellez, D.; Quijano, N.; Ocampo-Martínez, C. Modeling and real-time control of urban drainage systems: A review. Adv. Water Resour. 2015, 85, 120–132. [Google Scholar] [CrossRef] [Green Version]
- Berggren, K.; Olofsson, M.; Viklander, M.; Svensson, G.; Gustafsson, A.-M. Hydraulic Impacts on Urban Drainage Systems due to Changes in Rainfall Caused by Climatic Change. J. Hydrol. Eng. 2012, 17, 92–98. [Google Scholar] [CrossRef]
- Denault, C.; Millar, R.G.; Lence, B.J. Assessment of Possible Impacts of Climate Change in an Urban Catchment. JAWRA J. Am. Water Resour. Assoc. 2006, 42, 685–697. [Google Scholar] [CrossRef]
- Semadeni-Davies, A.; Hernebring, C.; Svensson, G.; Gustafsson, L.-G. The impacts of climate change and urbanisation on drainage in Helsingborg, Sweden: Combined sewer system. J. Hydrol. 2008, 350, 100–113. [Google Scholar] [CrossRef]
- Nicklow, J.; Reed, P.; Savic, D.; Dessalegne, T.; Harrell, L.; Chan-Hilton, A.; Karamouz, M.; Minsker, B.; Ostfeld, A.; Singh, A.; et al. State of the Art for Genetic Algorithms and Beyond in Water Resources Planning and Management. J. Water Resour. Plan. Manag. 2010, 136, 412–432. [Google Scholar] [CrossRef]
- Maier, H.; Razavi, S.; Kapelan, Z.; Matott, L.; Kasprzyk, J.; Tolson, B. Introductory overview: Optimization using evolutionary algorithms and other metaheuristics. Environ. Model. Softw. 2019, 114, 195–213. [Google Scholar] [CrossRef]
- Maier, H.; Kapelan, Z.; Kasprzyk, J.; Kollat, J.; Matott, L.; Cunha, M.; Dandy, G.; Gibbs, M.; Keedwell, E.; Marchi, A.; et al. Evolutionary algorithms and other metaheuristics in water resources: Current status, research challenges and future directions. Environ. Model. Softw. 2014, 62, 271–299. [Google Scholar] [CrossRef] [Green Version]
- Shao, Z.; Zhang, X.; Li, S.; Deng, S.; Chai, H. A Novel SWMM Based Algorithm Application to Storm Sewer Network Design. Water 2017, 9, 747. [Google Scholar] [CrossRef] [Green Version]
- Navin, P.K.; Mathur, Y.P. Layout and Component Size Optimization of Sewer Network Using Spanning Tree and Modified PSO Algorithm. Water Resour. Manag. 2016, 30, 3627–3643. [Google Scholar] [CrossRef]
- Steele, J.C.; Mahoney, K.; Karovic, O.; Mays, L.W. Heuristic Optimization Model for the Optimal Layout and Pipe Design of Sewer Systems. Water Resour. Manag. 2016, 30, 1605–1620. [Google Scholar] [CrossRef]
- Bakhshipour, A.E.; Bakhshizadeh, M.; Dittmer, U.; Haghighi, A.; Nowak, W. Hanging Gardens Algorithm to Generate Decentralized Layouts for the Optimization of Urban Drainage Systems. J. Water Resour. Plann. Manag. 2019, 145, 04019034. [Google Scholar] [CrossRef]
- Bakhshipour, A.; Hespen, J.; Haghighi, A.; Dittmer, U.; Nowak, W. Integrating Structural Resilience in the Design of Urban Drainage Networks in Flat Areas Using a Simplified Multi-Objective Optimization Framework. Water 2021, 13, 269. [Google Scholar] [CrossRef]
- Di Matteo, M.; Dandy, G.C.; Maier, H.R. Multiobjective Optimization of Distributed Stormwater Harvesting Systems. J. Water Resour. Plann. Manag. 2017, 143, 4017010. [Google Scholar] [CrossRef]
- Raei, E.; Alizadeh, M.R.; Nikoo, M.R.; Adamowski, J. Multi-objective decision-making for green infrastructure planning (LID-BMPs) in urban storm water management under uncertainty. J. Hydrol. 2019, 579, 124091. [Google Scholar] [CrossRef]
- Liu, Y.; Cibin, R.; Bralts, V.F.; Chaubey, I.; Bowling, L.C.; Engel, B.A. Optimal selection and placement of BMPs and LID practices with a rainfall-runoff model. Environ. Model. Softw. 2016, 80, 281–296. [Google Scholar] [CrossRef] [Green Version]
- Eckart, K.; McPhee, Z.; Bolisetti, T. Multiobjective optimization of low impact development stormwater controls. J. Hydrol. 2018, 562, 564–576. [Google Scholar] [CrossRef]
- Wang, Q.; Zhou, Q.; Lei, X.; Savić, D.A. Comparison of Multiobjective Optimization Methods Applied to Urban Drainage Adaptation Problems. J. Water Resour. Plan. Manag. 2018, 144, 04018070. [Google Scholar] [CrossRef]
- Vojinovic, Z.; Sahlu, S.; Torres, A.S.; Seyoum, S.D.; AnvariFar, F.; Matungulu, H.; Barreto, W.; Savic, D.; Kapelan, Z. Multi-objective rehabilitation of urban drainage systems under uncertainties. J. Hydroinform. 2014, 16, 1044–1061. [Google Scholar] [CrossRef]
- Yazdi, J. Optimal Operation of Urban Storm Detention Ponds for Flood Management. Water Resour. Manag. 2019, 33, 2109–2121. [Google Scholar] [CrossRef]
- Ngamalieu-Nengoue, U.A.; Iglesias-Rey, P.L.; Martínez-Solano, F.J.; Mora-Meliá, D.; Valderrama, J.G.S. Urban Drainage Network Rehabilitation Considering Storm Tank Installation and Pipe Substitution. Water 2019, 11, 515. [Google Scholar] [CrossRef] [Green Version]
- Ngamalieu-Nengoue, U.A.; Martínez-Solano, F.J.; Iglesias-Rey, P.L.; Mora-Meliá, D. Multi-Objective Optimization for Urban Drainage or Sewer Networks Rehabilitation through Pipes Substitution and Storage Tanks Installation. Water 2019, 11, 935. [Google Scholar] [CrossRef] [Green Version]
- Li, J.; Li, W.; Chang, X.; Sharma, K.; Yuan, Z. Real-Time Predictive Control for Chemical Distribution in Sewer Net-works using Improved Elephant Herding Optimization. IEEE Trans. Ind. Inf. 2020, 1. [Google Scholar] [CrossRef]
- Li, J. A data-driven improved fuzzy logic control optimization-simulation tool for reducing flooding volume at downstream urban drainage systems. Sci. Total Environ. 2020, 732, 138931. [Google Scholar] [CrossRef]
- Butler, D.; Schütze, M. Integrating simulation models with a view to optimal control of urban wastewater systems. Environ. Model. Softw. 2005, 20, 415–426. [Google Scholar] [CrossRef]
- Zhao, W.; Beach, T.H.; Rezgui, Y. Automated Model Construction for Combined Sewer Overflow Prediction Based on Efficient LASSO Algorithm. IEEE Trans. Syst. Man Cybern. Syst. 2017, 49, 1254–1269. [Google Scholar] [CrossRef] [Green Version]
- Yazdi, J.; Yoo, D.G.; Kim, J.H. Comparative study of multi-objective evolutionary algorithms for hydraulic rehabilitation of urban drainage networks. Urban Water J. 2017, 14, 483–492. [Google Scholar] [CrossRef]
- Petri, I.; Yuce, B.; Kwan, A.; Rezgui, Y. An Intelligent Analytics System for Real-Time Catchment Regulation and Water Management. IEEE Trans. Ind. Infor. 2018, 14, 3970–3981. [Google Scholar] [CrossRef]
- Dirckx, G.; Schutze, M.; Kröll, S.; Thoeye, C.; De Gueldre, G.; Van De Steene, B. Cost-efficiency of RTC for CSO impact mitigation. Urban Water J. 2011, 8, 367–377. [Google Scholar] [CrossRef]
- Seggelke, K.; Lowe, R.; Beeneken, T.; Fuchs, L. Implementation of an integrated real-time control system of sewer system and waste water treatment plant in the city of Wilhelmshaven. Urban Water J. 2013, 10, 330–341. [Google Scholar] [CrossRef]
- Weinreich, G.; Schilling, W.; Birkely, A.; Moland, T. Pollution based real time control strategies for combined sewer systems. Water Sci. Technol. 1997, 36, 331–336. [Google Scholar] [CrossRef]
- Cembrano, G. Optimal control of urban drainage systems. A case study. Control. Eng. Pr. 2004, 12, 1–9. [Google Scholar] [CrossRef]
- Fiorelli, D.; Schutz, G.; Klepiszewski, K.; Regneri, M.; Seiffert, S. Optimised real time operation of a sewer network using a multi-goal objective function. Urban Water J. 2013, 10, 342–353. [Google Scholar] [CrossRef]
- Lacour, C.; Schütze, M. Real-time control of sewer systems using turbidity measurements. Water Sci. Technol. 2011, 63, 2628–2632. [Google Scholar] [CrossRef] [PubMed]
- Troutman, S.C.; Schambach, N.; Love, N.G.; Kerkez, B. An automated toolchain for the data-driven and dynamical modeling of combined sewer systems. Water Res. 2017, 126, 88–100. [Google Scholar] [CrossRef] [PubMed]
- Haykin, S. Neural Networks: A Comprehensive Foundation; Prentice Hall: Upper Saddle River, NJ, USA, 1999. [Google Scholar]
- Mounce, S.R.; Shepherd, W.; Sailor, G.; Shucksmith, J.; Saul, A.J. Predicting combined sewer overflows chamber depth using artificial neural networks with rainfall radar data. Water Sci. Technol. 2014, 69, 1326–1333. [Google Scholar] [CrossRef]
- Dawson, C.W.; Wilby, R.L. Hydrological modelling using artificial neural networks. Prog. Phys. Geogr. Earth Environ. 2001, 25, 80–108. [Google Scholar] [CrossRef]
- Kurth, A.; Saul, A.; Mounce, S.; Shepherd, W.; Hanson, D. Application of artificial neural networks (ANNs) for the prediction of CSO discharges. In Proceedings of the 11th International Conference on Urban Drainage, Edinburgh, UK, 31 August–5 September 2008. [Google Scholar]
- Ayazpour, Z.; Bakhshipour, A.E.; Dittmer, U. Combined Sewer Flow Prediction Using Hybrid Wavelet Artificial Neural Network Model. In International Conference on Urban Drainage Modelling; Springer: Berlin/Heidelberg, Germany, 2018; pp. 693–698. [Google Scholar]
- Ruano, A.E. Intelligent Control Systems Using Computational Intelligence Techniques; IET: London, UK, 2005; ISBN 0863414893. [Google Scholar]
- Pleau, M.; Colas, H.; Lavallee, P.; Pelletier, G.; Bonin, R. Global optimal real-time control of the Quebec urban drainage system. Environ. Model. Softw. 2005, 20, 401–413. [Google Scholar] [CrossRef]
- Lund, N.S.V.; Falk, A.K.V.; Borup, M.; Madsen, H.; Mikkelsen, P.S. Model predictive control of urban drainage systems: A review and perspective towards smart real-time water management. Crit. Rev. Environ. Sci. Technol. 2018, 48, 279–339. [Google Scholar] [CrossRef]
- Seggelke, K.; Fuchs, L.; Tränckner, J.; Krebs, P. Development of an integrated RTC system for full-scale implementation. In Proceedings of the11th International Conference on Urban Drainage, Edinburgh, UK, 31 August–5 September 2008. [Google Scholar]
- Dotto, C.B.S.; Kleidorfer, M.; Deletic, A.; Fletcher, T.D.; McCarthy, D.T.; Rauch, W. Stormwater quality models: Performance and sensitivity analysis. Water Sci. Technol. 2010, 62, 837–843. [Google Scholar] [CrossRef] [PubMed]
- Kanso, A.; Chebbo, G.; Tassin, B. Stormwater quality modelling in combined sewers: Calibration and uncertainty analysis. Water Sci. Technol. 2005, 52, 63–71. [Google Scholar] [CrossRef]
- Bachmann-Machnik, A.; Meyer, D.; Waldhoff, A.; Fuchs, S.; Dittmer, U. Integrating retention soil filters into urban hydrologic models—Relevant processes and important parameters. J. Hydrol. 2018, 559, 442–453. [Google Scholar] [CrossRef]
- Korving, H.; Clemens, F. Impact of dimension uncertainty and model calibration on sewer system assessment. Water Sci. Technol. 2005, 52, 35–42. [Google Scholar] [CrossRef]
- Dotto, C.; Kleidorfer, M.; Deletic, A.; Rauch, W.; McCarthy, D.; Fletcher, T. Performance and sensitivity analysis of stormwater models using a Bayesian approach and long-term high resolution data. Environ. Model. Softw. 2011, 26, 1225–1239. [Google Scholar] [CrossRef]
- Kleidorfer, M.; Deletic, A.; Fletcher, T.D.; Rauch, W. Impact of input data uncertainties on urban stormwater model parameters. Water Sci. Technol. 2009, 60, 1545–1554. [Google Scholar] [CrossRef]
- Dittmer, U.; Bachmann-Machnik, A.; Lieb, W.; Giebl, B.; Weiß, G.; Wöhrle, C. Einflüsse auf die Einstau- und Entlastungsaktivität von Regenüberlaufbecken. In Proceedings of the Regenwasser in Urbanen Räumen, Aqua Urbanica Trifft RegenwasserTage, Landau, Germany, 18–19 June 2018; pp. 203–214, ISBN 978-3-95974-086-9. [Google Scholar]
- Korving, H.; van Gelder, P.; van Noortwijk, J.M.; Clemens, F. Influence of model parameter uncertainties on decision- making for sewer system management. In Proceedings of the Hydroinformatics 2002 the Fifth International Conference on Hydroinformatics, Cardiff, UK, 1–5 July 2002. [Google Scholar]
- Campisano, A.; Ple, J.C.; Muschalla, D.; Pleau, M.; Vanrolleghem, P. Potential and limitations of modern equipment for real time control of urban wastewater systems. Urban Water J. 2013, 10, 300–311. [Google Scholar] [CrossRef]
- Verordnung über Art und Häufigkeit der Selbstüberwachung von Kommunalen Abwasserbehandlungsanlagen und -Einleitungen (Selbstüberwachungsverordnung Kommunal—SüwV-kom). 2019. Available online: https://recht.nrw.de/lmi/owa/br_text_anzeigen? (accessed on 27 January 2021).
- Bachmann-Machnik, A. Optimierung des Betriebs von Kanalnetzen im Mischsystem auf Basis von Online-Messdaten: Schriftenreihe Wasser Infrastruktur Ressourcen—Band 7. Ph.D. Thesis, Technische Universität Kaiserslautern, Kaiserslautern, Germany, 2020. [Google Scholar]
- Bachmann, A.; Wetzel, J.; Dittmer, U. Assessing the potential of pollution based RTC in a combined sewer system based on highly resolved online quality data. In Proceedings of the SPN8 8th International Conference on Sewer Processes and Networks, Rotterdam, The Netherlands, 31 August–2 September 2016; pp. 286–290. [Google Scholar]
- EPA. SWMM; United States Environmental Protection Agency: Washington, DC, USA, 2014.
- MathWorks. MATLAB; MathWorks: Natick, MA, USA, 2018. [Google Scholar]
- Schütze, M. Integrale Abflusssteuerung in Mischsystemen: Abschätzung des Steuerungspotenzials; SAMUWA: Stuttgart, Germany, 2017. [Google Scholar]
- Einfalt, T.; Stölting, B. Real-Time Control for two communities—Technical and administrational aspects. In Proceedings of the Global Solutions for Urban Drainage Ninth International Conference on Urban Drainage (9ICUD), Portland, OR, USA, 8–13 September 2002; p. 1, ISBN 978-0-7844-0644-1. [Google Scholar]
- Lacour, C.; Joannis, C.; Schuetze, M.; Chebbo, G. Efficiency of a turbidity-based, real-time control strategy applied to a retention tank: A simulation study. Water Sci. Technol. 2011, 64, 1533–1539. [Google Scholar] [CrossRef] [PubMed]
- Peters, C.; Keller, S.; Sieker, H.; Jekel, M. Potentials of real time control, stormwater infiltration and urine separation to minimize river impacts: Dynamic long term simulation of sewer network, pumping stations, pressure pipes and waste water treatment plant. Water Sci. Technol. 2007, 56, 1–10. [Google Scholar] [CrossRef]
- Borsányi, P.; Benedetti, L.; Dirckx, G.; De Keyser, W.; Muschalla, D.; Solvi, A.-M.; Vandenberghe, V.; Weyand, M.; Vanrolleghem, P.A. Modelling real-time control options on virtual sewer systems. J. Environ. Eng. Sci. 2008, 7, 395–410. [Google Scholar] [CrossRef]
- Van Daal, P.; Gruber, G.; Langeveld, J.; Muschalla, D.; Clemens, F. Performance evaluation of real time control in urban wastewater systems in practice: Review and perspective. Environ. Model. Softw. 2017, 95, 90–101. [Google Scholar] [CrossRef] [Green Version]
- Harms, R.; Kenter, W. KOSIM; ITWH: Hannover, Germany, 1987. [Google Scholar]
- Brüning, Y.; Krauss, M.; Steinriede, D.; Weiß, G.; Marthaler, R.; Lieb, W.; Dittmer, U. Abschlussbericht Aktionsprogramm Jagst zur Wiederbelebung, Verbesserung und Ökologischen Stabilisierung der Jagst für die Zukunft: Modul M3-3 Punktquellen aus Siedlungsgebieten: Pilotmaßnahme Optimierung der Regenwasserbehandlung beim Abwasserzweckverband Mittleres Jagsttal; University of Stuttgart: Stuttgart, Germany, 2020. [Google Scholar]
- Müller, T. Generation of a Realistic Temporal Structure of Synthetic Precipitation Time Series for Sewer Applications. Ph.D. Thesis, Universität Stuttgart, Stuttgart, Germany, 2017. [Google Scholar]
Figure 2.
Conceptual catchment for measured data-based system optimization; C = catchment, D = controlled outflow, WWTP = wastewater treatment plant; T = combined sewer overflow tank, VS = specific storage volume, Aimp = impervious area.
Figure 2.
Conceptual catchment for measured data-based system optimization; C = catchment, D = controlled outflow, WWTP = wastewater treatment plant; T = combined sewer overflow tank, VS = specific storage volume, Aimp = impervious area.

Figure 3.
Case study catchment for measured data-based sewer system optimization; T = combined sewer overflow tank, D = controlled outflow, PS = pumping station.
Figure 3.
Case study catchment for measured data-based sewer system optimization; T = combined sewer overflow tank, D = controlled outflow, PS = pumping station.

Figure 4.
Emitted connected area specific combined sewer overflow (CSO) volume (left) and total suspended solid (TSS) load (right) from both CSO tanks for area weighted and optimized controlled outflows.
Figure 4.
Emitted connected area specific combined sewer overflow (CSO) volume (left) and total suspended solid (TSS) load (right) from both CSO tanks for area weighted and optimized controlled outflows.

Figure 5.
Influence of different durations of measured data on optimization results for volume (left) and load optimized controlled outflows (right).
Figure 5.
Influence of different durations of measured data on optimization results for volume (left) and load optimized controlled outflows (right).

Figure 6.
CSO emissions of the assessed real-time control strategies compared to CSO emissions from static volume optimized controlled outflows.
Figure 6.
CSO emissions of the assessed real-time control strategies compared to CSO emissions from static volume optimized controlled outflows.

Figure 7.
Combined sewer overflow volume reduction for the individual overflow events of the volume based real-time control compared to static optimized outflows.
Figure 7.
Combined sewer overflow volume reduction for the individual overflow events of the volume based real-time control compared to static optimized outflows.

Figure 8.
Emitted volume and load in the reference scenario, after measured data-based optimization, with real-time control and inevitable system emission.
Figure 8.
Emitted volume and load in the reference scenario, after measured data-based optimization, with real-time control and inevitable system emission.

Figure 9.
Standardized simulated and measured overflow frequencies for the status quo.

Figure 10.
Deviation of the minimum emitted volume using long-term (four year) time series as input for optimization from optimization results using shortened time series.
Figure 10.
Deviation of the minimum emitted volume using long-term (four year) time series as input for optimization from optimization results using shortened time series.

Figure 11.
Emitted volumes of all tanks and the total system relative to the emitted volumes of the status quo.
Figure 11.
Emitted volumes of all tanks and the total system relative to the emitted volumes of the status quo.


Table 1.
Catchment and combined sewer overflow (CSO) tank characteristics.
| CSO Tank 1 | CSO Tank 2 | |
|---|---|---|
| Connected area (ha) | 106 | 220 |
| Connected impervious area (ha) | 34 | 75 |
| Effective impervious area (ha) | 17 | 54 |
| Inhabitants | 4770 | 10,985 |
| Total tank volume (m3) | 713 | 1949 |
| Controlled outflow (L/s) | 58 | 183 |
Table 2.
Optimized controlled outflows and resulting total emitted loads and volumes for different optimization objectives and area-weighted controlled outflows.
Table 2.
Optimized controlled outflows and resulting total emitted loads and volumes for different optimization objectives and area-weighted controlled outflows.
| Optimization Objective | Controlled Outflow (L/s) | Totally Emitted | ||
|---|---|---|---|---|
| Tank 1 | Tank 2 | Volume (m3) | TSS Load (kg) | |
| Minimum emitted volume | 70 | 171 | 171,339 | 19,188 |
| Minimum total emitted load | 66 | 175 | 171,518 | 19,157 |
| Minimum CSO duration | 78 | 164 | 171,871 | 19,299 |
| Area weighted controlled outflows | 58 | 183 | 172,891 | 19,220 |
Table 3.
Influence of different measurement errors on data-based optimization results.
| Error Type | Influence Evaluated by | Effect on Optimization Results |
|---|---|---|
| Undirected random errors | noise | none to minor |
| Systematic errors | error factors, uncalibrated TSS probe, drifting of concentration | minor to medium |
| Combined errors | combination of the error types mentioned above | medium to strong |
| System simplifications | neglecting flow components as overflow | strong: unusable optimization results |
Publisher’s Note: MDPI stays neutral with regard to jurisdictional claims in published maps and institutional affiliations. |
© 2021 by the authors. Licensee MDPI, Basel, Switzerland. This article is an open access article distributed under the terms and conditions of the Creative Commons Attribution (CC BY) license (http://creativecommons.org/licenses/by/4.0/).
Share and Cite
MDPI and ACS Style
Bachmann-Machnik, A.; Brüning, Y.; Ebrahim Bakhshipour, A.; Krauss, M.; Dittmer, U. Evaluation of Combined Sewer System Operation Strategies Based on Highly Resolved Online Data. Water 2021, 13, 751. https://doi.org/10.3390/w13060751
AMA Style
Bachmann-Machnik A, Brüning Y, Ebrahim Bakhshipour A, Krauss M, Dittmer U. Evaluation of Combined Sewer System Operation Strategies Based on Highly Resolved Online Data. Water. 2021; 13(6):751. https://doi.org/10.3390/w13060751
Chicago/Turabian StyleBachmann-Machnik, Anna, Yannic Brüning, Amin Ebrahim Bakhshipour, Manuel Krauss, and Ulrich Dittmer. 2021. "Evaluation of Combined Sewer System Operation Strategies Based on Highly Resolved Online Data" Water 13, no. 6: 751. https://doi.org/10.3390/w13060751
Note that from the first issue of 2016, this journal uses article numbers instead of page numbers. See further details here.