
Impact Assessment of Flood Damage in Urban Areas Using RCP 8.5 Climate Change Scenarios and Building Inventory

1
Department of Urban and Environmental and Disaster Management, Graduated School of Prevention, Kangwon National University, Kangwon-do 25913, Korea
2
Department of Land, Water and Environment Research, Korea Institute of Civil Engineering and Building Technology, Gyeonggi-do 10223, Korea
3
Kangwon Institute of Inclusive Technology, Kangwon-do 24341, Korea
*
Author to whom correspondence should be addressed.
Water 2021, 13(6), 756; https://doi.org/10.3390/w13060756
Submission received: 2 February 2021
/
Revised: 4 March 2021
/
Accepted: 6 March 2021
/
Published: 10 March 2021
(This article belongs to the Special Issue Modelling Flood Hazards and Management for Environmental Sustainability)
Abstract
:Korea has frequent flood damage due to localized torrential rain and typhoons as a result of climate change, which causes many casualties and property damage. In particular, much damage occurs due to urban inundation caused by stream flooding as a result of climate change. Thus, this study aims to analyze the effect of climate change on flood damage targeting the Wonjucheon basin, which is an urban stream flowing the city. For future rainfall data, RCP (Representative Concentration Pathways) 8.5 climate change scenario data was used, statistical detailed using SDQDM (Spatial Disaggregation with Quantile Delta Mapping) techniques, and daily data was downscaled using Copula model. In general, the flood damage rate is calculated by using the area ratio according to the land use in the administrative district, but in this study, the flood damage rate is calculated using the flood damage rate proposed in the multi-dimensional flood damage analysis using Building Inventory. Using the created future rainfall data and current data, the runoff in the Wonjucheon basin, Wonju-si, South Korea, by rainfall frequency was calculated through the Spatial Runoff Assessment Tool (S-RAT) model, which was a distributed rainfall-runoff model. The runoff was calculated using 100-year and 200-year frequency rainfalls for a four-hour duration and the flood damage area was calculated by applying the calculated runoff to the Flo-2D model, was developed by Federal Emergency Management Agency (FEMA) in United State of America, which was a flood inundation model. As a result of calculating the amount of discharge, it was analyzed that the average amount of discharge increased by 16% over the 100-year, 200-year frequency. The calculated result of the flood damage area was analyzed and the analysis results showed that the future flood damage area increased by around 30% at the 100-year frequency and around 15% at the 200-year frequency. The estimated flood damage by rainfall frequency was calculated using the flood damage area by frequency and multi-dimensional analysis, and the analysis result exhibited that the damage increased by around 23% at the 100-year frequency and around 45% at the 200-year frequency.
1. Introduction
In rapid increase in high casualties and property damage in urban areas caused by urban flooding. In Korea, there has been much damage due to floods caused by torrential rainfalls of many typhoons such as Rusa in 2002, Maemi in 2003, and Nari in 2007, and frequencies of rainfalls that exceed the design flood frequencies for hydraulic recent years, rainfall intensity has significantly increased due to the changes in the environment and ecosystem caused by climate change and global warming, and flood-prone regions have also increased due to the expansion of residential areas and urban parks around rivers caused by the rapid urbanization, resulting in the structures are expected to increase due to climate change. Thus, it is necessary to build an analysis system for prior prediction of flood disasters that are repeated every year to protect the citizens’ lives and properties and manage the disasters effectively. However, the current information system is limited because most disasters contain many variables and uncertainties [1].
It is important to secure reliable rainfall scenarios and high-resolution terrain data in hydrological modeling according to climate change. Annis et al. [2] investigated the potential benefits of UAV-derived DEM(Digital Elevation Model)s with respect to a freely and largely available DEM (TINITALY) for flood modeling in small basins. and their results supported the conclusion that the UAV-derived DEMs could be an appropriate alternative to the LiDAR(Light Detection And Ranging) DEM for small basin flood mapping being a good compromise between accuracy. Generally, sub-daily rainfall data are needed for risk assessment of hydraulic structures or hydrological modeling, and several studies have been conducted on stationary rainfall frequency analysis and probability precipitation estimation [3,4,5]. However, those studies were focused on daily precipitation and few studies were conducted on sub-daily precipitation generation. One of the sub-daily downscaling methods is the copula model [6]. Kim et al. [7] developed a conditional copula model and examined its applicability through statistical verification. Salvadori et al. [8] showed how, exploiting recent theoretical developments, multivariate extreme value models(MEV) can be easily constructed via copulas, and lead to new model formulations. There have been many studies using the regional climate model (RCM) results to analyze the effect of climate change [9,10,11,12]. However, the use of the global climate model (GCM) or RCM results in the hydrological analysis is not recommended because of not only spatio-temporal bias but also various uncertainties. In particular, statistical downscaling can be another alternative for hydrological modeling (rainfall-runoff simulation and water budget analysis, etc.) that requires sub-daily precipitation time-series [13,14,15]. Some of the statistical downscaling methods are indirect downscaling methods [16] that reflects the climate change effect to the simulated hydrological weather data such as weather generator, weather typing, and climate analogue methods, and methods of statistical bias correction of climate change scenario results based on observations followed by using the corrected result in hydrological modeling and analysis [17]. Adan et al. [18] investigates the capability of four machine learning methods (MLM), optimal pruning extreme learning machine(OPELM), multivariate adaptive regression spline (MARS), M5 model tree (M5Tree), and hybridized MARS and Kmeans algorithm (MARS-Kmeans), in hourly rainfall-runoff modeling. And their results are compared with a conceptual method, Event-Based Approach for Small and Ungauged Basins (EBA4SUB) and multi-linear regression (MLR). Blenkinsop et al. [19] described a new, integrated implementation of the NSRP (Neyman-Scott Rectangular Pulses model) rainfall model and CRU (Climatic Research Unit) WG (Weatehr Generators) to provide downscaled daily weather scenarios of future transident climate for the Geer catchment in Belgium. Bruton et al. [20] presented a new transient rainfall simulation methodology which combines dynamical and statistical downscaling techniques to produce transient climate change scenarios. De Luca et al. [21] proposed a comprehensive methodology for trend investigation in rainfall time series, in a climate-change context, using Stochastic Rainfall Generator (SRG). De Luca and Biondi [22] was focused on the return period evaluation for design hyetographs (DH) and was obtained result, which allows the main characteristics of T-year DHS to be estimated, considering both the univariate and the coupla based multivariate analysis, and the associated T-year design flood peaks obtained through the simulation with a Rainfall-Runoff model. Pal et al. [23] conducted a study in the Bardhaman district of West Bengal in terms of flood management using GIS and proposed the effectiveness of flood management using GIS. Malik and Pal [24] conducted a study on flood prevention through the estimation and prediction of flood vulnerabilities due to climate change and analyzed using climate change scenarios and HEC-RAS, was developed by US Army Corps of Engineers in United State of America. Band et al. [25] conducted flood sensitivity modeling in the Iran Markazi Province region and performed an analysis of the parameters affecting the flood using machine learning techniques. Roy et al. [26] conducted a machine learning analysis using various factors on the Indian Ajoyriver basin and conducted a study verifying it using AUC (Area Under Curve) techniques. Malik et al. [27] conducted the study through AUC analysis with 14 variables for flood sensitivity analysis. Malik et al. [28] developed a rating curve using a two-dimensional hydrologic model for Dwarkswarriver which located west Bengal in India and reviewed its applicability.
The hydraulic problems such as flooding and inundation analysis require the analysis of various and complex terrains and the prediction of flow. Thus, they are studied constantly through various methods such as numerical analysis programs and empirical equations.
Yeo [29] studied an equation to calculate the damage due to the estimated inundation area by rainfall frequency to calculate the expected annual damage, which was one of the risk and benefit elements in the economic analysis of flood control and derived a relational equation after collecting damage data due to the inundated area of actual damage. Choi et al. [30] developed a multi-dimensional analysis to improve the problems in the existing economic analysis of flood control used in Korea. Lee et al. [31] corrected the factors of flood damage calculation in the multi-dimensional analysis to make them suitable for urban areas using the multi-dimensional analysis thereby conducting analysis by applying the corrected factors to the Dorimcheon basin,South Korea. Lee and Park [32] aimed to improve the limitations of previous studies on inundation risk and developed a methodology to implement the multi-dimensional flood damage analysis (MD-FDA) method based on digital topographic maps and land cover maps for some part of the Geum River, South Korea. Lee [33] also compared the expected flood damage based on the probability of rainfall caused by future climate change and quantitatively compared the benefits when coping with climate change. Schreider et al. [34] calculated the future flood damage using the climate change scenario data and lumped the rainfall-runoff model at the Hawkesbury region in Australia. IHACRES(Identification of unit Hydrograph And Component flows from Rainfall, Evaporation and Streamflow data)evaluated the flood-prone characteristics in Guri-si, Gyeonggi Province, South Korea, through the MD-FDA by evaluation items based on the geographic information system (GIS) data [35]. Tak et al. [36] investigated the applicability of the multi-dimensional flood damage calculation method to urban areas considering the detailed information of building type and contents to calculate the damage in the inundated region using the XP-Storm and Wastewater Management Model (SWMM). Huizinga et al. [37] compiled a depth-damage curve by collecting database from 41 countries and presented fractional damage for agriculture and infrastructure.
Dutta and Health [38] developed the flood damage assessment (FDA) methodology in link with a GIS based on survey data of asset value and the flood inundation model. [39] created an inundation trace map using HEC-RAS and ArcView which was developed by ESRI(Environmental Systems Research Institute) in United State of America, and Daniel Snead [40] conducted a visualization study of flood plain using HEC-GeoRAS, United State of America. Ministry of Land Infrastructure and Tranport and Turism [41] published the Flood Control Economic Survey Manual after improving and advancing the methods contained in the existing Flood Control Economic Survey Guidelines. Biza et al. [42] developed a flood damage calculation model called flood analysis toolbox (FAT) in link with a GIS such as asset information, economic data, and hydrological data, etc. Beffa and Connell [43] developed the Hydro2de model, which was a two-dimensional flood model, to investigate the terrain features and grid creation conditions in the protected lowland and applied the model to the Waihao River’s, New Zealand, flood plain to analyze the reliability and accuracy. Petroselli et al. [44] used the EBA4SUB rainfall-runoff model to calculate the runoff and compared it to the Mike 11 model which is 1D hydraulic model and developed by DHI in Denmark, and the Flo-2D model which is 2D hydraulic model. Merwade et al. [45] is to highlight the effects of uncertainties associated with key variables in flood inundation mapping and proposed a conceptual framework to address these uncertainties to produce improved estimates of flood inundation areas. Armenakis and Nirupama [46] calculated the spatial disaster risk and urban vulnerability, and conducted a study to visualize the calculation results using ArcGIS which was developed by ESRI(Environmental Systems Research Institute) in United State of America.
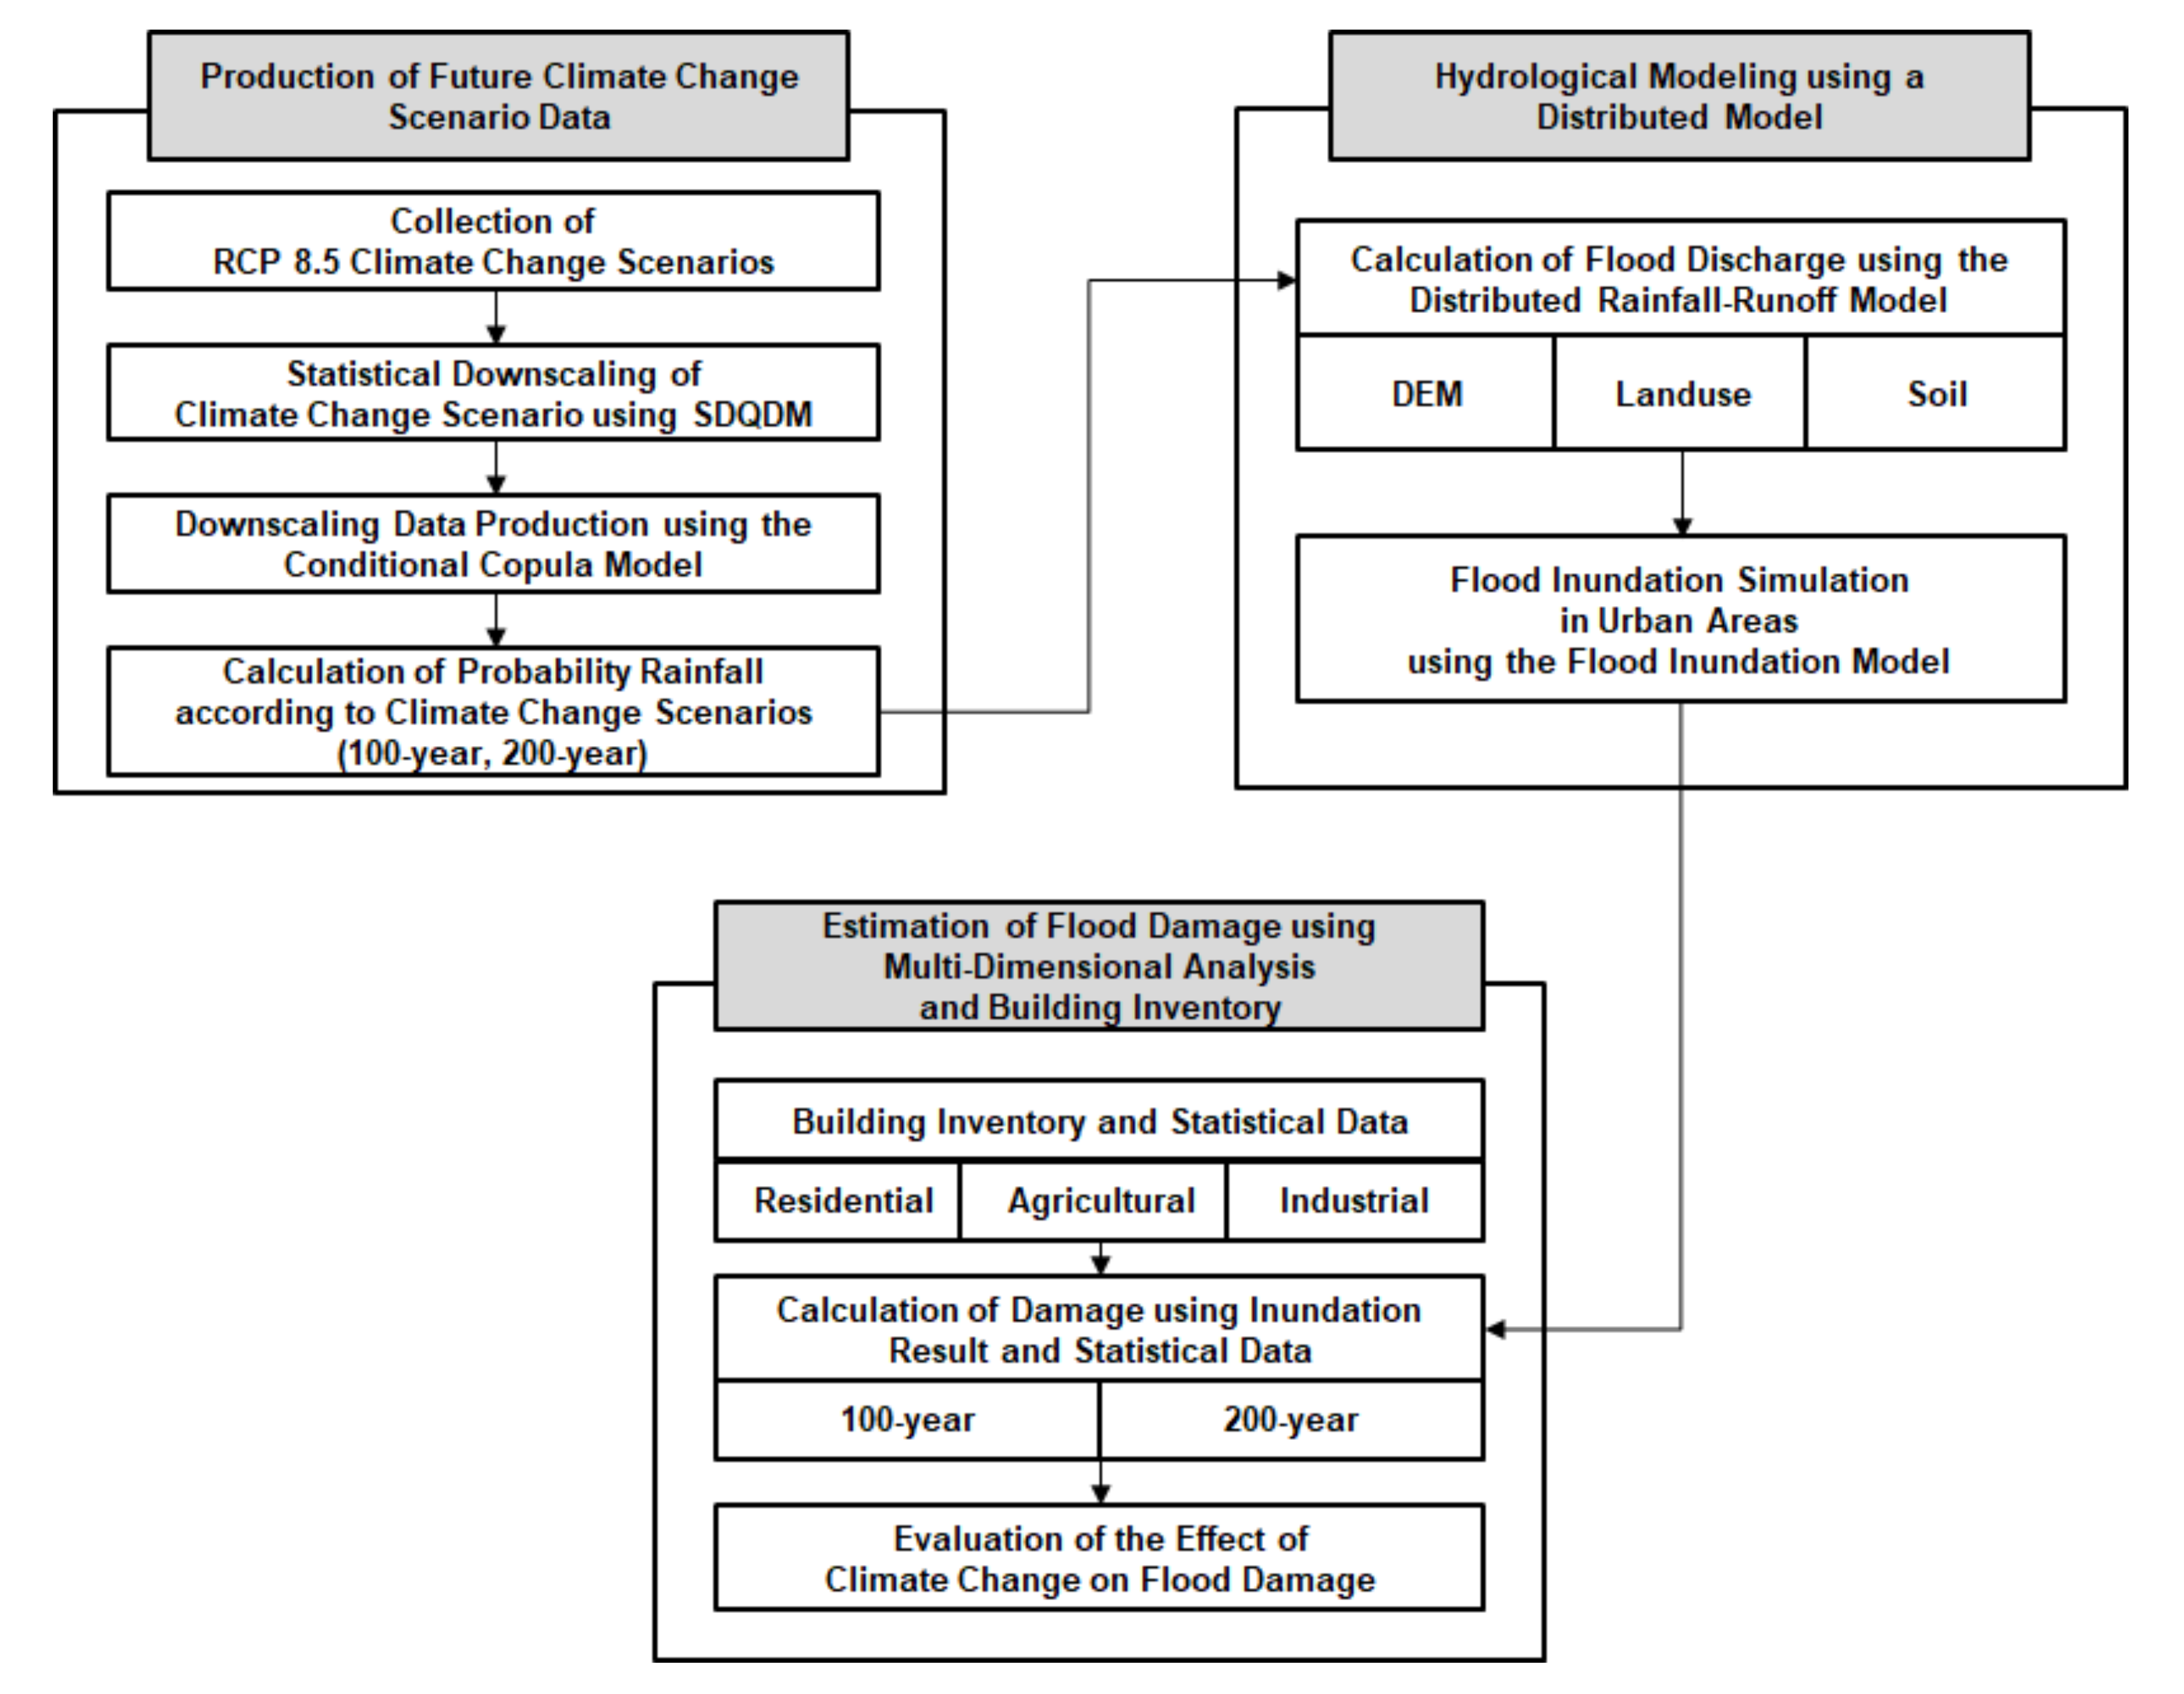
In the present study, the Wonjucheon basin, which was an urban stream flowing through the city was selected as the target basin, and a conditional Copula model-based downscaling scheme for sub-daily extreme rainfall was used to generate the future rainfall data thereby generating the future extreme rainfall data in the target basin using the RCP 8.5 scenario data. And RCP 8.5 Climate Change Scenario was used to conduct research assuming extreme situations in which greenhouse gas emissions have not been reduced. Since the duration in the flood inundation simulation had no reference data, it was set to four hours in this study. The runoff was calculated by applying the rainfall data of the current, and future 100-year and 200-year return periods according to the duration to the S-RAT model, which was a distributed rainfall-runoff model. The calculated runoff was used as the input data in the Flo-2D model to calculate the flood damage area. The flood damage was calculated using the multi-dimensional array, and the effect of climate change on the flood damage was evaluated through the comparison between the current and future flood damage scales. The overall study flow is shown in Figure 1.
2. Theoretical Background
2.1. RCP Climate Change Scenarios
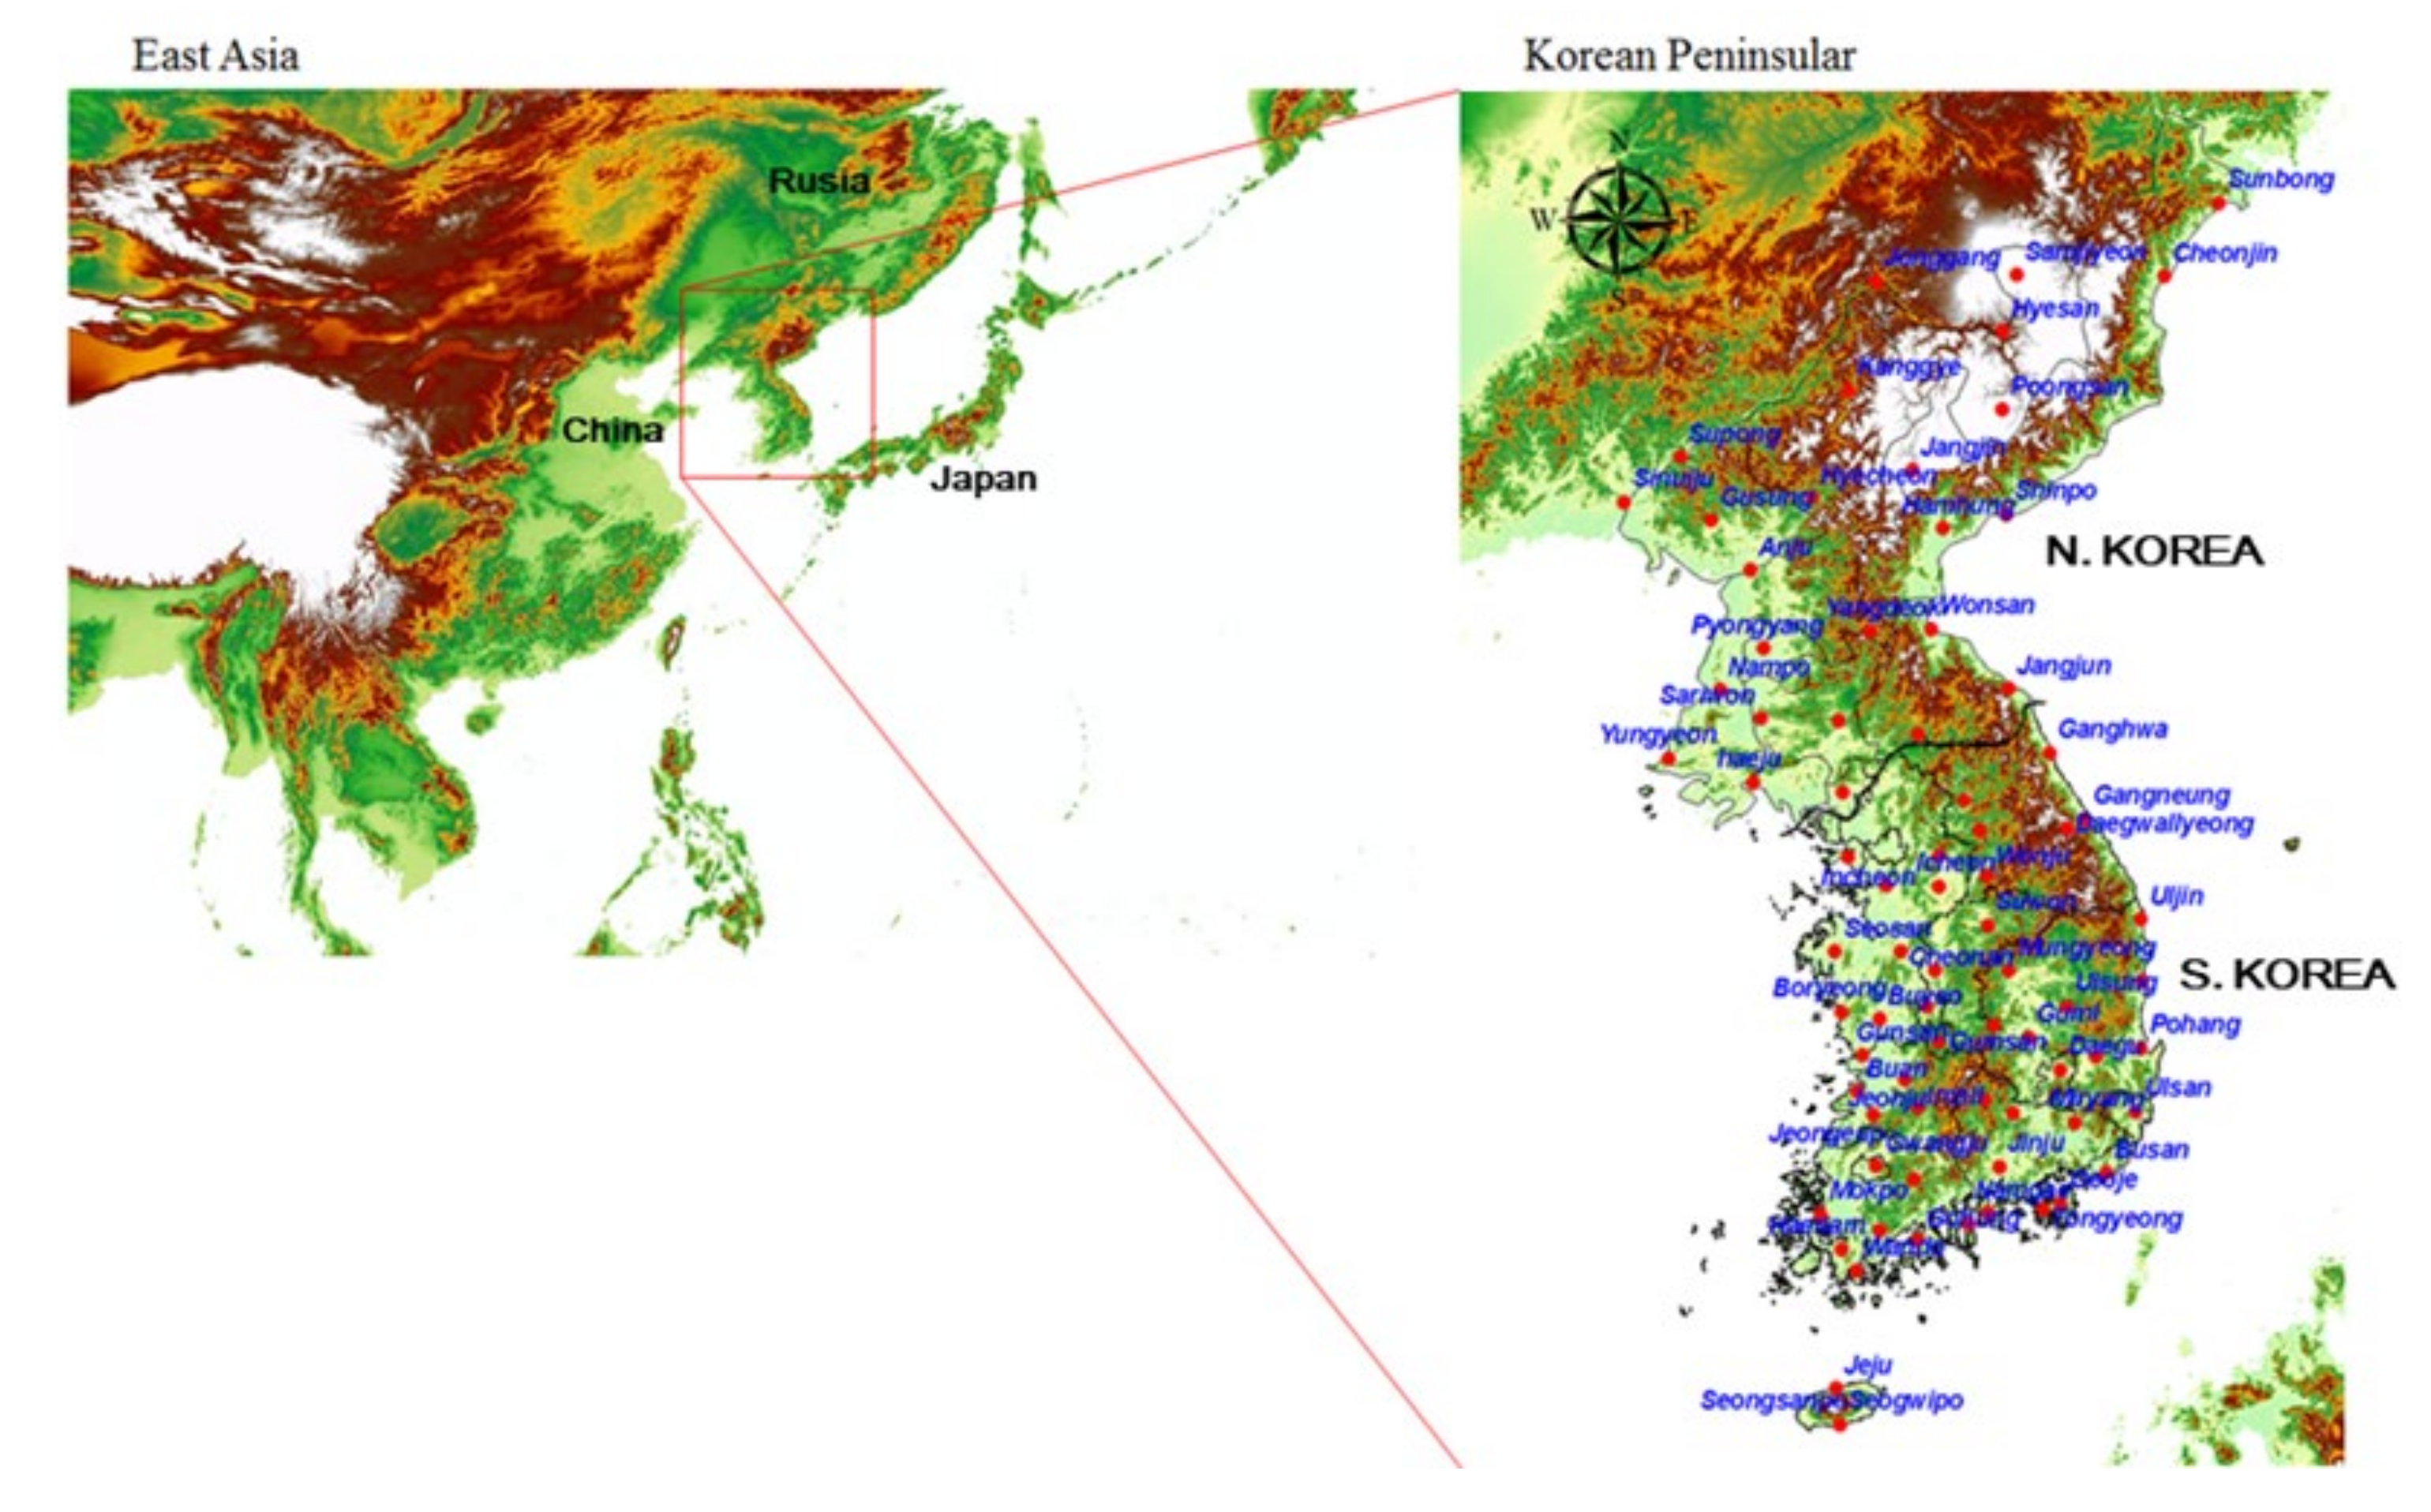
The Korea Meteorological Administration (KMA) has operated the standard scenario certification system from 2013 to use various scenarios, which recommends the scenarios at a level of 13 regions produced by combining the statistical downscaling (Table 1) and global climate model (GCM) scenarios. In this study, the HadGEM2-AO model was employed out of 13 global models that followed the Representative Concentration Pathway (RCP) 8.5, which refers to an extremely high greenhouse gas emission scenario without policies to combat climate change. In order to downscale GCM scenarios, we used SDQDM (Spatial Disaggregation with Quantile Delta Mapping; [47]) techniques developed to maintain long-term trends in climate models and to compensate for convenience. Figure 2 shows the locations of the meteorological stations used in the analysis.
2.2. Simualation of Extreme Precipitation Data Using Conditional Copula Model
In this study, the joint distribution relationship between daily and sub-daily extreme precipitation data per duration was built through the Copula function based on the past data. From the joint distribution built by using the daily precipitation derived from the climate change scenarios, the extreme precipitation for each duration was derived through the Copula model. Equation (1) refers to the process to induce the conditional Copula function. In other words, the conditional Copula is a technique used to derive u according to specific variate v. Here, the variates u and v refer to cumulative probability distributions based on the basic assumption of the Copula function. In this study, v refers to the 24-h precipitation, and u refers to the extreme precipitation below 24-h duration.
As mentioned above, the bivariate Archimedean Copula function was used to apply the conditional Copula. Equation (2) is needed in common to obtain the conditional Copula of the Archimedean Copula.
Here, in Equation (2) refers to the generator in the Archimedean Copula function. The generator for each Archimedean Copula function is presented in Table 1, in which t refers to the [u,v] vector. The advantage of the Archimedean Copula is that once for each Copula function is calculated, the Copula function can be estimated more easily, which is why it is widely used in various studies. The Archimedean Copula used in this study requires a conditional Copula equation such as Equation (3). To obtain the preferred variate u, Equation (2) is partially differentiated with respect to v to induce the conditional Archimedean Copula equation, which is presented in Equation (3). Equation (3) is called h-function generally.
Finally, the preferred variate (u) through the conditional Copula function can be calculated through the inverse function of the h-function as presented in Equation (4).
Thus, this study applied the conditional Copula model using 24-h data and extreme rainfall data per duration for the extreme sub-daily downscaling technique.
2.3. Distributed Rainfall-Runoff Model
The S-RAT model is a distributed rainfall-runoff model developed by Kim et al. [48]. It was designed that a target basin was configured with a certain size of grids using GIS data and the conceptual water budget for each grid in each time interval was calculated to simulate the spatio-temporal change in the runoff in the basin. In the S-RAT, input data are simplified by extracting its own parameters. The S-RAT model employed the SCS curve number (CN) method to select the infiltration and direct runoff for each grid. To do this, the soil map and land use map were inputted to generate the CN value grid data for the calculation.
Here, refers to the potential soil water retention and refers to the CN value for each grid.
Here, refers to the infiltration capacity (water content, mm) of the infiltration basin and refers to the capacity of the infiltration basin.
Here, refers to the subsurface runoff, (mm) refers to the direct runoff, and refers to the conceptual parameter, which is a dimensionless constant. The governing equation about the conservation of mass in the infiltration basin can be calculated using Equations (6)–(9) as follows: Equation (10) can be interpreted using the Runge Kutta 4th order method
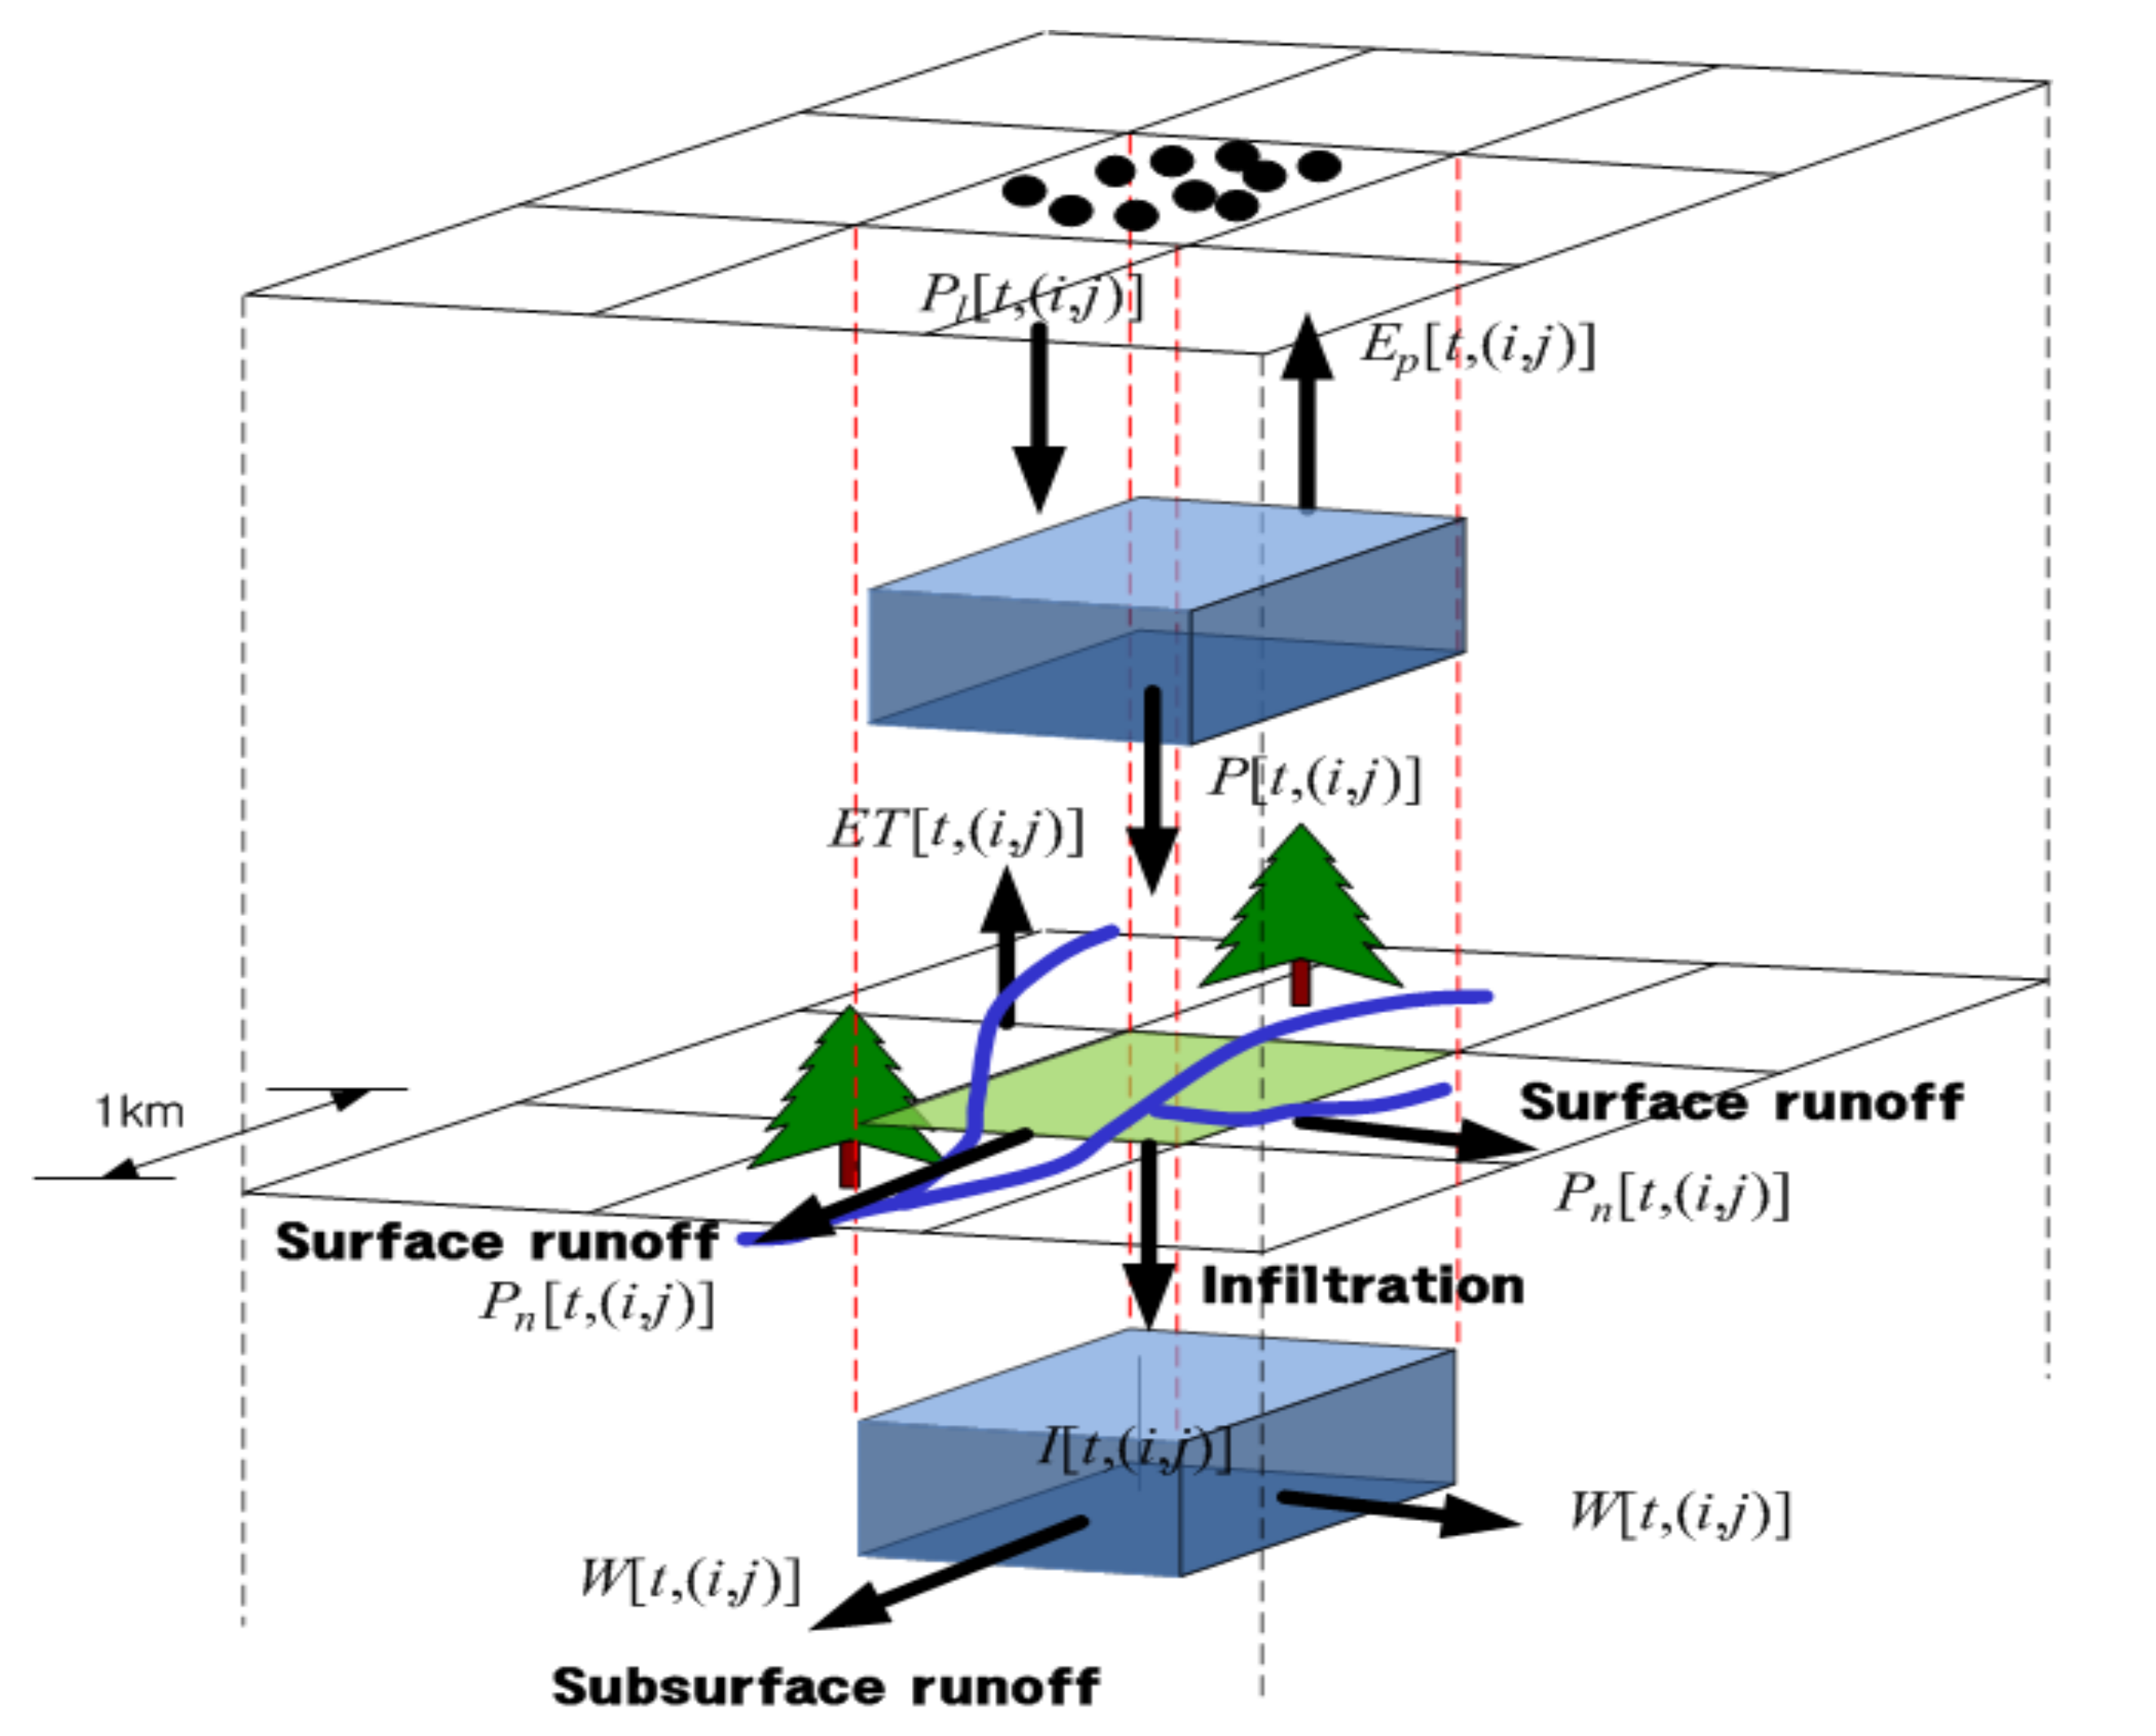
Figure 3 shows the conceptual diagram of the grid water budget calculation in this model. Through the above calculation formula, the runoff is calculated by putting the rainfall into the distributed runoff model S-RAT.
2.4. Flood Inundation Model (Flo-2D)
The Flo-2D model was developed by the Federal Emergency Management Agency (FEMA) to identify the vulnerable urban inundation areas for insurance purposes in the Colorado State of the USA. It is a certified model and highly reliable. The system in the Flo-2D model consists of processors for graphic editing and mapping and elements that can simulate water channels and flood plains in detail. The grid developer system (GDS) generates a grid network that replaces the terrain with continuous small tiles. The Flo-2D model has the components of physical characteristics such as rainfall, flow at water channels, flow at roads, infiltration, and banks. The PROFILES program edits the slope and cross-sectional shape of channels, and the results of flood paths can be graphically checked from the MAXPLOT, MAPPER, and HYDRO programs. The flow equation of Flo-2D is presented in Equation (11), which is based on the continuous and momentum equations.
Here, refers to the flow depth, refers to one of the mean flow velocities out of eight-direction flows (in the x-direction), and refers to the excessive rainfall intensity. refers to the friction slope, which is based on the Manning equation [49].
2.5. Multi-Dimentional Flood Damage Analysis
It is difficult for the economic feasibility analysis of flood control projects to completely verify the real benefits before and even after the project. Thus, the prediction of flood damage is an important part of the project as well as a very sensitive matter in terms of the project promotion. Thus, both engineering and economic viewpoints should be considered to calculate the flood damage reliably, which requires a wide range of analyses and scope of the investigation. From the engineering viewpoint, inundation simulation and flood prediction in the protected lowland mainly based on the hydraulic and hydrological analysis are conducted, which are essential and the most basic procedure in the flood damage calculation as well as overall flood control plan. From the economic viewpoint, it is a process to quantify flood damage by investigating various data and indices that can represent the economic value inside the predicted flood-prone areas [31]. Table 2 shows category of the flood damage assets each type.
2.6. Estimation of Flood Damage Rate
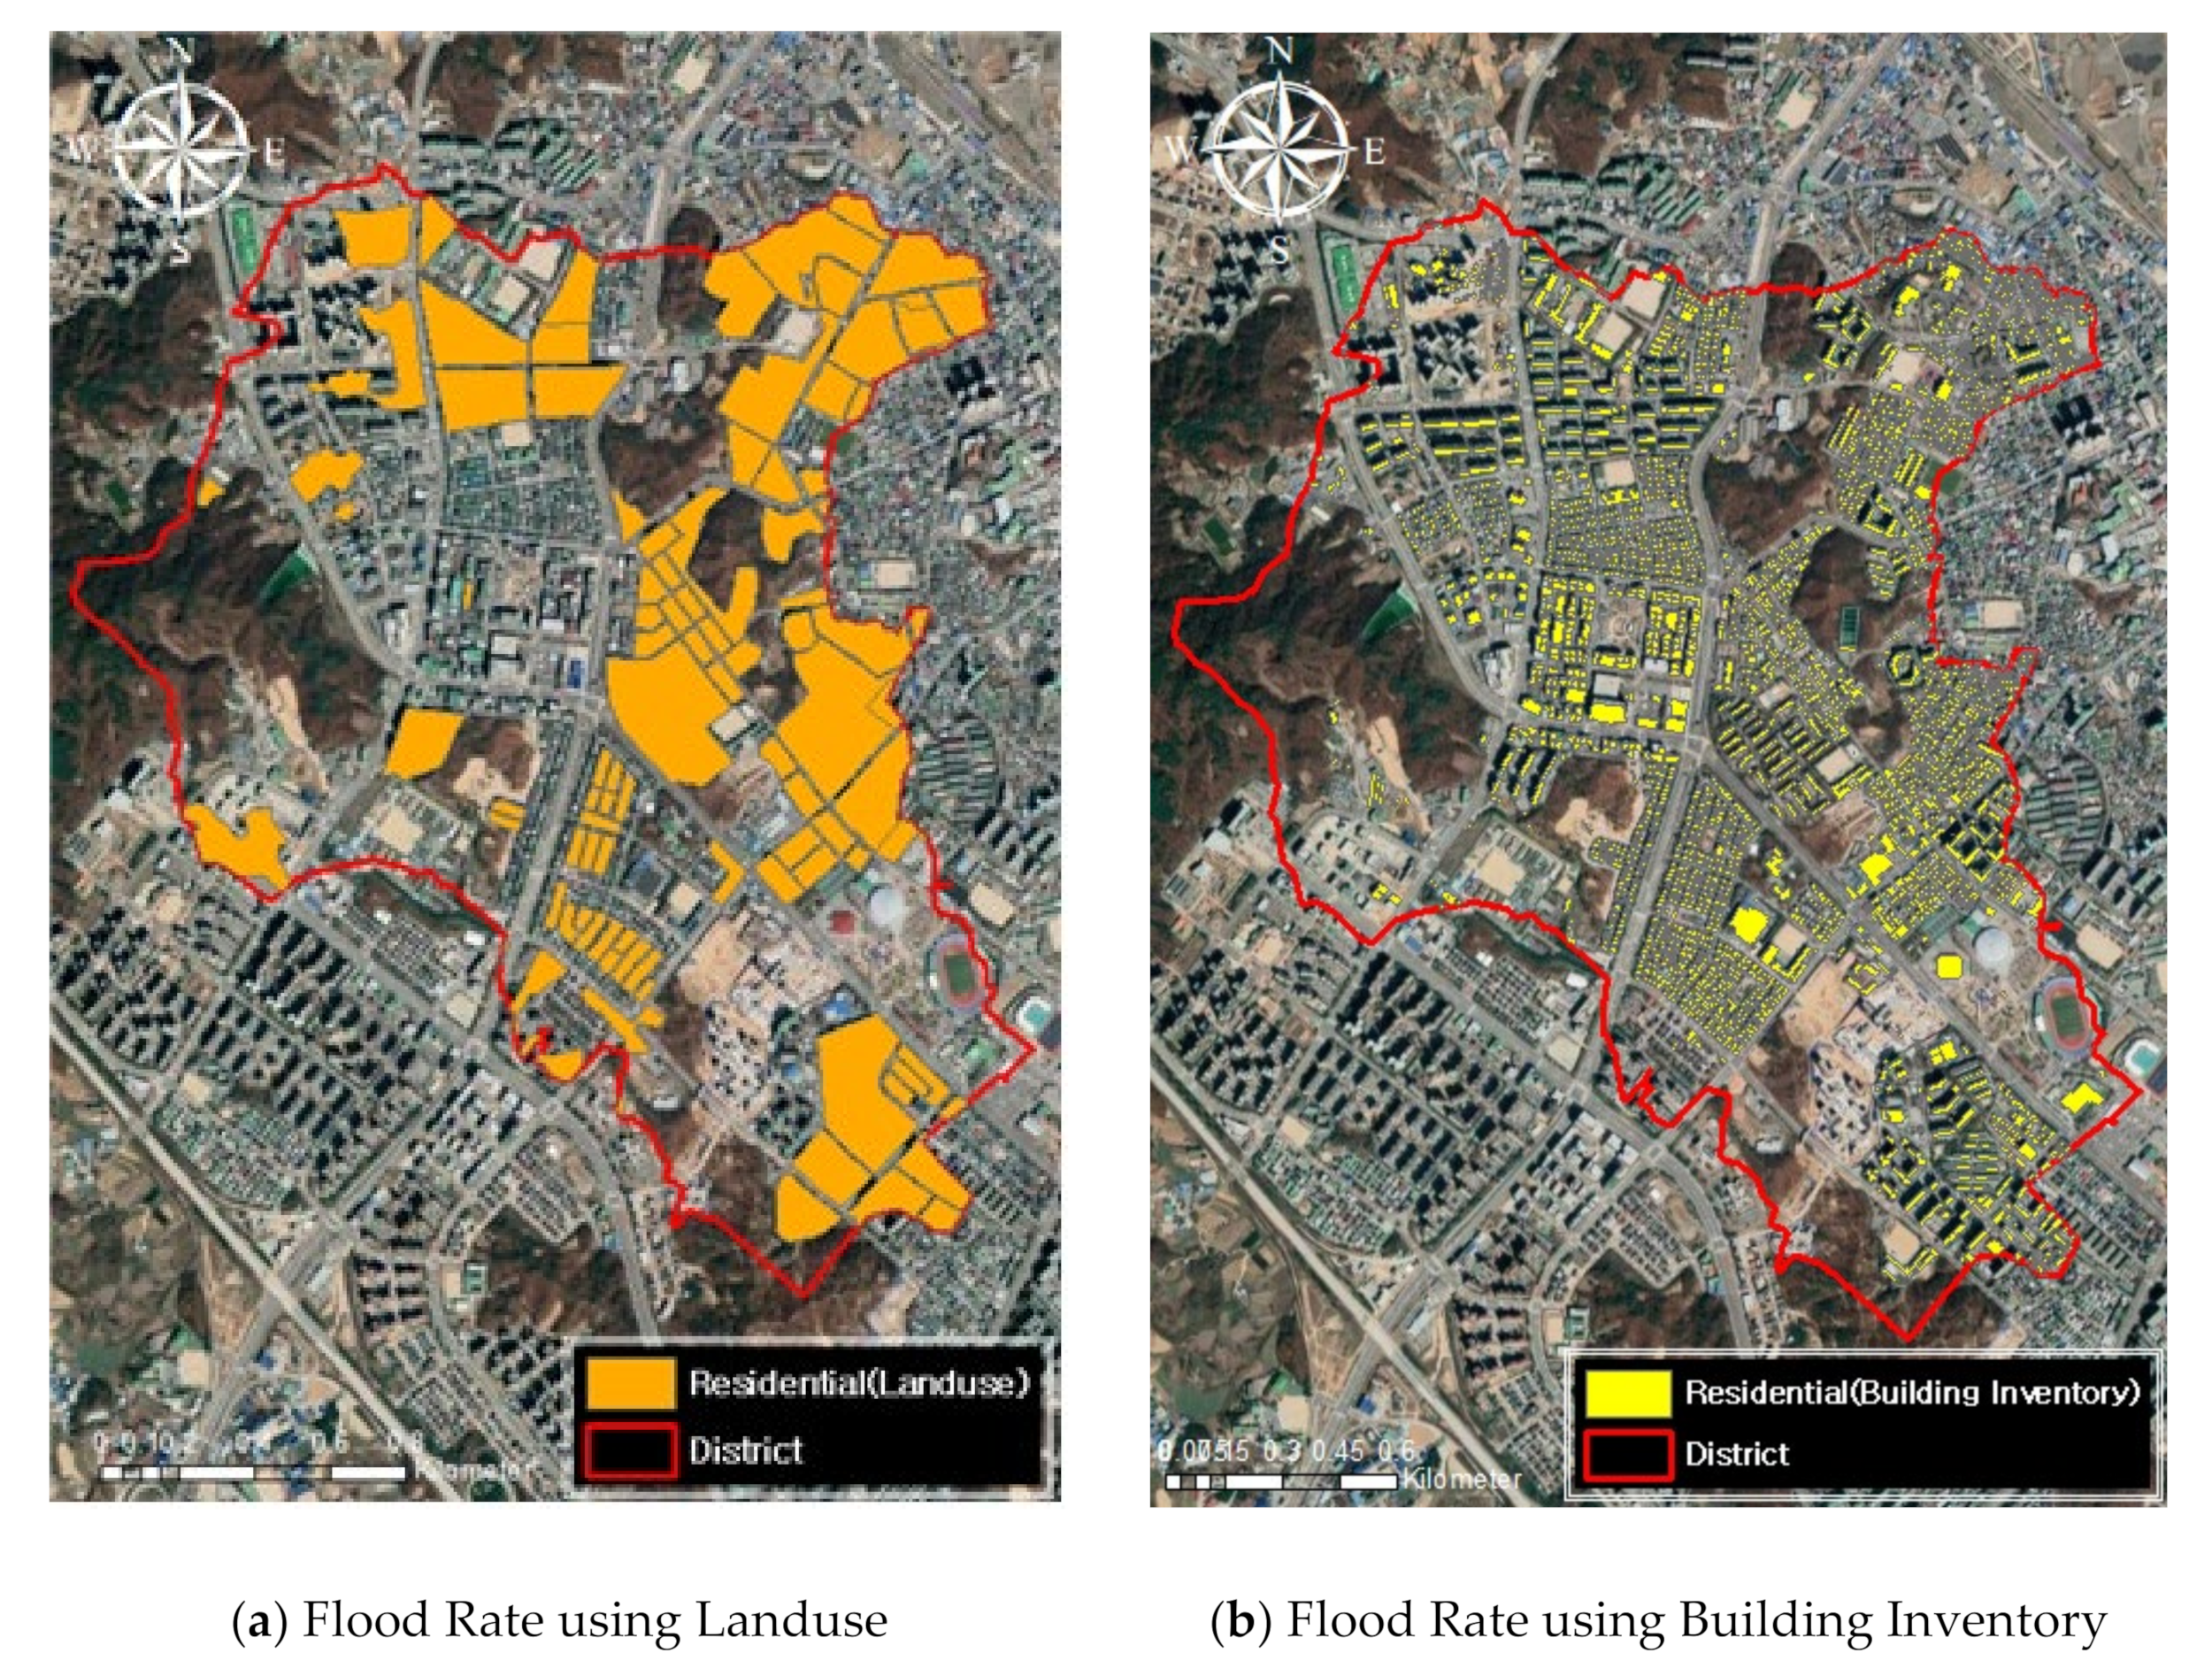
The flood damage rate is calculated as a ratio of flooded area to the total area by overlapping the location information of spatial objects, which are geographic elements, for each of characteristically divided regional areas such as residential, industrial, and agricultural areas in the administrative district by flood depths to convert the inundated area to their asset value out of the total asset value of characteristically divided regional areas. Thus, the flood damage rate is calculated per administrative district. The flood rates of three regional elements: residential, industrial, and agricultural areas are calculated for each flood depth and a sum of the flood damage rates in each flood depth should always be one. In this study, we used to calculate the flood damage rate method [50]. Figure 4 shows the figure to calculate a flood damage rate using overlapped spatial information. For residential and industrial districts, the rate is calculated based on the number of inundated buildings compared to the total number of buildings and for an agricultural district, it is calculated using the inundated area ratio. As you can see in the Figure 4, it is believed that there will be a difference in calculating the in Flood rate when using the area ratio and the actual building inventory, which will have an impact on the flood damage. However, in many cases, the flood damage rate is calculated using an area ratio even for residential and industrial districts because the inventory information of building groups is not sufficient in general. In this study, the flood damage rate of residential and industrial districts was calculated using the building inventory data in the target region in contrast with the method using an area ratio generally. Kang et al. [51] studied the impact on the flood damage by using the area ratio and the building inventory for the flood damage rate.
3. Study Basin and Application
3.1. Study Basin
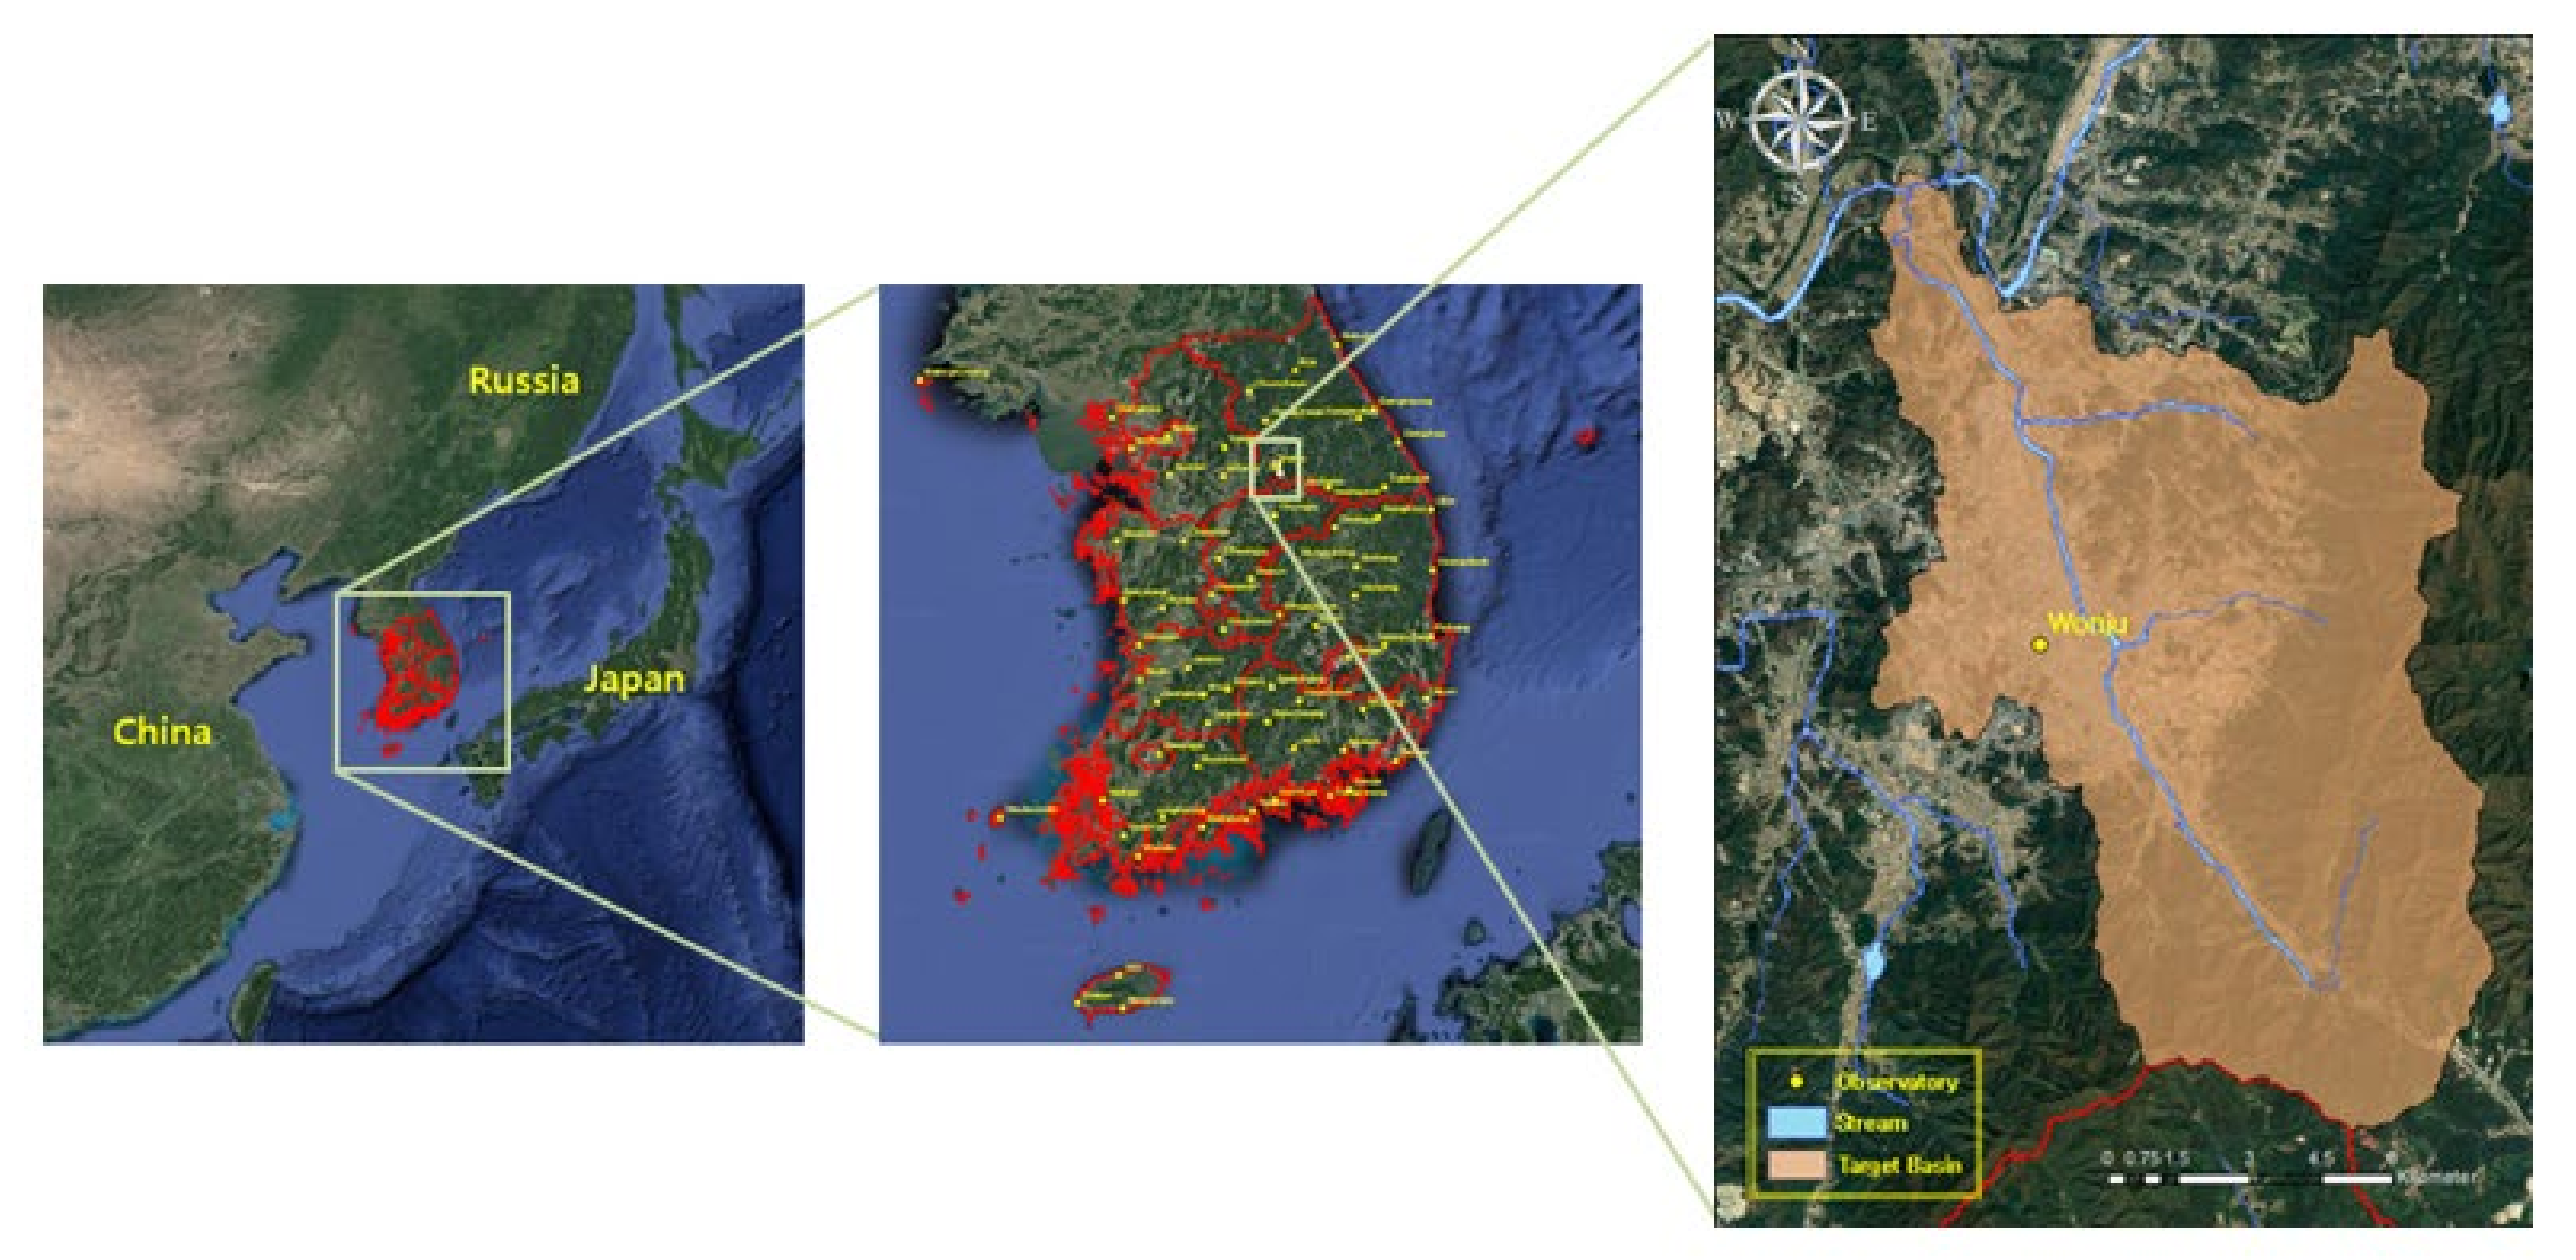
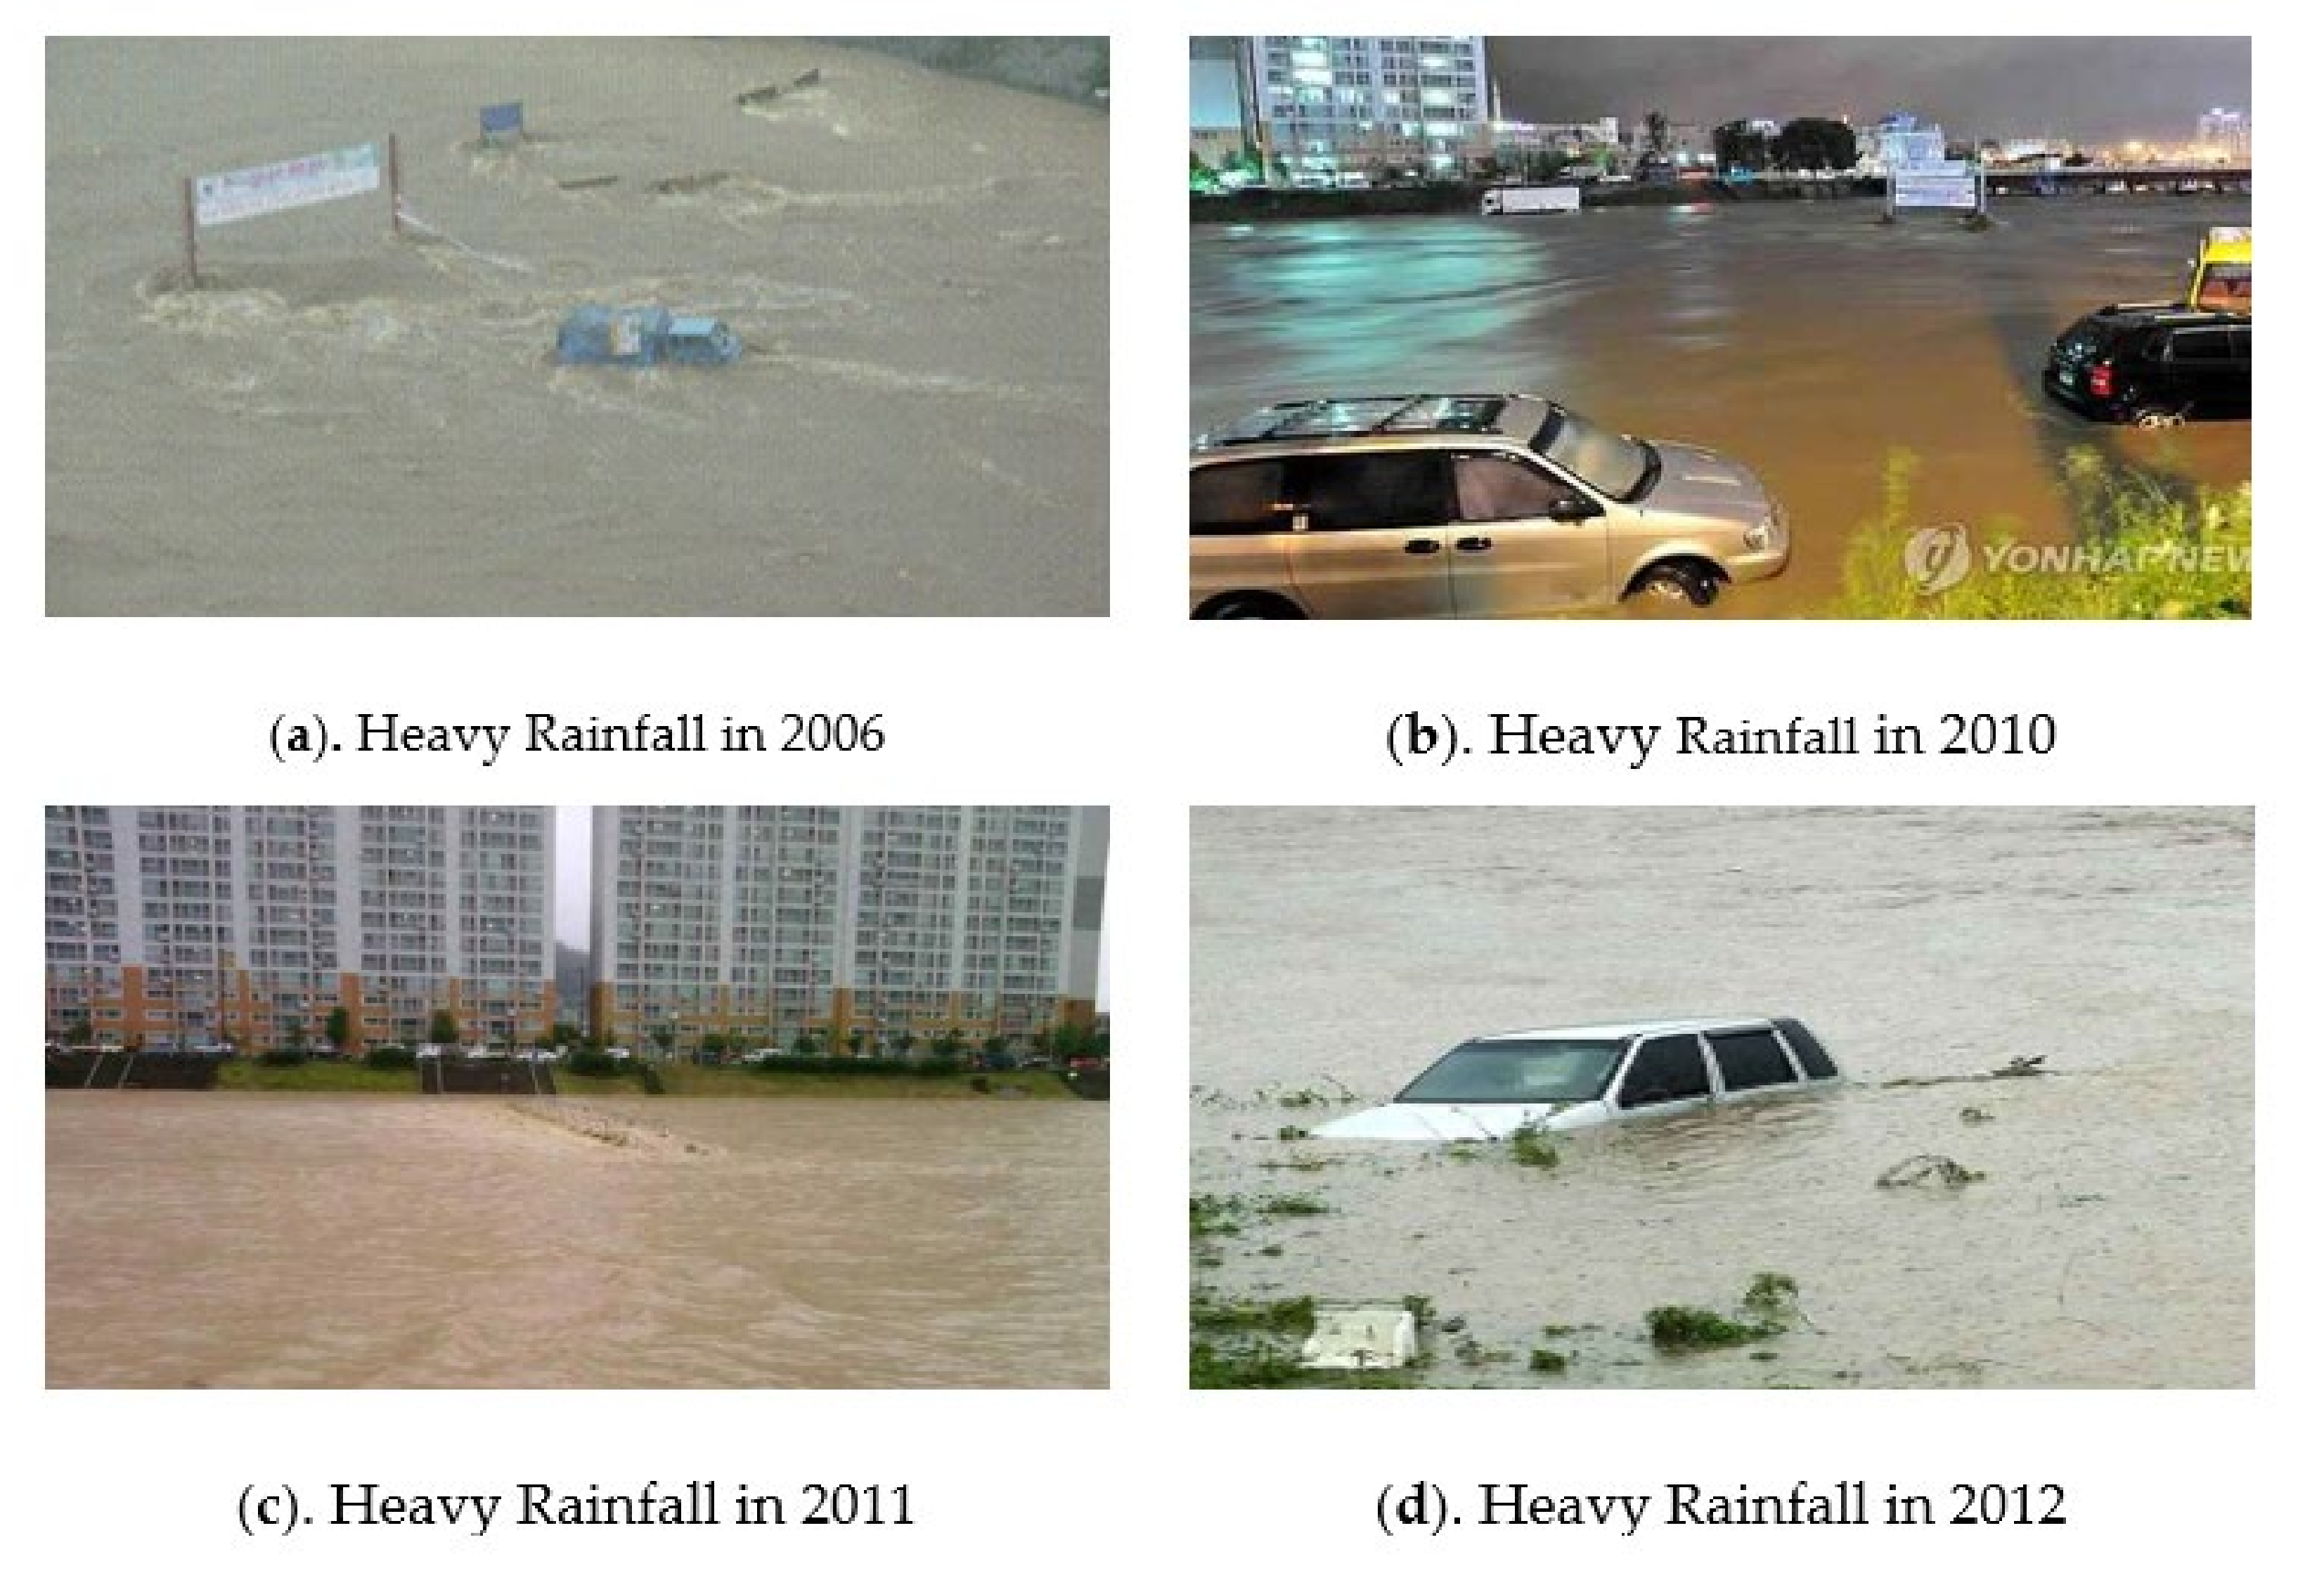
As shown in Figure 5, the Wonjucheon basin, which was an urban stream flowing through the city center, was selected as the target basin. The Wonjucheon basin was a region where urban inundation occurred frequently due to the stream flooding in the past as shown in Figure 6, which caused a large amount of flood damage. The stream was flooded in 2006, 2010, 2011, and 2012 due to heavy rains. The Master Plan for River Maintenance was applied to the Wonjucheon basin in 1999 with the flood level of 80-year frequency in the downstream and 50-year frequency in the upstream. Accordingly, the runoff for two frequencies, 100-year and 200-year, was calculated and analyzed in this study.
3.2. Downscaling of Climate Change Scenarios Using SDQDM
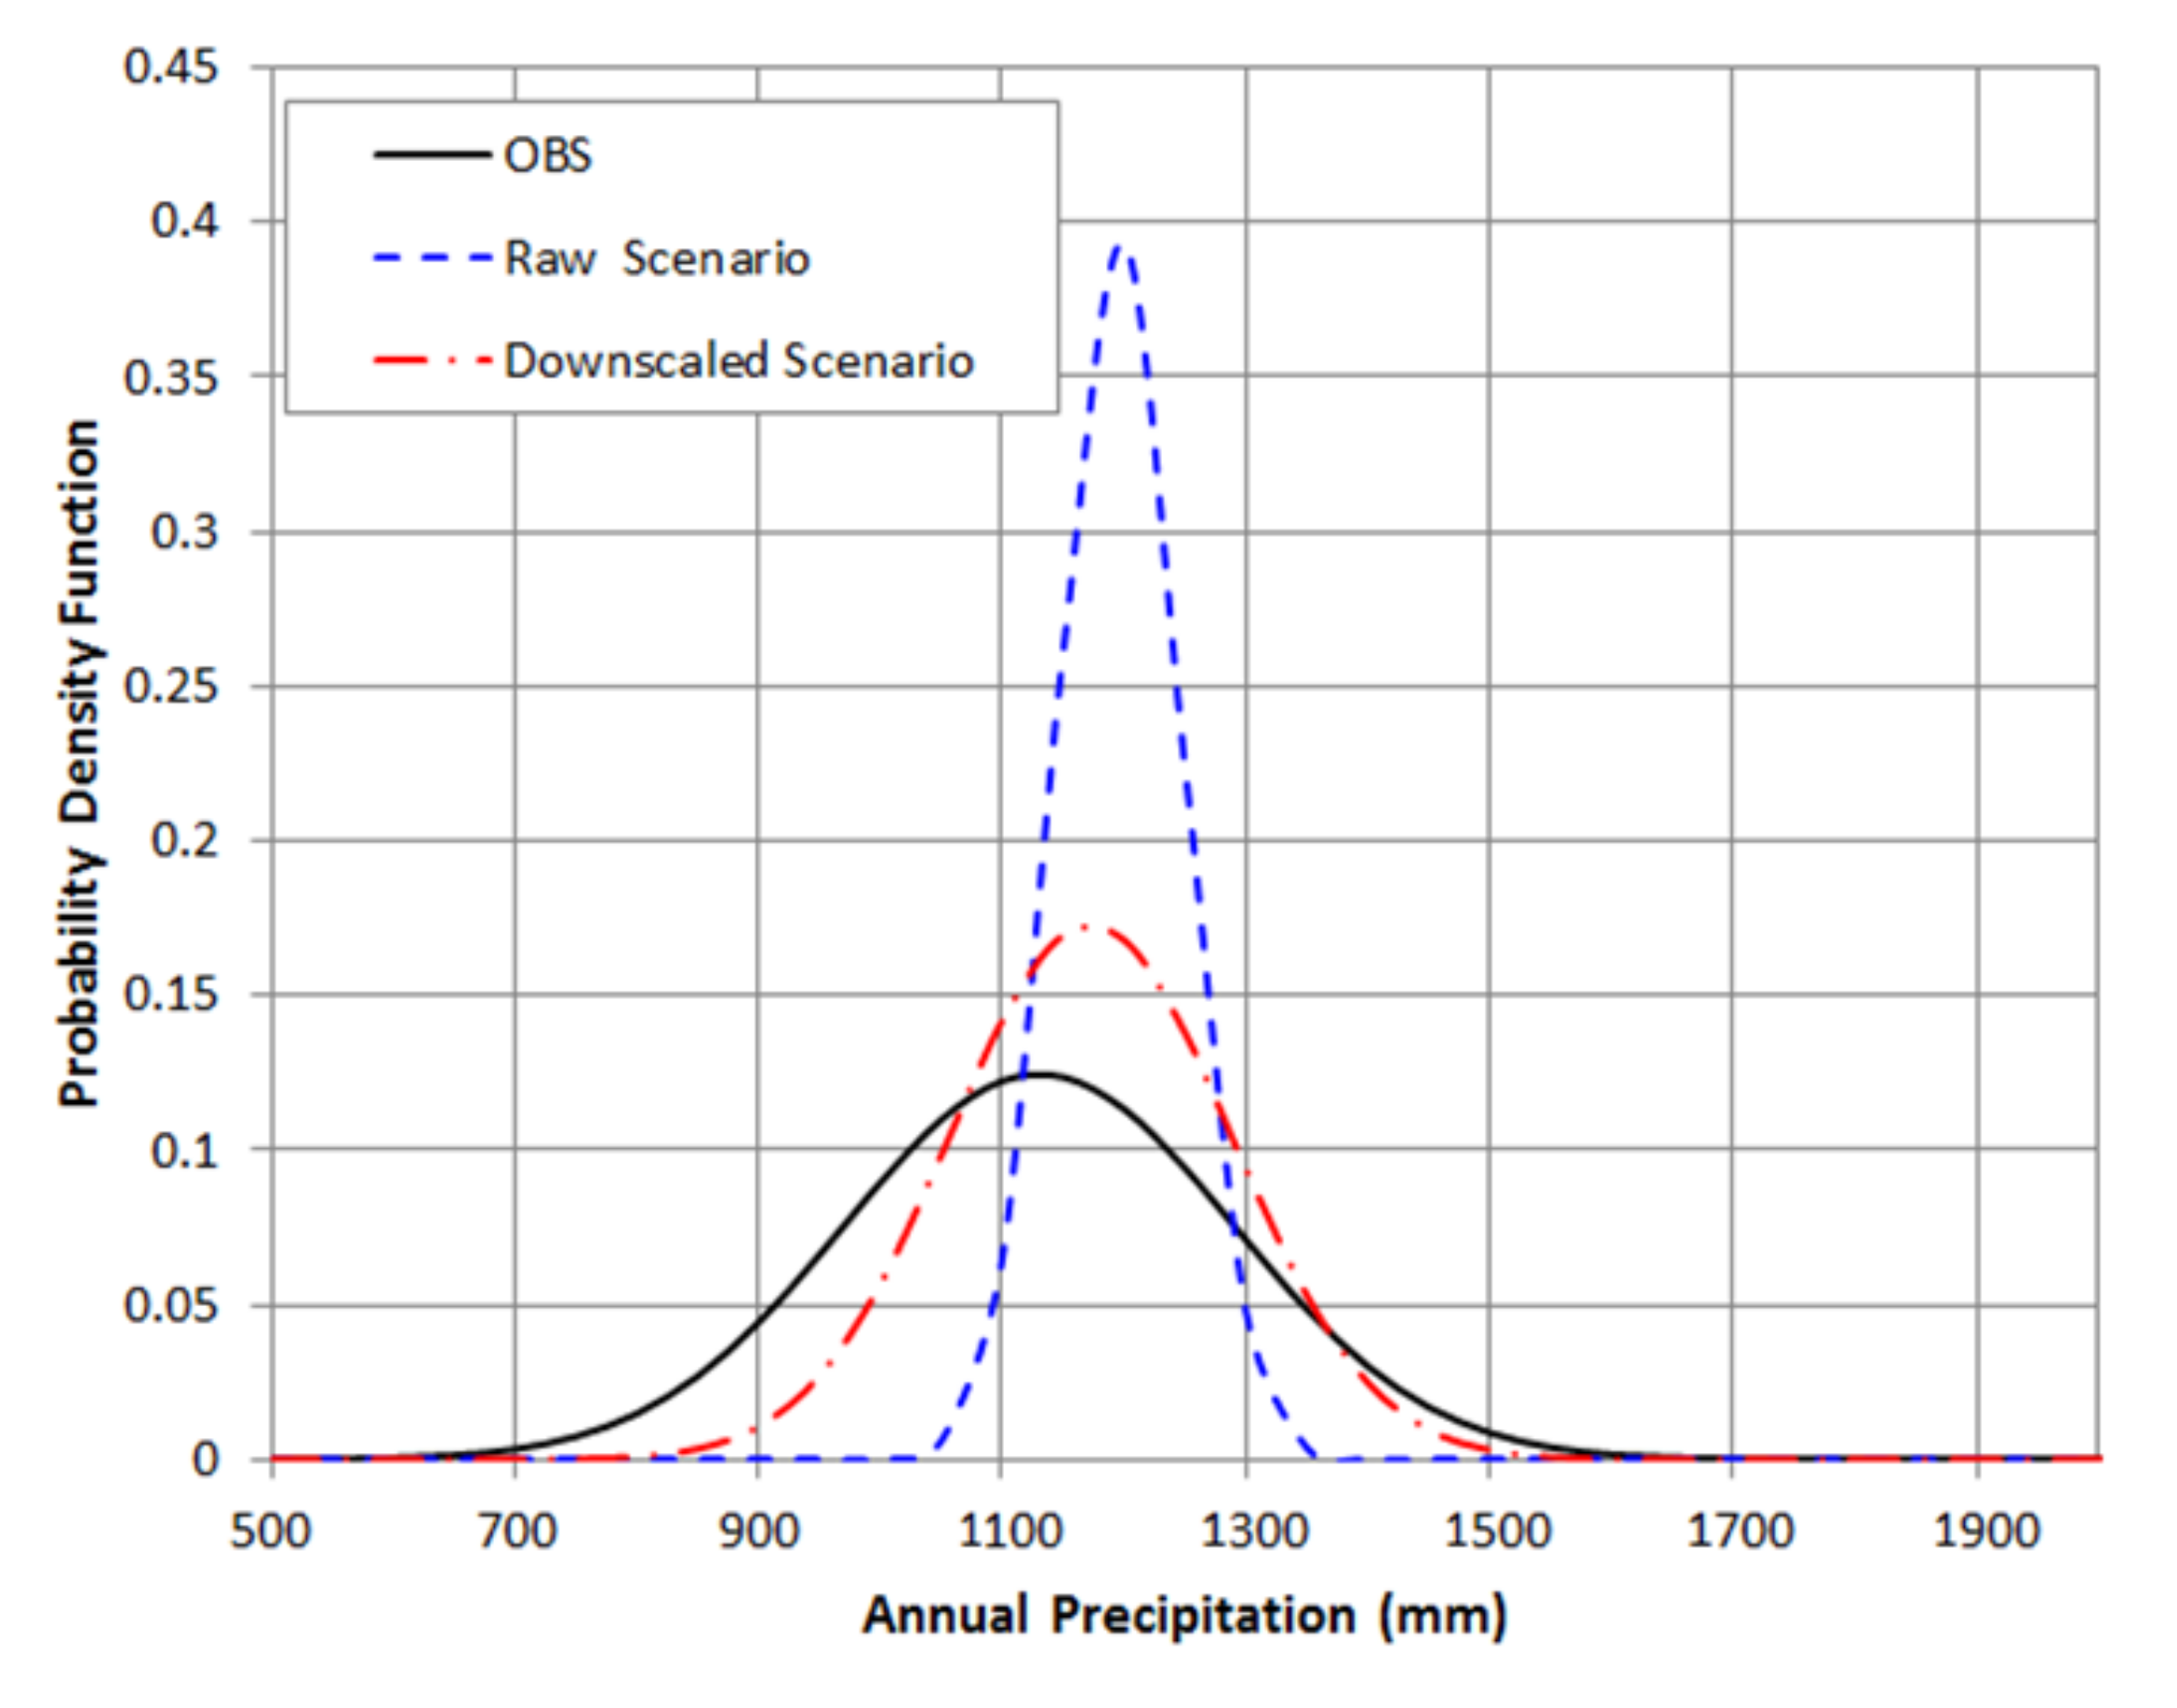
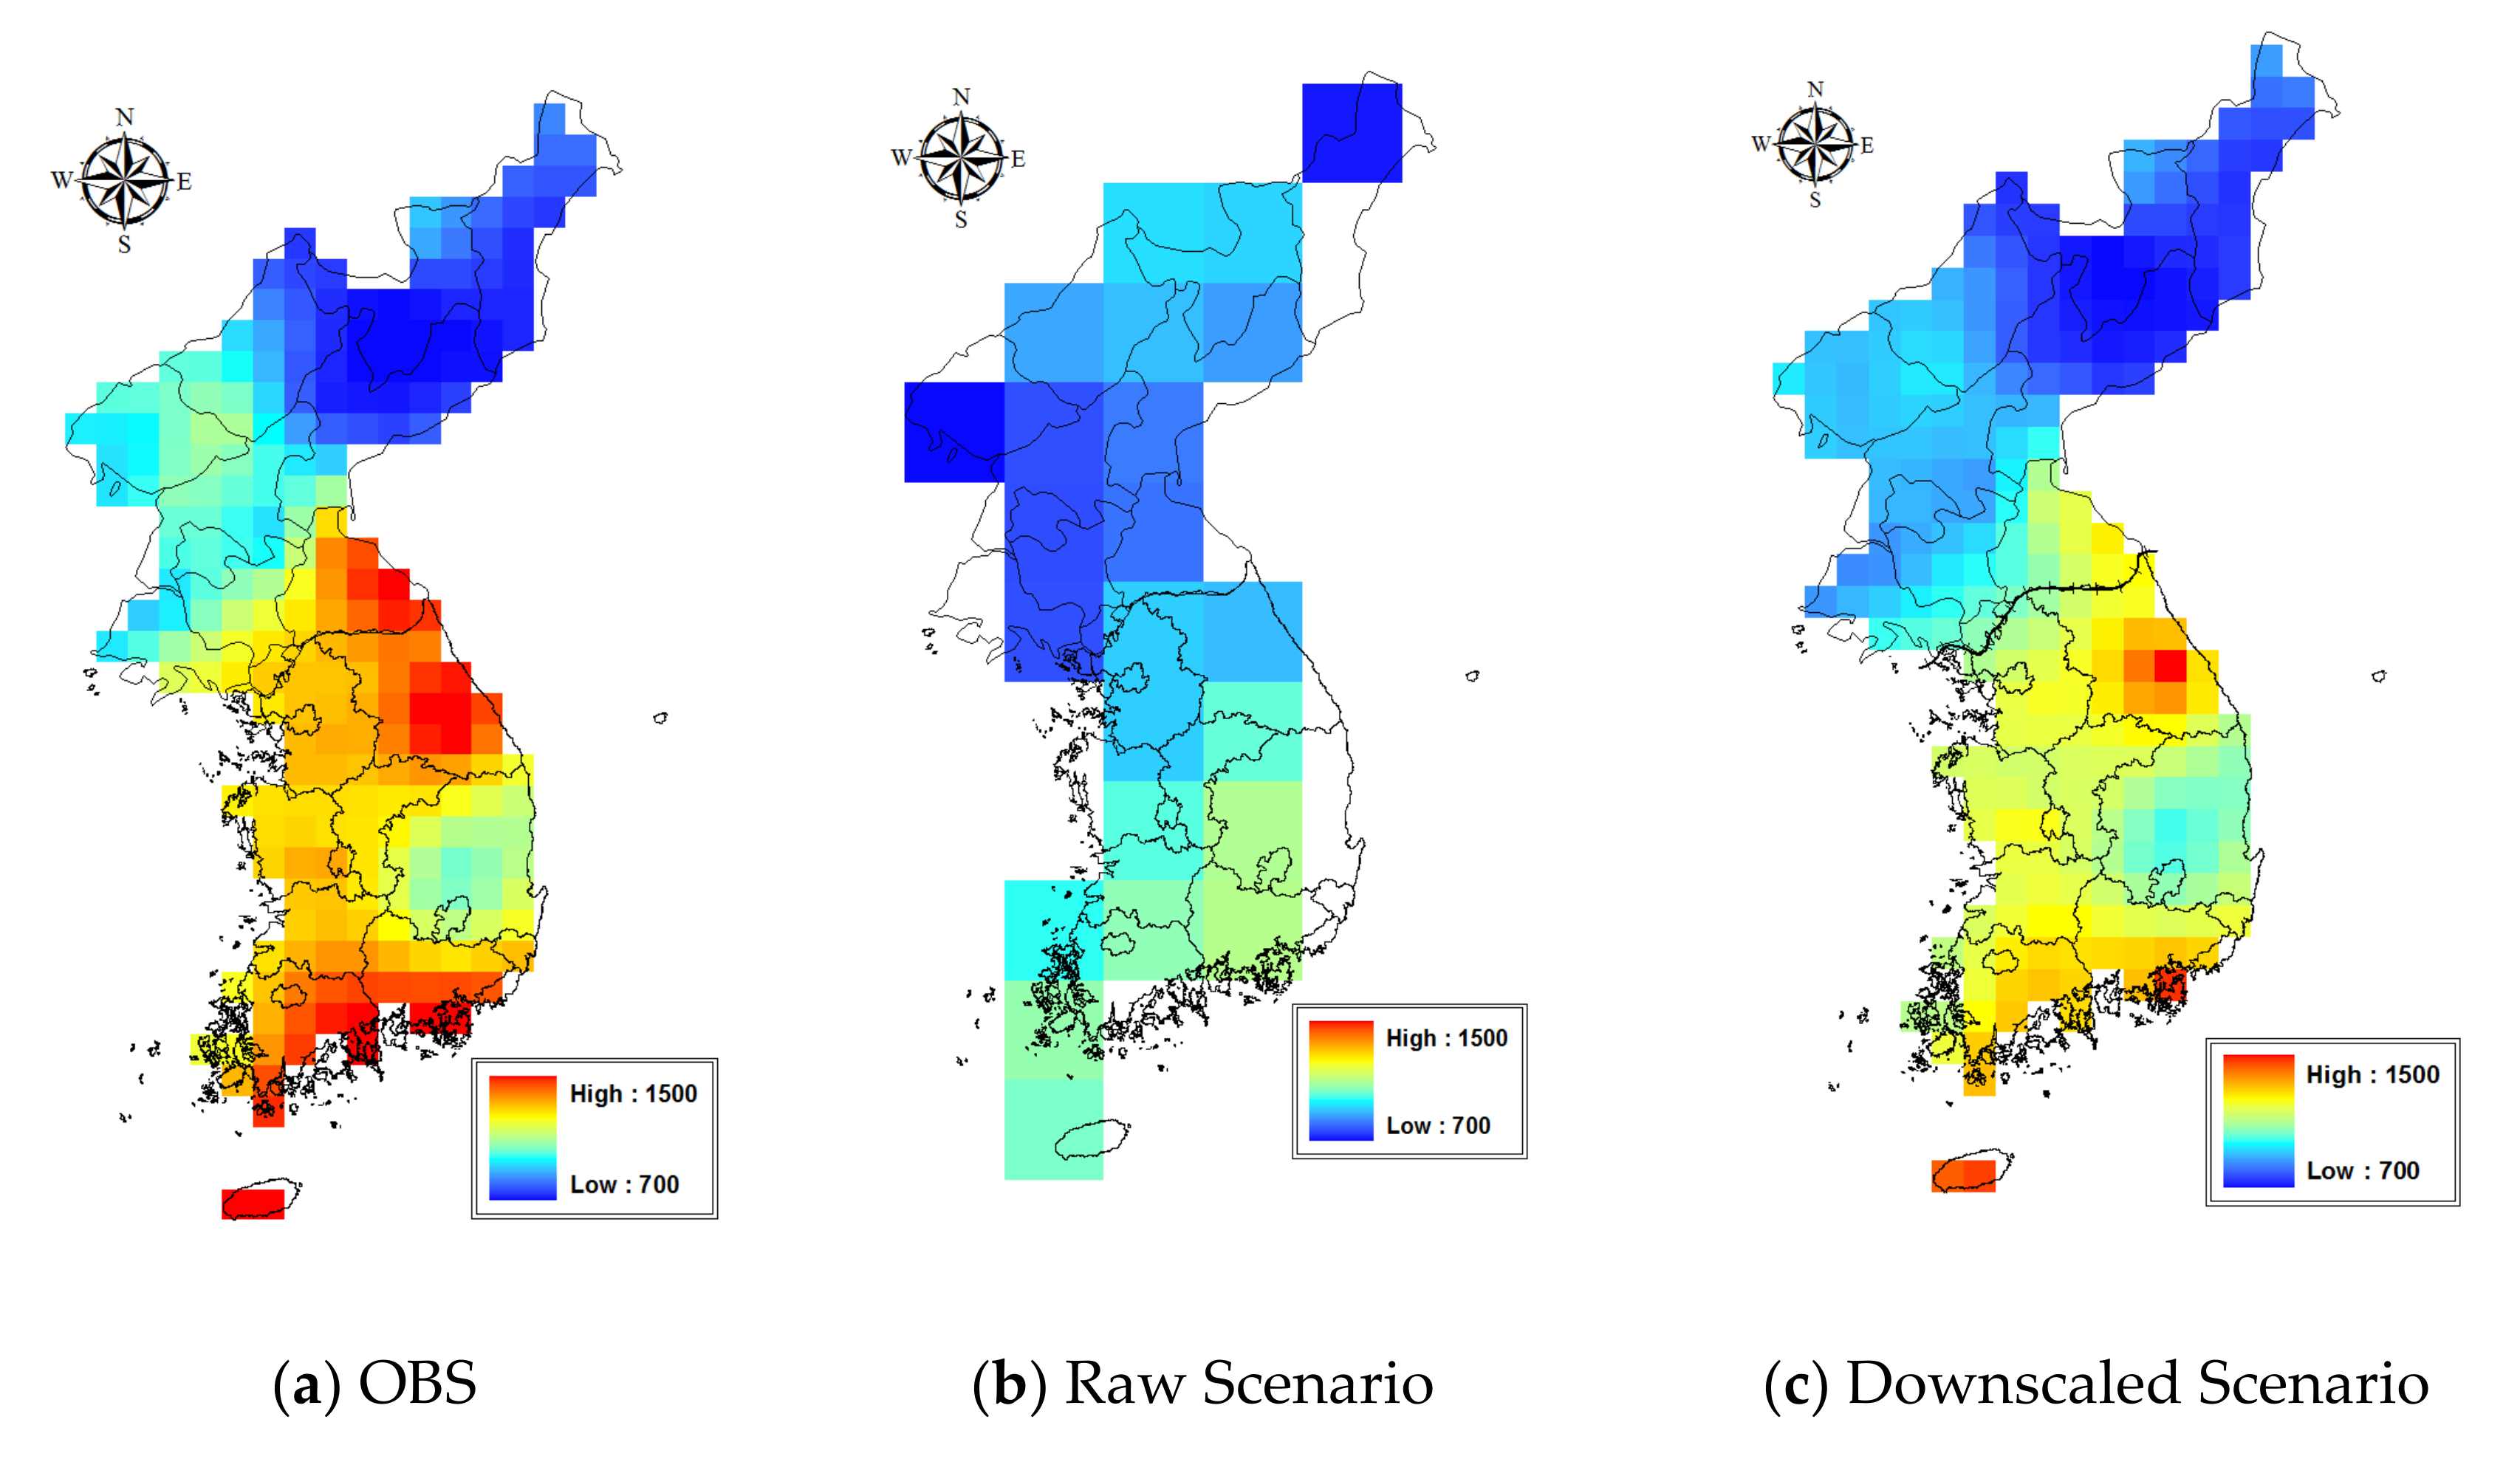
The study statistically downscaled HadGEM2-AO using the SDQDM. In this chapter, the study compares probability density functions (PDFs) and spatial distribution between MME, (precipitation and temperature), which is downscaled for the period of reference climate, and observation data. This aims to verify the applicability of statistical downscaling results. For annual precipitation, the PDFs were compared between the observation data and preapplication or post application of the SDQDM. This is well matched to the bell-shaped, normal distribution for the average value, while variables were gathered around the median. The mode, median, and average of observation data were all the same. Comparing average values (mode, median) and variances between pre-downscaling, and post downscaling, the study found that they were well matched to those of observation data after downscaling (Figure 7). The result of comparing spatial distribution between pre-/post-downscaling suggested that the latter simulated the spatial distribution very close (Figure 8c) to that of observation data (Figure 8a) more than (Figure 8b).
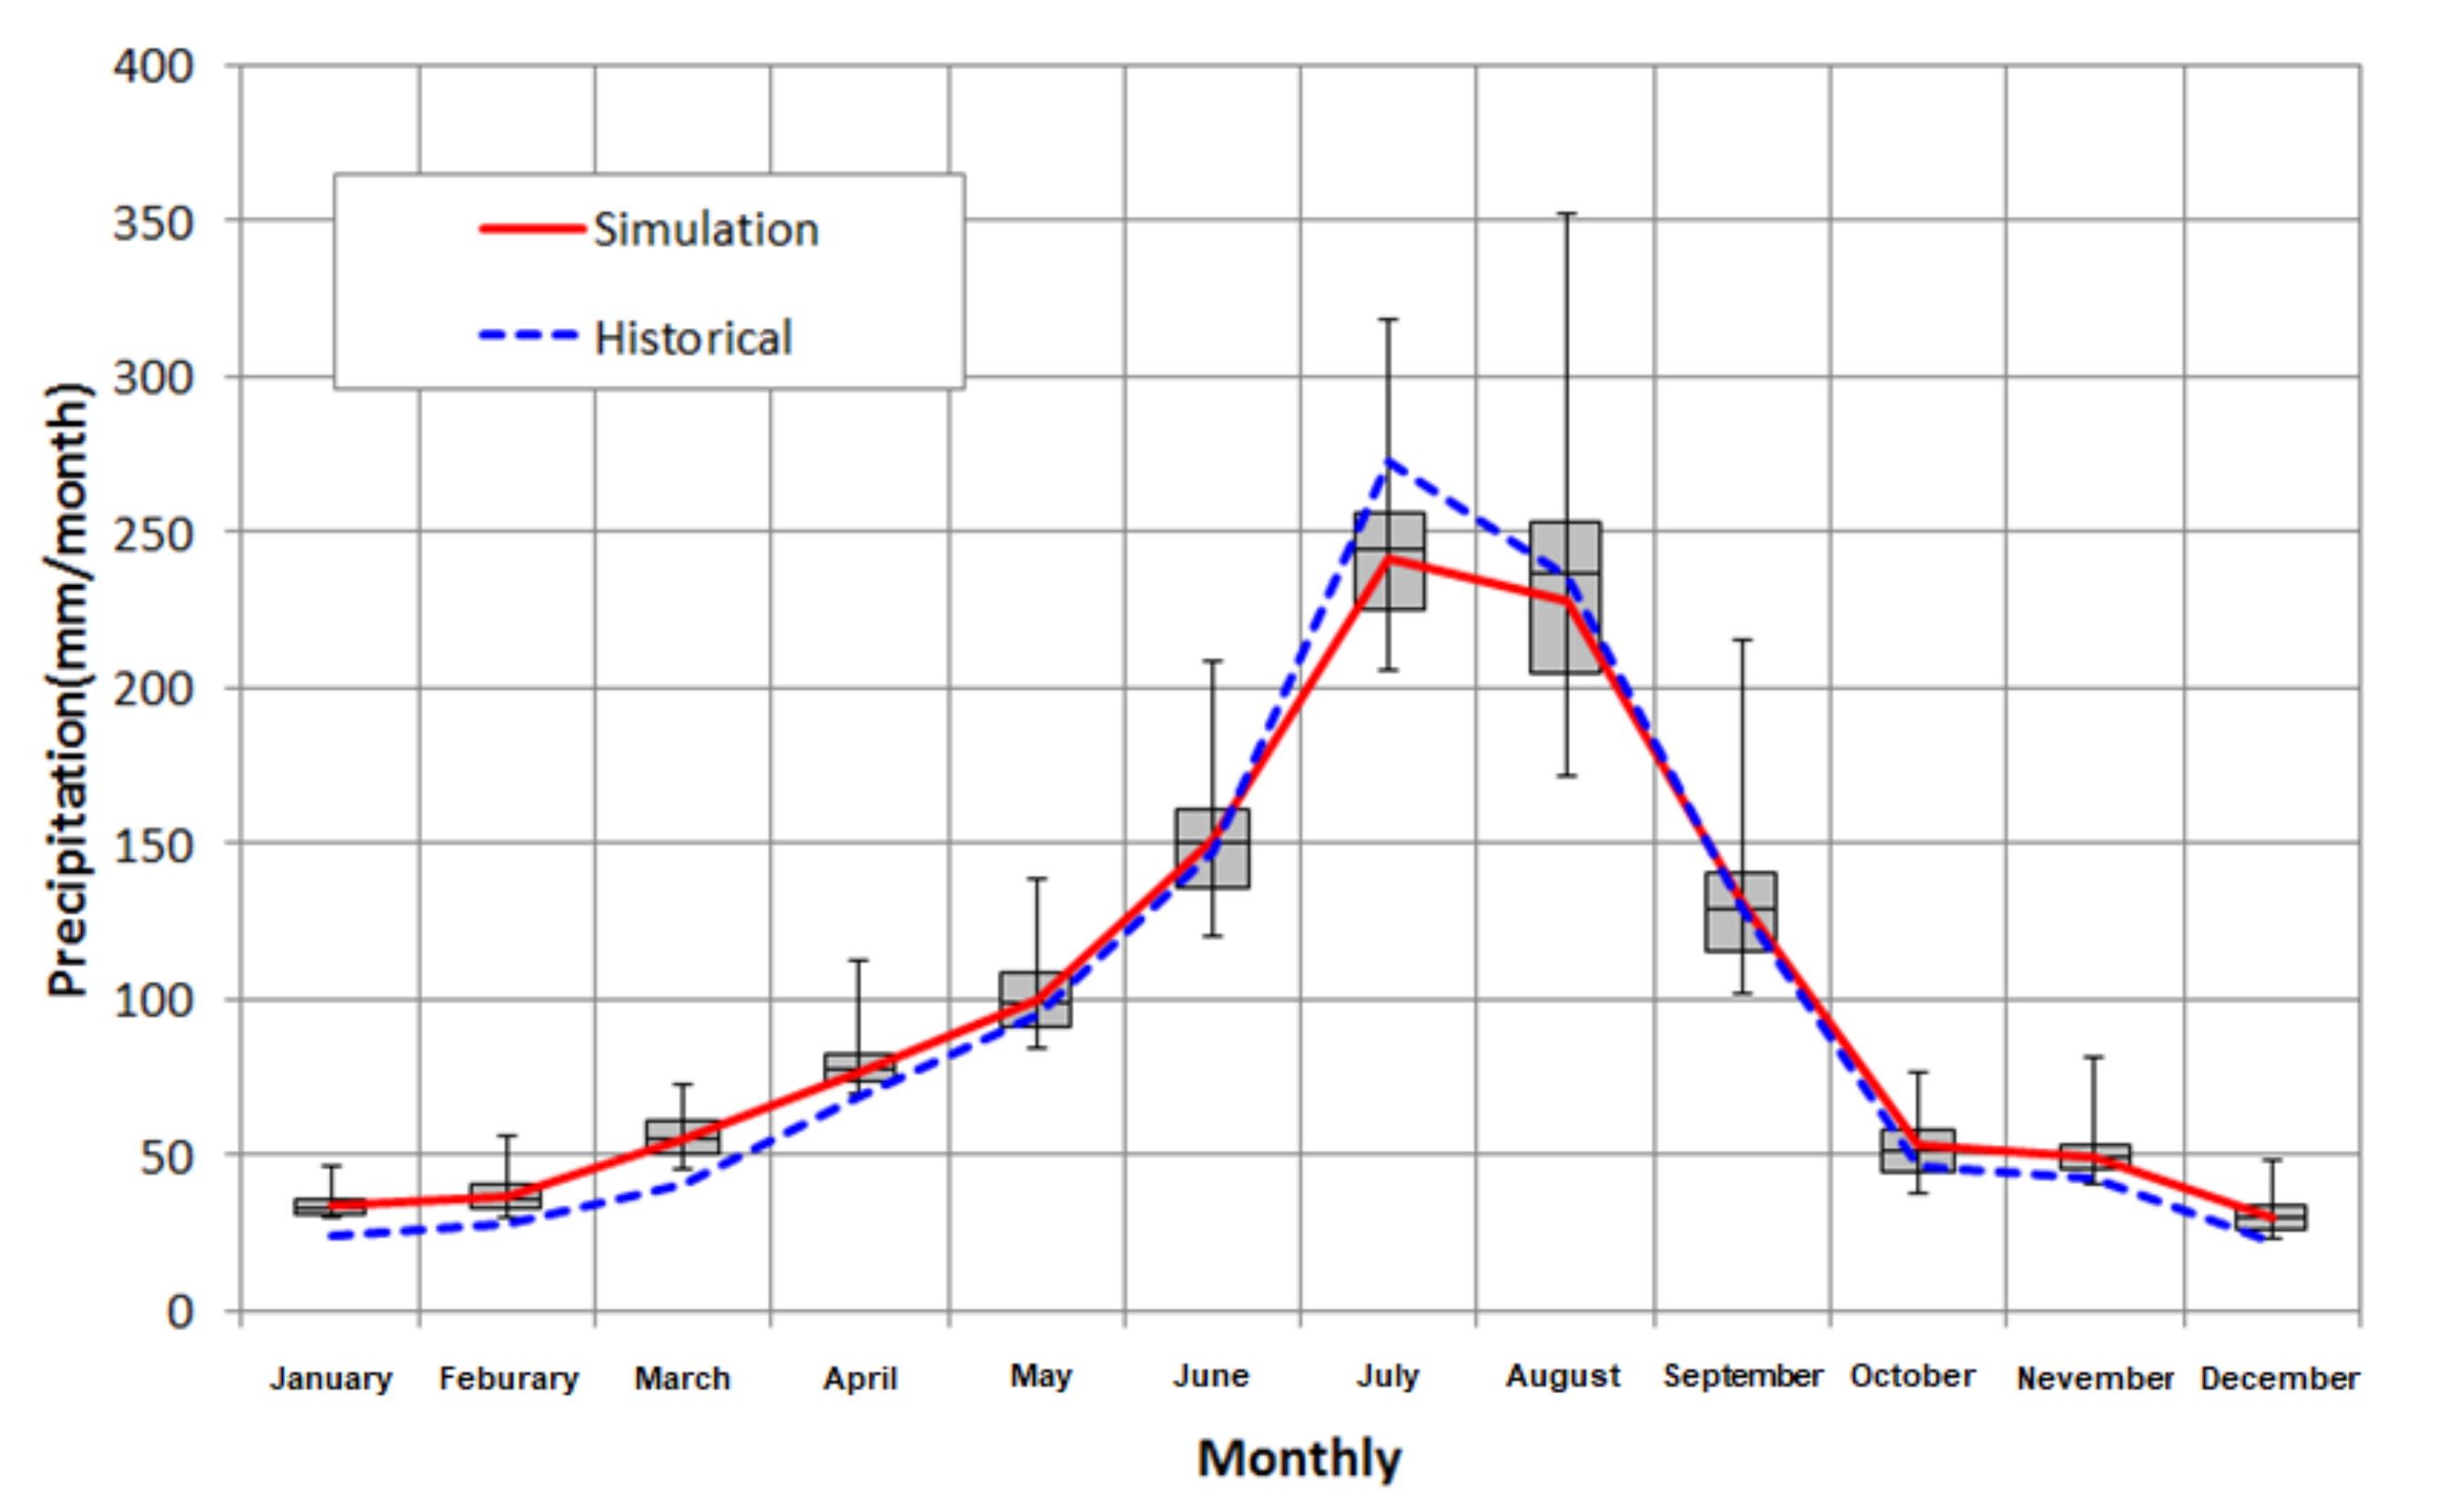
The high monthly variability in precipitation episodes that the Korean peninsula has experienced require further analysis. Figure 9 presents a box plot for monthly precipitation. The box plot suggests that MME averages are very close to those from observation data. The months with high precipitation, June and August, see high variability.
3.3. Generation of Extreme Rainfall Data Using Climate Change Scenarios and Conditional Copula Model
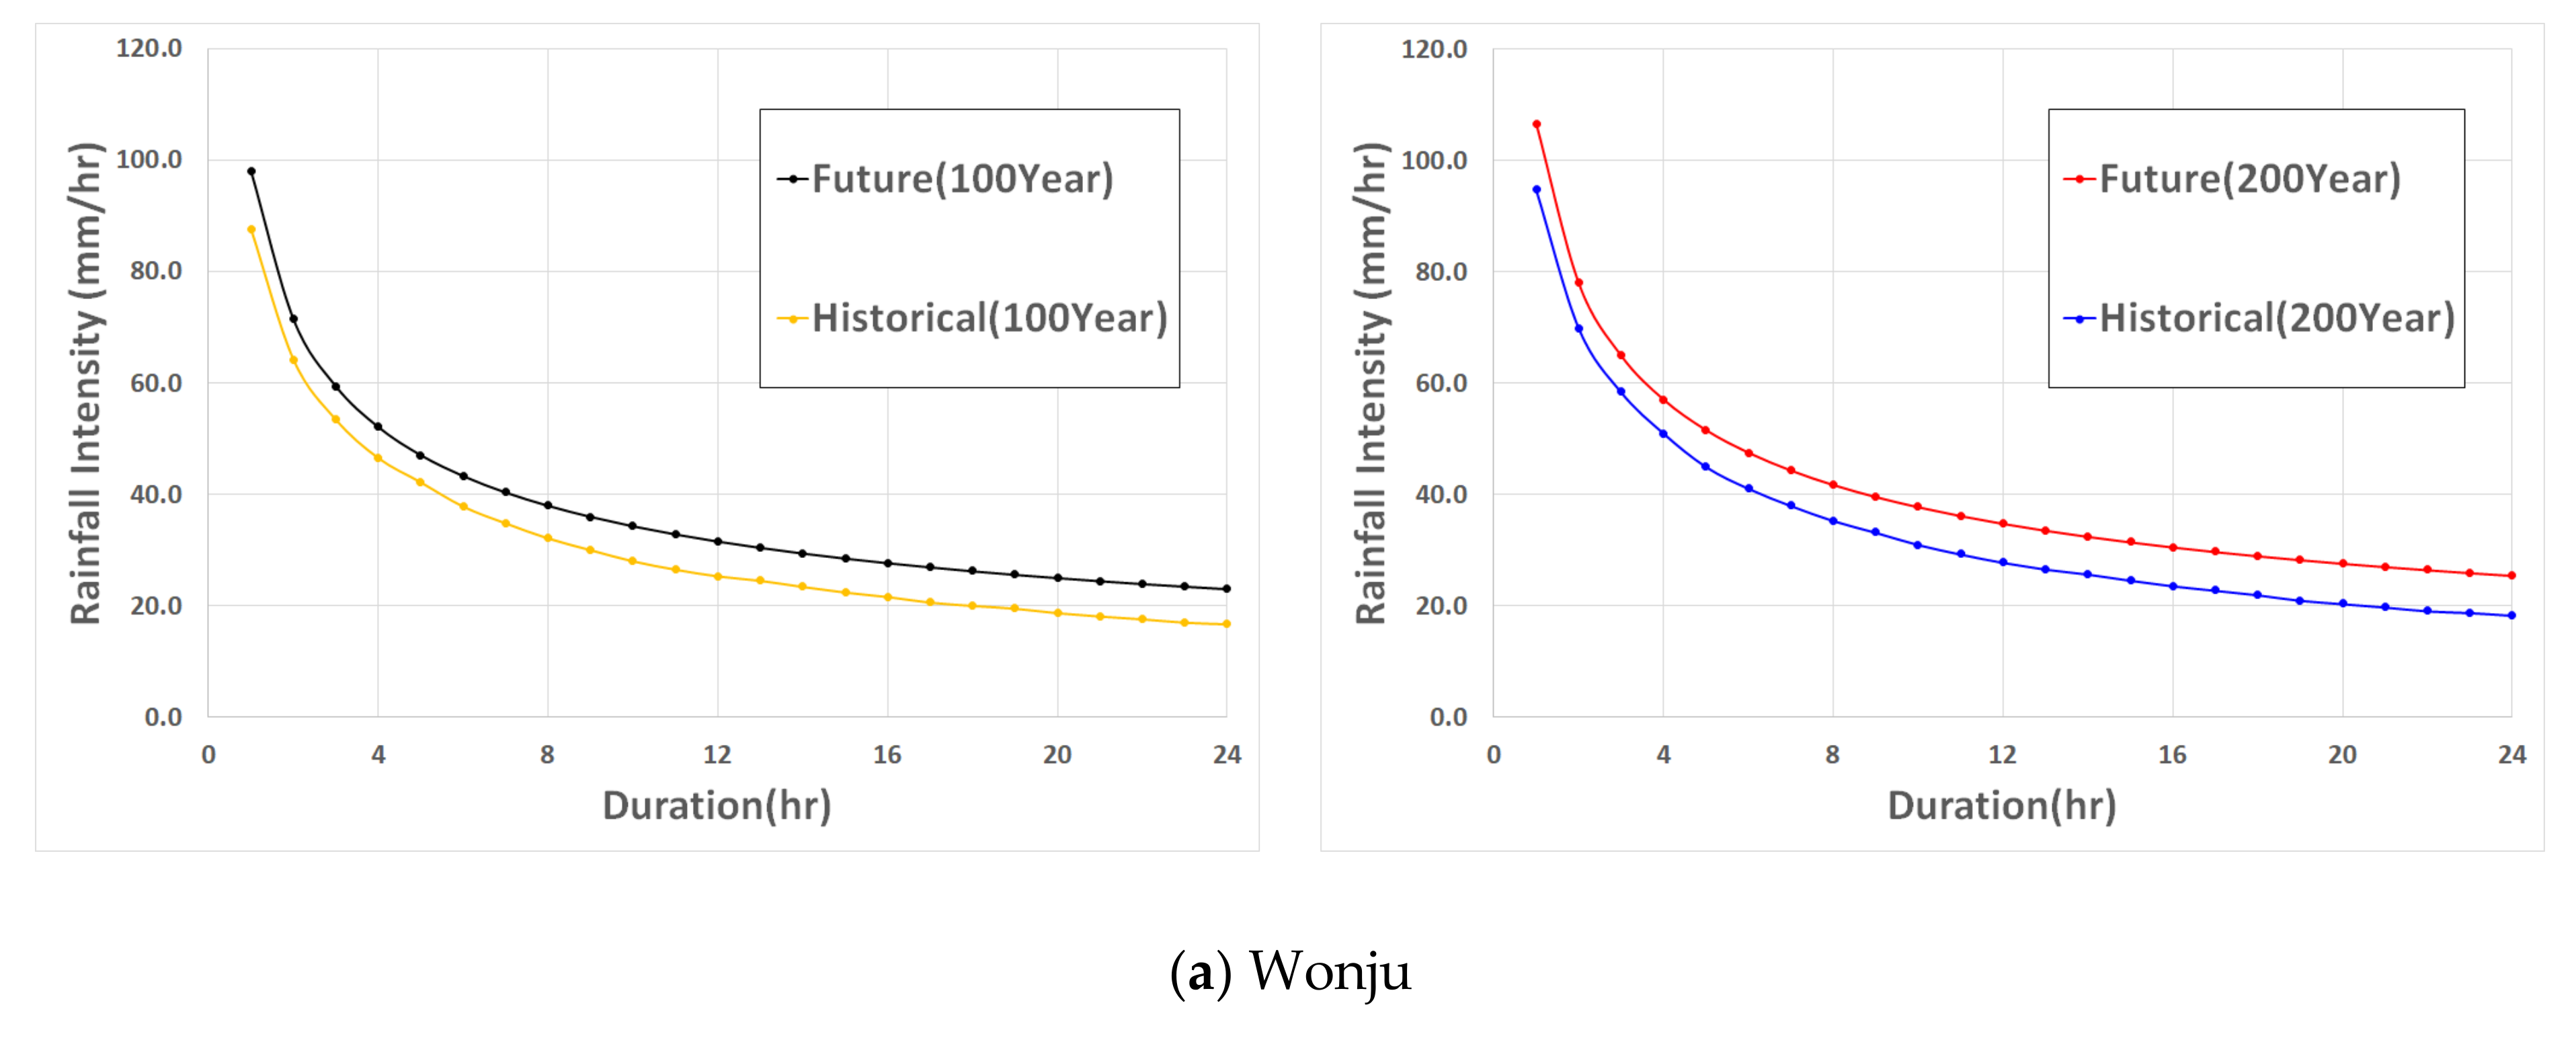
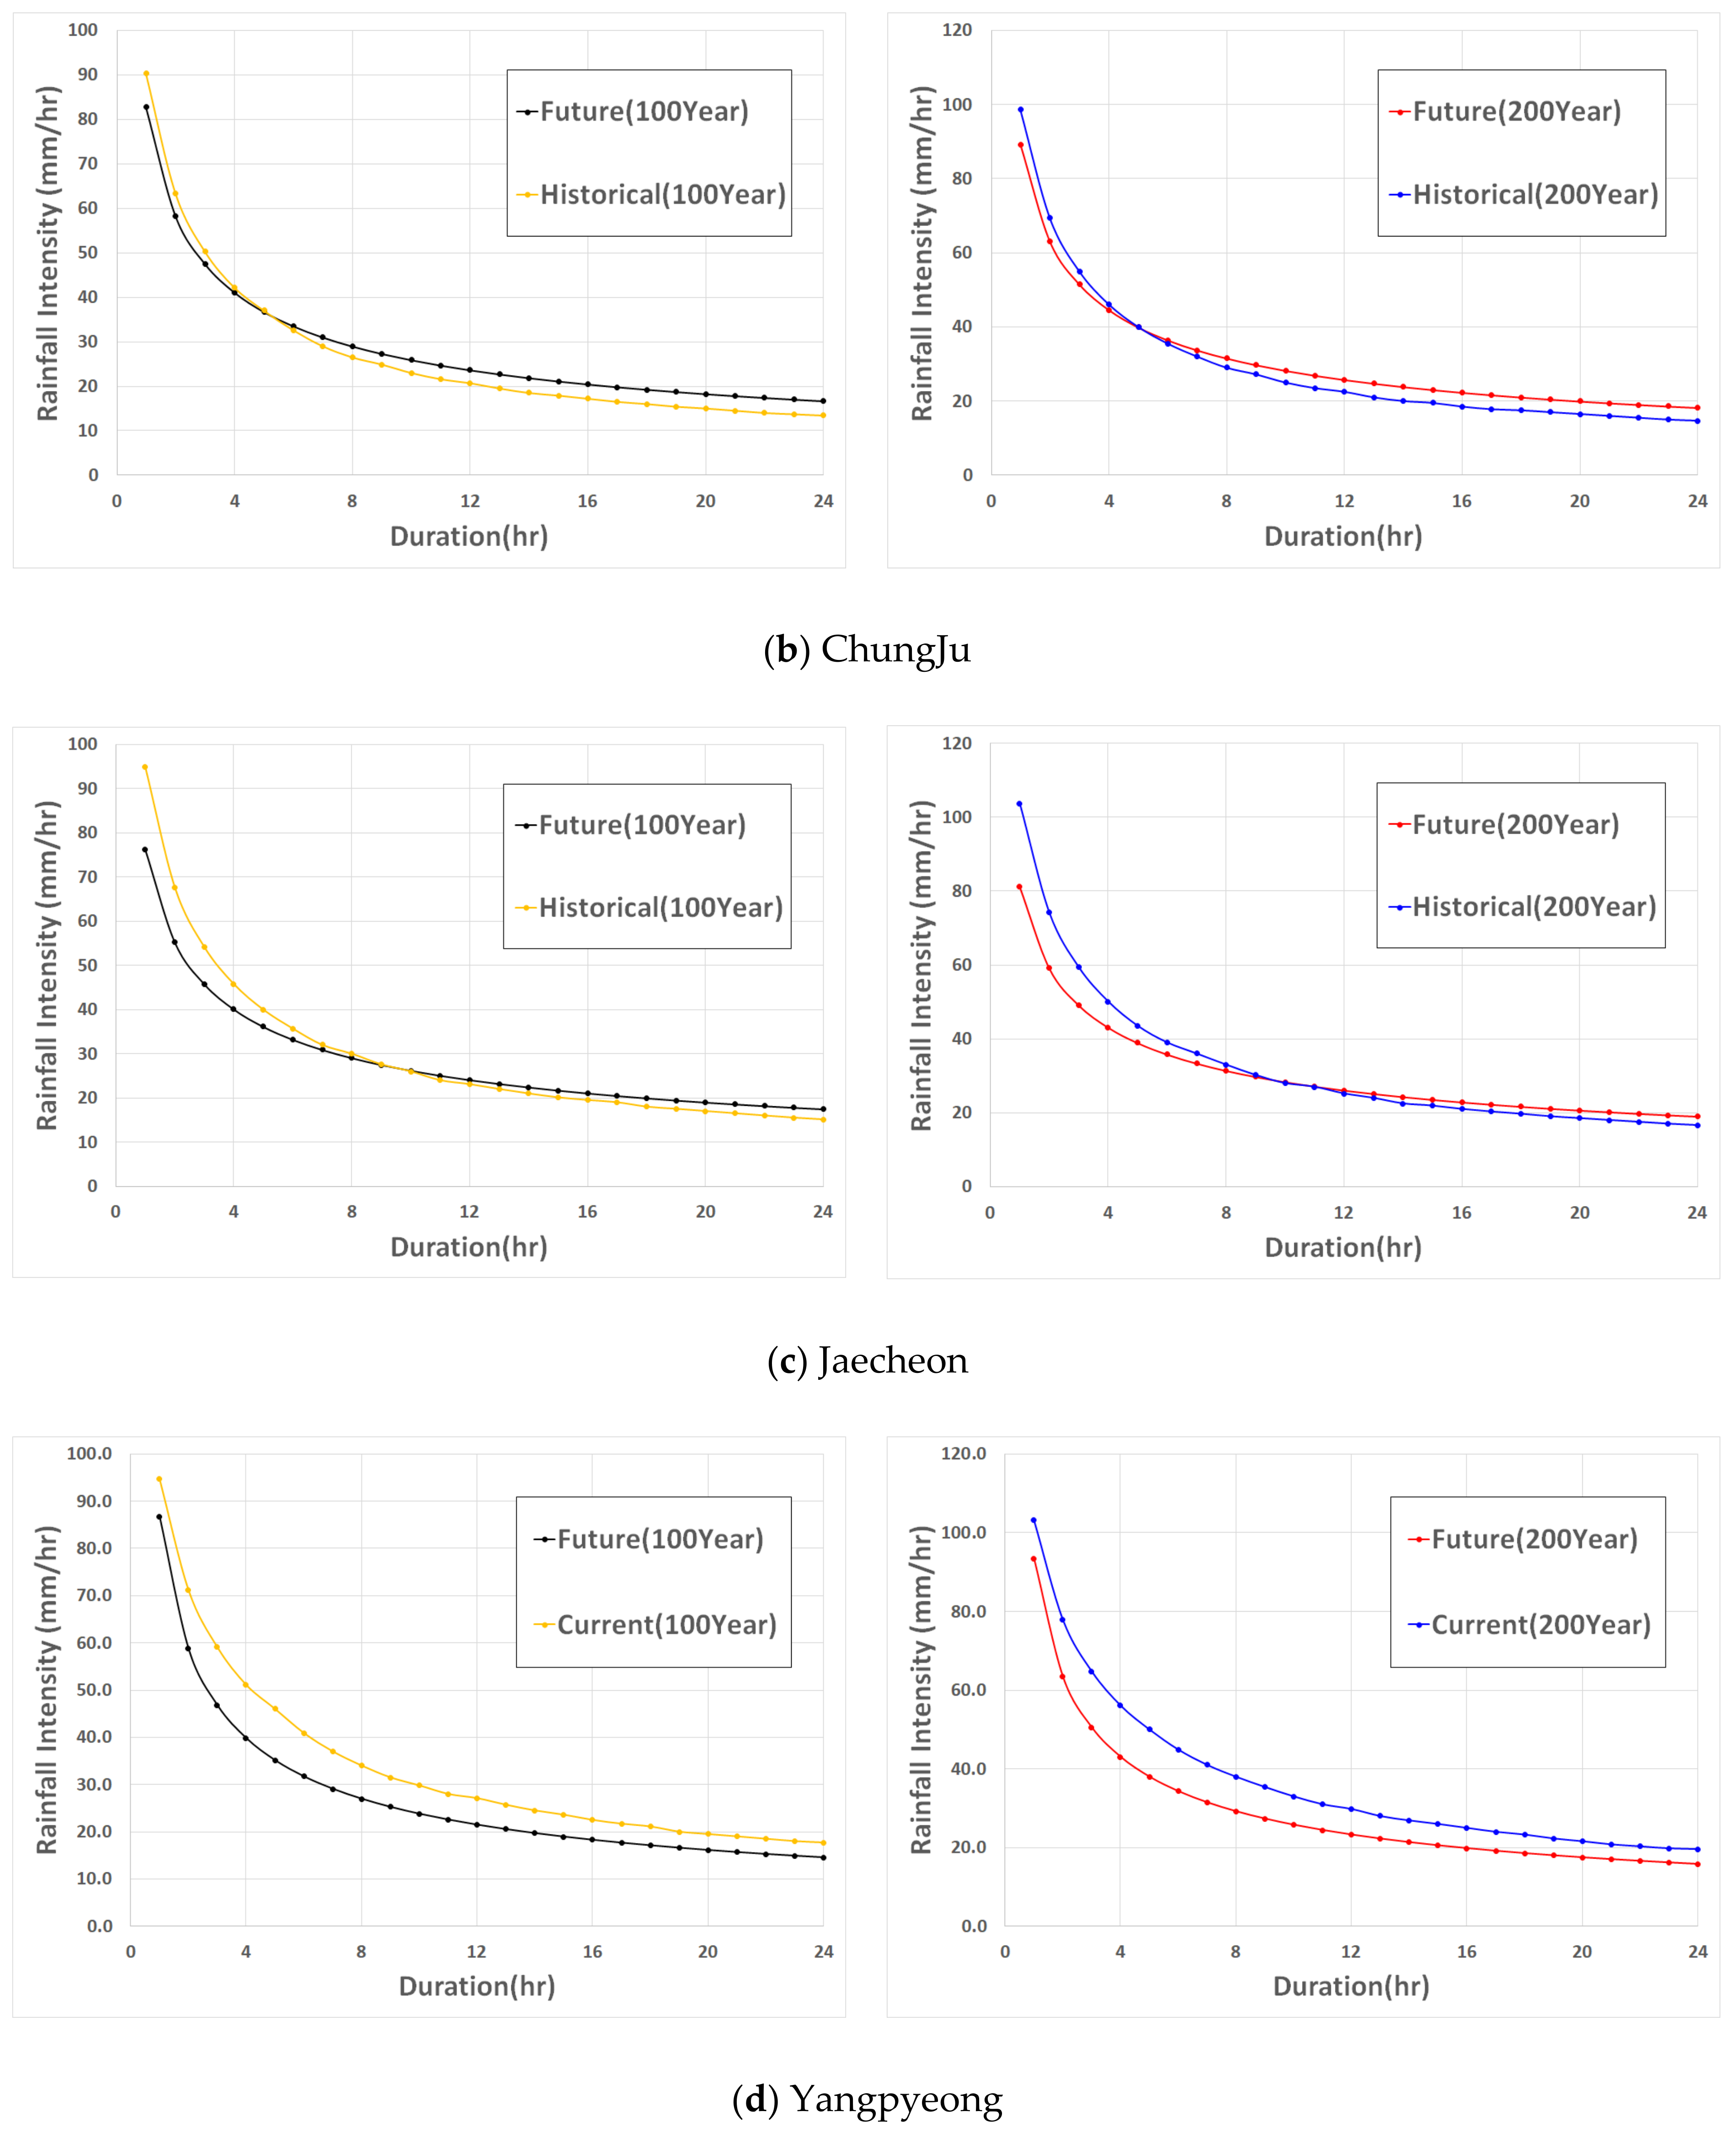
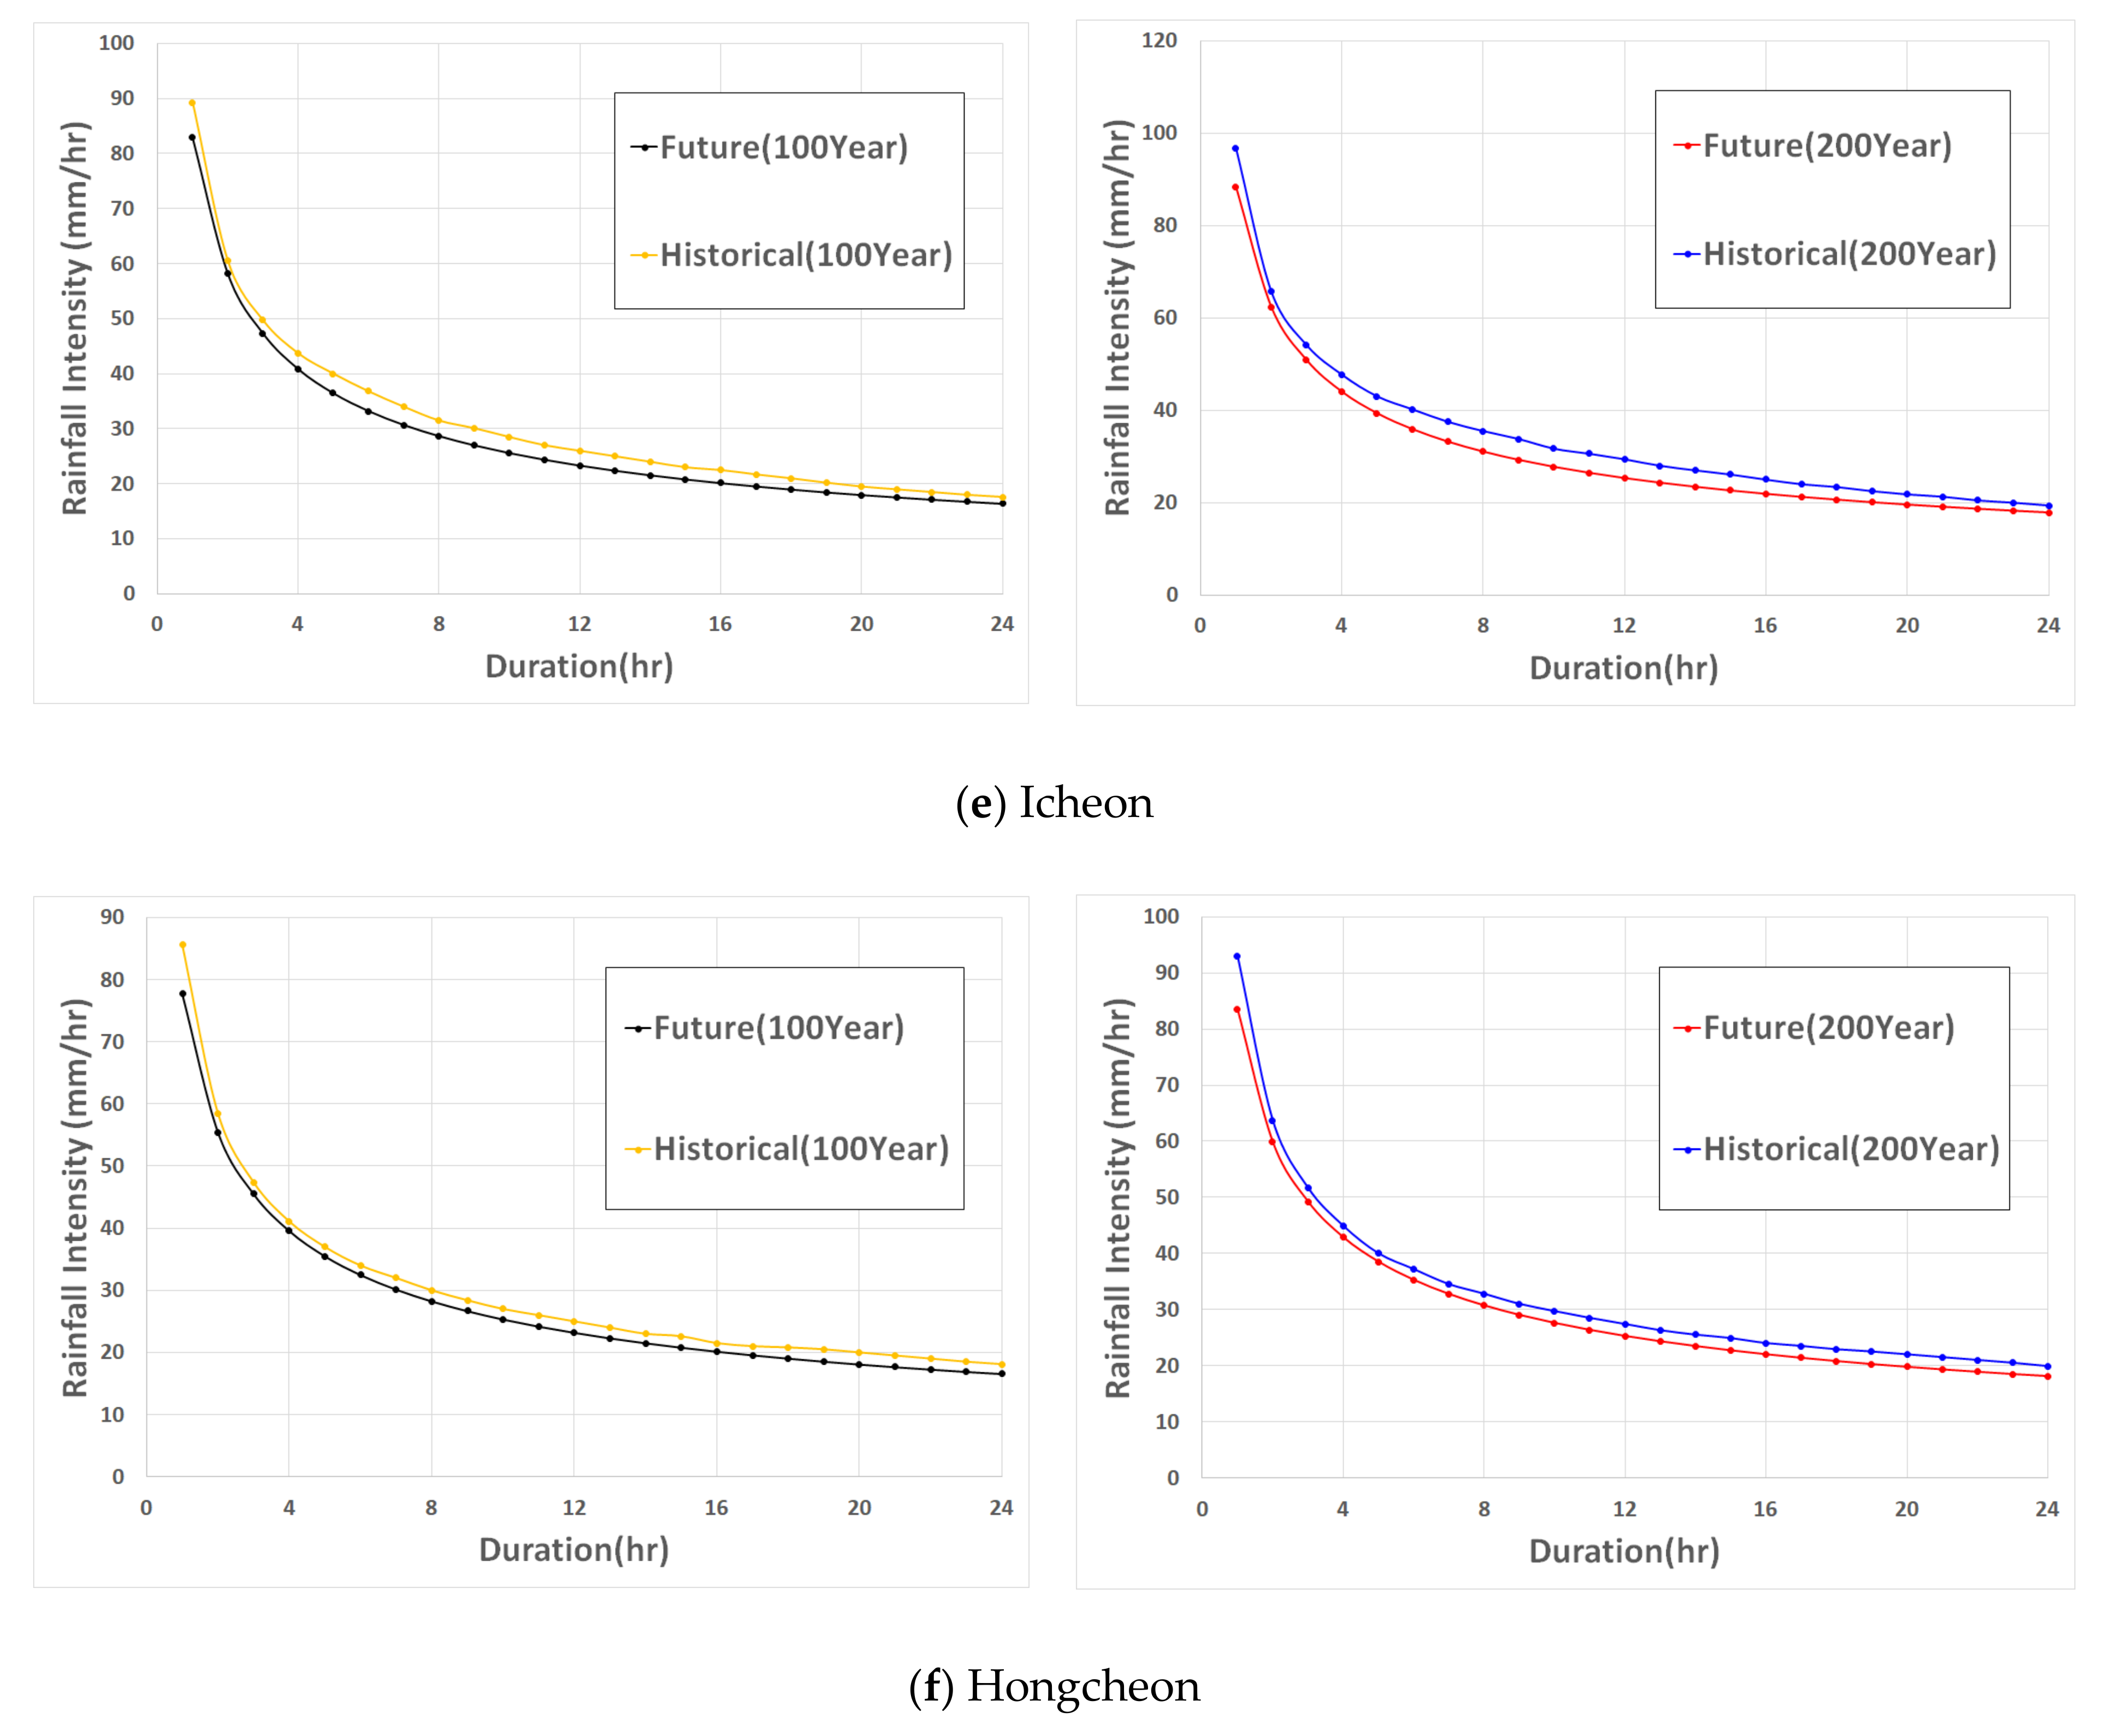
Downscaling was performed using RCP 8.5 climate change scenario data and the HadGEM2-AO model. The hourly extreme rainfall data were generated from the downscaled RCM data using the conditional Copula model. To check the change in the future rainfall intensity compared to that in the past, the Intensity-Duration-Frequency curves for the past and future 100-year and 200-year frequencies were created using the climate change scenario calculation results through the Copula model at six observatories around the target basin, which are depicted in Figure 10. The analysis results exhibited that the rainfall intensity increased with the duration in Wonju, Chungju, and Jaecheon observatories according to the future climate change whereas the rainfall intensity decreased with the duration in Yangpyeong, Icheon, and Hongcheon. The risk of future flood damage in the Wonju observatory is expected to increase due to the increase in rainfall intensity according to the duration in the observatory where the Wonjucheon basin was included.
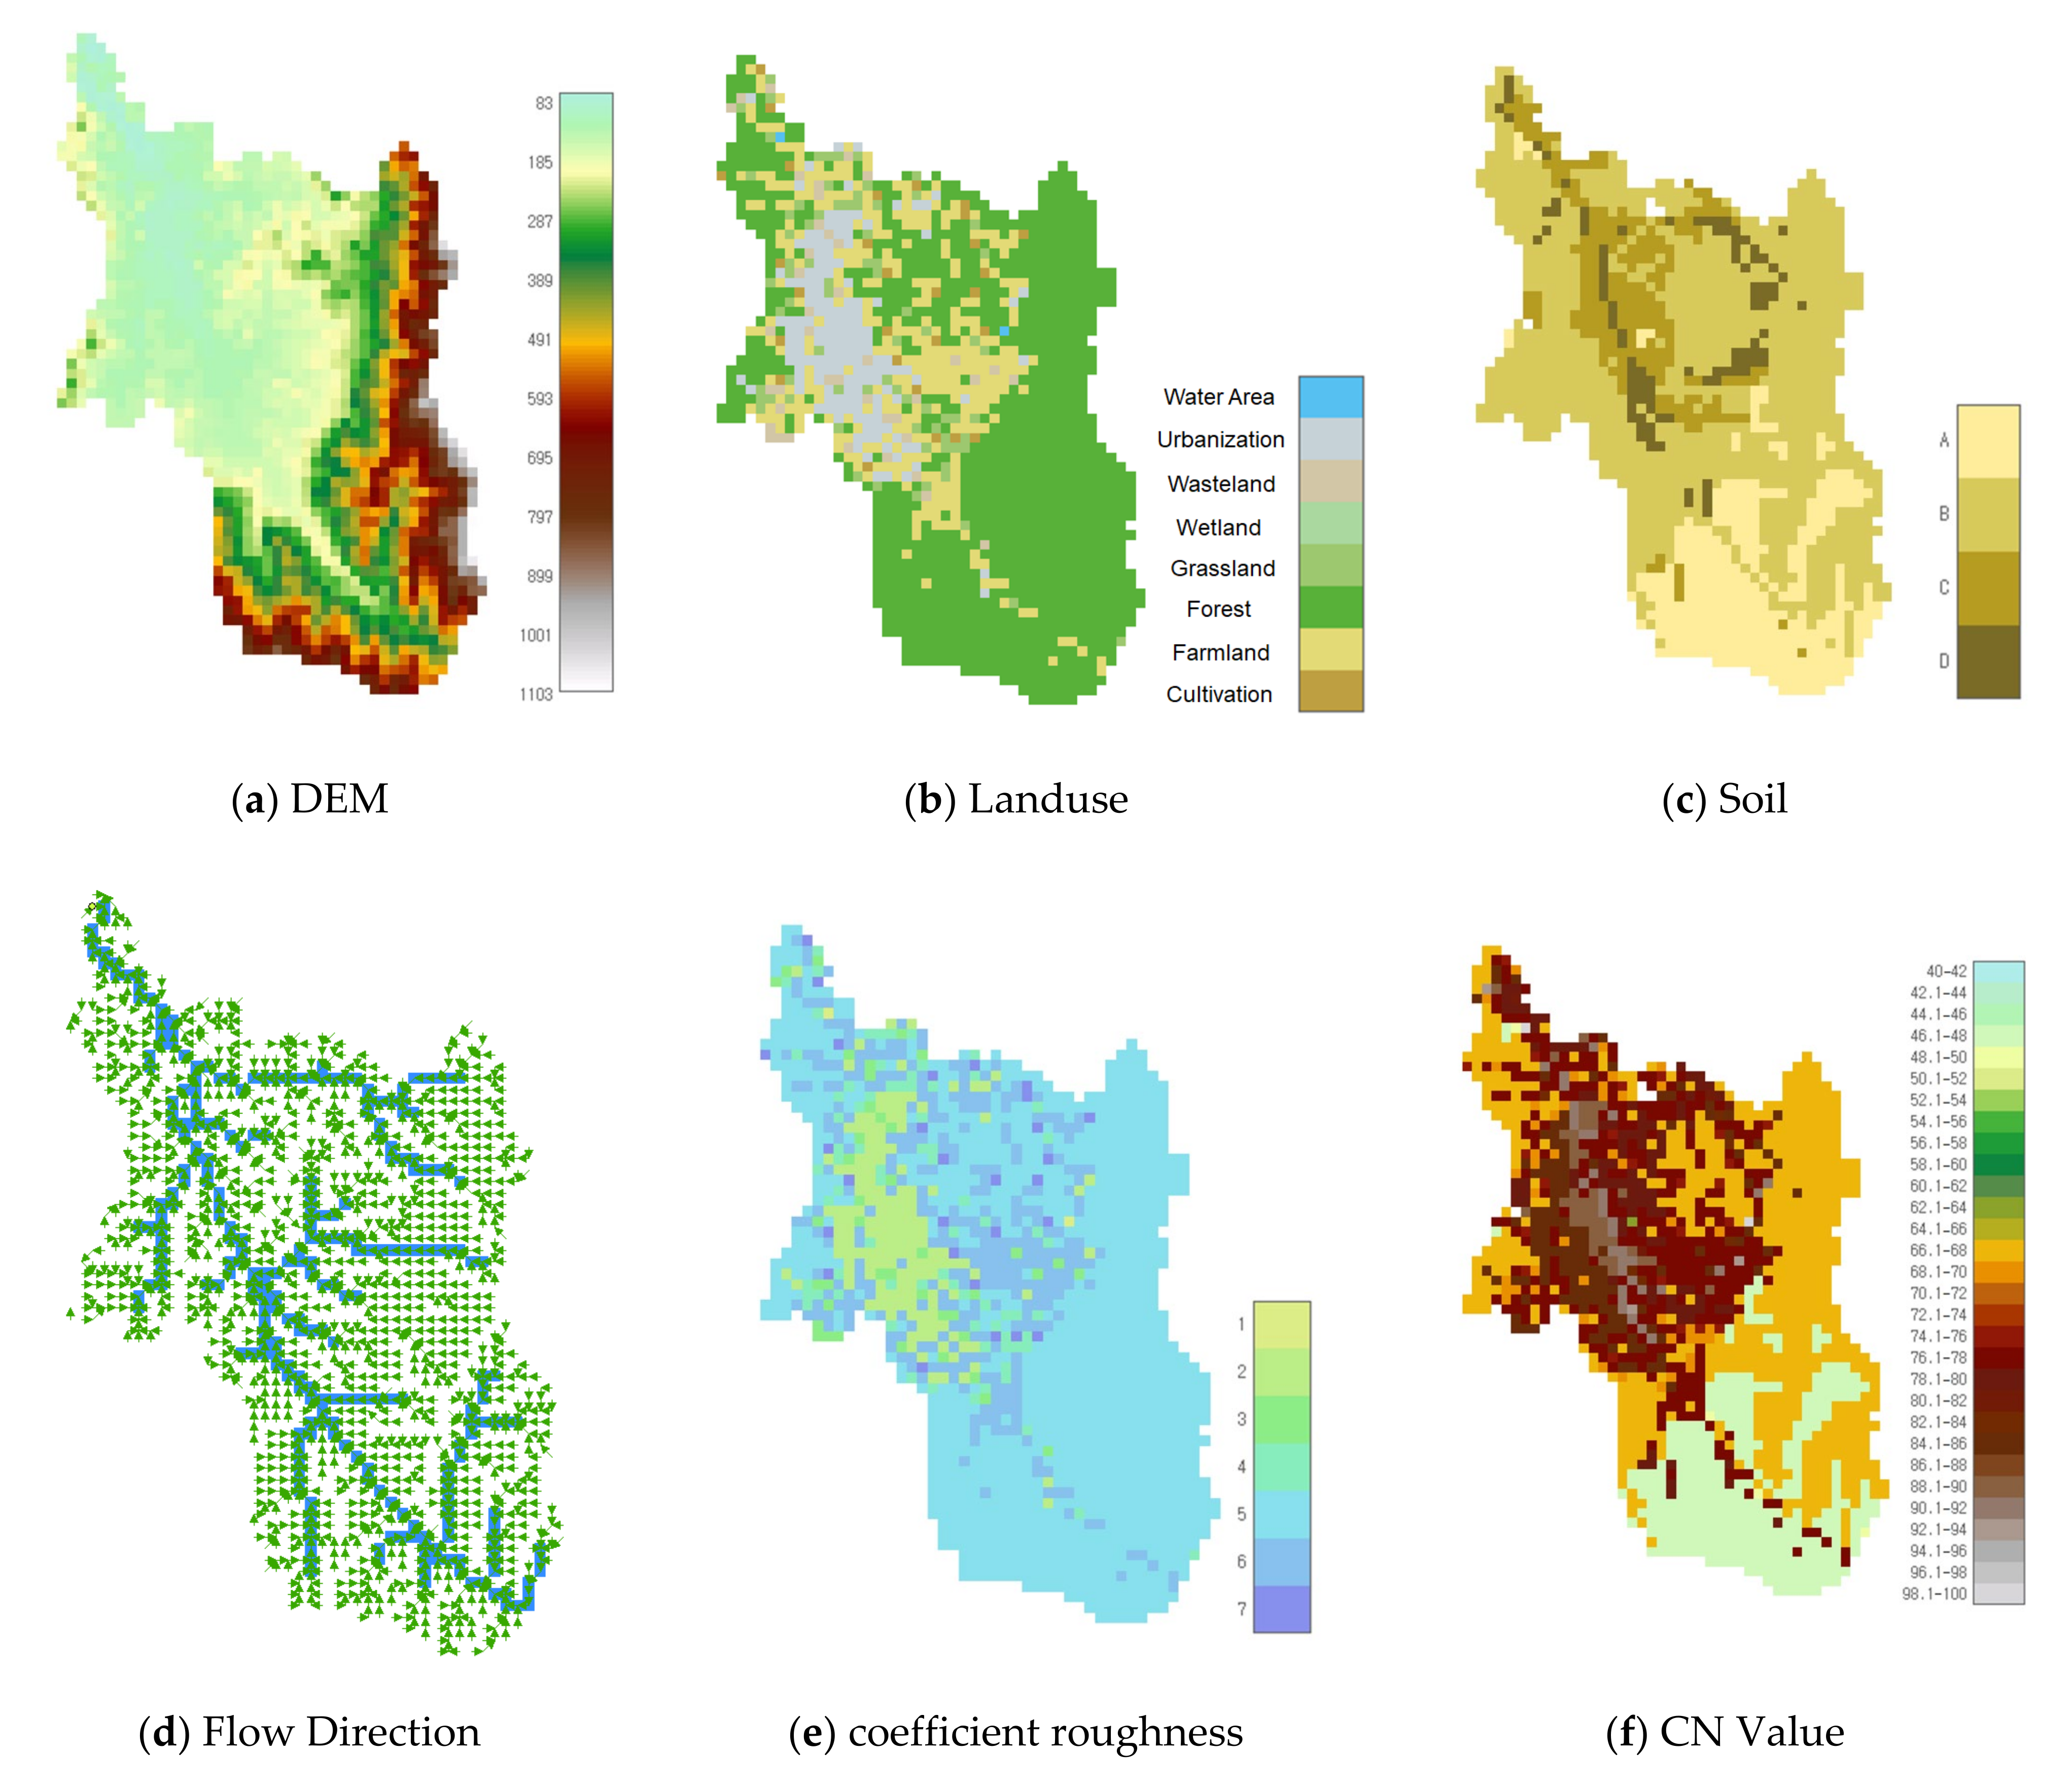
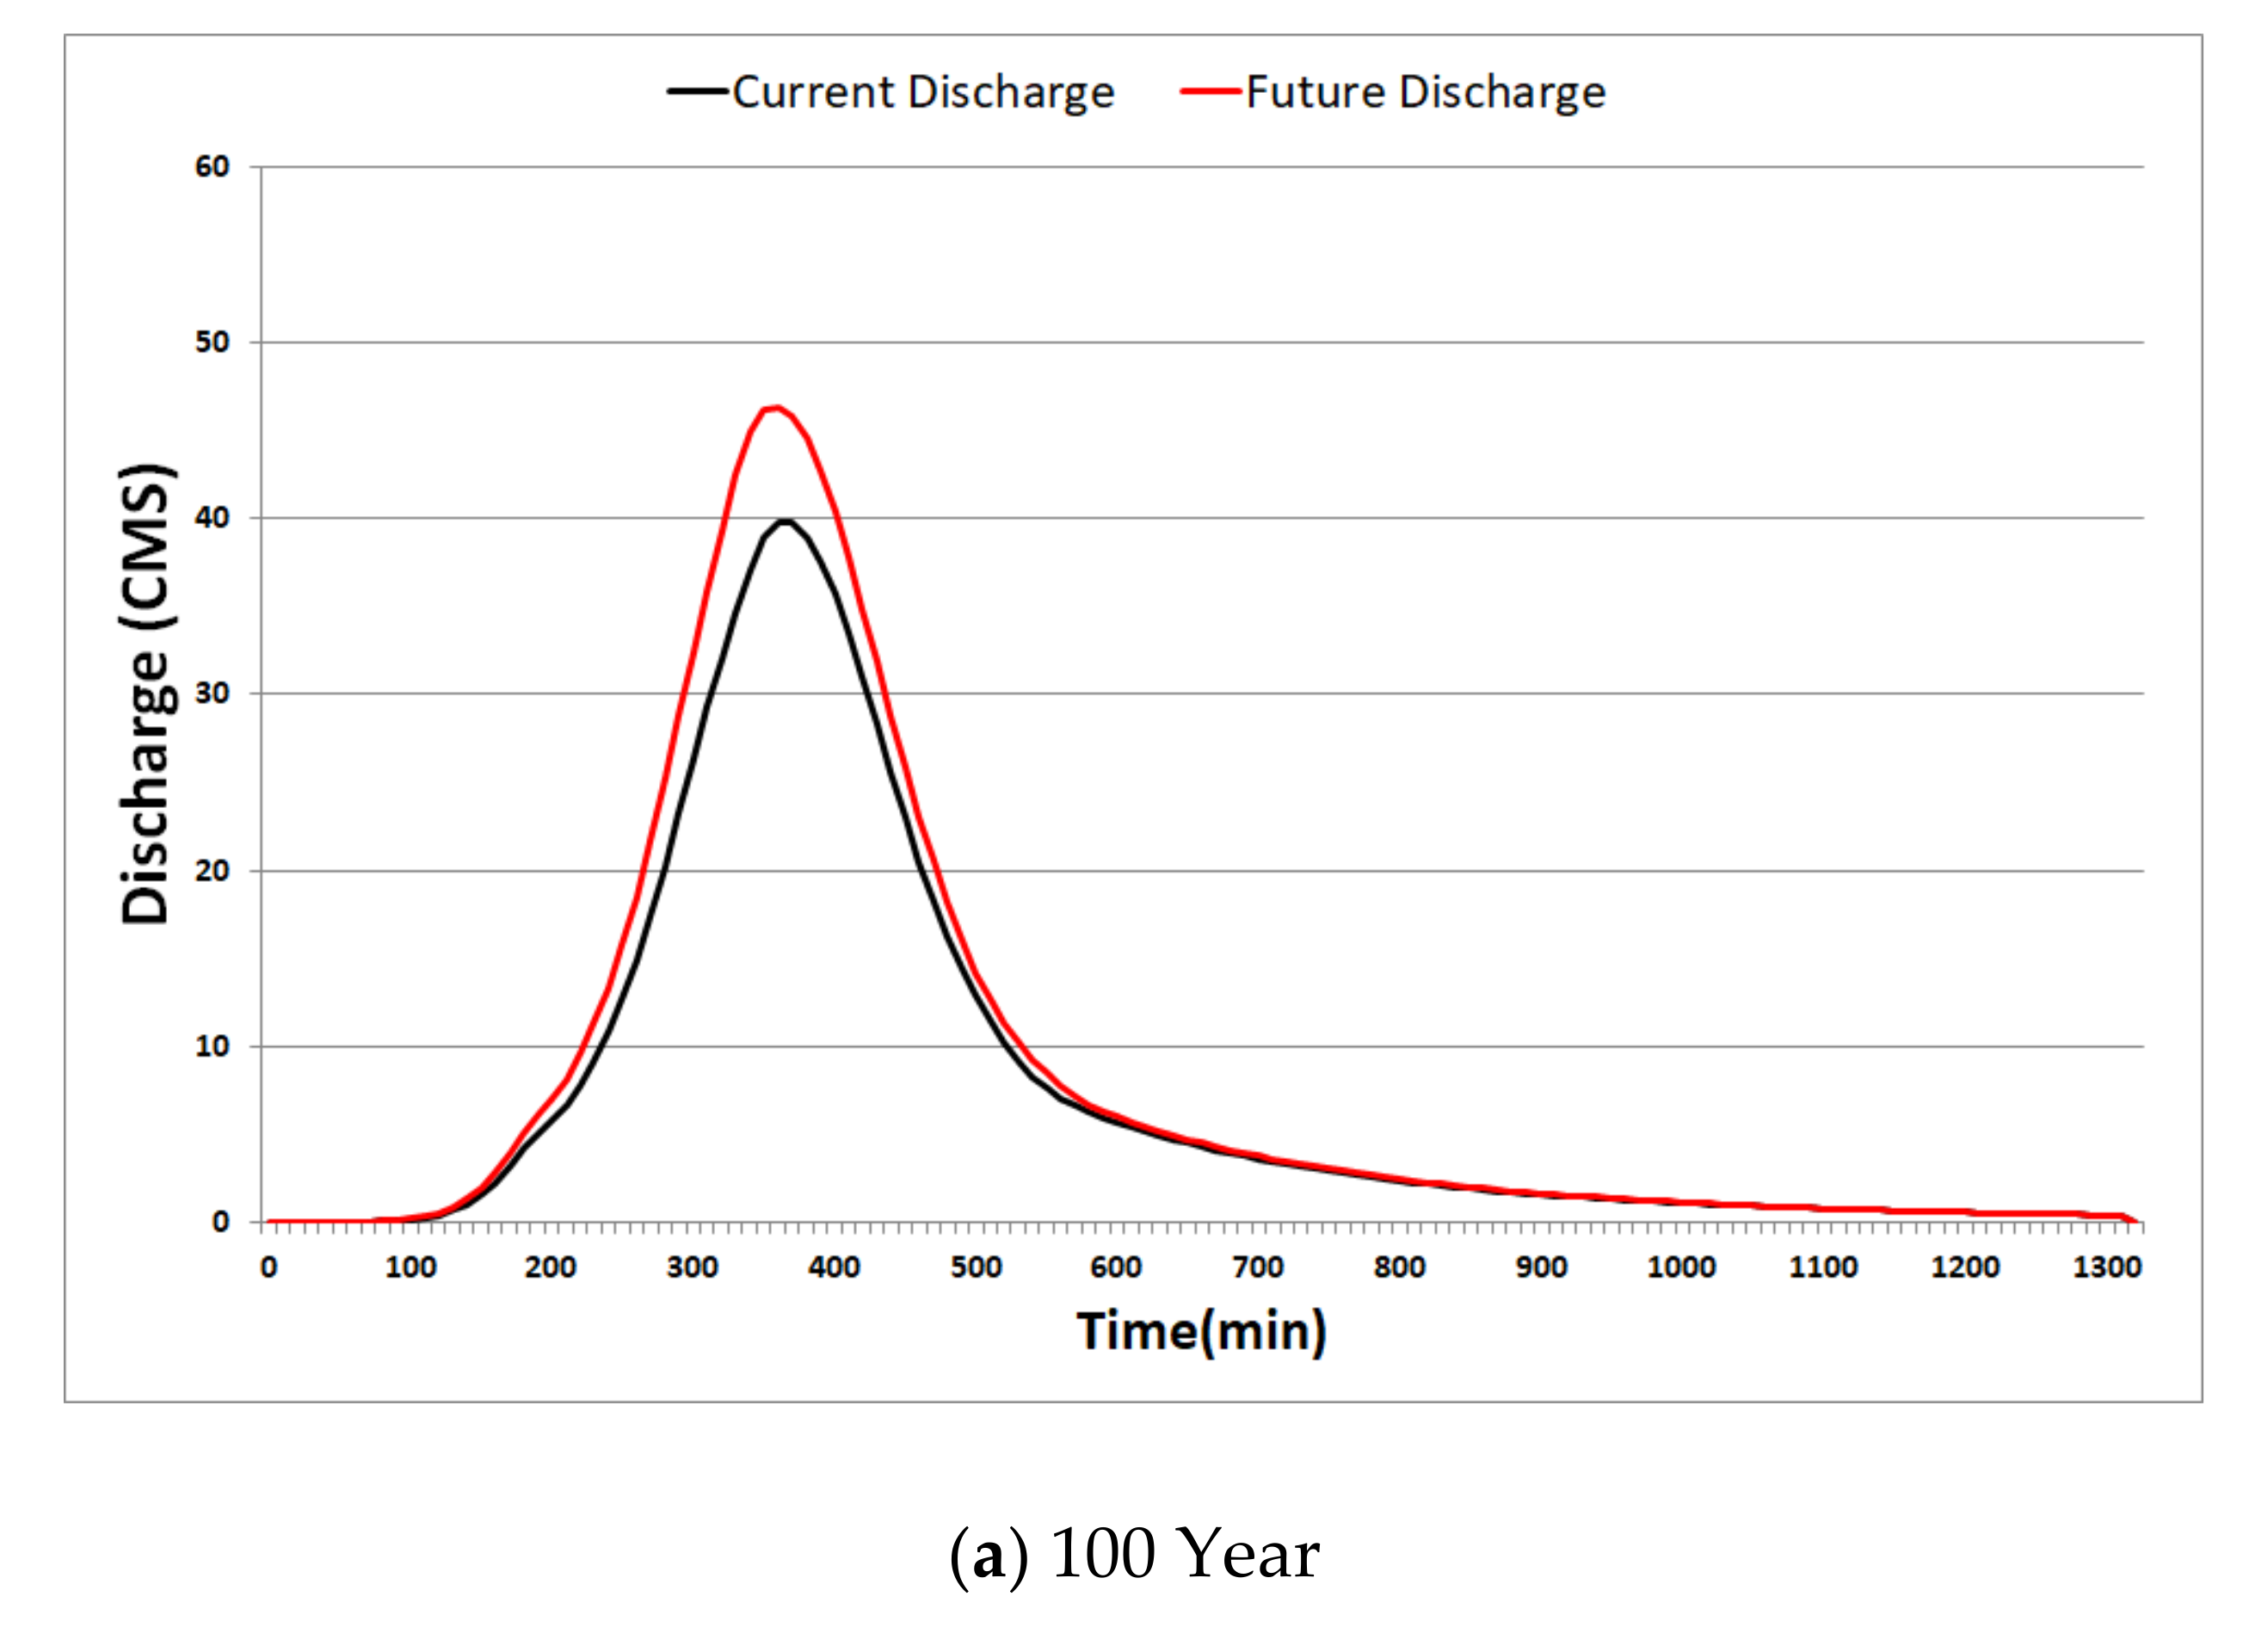
3.4. Calculation of the Flood Discharge Using the S-RAT Model
The digital elevation model (DEM), land use map, and soil map data are needed for the input data of the S-RAT model. And we conducted an analysis using a resolution map of 1:5000. The past 30-year rainfall data and climate change scenario data for each region were used to create the runoff data. The runoff data produced from the S-RAT model were used as the input data in the Flo-2D model, which was the flood inundation model. Figure 11 shows the input data of the S-RAT model. The flow direction, coefficient roughness, and CN value are calculated through the terrain analysis. Figure 12 shows the comparison of runoff results, which are analyzed using the past rainfall data and future climate change scenario data. And the average amount of discharge increased by 16% 100-year, 200-year return period.
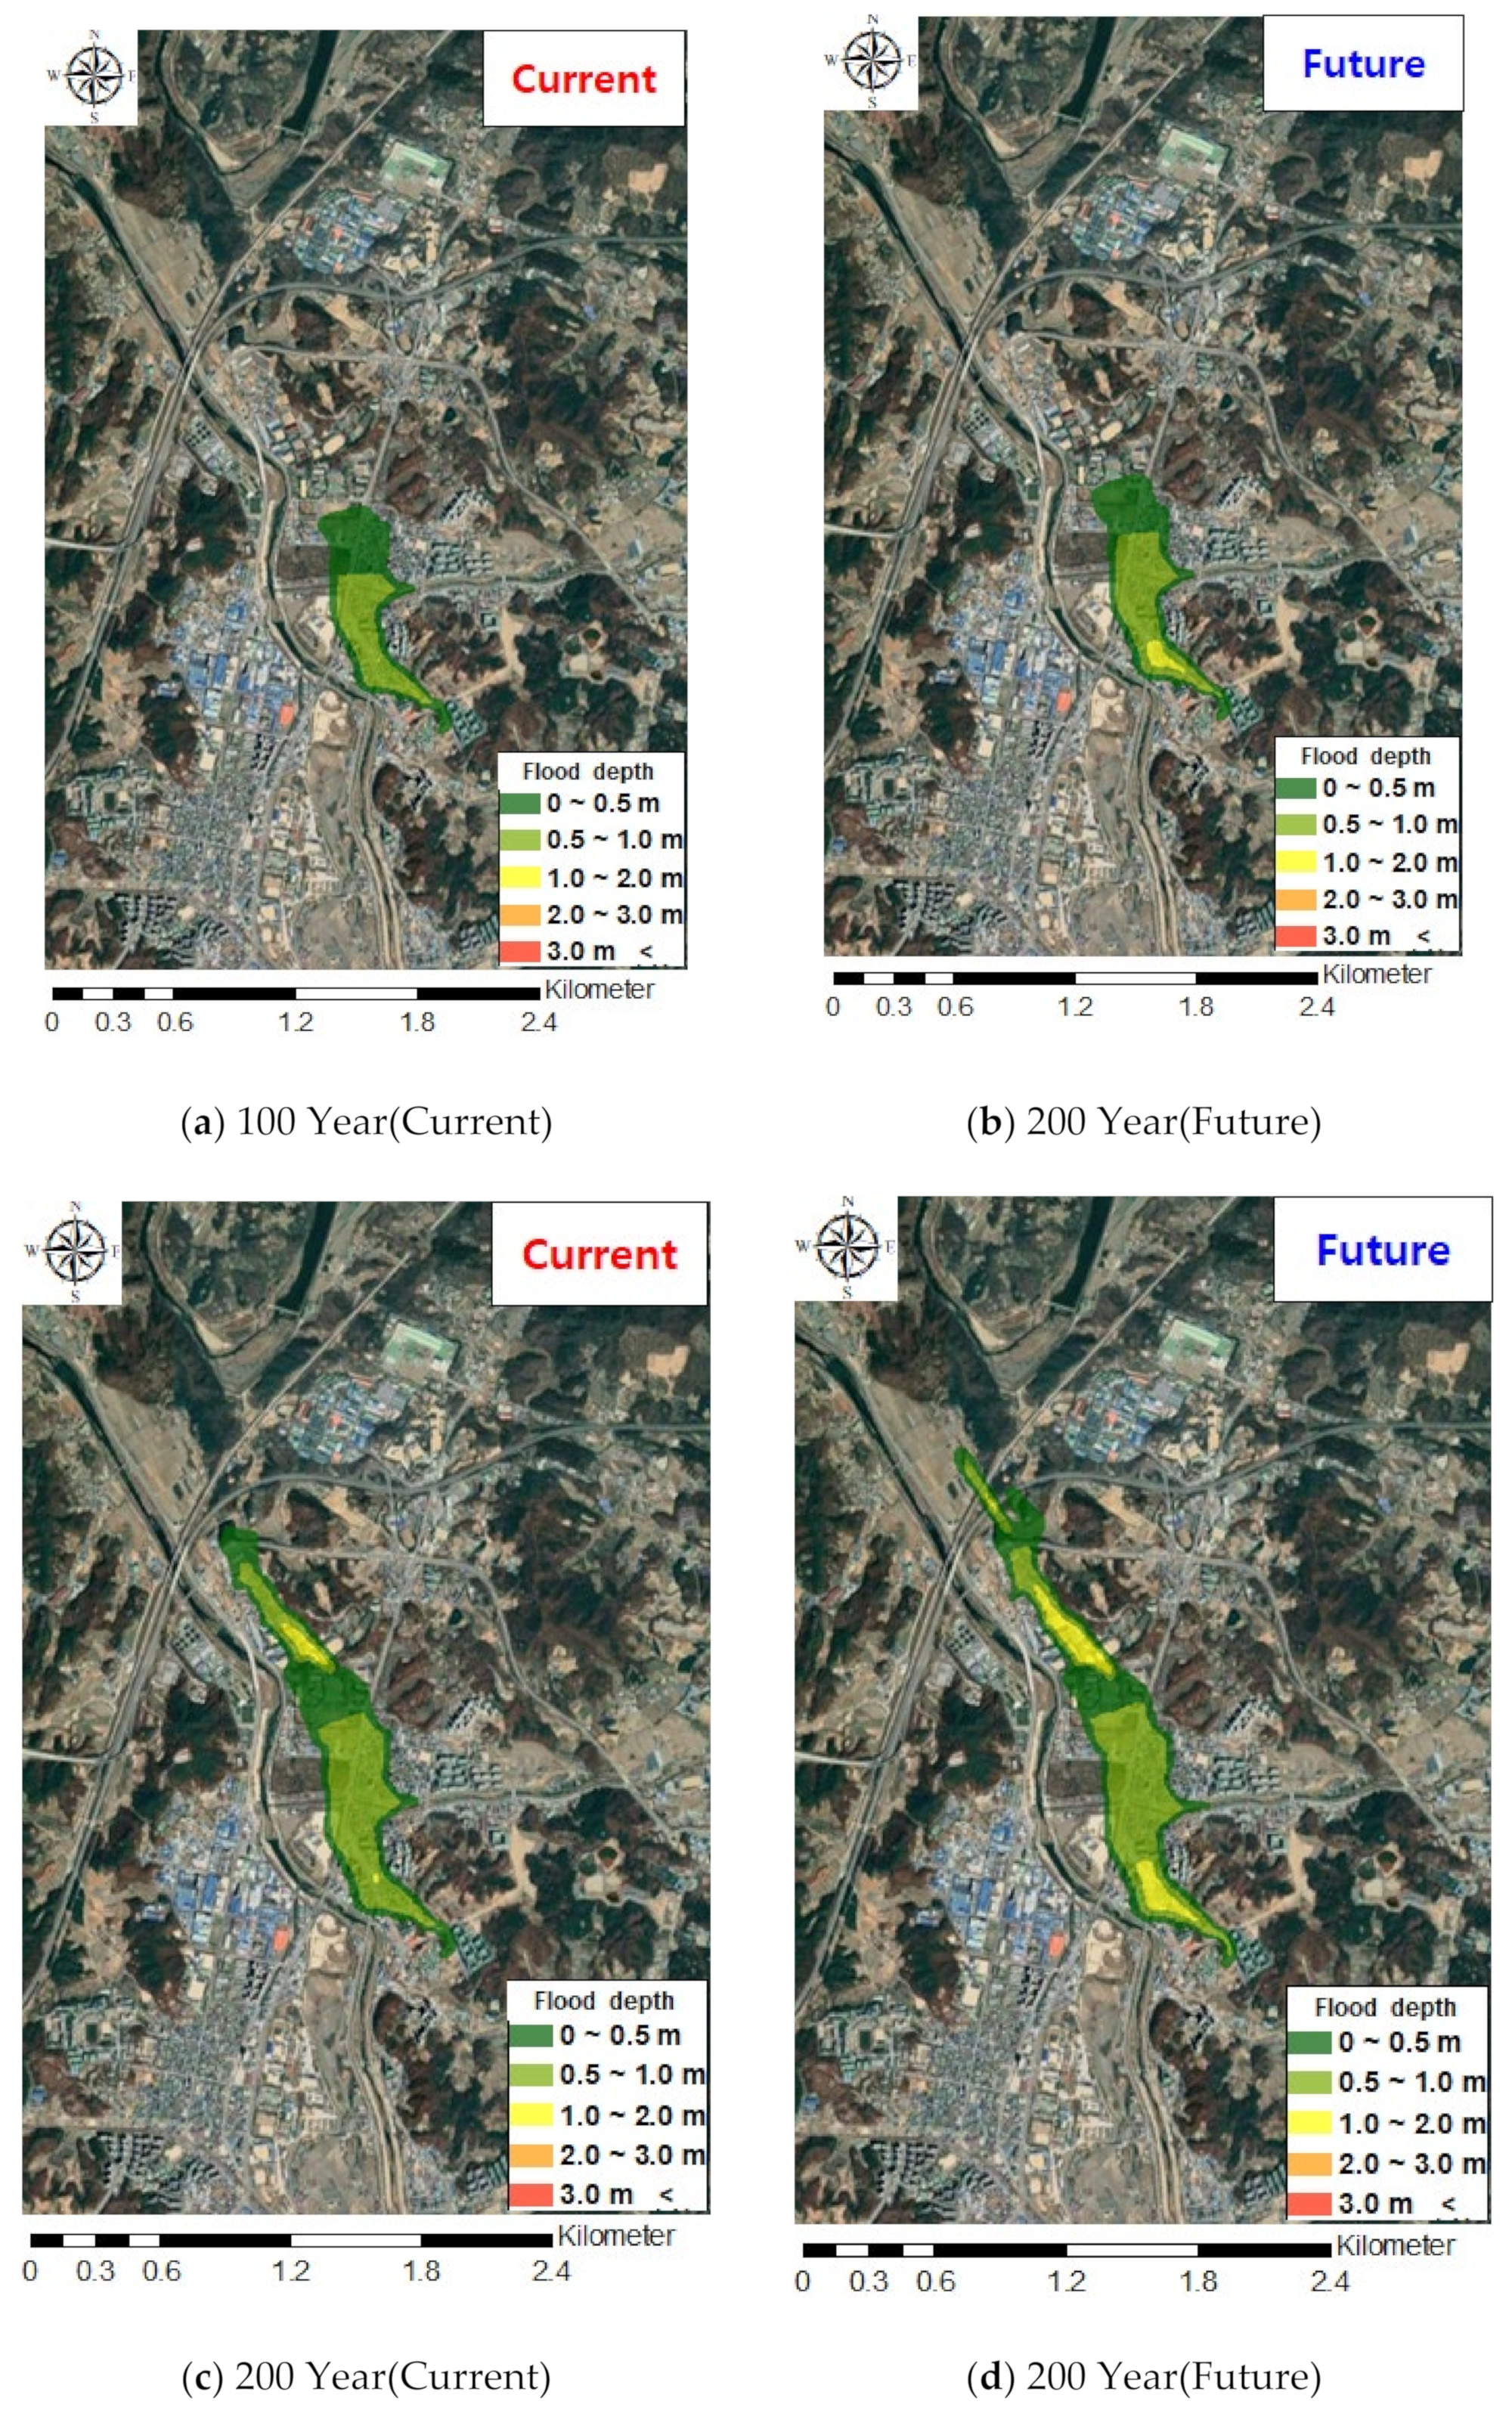
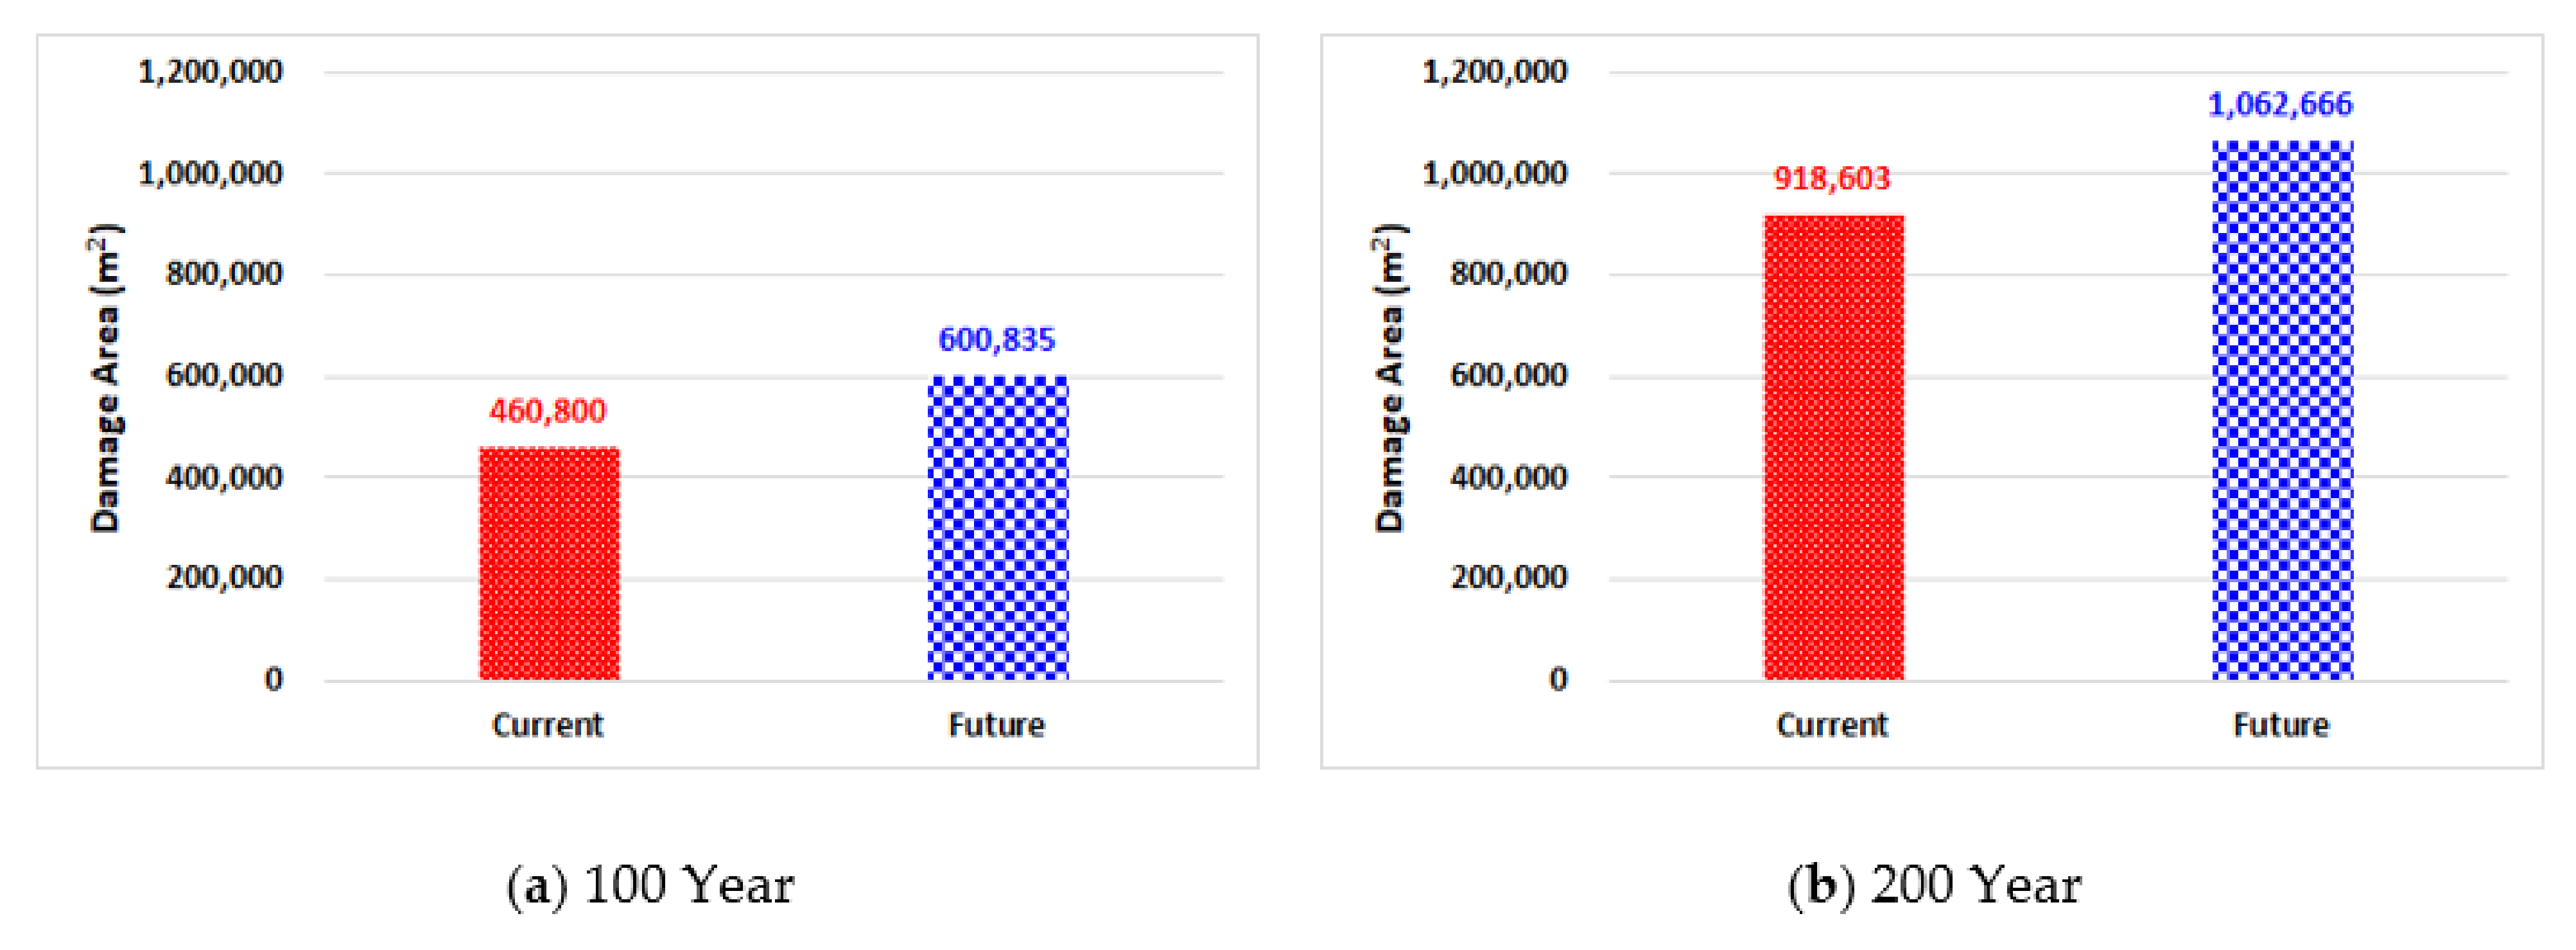
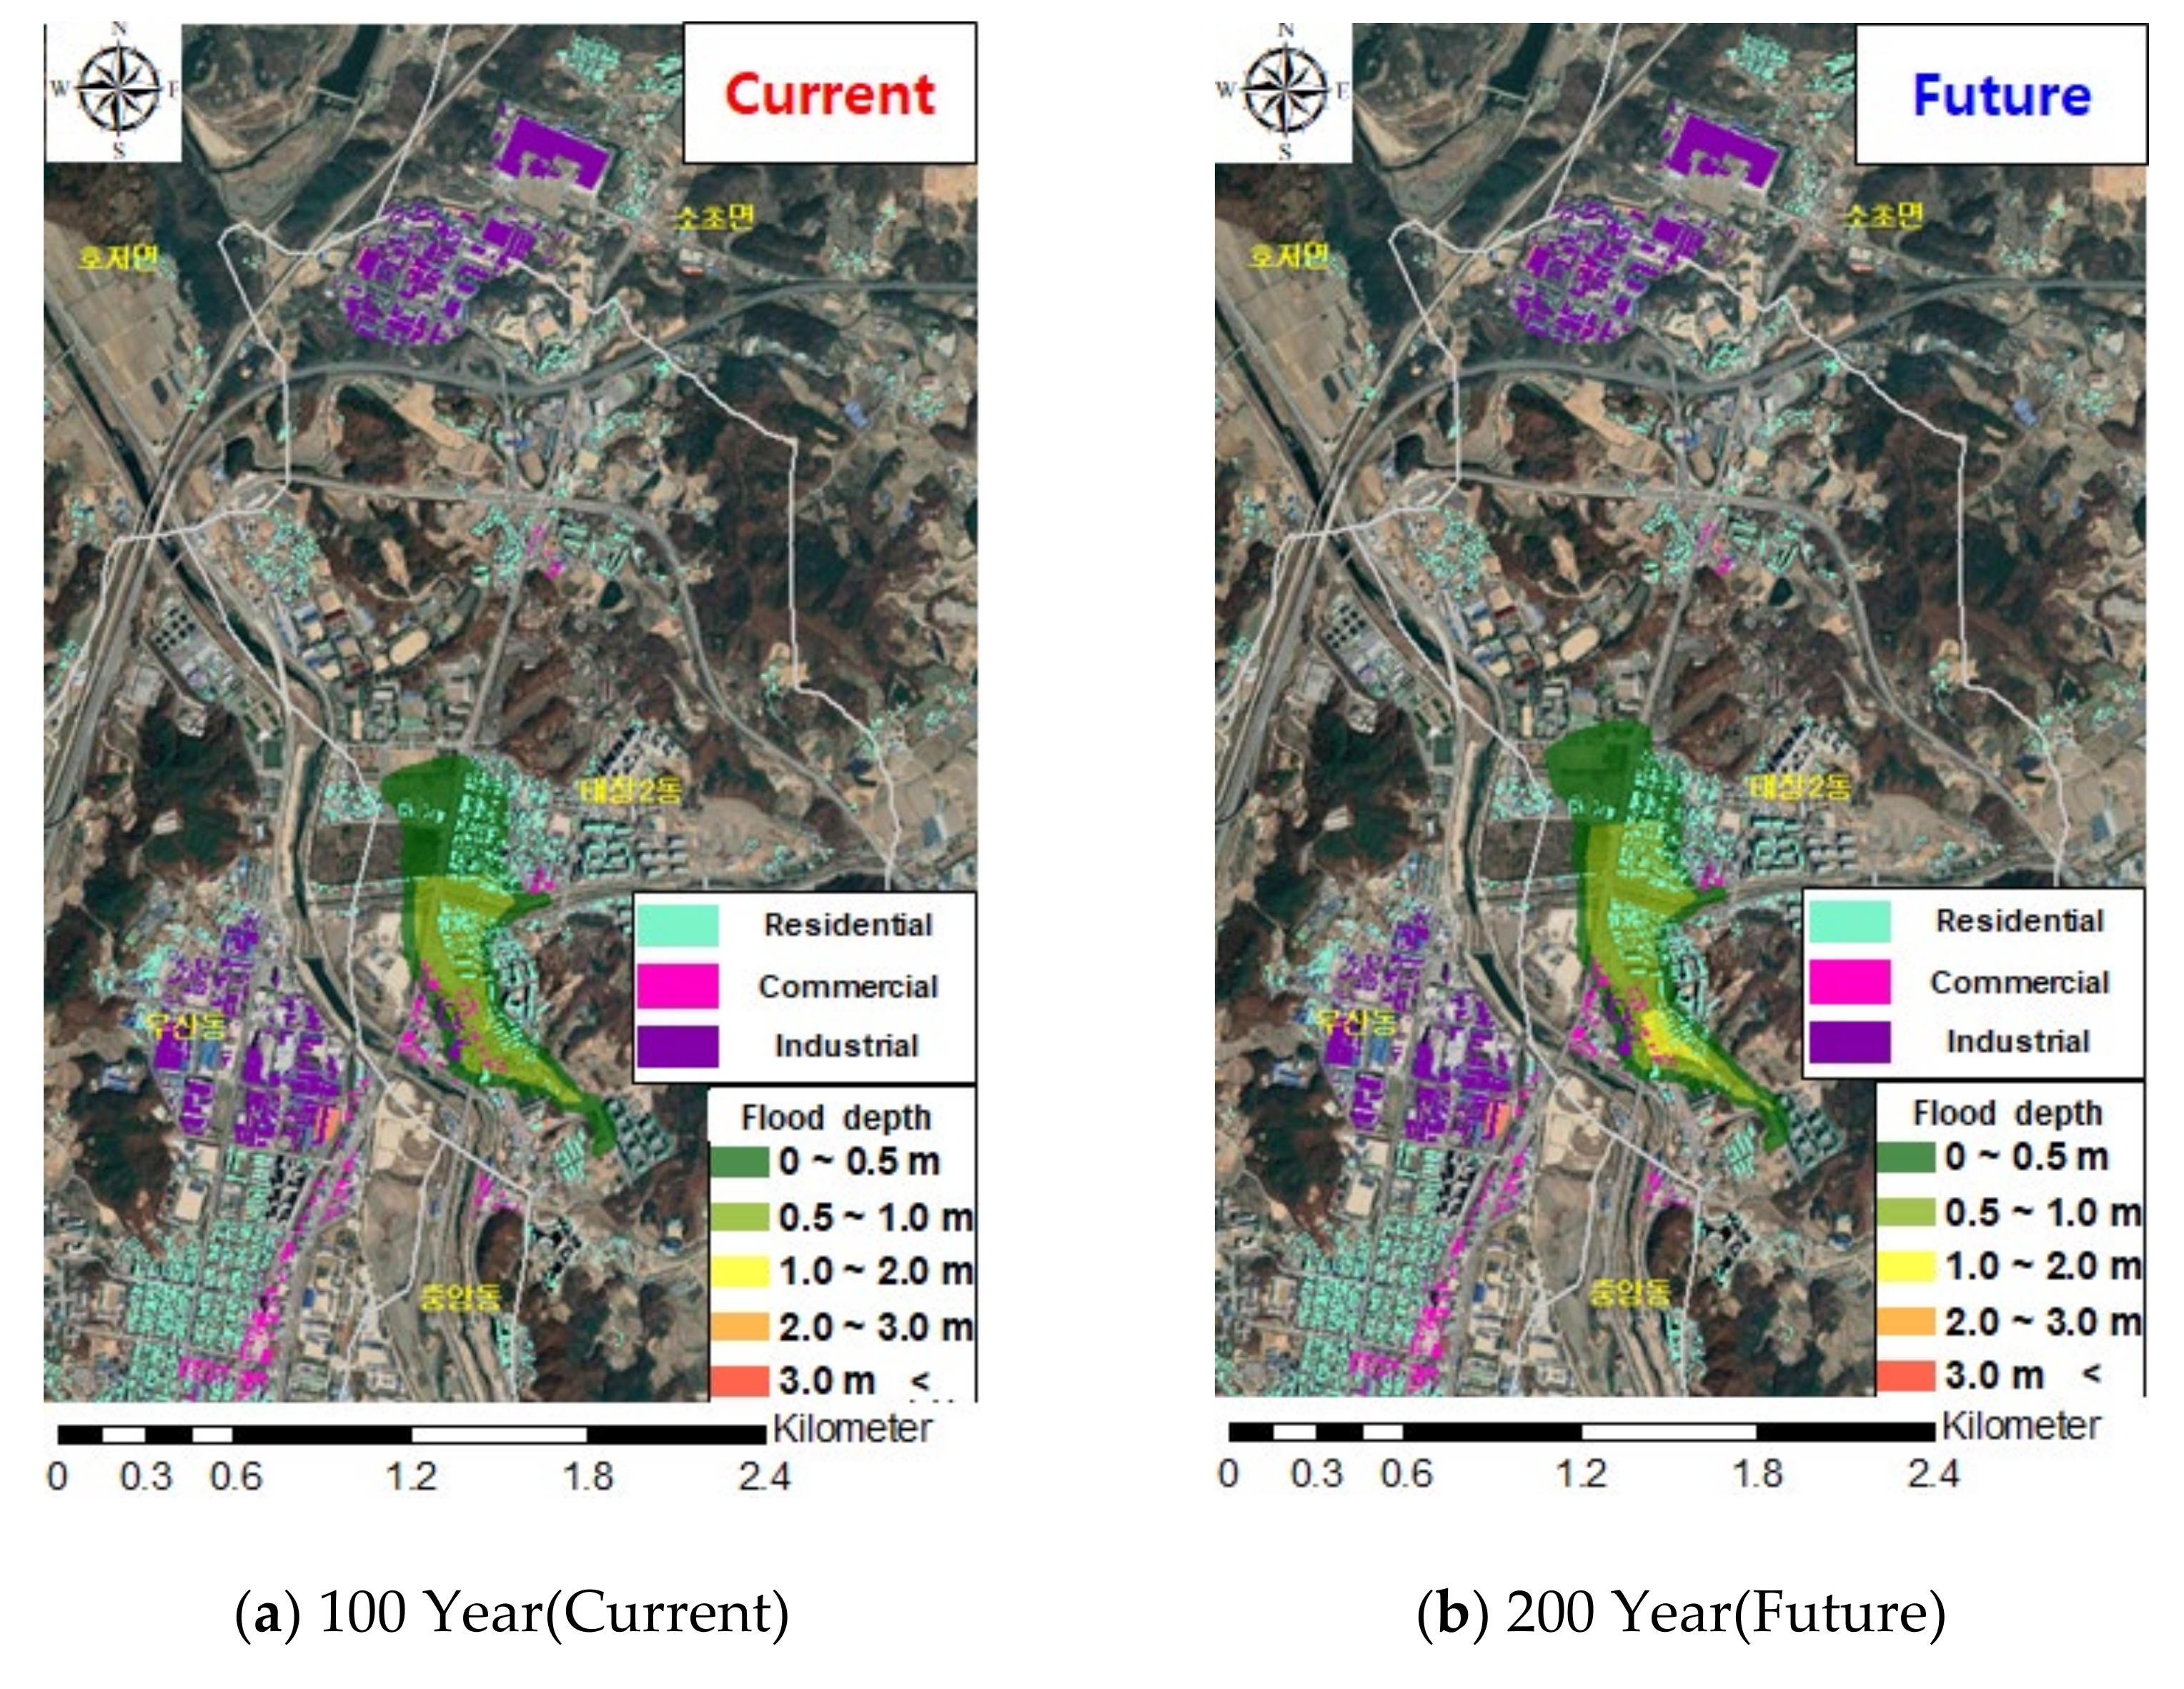
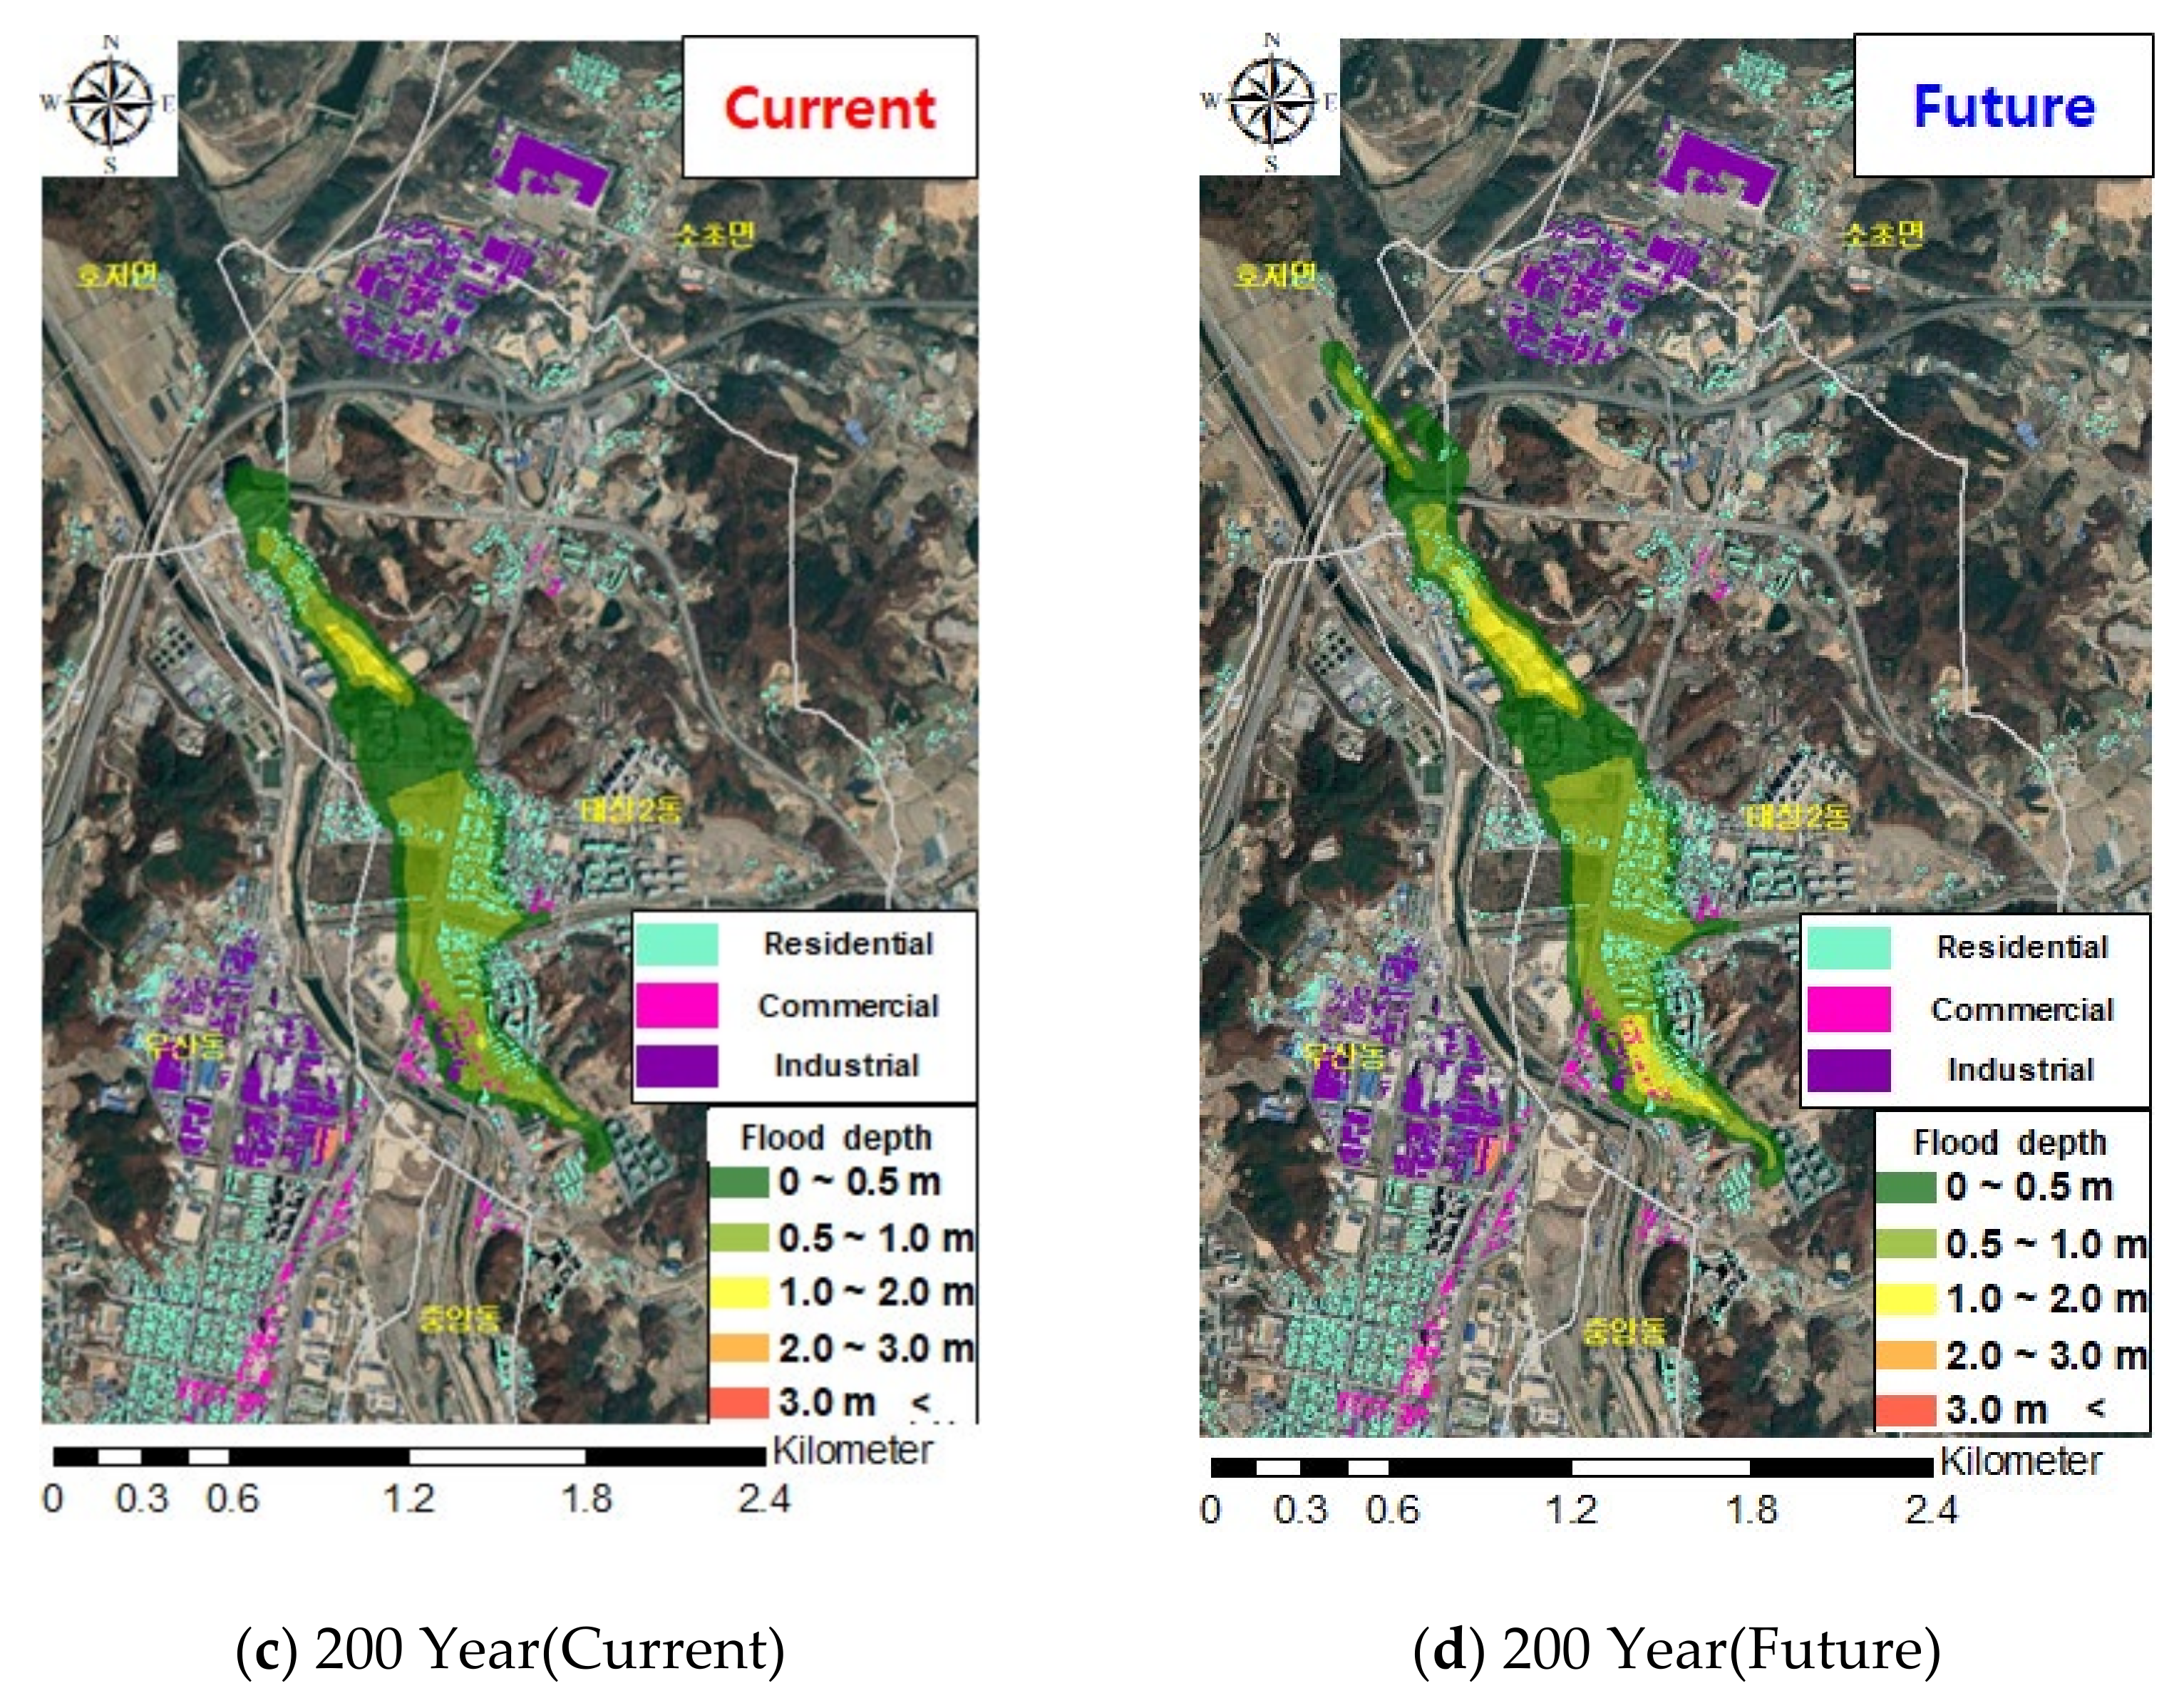
3.5. Flood Simulation by Return Period Using the Flo-2D Model
This study aimed to simulate the flood due to the levee overflow rather than flood by levee break. The levee height in the feasibility study report of the Wonjucheon Dam (2015) and flood level data by rainfall frequency (100-year and 200-year) were used to select the target point. Where flood occurs in all frequencies was selected as the target point. The damage area and damage amount were calculated assuming that flood damage occurred for four hours after calculating the flood level for each return periods (100-year and 200-year) in the selected target point. Figure 13 shows the satellite image of the damage area, and Figure 14 shows the past and future damage areas by the return period. The calculated result of the flood damage area was analyzed and the analysis results showed that the future flood damage area increased by around 30% at the 100-year and around 15% at the 200-year.
3.6. Calculation of Flood Damage Rate
The multi-dimensional flood damage calculation method suggests that the flood damage rate in the agricultural area is calculated using their area ratio while the flood damage rate in the residential and industrial areas is calculated using their location information of spatial objects (building groups). However, the data collection of GIS spatial objects is not easy so their flood damage rate is also calculated practically using their area ratio in many cases. This study aimed to calculate the flood damage through the calculation method using location information of GIS spatial objects rather than the calculation method of flood damage rate using their area ratio. For the land use map used in the analysis, the land use map data provided by the Korea National Spatial Infrastructure Portal was employed. Figure 15 shows the flood damage rate using the flood simulation result and GIS-based building inventory. The flood rate was calculated using the residential, commercial and industrial building inventory within the range of flooding. Table 3 summarizes the calculation results of the flood damage rates.
3.7. Calculation of Flood Damage
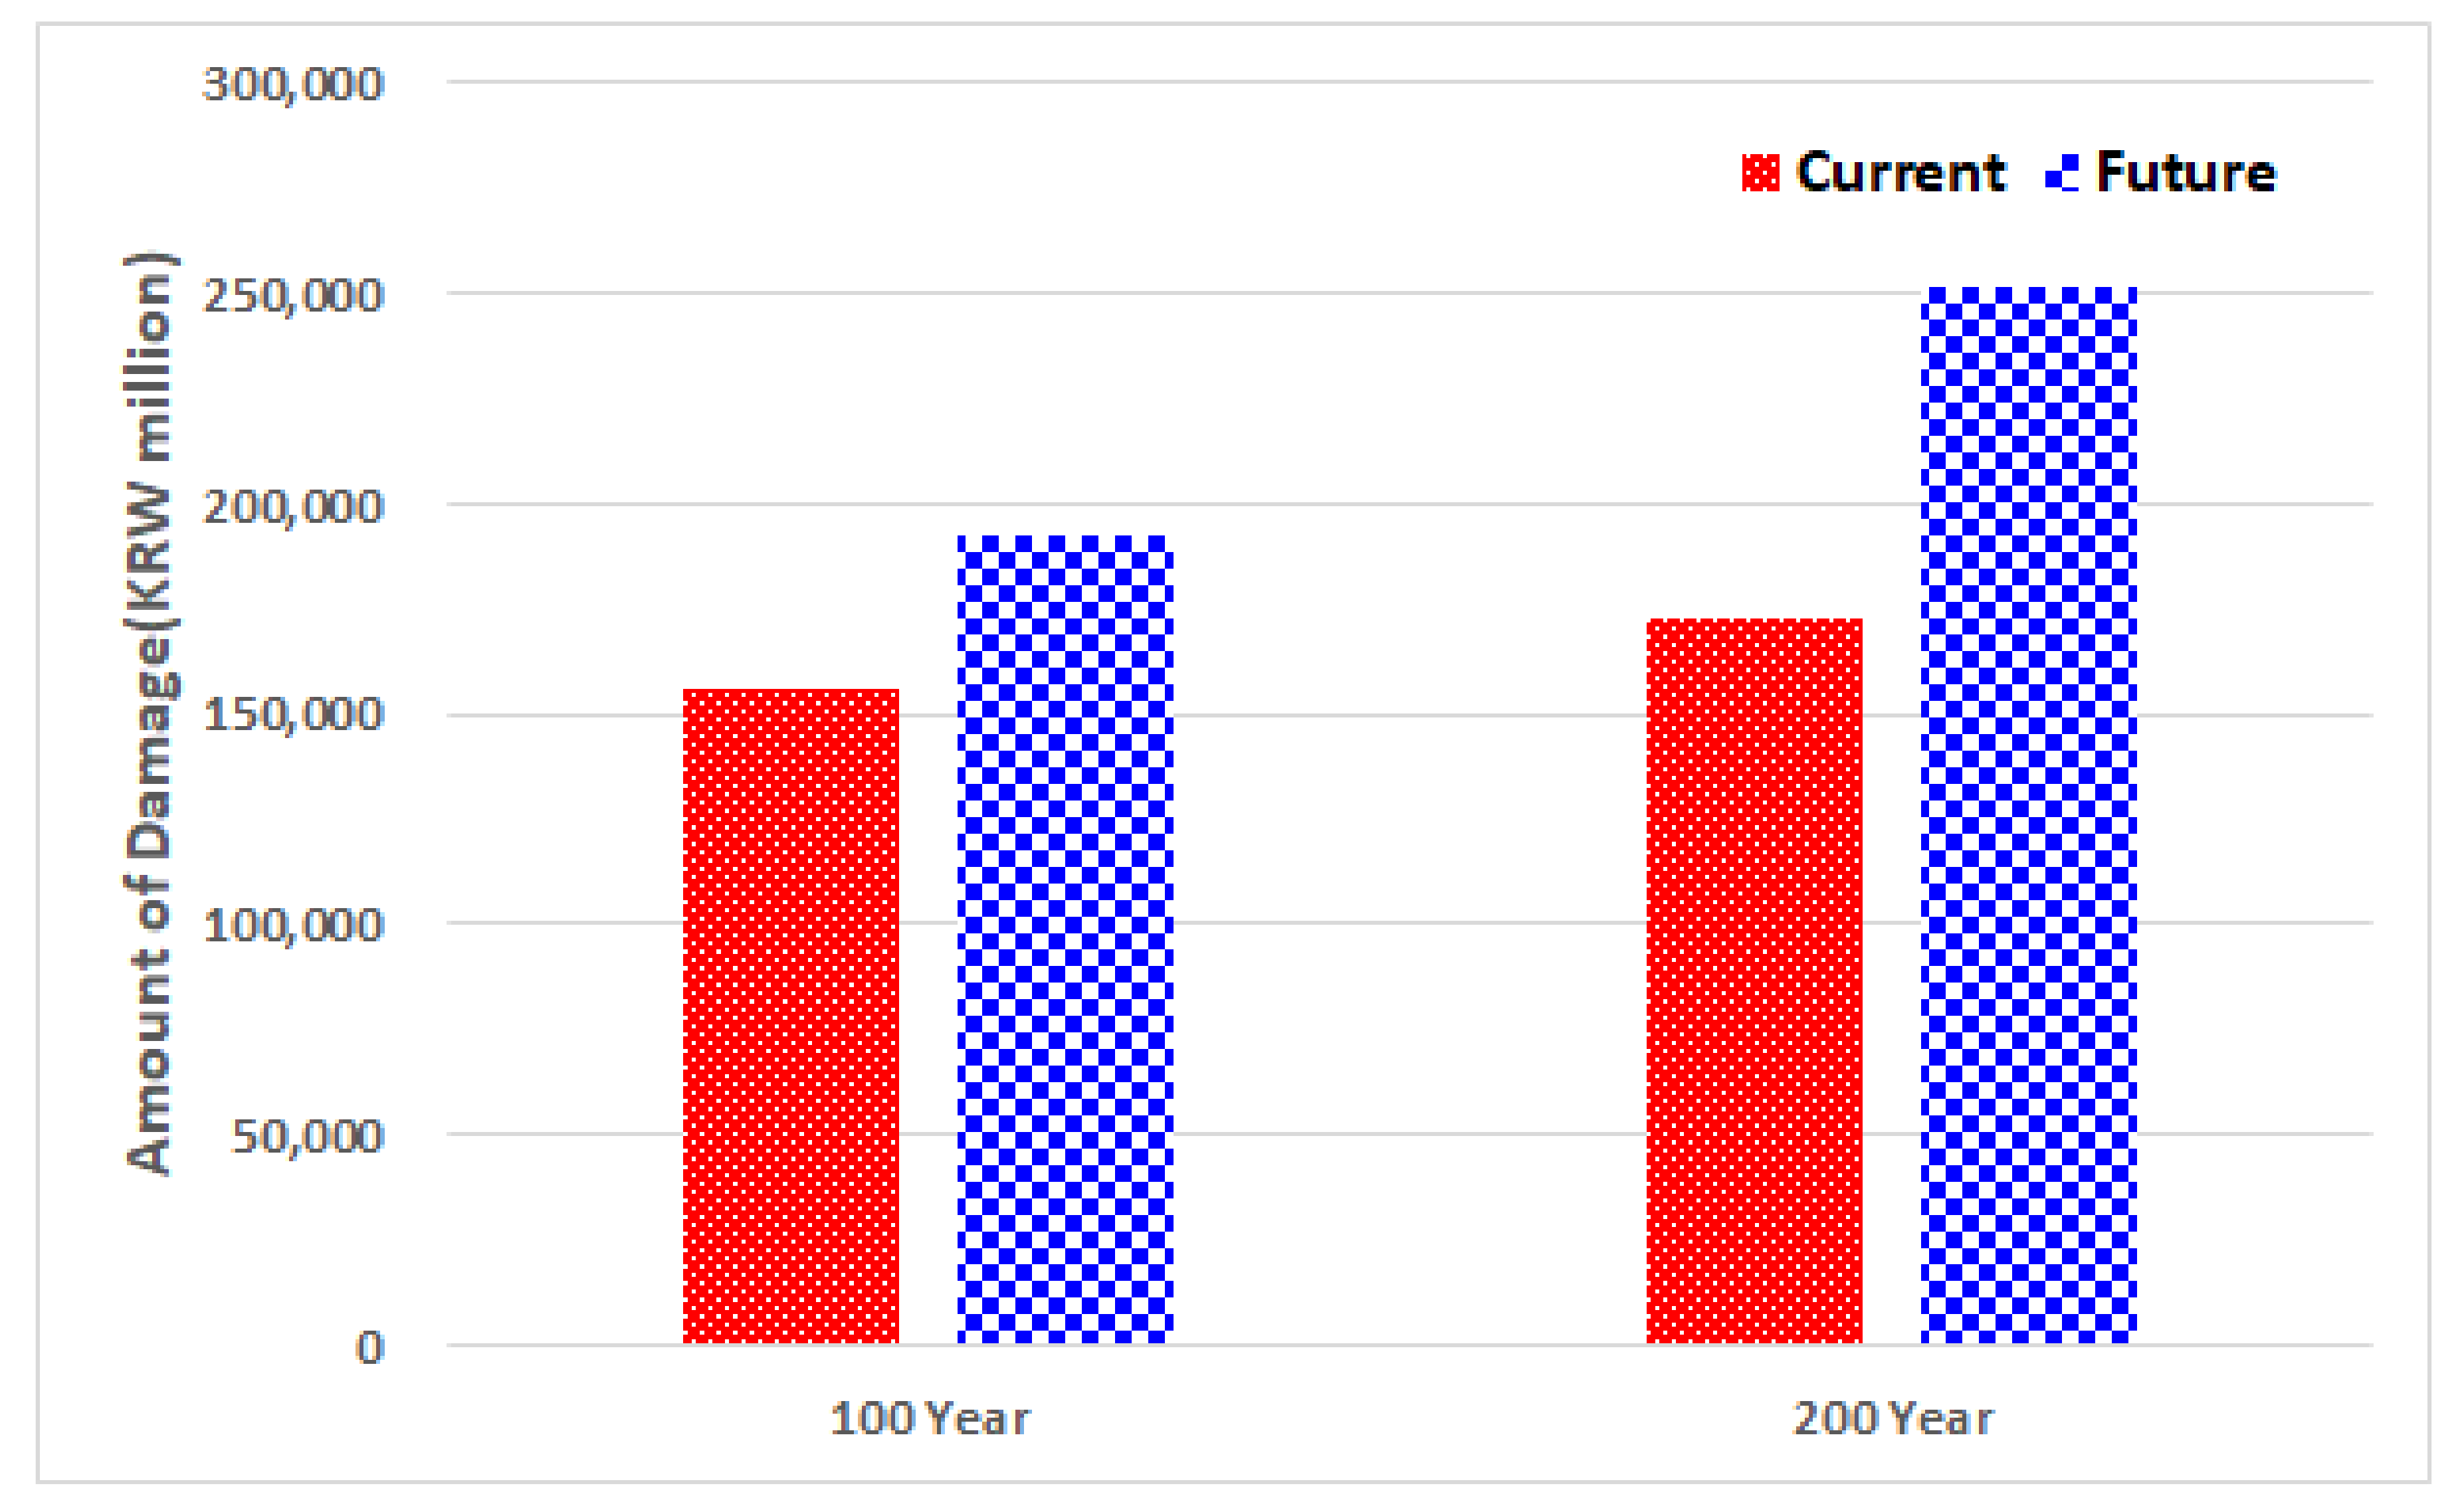
The flood damage amount in the residential, agricultural, and industrial assets was calculated for the current and future times according to the flood rate. To calculate the flood damage, the statistical data of Wonju-si in 2015 was used. To convert the damage amount to that in 2019, the consumer price index (CPI) was applied in the analysis. Table 4 is a quantitative representation of the flood damage. The damage was calculated and the results are shown in Figure 16, which increases by around 23% at the 100-year frequency and around 45% at the 200-year frequency compared to the current one.
4. Conclusions
The purpose of this study was to analyze the effect of climate change on flood damage, and the Wonjucheon basin was selected as the target basin. The novelty of this study is that the amount of flood damage in urban flood was calculated using building inventory, not the area ratio commonly. To generate future rainfall data in the Wonjucheon basin, the conditional Copula model was used to generate 100-year and 200-year frequency rainfall data. To select the runoff data required for the inundation simulation, the data were applied to the S-RAT model, which was a distributed rainfall-runoff model, and the runoff was calculated by applying the current and future rainfall data. The calculated runoff was applied to the Flo-2D model, which was a flood inundation model, to calculate the flood damage area. When applying the flood inundation model, the flood simulation time was assumed to be four hours in the analysis. The multi-dimensional method was used to calculate the damage, and the flood damage rate was calculated using the building inventory in Wonju-si and the damage amount was calculated using the 2015 statistical data.
As a result of acalculating the amount of discharge, the average amount of discharge increased by 16%. This is expected to increase the scope of flooding when applied to the flood model and affect the amount of flood damage. The flood inundation simulation results revealed that the flood area increased by around 30% in the future at the 100-year frequency, and around 15% at the 200-year frequency compared to that of the current time. This indicated that the rainfall increase due to climate change raised the runoff in the Wonjucheon basin thereby affecting the flood damage area. The flood damage rate was selected using the calculated flood damage area and building inventory. The analysis result indicated that a flood level of more than 2 m did not occur in Taijiang 2-dong and Hojeo-myeon. Thus, the flood damage rate was calculated for the 0–2 m flood level. Based on the calculated flood damage rate, the flood damage amount was calculated using the 2015 statistical data in Wonju-si, and the CPI was considered to convert the amount into the price in 2019. The damage was calculated and the result increased by around 23% at the 100-year frequency and around 45% at the 200-year frequency compared to the current one. This result verified that the runoff in the Wonjucheon basin increased due to climate change thereby increasing the flood damage area, which also caused the increase in the flood damage area. Thus, this study concluded that it is necessary to promote river maintenance and disaster prevention measures in response to climate change. And it is easy to calculate the amount of flood damage using the area ratio in calculating the amount of flood damage, but it is not believed to produce accurate results. Therefore, it is better to consider the actual building inventory to ensure high accuracy in calculating flood damage. Furthermore, we would like to analyze the possibility of improvement in the calculation of flood damage using continuous hydrological modelling [52] for future research.
Author Contributions
D.-H.K. and D.-H.N., S.-J.J. carried out the survey of previous study and wrote the graph of the data. B.-S.K. suggested idea of study and contributed to the writing of the paper. All authors have read and agreed to the published version of the manuscript.
Funding
This work was funded by the Korea Meteorological Administration Research and Development Program under Grant KMI [2021—00312]. This work was supported by the Korea Sanhak Foundation(KSF) in 2020.
Institutional Review Board Statement
Not applicable.
Informed Consent Statement
Not applicable.
Data Availability Statement
Not applicable.
Conflicts of Interest
The authors declare no conflict of interest.
References
- Yun, H.-C.; Min, K.-S.; Kim, M.-K. Construction of Multi-purpose Hazard Information Map Based on Digital Image Using Geospatial Information. J. Korean Assoc. Geogr. Inf. Stud. 2010, 13, 91–101. [Google Scholar]
- Annis, A.; Nardi, F.; Petroselli, A.; Apollonio, C.; Arcangeletti, E.; Tauro, F.; Belli, C.; Bianconi, R.; Grimaldi, S. UAV-DEMs for Small-Scale Flood Hazard Mapping. Water 2020, 12, 1717. [Google Scholar] [CrossRef]
- Trefry, C.M.; Watkins, D.W.; Johnson, D. Regional rainfall frequency analysis for the state of michigan. J. Hydrol. Eng. 2005, 10, 439–449. [Google Scholar] [CrossRef]
- Kim, J.-Y.; Kwon, H.-H.; Lim, J.-Y. Development of hierarchical bayesian spatial regional frequency analysis model considering geographical characteristics. J. Korea Water Resour. Assoc. 2014, 47, 469–482. [Google Scholar] [CrossRef] [Green Version]
- Moon, J.-W.; Moon, Y.-I.; Kwon, H.-H. Assessment of uncertainty assoicated with parameter of gumbel probability density function in rainfall frequcney analysis. J. Korea Water Resour. Assoc. 2016, 49, 411–422. [Google Scholar] [CrossRef]
- Nelsen, R.B. An Introduction to Copulas, 1st ed.; Springer: New York, NY, USA, 1999. [Google Scholar]
- Kim, J.-Y.; Park, C.-Y.; Kwon, H.H. A development of downscaling scheme for sub-daily extreme precipitation using conditional copula model. J. Korea Water Resour. Assoc. 2016, 49, 863–876. [Google Scholar]
- Salvadori, G.; De Michele, C. Multivariate multiparameter extreme value models and return periods: A copula approach. Water Resour. Res. 2010, 46, W10501. [Google Scholar] [CrossRef]
- Hadjinicolaou, P.; Giannakopoulos, C.; Zerefos, C.; Lange, M.; Pashiardis, S.; Lelieveld, J. Mid-21st century climate and weather extremes in Cyprus as projected by six regional climate models. Reg. Environ. Chang. 2011, 11, 441–457. [Google Scholar] [CrossRef]
- Hanel, M.; Buishand, T.A. Analysis of precipitation extremes in an ensemble of transient regional climate model simulations for the Rhine basin. Clim. Dyn. 2011, 36, 1135–1153. [Google Scholar] [CrossRef]
- Kim, B.-S.; Kim, B.-K.; Kwon, H.-H. Assessment of the impact of climate change on the flow regime of the Han River basin using indicators of hydrologic alteration. Hydrol. Process. 2011, 25, 691–704. [Google Scholar] [CrossRef]
- Kyselý, J.; Gaál, L.; Beranová, R.; Plavcová, E. Climate change scenarios of precipitation extremes in central europe from ENSEMBLES regional climate models. Theor. Appl. Climatol. 2011, 104, 529–542. [Google Scholar] [CrossRef]
- Kwon, H.-H.; Kim, J.-G.; Lee, J.S.; Na, B.-K. Uncertaintyassessment of single event rainfall-runoff model using bayesian model. J. Korea Water Resour. Assoc. 2012, 45, 505–516. [Google Scholar] [CrossRef] [Green Version]
- Na, B.-K.; Kim, J.-Y.; Kwon, H.-H.; Lim, J.-Y. Improvement of hydrologic dam risk analysis model considering uncertainty of hydrologic analysis process. J. Korea Water Resour. Assoc. 2014, 47, 853–865. [Google Scholar] [CrossRef] [Green Version]
- Kim, J.-Y.; Kim, J.-G.; Choi, B.-H.; Kwon, H.-H. A development of hydrologic dam risk analysis model using bayseian network (BN). J. Korea Water Resour. Assoc. 2015, 48, 781–791. [Google Scholar] [CrossRef] [Green Version]
- Segond, M.L.; Neokleous, N.; Makropoulos, C.; Onof, C.; Maksimovic, C. Simulation and spatial–temporal disaggregation of multi-site rainfall data for urban drainage applications. J. Hydrol. Sci. 2007, 52, 917–935. [Google Scholar] [CrossRef]
- Reynard, N.S.; Prudhomme, C.; Crooks, S.M. The flood characteristics of large UK rivers: Potential effects of changing climate and land use. Clim. Chang. 2001, 48, 343–359. [Google Scholar] [CrossRef]
- Adan, R.M.; Petroselli, A.; Heddam, S.; Santos, C.A.G.; Kisi, O. Comparison of different methodologies for rainfall-runoff modeling: Machine learning vs. conceptual approach. Nat. Hazards 2021, 105, 2987–3011. [Google Scholar] [CrossRef]
- Blenkinsop, S.; Harpham, C.; Burton, A.; Goderniaux, P.; Brouyere, S.; Fowler, H.J. Downscaling transient climate change with a stochastic weather generator for the Geer catchment, Belgium. Clim. Res. 2013, 57, 95–109. [Google Scholar] [CrossRef] [Green Version]
- Burton, A.; Fowler, H.J.; Blenkinsop, S.; Kilsby, C.G. Downscaling transient climate change using a Neyman-Scott Rectangular Pulses stochastic rainfall model. J. Hydrol. 2010, 381, 18–32. [Google Scholar] [CrossRef]
- De Luca, D.L.; Petroselli, A.; Galasso, L. A Transient Stochastic Rainfall Generator for Climate Changes Analysis at Hydrological Scales in Central Italy. Atmosphere 2020, 11, 1292. [Google Scholar] [CrossRef]
- De Luca, D.L.; Biondi, D. Bivariate Return Period for Design Hyetograph and Relationship with T-year Design Flood Peak. Water 2017, 9, 673. [Google Scholar] [CrossRef] [Green Version]
- Pal, S.C.; Das, B.; Malik, S.; Shit, M.; Chakrabortty, R. Flood Frequency Analysis and Its Management in Selected Part of Bardhaman District, West Bengal. In Habitat, Ecology and Ekistics. Advances in Asian Human-Environmental Research; Rukhsana, Haldar, A., Alam, A., Satpati, L., Eds.; Springer: Cham, Switzerland, 2021; pp. 225–246. [Google Scholar]
- Malik, S.; Pal, S.C. Potential flood frequency analysis and susceptibility mapping using CMIP5 of MIROC5 and HEC-RAS model: A case study of lower Dwarkeswar River, Eastern India. SN Appl. Sci. 2021, 31, 1–22. [Google Scholar]
- Band, S.S.; Janizadeh, S.; Chandra Pal, S.; Saha, A.; Chakrabortty, R.; Melesse, A.M.; Mosavi, A. Flash Flood Susceptibility Modeling Using New Approaches of Hybrid and Ensemble Tree-Based Machine Learning Algorithms. Remote Sens. 2020, 12, 3568. [Google Scholar] [CrossRef]
- Roy, P.; Chandra Pal, S.; Chakrabortty, R.; Chowdhuri, I.; Malik, S.; Das, B. Threats of climate and land use change on future flood susceptibility. J. Clean. Prod. 2020, 272, 122757. [Google Scholar] [CrossRef]
- Malik, S.; Chandra Pal, S.; Chowdhuri, I.; Chakrabortty, R.; Roy, P.; Das, B. Prediction of highly flood prone areas by GIS based heuristic and statistical model in a monsoon dominated region of Bengal Basin. Remote Sens. Appl. Soc. Environ. 2020, 19, 100343. [Google Scholar] [CrossRef]
- Malik, S.; Chandra Pal, S. Application of 2D numerical simulation for rating curve development and inundation area mapping: A case study of monsoon dominated Dwarkeswar river. Int. J. River Basin Manag. 2020. [Google Scholar] [CrossRef]
- Yeo, K.-D. A Study on Estimation Method of Expected Flood Damage Considering Local Charateristics. Master Thesis, Inha University, Incheon, Korea, 2003. [Google Scholar]
- Choi, S.-A.; Yi, C.-S.; Shim, M.-P.; Kim, H.S. Multi-Dimensional Expected Flood Damage Assessment Method: Principle and Procedure. KSCE J. Civ. Eng. 2004, 10, 839–843. [Google Scholar]
- Lee, K.-H.; Choi, S.-A.; Kim, H.-S.; Shim, M.-P. Application of Multi-Dimensional Flood Damage Analysis for Urban Flood Damage. J. Korean Soc. Civ. Eng. B 2006, 26, 363–369. [Google Scholar]
- Lee, G.-S.; Park, J.-H. Flood Damage Assessment According to the Scenarios Coupled with GIS Data. J. Korean Soc. Geospat. Inf. Sci. 2011, 19, 71–80. [Google Scholar]
- Lee, K.-H. Estimation of Expected Flood Damage considering Uncertainty and Under Climate Change. Ph.D. Thesis, Inha University, Incheon, Korea, 2011. [Google Scholar]
- Schreider, S.Y.; Smith, D.I.; Jakeman, A.J. Climate change impacts on urban flooding. Clim. Chang. 2000, 47, 91–115. [Google Scholar] [CrossRef]
- Park, J.-K.; Cho, K.-S.; Lee, G.-S. Evaluation of Flood Damage Assessment of Guri City based on GIS. 2015 Conference of the Korean Society for Geospatial Information Science. 2015, 169–170.
- Tak, Y.-H.; Kim, Y.-D.; Kang, B.-S.; Park, M.-H. Application of Multi-Dimensional Flood Damage analysis in urban area. J. Korea Water Resour. Assoc. 2017, 50, 397–405. [Google Scholar]
- Huizinga, J.; Moel, H.; de Szewczyk, W. Global flood depth-damage functions—Methodology and the database with guidelines. Jt. Res. Cent. 2017. [Google Scholar] [CrossRef]
- Dutta, D.; Heath, S. Methodology for Flood Assessment using GIS and Distributed Hydrologic Model. In Proceedings of the International Symposium on Information Technology Tools for Natural Disaster Risk Management, Bangkok, Thailand, 4–6 February 1998; pp. 109–124. [Google Scholar]
- Tate, E. Floodplain Mapping and Terrain Modeling Using HEC-RAS and ArcView GIS; Center for Research in Water Resources, The University of Texas at Austin: Austin, TX, USA, 1999. [Google Scholar]
- Snead, D. Floodplain Visualization Using HEC-Geo RAS; University of Texas at Austin Civil Engineering class exercise: Austin, TX, USA, 2000. [Google Scholar]
- MLIT. Manual on Flood Control Economic Analysis; Ministry of Land Infrastruc ture and Transport and Tourism in Japan: Tokyo, Japan, 2000.
- Biza, P.; Gimun, V.; Knap, R.; Ammentorp, H.C.; Smith, G.; Ohly, T. The use of a GIS-based software tool for cost-benefit analysis of flood mitigation. In Proceedings of the 4th DHI Software Conference, Helsingør, Denmark, 6–8 June 2001. [Google Scholar]
- Beffa, C.; Connell, R.J. Two-Dimensional flood plain flow. I: Model Description. J. Hydrol. Eng. 2001, 6, 397–405. [Google Scholar] [CrossRef]
- Petroselli, A.; Florek, J.; Młyński, D.; Książek, L.; Wałęga, A. New Insights on Flood Mapping Procedure: Two Case Studies in Poland. Sustainability. 2020, 12, 8454. [Google Scholar] [CrossRef]
- Merwade, V.; Olivera, F.; Arabi, M.; Edleman, S. Uncertainty in Flood Inundation Mapping: Current Issues and Future Directions. J. Hydrol. Eng. 2008, 13, 608–620. [Google Scholar] [CrossRef] [Green Version]
- Armenakis, C.; Nirupama, N. Estimating spatial disaster risk in urban environments. Geomat. Nat. Hazards Risk 2013, 4, 289–298. [Google Scholar] [CrossRef] [Green Version]
- Eum, H.-I.; Cannon, A.J. Intercomparison of projected changes in climate extremes for South Korea: Application of trend preserving statistical downscaling methods to the CMIP5 ensemble. Int. J. Climatol. 2017, 37, 3381–3397. [Google Scholar] [CrossRef]
- Kim, B.-S.; Yoon, S.-K.; Yang, D.-M.; Kwon, H. Development of Grid-Based Conceptual Hydrologic Model. J. Korea Water Resour. Assoc. 2010, 43, 667–679. [Google Scholar] [CrossRef]
- Software Packages FLO-2D Manual. 2009. Available online: https://www.flo-2d.com/download/ (accessed on 20 March 2020).
- Korea Development Institute. Modification and Supplementary Study of the Preliminary Feasibility Study Standard Guide for Water Resources (dam) Project, 4th ed.; Korea Development Institute: Wonju-si, Korea, 2008. [Google Scholar]
- Kang, D.-H.; Lee, S.-H.; Kim, K.-H.; Kim, B.-S. Estimation of Flood Damage Using Building Group Inventory and Multi-Dimensional Flood Damage Analysis. J. Korea Soc. Hazard Mitig. 2018, 18, 119–127. [Google Scholar] [CrossRef]
- Grimaldi, S.; Nardi, F.; Piscopia, R.; Petroselli, A.; Apollonio, C. Continuous hydrologic modelling for design simulation in small and ungauged basins: A step forward and some tests for tis practical use. J. Hydrol. 2020, 125664. [Google Scholar] [CrossRef]
Figure 1.
Flow Chart of Study.

Figure 2.
Meteorological Station in Republic of Korea.

Figure 3.
Conceptual Diagram of Grid Water Balace [48].
Figure 3.
Conceptual Diagram of Grid Water Balace [48].

Figure 4.
Comparison of Estimate Flood Damage Rate.

Figure 5.
Study Basin.

Figure 6.
Past Flood Event of Study Basin.

Figure 7.
Observation and probability density functions of pre-/post-application of SDQDM (annual precipitation).
Figure 7.
Observation and probability density functions of pre-/post-application of SDQDM (annual precipitation).

Figure 8.
Spatial distribution for observation and pre-/post-downscaling.

Figure 9.
Variability for monthly precipitation.

Figure 10.
Result of I-D-F Curve by Return Period in Study Stations.


Figure 11.
Input Data of S-RAT Model.

Figure 12.
Calculation of Discharge by Returnperiods.


Figure 13.
Damage Area by Return Periods.

Figure 14.
Result of Damage Area.

Figure 15.
Result Flood Damage Rate.


Figure 16.
Result Flood Damage.


Table 1.
Global Climate Models.
| No. | GCMs | Resolution (Degree) | Institution |
|---|---|---|---|
| 1 | CanESM2 | 2.813 × 2.791 | Canadian Centre for Climate Modelling and Analysis |
| 2 | CESM1- | 1.250 × 0.942 | National Center for Atmospheric Research |
| 3 | CMCC-CM | 0.750 × 0.748 | Centro Euro-Mediterraneo per I Cambiamenti Climatic |
| 4 | CMCC-CMS | 1.875 × 1.865 | |
| 5 | CNRM-CM5 | 1.406 × 1.401 | Centre National de Recherches Meteorologiques |
| 6 | GFDL-ESM2G | 2.500 × 2.023 | Geophysical Fluid Dynamics Laboratory |
| 7 | HadGEM2-AO | 1.875 × 1.250 | Met Office Hadley Centre |
| 8 | HadGEM2-ES | 1.875 × 1.250 | |
| 9 | INM-CM4 | 2.000 × 1.500 | Institute for Numerical Mathematics |
| 10 | IPSL-CM5A-LR | 3.750 × 1.895 | Institute Pierre-Simon Laplace |
| 11 | IPSL-CM5A-MR | 2.500 × 1.268 | |
| 12 | MRI-CGCM3 | 1.125 × 1.122 | Meteorological Research Institute |
| 13 | NorESM1-M | 2.500 × 1.895 | Norwegian Climate Centre |
Table 2.
Flood Damage Assets by Administrative District Based on the MD-FDA.
| Asset Type | Assets |
|---|---|
| Residential | Building: Residential Buildings Building content: Home Supplies |
| Agricultural | Farmland: Fields and paddles Produce: Representative crops during flood season |
| Industrial | Tangible fixed/stored assets: Production facilities and/or assets except for land |
Table 3.
Estimation Flood Damage Rate by Return Period.
| Division | Flood Damage Rate | |||||||||||
|---|---|---|---|---|---|---|---|---|---|---|---|---|
| Current | Future | |||||||||||
| 0–0.5 m | 0.5–1.0 m | 1.0–2.0 m | 2.0–3.0 m | 3.0 m over | 0–0.5 m | 0.5–1.0 m | 1.0–2.0 m | 2.0–3.0 m | 3.0 m over | |||
| 100 Year | Residential | Taijiang 2-Dong | 0.1243 | 0.0407 | 0 | 0 | 0 | 0.1058 | 0.0785 | 0.0008 | 0 | 0 |
| Industry | Taijiang 2-Dong | 0.0602 | 0.1783 | 0.0072 | 0 | 0 | 0.0698 | 0.1253 | 0.0626 | 0 | 0 | |
| 200 Year | Residential | Taijiang 2-Dong | 0.1301 | 0.1251 | 0.0033 | 0 | 0 | 0.1226 | 0.1348 | 0.0231 | 0 | 0 |
| Hojeo-Myeon | 0 | 0 | 0 | 0 | 0 | 0.0012 | 0.0009 | 0.0009 | 0 | 0 | ||
| Industry | Taijiang 2-Dong | 0.0722 | 0.1710 | 0.0024 | 0 | 0 | 0.0698 | 0.0746 | 0.1277 | 0 | 0 | |
Table 4.
Result of Flood Damage.
| Time | Flood Damage (KRW Million) | |||
|---|---|---|---|---|
| 100 Year | 200 Year | |||
| Current | Future | Current | Future | |
| 4 h | 155,780 | 192,384 | 172,810 | 251,155 |
Publisher’s Note: MDPI stays neutral with regard to jurisdictional claims in published maps and institutional affiliations. |
© 2021 by the authors. Licensee MDPI, Basel, Switzerland. This article is an open access article distributed under the terms and conditions of the Creative Commons Attribution (CC BY) license (http://creativecommons.org/licenses/by/4.0/).
Share and Cite
MDPI and ACS Style
Kang, D.-H.; Nam, D.-H.; Jeung, S.-J.; Kim, B.-S. Impact Assessment of Flood Damage in Urban Areas Using RCP 8.5 Climate Change Scenarios and Building Inventory. Water 2021, 13, 756. https://doi.org/10.3390/w13060756
AMA Style
Kang D-H, Nam D-H, Jeung S-J, Kim B-S. Impact Assessment of Flood Damage in Urban Areas Using RCP 8.5 Climate Change Scenarios and Building Inventory. Water. 2021; 13(6):756. https://doi.org/10.3390/w13060756
Chicago/Turabian StyleKang, Dong-Ho, Dong-Ho Nam, Se-Jin Jeung, and Byung-Sik Kim. 2021. "Impact Assessment of Flood Damage in Urban Areas Using RCP 8.5 Climate Change Scenarios and Building Inventory" Water 13, no. 6: 756. https://doi.org/10.3390/w13060756
Note that from the first issue of 2016, this journal uses article numbers instead of page numbers. See further details here.