
A Global Assessment of the Potential for Ocean-Driven Transport in Hatchling Sea Turtles


1
Biology Department, The University of West Florida, Pensacola, FL 32514, USA
2
LGL Ecological Research Associates, Bryan, TX 77802, USA
*
Author to whom correspondence should be addressed.
Water 2021, 13(6), 757; https://doi.org/10.3390/w13060757
Submission received: 3 February 2021
/
Revised: 25 February 2021
/
Accepted: 1 March 2021
/
Published: 11 March 2021
(This article belongs to the Special Issue Marine Species on the Move)
Abstract
:Ocean circulation models are an essential tool for use in estimating the movements of drifting marine species. Across the world, hatchling sea turtle transport to the pelagic ocean is facilitated by the local currents off their natal beaches. It is difficult, if not impossible, to observe this transport reliably for any lengthy period, and, as such, ocean circulation models are an essential tool for studying sea turtles during this vulnerable time. Here, we use the ocean circulation model HYCOM and the particle simulator Ichthyop to model the first month of hatchling transport across all sea turtle species from nesting sites across the world from 25 cohorts of hatchlings at 67 nesting sites. We evaluated transport as a function of spatiotemporal factors that could influence turtle movement, using generalized linear models and the information theoretic approach to model selection. We found that multiple physical factors influence transport across the first month of movement and that annual variability is an important factor in hatchling transport. Our findings suggest that the beaches turtles hatch from and the year in which they hatch may shape their early life and the speed of transport into the relative safety of the open ocean. An increased understanding of the likely survival of a cohort may aid in designating funds and planning conservation strategies for individual beaches to either compensate for or take advantage of the local currents.
1. Introduction
Ocean currents play an important role in the spatial distribution of many marine plants, invertebrates, and vertebrates as the main driver of movement, ontogenetic shifts in habitats, and dispersal in individual organisms [1]. At a population level, the importance of ocean currents is readily apparent in the timing of reproduction, the location of reproductive sites [1,2,3], and spatiotemporal variation in recruitment dynamics [4]. On longer timescales, ocean currents shape the magnitude and directionality of gene flow among populations, colonization, and speciation [5,6]. Indeed, a reasonable null-hypothesis for ecological patterns and evolutionary processes in marine environments is that they are driven entirely by ocean circulation dynamics [7,8,9]. Global ocean circulation models have become valuable tools for generating the predictions of that null hypothesis, by providing a realistic environment within which the movements of individual organisms can be simulated [10]. Here, we use this framework to quantify differences in the potential ocean-driven transport of hatchling sea turtles departing nesting beaches.
Like many marine taxa, the sea turtle life cycle is characterized by movement [11]. Sea turtles deposit nests on warm, sandy beaches where eggs incubate for a period of weeks. When sea turtles hatch, they exhibit intense swimming behavior, dubbed the “swimming frenzy”, lasting 12 to 48 h that helps them quickly leave the continental shelf [2,12,13,14]. Nearshore predation is high for hatchlings, and they are less likely to be found and eaten in the open ocean than they are in the relatively shallow water of the continental shelf [15,16,17]. The young turtles of most species remain in open ocean habitats for several years, carried by prevailing ocean currents and, in at least some cases, following an innate migratory route to distant, productive foraging grounds [18,19]. As turtles grow, some species move to more coastal habitats, whereas others remain in the open sea. Upon reaching maturity, there is a strong propensity for all species to return to the vicinity of their natal site to mate and nest [2,20,21]. This “natal homing” behavior is an important aspect for maintaining population structure and promoting demographic independence among nesting assemblages, despite the potential for widespread mixing in the oceanic habitats they occupy [22].
There is accumulating evidence that the hatchling migration is a critical period in the sea turtle life cycle. Observed hatchling mortality during this period ranges from 0–85% and likely depends upon beach conditions, predator density, geography of the beach and nearby ocean currents [15,16,17]. Consistent differences among nesting sites in how ocean currents facilitate the transport of hatchlings offshore may be a determining factor in regional variation in population sizes [11]. This period of oceanic transport also contributes to the distribution of juvenile turtles [10,23] and, possibly, the subsequent selection of foraging grounds by adults [24,25]. Given that this relatively brief period of the sea turtle life cycle has implications ranging from explaining biogeographic patterns of nest densities [26] to better managing fisheries [27], we investigated spatiotemporal variability in the oceanic transport of sea turtle hatchlings from 67 nesting beaches scattered across the globe. We used 25 years of hindcast ocean circulation model output paired with virtual particle tracking software to simulate the ocean-driven transport of non-swimming hatchling sea turtles. In addition to examining variability in transport potential among sites and through time, we evaluated whether these differences revealed any broad-scale trends of transport as a function of ocean basin, latitude, longitude, or coastal setting.
2. Methods
2.1. Particle Tracking Simulation
In our transportation simulations, we used the Global Hybrid Coordinate Ocean Model (HYCOM) to provide hindcast oceanic current conditions [28]. HYCOM provides a model environment of ocean current features at 0.08° resolution (~8–9 km grid spacing at mid-latitudes) and daily timesteps by integrating in situ and satellite data. We used the surface layer (~0–1 m) from experiments 19.0, 19.1, 91.0, 91.1, and 91.2 for the years 1993 to 2017 to provide background conditions for our particle simulation (https://www.hycom.org/).
Using Ichthyop (v. 2 Ichthyop, Lyons, France) particle tracking software, we simulated transportation from the selected nesting sites [29]. Ichthyop uses a Runge-Kutta 4th-order time step method to simulate the movement of virtual particles in ocean circulation model velocity fields. To better match how turtles behave in reality, we used a “bouncy” coastline, so that particles would move along or bounce off the coast rather than be stranded on shore and removed from the simulation. We released 350 particles day−1 during the typical hatching season for each site from 1993 to 2017. The model tracked the location and path of the particles for 30 days post release.
We measured the transport distance (km) of the turtles from their nesting beaches at 4 specific periods, 1, 5, 10, and 30 day(s) using the positions recorded from Ichthyop and functions in Python (v. 2.2 Python Software Foundation, Wilmington, DE, USA). We selected the first month of transport to examine short-term transport as turtles are at their smallest and most vulnerable during that period and rapid movement away from the shelf habitat is critical [15,16,17]. While swimming by sea turtles at this stage can have important implications for movements, distribution, and survival [14,30,31], we did not consider it here as our aim was only to examine the environmental setting into which turtles dispersed rather than the direct behavior of hatchling turtles. Distance was recorded as the straight (rhumb) line distance between the initial particle location and its position at a given timestep. From the simulated distances at each site, we calculated the standard deviation to estimate the variability of transport distance.
2.2. Nesting Beach Selection
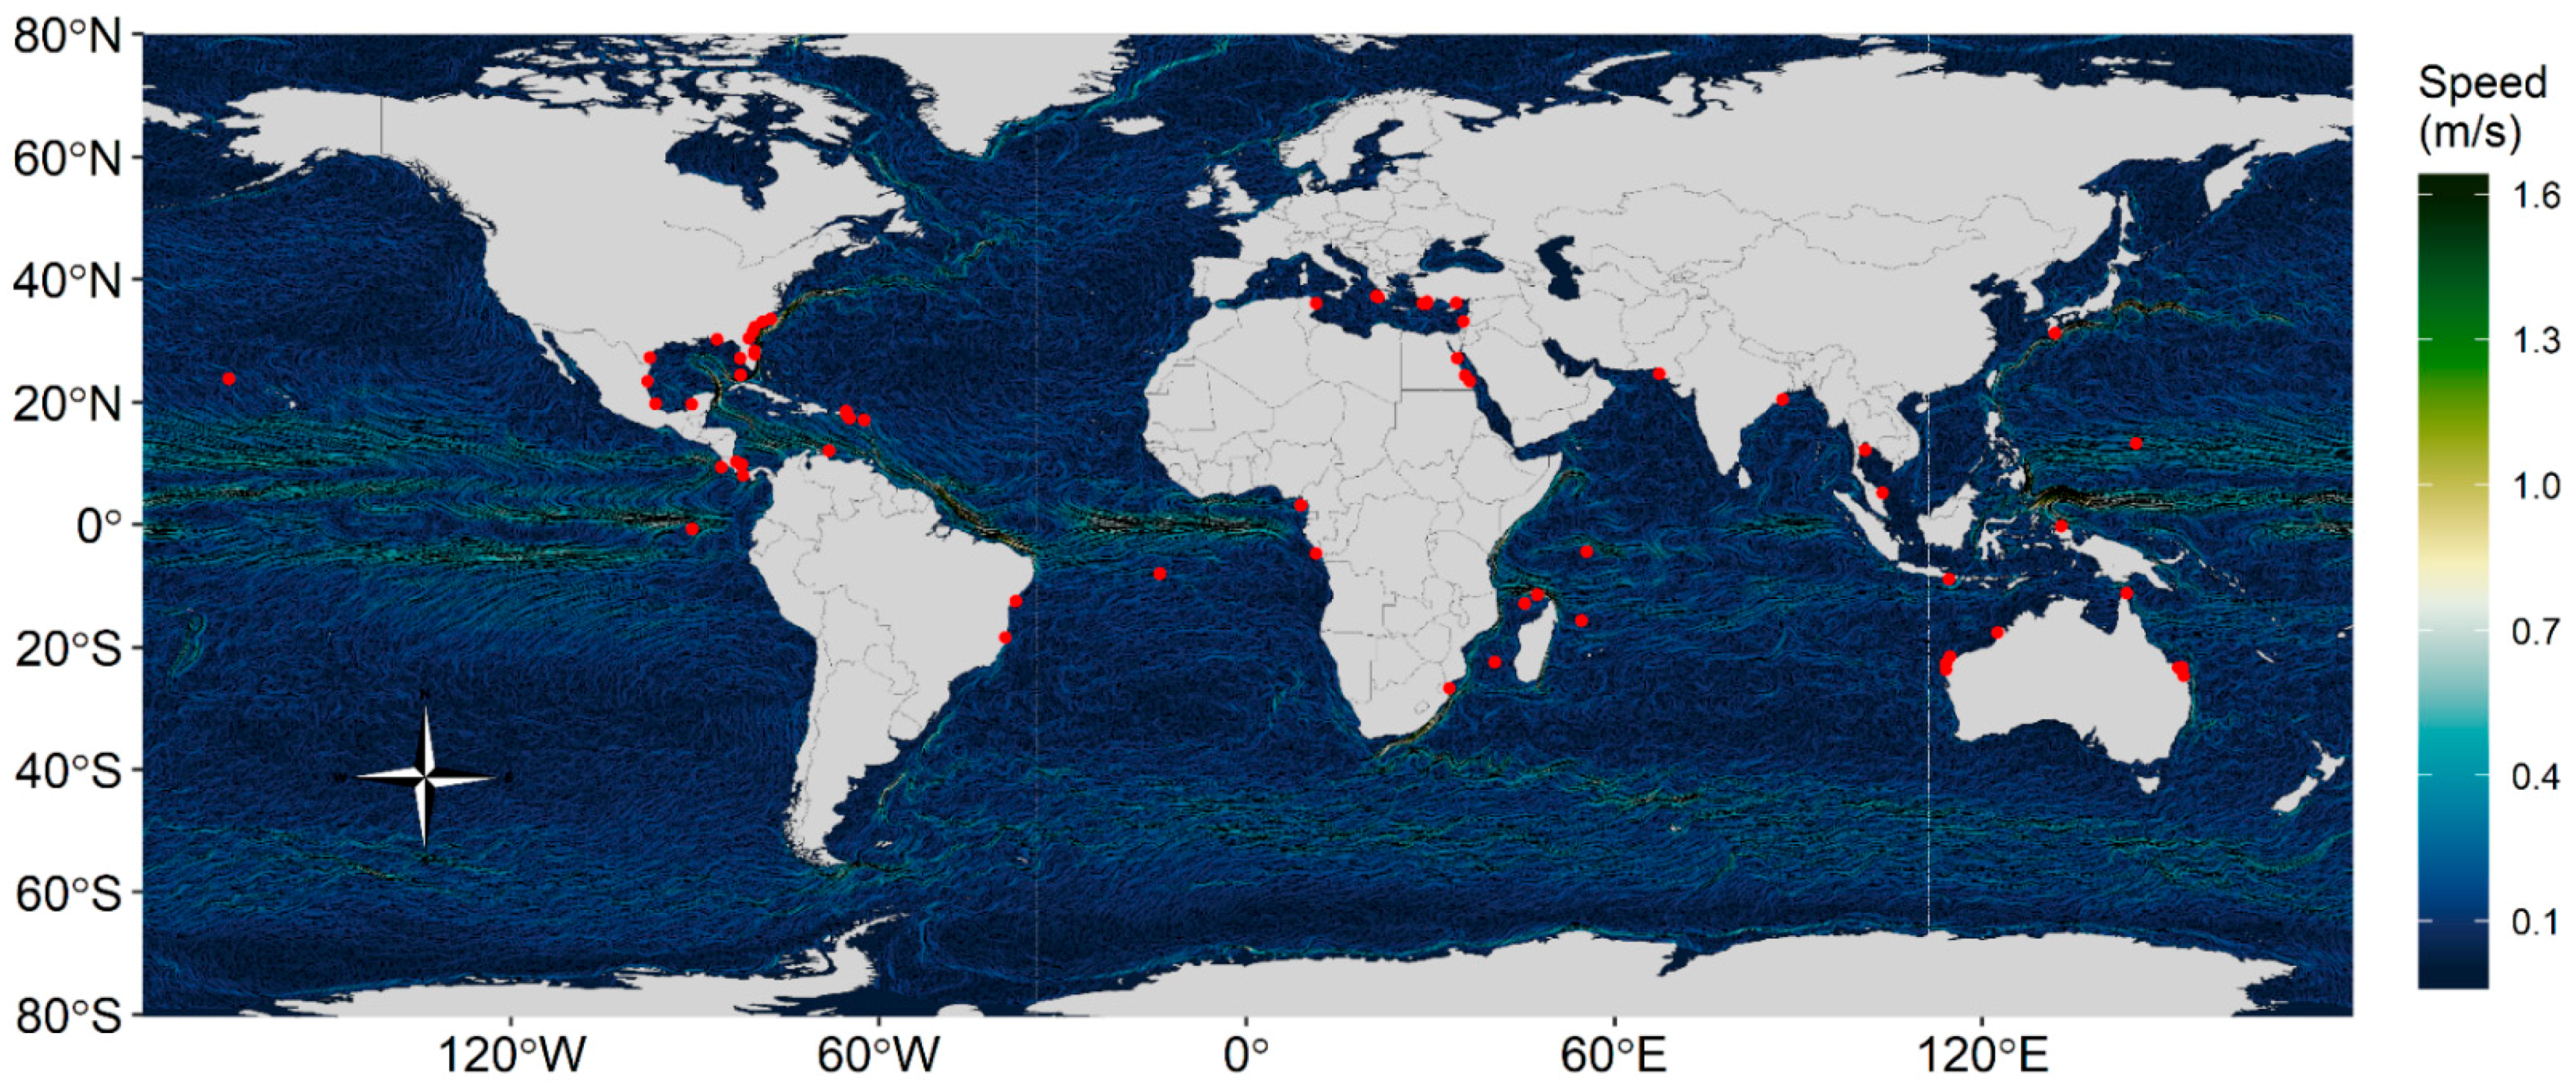
We simulated short term transport of hatchling sea turtles from 67 sites around the world (Figure 1). We chose sites that represented a diversity of countries and ocean regions including the Atlantic Ocean, the Pacific Ocean, the Indian Ocean, the Mediterranean Sea, the Caribbean Sea, and the Red Sea (Table 1 and Table A1 see Appendix A). Each of the seven species of turtles are represented by ≥3 sites and several sites represented multiple species. The loggerhead sea turtle, Caretta caretta, was represented by 28 sites, green sea turtle, Chelonia mydas, was represented by 24 sites, hawksbill sea turtle, Eretmochelys imbricata, by 15, leatherback sea turtle, Dermochelys coriacea, by 13, olive ridley sea turtle, Lepidochelys olivacea by 9, and Kemp’s ridley sea turtle, Lepidochelys kempii, and Flatback sea turtle, Natator depressus, by 3 sites each. The differing site representation is due to the relative numbers of nesting sites for each species globally. For each site, we chose a single point to represent the nesting area location (i.e., latitude and longitude). We also categorized the ocean region the site is located within and the type of coast (i.e., shallow islands, deep islands, or continental coasts).
2.3. Statistical Analysis
Transport Distance
We analyzed factors that could contribute to the variation in ocean transport distances for 67 sites worldwide, using the information-theoretic approach [32].
We included the year, ocean region, coast type, latitude, and longitude as factors in the model. The chosen factors represent large-scale spatiotemporal influences on transport [33]. Evaluating the yearly differences allowed us to examine inter-annual variability. The ocean regions are large basins with unique ocean currents and land mass obstructions, e.g., North Atlantic Ocean, Mediterranean Sea, Gulf of Mexico, etc. Coast type is a potential source of hatchling survival variability based on the bathymetry of the area surrounding the beach and the related predator density [34]. We defined coast type as either coastal, shallow island (within continental shelf), or deep island (off the continental shelf, usually mid-ocean). The geographic coordinates, i.e., latitude and longitude, allowed us to examine spatial trends on two gradients rather than by large units as in the ocean region factor. We analyzed both the transport distance and the standard deviation of transport distance as the response variables at our chosen temporal intervals (i.e., 1, 5, 10 and 30 days post-hatching).
Visual inspection of the residuals from a global linear model (which included all candidate explanatory variables) suggested deviation from a normal distribution and heteroscedasticity. Using variance inflation factors (VIF), we tested for collinearity of the explanatory variables. All variables had a VIF < 3, our a priori threshold, and all were included in the global model [35]. We checked the sites for spatial autocorrelation and found no evidence of spatial autocorrelation (based on Moran’s I test). Initial exploratory analyses and ACF plots of transport distance regressed with the spatial factors and year indicated the presence of temporal autocorrelation with a 25+ year lag. Including an autocorrelation structure in the model substantially increased the model fit. However, we were specifically interested in modelling year as a fixed effect so that it would be acted upon during the model selection process, so we did not include year as a random effect. Thus, we used a generalized linear model and a gamma distribution with a log link.
2.4. Model Selection
We used the information-theoretic approach to evaluate which of the chosen factors influenced hatchling transport distance. We used Akaike Information Criterion correction for small sample sizes (AICc) to rank potential models [32,36]. Models included in the confidence set were those with a ΔAICc ≤ 2. These models were considered to balance parsimony in the number of explanatory variables while achieving a good fit to the data. We used relative importance (the sum of the AICc weight of the models in the confidence set containing a variable) to evaluate the importance of variables [32]. We used evidence ratios to compare the probability of the top-ranked models against the intercept-only null model [32].
3. Results
3.1. Global Patterns of Mean Transport Distance
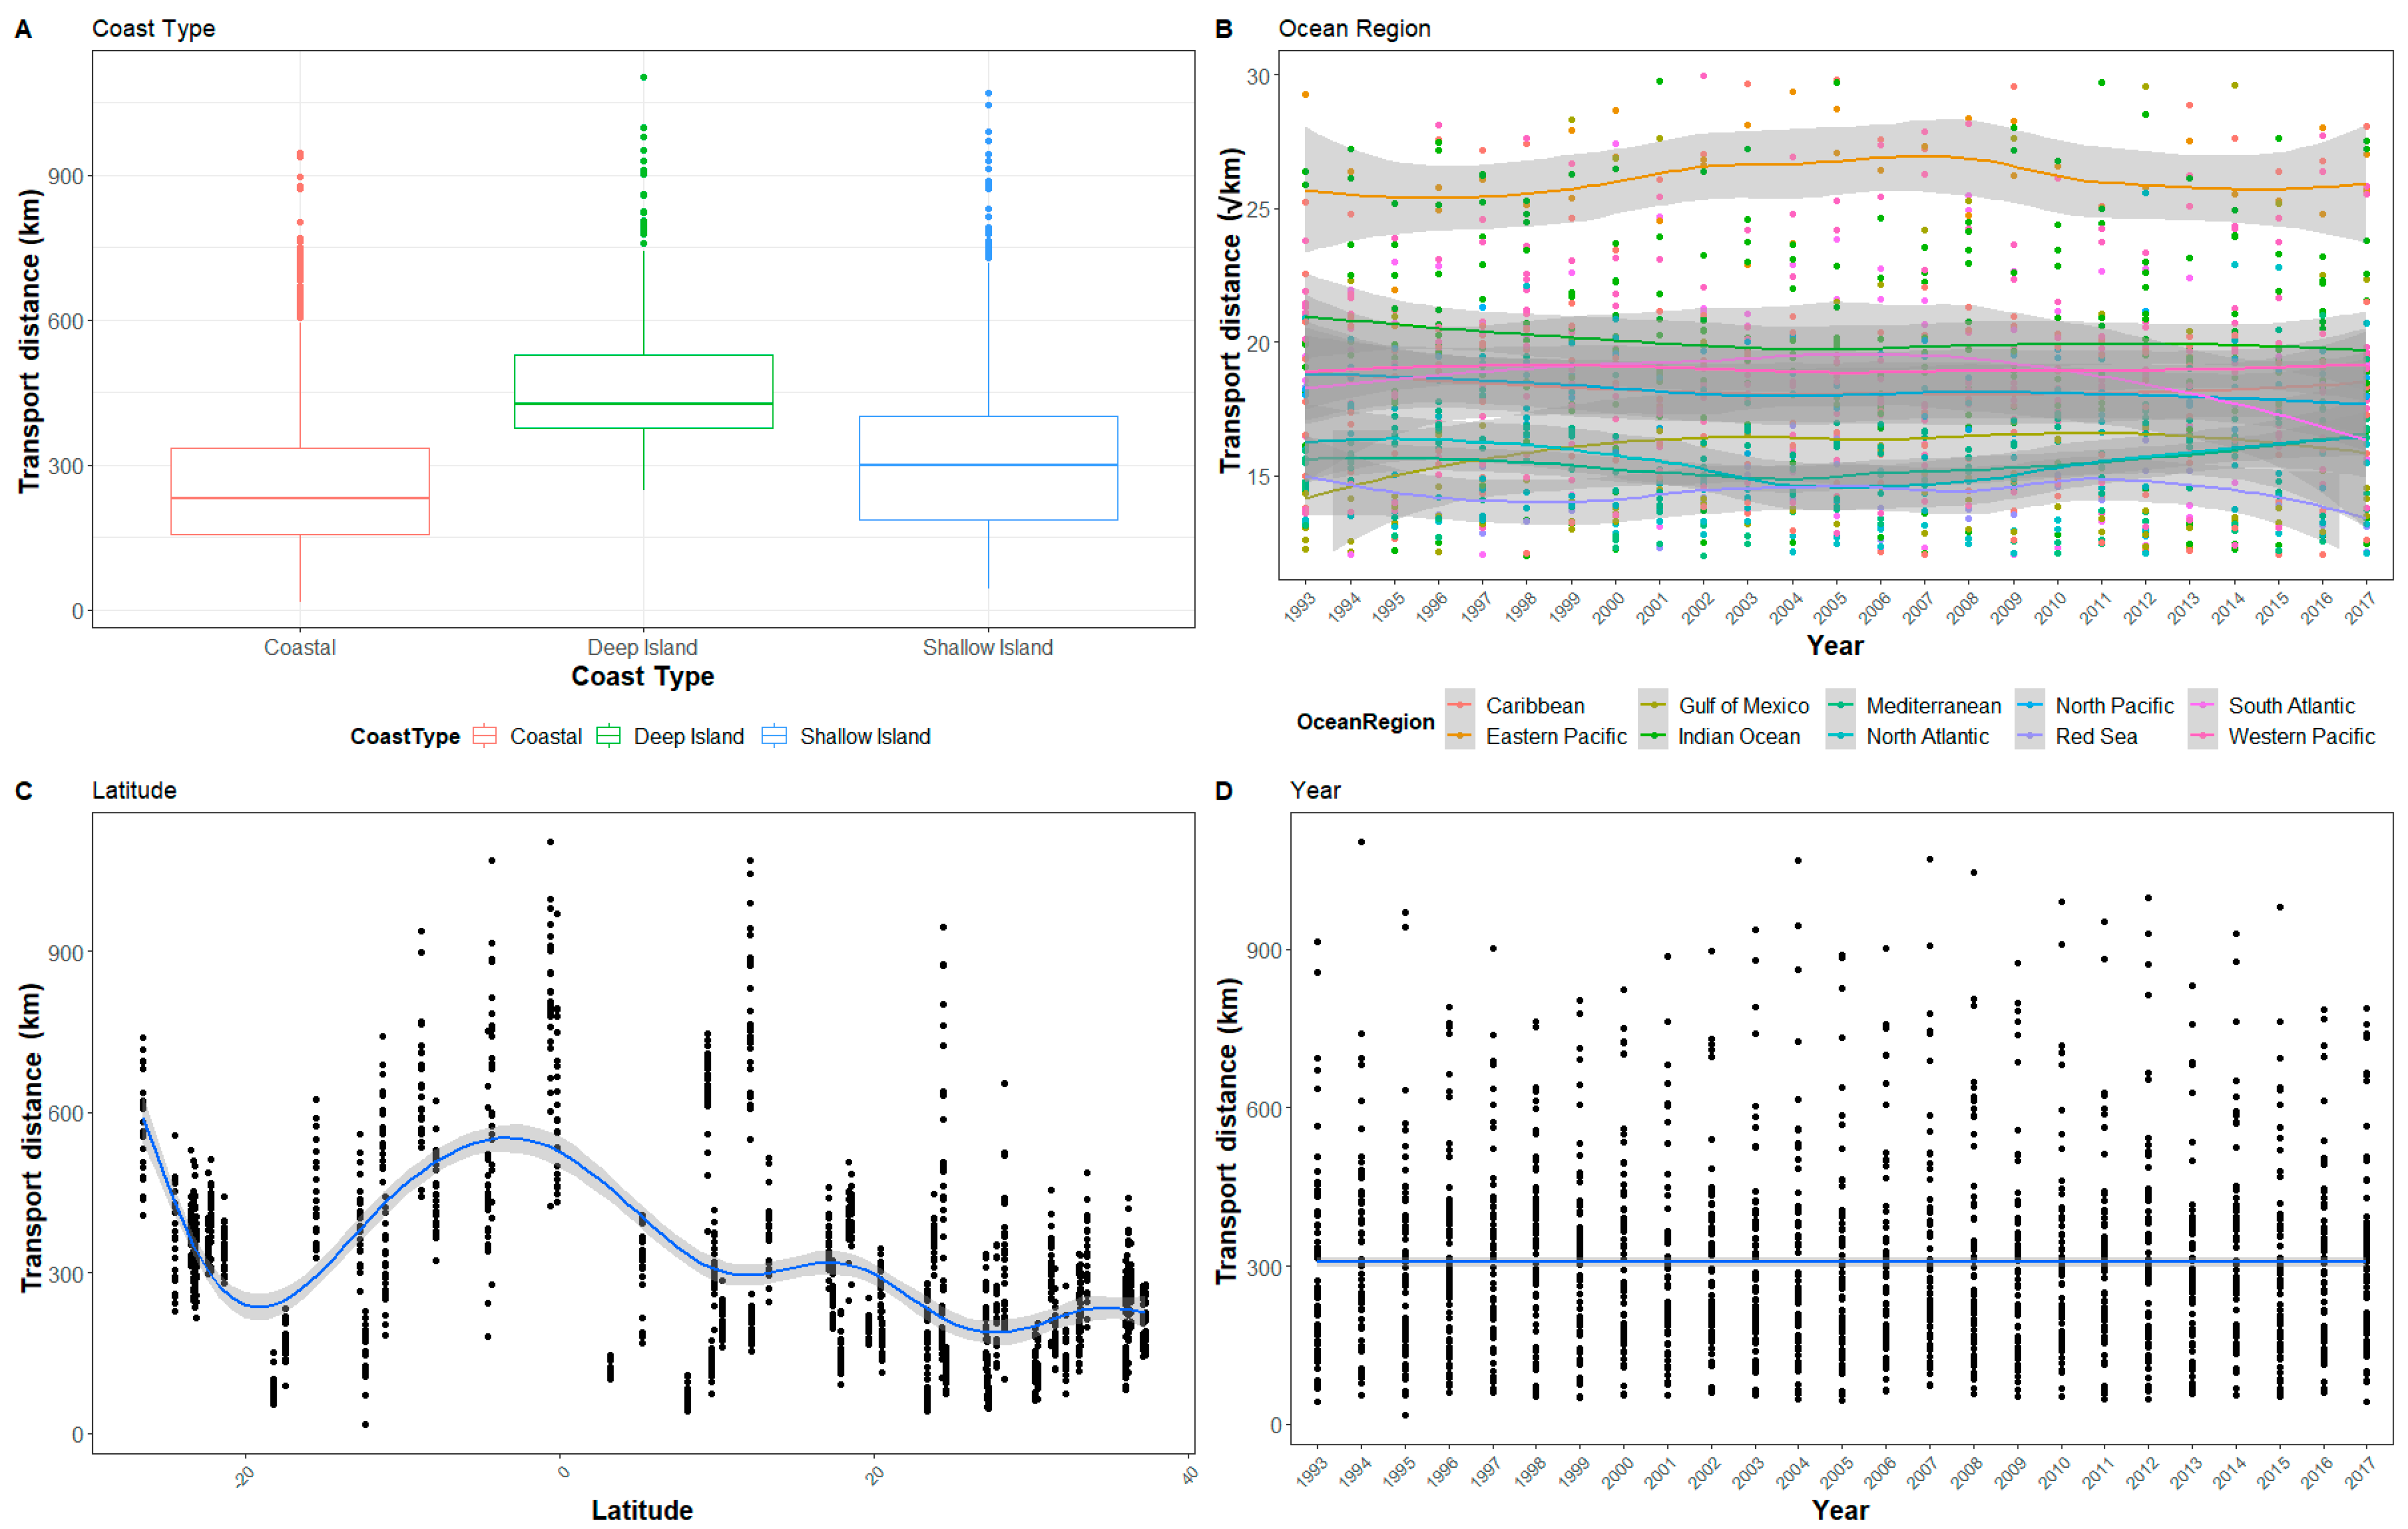
In general, the relationships with modeled ocean driven hatchling transport and the explanatory variables were similar for each period examined (1, 5, 10, and 30 days), but were most pronounced at 30 days. Therefore, while we will be presenting figures including all transport periods, we primarily discuss transport at at 30 days as the factors are most apparent at that interval (Figure 2). The range of the mean transport distance, using 30 days of hatchling transport from the nesting beaches, was 67 km (±64.66 km standard deviation (SD)) in Chiriquí, Panama to 817 km (±254.53 km SD) in the Galapagos Islands, Ecuador. Globally, the mean transport distance at 30 days across all sites was 307 km (±151.74 km SD). Though the variation between sites was generally more pronounced, the inter-annual differences in transport for specific nesting beaches also appeared to vary depending on how the currents shift at that location for any given year. For example, in Australia, Gnaraloo Bay and Ningaloo have similar transport. Due to the similarity in transport at the two sites and the yearly variation of each site, in some years, Gnaraloo Bay has higher transport, such as 1996, but in 1998 Ningaloo had higher transport.
Latitude, coast type, and ocean region were always included in the model confidence set for each transport period and each had a relative importance of 1.0 (Table 2). Transport distance was greatest in the tropical latitudes. Overall, southern hemisphere sites had greater transport distance than northern hemisphere sites, although the sites farther north had less variability in transport over time. This pattern in latitude holds true for the whole short-term transport period we simulated though with differing magnitudes (Figure A1, Figure A2 and Figure A3, see Appendix A).
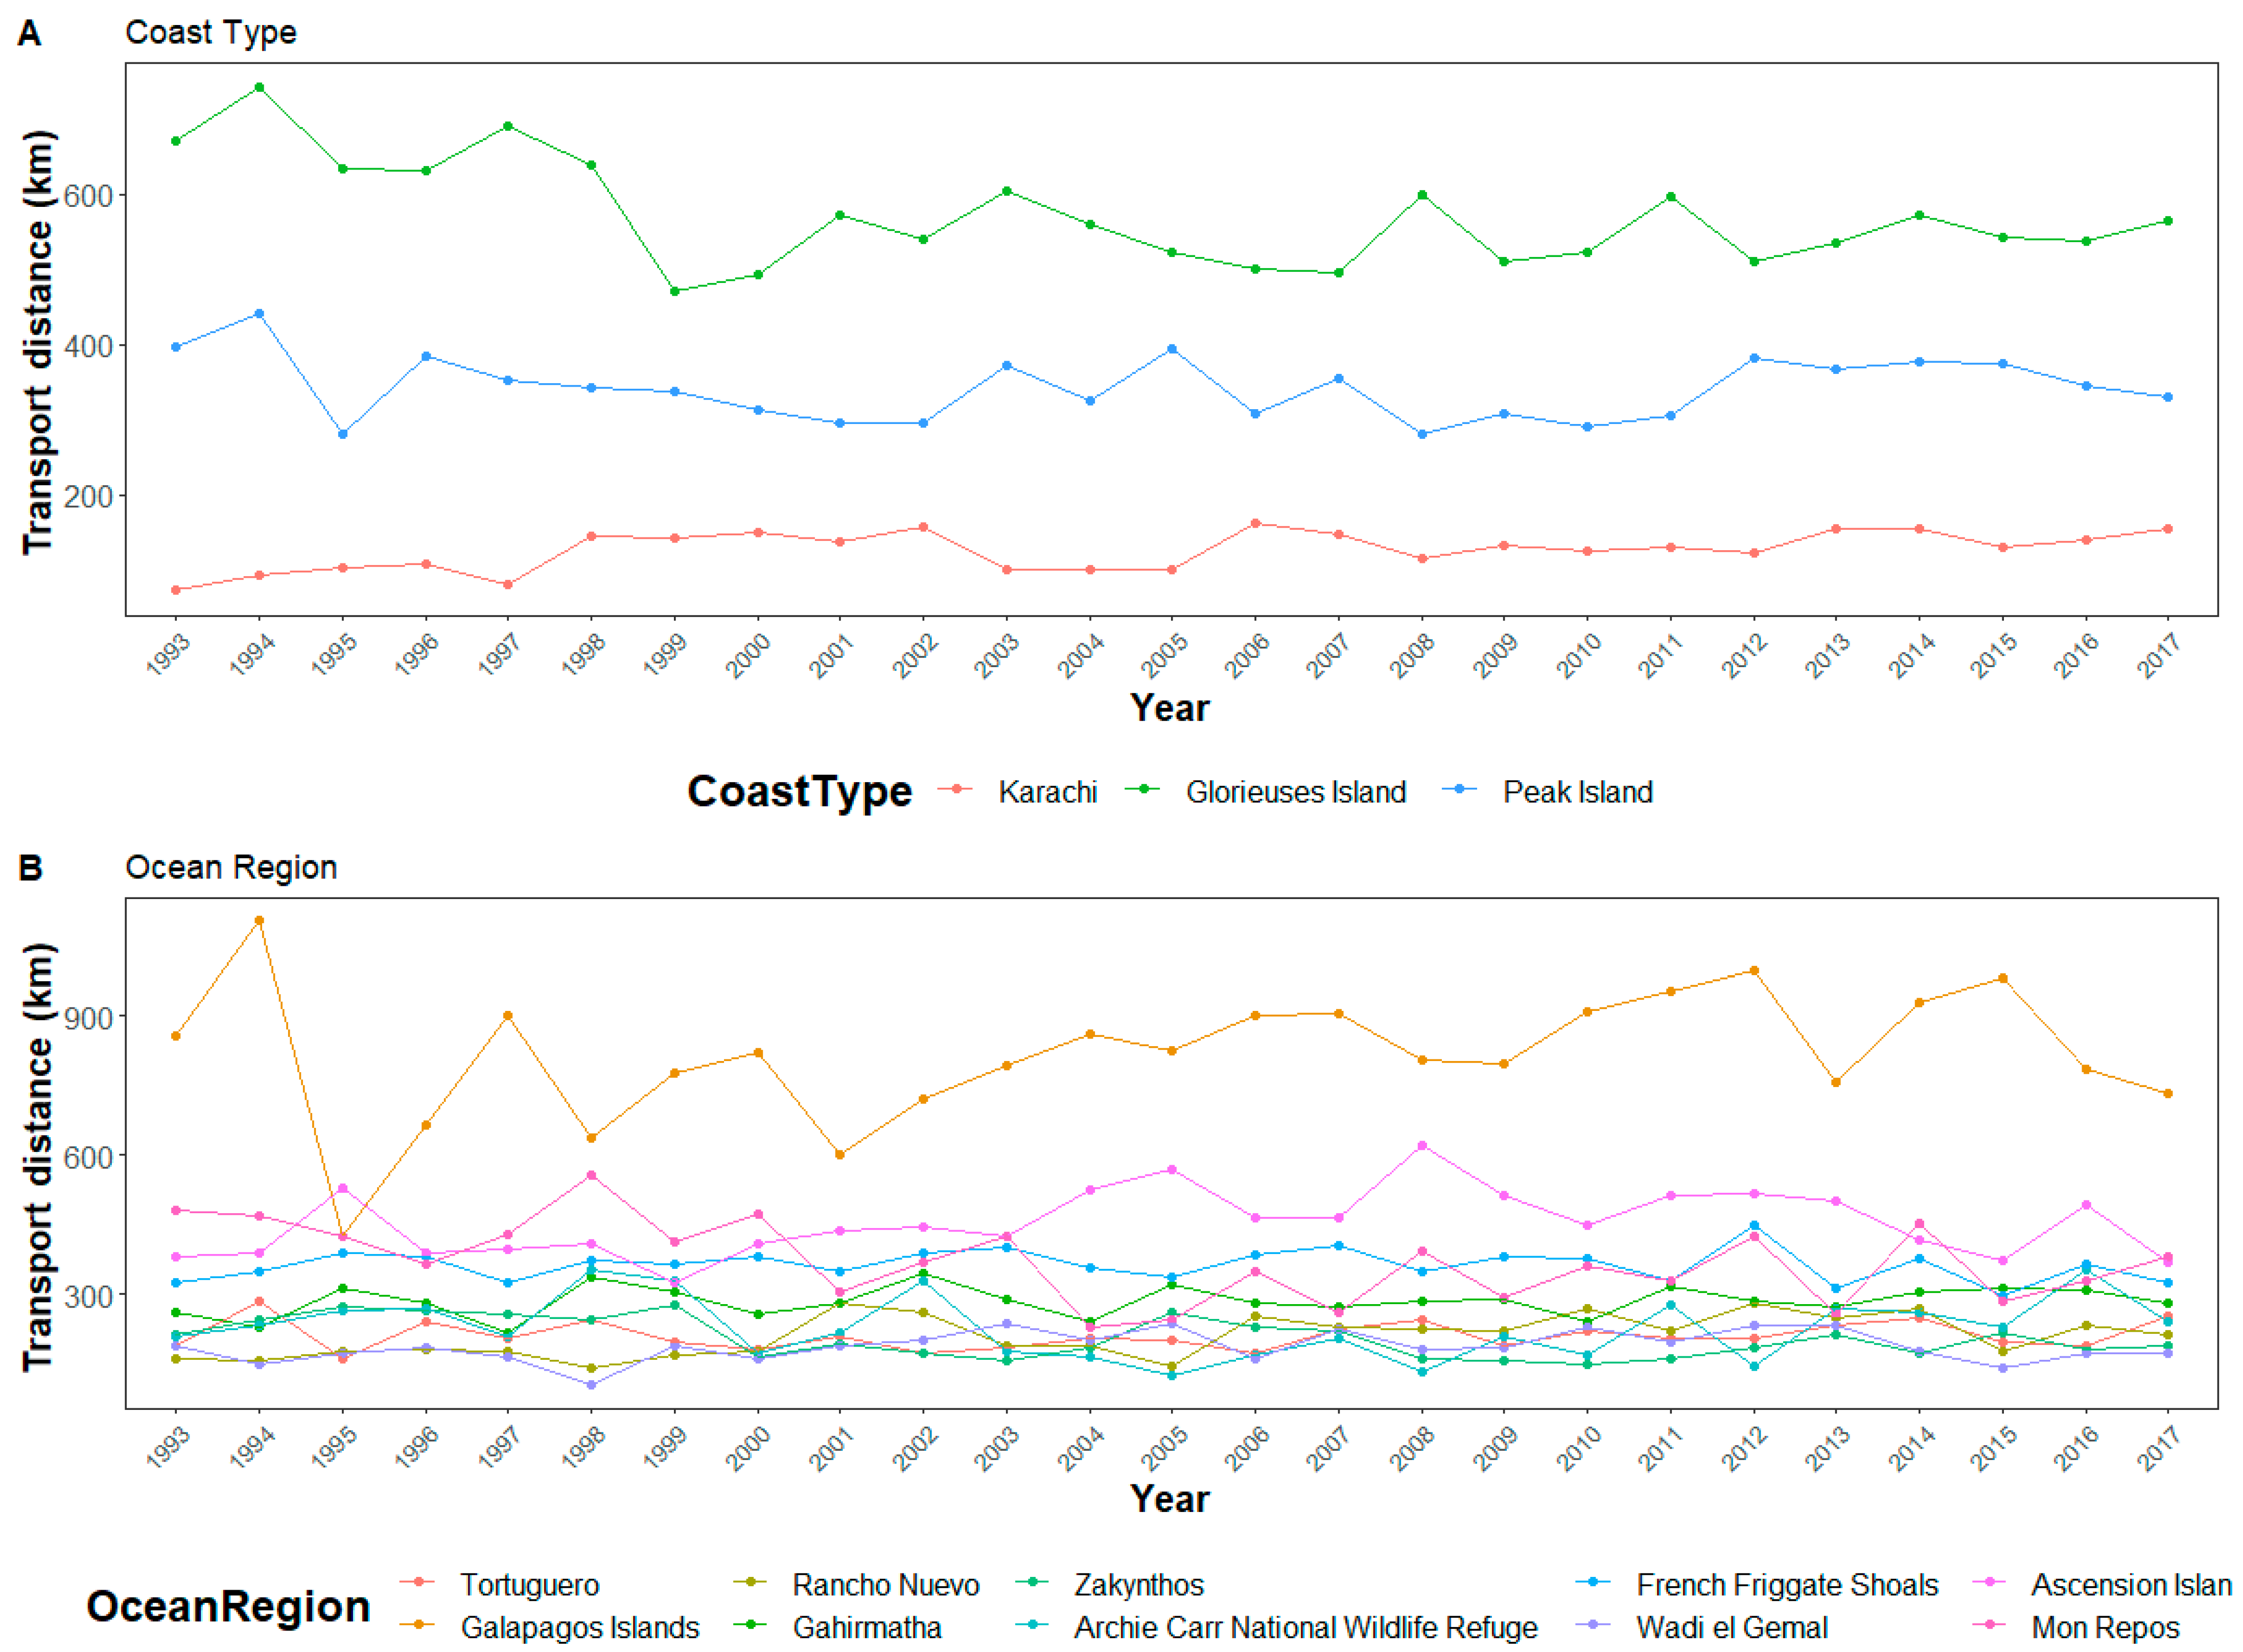
The coast type and ocean region were consistently present in the model confidence set (Table 2). Coast type was a factor in all of the models across all transport periods. Modeled transport from coasts was generally lower than transport from deep or shallow islands (Figure 2 and Figure 3). Deep islands had the highest transport distance, while shallow islands had slightly smaller average distances. Coastal sites never had the highest transport in any year. In contrast, there were only three years where shallow islands, rather than coasts, had the lowest transport distance.
The ocean region of each site was also an important factor in all of the models in the confidence set across all transport periods. The Red Sea, Gulf of Mexico, Mediterranean Sea, and North Atlantic Ocean tended to have the lowest transport, while the Eastern Pacific and Indian Oceans tended to have the highest (Figure 2 and Figure 4). Notably, despite the variability in transport distance at each site, the ocean regions had a relatively consistent mean transport distance relative to one another. The regions tended to have broad ranges with a large amount of overlap in values, but regions had consistent general ranges (Figure 2). Year and longitude appeared occasionally in the confidence set and had lower relative importance compared to latitude, coast type and ocean region.
3.2. Temporal Factors
There were distinct and extreme inter-annual fluctuations in the modeled transport distances of hatchling turtles. Shifts in ocean currents between years produced substantial fluctuations at individual sites (Figure 4). For example, the Galapagos Islands, Ecuador, changed from an average 30-day transport distance of 1103 km (±216 km) in 1994 to 423 km (±116 km) in 1995. Year did not, however, have a linear correlation with transport (Figure 2). Though inter-annual variation in currents impacted the transport from sites, there is no annual trend to suggest global changes in ocean currents effecting sea turtle transport within our study period.
3.3. Annual Variability in Hatchling Transport Distance
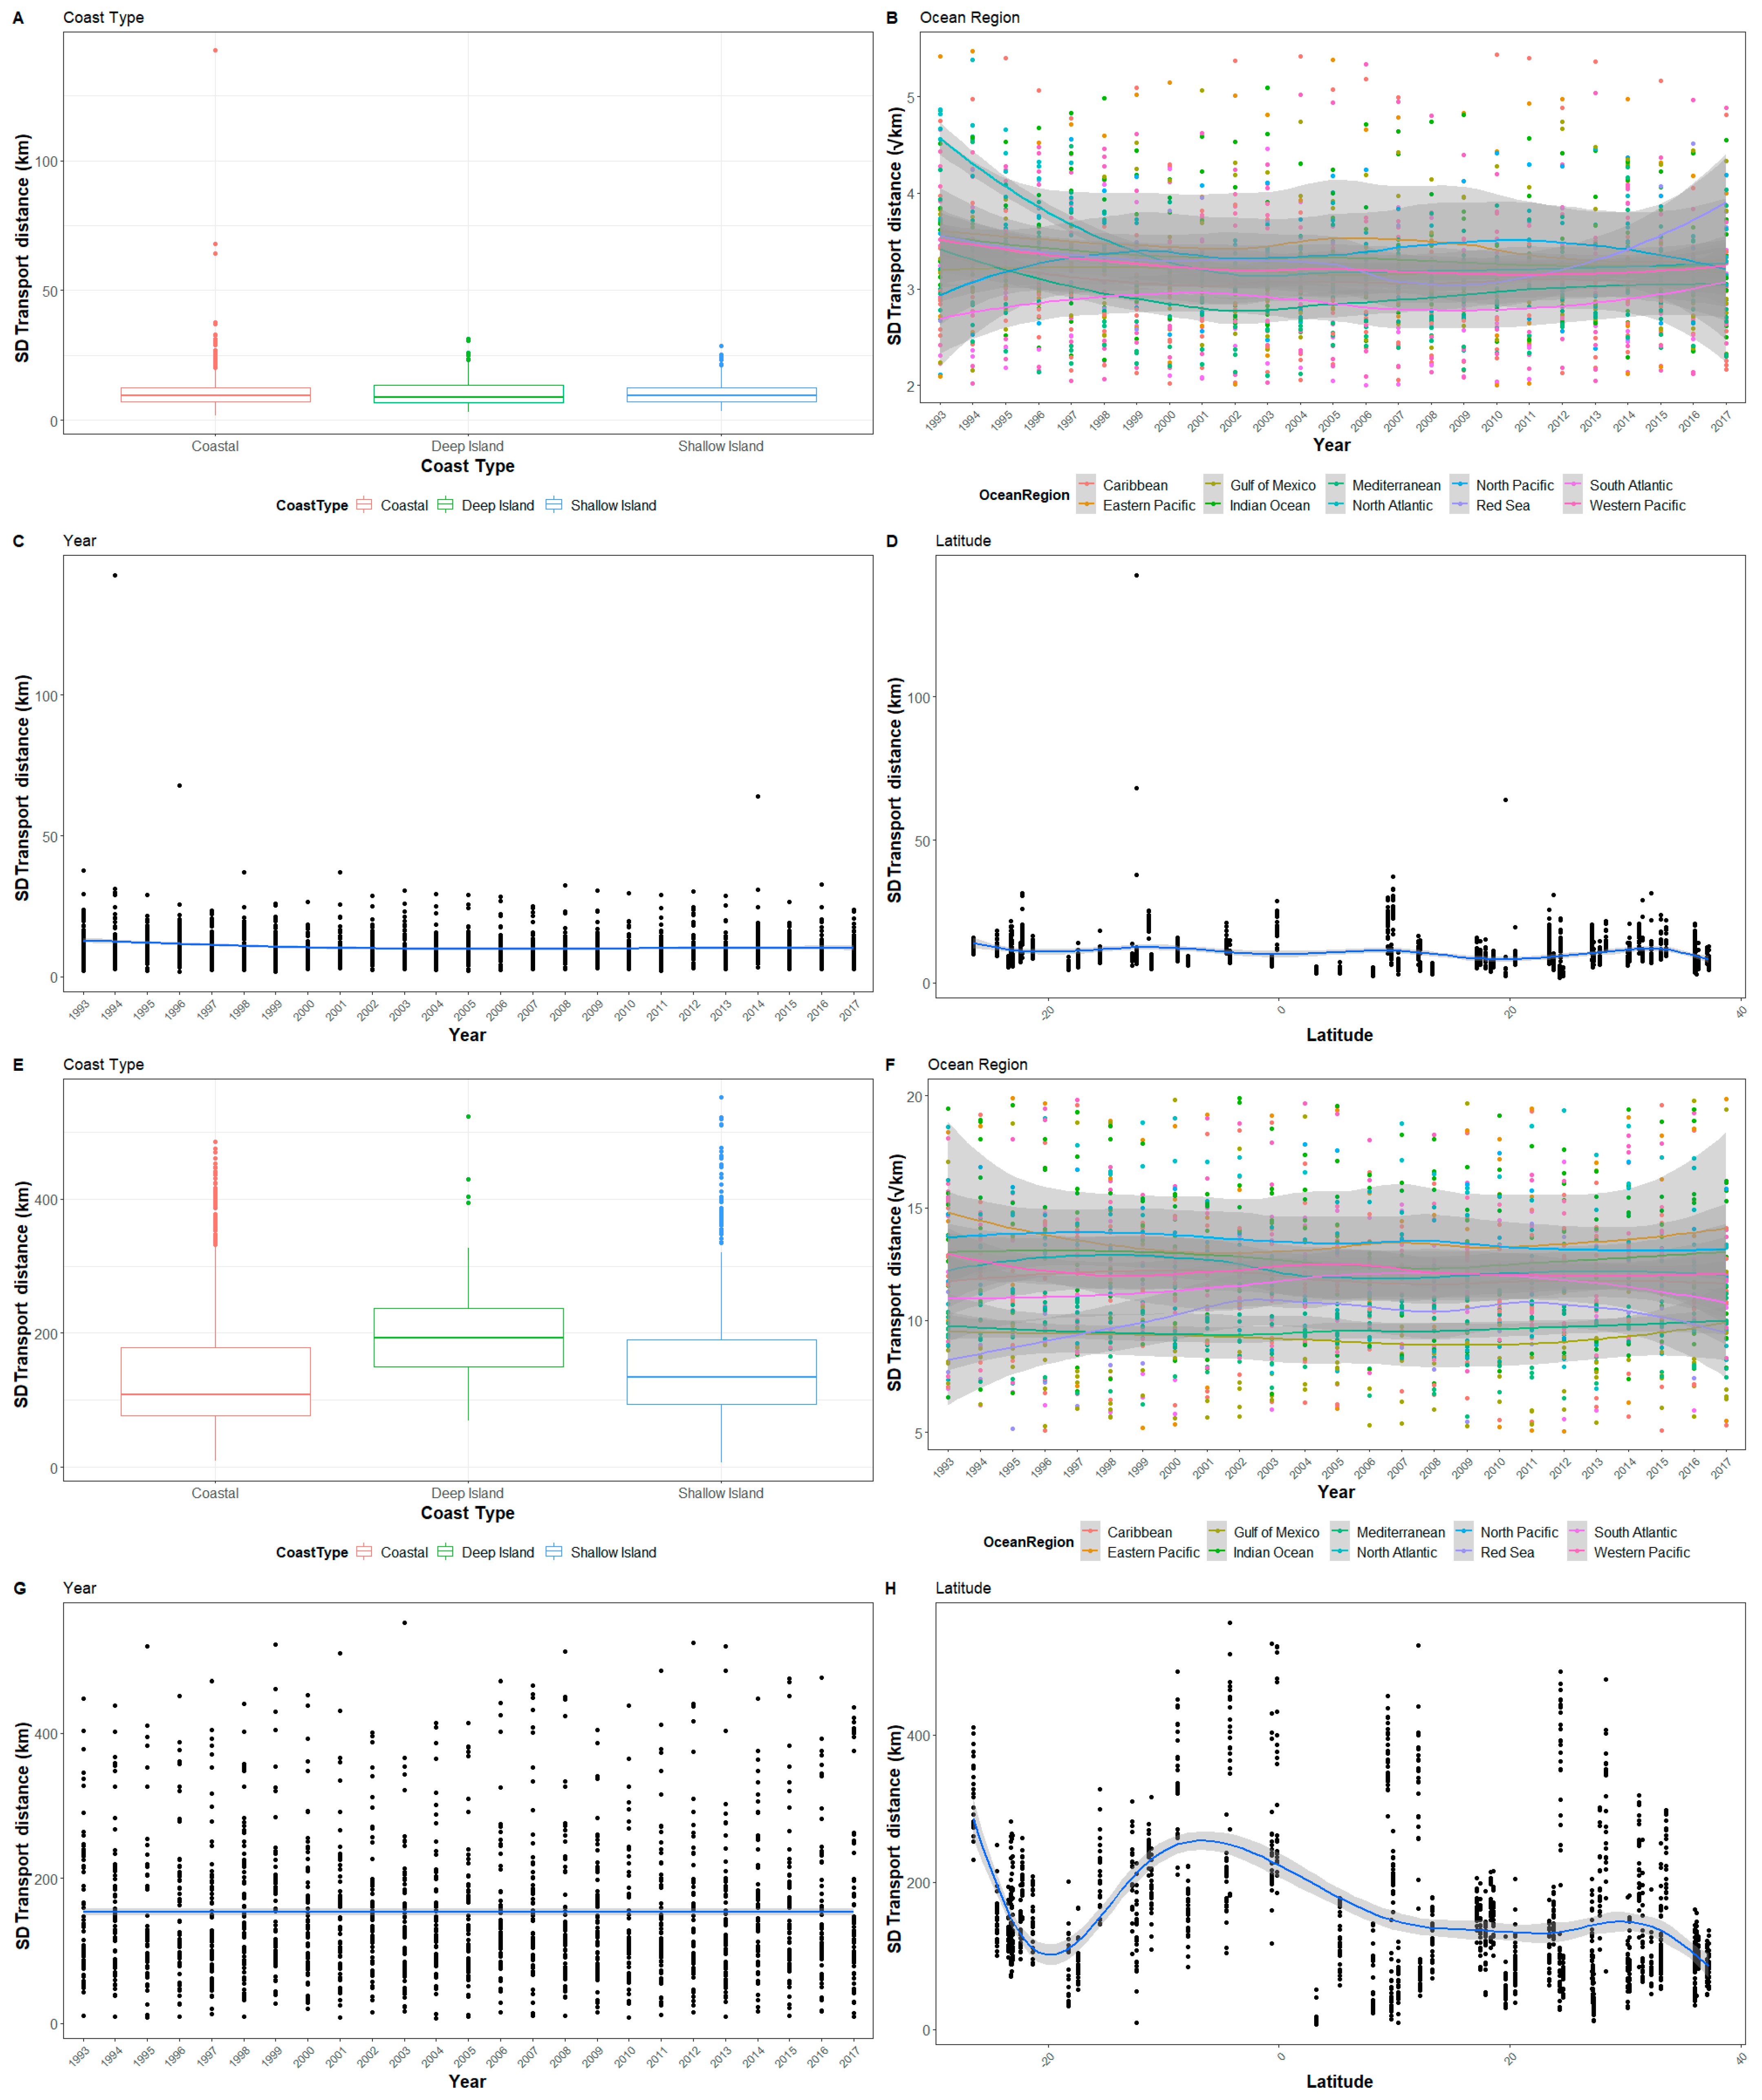
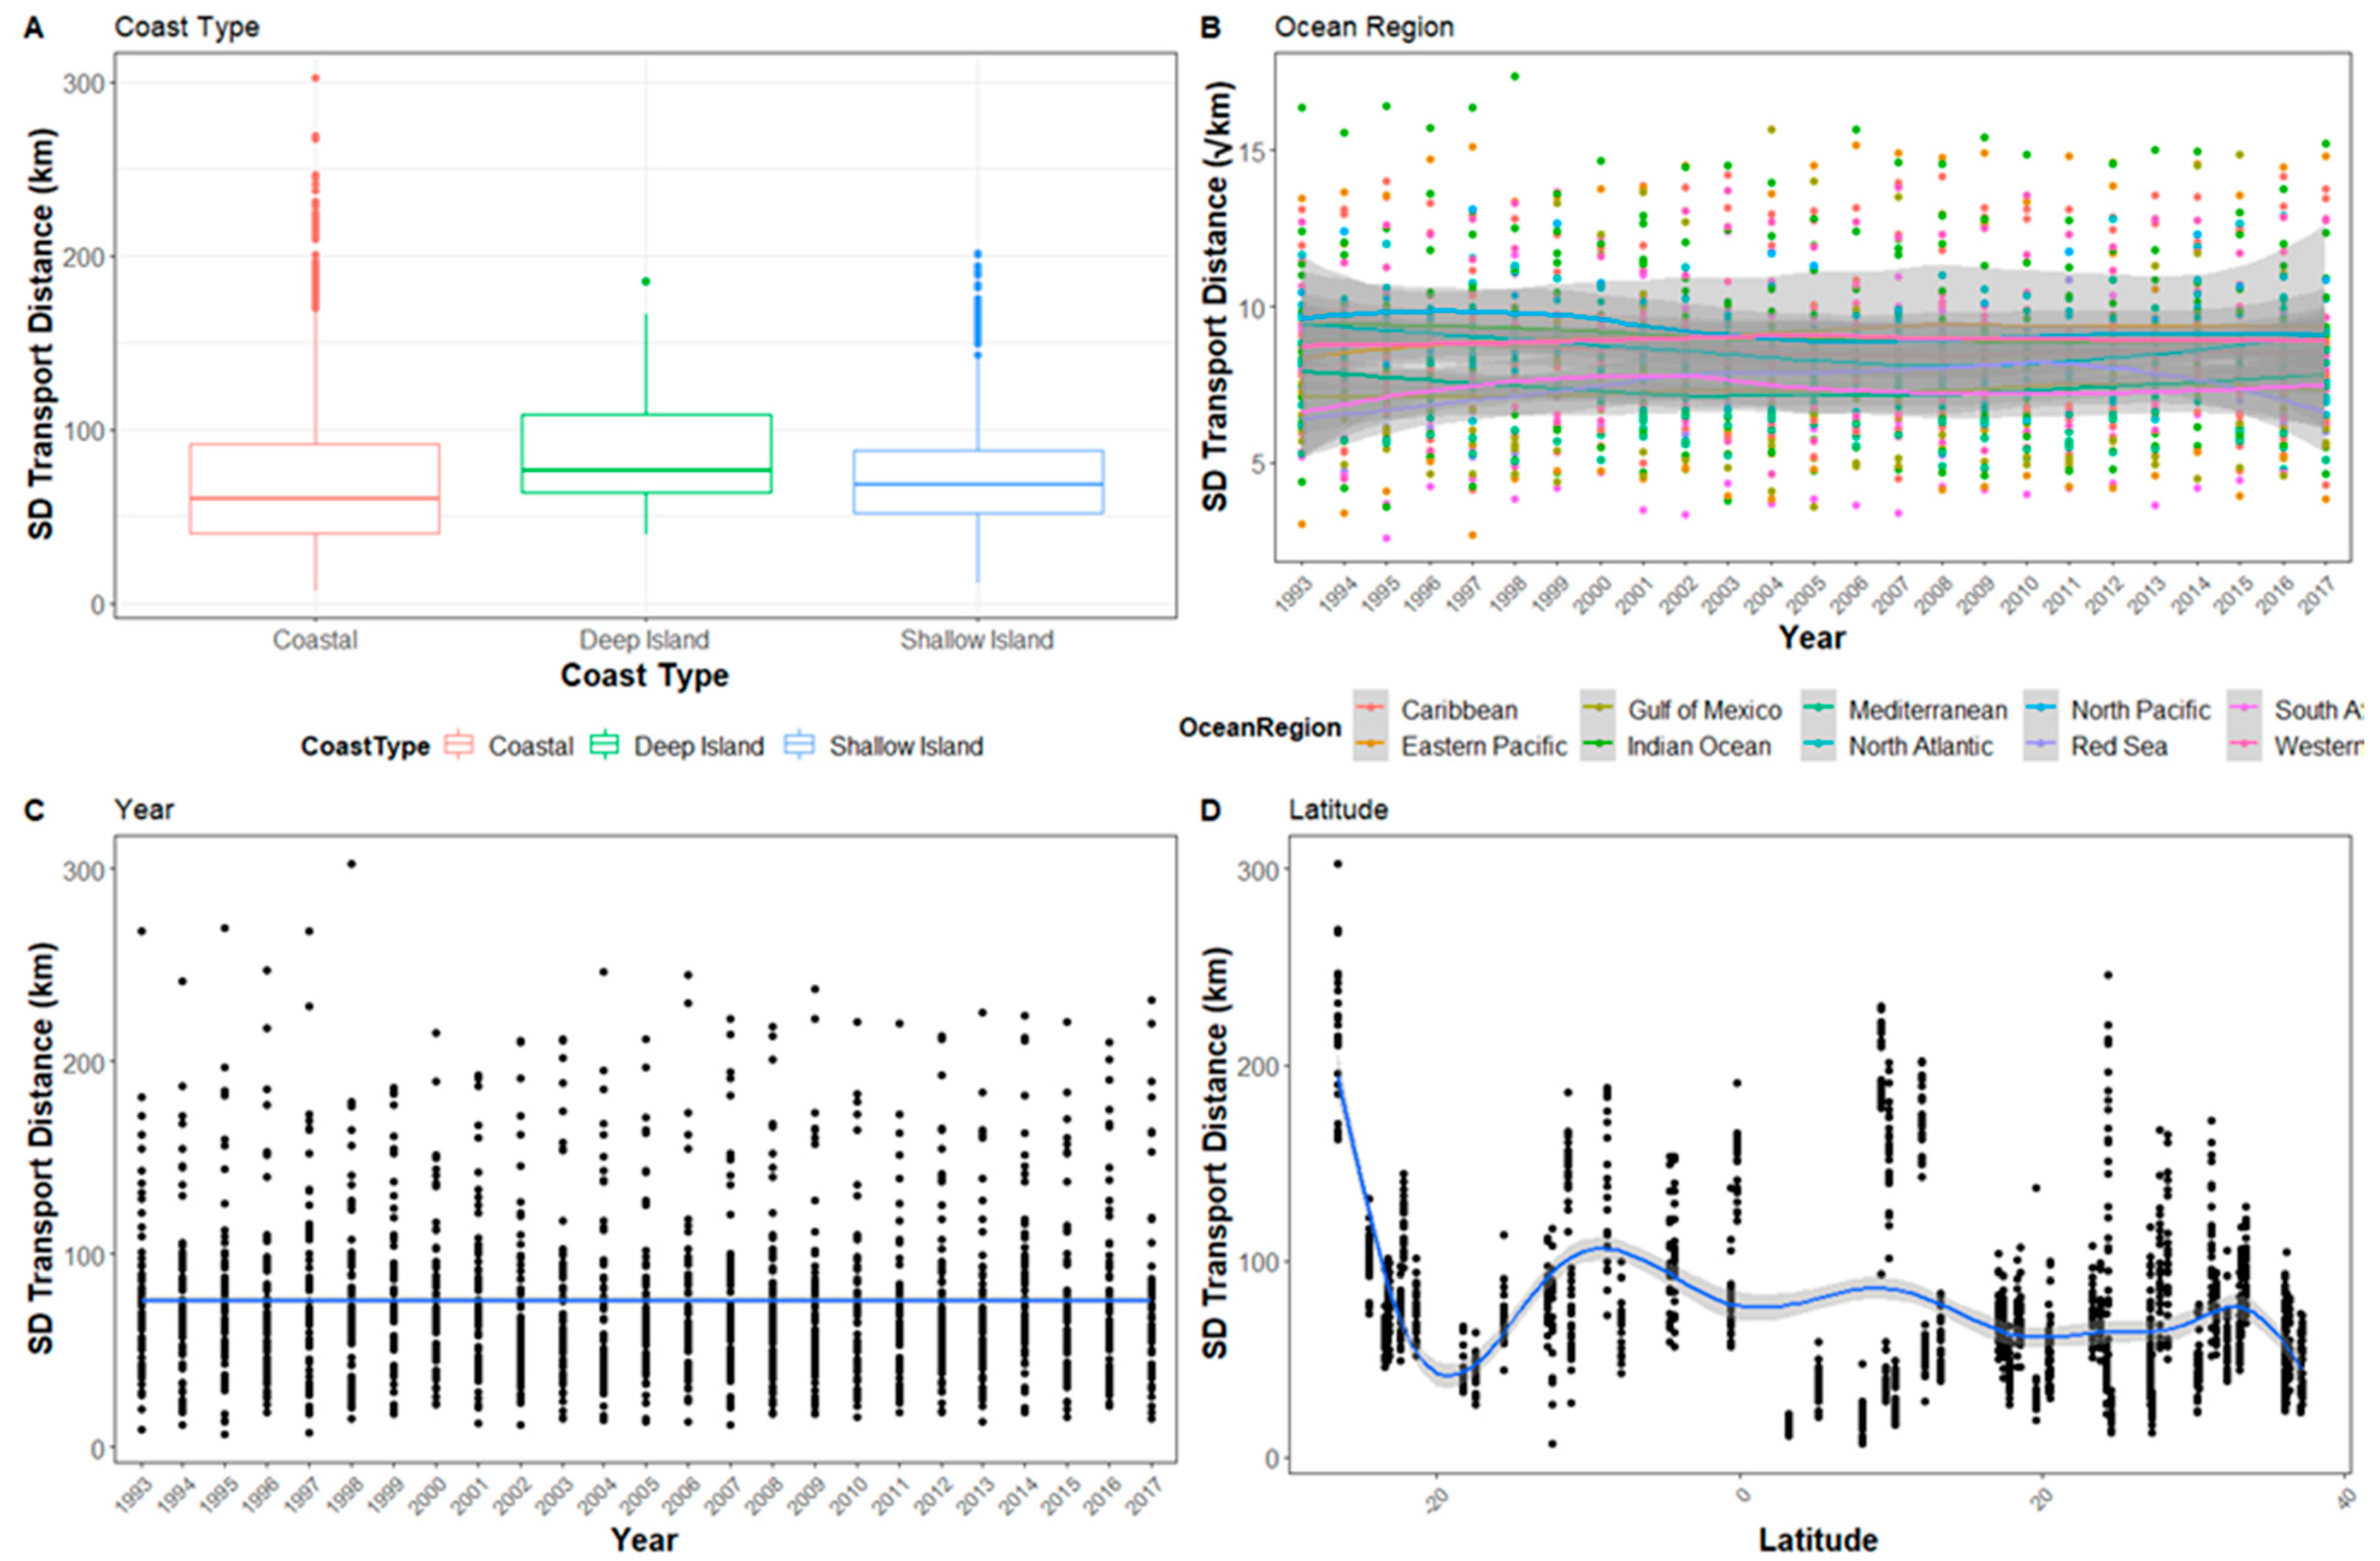
The patterns of variability of transport distances from each nesting beach had some notable patterns. First, variability in transport distance increased with the transport period (Figure 4, Figure A4 and Figure A5 see Appendix A). Second, coast types are not included in the confidence set until transport is measured for 10 days and is only present in all models in the confidence set after 30 days of transport (Table 2). Conversely to mean transport distance, year is present in all models of the confidence set at 1- and 5-days transport, and then nearly absent at 10- and 30-days (Table 2). Like mean transport distance, the ocean region and latitude were present in all models in the confidence set, with the Eastern Pacific having the highest standard deviation as well as the highest mean transport, while the Gulf of Mexico had the lowest standard deviation, and the Red Sea had the lowest mean transport distance (Figure 2 and Figure 4).
4. Discussion
Sea turtle conservation is a global issue due to their broad distributions, highly migratory nature, and long history of exploitation of all species [37]. Therefore, comprehensive assessments of their life history and ecology at the global scale are an important and valuable tool [37,38]. Ocean circulation models have been used to evaluate transport of simulated particles away from specific regions or beaches, particularly for purposes of evaluating hatchling swimming [8,39,40,41] and predicting distributions of hatchlings [42,43,44]. Ocean circulation models have also been used for such diverse studies as finding the best places to release rehabilitated turtles and studying migratory ontogeny [25,45]. However, a global analysis of hatchling transport across all oceans and species has not been performed at this scale to date. The global patterns we have presented here provide evidence that the offshore transport of hatchling sea turtles is highly variable and may have profound impacts on the population dynamics of these species [2,42]. The combination of high spatial and temporal variability across nesting beaches globally indicates that sea turtles may rely on the portfolio effect to act as a buffer against the years and locations that are suboptimal and facilitates the survival of the population as a whole, even if certain beaches fail to produce many hatchlings during certain periods [46,47,48,49].
4.1. Spatial Factors
Our modelling approach indicates that ocean region, coast type, and latitude all play important roles in ocean driven sea turtle hatchling transport. There are clear differences in transport distance across ocean regions. Accounting for the regional differences in hatchling transport and the status of adult sea turtles could improve conservation assessments for specific populations. For example, populations exposed to nest poaching or adult bycatch that also have low transport potential could be especially vulnerable, as the estimated number of hatchlings recruiting to pelagic habitats may be lower than the mean for that population. Thus, information on transport potential combined with other ecological information may provide insight into what aspects of conservation may be confounded by transport based mortality. For instance, nesting beaches on mainlands (coastal coast type) tend to have lower transport distances than either deep or shallow islands (Figure 2A), which might result in higher predation as hatchlings attempt to migrate offshore to nursery habitat [15,16,17]. In such a setting, efforts to reduce terrestrial predators may not ultimately result in increased hatchling survival because of this coastal mortality bottleneck. However, such efforts to reduce terrestrial predators on oceanic islands might create a more noticeable increase in overall population growth as hatchlings are poised to quickly recruit to nursery habitat [34]. While there is high spatio-temporal variability in transport distance, there are relatively predictable rankings in transport across the ocean regions (Figure 2B and Figure 4F), and which may provide insight into which populations might be more constrained by juvenile recruitment dynamics as compared to other stages of the sea turtle life cycle or by anthropogenic perturbations.
4.2. Temporal Factors
The year in which turtle hatchlings enter the sea from a nesting beach also influences transport distance, but not as frequently as the spatial factors. On a global scale, rather than a regional one, an annual trend is almost non-existent. Ocean currents are predicted to slow due to anthropogenic climate change [50]. However, in our 25-year analysis covering 67 nesting beaches, we do not see strong evidence of decreased hatchling transport from 1993 to 2017 (Figure 2). As offshore hatchling transport is an important factor contributing to neonate survival, this is encouraging information for these endangered and threatened species. Interestingly, several basins show inter-annual fluctuations that are likely consistent with large-scale fluctuations and climatic patterns within those regions. For example, the low transport fluctuation in the Eastern Pacific corresponds to the strong El Niño in 1997–1998, while the high transport fluctuation corresponds to the strong La Niña in 2007–2008 (Figure 2).
When sites are examined individually, there is considerable inter-annual variation in hatchling transport distances across the nesting beaches. Our research also indicates that no beach is characterized by consistently high or low current intensity. Thus, hatchling survival is also probably highly variable. As no site is “always” ideal, adult females are long-lived and nest over many years, and natal homing likely includes a broader area than traditionally assumed [51], it is likely that some diversity in nesting locations would be indefinitely maintained in the population. Even locations that tend to be unfavorable may have some years where hatchling cohorts are successfully transported to favorable habitat.
The high degree of inter-annual variation in hatchling transport underlines the importance of long-term studies to properly evaluate sea turtle conservation status. Basing hatchling survival estimates on a field study carried out in a single year may inadvertently skew the estimate based on the ocean currents at that time. In all, yearly differences matter just as much as regional ones when estimating population trends and evaluating management strategies. Furthermore, through the first month of transport, the influence of the spatial and temporal factors on hatchlings only intensifies from day one to thirty (Figure 2). An advantageous set of circumstances at hatching begets an expedited journey to the safety of the open ocean for the duration of early transport (Figure 3). Ultimately, this temporal variability may result in disproportionate contributions of sea turtle juvenile recruits from certain beaches within populations.
4.3. Model Uses, Future Directions, and Caveats
All sea turtles are threatened by anthropogenic activities [38,52,53]. Managing and protecting populations has become vital in the effort to increase populations, and in some populations, recovery is evident [37]. Population models help researchers and managers estimate the population size, recovery time, and how to best protect the species [54,55,56]. To correctly model populations, accurately estimated life history traits are necessary, including hatchling survival [56,57,58]. Presently, many population models use a static value determined by mark-recapture studies, internal model fitting, life tables, or data sharing from other more studied species for good reason [54,59,60,61]. Currently, it is logistically challenging, if not prohibitive, to estimate the survival of an entire hatchling cohort or track them via satellite before they reach a size almost twice the length of newly born turtles [62,63]. However, understanding how the environment plays a role in determining when a hatchling reaches the relative safety of the open ocean could help parameterize population models with a more accurate value relative to the “normal” performance of the beach or the region. Understanding that not all natal beaches are equal, in terms of transport, and ultimately hatchling survival, may help scientists to tailor models and management more specifically to better direct efforts to the maximum effect for these turtles. However, there are additional factors to be considered, such as region-specific threats to turtles, and specific conservation actions that were beyond the geographical scope of this paper. Furthermore, a nesting beach with ideal physical conditions could still have a negative growth rate, if the turtles in the area have increased mortality that outweighs the benefits of the hatching beach as anthropogenic threats can impact populations to extreme degrees [38,64].
Future steps in understanding the factors affecting hatchling transport would relate the short-term survival of hatchlings from several of the sites to the speed of local ocean currents and predicted transport distance. Acoustic tagging for longer periods would be useful to estimate survival for neonate turtles, though, perhaps, logistically complicated to implement [14,65,66]. Acoustic tagging has recently been used to estimate hatchling mortality as well, a more technologically advanced, and possibly more accurate, method than that used in the past [17]. As our model did not include swimming turtles, only the environmentally based movement, tagging and tracking would help improve the model estimates of movement along with mortality. Additionally, relating the population abundance or growth to the transport distance could validate the connection between high transport distance and higher hatchling survival and recruitment into the adult population. However, this relationship could be confounded by sources of mortality for later age classes, such as bycatch. The survival of large juveniles and sub-adults has a greater impact on population growth rate, as these age classes are poised to contribute to reproduction, yet survival is still lower than adults [54]. However, these studies did not consider the range or magnitude of hatchling survival, temporal variability, or density-dependence in neonate production. Using a modeling approach to estimate hatchling transport is a cost effective and simple tool that, particularly if paired with field studies in the future, can improve demographic models and conservation planning.
Author Contributions
Conceptualization, M.J.D., N.F.P. and S.E.P.; methodology M.J.D., N.F.P. and S.E.P.; formal analysis; M.J.D., S.E.P.; writing—original draft preparation, M.J.D.; writing—review and editing, M.J.D., N.F.P. and S.E.P.; visualization, M.J.D. All authors have read and agreed to the published version of the manuscript.
Funding
M.J.D. was supported by the University of West Florida Department of Biology assistantship, the University of West Florida PACE Scholarship, and the University of West Florida Hal Marcus College of Science and Engineering grant. Additionally, funding to present this study has been provided by the International Sea Turtle Symposium travel grant and the University of West Florida Student Government Association. S.E.P. and M.J.D. were partially supported under startup funding from the University of West Florida.
Institutional Review Board Statement
Not applicable.
Informed Consent Statement
Not applicable.
Data Availability Statement
Data is available at doi:10.5281/zenodo.4587366.
Acknowledgments
We would like to thank Madison Clark for her contributions creating configurations for nest site simulations. We thank the HYCOM Consortium and Ichthyop for making their data and software freely available.
Conflicts of Interest
The authors declare that the research was conducted in the absence of any commercial or financial relationships that could be construed as a potential conflict of interest.
Appendix A

Table A1.
Nesting beach sites included in the study, organized alphabetically by Ocean Region and then by country as in Table 1. Each site is listed with the coordinates of the center of the release zone.
Table A1.
Nesting beach sites included in the study, organized alphabetically by Ocean Region and then by country as in Table 1. Each site is listed with the coordinates of the center of the release zone.
| Site | Latitude (Decimal Degrees) | Longitude (Decimal Degrees) |
|---|---|---|
| Long Island, Antigua | 17.1542 | −61.7542 |
| Tortola, British Virgin Islands | 18.6208 | −65.6167 |
| Klein Bonaire Beaches, Caribbean Netherlands | 12.15 | −68.3014 |
| Cahuita National Park, Costa Rica | 10.15 | −82.8875 |
| Grandoca, Costa Rica | 10.4236 | −82.5903 |
| Tortuguero, Costa Rica | 10.5403 | −83.4903 |
| Culebra Island, Puerto Rico | 18.4667 | −65.45 |
| Fajardo-Luquillo, Puerto Rico | 18.8681 | −65.6903 |
| St. Croix National Wildlife Refuge, US Virgin Islands | 17.0667 | −65.3042 |
| Ostional, Costa Rica | 9.0667 | −86.1681 |
| Galapagos Islands, Ecuador | -0.6 | −90.7 |
| Chiriqui, Panama | 8.1875 | −82.3042 |
| Dry Tortugas-Loggerhead Key, US Florida | 24.6181 | −82.9208 |
| Gulf Islands National Sea Shore, US Florida | 30.3514 | −86.0667 |
| Siesta Key, US Florida | 27.25 | −83.0014 |
| Campeche, Mexico | 20.0847 | −90.7875 |
| Rancho Nuevo, Mexico | 23.6167 | −98.2667 |
| Veracruz, Mexico | 20.8 | −97.0167 |
| Padre Island, US Texas | 27.3847 | −97.5833 |
| Cable Beach, Australia | −17.7403 | 122.0167 |
| Gnaraloo Bay, Australia | -23.8 | 114.0347 |
| Ningaloo, Australia | −22.6736 | 114.1542 |
| Peak Island, Australia | −21.6014 | 114.4903 |
| Europa Island, French Southern Territories | −22.3667 | 40.2875 |
| Glorieuses Island, French Southern Territories | −11.5042 | 47.2069 |
| Tromelin Island, French Southern Territories | −15.8681 | 54.5208 |
| Gahirmatha, India | 20.7375 | 87.0069 |
| Mayotte, Mayotte | −13.1875 | 45.1542 |
| Ponta do Ouro, Mozambique | −26.8542 | 32.1333 |
| Karachi, Pakistan | 24.9736 | 67.6569 |
| Silhouette Island, Seychelles | −4.4903 | 55.2236 |
| Kyparissa Town, Greece | 37.0833 | 21.4167 |
| Zakynthos, Greece | 37.4172 | 21.5833 |
| El Mansouri, Lebanon | 33.1736 | 35.15 |
| Kurait, Tunisia | 36.0181 | 11.1333 |
| Dalyan Beach, Turkey | 36.0347 | 28.8681 |
| Fethiye Beach, Turkey | 36.0833 | 29.2403 |
| Goksu Delta, Turkey | 36.2569 | 34.5375 |
| Patara Beach, Turkey | 36.5347 | 29.2708 |
| Archie Carr National Wildlife Refuge, US Florida | 28.3375 | −80.5014 |
| Amelia Island, US Florida | 30.6 | −81.4014 |
| Canaveral Air Force Station, US Florida | 28.4833 | −80.5181 |
| Wassaw, US Georgia | 31.85 | −80.9181 |
| Bald Head Island, US North Carolina | 33.8542 | −78.1347 |
| Huntington Beach State Park, US South Carolina | 33.0667 | −79.0375 |
| Hunting Island SP, US South Carolina | 32.35 | −80.4736 |
| French Frigate Shoals, US Hawaii | 23.1333 | −166.45 |
| Miyazaki, Japan | 31.3514 | 131.5708 |
| Jazā'ir Jiftūn, Egypt | 27.2208 | 34.1208 |
| Wadi el Gemal, Egypt | 24.05 | 35.5569 |
| Zabargad, Egypt | 23.6 | 36.1833 |
| Ascension Island | −8.4333 | −14.5014 |
| Bahia, Brazil | −12.5736 | −38.3181 |
| Espirito Santo, Brazil | −18.4167 | −39.85 |
| Congo Coast, Congo | −4.9736 | 11.2236 |
| Bioko Island, Guinea | 3.4 | 9.0236 |
| Heron Island, Australia | −23.4347 | 151.9014 |
| Milman Island, Australia | −11.1181 | 143.0014 |
| Northwest Island, Australia | −23.2847 | 151.7 |
| Woongarra Coast, Australia | −24.7847 | 152.4347 |
| Wreck Island, Australia | −23.3181 | 152.2847 |
| Wreck Rock Beach, Australia | −23.0167 | 152.0833 |
| Guam | 13.4736 | 144.9833 |
| Alas Purwo, Indonesia | −9.3042 | 114.2069 |
| Jamursba Medi, Indonesia | −0.2 | 132.6208 |
| Terengganu, Malaysia | 5.3681 | 103.4681 |
| Khram Island, Thailand | 12.3514 | 100.7875 |
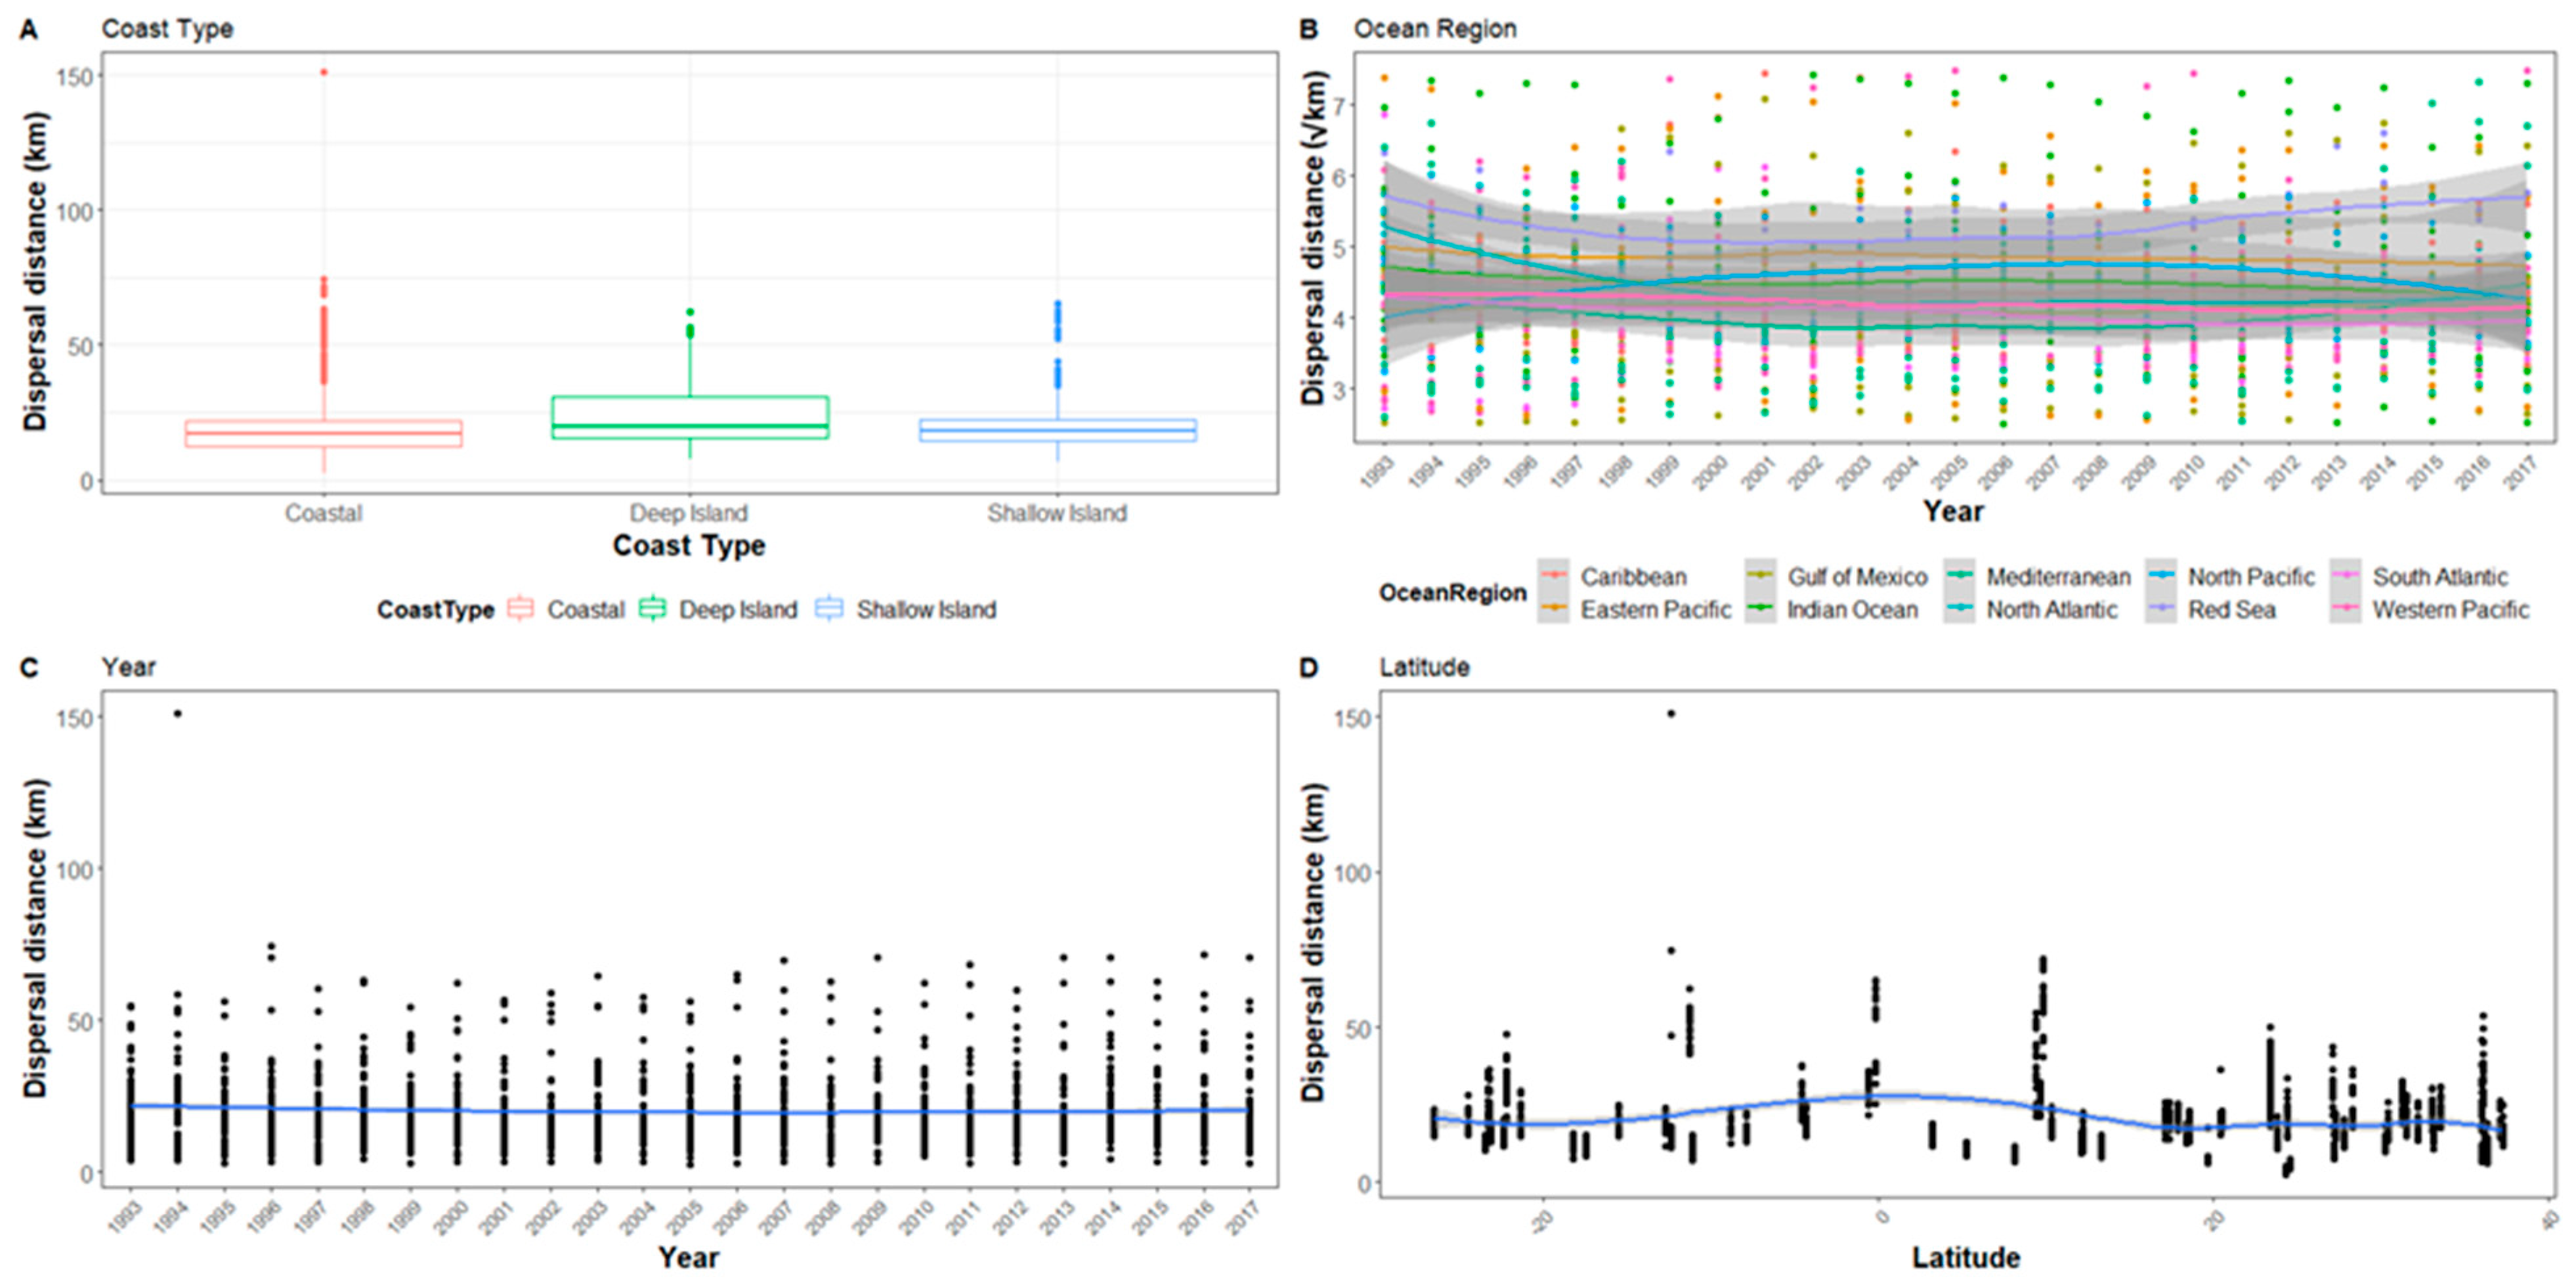
Figure A1.
The hatchling dispersal distance for all sites after1 day represented in relation to (A) Coast type, (B) Ocean region, (C) Year, and (D) Latitude. Ocean region has been square root transformed and the graph range reduced so not all outliers are visible.
Figure A1.
The hatchling dispersal distance for all sites after1 day represented in relation to (A) Coast type, (B) Ocean region, (C) Year, and (D) Latitude. Ocean region has been square root transformed and the graph range reduced so not all outliers are visible.

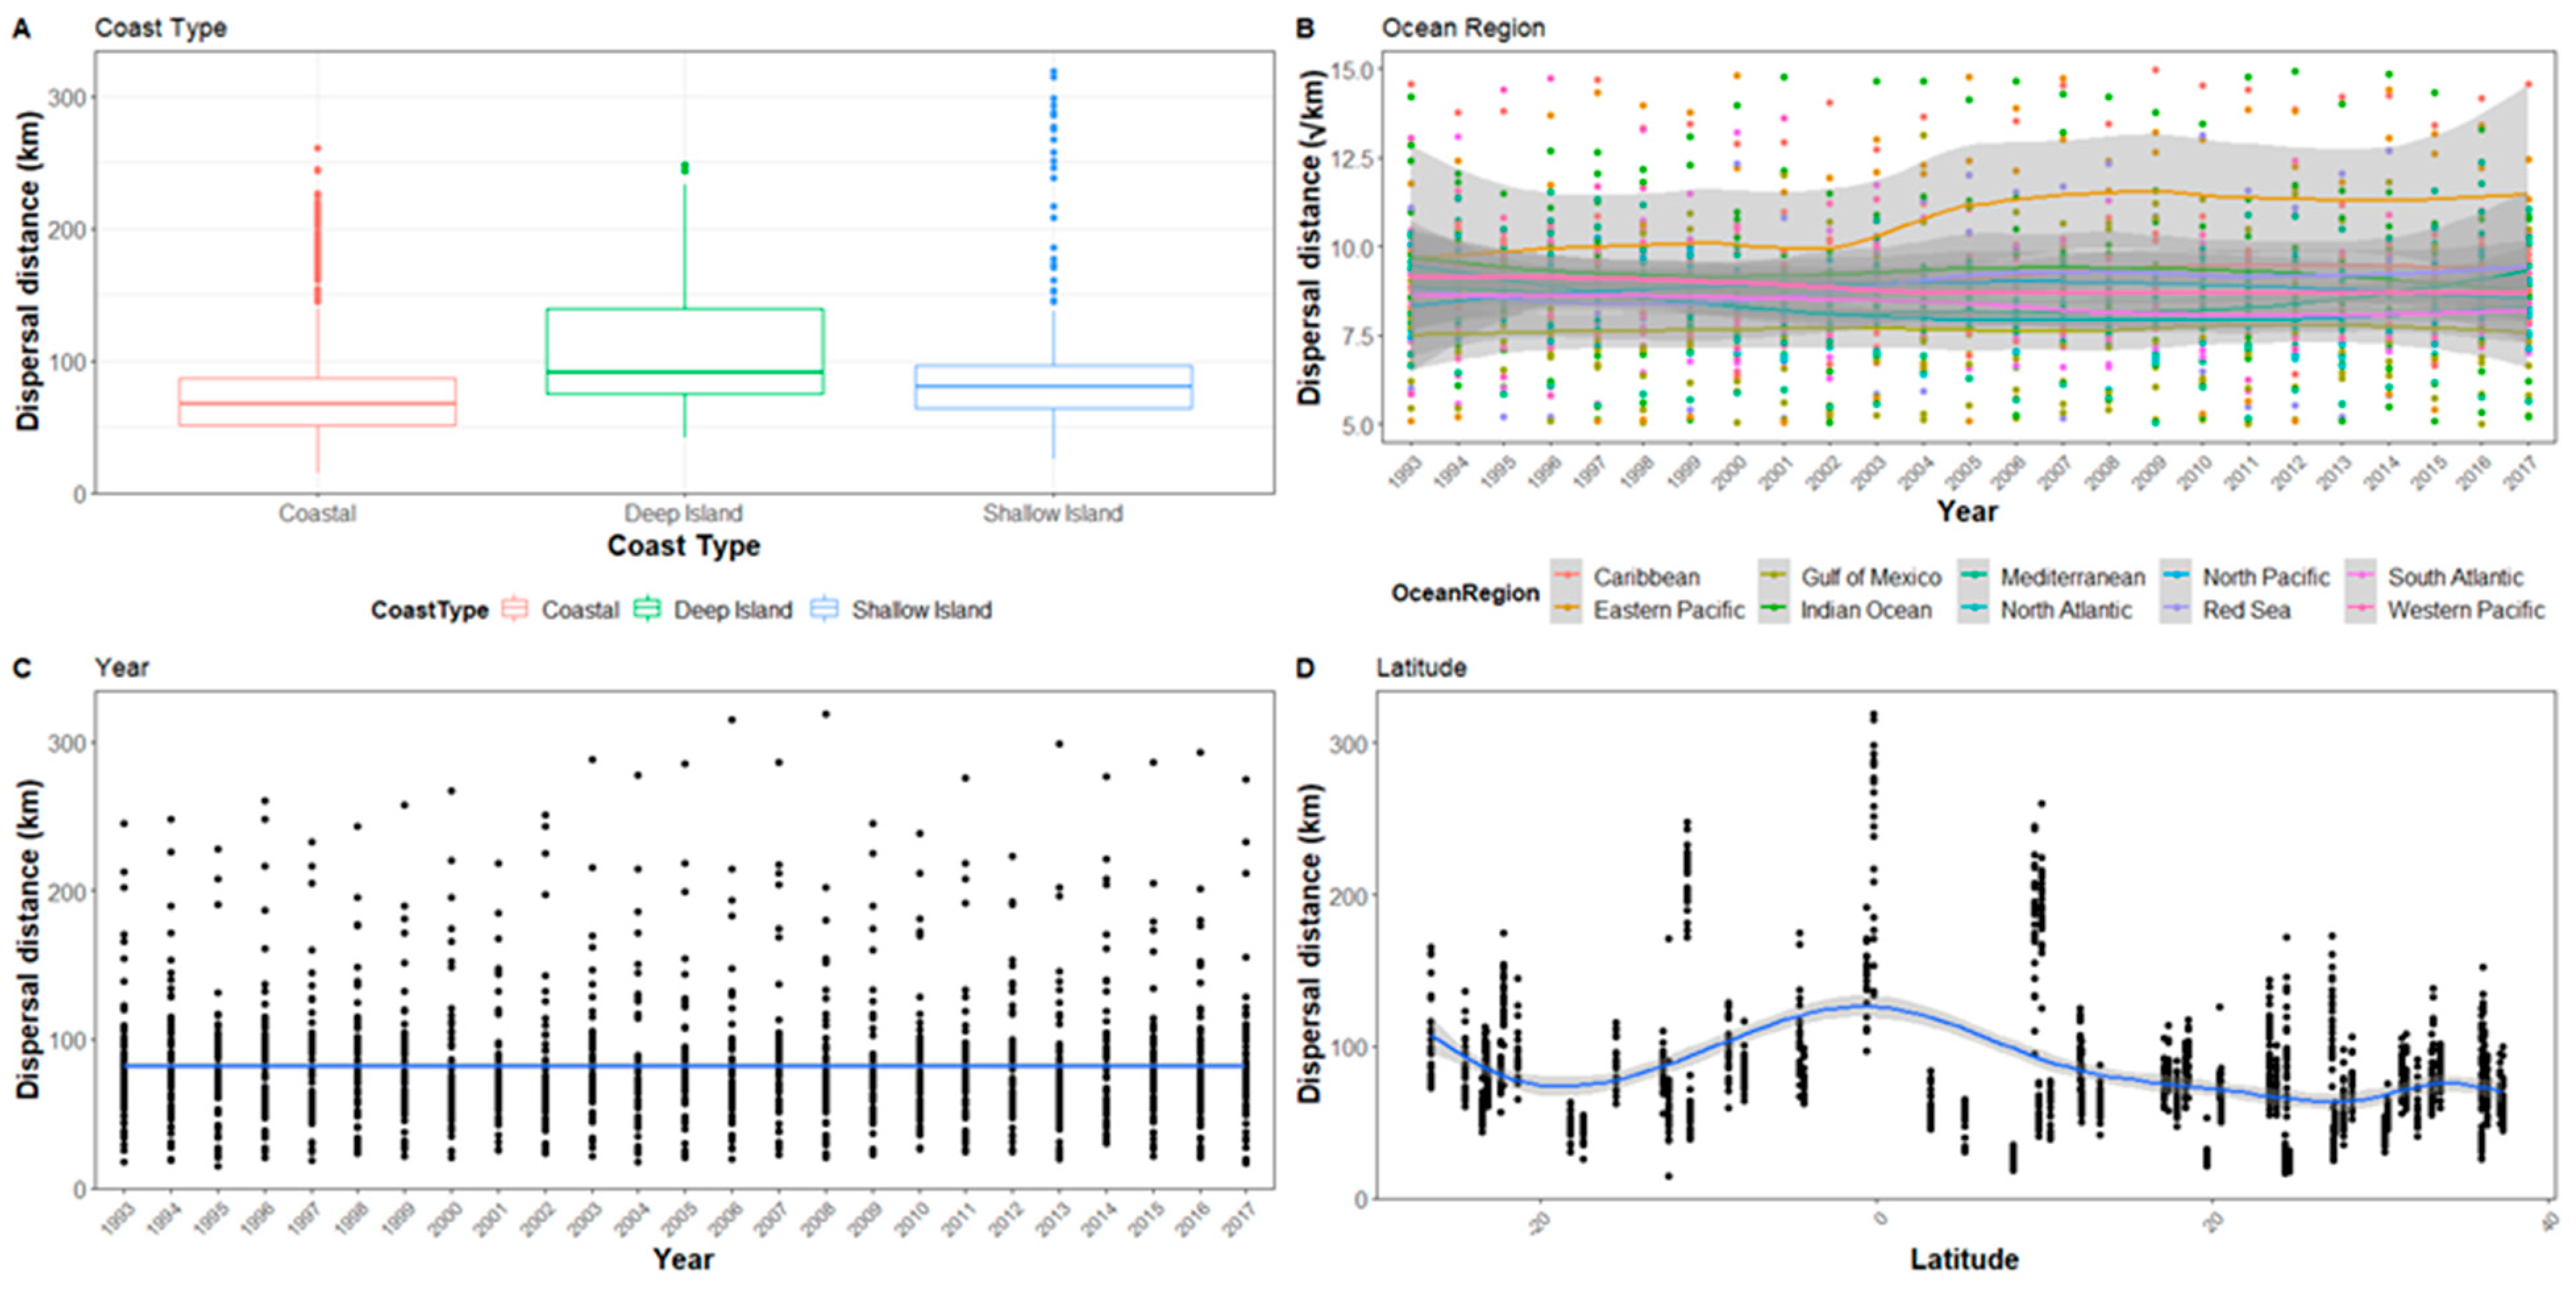
Figure A2.
The hatchling dispersal distance for all sites after 5 days represented in relation to (A) Coast type, (B) Ocean region, (C) Year, and (D) Latitude. Ocean region has been square root transformed and the graph range reduced so not all outliers are visible.
Figure A2.
The hatchling dispersal distance for all sites after 5 days represented in relation to (A) Coast type, (B) Ocean region, (C) Year, and (D) Latitude. Ocean region has been square root transformed and the graph range reduced so not all outliers are visible.

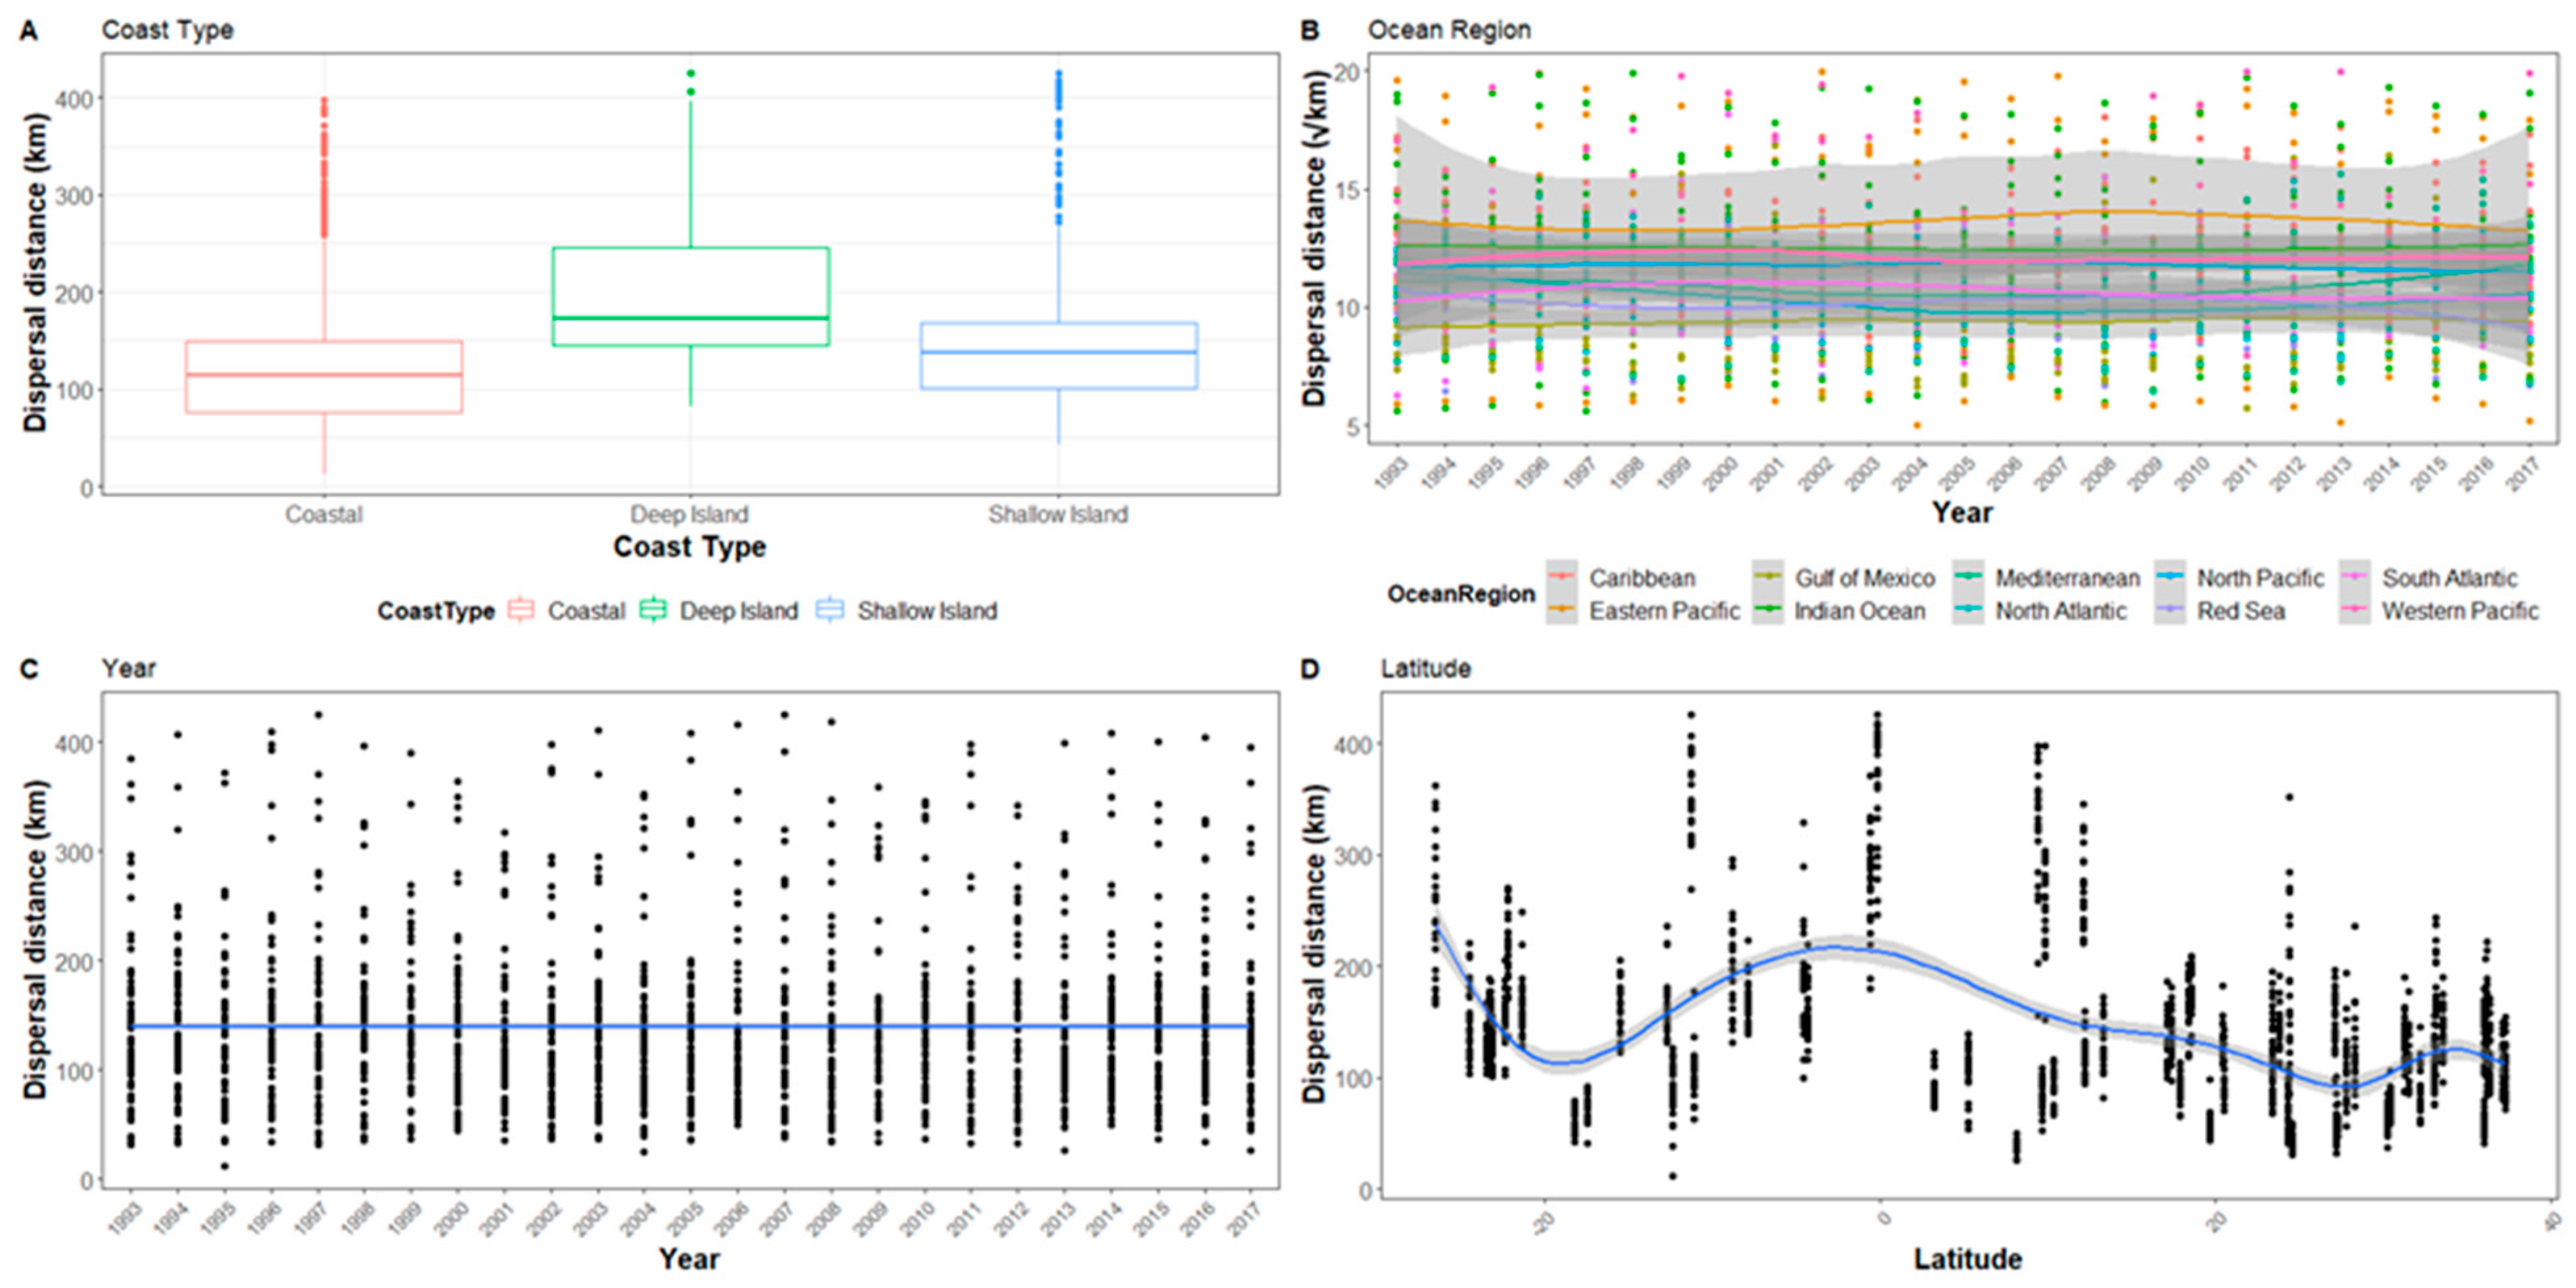
Figure A3.
The hatchling dispersal distance for all sites after 10 days represented in relation to (A) Coast type, (B) Ocean region, (C) Year, and (D) Latitude. Ocean region has been square root transformed and the graph range reduced so not all outliers are visible.
Figure A3.
The hatchling dispersal distance for all sites after 10 days represented in relation to (A) Coast type, (B) Ocean region, (C) Year, and (D) Latitude. Ocean region has been square root transformed and the graph range reduced so not all outliers are visible.

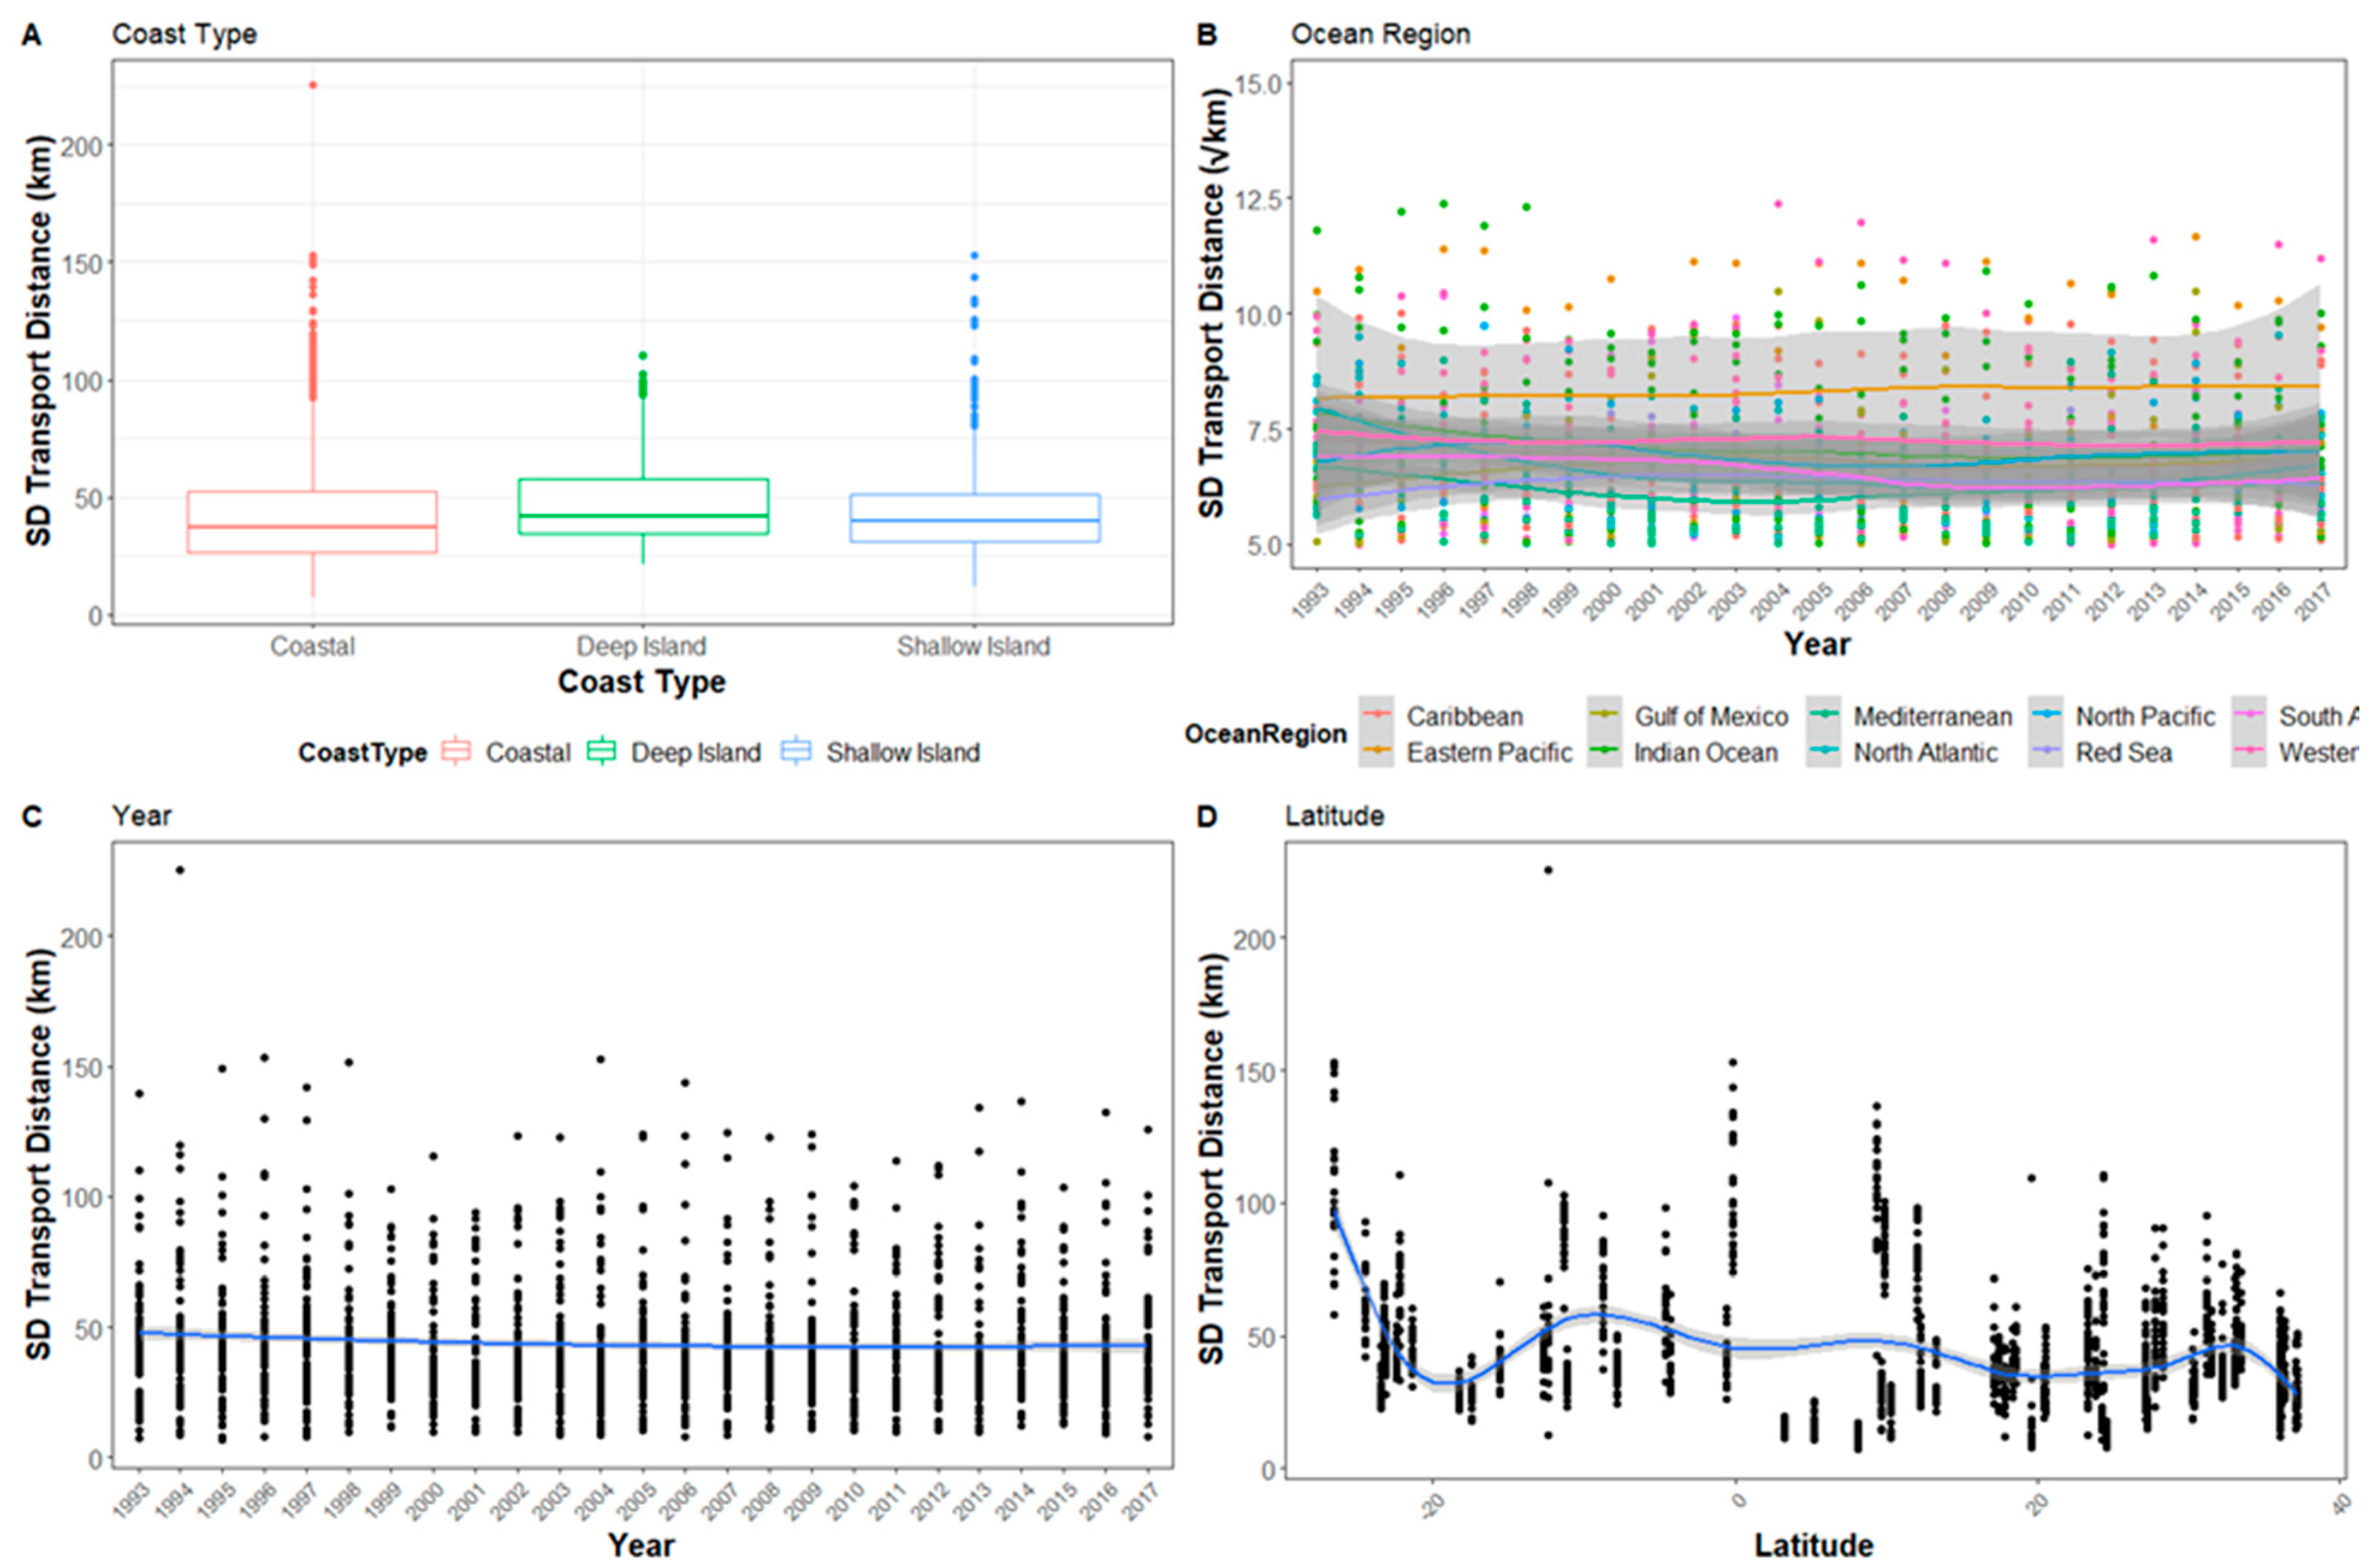
Figure A4.
The standard deviation of Transport distance for all sites after 5 days in relation to (A) Coast type, (B) Ocean region, (C) Year, and (D) Latitude. The y-axis for (B) Ocean region has been square root transformed and reduced so not all outliers are visible. Error bars have been omitted as they occlude patterns.

Figure A5.
The standard deviation of Transport distance for all sites after 10 days in relation to (A) Coast type, (B) Ocean region, (C) Year, and (D) Latitude. The y-axis for (B) Ocean region has been square root transformed and reduced so not all outliers are visible. Error bars have been omitted as they occlude patterns.

References
- Kritzer, J.P.; Sale, P.F. Marine Metapopulations; Elsevier Science & Technology: Burlington, VT, USA, 2006; ISBN 978-0-08-045471-9. [Google Scholar]
- Lutz, P.L.; Musick, J.A. The Biology of Sea Turtles; CRC Press: Boca Raton, FL, USA, 1996; ISBN 978-0-8493-8422-6. [Google Scholar]
- Padilla-Gamino, J.L.; Gates, R.D. Spawning Dynamics in the Hawaiian Reef-Building Coral Montipora Capitata. Mar. Ecol. Prog. Ser. 2012, 449, U145–U176. [Google Scholar] [CrossRef] [Green Version]
- Lobel, P. Ocean Current Variability and Spawning Season of Hawaiian Reef Fishes. Environ. Biol. Fish. 1989, 24, 161–171. [Google Scholar] [CrossRef]
- Benzie, J.A.H. Genetic Structure of Coral Reef Organisms: Ghosts of Dispersal Past. Integr. Comp. Biol. 1999, 39, 131–145. [Google Scholar] [CrossRef] [Green Version]
- Bertola, L.D.; Boehm, J.T.; Putman, N.F.; Xue, A.T.; Robinson, J.D.; Harris, S.; Baldwin, C.C.; Overcast, I.; Hickerson, M.J. Asymmetrical Gene Flow in Five Co-Distributed Syngnathids Explained by Ocean Currents and Rafting Propensity. Proc. Roy. Soc. B Biol. Sci. 2020, 287, 20200657. [Google Scholar]
- Harden-Jones, F.R. Fish Migration; Edward Arnold: London, UK, 1968; ISBN 978-0-7131-2182-7. [Google Scholar]
- Putman, N.F.; Lumpkin, R.; Sacco, A.E.; Mansfield, K.L. Passive Drift or Active Swimming in Marine Organisms? Proc. R. Soc. B Biol. Sci. 2016, 283, 20161689. [Google Scholar] [CrossRef]
- Hays, G.C. Ocean Currents and Marine Life. Curr. Biol. 2017, 27, R470–R473. [Google Scholar] [CrossRef] [Green Version]
- Putman, N.F.; Naro-Maciel, E. Finding the ‘Lost Years’ in Green Turtles: Insights from Ocean Circulation Models and Genetic Analysis. Proc. R. Soc. B Biol. Sci. 2013, 280, 20131468. [Google Scholar] [CrossRef]
- Putman, N. Marine Migrations. Curr. Biol. 2018, 28, R976. [Google Scholar] [CrossRef] [Green Version]
- Carr, A. New Perspectives on the Pelagic Stage of Sea Turtle Development. Conserv. Biol. 1987, 1, 103–121. [Google Scholar] [CrossRef]
- Wyneken, J.; Salmon, M. Frenzy and Postfrenzy Swimming Activity in Loggerhead, Green, and Leatherback Hatchling Sea Turtles. Copeia 1992, 1992, 478–484. [Google Scholar] [CrossRef]
- Scott, R.; Biastoch, A.; Roder, C.; Stiebens, V.A.; Eizaguirre, C. Nano-Tags for Neonates and Ocean-Mediated Swimming Behaviours Linked to Rapid Dispersal of Hatchling Sea Turtles. Proc. R. Soc. B Biol. Sci. 2014, 281, 20141209. [Google Scholar] [CrossRef] [PubMed] [Green Version]
- Witherington, B.E.; Salmon, M. Predation on Loggerhead Turtle Hatchlings after Entering the Sea. J. Herpetol. 1992, 26, 226–228. [Google Scholar] [CrossRef]
- Gyuris, E. The Rate of Predation by Fishes on Hatchlings of the Green Turtle (Chelonia mydas). Coral Reefs 1994, 13, 137–144. [Google Scholar] [CrossRef]
- Wilson, P.; Thums, M.; Pattiaratchi, C.; Whiting, S.; Pendoley, K.; Ferreira, L.C.; Meekan, M. High Predation of Marine Turtle Hatchlings near a Coastal Jetty. Biol. Conserv. 2019, 236, 571–579. [Google Scholar] [CrossRef]
- Mansfield, K.; Putman, N. Oceanic Habits and Habitats Caretta caretta. In The Biology of Sea Turtles; Wyneken, J., Lohmann, K.J., Musick, J.A., Eds.; CRC Press: Boca Raton, FL, USA, 2013; Volume III, ISBN 978-1-4398-7308-3. [Google Scholar]
- Lohmann, K.J.; Putman, N.F.; Lohmann, C.M. The Magnetic Map of Hatchling Loggerhead Sea Turtles. Curr. Opin. Neuro. Biol. 2012, 22, 336–342. [Google Scholar] [CrossRef]
- Allard, M.W.; Miyamoto, M.M.; Bjorndal, K.A.; Bolten, A.B.; Bowen, B.W. Support for Natal Homing in Green Turtles from Mitochondrial DNA Sequences. Copeia 1994, 1, 34–41. [Google Scholar] [CrossRef]
- Lohmann, K.J.; Putman, N.F.; Lohmann, C.M.F. Geomagnetic Imprinting: A Unifying Hypothesis of Long-Distance Natal Homing in Salmon and Sea Turtles. Proc. Natl. Acad. Sci. USA 2008, 105, 19096–19101. [Google Scholar] [CrossRef] [Green Version]
- Bowen, B.W.; Karl, S.A. Population Genetics and Phylogeography of Sea Turtles. Mol. Ecol. 2007, 16, 4886–4907. [Google Scholar] [CrossRef] [PubMed]
- DuBois, M.J.; Putman, N.F.; Piacenza, S.E. Hurricane Frequency and Intensity May Decrease Dispersal of Kemp’s Ridley Sea Turtle Hatchlings in the Gulf of Mexico. Front. Mar. Sci. 2020, 7, 301. [Google Scholar] [CrossRef]
- Hays, G.C.; Fossette, S.; Katselidis, K.A.; Mariani, P.; Schofield, G. Ontogenetic Development of Migration: Lagrangian Drift Trajectories Suggest a New Paradigm for Sea Turtles. J. R. Soc. Interface 2010, 7, 1319–1327. [Google Scholar] [CrossRef] [Green Version]
- Scott, R.; Marsh, R.; Hays, G.C. Ontogeny of Long Distance Migration. Ecology 2014, 95, 2840–2850. [Google Scholar] [CrossRef] [Green Version]
- Putman, N.F.; Bane, J.M.; Lohmann, K.J. Sea Turtle Nesting Distributions and Oceanographic Constraints on Hatchling Migration. Proc. R. Soc. B Biol. Sci. 2010, 277, 3631–3637. [Google Scholar] [CrossRef] [Green Version]
- Putman, N.F.; Hawkins, J.; Gallaway, B.J. Managing Fisheries in a World with More Sea Turtles. Proc. R. Soc. B Biol. Sci. 2020, 287, 20200220. [Google Scholar] [CrossRef]
- Chassignet, E.P.; Hurlburt, H.E.; Smedstad, O.M.; Halliwell, G.R.; Hogan, P.J.; Wallcraft, A.J.; Baraille, R.; Bleck, R. The HYCOM (HYbrid Coordinate Ocean Model) Data Assimilative System. J. Mar. Syst. 2007, 65, 60–83. [Google Scholar] [CrossRef]
- Lett, C.; Verley, P.; Mullon, C.; Parada, C.; Brochier, T.; Penven, P.; Blanke, B. A Lagrangian Tool for Modelling Ichthyoplankton Dynamics. Environ. Model. Softw. 2008, 23, 1210–1214. [Google Scholar] [CrossRef] [Green Version]
- Putman, N.F.; Scott, R.; Verley, P.; Marsh, R.; Hays, G.C. Natal Site and Offshore Swimming Influence Fitness and Long-Distance Ocean Transport in Young Sea Turtles. Mar. Biol. 2012, 159, 2117–2126. [Google Scholar] [CrossRef]
- Putman, N.F.; Verley, P.; Shay, T.J.; Lohmann, K.J. Simulating Transoceanic Migrations of Young Loggerhead Sea Turtles: Merging Magnetic Navigation Behavior with an Ocean Circulation Model. J. Exp. Biol. 2012, 215, 1863–1870. [Google Scholar] [CrossRef] [PubMed] [Green Version]
- Burnham, K.P.; Anderson, D.R. Model Selection and Multimodel Inference: A Practical Information-Theoretic Approach, 2nd ed.; Springer: New York, NY, USA, 2002; ISBN 978-0-387-95364-9. [Google Scholar]
- Bradbury, I.R.; Laurel, B.; Snelgrove, P.V.R.; Bentzen, P.; Campana, S.E. Global Patterns in Marine Dispersal Estimates: The Influence of Geography, Taxonomic Category and Life History. Proc. R. Soc. B Biol. Sci. 2008, 275, 1803–1809. [Google Scholar] [CrossRef] [Green Version]
- Limpus, C.J. A Biological Review of Australian Marine Turtle Species. 1. Loggerhead Turtle, Caretta caretta (Linneaus); Environmental Protection Agency: State of Queensland, Australia, 2008. [Google Scholar]
- Zuur, A.; Ieno, E.N.; Walker, N.; Saveliev, A.; Smith, G.M. Mixed Effects Models and Extensions in Ecology with R; Springer: Berlin/Heidelberg, Germany, 2009; Volume 1–574. [Google Scholar]
- Hobbs, N.T.; Hilborn, R. Alternatives to Statistical Hypothesis Testing In Ecology: A Guide to Self Teaching. Ecol. Appl. 2006, 16, 5–19. [Google Scholar] [CrossRef] [PubMed] [Green Version]
- Mazaris, A.D.; Schofield, G.; Gkazinou, C.; Almpanidou, V.; Hays, G.C. Global Sea Turtle Conservation Successes. Sci. Adv. 2017, 3, e1600730. [Google Scholar] [CrossRef] [Green Version]
- Wallace, B.P.; DiMatteo, A.D.; Bolten, A.B.; Chaloupka, M.Y.; Hutchinson, B.J.; Abreu-Grobois, F.A.; Mortimer, J.A.; Seminoff, J.A.; Amorocho, D.; Bjorndal, K.A.; et al. Global Conservation Priorities for Marine Turtles. PLoS ONE 2011, 6, e24510. [Google Scholar] [CrossRef]
- Putman, N.F.; Mansfield, K.L. Direct Evidence of Swimming Demonstrates Active Dispersal in the Sea Turtle “Lost Years”. Curr. Biol. 2015, 25, 1221–1227. [Google Scholar] [CrossRef] [PubMed] [Green Version]
- Briscoe, D.K.; Parker, D.M.; Balazs, G.H.; Kurita, M.; Saito, T.; Okamoto, H.; Rice, M.; Polovina, J.J.; Crowder, L.B. Active Dispersal in Loggerhead Sea Turtles (Caretta caretta) during the ‘Lost Years’. Proc. R. Soc. B Biol. Sci. 2016, 283, 20160690. [Google Scholar] [CrossRef] [PubMed]
- Christiansen, F.; Putman, N.F.; Farman, R.; Parker, D.M.; Rice, M.R.; Polovina, J.J.; Balazs, G.H.; Hays, G.C. Spatial Variation in Directional Swimming Enables Juvenile Sea Turtles to Reach and Remain in Productive Waters. Mar. Ecol. Prog. Ser. 2016, 557, 247–259. [Google Scholar] [CrossRef] [Green Version]
- Putman, N.F.; Mansfield, K.L.; He, R.; Shaver, D.J.; Verley, P. Predicting the Distribution of Oceanic-Stage Kemp’s Ridley Sea Turtles. Biol. Lett. 2013, 9, 20130345. [Google Scholar] [CrossRef] [Green Version]
- Scott, R.; Biastoch, A.; Agamboue, P.D.; Bayer, T.; Boussamba, F.L.; Formia, A.; Godley, B.J.; Mabert, B.D.K.; Manfoumbi, J.C.; Schwarzkopf, F.U.; et al. Spatio-Temporal Variation in Ocean Current-Driven Hatchling Dispersion: Implications for the World’s Largest Leatherback Sea Turtle Nesting Region. Divers. Distrib. 2017, 23, 604–614. [Google Scholar] [CrossRef]
- Le Gouvello, D.Z.M.; Hart-Davis, M.G.; Backeberg, B.C.; Nel, R. Effects of Swimming Behaviour and Oceanography on Sea Turtle Hatchling Dispersal at the Intersection of Two Ocean Current Systems. Ecol. Model. 2020, 431, 109130. [Google Scholar] [CrossRef]
- Robson, N.A.; Hetzel, Y.; Whiting, S.; Wijeratne, S.; Pattiaratchi, C.B.; Withers, P.; Thums, M. Use of Particle Tracking to Determine Optimal Release Dates and Locations for Rehabilitated Neonate Sea Turtles. Front. Mar. Sci. 2017, 4, 173. [Google Scholar] [CrossRef] [Green Version]
- Figge, F. Bio-Folio: Applying Portfolio Theory to Biodiversity. Biodivers. Conserv. 2004, 13, 827–849. [Google Scholar] [CrossRef]
- Carlson, S.M.; Satterthwaite, W.H. Weakened Portfolio Effect in a Collapsed Salmon Population Complex. Can. J. Fish. Aquat. 2011, 68, 1579–1589. [Google Scholar] [CrossRef] [Green Version]
- Yates, P.M.; Heupel, M.R.; Tobin, A.J.; Simpfendorfer, C.A. Diversity in Young Shark Habitats Provides the Potential for Portfolio Effects. Mar. Ecol. Prog. Ser. 2012, 458, 269–281. [Google Scholar] [CrossRef]
- Schindler, D.E.; Armstrong, J.B.; Reed, T.E. The Portfolio Concept in Ecology and Evolution. Front. Ecol. Environ. 2015, 13, 257–263. [Google Scholar] [CrossRef]
- Vecchi, G.A.; Soden, B.J. Global Warming and the Weakening of the Tropical Circulation. J. Clim. 2007, 20, 4316–4340. [Google Scholar] [CrossRef] [Green Version]
- Tucker, A.D. Nest Site Fidelity and Clutch Frequency of Loggerhead Turtles Are Better Elucidated by Satellite Telemetry than by Nocturnal Tagging Efforts: Implications for Stock Estimation. J. Exp. Mar. Biol. Ecol. 2010, 383, 48–55. [Google Scholar] [CrossRef]
- CITES Appendices. Available online: https://www.cites.org/eng/app/appendices.php (accessed on 15 June 2019).
- IUCN The IUCN Red List of Threatened Species. Available online: http://www.iucnredlist.org (accessed on 20 June 2019).
- Crouse, D.T.; Crowder, L.B.; Caswell, H. A Stage-Based Population Model for Loggerhead Sea Turtles and Implications for Conservation. Ecology 1987, 68, 1412–1423. [Google Scholar] [CrossRef]
- Heppell, S.S.; Crowder, L.B.; Crouse, D.T. Models to Evaluate Headstarting as a Management Tool for Long-Lived Turtles. Ecol. Appl. 1996, 6, 556–565. [Google Scholar] [CrossRef]
- Piacenza, S.E.; Richards, P.M.; Heppell, S.S. An Agent-Based Model to Evaluate Recovery Times and Monitoring Strategies to Increase Accuracy of Sea Turtle Population Assessments. Ecol. Model. 2017, 358, 25–39. [Google Scholar] [CrossRef]
- Hays, G.C. The Implications of Variable Remigration Intervals for the Assessment of Population Size in Marine Turtles. J. Theor. Biol. 2000, 206, 221–227. [Google Scholar] [CrossRef] [Green Version]
- Esteban, N.; Mortimer, J.A.; Hays, G.C. How Numbers of Nesting Sea Turtles Can Be Overestimated by Nearly a Factor of Two. Proc. R. Soc. B Biol. Sci. 2017, 284, 20162581. [Google Scholar] [CrossRef] [Green Version]
- Congdon, J.D.; Dunham, A.E.; Sels, R.C.V.L. Delayed Sexual Maturity and Demographics of Blanding’s Turtles (Emydoidea blandingii): Implications for Conservation and Management of Long-Lived Organisms. Conserv. Biol. 1993, 7, 826–833. [Google Scholar] [CrossRef] [Green Version]
- Casale, P.; Mazaris, A.D.; Freggi, D.; Basso, R.; Argano, R. Survival Probabilities of Loggerhead Sea Turtles (Caretta caretta) Estimated from Capture-Mark-Recapture Data in the Mediterranean Sea. Sci. Mar. 2007, 71, 365–372. [Google Scholar] [CrossRef] [Green Version]
- Van Houtan, K.; Hargrove, S.; Balazs, G. Modeling Sea Turtle Maturity Age from Partial Life History Records1. Pac. Sci. 2014, 68, 465. [Google Scholar] [CrossRef]
- Sim, E.L.; Booth, D.T.; Limpus, C.J. Incubation Temperature, Morphology and Performance in Loggerhead (Caretta caretta) Turtle Hatchlings from Mon Repos, Queensland, Australia. Biol. Open 2015, 4, 685–692. [Google Scholar] [CrossRef] [PubMed] [Green Version]
- Hays, G.C.; Hawkes, L.A. Satellite Tracking Sea Turtles: Opportunities and Challenges to Address Key Questions. Front. Mar. Sci. 2018, 5, 432. [Google Scholar] [CrossRef]
- Jackson, J.B.C. Reefs since Columbus. Coral Reefs 1997, 16, S23–S32. [Google Scholar] [CrossRef]
- Thums, M.; Whiting, S.D.; Reisser, J.W.; Pendoley, K.L.; Pattiaratchi, C.B.; Harcourt, R.G.; McMahon, C.R.; Meekan, M.G. Tracking Sea Turtle Hatchlings-A Pilot Study Using Acoustic Telemetry. J. Exp. Mar. Biol. Ecol. 2013, 440, 156–163. [Google Scholar] [CrossRef]
- Hoover, A.L.; Shillinger, G.L.; Swiggs, J.; Bailey, H. Comparing Acoustic Tag Attachments Designed for Mobile Tracking of Hatchling Sea Turtles. Front. Mar. Sci. 2017, 4, 225. [Google Scholar] [CrossRef] [Green Version]
Figure 1.
Global map of simulated sea turtle nesting sites with 5-day mean surface current velocities (m/s) from the Global Hybrid Coordinate Ocean Model from 2015.
Figure 1.
Global map of simulated sea turtle nesting sites with 5-day mean surface current velocities (m/s) from the Global Hybrid Coordinate Ocean Model from 2015.

Figure 2.
The hatchling transport distance for all sites after 30 days in relation to (A) Coast type, (B) Ocean region, (C) Latitude, and (D) Year. To improve visualization, ocean region has been square root transformed and the y-axis reduced so not all outliers are visible.
Figure 2.
The hatchling transport distance for all sites after 30 days in relation to (A) Coast type, (B) Ocean region, (C) Latitude, and (D) Year. To improve visualization, ocean region has been square root transformed and the y-axis reduced so not all outliers are visible.

Figure 3.
Example sites illustrating the differences in coast type (A) and ocean region (B). The order and color of the sites correspond to the same metrics in Figure 2. Error bars have been omitted as they occlude patterns.
Figure 3.
Example sites illustrating the differences in coast type (A) and ocean region (B). The order and color of the sites correspond to the same metrics in Figure 2. Error bars have been omitted as they occlude patterns.

Figure 4.
The standard deviation of transport distance for all sites by (A,E) Coast Type, (B,F) Ocean Region, (C,G) Year, and (D,H) Latitude for after 1 day and 30 days, respectively. The y-axis for (B) Ocean region has been square root transformed and reduced so not all outliers are visible. Error bars have been omitted as they occlude patterns.

Table 1.
Nesting beach sites included in the study, organized alphabetically by Ocean Region and then by country. Each site is listed with the ocean region and coast type assigned to it for this study as well as the species found at the site and the mean transport distance (km) at the thirty-day interval with the standard deviation.
| Ocean Region | Site | Coast Type | Species | Mean Distance (km) ± SD |
|---|---|---|---|---|
| Caribbean | Long Island, Antigua | Shallow Island | Hawksbill | 357.26 ± 162.58 |
| Caribbean | Tortola, British Virgin Islands | Shallow Island | Leatherback | 348.04 ± 162.91 |
| Caribbean | Klein Bonaire Beaches, Caribbean Netherlands | Shallow Island | Hawksbill, Loggerhead, Green | 784.21 ± 341.47 |
| Caribbean | Cahuita National Park, Costa Rica | Coastal | Hawksbill, Leatherback | 127.48 ± 49.43 |
| Caribbean | Grandoca, Costa Rica | Coastal | Hawksbill, Green, Leatherback | 314.29 ± 209.04 |
| Caribbean | Tortuguero, Costa Rica | Coastal | Green, Leatherback | 209.64 ± 62.27 |
| Caribbean | Culebra Island, Puerto Rico | Shallow Island | Leatherback | 153.39 ± 112.07 |
| Caribbean | Fajardo-Luquillo, Puerto Rico | Shallow Island | Leatherback | 405.42 ± 157.01 |
| Caribbean | St. Croix National Wildlife Refuge, US Virgin Islands | Shallow Island | Leatherback | 255.34 ± 132.54 |
| Eastern Pacific | Ostional, Costa Rica | Coastal | Olive Ridley | 640.17 ± 373.76 |
| Eastern Pacific | Galapagos Islands, Ecuador | Deep Island | Green | 817.57 ± 254.52 |
| Eastern Pacific | Chiriqui, Panama | Coastal | Hawksbill, Leatherback | 67.22 ± 64.66 |
| Gulf of Mexico | Dry Tortugas- Loggerhead Key, US Florida | Coastal | Loggerhead | 542.06 ± 376.87 |
| Gulf of Mexico | Gulf Islands National Sea Shore, US Florida | Coastal | Loggerhead | 117.80 ± 84.26 |
| Gulf of Mexico | Siesta Key, US Florida | Coastal | Loggerhead | 109.51 ± 69.32 |
| Gulf of Mexico | Campeche, Mexico | Coastal | Hawksbill, Green | 198.10 ± 58.90 |
| Gulf of Mexico | Rancho Nuevo, Mexico | Coastal | Kemp’s Ridley | 208.76 ± 105.57 |
| Gulf of Mexico | Veracruz, Mexico | Coastal | Kemp’s Ridley | 169.55 ± 77.40 |
| Gulf of Mexico | Padre Island, US Texas | Coastal | Kemp’s Ridley | 68.73 ± 34.26 |
| Indian Ocean | Cable Beach, Australia | Coastal | Flatback | 165.59 ±92.52 |
| Indian Ocean | Gnaraloo Bay, Australia | Coastal | Loggerhead, Green | 383.30 ± 131.90 |
| Indian Ocean | Ningaloo, Australia | Coastal | Hawksbill, Loggerhead, Green | 366.13 ± 133.52 |
| Indian Ocean | Peak Island, Australia | Shallow Island | Flatback | 342.37 ± 148.40 |
| Indian Ocean | Europa Island, French Southern Territories | Deep Island | Green | 408.04 ± 202.57 |
| Indian Ocean | Glorieuses Island, French Southern Territories | Deep Island | Green | 570.20 ± 246.75 |
| Indian Ocean | Tromelin Island, French Southern Territories | Deep Island | Green | 448.90 ± 216.00 |
| Indian Ocean | Gahirmatha, India | Coastal | Olive Ridley | 283.97 ± 89.57 |
| Indian Ocean | Mayotte, Mayotte | Deep Island | Green | 401.27 ± 213.02 |
| Indian Ocean | Ponta do Ouro, Mozambique | Coastal | Loggerhead, Leatherback | 580.24 ± 325.16 |
| Indian Ocean | Karachi, Pakistan | Coastal | Green, Olive Ridley | 126.48 ± 71.53 |
| Indian Ocean | Silhouette Island, Seychelles | Shallow Island | Hawksbill | 679.59 ± 400.10 |
| Mediterranean | Kyparissa Town, Greece | Coastal | Loggerhead | 198.85 ± 82.50 |
| Mediterranean | Zakynthos, Greece | Shallow Island | Loggerhead | 205.12 ± 90.45 |
| Mediterranean | El Mansouri, Lebanon | Coastal | Loggerhead, Green | 244.07 ± 86.81 |
| Mediterranean | Kurait, Tunisia | Shallow Island | Loggerhead | 134.64 ± 62.72 |
| Mediterranean | Dalyan Beach, Turkey | Coastal | Loggerhead | 267.44 ± 111.22 |
| Mediterranean | Fethiye Beach, Turkey | Coastal | Loggerhead | 267.36 ± 98.54 |
| Mediterranean | Goksu Delta, Turkey | Coastal | Loggerhead | 263.90 ± 112.62 |
| Mediterranean | Patara Beach, Turkey | Coastal | Loggerhead | 264.93 ± 103.56 |
| North Atlantic | Archie Carr National Wildlife Refuge, US Florida | Coastal | Green | 228.08 ± 196.90 |
| North Atlantic | Amelia Island, US Florida | Coastal | Loggerhead | 119.91 ± 94.11 |
| North Atlantic | Canaveral Air Force Station, US Florida | Coastal | Loggerhead | 329.44 ± 295.21 |
| North Atlantic | Wassaw, US Georgia | Coastal | Loggerhead | 189.37 ± 117.13 |
| North Atlantic | Bald Head Island, US North Carolina | Coastal | Loggerhead | 331.15 ± 235.88 |
| North Atlantic | Huntington Beach State Park, US South Carolina | Coastal | Loggerhead | 204.72 ± 139.22 |
| North Atlantic | Hunting Island SP, US South Carolina | Coastal | Loggerhead | 157.79 ± 90.37 |
| North Pacific | French Frigate Shoals, US Hawaii | Deep Island | Green | 361.83 ± 149.02 |
| Northern Pacific | Miyazaki, Japan | Coastal | Loggerhead | 305.24 ± 222.95 |
| Red Sea | Jazā'ir Jiftūn, Egypt | Shallow Island | Hawksbill | 224.84 ± 133.89 |
| Red Sea | Wadi el Gemal, Egypt | Coastal | Green | 186.37± |
| Red Sea | Zabargad, Egypt | Shallow Island | Green | 74.67 ± 48.07 |
| South Atlantic | Ascension Island | Deep Island | Green | 452.39 ± 159.76 |
| South Atlantic | Bahia, Brazil | Coastal | Hawksbill, Loggerhead, Olive Ridley | 154.17 ± 131.20 |
| South Atlantic | Espirito Santo, Brazil | Coastal | Loggerhead, Leatherback | 79.19 ± 79.14 |
| South Atlantic | Congo Coast, Congo | Coastal | Olive Ridley, Leatherback | 440.48 ± 189.94 |
| South Atlantic | Bioko Island, Guinea | Shallow Island | Hawksbill, Green, Loggerhead, Leatherback | 115.91 ± 14.96 |
| Western Pacific | Heron Island, Australia | Shallow Island | Loggerhead, Green | 336.78 ± 142.45 |
| Western Pacific | Milman Island, Australia | Shallow Island | Hawksbill | 314.12 ± 190.94 |
| Western Pacific | Northwest Island, Australia | Shallow Island | Loggerhead, Green | 324.00 ± 131.86 |
| Western Pacific | Woongarra Coast, Australia | Coastal | Flatback, Loggerhead | 371.37 ± 149.97 |
| Western Pacific | Wreck Island, Australia | Shallow island | Loggerhead, Green | 339.44 ± 129.94 |
| Western Pacific | Wreck Rock Beach, Australia | Coastal | Loggerhead | 324.23 ± 145.72 |
| Western Pacific | Guam | Deep Island | Green | 368.79 ± 122.68 |
| Western Pacific | Alas Purwo, Indonesia | Coastal | Hawksbill, Olive Ridley | 639.19 ± 346.51 |
| Western Pacific | Jamursba Medi, Indonesia | Shallow Island | Hawksbill, Green, Olive Ridley, Leatherback | 604.16 ± 326.32 |
| Western Pacific | Terengganu, Malaysia | Coastal | Hawksbill, Green, Olive Ridley, Leatherback | 312.83 ± 121.41 |
| Western Pacific | Khram Island, Thailand | Shallow Island | Hawksbill, Green | 201.43 ± 73.22 |
Table 2.
Confidence set for models describing mean transport distance and standard deviation of transport distance from 1–30 days post-hatching. The + symbol indicates a categorical variable (coast type and ocean region) was included in a model set, whereas when continuous variables (latitude, longitude, and year) were included in a model set, the parameter estimate is reported, and the relative effect size is reported. Models are ranked by their AICc weight. The relative importance (RI) of each variable in the model for each transport period is listed below the selection.
| Model | Coast Type | Ocean Region | Latitude | Longitude | Year | Degrees of Freedom | AICc | ΔAICc | AICc Weight |
|---|---|---|---|---|---|---|---|---|---|
| Mean 1 Day | + | + | −0.0065 | 0.00084 | −0.0030 | 16 | 12,099.08 | 0 | 0.51819 |
| + | + | −0.0066 | −0.0030 | 15 | 12,100.53 | 1.45644 | 0.25016 | ||
| + | + | −0.0066 | 0.00083 | 15 | 12,100.69 | 1.61037 | 0.23163 | ||
| RI | 1.0 | 1.0 | 1.0 | 0.75 | 0.77 | ||||
| Mean 5 Days | + | + | −0.0061 | 14 | 16,479.79 | 0 | 0.32274 | ||
| + | + | −0.0060 | 0.00055 | 15 | 16,479.84 | 0.04512 | 0.31554 | ||
| + | + | −0.0061 | −0.0013 | 15 | 16,480.93 | 1.13417 | 0.18305 | ||
| + | + | −0.0060 | 0.00055 | −0.0013 | 16 | 16,480.98 | 1.18274 | 0.17866 | |
| RI | 1.0 | 1.0 | 1.0 | 0.49 | 0.36 | ||||
| Mean 10 Days | + | + | −0.0072 | 14 | 18,193.3 | 0 | 0.50573 | ||
| + | + | −0.0072 | 0.00033 | 15 | 18,194.53 | 1.23551 | 0.27266 | ||
| + | + | −0.0072 | −0.0009 | 15 | 18,194.95 | 1.65027 | 0.2216 | ||
| RI | 1.0 | 1.0 | 1.0 | 0.27 | 022 | ||||
| Mean 30 Days | + | + | −0.0073 | 0.0007 | 15 | 21,186.48 | 0 | 0.60369 | |
| + | + | −0.0073 | 14 | 21,187.32 | 0.84177 | 0.39630 | |||
| RI | 1.0 | 1.0 | 1.0 | 0.6 | |||||
| St Dev 1 Day | + | −0.0141 | 0.00067 | −0.0071 | 14 | 9860.584 | 0 | 0.61589 | |
| + | −0.0141 | −0.0071 | 13 | 9861.528 | 0.94433 | 0.38410 | |||
| RI | 1.0 | 1.0 | 0.62 | 1.0 | |||||
| St Dev 5 Days | + | −0.01631 | −0.0045 | 13 | 14,570.51 | 0 | 0.63628 | ||
| + | −0.01627 | −0.00037 | −0.0045 | 14 | 14,571.63 | 1.11853 | 0.36371 | ||
| RI | 1.0 | 1.0 | 0.36 | 1.0 | |||||
| St Dev 10 Days | + | −0.017 | 12 | 16,327.43 | 0 | 0.40193 | |||
| + | −0.01693 | −0.00046 | 13 | 16,328.27 | 0.84260 | 0.26374 | |||
| + | −0.017 | −0.0011 | 13 | 16,329.02 | 1.59193 | 0.18133 | |||
| + | + | −0.01685 | 14 | 16,329.36 | 1.93187 | 0.15298 | |||
| 0.15 | 1.0 | 1.0 | 0.26 | 0.18 | |||||
| St Dev 30 Days | + | + | −0.00974 | 14 | 18,977.83 | 0 | 0.71428 | ||
| + | + | −0.00973 | −0.00023 | 15 | 18,979.66 | 1.83260 | 0.28571 | ||
| RI | 1.0 | 1.0 | 1.0 | 0.29 |
Publisher’s Note: MDPI stays neutral with regard to jurisdictional claims in published maps and institutional affiliations. |
© 2021 by the authors. Licensee MDPI, Basel, Switzerland. This article is an open access article distributed under the terms and conditions of the Creative Commons Attribution (CC BY) license (http://creativecommons.org/licenses/by/4.0/).
Share and Cite
MDPI and ACS Style
DuBois, M.J.; Putman, N.F.; Piacenza, S.E. A Global Assessment of the Potential for Ocean-Driven Transport in Hatchling Sea Turtles. Water 2021, 13, 757. https://doi.org/10.3390/w13060757
AMA Style
DuBois MJ, Putman NF, Piacenza SE. A Global Assessment of the Potential for Ocean-Driven Transport in Hatchling Sea Turtles. Water. 2021; 13(6):757. https://doi.org/10.3390/w13060757
Chicago/Turabian StyleDuBois, Morgan J., Nathan F. Putman, and Susan E. Piacenza. 2021. "A Global Assessment of the Potential for Ocean-Driven Transport in Hatchling Sea Turtles" Water 13, no. 6: 757. https://doi.org/10.3390/w13060757
Note that from the first issue of 2016, this journal uses article numbers instead of page numbers. See further details here.