Article

Reservoir Management by Reducing Evaporation Using Floating Photovoltaic System: A Case Study of Lake Nasser, Egypt

1
Department of Water and Water Structures Engineering, Faculty of Engineering, Zagazig University, Zagazig 44519, Egypt
2
Civil Engineering Department, College of Engineering, Shaqra University, Dawadmi 11911, Saudi Arabia
3
Department of Civil and Environmental Engineering, Brunel University London, Kingston Lane, Uxbridge UB8 3PH, UK
4
Department of Environmental Engineering, Faculty of Civil Engineering, Technical University of Kosice, 040 01 Košice, Slovakia
5
Department of Building Facilities, Faculty of Civil Engineering, Technical University of Kosice, 040 01 Košice, Slovakia
*
Author to whom correspondence should be addressed.
Water 2021, 13(6), 769; https://doi.org/10.3390/w13060769
Submission received: 12 February 2021 / Revised: 8 March 2021 / Accepted: 9 March 2021 / Published: 11 March 2021
(This article belongs to the Section Hydraulics and Hydrodynamics)

Abstract

:
The shortage of water is a major obstruction to the social and economic development of many countries, including Egypt. Therefore, there is an urgent need to properly manage water resources to achieve optimum water use. One way of saving available water resources is to reduce evaporation that leads to the loss of a large amount of water from reservoirs and open lakes. This paper aims to use a floating photovoltaic system (FPVS) to cover a lake’s water surface to reduce evaporation and also for energy production. This methodology was applied to Lake Nasser as one of the largest lakes in the world where much evaporation happens due to its large area, arid environments, and the shallow depths of some parts of the lake. The estimated evaporation from the lake was 12.0 × 10⁹ m3/year. The results show that covering 25%, 50%, 75%, and 100% of the lake can save about 2.1, 4.2, 6.3, 7.0, and 8.4 × 10⁹ m3/year and produce energy of 2.85 × 10⁹, 5.67 × 10⁹, 8.54 × 10⁹, and 11.38 × 10⁹ MWh/year, respectively. Covering areas of shallow water depth was more efficient and economical. The results show that covering 15% of the lake’s area (depths from 0.0 to 3.0 m) can save 2.66 × 10⁹ m3/year and produce 1.7 MWh/year. Covering 25% of the lake’s area (depths from 0.0 to 7.0) can save 3.5 × 10⁹ m3/year and produce 2.854 MWh/year. Using an FPVS to cover parts of Lake Nasser could help manage water resources and energy production for Egypt to overcome the likely shortage of water resources due to population growth. This system could be applied in different locations of the world which could help in increasing water resources and energy production, especially in arid and semi-arid regions.

1. Introduction

Water resource management in arid and semi-arid regions has become a crucial issue due to many factors such as population increase, climate change, and regional changes. Therefore, proper management of these resources saves a large amount of water and helps grow the economy and narrow the water shortage gaps. One of the main sources of water losses in these areas is the evaporation from lakes and large water bodies, which leads to billions of cubic meters of freshwater lost due to dry weather and high temperature. Evaporation loss varies from one reservoir to another and changes according to the change in hydro-meteorological data. Studying evaporation will allow a better understanding of the mechanisms and regularities that guide the water circulation in nature and also its associated processes [1,2,3,4].
Several methods were used to estimate evaporation from water bodies, including evaporation pans, water budget methods, the bulk aerodynamic method, and some empirical formulas such as Penman’s equation. Recently, the utilization of images provided by satellite sensor technology and remote sensing (RS) can help in determining evaporation and evapotranspiration with no previous knowledge of soil or crop conditions [5]. Many studies estimated evaporation loss rates around the world using different methods. For example, the evaporation losses estimated from reservoirs in South East Queensland, Australia, were 40% of the total water storage capacity per year [6], while they were 3.1 mm/day from Sparkling Lake, northern Wisconsin, USA [7], 3.6 mm/day from Lake Okeechobee in South Florida [8], and 4.87 mm/day from a tropical African lake in Ethiopia [9]. In Turkey, the total evaporation loss was 6.8 × 10⁹–4.1 × 10⁹ m3/year from reservoirs and 2.7 × 10⁹ m3/year from lakes [10], while in Japan, the mean annual evaporation was 911 mm from Lake Kasumigaura [11].
Evaporation losses in arid and semi-arid regions such as Egypt are generally high. For example, the evaporation from Lake Nasser in Egypt ranges from 12 × 109 to 16 × 109 m3/year [12]. Egypt has already been facing water scarcity, and the construction of the Grand Ethiopian Renaissance Dam will further reduce Egypt’s share of water from the Nile River significantly [13]. Therefore, there is an urgent need to save every drop of water and manage the resources. One of these ways, which we suggest here, is to reduce the water evaporation from Lake Nasser, the second largest manmade lake in the world. The evaporated water loss from the lake ranges between 10 × 109 and 16 × 109 m3 every year, which is equivalent to 20 to 30% of the Egyptian income from Nile water [14].
Hassan [15] estimated an evaporation rate of 6.6 mm/day using the Surface Energy Balance Algorithm for Land (SEBAL). Abdel Wahab et al. [12] estimated the annual evaporation losses from Lake Nasser from 2001 to 2013 and they ranged from 12.3 × 10⁹ to 12.9 × 10⁹ m3. Hamdan and Zaki [16] presented a long-term estimation for the evaporation losses from Aswan High Dam Reservoir (AHDR) using local hydrological and meteorological data collected from nine stations. The bulk aerodynamic method was applied using monthly available hydro-meteorological data with a record of 20 years (1995/1996 to 2014/2015). Annual water losses by evaporation varied from 12 × 109 (in 1995/1996) to 15.53 × 10⁹ m3 (in 2007/2008) with an average of 13.62 × 10⁹ m3/year.
Some methods were used to reduce evaporation from Lake Nasser. For example, Hassan et al. (2007) estimated an average evaporation rate of 6.3 mm/day and an annual water loss by evaporation of 12.5 × 10⁹ m3. They used pontoon framework and circular foam sheets and found that 0.500 km2 must be covered to save one million cubic meters annually. Ebaid and Ismail [17] studied the reduction in evaporation from Lake Nasser by disconnecting some of its secondary channels (khors). The results showed that the evaporation rate ranged from 2.73 in the middle of the lake to 9.58 mm/day at the edge. The evaporated water loss throughout the entire lake was about 0.86 billion m3/month in March. The study showed that disconnecting two khors could approximately save an evaporation loss of 2.4 × 10⁹ m3/year. Elba et al. [18] investigated the impact of lowering the lakebed by removing sediments from the High Aswan Dam Reservoir (HADR), emphasizing evaporation losses. A digital elevation model for the HADR was developed to describe the hydrological characteristics and to assess the consequences of removing sediment deposits. The results showed that the removal of sediments would reduce evaporation losses by 1.1 km3 of the lake projected for 2100, which represents 6.5% of the total projected evaporation losses.
One of the promising methods that may be used to reduce evaporation from open water surfaces is the floating photovoltaic system (FPVS). It has many advantages compared to overland installed solar panels, including fewer obstacles that block sunlight, convenience, energy efficiency, and higher power generation efficiency owing to its lower temperature underneath the panels. Additionally, the aquatic environment profits from the solar installation because the shading of the plant prevents excessive water evaporation, limits algae growth, and potentially improves water quality [19]. A number of studies have been conducted on FPVSs, which assessed them from different points of view. Ranjbaran et al. [20] presented an analytical analysis and updated review that studied different aspects of FPV systems as a power generation system.
There has been little work conducted on using FPVSs in reducing evaporation. Abid et al. [21] presented a review study to assess the prospects and highlight the importance of floating solar panel technology. They discussed multiple opportunities of FPVSs in different regions of the world and highlighted the importance of such technologies in already water-scarce areas. The FPVS is a novel idea in renewable energy production without putting an additional burden on water and land resources. Since the FPVS is a relatively new concept, only a few demonstrator projects have been deployed worldwide [22]. Figure 1 shows a 40 MW FPVS at Huainan, China [23].
A typical overland photovoltaic (PV) module, depending on the type of solar cells and climatic conditions, converts 4–18% of the incident solar energy into electricity. For the rest of the incident, solar radiation is converted into heat, which significantly increases the temperature of the PV [24,25,26,27,28]. Being installed on water, an FPVS has a significantly lower ambient temperature in virtue due to water’s cooling effect. Consequently, the efficiency of floating-type solar panels is 11% higher than ground-installed solar panels [29,30,31,32,33]. The first pilot floating PV plant was built in California in 2008. By the end of 2014, a total of 22 photovoltaic power plants were built in different areas of the world with an installed capacity from 0.5 to 1157 kW [34]. At present, the developments on marine floating PV systems are in the pipeline to examine the effects of corrosion of seawater on unit and PV configuration and the link with energy production efficacy [35].
The main purpose of the present work is to investigate the use of the floating photovoltaic system to reduce the water evaporation loss from Lake Nasser in Egypt and produce clean energy. In this work, evaporation was estimated based on meteorological data for the period from 2009 to 2020. Different scenarios of covering the lake’s surface with an FPVS were studied and discussed. Further, the effect of covering shallow depths is studied. This study is significant, given the fact that Egypt is a water-stressed country and further shortage in water supply from the Nile River is expected due to the construction of the Grand Ethiopian Renaissance Dam.

2. Materials and Methods

2.1. Study Area

Egypt constructed the High Aswan Dam (HAD) to manage the Nile River water and rescue the Nile Delta from flooding. Lake Nasser was formed at the upstream side of the dam. The lake is located between 23°58 and 20°27′N and 30°07′E and 33°15′E, and its length is 500 km, 350 km in the Egypt border and 150 km in the Sudanese border, as shown in Figure 2. The lake’s average width is 13 km, the area of the water surface is about 6500 km2 at the level 182 above Mean Sea Level (MSL), and the total capacity is about 162 billion m3 [36].

2.2. Climate Data

Estimating water losses from climate data was conducted based on data from world weather online during the period from 2009 to 2020. Monthly evaporation from Lake Nasser during the period from 2009 to 2020 was calculated using monthly data for temperature, relative humidity, and wind speed, which are available at (https://www.worldweatheronline.com/ (accessed on 1 January 2021)).

2.2.1. Temperature

The minimum and maximum monthly temperatures at Lake Nasser from 2009 to 2020 were used to calculate the average monthly temperature, as shown in Table 1. The average monthly temperature was calculated from 2009 to 2020, as shown in Figure 3a. The highest and lowest average temperatures were recorded in August (34.4 °C) and January (15.5 °C).

2.2.2. Wind Speed

The average monthly wind speed was calculated at Lake Nasser during the period from 2009 to 2020, and the results are shown in Table 2. The average monthly temperature is shown in Figure 3b during the period from 2009 to 2020.

2.2.3. Relative Humidity

The relative humidity is shown in Figure 3c for the period from 2009 to 2020. The relative humidity was calculated based on the minimum and maximum records for the same period, as shown in Table 3.

2.3. Estimation of Evaporation Losses

As noted above, several methods can be used to compute evaporation losses. The current work was based on atmospheric and hydro-meteorological data and used the bulk aerodynamic method. The bulk aerodynamic method is the most widely used for estimating evaporation losses from large lakes and reservoirs. This method uses the Harbeck equation. The following equations and parameters can be used for calculations [37].
E = NU 2 ( e s e a )
where:
E is the evaporation losses (mm/day);
N is the Lake Nasser coefficient; in this work, this value was assumed as 0.0525 [36];
U2 is the wind speed (m/sec);
es is the saturated vapor pressure (kpa) at water surface temperature.
The following equation can be used for calculating saturated vapor pressure [38]:
e s = 0.611   e x p ( 17.27 T T + 237.3 )
where ea is the actual vapor pressure of the air (kpa). The following equation can be used for calculation of actual vapor pressure:
e a   =   R H 100   e s
RH is the relative humidity;
T is the temperature (°C).
Equations (1)–(3) were used for estimating the evaporation from Lake Nasser using hydro-meteorological data from Table 1, Table 2 and Table 3.

2.4. Estimation of the Water Volume Lost by Evaporation from Lake Nasser

The annual volume of the water lost by evaporation was calculated based on the total yearly average of the evaporation rate, which is based on the monthly average. The annual volume of the water lost was calculated from the following equation [38]:
V = EA 365 10 6
where:
V: the annual volume of water loss (billion m3/year);
E: evaporation rate (mm/day);
A: surface area of Lake Nasser (km2).

2.5. The Relation between Evaporation and Water Depth

Wong et al. [39] determined a power relationship between lake depth and evaporation. The evaporation rate increases exponentially at lower depth as follows:
Log   ( Water   loss ) = B 0 + B 1 × d + ε
E V = 10 ( 0.02 0.48 d 1 )
where:
Water loss (E/V): Evaporation (m3)/Volume of the lake (m3);
d: water depth (m);
B0: constant (0.02);
B1: the marginal effect (−0.48);
ε: error term.
Equation (6) was used to draw a relationship between the water depth and lake (evaporation/volume) ratio (see Figure 4). From the figure, it is clear that the evaporation decreases with increasing water depth up to 5.0 m, after which the depth does not affect evaporation. At a water depth of 1.0 m, the evaporation is 3.5 times the evaporation at 5.0 m. Figure 5a,b show the bed level and water level of Lake Nasser that were used to determine the water depth along Lake Nasser, as shown in Figure 5c. Arc GIS was used to determine the areas between water depths of the lake that are listed in Table 6.

2.6. Reduction in Evaporation

A number of techniques can be used to decrease the amount of water lost by evaporation from open water surfaces. In the current study, covering using an FPVS was used. In this work, four different covering ratios (25%, 50%, 75%, and 100%) of the lake’s surface were studied. The surface area of the lake calculated by GIS was about 5775 km2. Water savings due to FPVS installation can be calculated using the following equation [19]:
Annual water saving = Annual evaporation × Percentage of insulated area × 0.70

2.7. Energy Production

Lake Nasser is located at Aswan, where the available solar power for PV is in the range from 200 to 250 W/m2, which indicates the appropriateness of this area for efficient energy exploitation almost all year. The available solar power data were obtained from the “Solar Atlas of Egypt” [33]. Based on these data, the sums of the monthly mean solar energy potential values at Aswan have energy potential for PV exploitation of 2450 KWh/m2. The energy density of the study area was taken as 225 W/m2 or 225 MW/km2. The energy potential of Lake Nasser can be calculated using the following equation [40]:
Potential energy production= Area (km2) × Energy density (MW/Km2) × (24 × 365)

3. Results

The results here will present the reduction in evaporation losses in Lake Nasser using an FPVS. The benefits of an FPVS in terms of both water conservation and energy generation are also shown.

3.1. Water Losses from Lake Nasser

Figure 6 shows the average monthly evaporation for the period from 2009 to 2020, and details of the parameters used in calculations are provided in Table 4. As expected, the lake’s highest evaporation rate occurs in the summertime with a peak of about 1.74 billion m3/month during August and the lowest of about 0.3 billion m3/month during the wintertime in January. The total annual water loss from the lake was about 12.0 billion m3/year. Those calculations agree with Hamdan and Zaki [16], who estimated average annual evaporation losses of 13.62 billion m3, with Abdel Wahab et al., whose estimations ranged from 12.3 to 12.9 billion m3, and with Hassan et al. [41], who estimated annual water loss by evaporation of 12.5 billion m3.
The evaporation rate from January to June nonlinearly increased and was doubled over five times during this period. From June to August, the evaporation rate still increased but at a much lower rate than before June. This means that covering the lake’s surface in the summertime, where the temperature is high, with an FPVS is importantly needed. It will serve two purposes: first, it will reduce the maximum amount of water evaporation for better water resource management, and second, it will generate green solar energy. This latter objective is environmentally friendly and is a step forward towards the adaptation for climate change and reduction in CO2 and other pollution emissions.

3.2. Water Saving

Different scenarios of the lake’s covered area were studied, including 25%, 50%, 75%, and 100% covered areas, as shown in Table 5. The surface area of the lake was 5775 km2, and annual evaporation of 12.00 billion m3 was adopted to estimate the yearly water saving using Equation (7). The monthly water saving using an FPVS at the lake is presented in Figure 7. Covering 25%, 50%, 75%, and 100% of the lake surface can, respectively, save about 2.1, 4.2, 6.3, and 8.4 billion m3 annually. As expected, this is just a linear relationship as per Equation (7). Figure 8 shows the relation between the area covered and both water losses and water saving at Lake Nasser.

3.3. Energy Production

According to the data obtained from the Solar Atlas of Egypt, the available solar power for PV technologies in the study area is 225 W/m2. The total surface area of the lake is 5775 km2. The energy potential production of the lake was calculated using Equation (8) for the four scenarios (25%, 50%, 75%, and 100% coverage). For the 25%, 50%, 75%, and 100% covered areas, the potential energy production was 2.85, 5.7, 8.55, and 11.40 × 10⁹ MWh/year. Figure 9 shows the relation between the area covered and energy production from Lake Nasser.

3.4. Cost Estimation

An FPVS is not much more expensive than land-based photovoltaics. The system consists of a floating platform upon which traditional photovoltaic panels can be mounted. Land costs may also be an advantage of an FPVS, and since the installation of an FPVS provides benefits including improved water quality and decreased evaporation, it is reasonable that leasing costs for the field would be small or non-existent. Recently, the cost of an FPVS has continued to rapidly decline. To estimate the cost of an FPVS installed in Lake Nasser, we used the median price for non-residential solar installations (USD 0.5–2.8 per watt installed) [42].

3.5. Effect of Water Depth on Evaporation from the Lake

Ebaid and Ismail [17] studied the reduction in evaporation from Lake Nasser by disconnecting some of its secondary channels (khors). The results showed that the evaporation depth ranging from 2.73 at the middle of the lake to 9.58 mm/day at the edge indicates that evaporation from the edge (shallow water) is 3.5 times the evaporation from the middle of the lake. This is consistent with the results presented in Figure 4, where the evaporation at a water depth of 1.0 m is 3.5 times the evaporation at deep water at a depth of 5.0 m or more. However, the evaporation decreased nonlinearly with the water depth, as was shown in Figure 4. The results were based on Wong et al. [39], who determined a power relationship between lake depth and evaporation, where the evaporation rate increased exponentially at lower water depths. Arc GIS was used to determine the areas between water depth contours of the lake, and results are provided in Table 6. The table shows that 15% of the lake’s total area lies between depths of 0.0 and 3.0 m, and 10% of the lake area lies between 3.0 and 7.0 m. Hence, the depths from 0.0 to 7.0 m cover about 25% of the total lake area.
Since the evaporation is significantly greater in shallow water where the depth is smaller than 5.0 m, this means that covering this shallow area of the lake will have a marked reduction in the evaporation from Lake Nasser. Using the FPVS will even double the benefit by generating a green power supply. As per Table 6, the depth from 0.0 to 1.0 m represents 6.5% of the lake’s area. The results show that covering this shallow area with depths up to 1.0 m can annually save 1.9 billion m3 of water. Extension of the covered area to include water depths of 1.0–2.00 m, which represent 5% of the lake’s surface area, can provide an additional annual water saving of 500 million m3. A further water area covering for depths 2.0 to 3.0 m, which represent 3.5% of the lake’s area, can save an additional 260 million m3 of water (see Figure 10).
The above results suggest that covering the area with water depths from 1.0 to 3.0 m, which represent 15% of the lake’s surface area, will provide an annual water saving of about 2.66 billion m3. This water saving represents 31.67% of the water saving for the case when all the lake is covered. Most of this water saving comes from covering the very shallow depths up to 1.0 m, which represent only 6.5% of the lake’s surface area, and at the same time, it saves 1.9 billion m3 of water, which represents about 23% of the water saved by covering the whole surface area. These results are of particular importance as they provide guidance to the decision-makers about the crucial parts of the lake that need to be covered and the significant water saving and clean energy generation associated with this process.
Since Egypt is already a water-stressed country with more water shortages expected in the future due to climate change and the inevitable impact of the Great Renaissance Dam in Ethiopia, it may also be worth considering the depths from 3.0 to 7.0 m of the lake to be covered by an FPVS. Although the water saving is not as great as covering the shallower parts of the lake, saving every drop of water in an arid country such as Egypt is a big gain and is worth considering. The depths from 3.0 to 7.0 m represent 10% of the lake’s area and can further save about 850 million m3 every year.
Covering the lake surface with an FPVC will not only save water but also produce energy. Covering depths from 0.0 to 3.0 m (15%) can produce 1.71 × 10⁹ MWh/year. With the extension of the lake surface covering depths up to 7.0 m (25%), this can produce 2.85109 MWh/year. The relations between water depth and water saving and energy production are shown in Figure 10. Covering all of the lake can produce 11.38 × 10⁹ MWh/year.

4. Discussion

Evaporation from open water surfaces is a great challenge in arid and semi-arid regions. Therefore, there is an urgent need to reduce evaporation in these areas, which will help manage the reduction in evaporation and could be very useful in these areas to manage the water resources more efficiently. Lake Nasser is considered one of the largest lakes in the world exposed to a very high rate of evaporation.
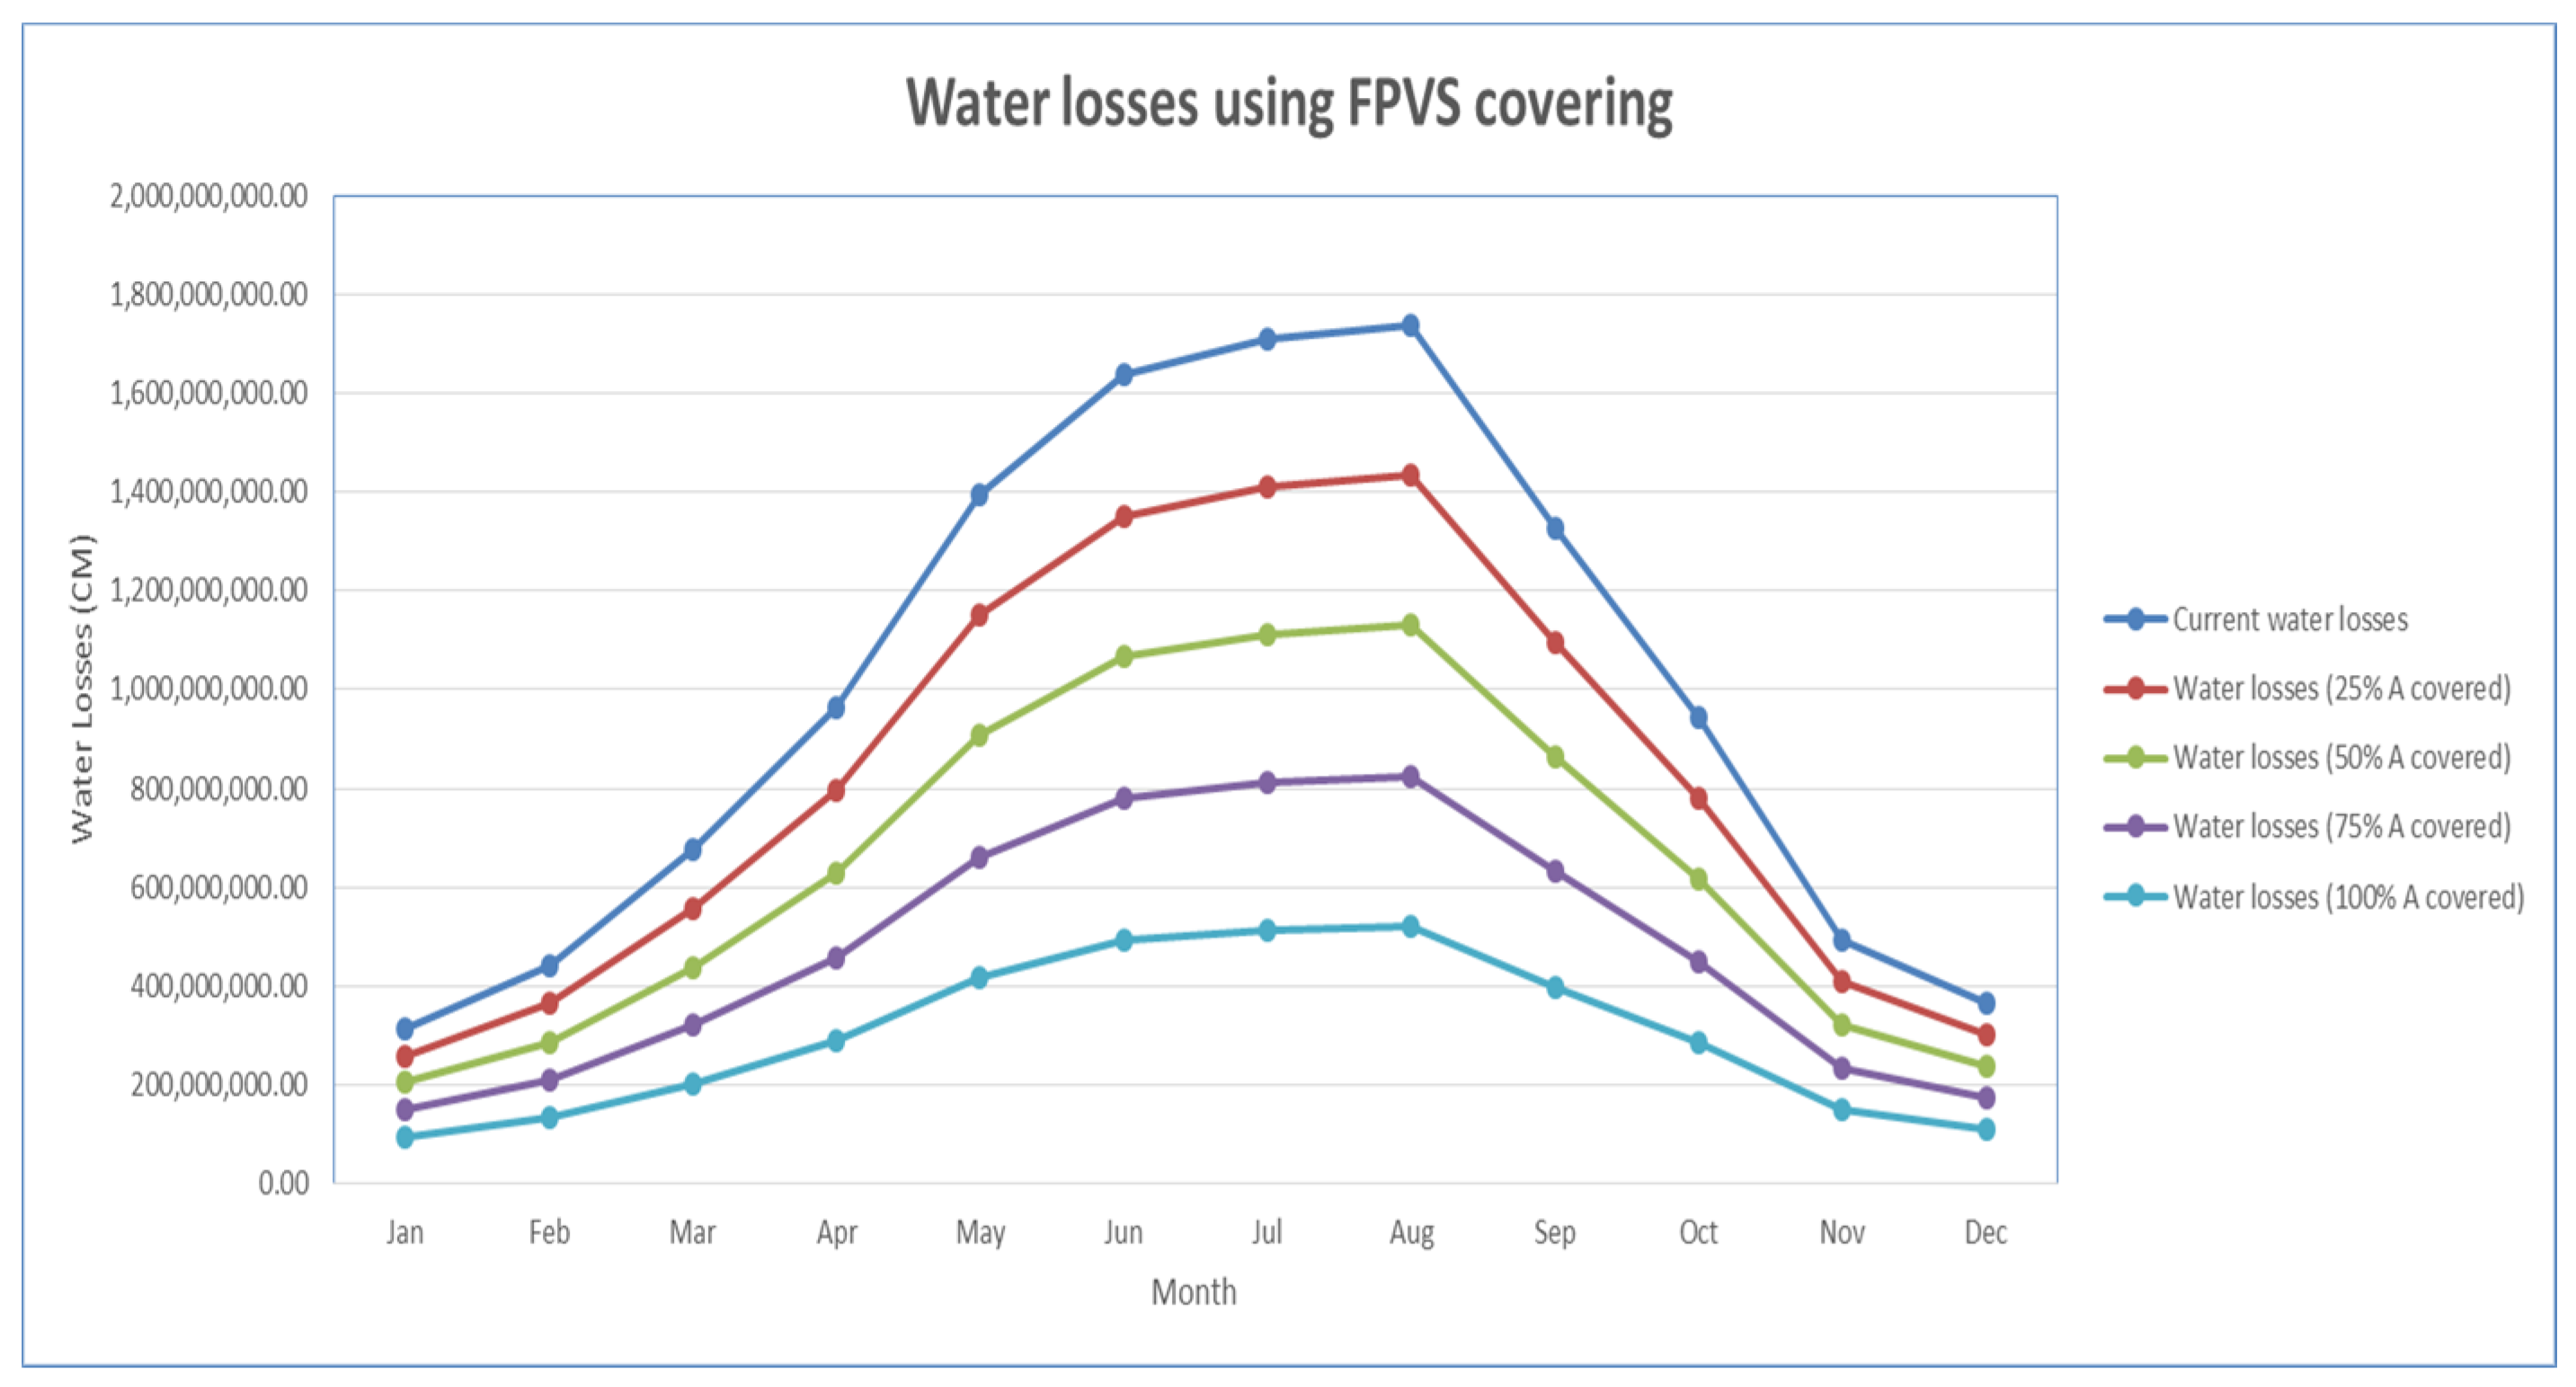
This study suggested using an FPVS to cover parts of the lake to reduce water losses due to evaporation. Different ratios of the coverage area were suggested, ranging from 25% to 100%. Although these different scenarios of covering the water surface were analyzed for Lake Nasser, the large area of 5775 km2 of the lake makes it unlikely that the decision-makers in Egypt will go for covering 100% of the lake or even 50%. This has motivated the authors to look for more practical solutions that can be practically visible and may be implemented by decision-makers. One of the optimum covering scenarios that can be followed for Lake Nasser is to cover only the shallow areas of the lake. For example, covering the water depths of 1.0–3.0 m, which only represent 15% of the total area, will provide an annual water saving of about 2.66 million m3. This water saving represents about one third of the total water saving should an FPVS cover the entire water surface in the lake.
Not far from the lake, and specifically near Aswan, Egypt has recently built Benban, the largest solar park in Africa, which is constructed over an area of 37 square kilometers. According to the European Bank, this solar park will generate 1.5 GW, enough to provide renewable energy to more than 1,000,000 homes [43]. Lake Nasser has similar weather to this site, and sunshine is there most of the year with very high temperatures normally above 40 °C in summer, which means the use of an FPVS is a proper choice to cover the lake, especially areas with water depths below 1.0 m [31]. In addition to saving 1.9 billion m3 of water, enough renewable energy can be generated to fill the consumption of millions of homes in Egypt.

5. Conclusions

Evaporation is a complex phenomenon with many factors and various methodologies to measure. Factors influencing evaporation include wind, temperature, vapor pressure, and exposed surface area. The reduction in evaporation in arid and semi-arid regions is a vital issue due to water shortages in such areas. In this study, we investigated different scenarios to reduce evaporation from Lake Nasser, one of the main sources of water in Egypt that store the excess water from the Nile. We used meteorological data including temperature, relative humidity, and wind speed from 2009 to 2020, and then the bulk aerodynamic method was adopted to determine the annual evaporation from the lake. The results showed that the average amount of water lost annually due to evaporation from Lake Nasser is about 12.00 BCM/year, representing approximately 22% of Egypt’s current share from the Nile River, which is 55.5 billion m3 of water per year. This share will very likely be reduced because of the construction of the Great Renaissance Dam in Ethiopia. This study suggests using an FPVS to cover parts of the lake to reduce water losses due to evaporation. Although covering 100% of the lake can save up to 8.4 billion m3 of water every year, this is not a practical solution due to the large area of the lake that reaches 5775 km2. Therefore, we investigated the water saved by only covering the shallow parts of the lake for water depths up to 3.0 m. We did that at different stages by first covering the water depths from 0.0 to 1.0 m (6.5% of the lake’s area), then from 1.0 to 2.0 m (5% of the lake’s area), and finally from 2.0 to 3.0 m (3.5% of the lake’s area). The results suggested that covering the very shallow parts of 0.0 to 1.0 m will provide the highest water saving of the lake, which reaches 1.9 billion m3 of water. Extension of the covered area to depths of 1.0–2.00 m added an annual water saving of 500 million m3. A further water area covering for depths of 2.0 to 3.0 m, which represent 3.5% of the lake’s area, can save an additional 260 million m3 of water. Another benefit of the use of an FPVS to cover parts of Lake Nasser is renewable energy generation. The estimated annual energy generated will be 740 × 106, 570 × 106, and 400 × 106 MWh. Since the average annual household energy consumption in Egypt is 3130 kWh (World Bank, 2014), the energy generated from covering the depths up to 1.0 m can fill the consumption of 238 homes. A further benefit coming from this is that it helps Egypt meet climate change targets by producing more renewable energy.

Author Contributions

Conceptualization, M.Z., A.A., H.F.A.-E.; methodology, H.F.A.-E., I.F.; validation, I.F., H.F.A.-E.; formal analysis, A.A., M.Z., Z.V.; investigation, I.F.; data curation, H.F.A.-E.; writing—original draft preparation, I.F., H.F.A.-E.; writing—review and editing, H.F.A.-E., M.Z.; supervision, A.A., M.Z.; project administration, M.Z., Z.V.; funding acquisition, M.Z., Z.V. All authors have read and agreed to the published version of the manuscript.

Funding

This work was supported by the projects of the Ministry of Education of the Slovak Republic, VEGA 1/0217/19: Research of Hybrid Blue and Green Infrastructure as Active Elements of a Sponge City, VEGA 1/0308/20: Mitigation of hydrological hazards—floods and droughts—by exploring extreme hydroclimatic phenomena in river basins, and the project of the Slovak Research and Development Agency APVV-18-0360: Active hybrid infrastructure towards a sponge city.

Institutional Review Board Statement

Not applicable.

Informed Consent Statement

Not applicable.

Data Availability Statement

Data available upon request.

Acknowledgments

The authors are grateful to the Department of Water and Water Structures Engineering, Faculty of Engineering, Zagazig University, Zagazig, Egypt, for supporting this research.

Conflicts of Interest

The authors declare no conflict of interest.

References

  1. Stan, F.; Neculau, G.; Zaharia, L.; Ioana-Toroimac, G.; Mihalache, S. Study on the Evaporation and Evapotranspiration Measured on the Căldăruşani lake (Romania). Procedia Environ. Sci. 2016, 32, 281–289. [Google Scholar] [CrossRef] [Green Version]
  2. Pochwat, K.; Slys, D.; Kordana, S. The temporal variability of a rainfall synthetic hyetograph for the dimensioning of stormwater retention tanks in small urban catchments. J. Hydrol. 2017, 549, 501–511. [Google Scholar] [CrossRef]
  3. Stec, A.; Zeleňáková, M. An Analysis of the Effectiveness of Two Rainwater Harvesting Systems Located in Central Eastern Europe. Water 2019, 11, 458. [Google Scholar] [CrossRef] [Green Version]
  4. Kaya, Y.Z.; Zelenakova, M.; Üneş, F.; Demirici, M.; Hlavata, H.; Mesaros, P. Estimation of daily evapotranspiration in Košice City (Slovakia) using several soft computing techniques. Appl. Clim. 2021, 1–12. [Google Scholar] [CrossRef]
  5. Bastiaanssen, W.; Noordman, E.; Pelgrum, H.; Davids, G.; Thoreson, B.; Allen, R. SEBAL model with remotely sensed data to improve water-resources management under actual field conditions. J. Irrig. Drain. Eng. 2015, 131, 85–93. [Google Scholar] [CrossRef]
  6. Helfer, F.; Lemckert, C.; Zhang, H. Impacts of climate change on temperature and evaporation from a large reservoir in Australia. J. Hydrol. 2012, 475, 365–378. [Google Scholar] [CrossRef] [Green Version]
  7. Lenters, J.D.; Kratz, T.K.; Bowser, C.J. Effects of climate variability on lake evaporation: Results from a long-term energy budget study of Sparkling lake, northern Wisconsin (USA). J. Hydrol. 2005, 308, 168–195. [Google Scholar] [CrossRef]
  8. Abtew, W. Evaporation estimation for lake Okeechobee in south Florida. J. Irrig. Drain. Eng. 2001, 127, 140–147. [Google Scholar] [CrossRef]
  9. Vallet-Coulomb, C.; Legesse, D.; Gasse, F.; Travi, Y.; Chernet, T. Lake evaporation estimates in tropical Africa (lake Ziway, Ethiopia). J. Hydrol. 2001, 245, 1–18. [Google Scholar] [CrossRef]
  10. Gokbulak, F.; Ozhan, S. Water Loss through Evaporation from Water Surfaces of Lakes and Reservoirs in Turkey; Official Publication of the European Water Association, EWA: Hennef, Germany, 2006. [Google Scholar]
  11. Sugita, M.; Ikura, H.; Miyano, A.; Yamamoto, K.; Zhongwang, W. Evaporation from lake Kasumigaura: Annual totals and variability in time and space. Hydrol. Res. Lett. 2014, 8, 103–107. [Google Scholar] [CrossRef]
  12. Abdel Wahab, M.; Essa, Y.; Khalil, A.; Elfadli, K.; Giulia, P. Water loss in egypt based on the lake Nasser evaporation and agricultural evapotranspiration. Environ. Asia 2018, 11, 192–204. [Google Scholar]
  13. Abd-Elaziz, S.; Zelenakova, M.; Mesaros, P.; Purcz, P.; Abd-Elhamid, H.F. Anthropogenic Activity Effects on Canals Morphology, Case Study: Nile Delta, Egypt. Water 2020, 12, 3184. [Google Scholar] [CrossRef]
  14. Shaltout, M.; El-Hosary, T.N. Estimating the evaporation over Nasser lake in the upper Egypt from Meteosat observations. Adv. Space Res. 1997, 19, 515–518. [Google Scholar] [CrossRef]
  15. Hassan, M. Evaporation estimation for lake Nasser based on remote sensing technology. Ain Shams Eng. J. 2013, 4, 593–604. [Google Scholar] [CrossRef] [Green Version]
  16. Hamdan, A.; Zaki, M. Long-Term Estimation of Water Losses Through Evaporation from Water Surfaces of Nasser lake Reservoir, Egypt. Int. J. Civ. Environ. Eng. IJCEE-IJENS 2016, 16, 13–23. [Google Scholar]
  17. Ebaid, H.; Ismail, S. Lake Nasser evaporation reduction study. J. Adv. Res. 2010, 1, 315–322. [Google Scholar] [CrossRef] [Green Version]
  18. Elba, E.; Urban, B.; Ettmer, B.; Farghaly1, D. Mitigating the Impact of Climate Change by Reducing Evaporation Losses: Sediment Removal from the High Aswan Dam Reservoir. Am. J. Clim. Chang. 2017, 6, 230–246. [Google Scholar] [CrossRef] [Green Version]
  19. Sahu, A.; Yadav, N.; Sudhakar, K. Floating photovoltaic power plant: A review. Renew. Sustain. Energy Rev. 2016, 66, 815–824. [Google Scholar] [CrossRef]
  20. Ranjbaran, P.; Yousefi, H.; Gharehpetian, G.B.; Astaraei, F.R. A review on floating photovoltaic (FPV) power generation units. Renew. Sustain. Energy Rev. 2019, 110, 332–347. [Google Scholar] [CrossRef]
  21. Abid, M.; Abid, Z.; Sagin, J.; Murtaza, R.; Sarbassov, D.; Shabbir, M. Prospects of floating photovoltaic technology and its implementation in Central and South Asian Countries. Int. J. Environ. Sci. Technol. 2018, 16, 1755–1762. [Google Scholar] [CrossRef]
  22. Trapani, K.; Millar, D.L. Proposing offshore photo voltaic (PV) technology to the energy mix of the Maltese islands. Energy Convers Manag. 2013, 67, 18–26. [Google Scholar] [CrossRef]
  23. Brandon, S.; World Economic Forum. China just Switched on the World’s Largest Floating Solar Power Plant. 2017. Available online: https://www.weforum.org/agenda/2017/06/china-worlds-largest-floating-solar-power/ (accessed on 11 March 2021).
  24. Dubey, S.; Sarvaiya, J.N.; Seshadri, B. Temperature dependent photovoltaic (PV) efficiency and its effect on PV production in the world a review. Energy Proc. 2013, 33, 311–332. [Google Scholar] [CrossRef] [Green Version]
  25. Syahriman, M.; Azmia, M.; Othmana, M.; Yusof, H.; Ruslanb, M.; Hafidz, H.; Sopianb, K.; Azran, A.M.Z. Study on electrical power output of floating photovoltaic and conventional photovoltaic. In AIP Conference Proceedings; American Institute of Physics: Hong Kong, China, 2013; Volume 1571, p. 95. [Google Scholar] [CrossRef]
  26. Kušnír, M.; Vranay, F.; Vranayova, Z.; Kapalo, P.; Košičanová, D. Synergy between progressive indoor environment cooling and photovoltaic system. In Proceedings of the International Conference SGEM 2015, Sofia: STEF92 Technology, Albena, Bulgaria, 18–24 June 2015; pp. 541–546. [Google Scholar]
  27. Kušnír, M.; Vranay, F.; Košičanová, D.; Vranayova, Z.; Kapalo, P.; Gavlík, M. Utilizing solar energy in order to reduce energy loads of building. In Proceedings of the 17th Conference on Process Integration, Modelling and Optimisation for Energy Saving and Pollution Reduction (PRES 2014), Prague, Czech Republic, 23–27 August 2014; pp. 1483–1488. [Google Scholar]
  28. Kušnír, M.; Košičanová, D.; Vranayová, Z.; Štefanco, M.; Vranay, F. Synergic application of renewable energy sources in reducing energy load of buildings. In Proceedings of the International Conference SGEM 2014, Sofia: STEF92 Technology, Kraków, Poland, 14–16 April 2014; pp. 489–495. [Google Scholar]
  29. Gotmare, J.A.; Prayagi, S.V. Enhancing the performance of photovoltaic panels by stationary cooling. Int. J. Sci. Eng. Technol. 2014, 2, 1465–1468. [Google Scholar]
  30. Dash, P.K.; Gupta, N.C. Effect of temperature on power output from different commercially available photovoltaic modules. PK Dash Int. J. Eng. Res. Appl. 2015, 5, 148–151. [Google Scholar]
  31. Fesharaki, V.; Jafari, D.M.; Jafari, F.J. The effect of temperature on photovoltaic cell efficiency. In Proceedings of the 1st International Conference on Emerging Trends in Energy Conservation, ETEC Tehran, Tehran, Iran, 20–21 November 2011; pp. 20–21. [Google Scholar]
  32. Baskar, D. Efficiency improvement on photovoltaic water pumping system by automatic water spraying over photovoltaic cells. Middle-East J. Sci. Res. 2014, 19, 1127–1131. [Google Scholar]
  33. Choi, Y.K. A study on power generation analysis of floating PV system considering environmental impact. Int. J. Softw. Eng. Appl. 2014, 8, 75–84. [Google Scholar] [CrossRef]
  34. Liu, L.; Wang, Q.; Lin, H.; Li, H.; Sun, Q. Power generation efficiency and prospects of floating photo voltaic systems. Energy Proc. 2017, 105, 1136–1142. [Google Scholar] [CrossRef]
  35. Oshima, H.; Karasawa, K.; Nakamura, K. Water purification experiment by artificial floating Island. Proc. JSWE 2001, 35, 146. [Google Scholar]
  36. Hassan, A.; Ismail, S.; Elmoustafa, A.; Khalaf, S. Evaluating Evaporation Rates Using Numerical Model (Delft3D). Curr. Sci. Int. 2017, 6, 402–411. [Google Scholar]
  37. Rosenberry, D.O.; Winter, T.C.; Buso, D.C.; Likens, G.E. Comparison of 15 evaporation methods applied to a small mountain lake in the northeastern USA. J. Hydrol. 2007, 340, 149–166. [Google Scholar] [CrossRef]
  38. Junzeng, X.U.; Qi, W.; Shizhang, P.; Yanmei, Y.U. Error of Saturation Vapor Pressure Calculated by Different Formulas and Its Effect on Calculation of Reference Evapotranspiration in High Latitude Cold Region. Procedia Eng. Int. Conf. Mod. Hydraul. Eng. 2012, 2, 43–48. [Google Scholar] [CrossRef] [Green Version]
  39. Wong, P.; Jiang, B.; Bohn, J.; Lee, N.; Lettenmaier, P.; Ma, D.; Ouyang, Z. Lake and wetland ecosystem services measuring water storage and local climate regulation. Water Resour. Res. 2017, 53, 3197–3223. [Google Scholar] [CrossRef] [Green Version]
  40. Kosmopoulos, P.; Kazadzis, S.; El-Askary, H. The Solar Atlas of Egypt. 2013. Available online: http://www.nrea.gov.eg/Content/files/SOLAR%20ATLAS%202018%20digital1.pdf (accessed on 11 March 2021).
  41. Hassan, R.; Hekal, N.; Mansor, M. Evaporation Reduction from lake Naser using new environmentally safe techniques. In Proceedings of the Eleventh International Water Technology Conference, IWTC11 2007, Sharm El-Sheikh, Egypt, 16 March 2007; pp. 179–194. [Google Scholar]
  42. Barbose, G.L.; Darghouth, N.R.; Millstein, D.; Spears, M.; Wiser, R.H.; Buckley, M.; Grue, N. Tracking the Sun VIII. The Installed Price of Residential and Non-Residential Photovoltaic Systems in the United States; Lawrence Berkeley National Laboratory, SunShot U.S. Department of Energy: Berkeley, CA, USA, 2015. [Google Scholar] [CrossRef] [Green Version]
  43. European Bank, Benban, Africa’s Largest Solar Park, Completed. 2020. Available online: https://www.ebrd.com/news/video/benban-africas-largest-solar-park-completed.html (accessed on 11 March 2021).
Figure 1. Floating solar power plant (Source: Brandon, 2017 [23]).
Water 13 00769 g001
Figure 2. Location map of Lake Nasser.
Water 13 00769 g002
Figure 3. Meteorological data of Lake Nasser from 2009 to 2020: (a) average monthly temperature (°C), (b) average monthly wind speed (m/sec), (c) average monthly relative humidity (%).
Water 13 00769 g003
Figure 4. Relation between evaporation and water depth.
Water 13 00769 g004
Figure 5. Bed level and water level and depth in Lake Nasser (2020): (a) bed level, (b) water level, (c) water depth.
Water 13 00769 g005
Figure 6. Average monthly evaporation (m3/month) from 2009 to 2020.
Water 13 00769 g006
Figure 7. Monthly water losses after using an FPVS at Lake Nasser.
Water 13 00769 g007
Figure 8. Relation between area covered and water saving at Lake Nasser.
Water 13 00769 g008
Figure 9. Relation between area covered and energy production at Lake Nasser.
Water 13 00769 g009
Figure 10. Relations between water depth and water saving and energy production at Lake Nasser: (a) water saving, (b) energy production.
Water 13 00769 g010
Table 1. Monthly temperature (°C) at Lake Nasser during the period from 2009 to 2020.
JanuaryFebruaryMarchAprilMayJuneJulyAugustSeptemberOctoberNovemberDecemberAv
200914161826273132312925191423.50
201016182125283132333028231625.08
201114171923293233322926172524.67
201212181927313334333028231625.33
201317182325313232323025211625.17
201416182331333333343126201826.33
201514182324303132363329211525.50
201614182428303433333128231525.92
201715152027313335373428231225.83
201817232829353636363534262029.58
201920222531383939383533262030.50
202017212730353939383533262030.00
Av15.518.522.527.231.533.734.234.431.828.622.317.326.5
Table 2. Monthly wind speed (km/h) at Lake Nasser during the period from 2009 to 2020.
JanuaryFebruaryMarchAprilMayJuneJulyAugustSeptemberOctoberNovemberDecemberAv
20096.306.406.906.906.906.806.706.606.505.706.205.406.42
20105.705.606.506.906.806.907.006.906.506.506.306.406.50
20116.506.307.606.6013.5016.7016.0016.0012.2015.2013.5013.8011.74
201212.6015.3015.7014.5015.1015.4014.2015.0012.7012.4012.2012.2013.94
201313.2014.3013.0014.5014.3015.3017.5014.2015.5013.1010.8013.8014.13
201411.5014.4012.9014.2016.2015.9015.1014.8016.0013.8012.7012.3014.15
201512.9013.4014.3015.4015.7017.8016.7016.2013.0011.9012.4013.7014.20
201612.7014.1014.3011.8014.1014.5015.2016.6015.0011.4012.2014.1013.75
201712.7013.6012.5015.5013.1016.4017.0019.8016.8016.2014.5015.3015.12
201814.9013.0012.6013.9015.7018.6017.1016.6019.9015.1012.7013.8015.24
201912.5016.3015.9016.5014.4016.1017.5019.1018.9015.3014.3015.3015.99
202016.7016.9016.9017.3018.4016.1017.5019.1018.9015.3014.3015.3016.88
Av11.5212.4712.4312.8313.6814.7114.7915.0814.3312.6611.8412.6213.17
Table 3. Monthly relative humidity (%) at Lake Nasser during the period from 2009 to 2020.
JanuaryFebruaryMarchAprilMayJuneJulyAugustSeptemberOctoberNovemberDecemberAv
200938.030.026.017.018.015.019.021.024.030.045.052.027.9
201047.036.030.021.017.017.021.019.023.026.042.045.028.7
201150.036.027.022.017.018.016.020.024.030.041.045.028.8
201245.030.026.015.016.016.019.019.024.026.042.045.026.9
201342.032.022.018.015.016.021.020.024.029.042.049.027.5
201444.037.026.017.016.016.018.019.024.029.044.053.028.6
201545.031.022.017.015.018.017.018.019.029.043.049.026.9
201641.033.023.016.016.014.018.019.022.028.036.038.025.3
201733.033.023.017.015.015.015.016.017.022.029.038.022.8
201836.022.014.014.013.013.015.018.019.023.032.038.021.4
201925.027.019.015.011.016.017.019.022.026.034.038.022.4
202042.034.026.021.018.016.017.019.022.026.034.038.026.1
Av40.731.823.717.515.615.817.818.922.027.038.744.026.1
Table 4. Monthly average evaporation (BCM/month) at Lake Nasser during the period from 2009 to 2020.
MonthAv TempAv Wind SpeedRelative HumidityeseaEV
CU2 (m/sec)RH%mbmbmm/daym3/month
Jan15.503.2040.701.760.721.75314,184,563
Feb18.503.4631.802.130.682.64442,024,295
Mar22.503.4523.702.730.653.77674,557,455
Apr27.203.5617.503.610.635.56963,987,867
May31.503.8015.604.620.727.791,393,726,720
Jun33.704.0915.805.230.839.461,639,075,747
Jul34.204.1117.805.380.969.541,708,490,965
Aug34.404.1918.905.441.039.711,737,638,590
Sep31.803.9822.004.701.037.661,327,915,547
Oct28.603.5227.003.921.065.28945,589,289
Total evaporation (m3/year)12,005,213,803
Table 5. Monthly water saving using a floating photovoltaic system (FPVS) at Lake Nasser.
MonthV (m3)
Covering 0% of the AreaCovering 25% of the AreaCovering 50% of the AreaCovering 75% of AreaCovering 100% of the Area
Jan314,184,562.6954,982,298.47109,964,596.94164,946,895.41219,929,193.88
Feb442,024,294.5377,354,251.54154,708,503.09232,062,754.63309,417,006.17
Mar674,557,455.24118,047,554.67236,095,109.33354,142,664.00472,190,218.67
Apr963,987,866.91168,697,876.71337,395,753.42506,093,630.13674,791,506.84
May1,393,726,720.15243,902,176.03487,804,352.05731,706,528.08975,608,704.11
Jun1,639,075,747.18286,838,255.76573,676,511.51860,514,767.271,147,353,023.03
Jul1,708,490,964.67298,985,918.82597,971,837.64896,957,756.451,195,943,675.27
Aug1,737,638,589.87304,086,753.23608,173,506.45912,260,259.681,216,347,012.91
Sep1,327,915,547.14232,385,220.75464,770,441.50697,155,662.25929,540,883.00
Oct945,589,289.41165,478,125.65330,956,251.29496,434,376.94661,912,502.59
Nov494,098,293.8386,467,201.42172,934,402.84259,401,604.26345,868,805.68
Dec363,924,471.3163,686,782.48127,373,564.96191,060,347.44254,747,129.92
Saving0.002,100,912,415.514,201,824,831.036,302,737,246.548,403,649,662.05
Losses12,005,213,802.939,904,301,387.427,803,388,971.915,702,476,556.393,601,564,140.88
Table 6. The areas covered by different water depths.
No.ContourArea between Contours (m2)Area (%) of the Total Area
MinimumMaximum
101375,382,123.776.500
212288,755,479.835.000
323202,128,835.883.500
434173,253,287.903.000
545155,927,959.112.700
656132,827,520.722.300
767115,502,191.932.000
8710288,755,479.835.000
91215288,755,479.835.000
101720311,855,918.215.400
112225294,530,589.425.100
122730254,104,822.254.400
133235202,128,835.883.500
143740132,827,520.722.300
154245138,602,630.322.400
164750173,253,287.903.000
175255213,679,055.073.700
185760179,028,397.493.100
196265410,032,781.357.100
206770294,530,589.425.100
217275231,004,383.864.000
227780196,353,726.283.400
238285358,056,794.986.200
248792.16363,889,655.686.301
sum5,775,109,596100.00
Publisher’s Note: MDPI stays neutral with regard to jurisdictional claims in published maps and institutional affiliations.

