
Driving Factors and Risk Assessment of Rainstorm Waterlogging in Urban Agglomeration Areas: A Case Study of the Guangdong-Hong Kong-Macao Greater Bay Area, China


Abstract
:1. Introduction
- (1)
- What are the main driving factors of rainstorm waterlogging in the GBA? How do the various driving factors affect the occurrence of rainstorm waterlogging?
- (2)
- Are there spatial differences in the impacts of various driving factors on rainstorm waterlogging in the GBA?
- (3)
- Where are the areas with high risks of rainstorm waterlogging in the GBA under the combined effect of various driving factors?
- (4)
- How can the risk of rainstorm waterlogging in the GBA be effectively alleviated?
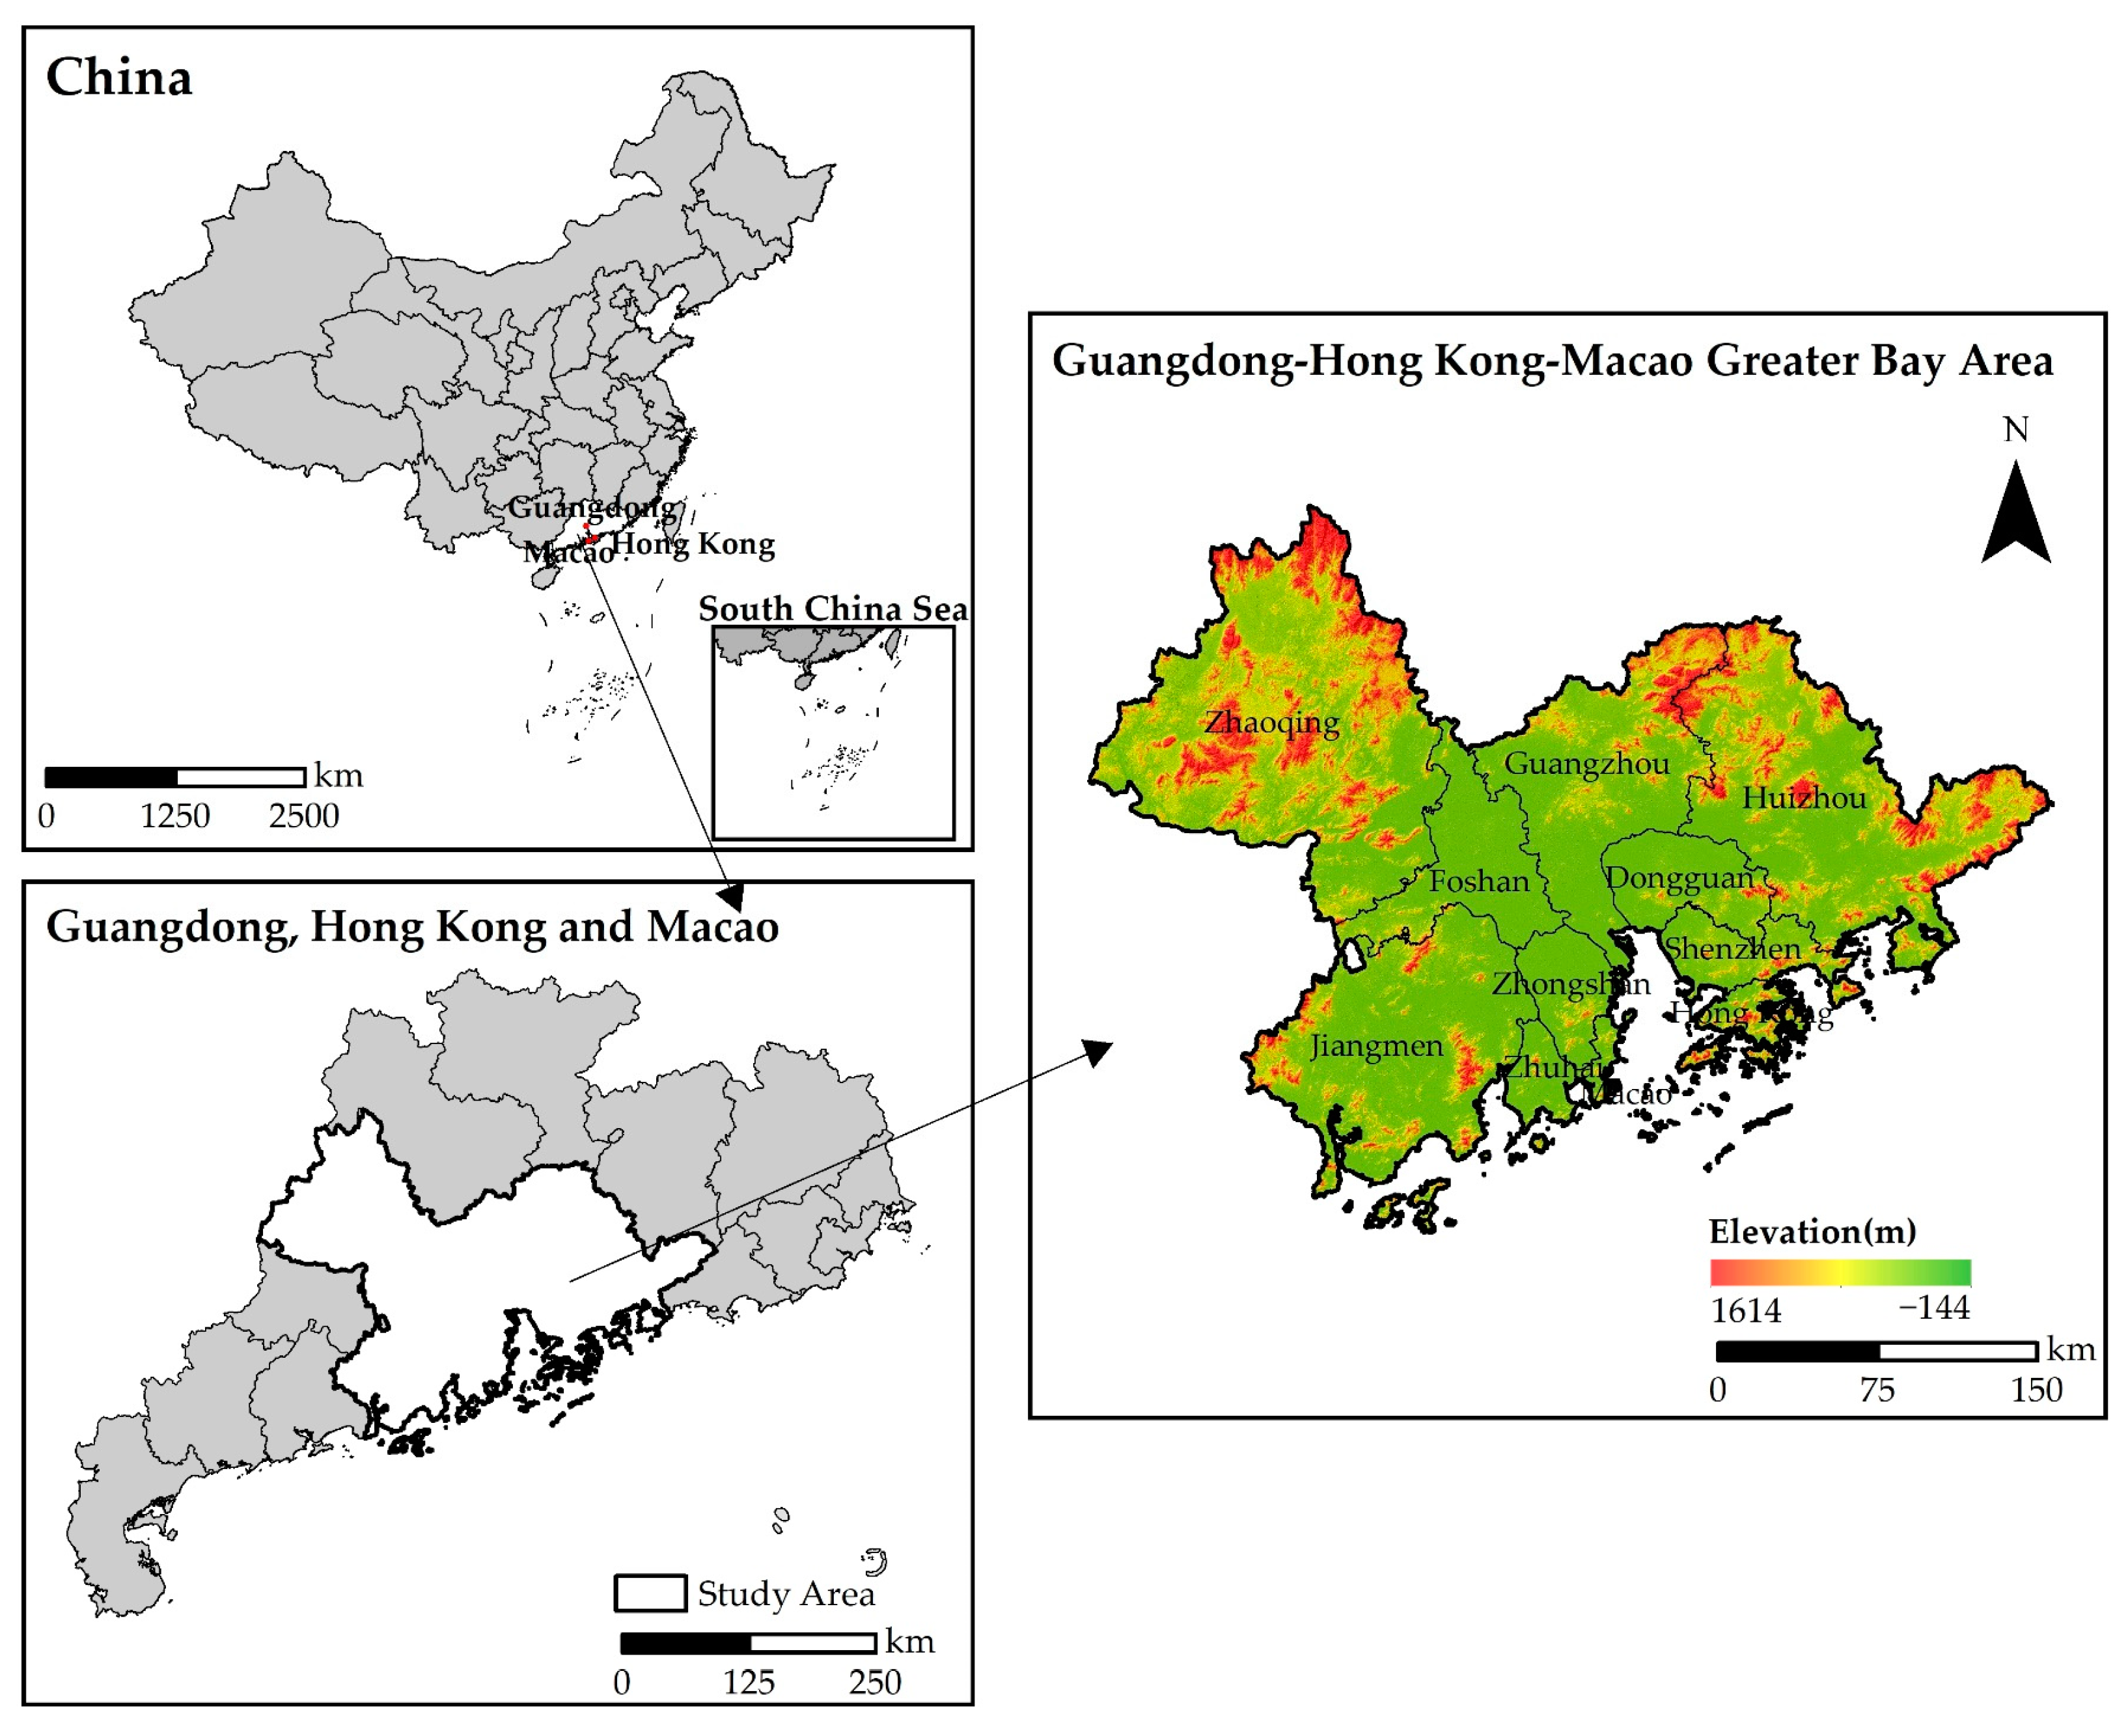
2. Study Area and Datasets
2.1. Study Area
2.2. Datasets and Pre-Processing
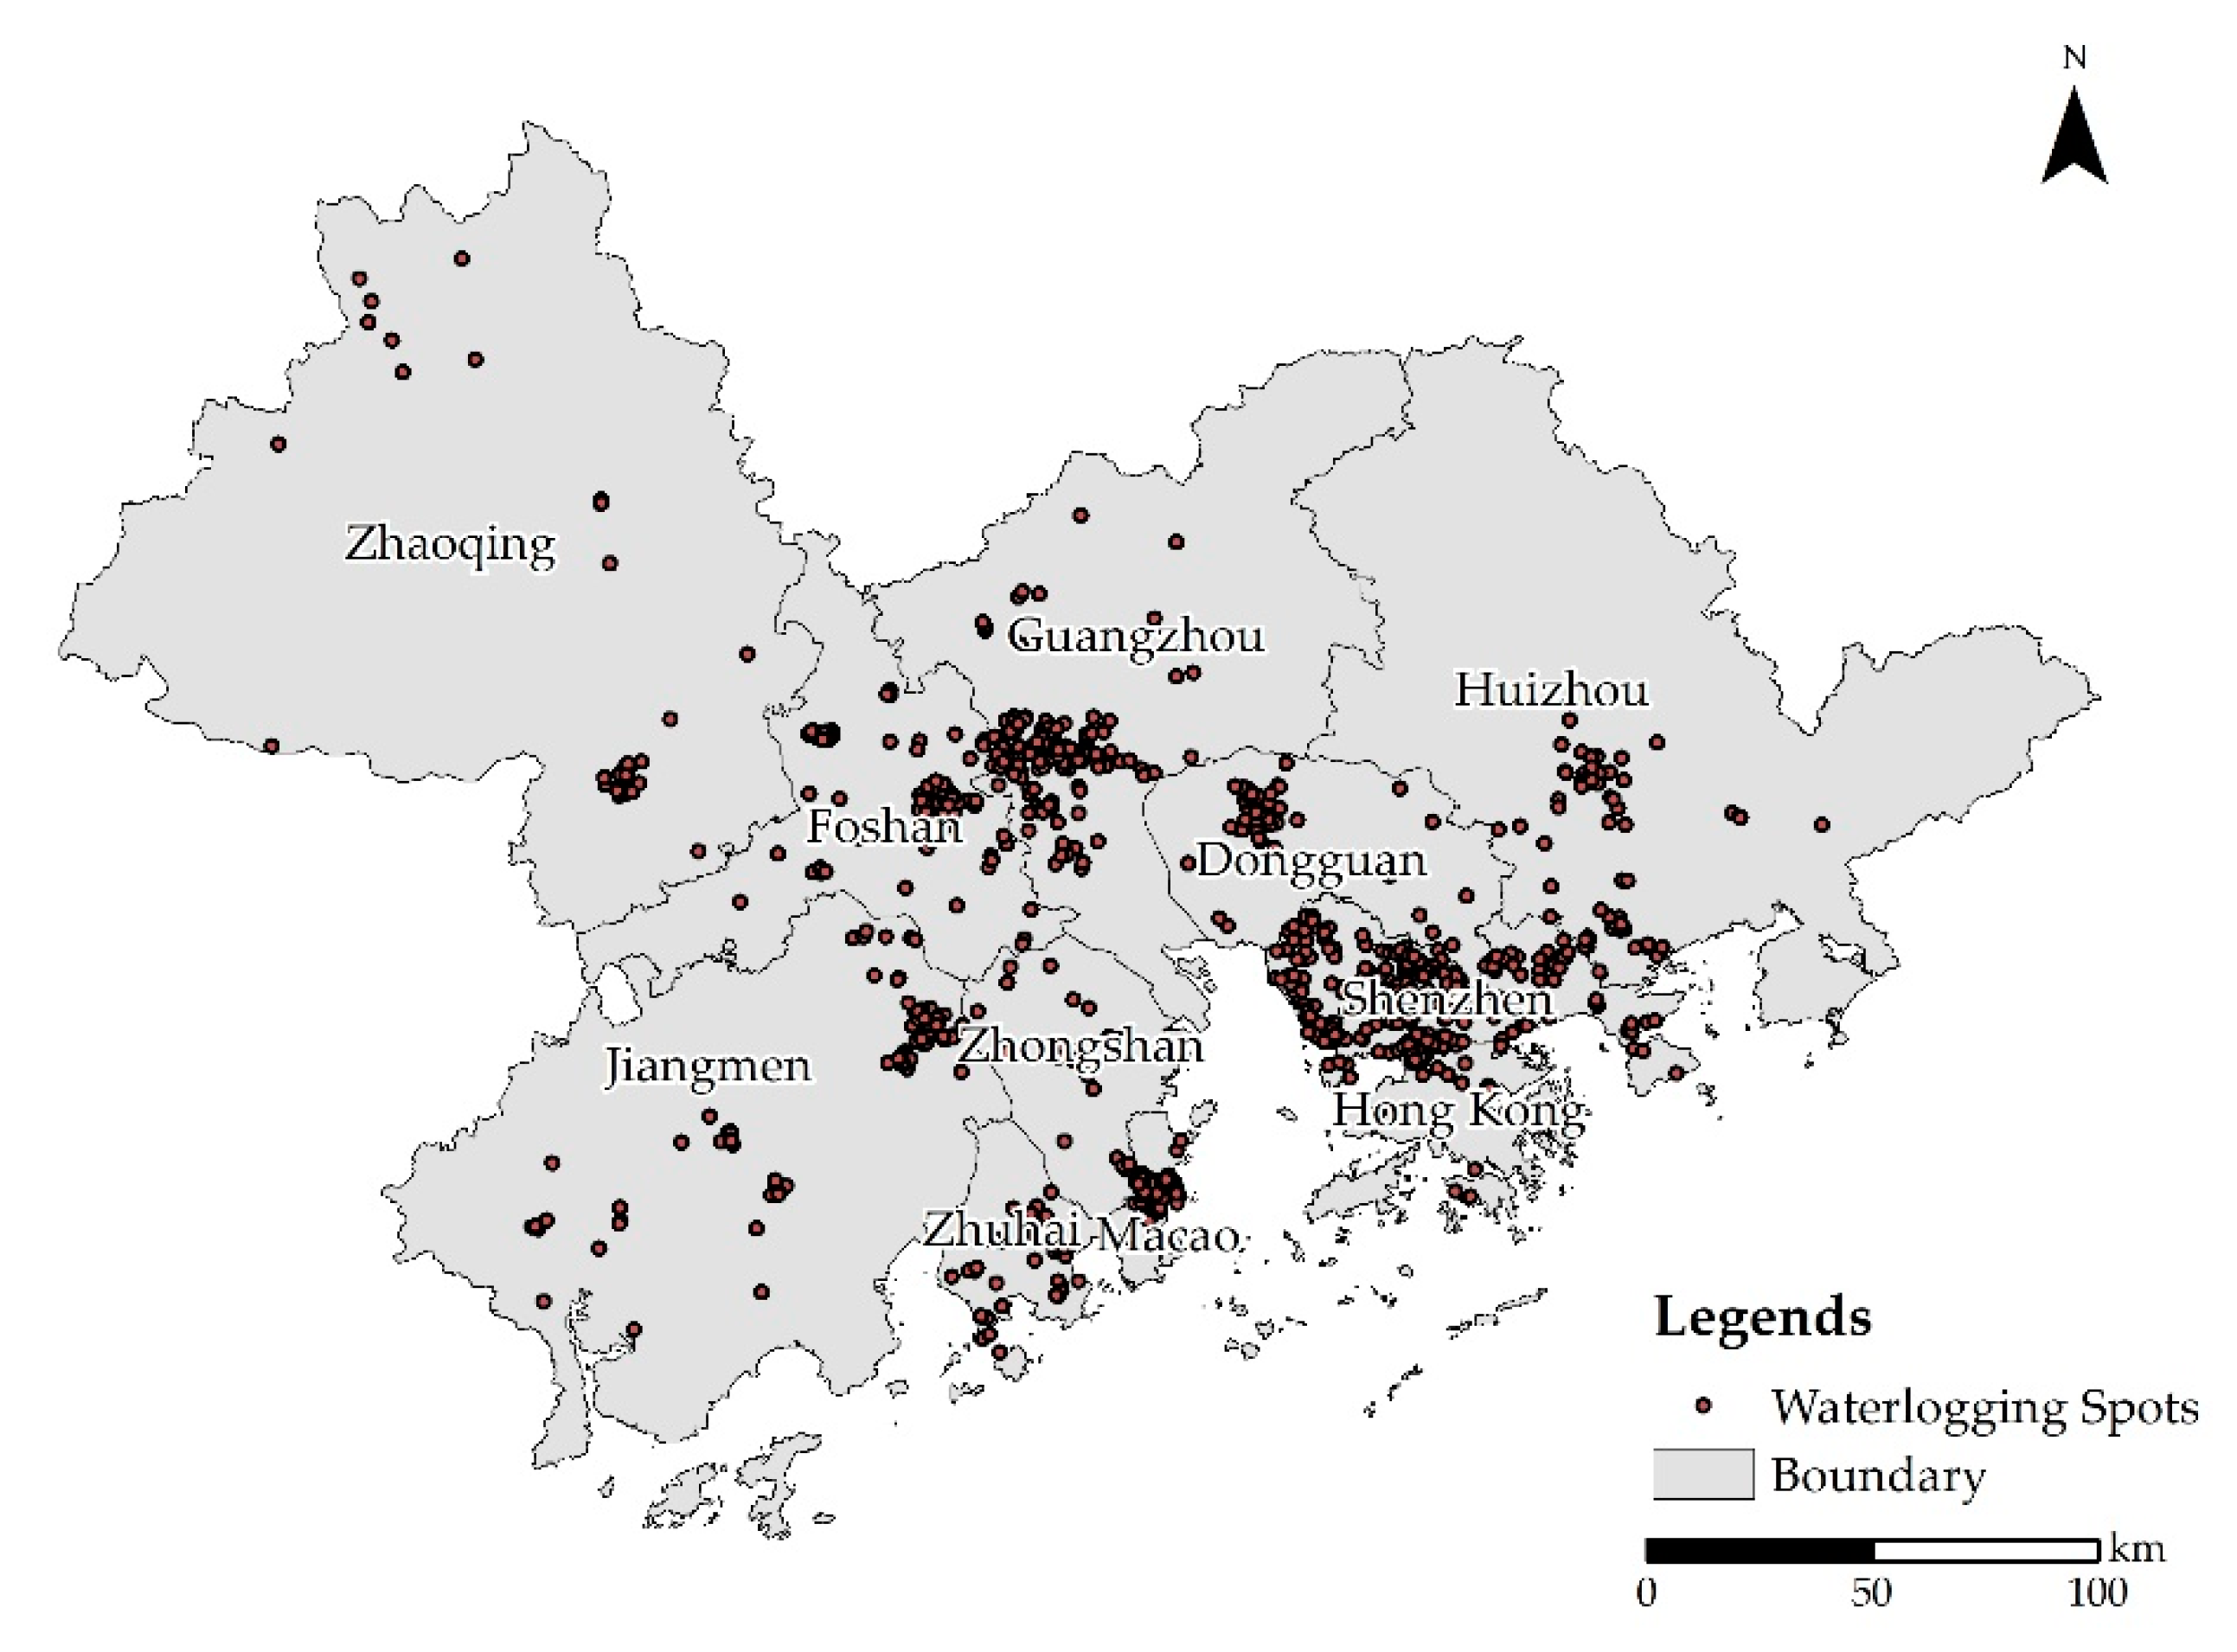
2.2.1. Rainstorm Waterlogging Inventory
2.2.2. Driving Factors of Rainstorm Waterlogging
Land Cover Characteristics
Topography
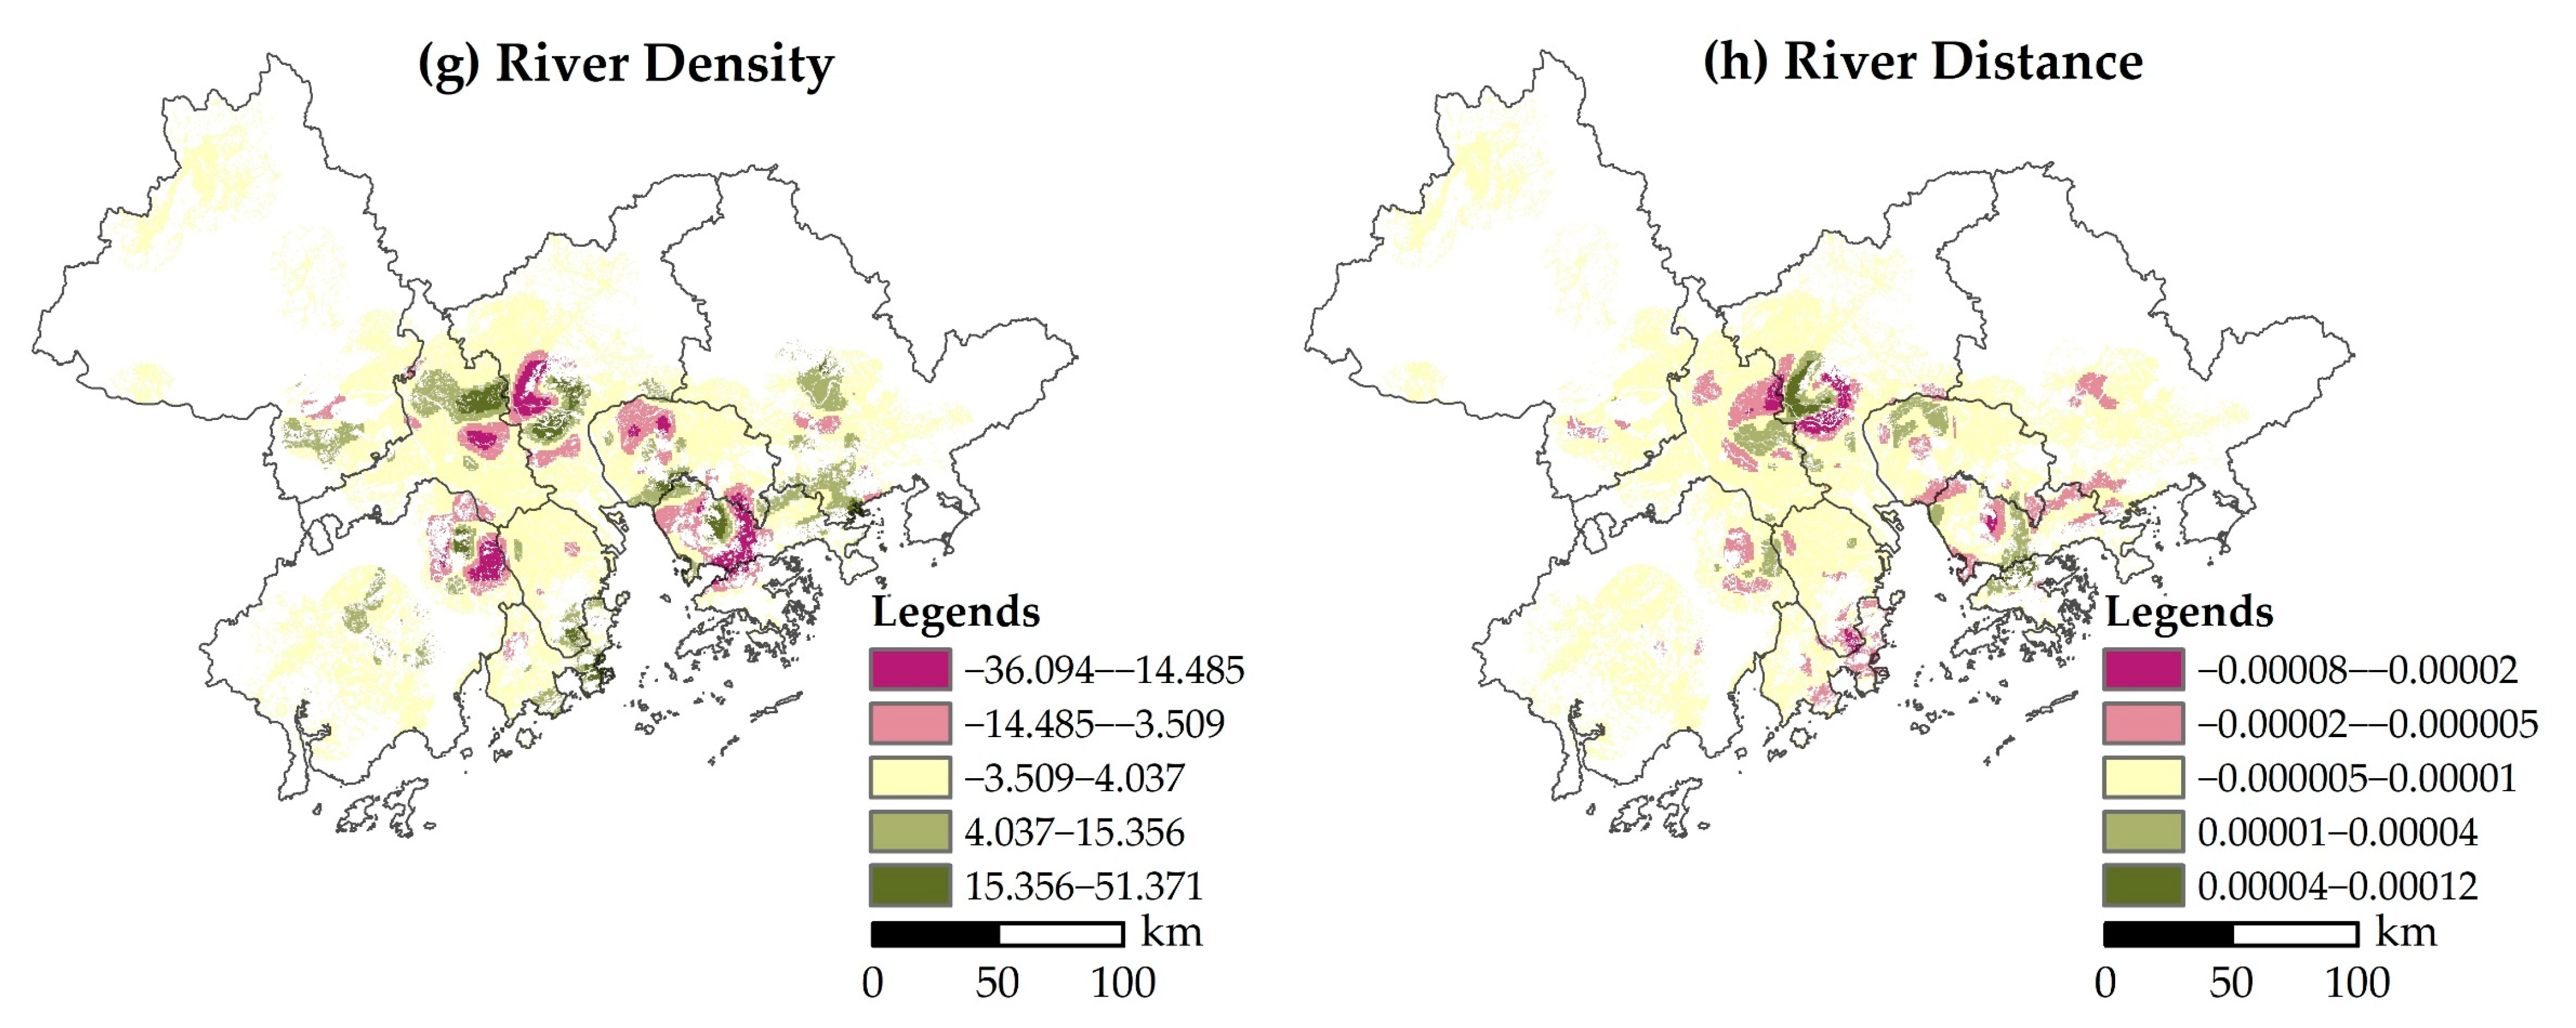
Water Network
3. Methods
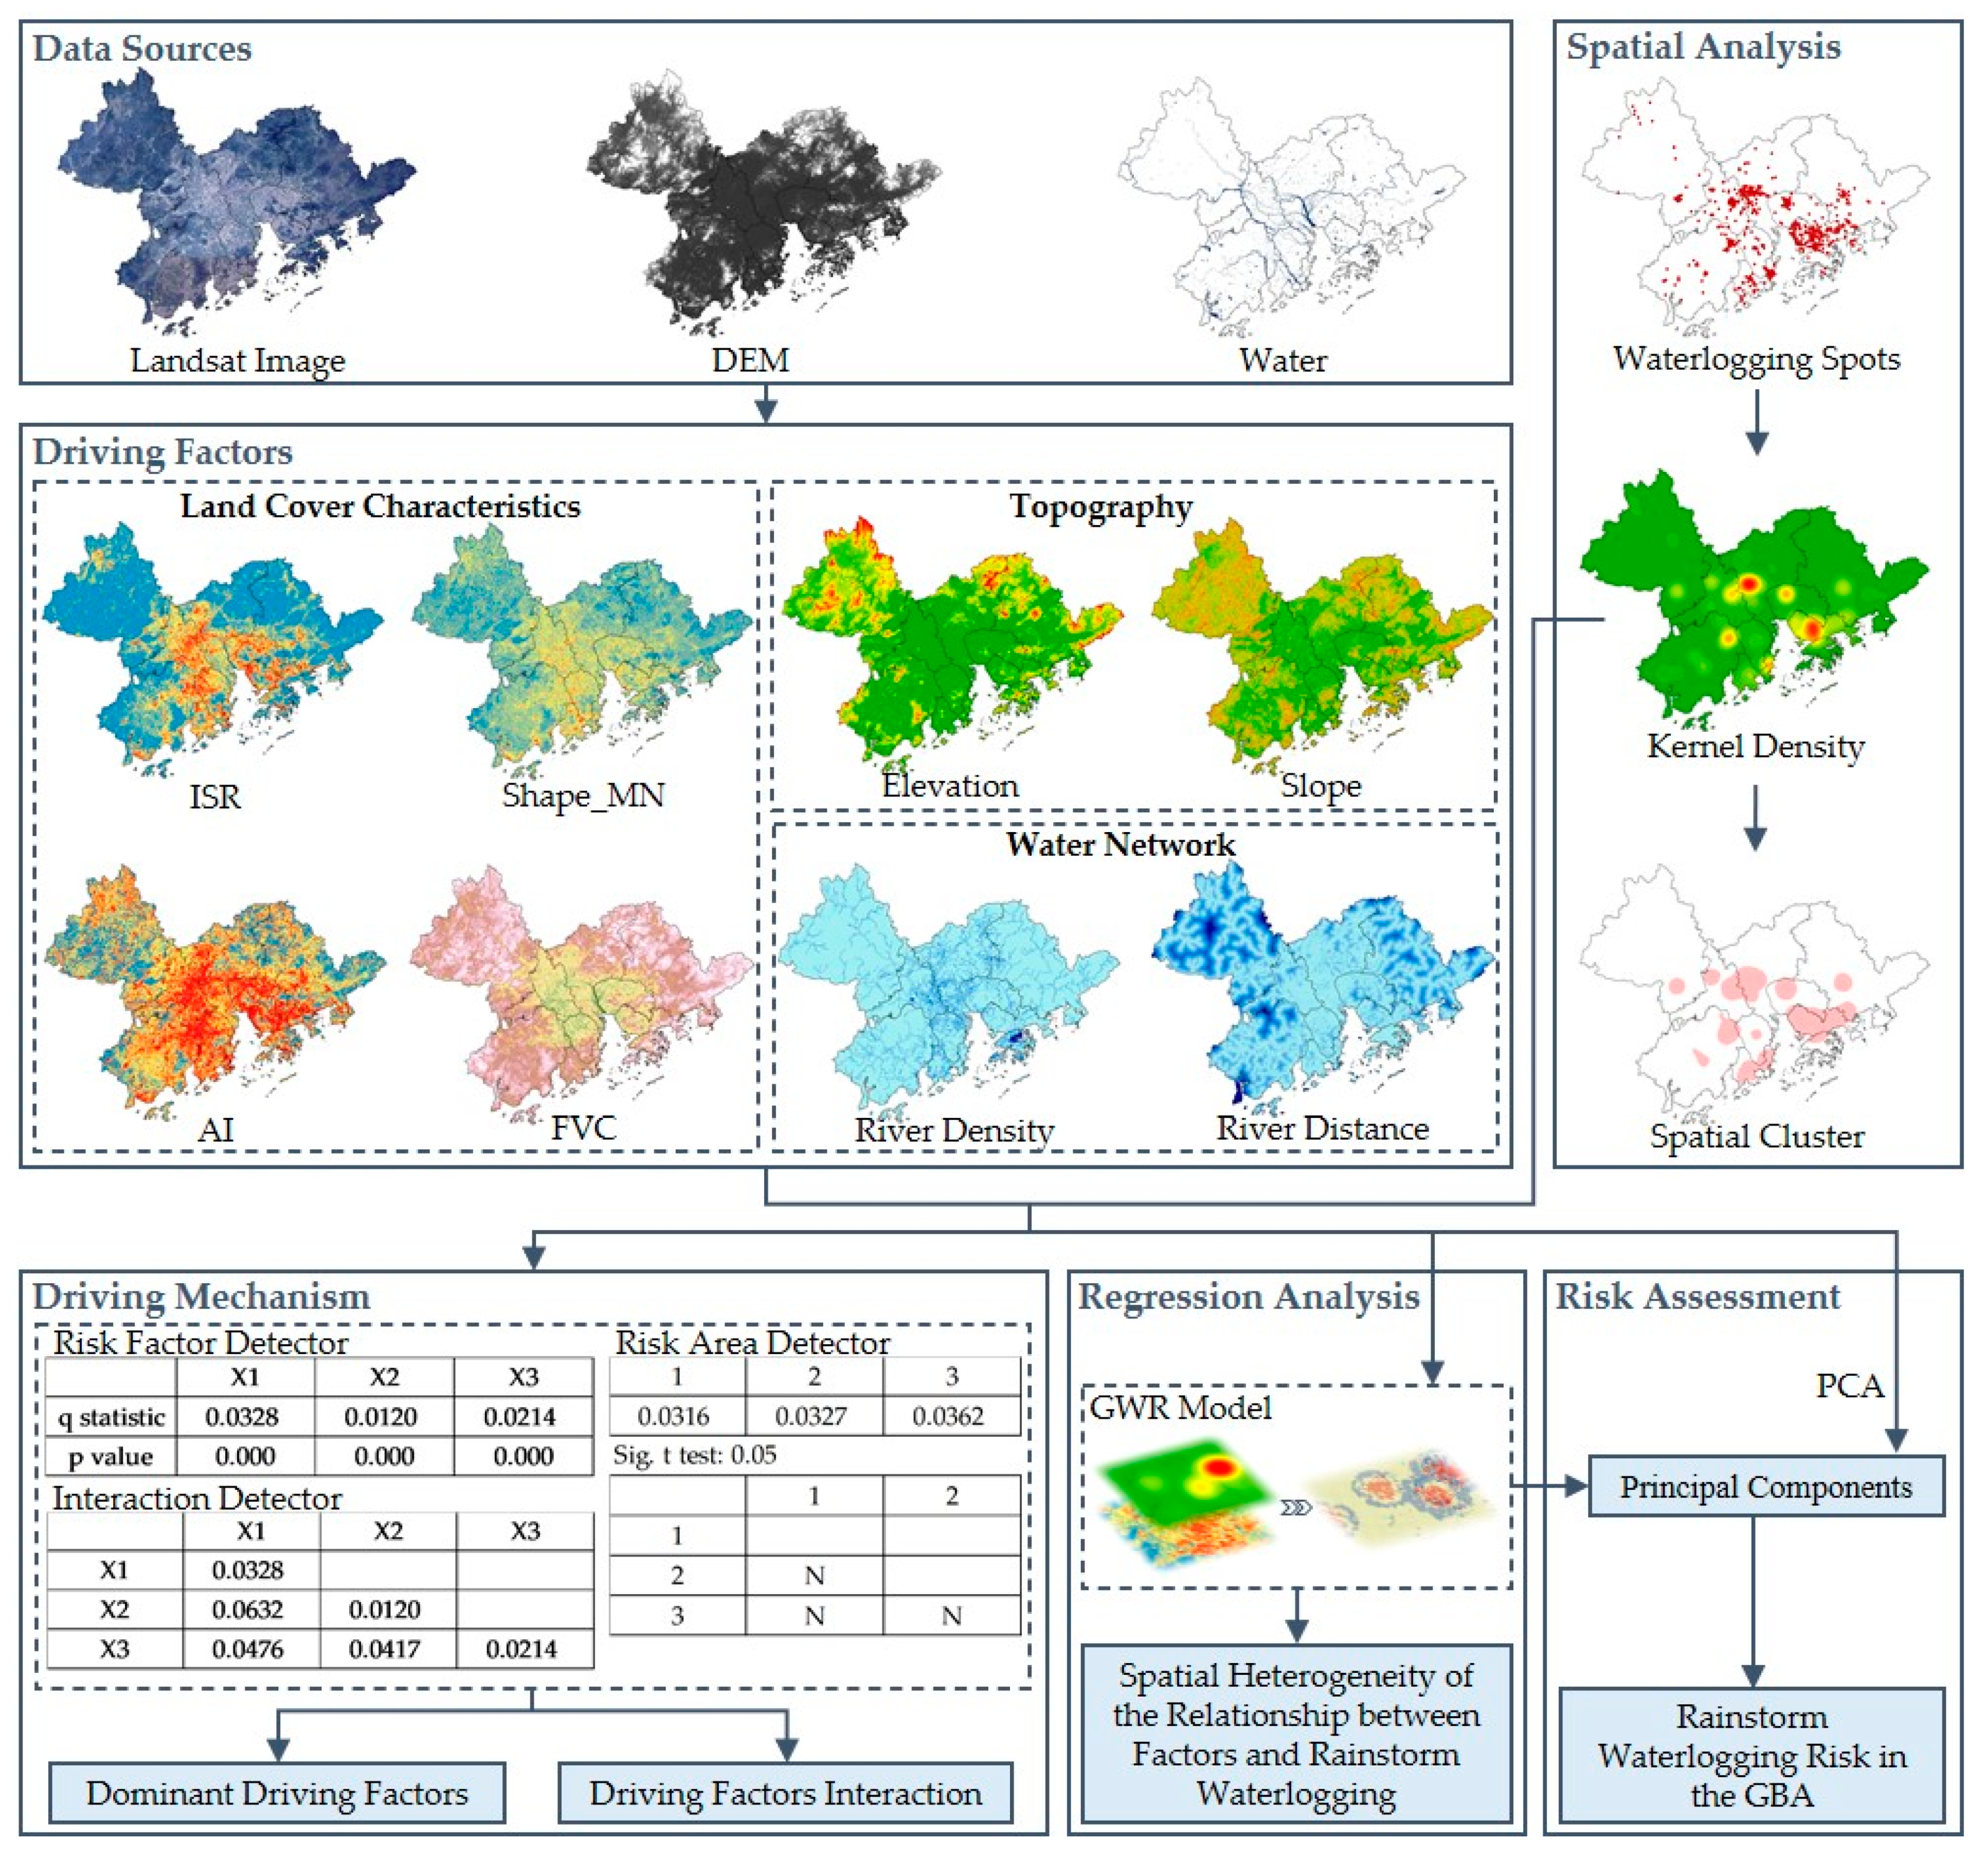
3.1. Integrated Frameworks
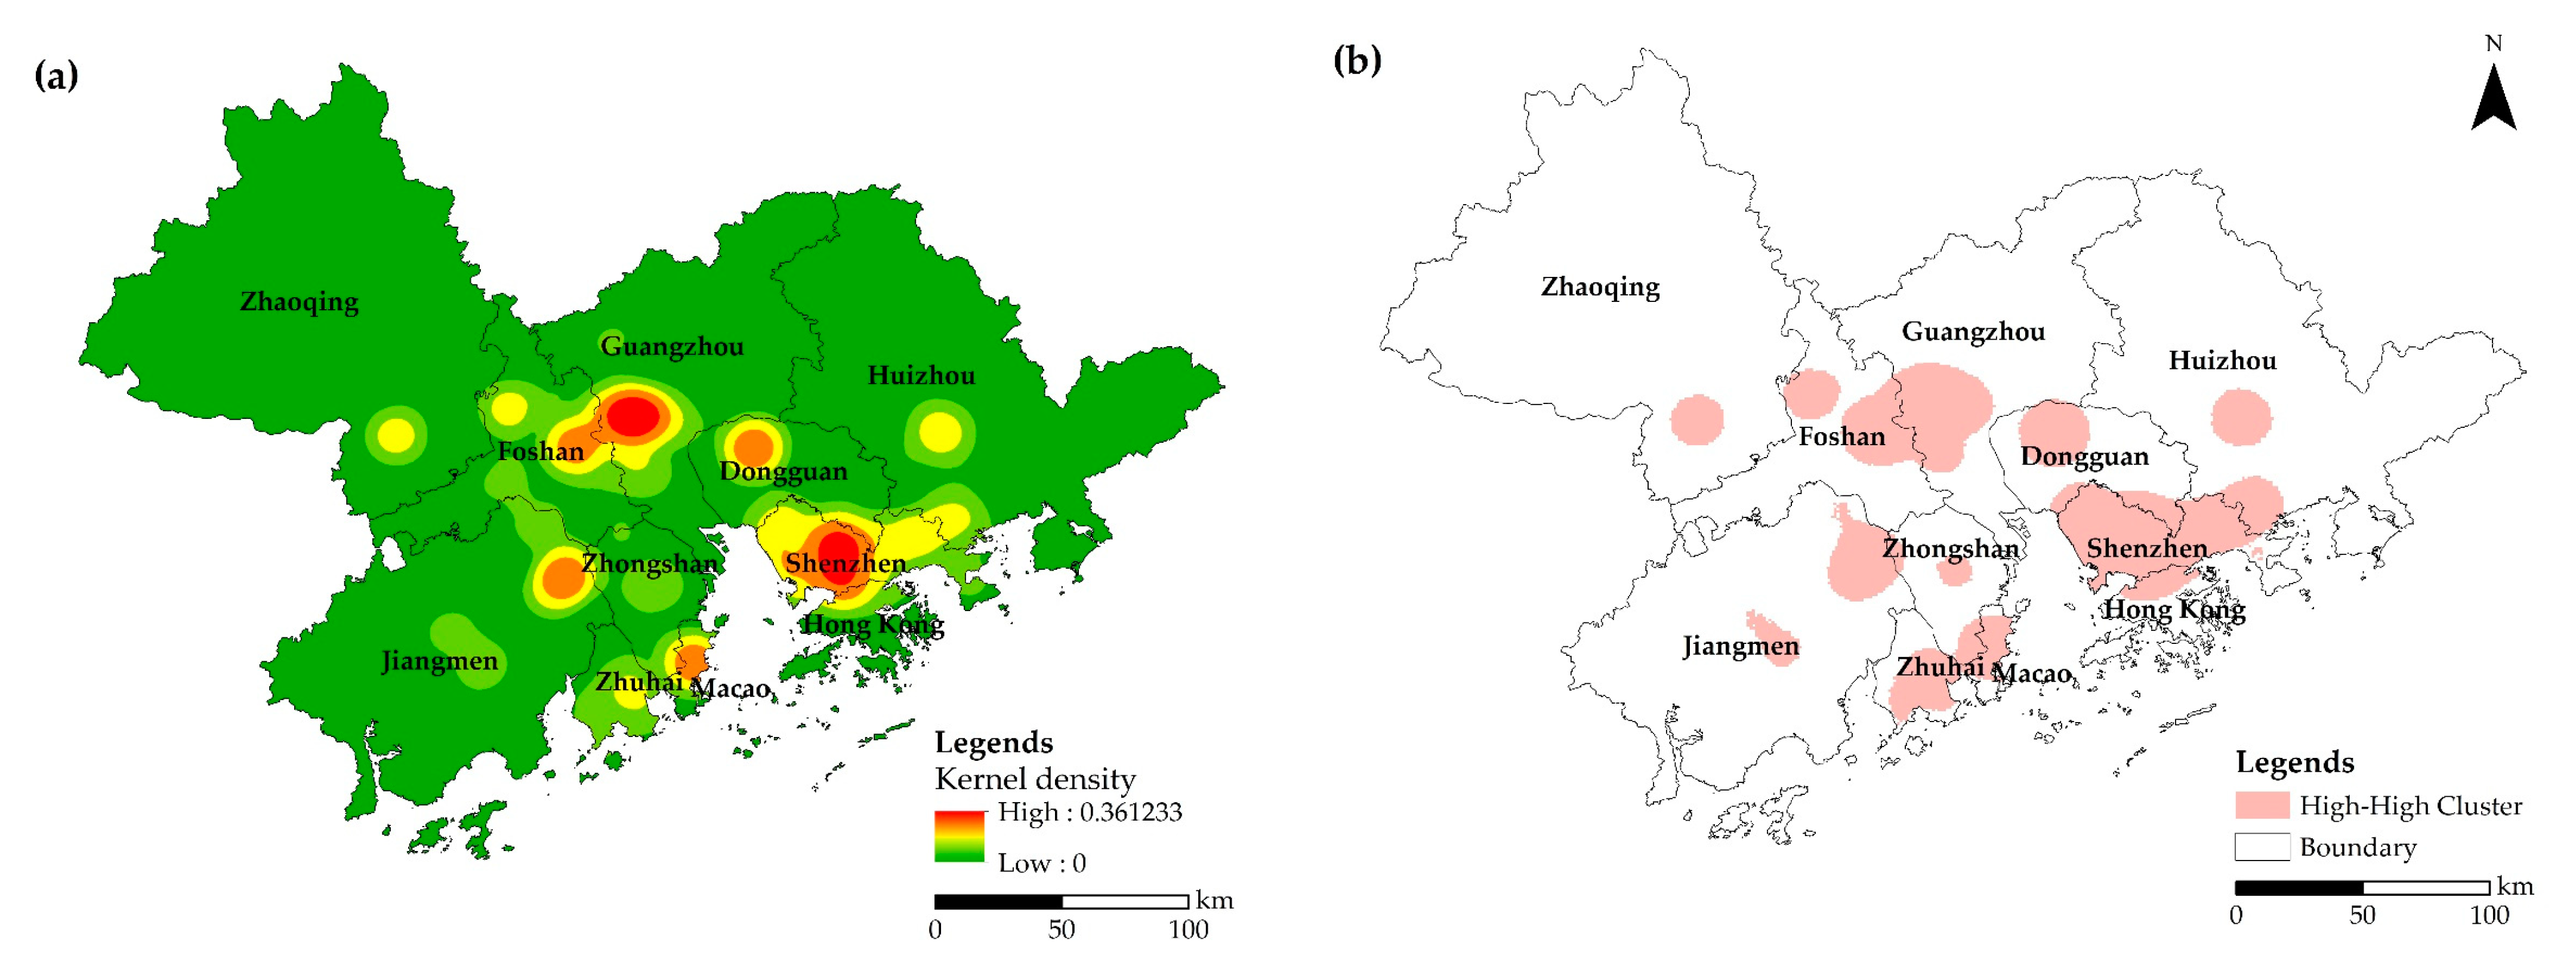
3.2. Spatial Pattern Analysis Method
3.3. Mechanism Analysis Method
3.4. Regression Analysis Method
4. Result
4.1. Spatial Distribution Characteristics of Rainstorm Waterlogging Spots in the GBA
4.2. Factors Driving Rainstorm Waterlogging in the GBA
4.2.1. Dominant Driving Factor Analysis
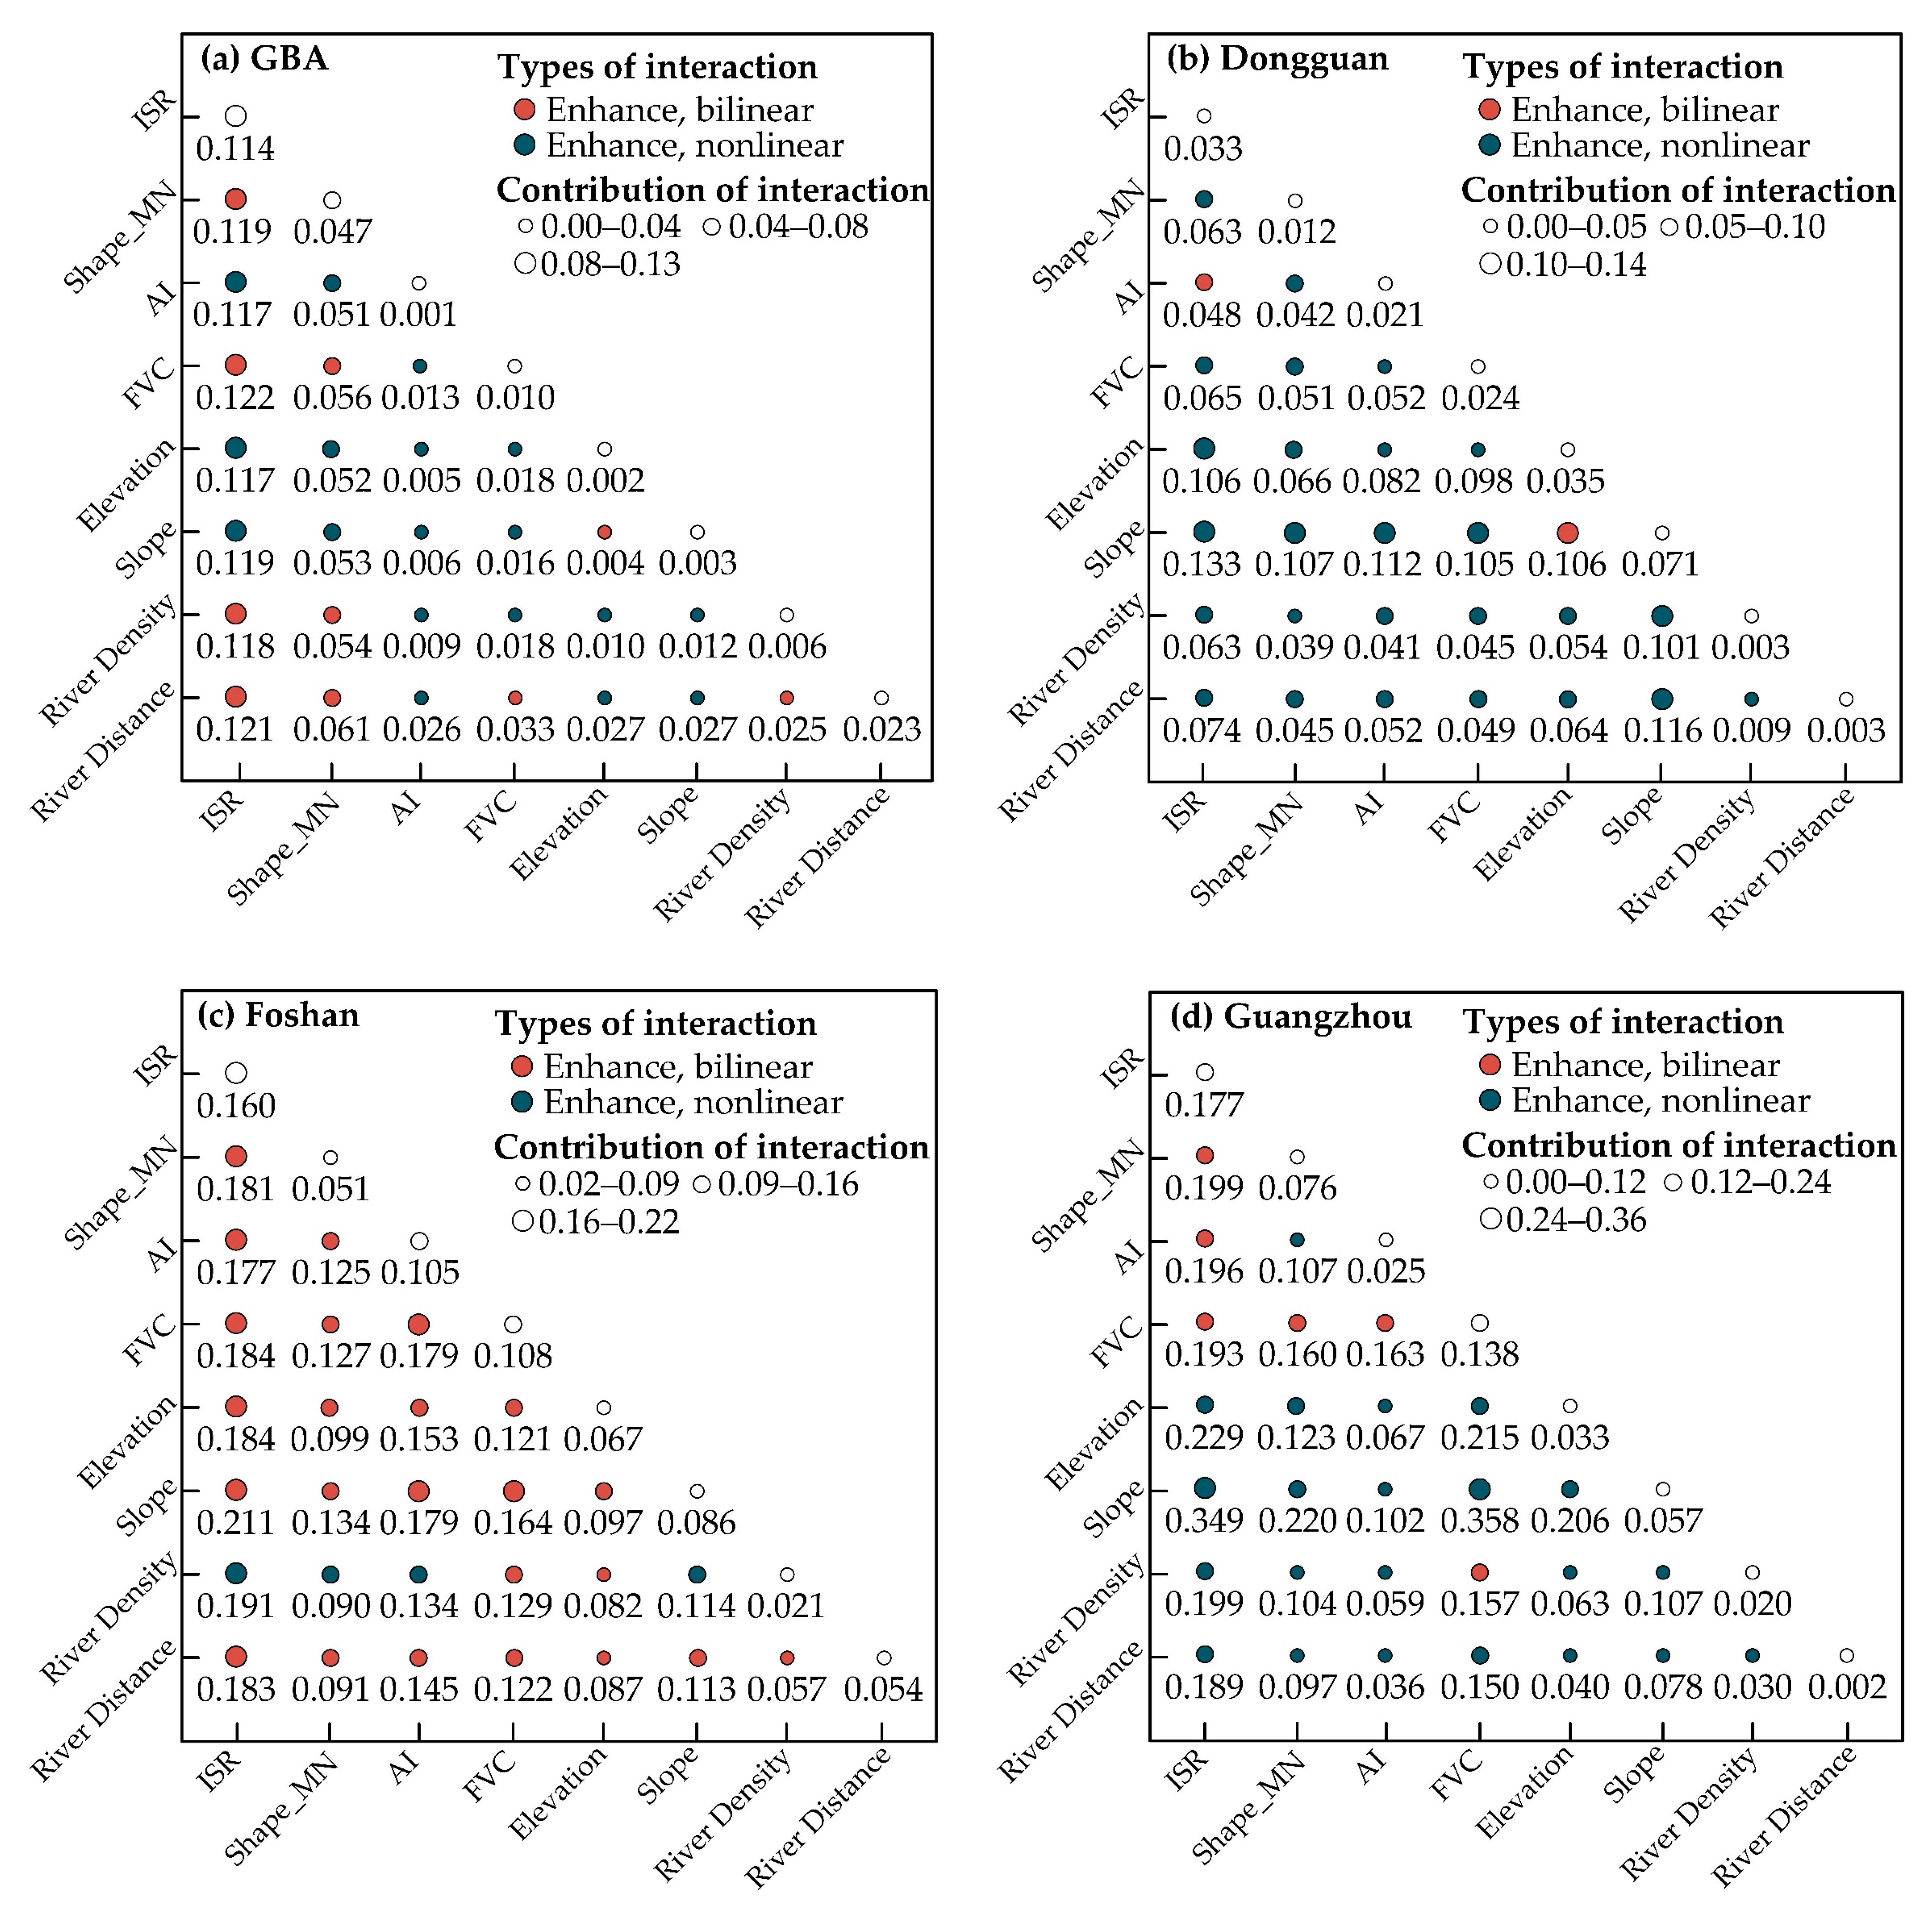
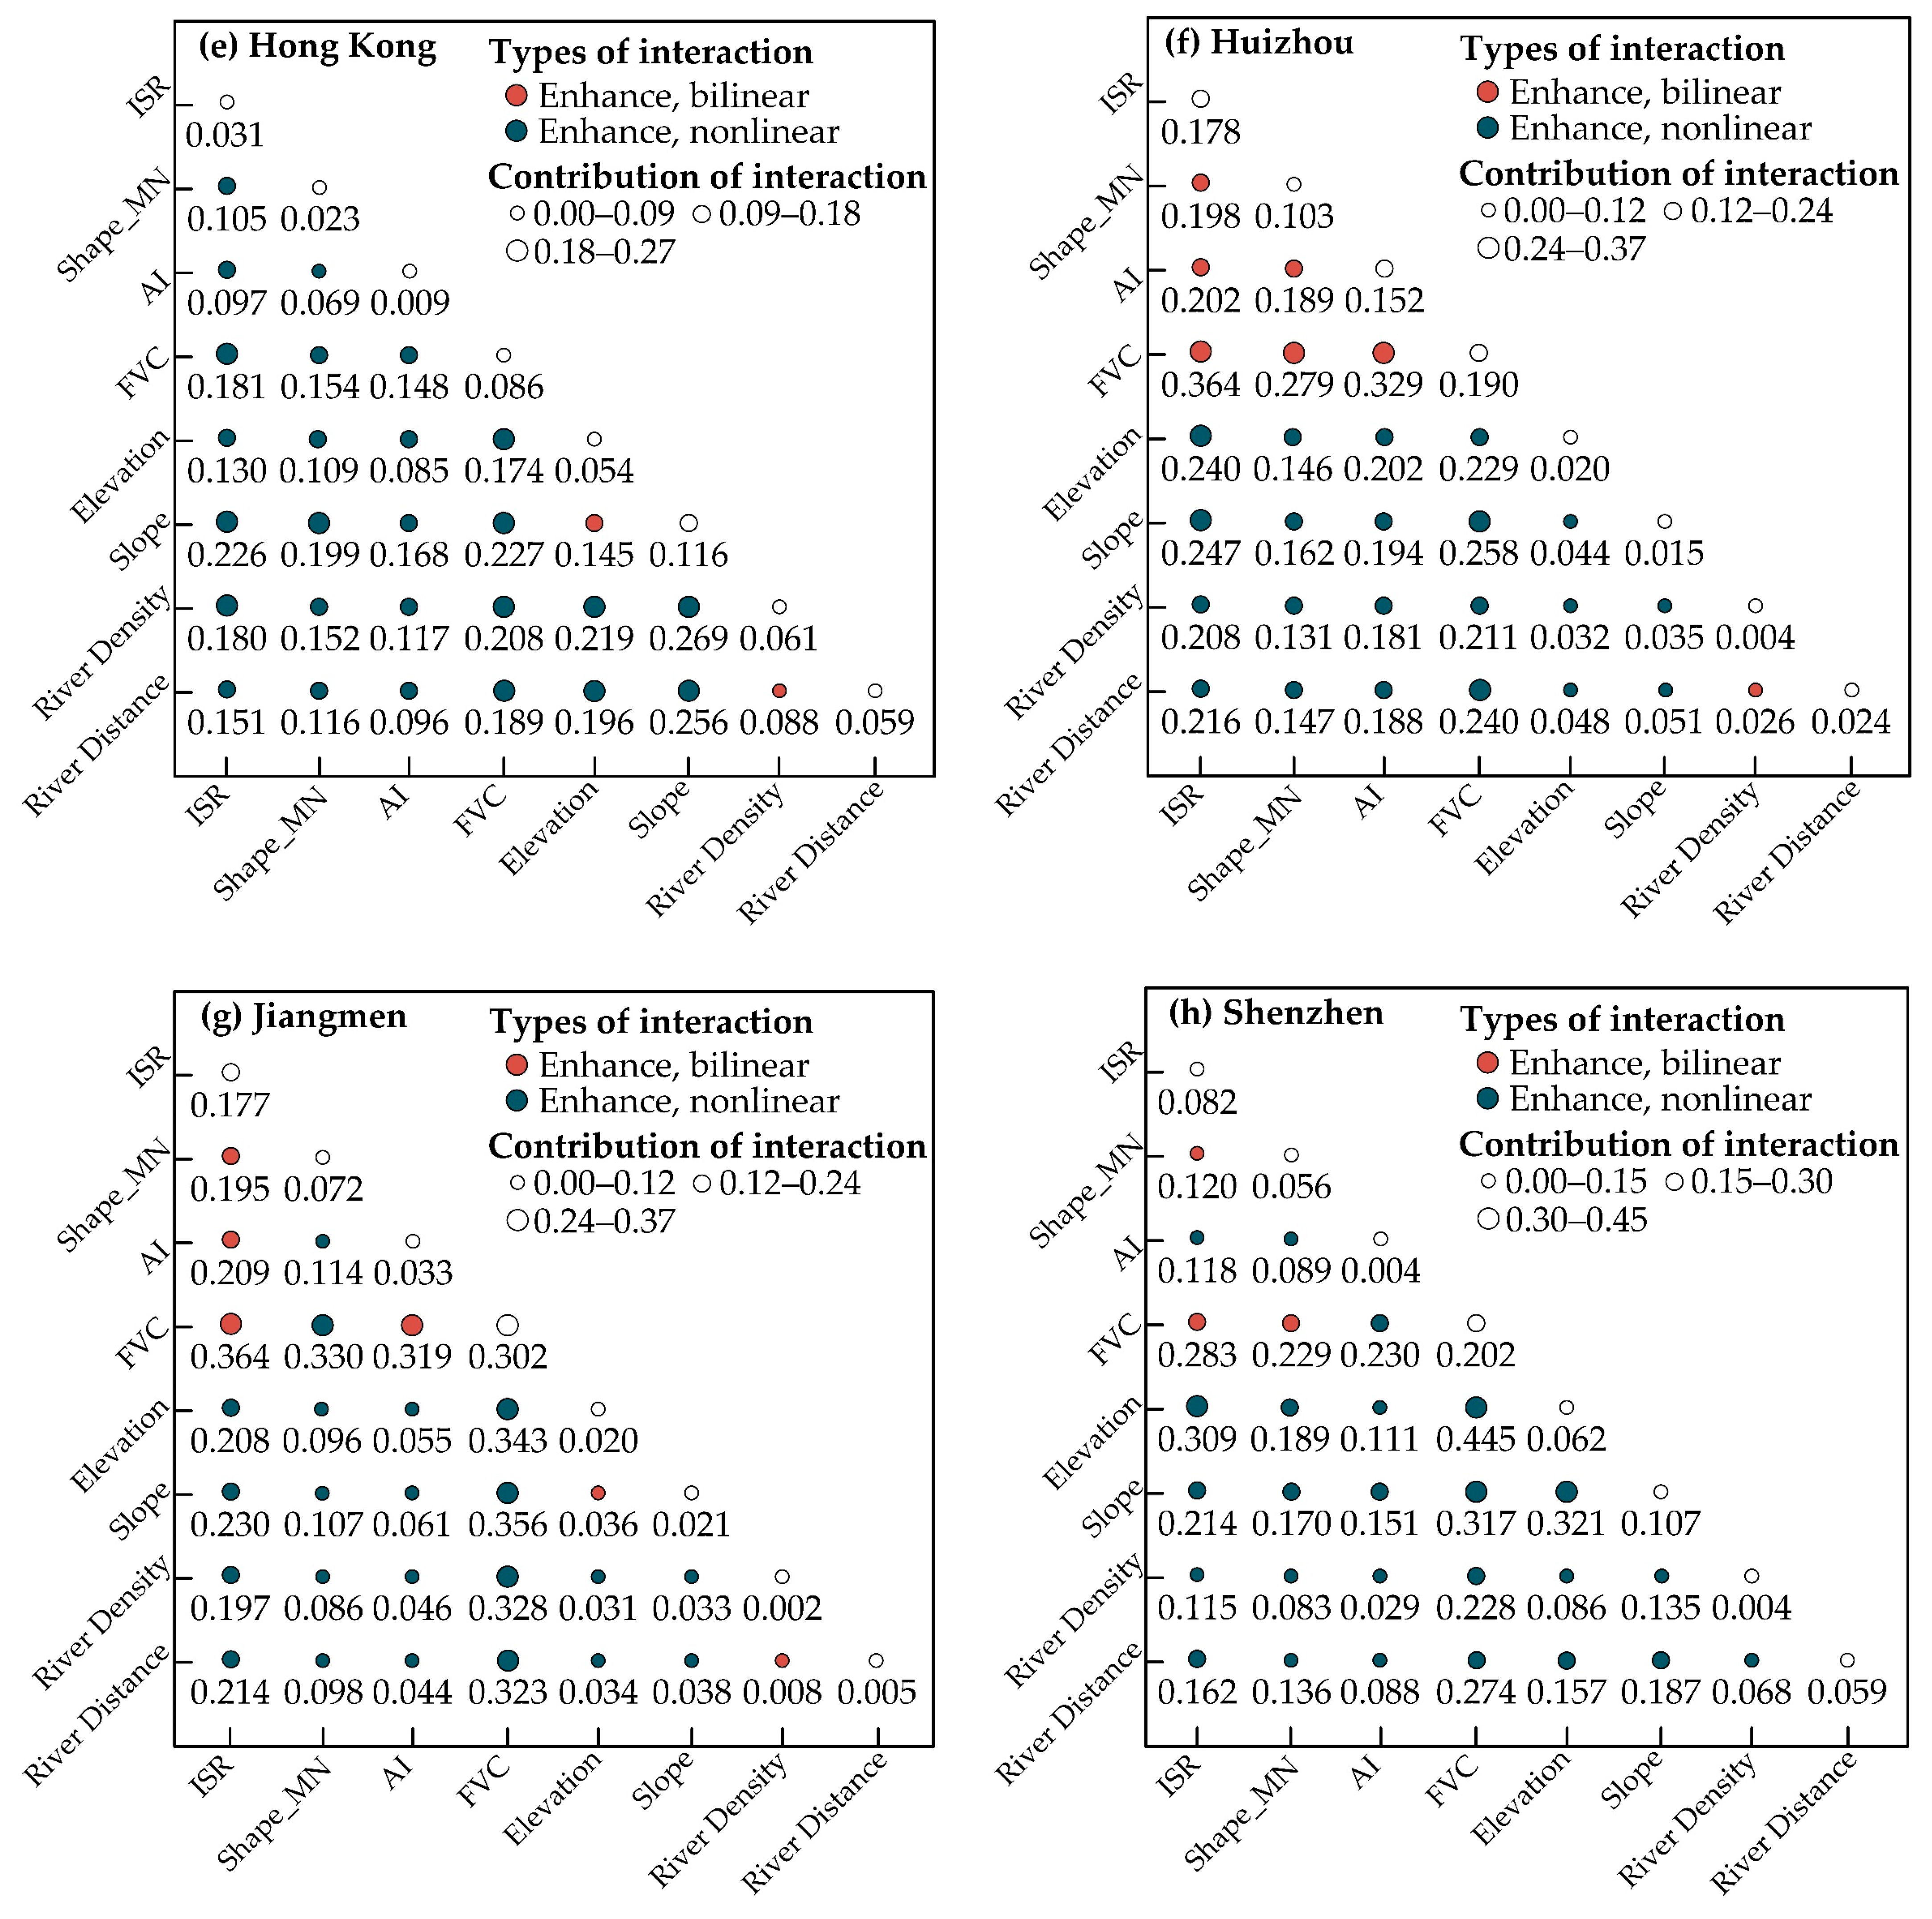
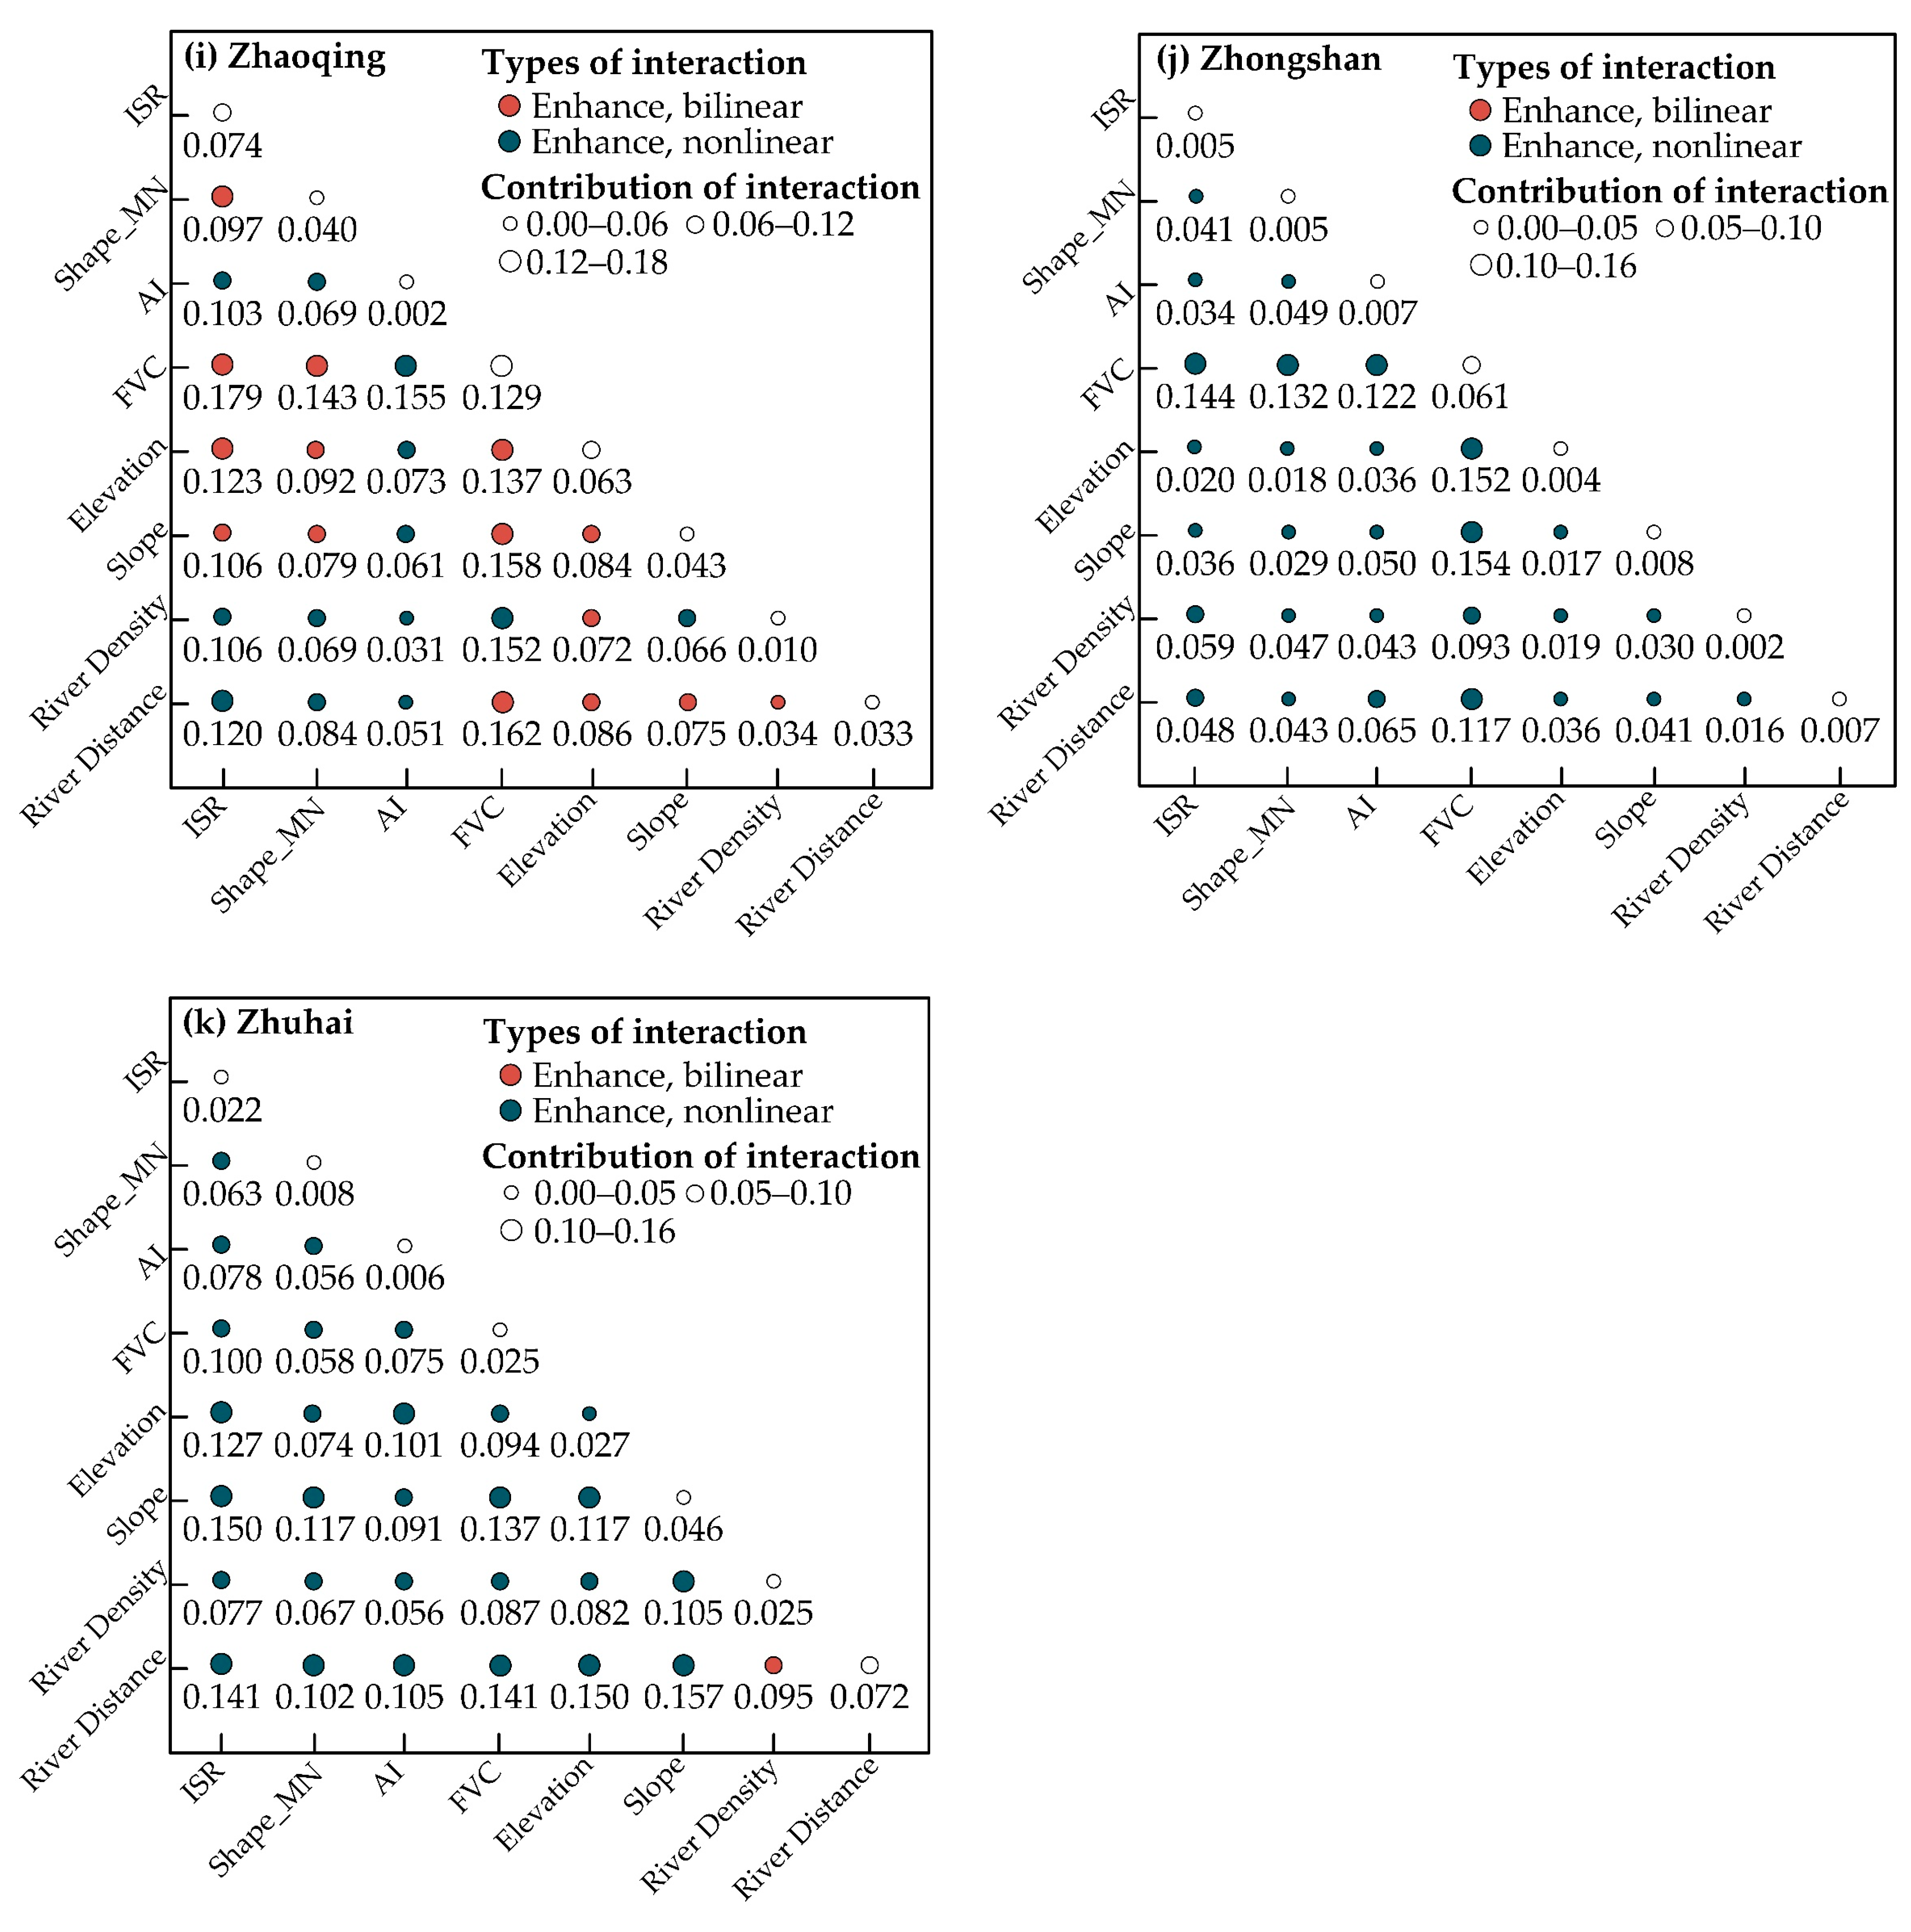
4.2.2. Interactive Analysis of Driving Factors
4.3. Spatial Regression Analysis of the Driving Mechanisms of Driving Factors on Rainstorm Waterlogging
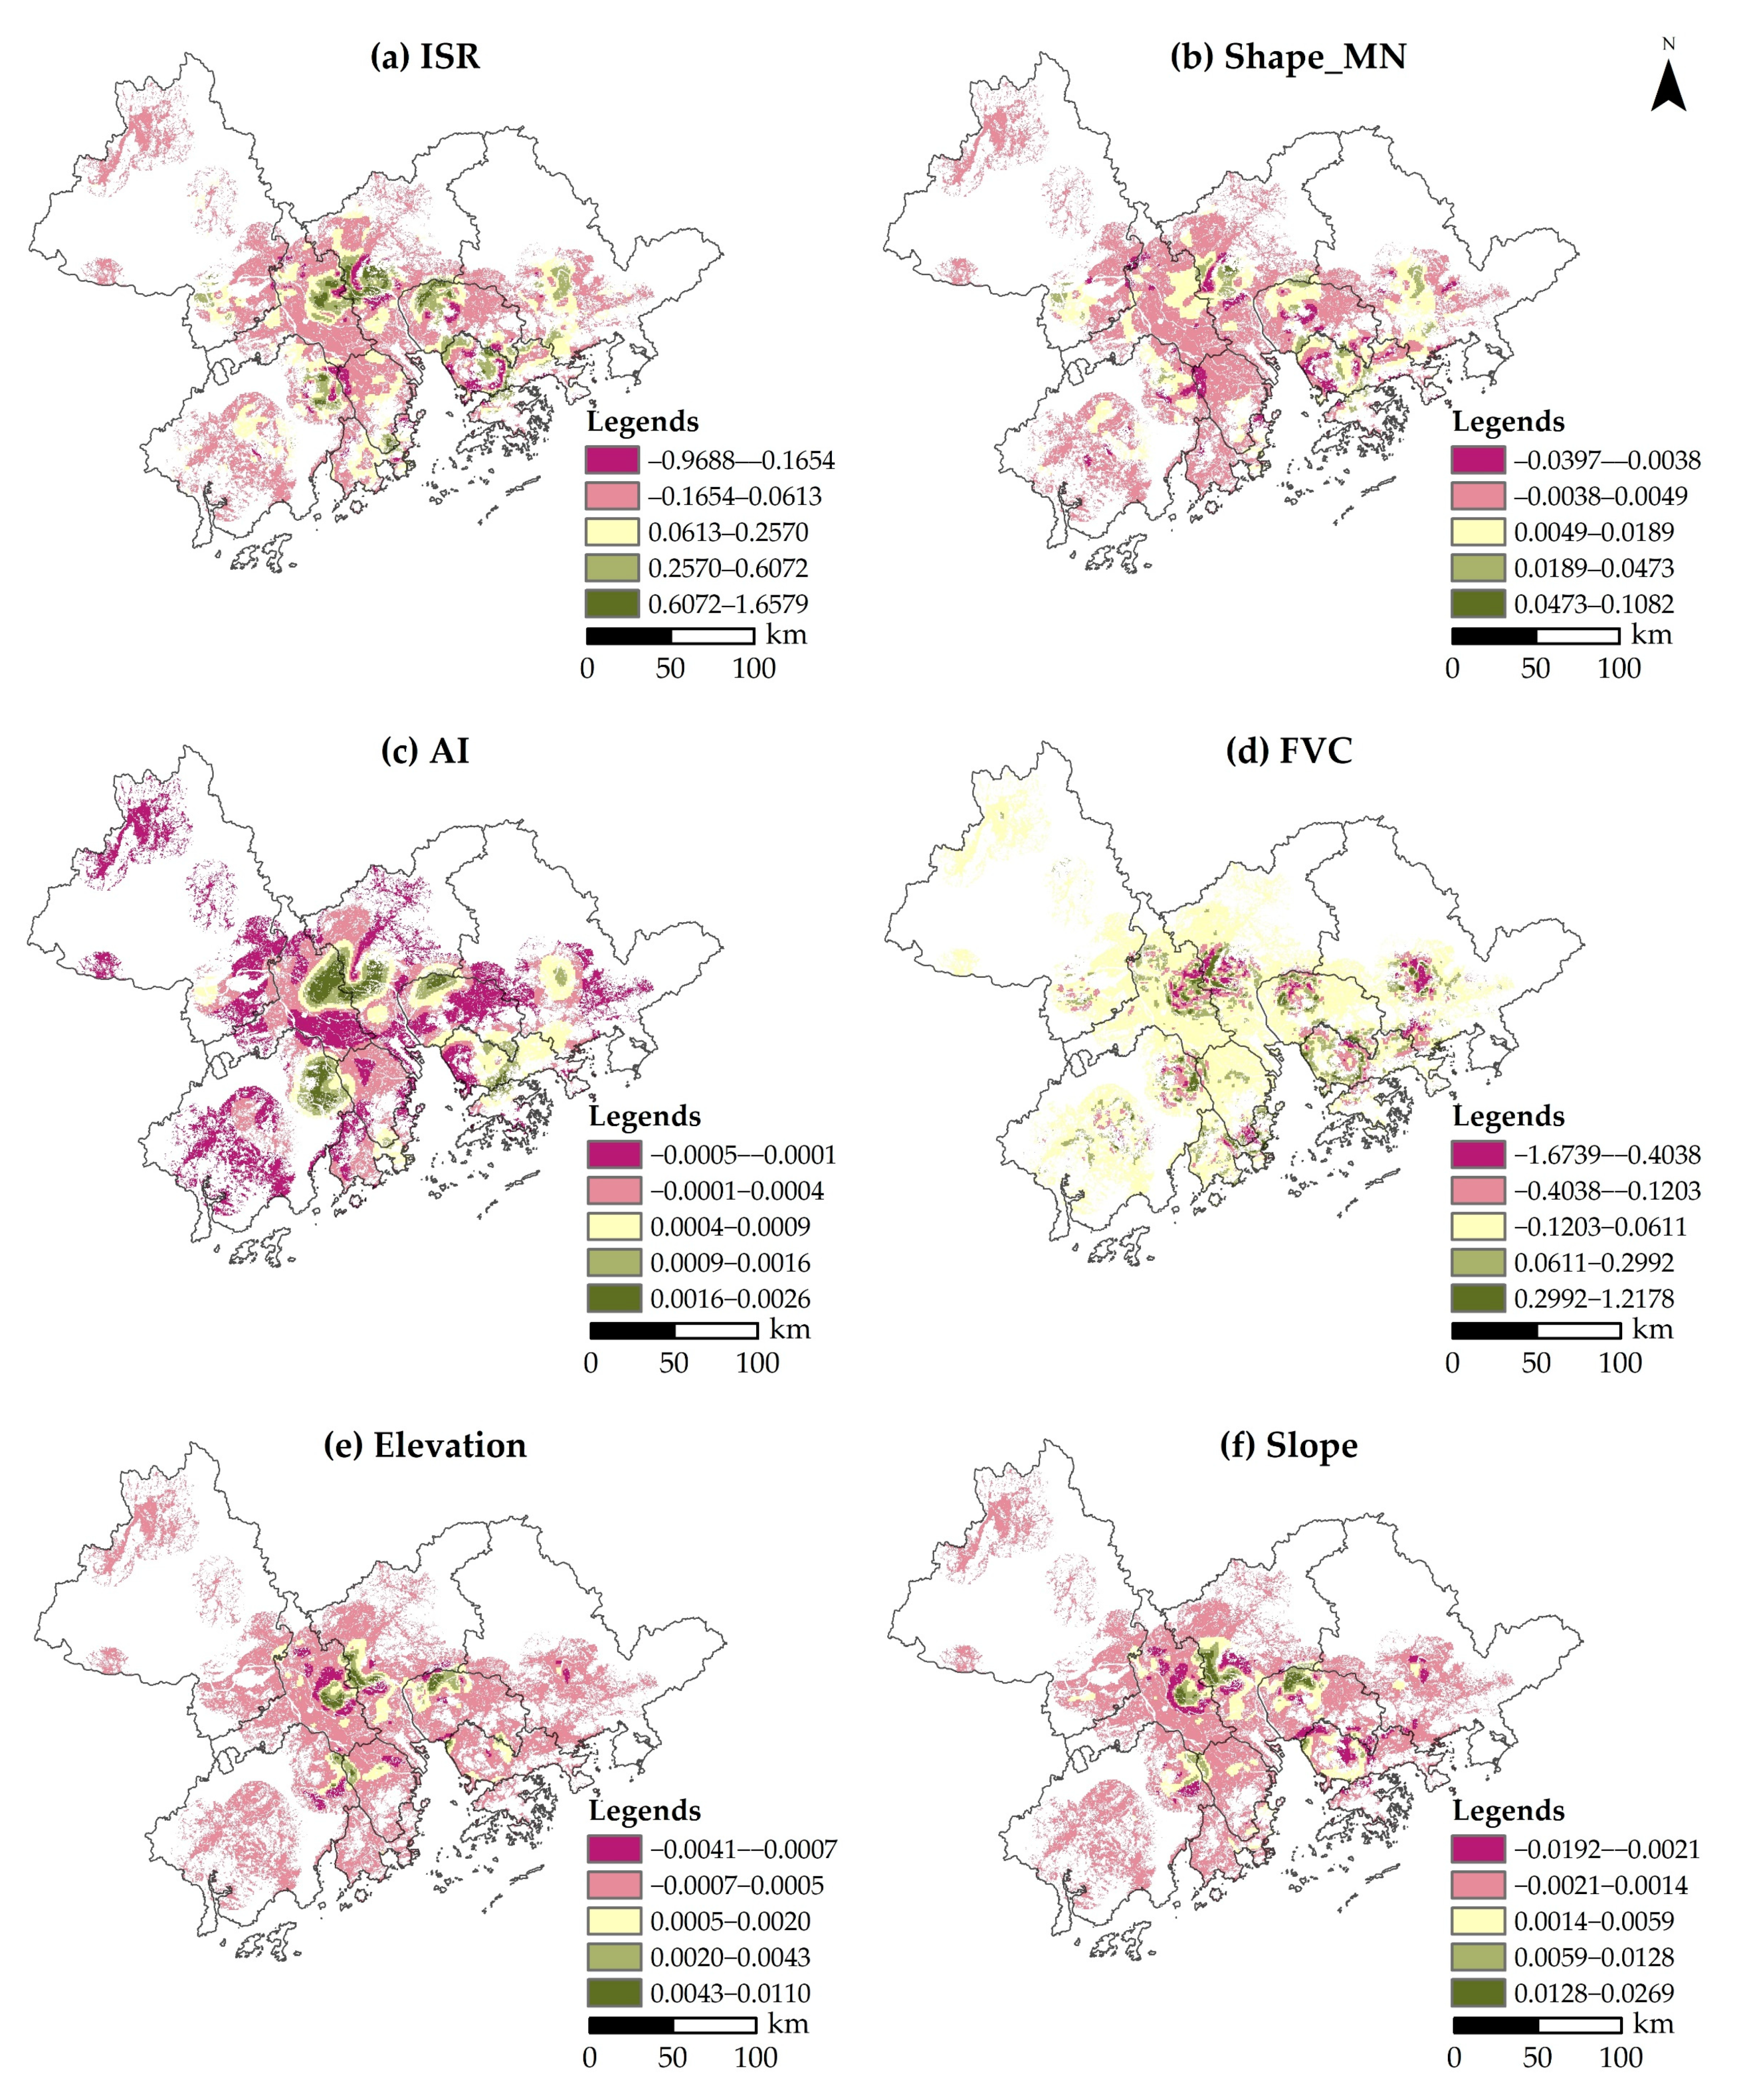
4.3.1. The Spatial Non-Stationarity Between Rainstorm Waterlogging and Driving Factors
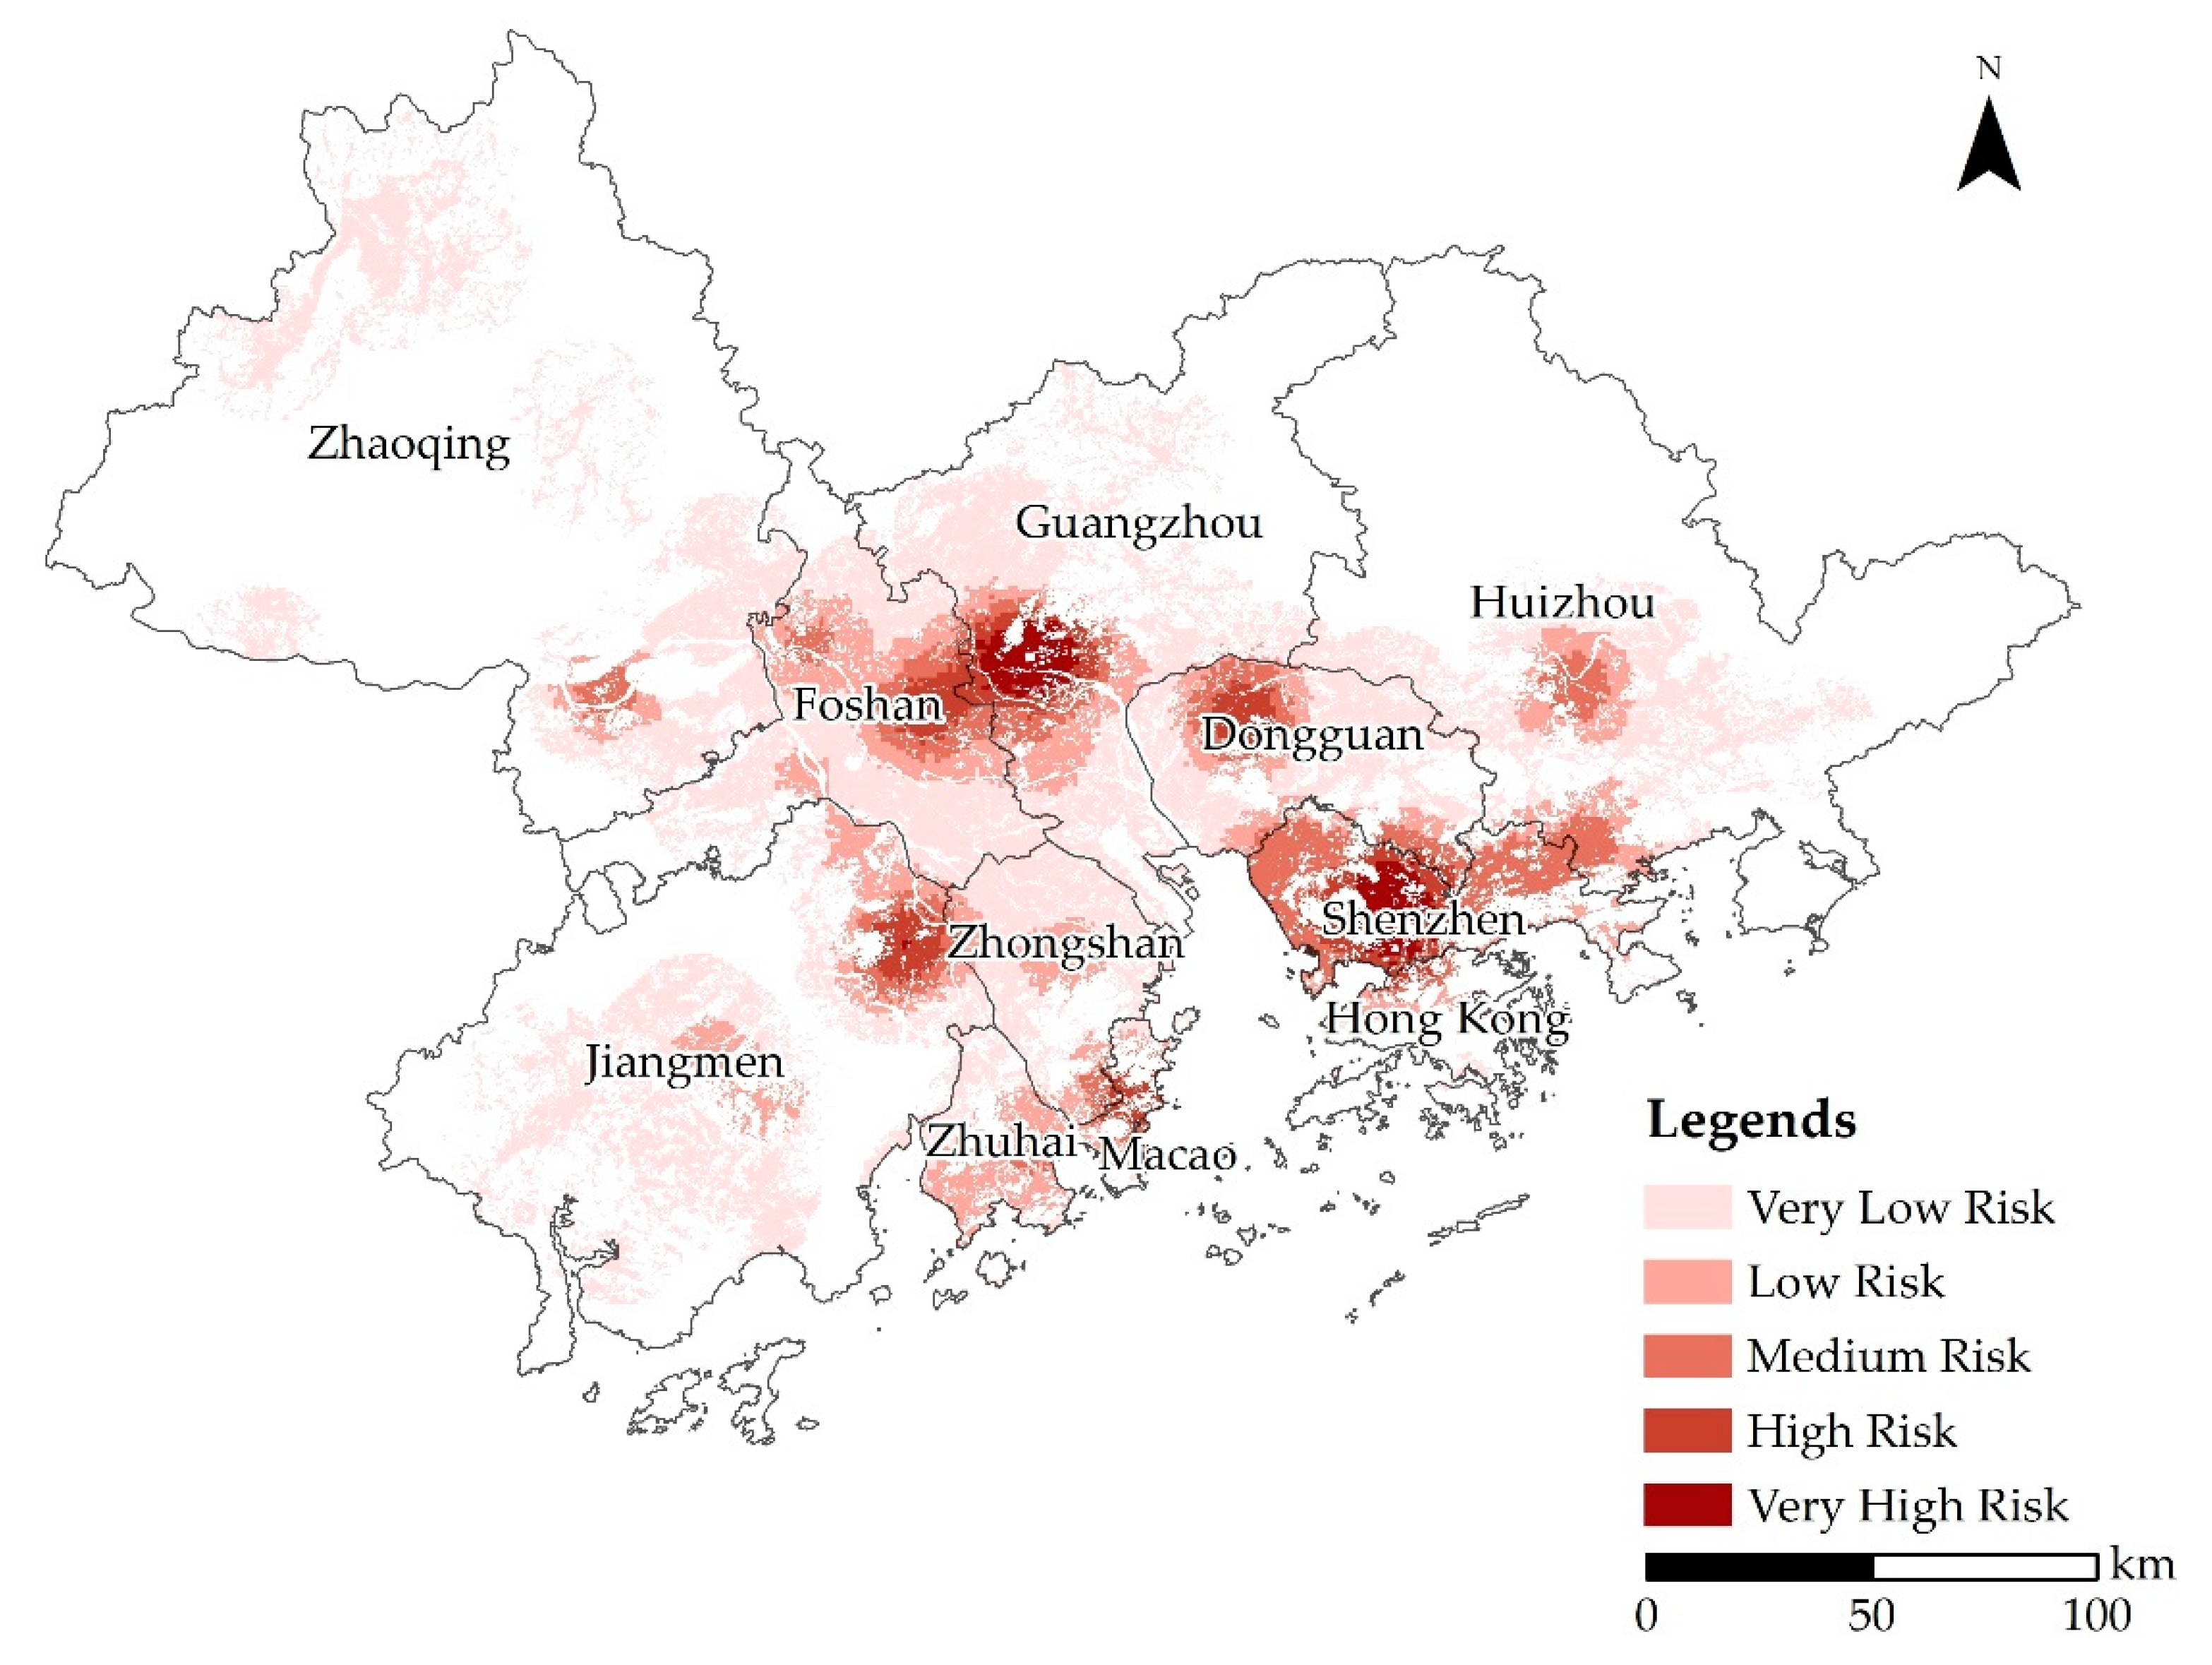
4.3.2. Risk Assessment of Rainstorm Waterlogging in the GBA
5. Discussion
5.1. Driving Mechanisms of Rainstorm Waterlogging in the GBA
5.2. Suggestions to Mitigate the Risk of Rainstorm Waterlogging in the GBA
6. Conclusions
Author Contributions
Funding
Institutional Review Board Statement
Informed Consent Statement
Data Availability Statement
Acknowledgments
Conflicts of Interest
References
- Luo, J. Characteristics and trends of China’s urban agglomeration. Tongji Univ. J. Soc. Sci. Sect. 2011, 22, 44–52. [Google Scholar]
- Fang, C.; Yu, D. Urban agglomeration: An evolving concept of an emerging phenomenon. Landsc. Urban Plan. 2017, 162, 126–136. [Google Scholar] [CrossRef]
- Nowak, D.J.; Greenfield, E.J. The increase of impervious cover and decrease of tree cover within urban areas globally (2012–2017). Urban For. Urban Green. 2020, 49, 126638. [Google Scholar] [CrossRef]
- Radford, K.G.; James, P. Changes in the value of ecosystem services along a rural-urban gradient: A case study of Greater Manchester, UK. Landsc. Urban Plan. 2013, 109, 117–127. [Google Scholar] [CrossRef]
- Liu, F.; Zhao, Y.; Muhammad, R.; Liu, X.; Chen, M. Impervious surface expansion: A key indicator for environment and urban agglomeration—A case study of Guangdong-Hong Kong-Macao Greater Bay Area by using Landsat data. J. Sens. 2020, 2020, 3896589. [Google Scholar] [CrossRef]
- Chen, Y.; Zhou, H.; Zhang, H.; Du, G.; Zhou, J. Urban flood risk warning under rapid urbanization. Environ. Res. 2015, 139, 3–10. [Google Scholar] [CrossRef]
- Salvadore, E.; Bronders, J.; Batelaan, O. Hydrological modelling of urbanized catchments: A review and future directions. J. Hydrol. 2015, 529, 62–81. [Google Scholar] [CrossRef]
- Lee, C.S.; Ho, H.Y.; Lee, K.T.; Wang, Y.C.; Guo, W.D.; Chen, D.Y.C.; Hsiao, L.F.; Chen, C.H.; Chiang, C.C.; Yang, M.J. Assessment of sewer flooding model based on ensemble quantitative precipitation forecast. J. Hydrol. 2013, 506, 101–113. [Google Scholar] [CrossRef]
- Hurricane Irene. Available online: https://en.wikipedia.org/wiki/Hurricane_Irene (accessed on 7 October 2020).
- 2017 California Floods. Available online: https://en.wikipedia.org/wiki/2017_California_floods (accessed on 7 October 2020).
- Official: San Jose Flooding Caused $73 Million in Damages. Available online: https://www.usnews.com/news/california/articles/2017-02-27/official-san-jose-flooding-caused-73-million-in-damages (accessed on 7 October 2020).
- The “5·11” Heavy Rainstorm in Shenzhen has Direct Economic Losses of Approximately 80 Million Yuan. Available online: http://news.cnr.cn/native/city/201405/t20140512_515487274.shtml (accessed on 24 May 2020).
- Heavy Rain Causes Flood in South China City. Available online: https://www.chinadaily.com.cn/china/2014-05/11/content_17499222.htm (accessed on 7 October 2020).
- Gaitan, S.; Veldhuis, J.A.E.T. Opportunities for multivariate analysis of open spatial datasets to characterize urban flooding risks. Proc. IAHS 2015, 370, 9–14. [Google Scholar] [CrossRef]
- Ahiablame, L.M.; Engel, B.A.; Chaubey, I. Effectiveness of low impact development practices: Literature review and suggestions for future research. Water Air Soil Pollut. 2012, 223, 4253–4273. [Google Scholar] [CrossRef]
- Jarden, K.M.; Jefferson, A.J.; Grieser, J.M. Assessing the effects of catchment-scale urban green infrastructure retrofits on hydrograph characteristics. Hydrol. Process. 2016, 30, 1536–1550. [Google Scholar] [CrossRef]
- Yu, H.; Zhao, Y.; Fu, Y. Optimization of impervious surface space layout for prevention of urban rainstorm waterlogging: A case study of Guangzhou, China. Int. J. Environ. Res. Public Health 2019, 16, 3613. [Google Scholar] [CrossRef] [PubMed] [Green Version]
- Spekkers, M.; Kok, M.; Clemens, F.; Ten Veldhuis, J. A statistical analysis of insurance damage claims related to rainfall extremes. Hydrol. Earth Syst. Sci. 2013, 17, 913–922. [Google Scholar] [CrossRef] [Green Version]
- Wang, C.; Du, S.; Wen, J.; Zhang, M.; Gu, H.; Shi, Y.; Xu, H. Analyzing explanatory factors of urban pluvial floods in Shanghai using geographically weighted regression. Stoch. Environ. Res. Risk Assess. 2017, 31, 1777–1790. [Google Scholar] [CrossRef]
- Merz, B.; Kreibich, H.; Lall, U. Multi-variate flood damage assessment: A tree-based data-mining approach. Nat. Hazards Earth Syst. Sci. 2013, 13, 53–64. [Google Scholar] [CrossRef]
- Wang, W.; Wang, Q.; Lin, H.; Gong, D.; Zhang, S. Summary and prospects of research on urban waterlogging in China. Urban Probl. 2015, 24–28. [Google Scholar] [CrossRef]
- Zhang, H.; Wu, C.; Chen, W.; Huang, G. Assessing the impact of climate change on the waterlogging risk in coastal cities: A case study of Guangzhou, South China. J. Hydrometeorol. 2017, 18, 1549–1562. [Google Scholar] [CrossRef]
- Wang, P.; Deng, X.; Zhou, H.; Qi, W. Responses of urban ecosystem health to precipitation extreme: A case study in Beijing and Tianjin. J. Clean. Prod. 2018, 177, 124–133. [Google Scholar] [CrossRef]
- Huang, T.; Chen, J.; Huang, F.; Su, Z. A study of urban waterlogging characteristics in Pearl River Delta Region based on GIS. J. Guangdong Univ. Technol. 2017, 34, 24–30. [Google Scholar]
- Schmitt, T.G.; Thomas, M.; Ettrich, N. Analysis and modeling of flooding in urban drainage systems. J. Hydrol. 2004, 299, 300–311. [Google Scholar] [CrossRef]
- Zhou, Y.; Li, T. Case study: The performance and design outline of a buffering stormwater drainage system for a low-lying area. Water Environ. J. 2008, 22, 199–205. [Google Scholar] [CrossRef]
- Hu, M.; Zhang, X.; Siu, Y.L.; Li, Y.; Tanaka, K.; Yang, H.; Xu, Y. Flood mitigation by permeable pavements in Chinese sponge city construction. Water 2018, 10, 172. [Google Scholar] [CrossRef] [Green Version]
- Shuster, W.D.; Bonta, J.; Thurston, H.; Warnemuende, E.; Smith, D. Impacts of impervious surface on watershed hydrology: A review. Urban Water J. 2005, 2, 263–275. [Google Scholar] [CrossRef]
- Armson, D.; Stringer, P.; Ennos, A.R. The effect of street trees and amenity grass on urban surface water runoff in Manchester, UK. Urban For. Urban Green. 2013, 12, 282–286. [Google Scholar] [CrossRef]
- Xu, H. Study on the change of lake water area in the main urban area of Wuhan and its relationship with urban waterlogging. Sci. Technol. Innov. 2019, 23, 44–46. [Google Scholar]
- Tehrany, M.S.; Pradhan, B.; Mansor, S.; Ahmad, N. Flood susceptibility assessment using GIS-based support vector machine model with different kernel types. Catena 2015, 125, 91–101. [Google Scholar] [CrossRef]
- Gaitan, S.; Veldhuis, M.C.T.; Nick, V.D.G. Spatial distribution of flood incidents along urban overland flow-paths. Water Resour. Manag. 2015, 29, 3387–3399. [Google Scholar] [CrossRef] [Green Version]
- Schubert, J.E.; Sanders, B.F.; Smith, M.J.; Wright, N.G. Unstructured mesh generation and landcover-based resistance for hydrodynamic modeling of urban flooding. Adv. Water Resour. 2008, 31, 1603–1621. [Google Scholar] [CrossRef]
- Solín, Ľ.; Feranec, J.; Nováček, J. Land cover changes in small catchments in Slovakia during 1990–2006 and their effects on frequency of flood events. Nat. Hazards 2011, 56, 195–214. [Google Scholar] [CrossRef]
- Su, M.; Zheng, Y.; Hao, Y.; Chen, Q.; Chen, S.; Chen, Z.; Xie, H. The influence of landscape pattern on the risk of urban water-logging and flood disaster. Ecol. Indic. 2018, 92, 133–140. [Google Scholar] [CrossRef]
- Mejía, A.I.; Moglen, G.E. Impact of the spatial distribution of imperviousness on the hydrologic response of an urbanizing basin. Hydrol. Process. 2010, 24, 3359–3373. [Google Scholar] [CrossRef]
- Du, S.; Shi, P.; Van Rompaey, A.; Wen, J. Quantifying the impact of impervious surface location on flood peak discharge in urban areas. Nat. Hazards 2015, 76, 1457–1471. [Google Scholar] [CrossRef]
- Zhang, H.; Cheng, J.; Wu, Z.; Li, C.; Qin, J.; Liu, T. Effects of impervious surface on the spatial distribution of urban waterlogging risk spots at multiple scales in Guangzhou, South China. Sustainability 2018, 10, 1589. [Google Scholar] [CrossRef] [Green Version]
- Yu, H.; Zhao, Y.; Fu, Y.; Li, L. Spatiotemporal variance assessment of urban rainstorm waterlogging affected by impervious surface expansion: A case study of Guangzhou, China. Sustainability 2018, 10, 3761. [Google Scholar] [CrossRef] [Green Version]
- Wu, J.; Sha, W.; Zhang, P.; Wang, Z. The spatial non-stationary effect of urban landscape pattern on urban waterlogging: A case study of Shenzhen City. Sci. Rep. 2020, 10, 7369. [Google Scholar] [CrossRef]
- Yang, C.; Li, Q.; Hu, Z.; Chen, J.; Shi, T.; Ding, K.; Wu, G. Spatiotemporal evolution of urban agglomerations in four major bay areas of US, China and Japan from 1987 to 2017: Evidence from remote sensing images. Sci. Total Environ. 2019, 671, 232–247. [Google Scholar] [CrossRef]
- Yang, C.; Zhang, C.; Li, Q.; Liu, H.; Wu, G. Rapid urbanization and policy variation greatly drive ecological quality evolution in Guangdong-Hong Kong-Macau Greater Bay Area of China: A remote sensing perspective. Ecol. Indic. 2020, 115, 106373. [Google Scholar] [CrossRef]
- Li, W.; Han, C.; Li, W.; Zhou, W.; Han, L. Multi-scale effects of urban agglomeration on thermal environment: A case of the Yangtze River Delta Megaregion, China. Sci. Total Environ. 2020, 713, 136556. [Google Scholar] [CrossRef] [PubMed]
- Ji, J.; Wang, S.; Zhou, Y.; Liu, W.; Wang, L. Spatiotemporal change and landscape pattern variation of eco-environmental quality in Jing-Jin-Ji Urban Agglomeration from 2001 to 2015. IEEE Access 2020, 8, 125534–125548. [Google Scholar] [CrossRef]
- Taubenböck, H.; Weigand, M.; Esch, T.; Staab, J.; Wurm, M.; Mast, J.; Dech, S. A new ranking of the world’s largest cities—Do administrative units obscure morphological realities? Remote Sens. Environ. 2019, 232, 111353. [Google Scholar] [CrossRef]
- The Framework Agreement on Deepening Guangdong-Hongkong-Macao Cooperation in the Development of the Bay Area. Available online: http://www.pprd.org.cn/fzgk/hzgh/201707/t20170704_460601.htm (accessed on 24 May 2019).
- The Development Plan for Guangdong-Hong Kong-Macao Greater Bay Area. Available online: http://www.gov.cn/zhengce/2019-02/18/content_5366593.htm#1 (accessed on 25 June 2019).
- Feng, S.; Fan, F. Spatiotemporal changes of landscape pattern using impervious surface in Guangdong-Hong Kong-Macao Greater Bay Area, China. Chin. J. Appl. Ecol. 2018, 29, 113–120. [Google Scholar]
- Yang, C.; Li, Q.; Zhao, T.; Liu, H.; Gao, W.; Shi, T.; Guan, M.; Wu, G. Detecting spatiotemporal features and rationalities of urban expansions within the Guangdong-Hong Kong-Macau Greater Bay Area of China from 1987 to 2017 using time-series Landsat images and socioeconomic data. Remote Sens. 2019, 11, 2215. [Google Scholar] [CrossRef] [Green Version]
- 543.8 Million Yuan Lost in Guangzhou “5.7” Rainstorm. Available online: https://news.qq.com/a/20100512/001802.htm (accessed on 24 May 2020).
- The “5·20 Rainstorm” Caused Stagnant Water in 48 Areas of Dongguan. 280 Bus Services Were Suspended. Available online: http://news.sina.com.cn/o/2015-05-20/211831856332.shtml (accessed on 24 May 2020).
- Yi, S.; Liang, C. Geological Hazards and Prevention in Guangdong Province; Science Press: Beijing, China, 2010; pp. 12–14. [Google Scholar]
- Li, B.; Zhao, Y.; Fu, Y. Spatio-temporal characteristics of urban storm waterlogging in Guangzhou and the impact of urban growth. J. Geo-Inf. Sci. 2015, 17, 71–76. [Google Scholar]
- Wu, J.; Zhang, P. The effect of urban landscape pattern on urban waterlogging. Acta Geogr. Sin. 2017, 72, 444–456. [Google Scholar]
- Quan, R. Risk assessment of flood disaster in Shanghai based on spatial-temporal characteristics analysis from 251 to 2000. Environ. Earth Sci. 2014, 72, 4627–4638. [Google Scholar] [CrossRef]
- Han, R.; Feng, P. Effects of sublayer and land-cover change on flood in Daqinghe River Basin. J. Arid Land Resour. Environ. 2010, 24, 27–30. [Google Scholar]
- Liu, S.; Lin, M.; Li, C. Analysis of the effects of the river network structure and urbanization on waterlogging in high-density urban areas—A case study of the Pudong New Area in Shanghai. Int. J. Environ. Res. Public Health 2019, 16, 3306. [Google Scholar] [CrossRef] [PubMed] [Green Version]
- Shi, Y.; Shi, C.; Xu, S.; Sun, A.; Wang, J. Exposure assessment of rainstorm waterlogging on old-style residences in Shanghai based on scenario simulation. Nat. Hazards 2010, 53, 259–272. [Google Scholar] [CrossRef]
- Collins, K.A.; Hunt, W.F.; Hathaway, J.M. Hydrologic comparison of four types of permeable pavement and standard asphalt in Eastern North Carolina. J. Hydrol. Eng. 2008, 13, 1146–1157. [Google Scholar] [CrossRef]
- Gilroy, K.L.; McCuen, R.H. A nonstationary flood frequency analysis method to adjust for future climate change and urbanization. J. Hydrol. 2012, 414, 40–48. [Google Scholar] [CrossRef]
- Yang, G.; Bowling, L.C.; Cherkauer, K.A.; Pijanowski, B.C. The impact of urban development on hydrologic regime from catchment to basin scales. Landsc. Urban Plan. 2011, 103, 237–247. [Google Scholar] [CrossRef]
- Uuemaa, E.; Mander, Ü.; Marja, R. Trends in the use of landscape spatial metrics as landscape indicators: A review. Ecol. Indic. 2013, 28, 100–106. [Google Scholar] [CrossRef]
- Plexida, S.G.; Sfougaris, A.I.; Ispikoudis, I.P.; Papanastasis, V.P. Selecting landscape metrics as indicators of spatial heterogeneity—A comparison among Greek landscapes. Int. J. Appl. Earth Obs. Geoinf. 2014, 26, 26–35. [Google Scholar] [CrossRef]
- Zhang, L.; Xia, J.; Ye, W. Overview on choosing landscape indices in landscape pattern analysis. Yunnan Geogr. Environ. Res. 2008, 5, 42–47. [Google Scholar]
- Mcgarigal, K. FRAGSTATS Help. Documentation for FRAGSTATS, 4. 2018.FRAGSTATS: Spatial Pattern Analysis Program for Categorical Maps. Available online: https://www.umass.edu/landeco/research/fragstats/fragstats.html (accessed on 11 March 2021).
- Liu, Y.; Mu, X.; Wang, H.; Yan, G. A novel method for extracting green fractional vegetation cover from digital images. J. Veg. Sci. 2011, 23, 406–418. [Google Scholar] [CrossRef]
- Bui, D.T.; Pradhan, B.; Nampak, H.; Bui, Q.T.; Tran, Q.A.; Nguyen, Q.P. Hybrid artificial intelligence approach based on neural fuzzy inference model and metaheuristic optimization for flood susceptibilitgy modeling in a high-frequency tropical cyclone area using GIS. J. Hydrol. 2016, 540, 317–330. [Google Scholar]
- Meraj, G.; Romshoo, S.A.; Yousuf, A.; Altaf, S.; Altaf, F. Assessing the influence of watershed characteristics on the flood vulnerability of Jhelum Basin in Kashmir Himalaya. Nat. Hazards 2015, 77, 153–175. [Google Scholar] [CrossRef]
- Tang, X.; Hong, H.; Shu, Y.; Tang, H.; Li, J.; Liu, W. Urban waterlogging susceptibility assessment based on a PSO-SVM method using a novel repeatedly random sampling idea to select negative samples. J. Hydrol. 2019, 576, 583–595. [Google Scholar] [CrossRef]
- Botev, Z.I.; Grotowski, J.F.; Kroese, D.P. Kernel density estimation via diffusion. Ann. Stat. 2010, 38, 2916–2957. [Google Scholar] [CrossRef] [Green Version]
- Wang, Y.; He, H. Spatial Data Analysis Method (21st Century University Textbook); Science Press: Beijing, China, 2007; pp. 148–155. [Google Scholar]
- Anselin, L. Local indicators of spatial association—LISA. Geogr. Anal. 1995, 27, 93–115. [Google Scholar] [CrossRef]
- Moran, P.A. Notes on continuous stochastic phenomena. Biometrika 1950, 37, 17–23. [Google Scholar] [CrossRef]
- Ord, J.K.; Getis, A. Local spatial autocorrelation statistics: Distributional issues and an application. Geogr. Anal. 1995, 27, 286–306. [Google Scholar] [CrossRef]
- Anselin, L. An Introduction to Spatial Autocorrelation Analysis. Spat. Anal. Lab. Univ. Ill. Champagne-UrbanaIll. GeoDa: An Introduction to Spatial Data Analysis. GeoDa Documentation. 2003. Available online: https://geodacenter.github.io/ (accessed on 11 March 2021).
- Wang, J.; Xu, C. Geodetector: Principle and prospective. Acta Geogr. Sin. 2017, 72, 116–134. [Google Scholar]
- Wang, J.F.; Li, X.H.; Christakos, G.; Liao, Y.L.; Zhang, T.; Gu, X.; Zheng, X.Y. Geographical detectors-based health risk assessment and its application in the neural tube defects study of the Heshun Region, China. Int. J. Geogr. Inf. Sci. 2010, 24, 107–127. [Google Scholar] [CrossRef]
- Wang, J.F.; Zhang, T.L.; Fu, B.J. A measure of spatial stratified heterogeneity. Ecol. Indic. 2016, 67, 250–256. [Google Scholar] [CrossRef]
- Teukolsky, S.A.; Flannery, B.P.; Press, W.; Vetterling, W. Numerical Recipes in C Second Edition. SMR 1992, 693, 59–70. [Google Scholar]
- Fotheringham, A.S.; Brunsdon, C.; Charlton, M. Geographically Weighted Regression: The Analysis of Spatially Varying Relationships; International Union of Crystallography: Hoboken, NJ, USA, 2002; pp. 125–126. [Google Scholar]
- Lu, B.; Charlton, M.; Brunsdon, C.; Harris, P. The Minkowski approach for choosing the distance metric in geographically weighted regression. Int. J. Geogr. Inf. Sci. 2016, 30, 351–368. [Google Scholar] [CrossRef] [Green Version]
- Li, S. The Research of GWR Method to Simulate PM2.5 Concentration Based on PCA. Ph.D. Thesis, Liaoning Technical University, Fuxin, China, 2017. [Google Scholar]
- Zhang, B.; Xie, G.D.; Li, N.; Wang, S. Effect of urban green space changes on the role of rainwater runoff reduction in Beijing, China. Landsc. Urban Plan. 2015, 140, 8–16. [Google Scholar] [CrossRef]
- Guo, X.; Xu, J.; Lv, X. Effect of spatial structure of typical urban underlying surface on rainfall infiltration rate. J. Soil Water Conserv. 2007, 21, 60–62. [Google Scholar]
- Wang, C. Research on the Influencing Factors and Mitigation of Urban Rainstorm Waterlogging—A Case Study of Shanghai. Master’s Thesis, Shanghai Normal University, Shanghai, China, 2017. [Google Scholar]
- News Analysis: How does “Yudu” Hong Kong Prevent Urban Waterlogging? Available online: http://www.h2o-china.com/news/242801.html (accessed on 24 May 2020).
- Yao, L.; Chen, L.; Wei, W.; Sun, R. Potential reduction in urban runoff by green spaces in Beijing: A scenario analysis. Urban For. Urban Green. 2015, 14, 300–308. [Google Scholar] [CrossRef]
- Quan, R.; Liu, M.; Lu, M.; Zhang, L.; Wang, J.; Xu, S. Waterlogging risk assessment based on land use/cover change: A case study in Pudong New Area, Shanghai. Environ. Earth Sci. 2010, 61, 1113–1121. [Google Scholar] [CrossRef]


| Data | Data Type | Data Year | Data Source |
|---|---|---|---|
| Waterlogging information | Text file | 2013–2017 | City water authority, Mainstream media |
| Landsat remote sensing image | Satellite imagery | 2017 | USGS (https://www.usgs.gov/) (accessed on 25 January 2021) |
| High-resolution remote sensing image | Satellite imagery | 2017 | Google Earth satellite imagery |
| Topographic data | Raster | 2009 | Geospatial Data Cloud (http://www.gscloud.cn/) (accessed on 25 January 2021) |
| River data | Vector | 2017 | Open Street Map (https://www.openstreetmap.org/) (accessed on 25 January 2021) |
| 1:4 million administrative divisions | Vector | 2005 | National Geomatics Center of China (http://www.ngcc.cn/ngcc/) (accessed on 25 January 2021) |
| Name | Range | Implication |
|---|---|---|
| ISR | 1 ≥ ISR ≥ 0 | ISR is the ratio of the impervious surface. Bigger values mean a higher impervious surface area. |
| Shape_MN | Shape_MN ≥ 1 | Shape_MN represents the mean shape value of the landscape. The larger Shape_MN is, the more irregular the landscape distribution. |
| AI | 100 ≥ AI > 0 | AI describes the aggregation degree of landscape, and helps characterize the landscape in terms of stability. Higher values mean greater clustering. |
| GBA | Dongguan | Foshan | Guangzhou | Hong Kong | Huizhou | |
| ISR | 0.1141 | 0.0328 | 0.1601 | 0.1769 | 0.0313 | 0.1780 |
| Shape_MN | 0.0472 | 0.0120 | 0.0514 | 0.0758 | 0.0225 | 0.1028 |
| AI | 0.0013 | 0.0214 | 0.1046 | 0.0253 | 0.0093 | 0.1525 |
| FVC | 0.0103 | 0.0242 | 0.1085 | 0.1381 | 0.0861 | 0.1901 |
| Elevation | 0.0022 | 0.0352 | 0.0666 | 0.0332 | 0.0536 | 0.0198 |
| Slope | 0.0029 | 0.0712 | 0.0859 | 0.0573 | 0.1158 | 0.0147 |
| River Density | 0.0064 | 0.0025 | 0.0211 | 0.0203 | 0.0606 | 0.0038 |
| River Distance | 0.0234 | 0.0035 | 0.0536 | 0.0016 | 0.0595 | 0.0236 |
| Variation |  |  |  |  |  |  |
| Jiangmen | Shenzhen | Zhaoqing | Zhongshan | Zhuhai | ||
| ISR | 0.1774 | 0.0823 | 0.0735 | 0.0050 | 0.0224 | |
| Shape_MN | 0.0724 | 0.0560 | 0.0402 | 0.0053 | 0.0082 | |
| AI | 0.0326 | 0.0042 | 0.0024 | 0.0067 | 0.0057 | |
| FVC | 0.3025 | 0.2021 | 0.1289 | 0.0613 | 0.0251 | |
| Elevation | 0.0200 | 0.0617 | 0.0634 | 0.0041 | 0.0273 | |
| Slope | 0.0207 | 0.1066 | 0.0434 | 0.0082 | 0.0459 | |
| River Density | 0.0024 | 0.0043 | 0.0099 | 0.0016 | 0.0246 | |
| River Distance | 0.0054 | 0.0595 | 0.0331 | 0.0073 | 0.0721 | |
| Variation |  |  |  |  |  |
| Index | Principal Component 1 | Principal Component 2 | Principal Component 3 |
|---|---|---|---|
| Total | 3.810 | 1.185 | 1.003 |
| Variance Percent | 47.626 | 14.817 | 12.538 |
| Cumulative Percent | 47.626 | 62.443 | 74.981 |
Publisher’s Note: MDPI stays neutral with regard to jurisdictional claims in published maps and institutional affiliations. |
© 2021 by the authors. Licensee MDPI, Basel, Switzerland. This article is an open access article distributed under the terms and conditions of the Creative Commons Attribution (CC BY) license (http://creativecommons.org/licenses/by/4.0/).
Share and Cite
Liu, F.; Liu, X.; Xu, T.; Yang, G.; Zhao, Y. Driving Factors and Risk Assessment of Rainstorm Waterlogging in Urban Agglomeration Areas: A Case Study of the Guangdong-Hong Kong-Macao Greater Bay Area, China. Water 2021, 13, 770. https://doi.org/10.3390/w13060770
Liu F, Liu X, Xu T, Yang G, Zhao Y. Driving Factors and Risk Assessment of Rainstorm Waterlogging in Urban Agglomeration Areas: A Case Study of the Guangdong-Hong Kong-Macao Greater Bay Area, China. Water. 2021; 13(6):770. https://doi.org/10.3390/w13060770
Chicago/Turabian StyleLiu, Fan, Xiaoding Liu, Tao Xu, Guang Yang, and Yaolong Zhao. 2021. "Driving Factors and Risk Assessment of Rainstorm Waterlogging in Urban Agglomeration Areas: A Case Study of the Guangdong-Hong Kong-Macao Greater Bay Area, China" Water 13, no. 6: 770. https://doi.org/10.3390/w13060770