Communication

Estrogen Disrupting Pesticides in Nebraska Groundwater: Trends between Pesticide-contaminated Water and Estrogen-related Cancers in An Ecological Observational Study

1
Department of Environmental Health, Occupational Health, and Toxicology, College of Public Health, University of Nebraska Medical Center, Omaha, NE 68198-4395, USA
2
Department of Epidemiology, College of Public Health, University of Nebraska Medical Center, Omaha, NE 68198-4395, USA
*
Author to whom correspondence should be addressed.
Water 2021, 13(6), 790; https://doi.org/10.3390/w13060790
Submission received: 15 January 2021 / Revised: 3 March 2021 / Accepted: 11 March 2021 / Published: 14 March 2021
(This article belongs to the Section Water, Agriculture and Aquaculture)

Abstract

:
Estrogen disrupting pesticides (EDP) are pesticides that modify estrogen activities in estrogen-producing vertebrates. A substantial amount of these pesticides has been detected in human tissues, and they function directly to disrupt estrogen synthesis or effector cells. This study examines EDP’s ecological distribution across Nebraska counties and its association with estrogen-related cancers (ERC). To determine the ecological distribution of selected EDP, county-level choropleth maps were created. Moreover, EDP was tested in separate linear models with different ERC to determine the association between ERC and EDP across Nebraska counties. Exposure data for this county-level study was obtained from the quality assessed agrichemical contaminant Nebraska groundwater database between 1 January 1974 and 31 December 2012. Acetochlor, atrazine, and its metabolites, deethylatrazine (DEA), and de-isopropyl atrazine (DIA) were the most frequently detected EDP in Nebraska groundwater. Moreover, Nebraska county-level potential confounder for ERC such as physically unhealthy days, % adult smoking, % obese adult, % uninsured, and % binge drinking were obtained from County Health Rankings 2010. ERC, which is the outcome variable (breast cancer, uterine cancer, and prostate cancer), were obtained from the Nebraska State profile of the National Cancer Institute. This was expressed as county-level age-standardized incidence cancer rates between 1 January 2013 and 31 December 2017. Data characteristics were determined using percentages, mean, median, 25th and 75th percentile, minimum and maximum values. The relationship between county-level cancer rates and % wells positive for pesticides after adjusting for the county level potential confounders were analyzed in a linear regression model. Water supply wells positive for atrazine and DEA were observed to cluster in the South and South East counties of Nebraska. Furthermore, breast cancer and prostate cancer incidence rates were higher in the southeast of Nebraska with more atrazine and DEA. However, breast cancer and prostate cancer were not significantly associated in a linear regression model with any of the observed EDP. In contrast, uterine cancer was statistically associated with % water supply wells positive for acetochlor (β = 4.01, p = 0.04). While consistent associations were not observed between ERC and EDP from the GIS and the linear regression model, this study’s results can drive future conversation concerning the potential estrogenic effects of acetochlor, atrazine, and its metabolites on the incidence of breast, uterine and prostate cancer in the State of Nebraska.

1. Introduction

As the human population continues to grow exponentially, food security is emerging as a significant source of concern [1]. In response to this, artificial techniques, including agrichemical use, have been introduced into farming to improve agricultural yield. While agrichemicals may have enhanced food security for the growing population, it is feared that the toxic effects from agrichemical residues deposited in water, plants, land, and animals may outweigh its benefit. Hence, the tradeoff between agrichemical use and food security may transcend environmental degradation to humans’ toxicological outcomes. While the scope of agrichemicals is broad, this study will only focus on pesticides. The origin of synthetic pesticides dates to approximately nine decades ago in the United States, with dichloro-diphenyl-trichloroethane (DDT) as the first pesticide to be used [2]. Although DDT was originally intended to combat insect-borne human diseases such as malaria, its application soon included pest control in agriculture [3]. Even though DDT is now wholly restricted in the United States and many parts of the world due to its toxicity [4], other pesticides have continued to emerge over the years [5]. Despite replacing DDT with the new pesticides, their toxicological effects may not differ significantly from DDT. Some examples of commonly used agrichemicals are acephate, acetochlor, alachlor, aldrin, atrazine, glyphosate, metaldehyde, diazinon, and malathion [6]. These pesticides have been named in many toxicological effects, which may manifest from acute or chronic exposure. For example, malathion was implicated in acute toxic effects related to gastrointestinal discomfort [7] and glyphosate in chronic toxic effects such as cancer [8]. Moreover, some of these pesticides have recently begun to gain attention as endocrine disruptors. This is because pesticides can alter the endocrine system’s normal functioning by acting as an agonist/antagonist for endocrine receptors, activators/inhibitors for endocrine biogenesis, or induce epigenetic reprograming during estrogen-induced development [9].
The most implicated hormone during pesticide endocrine disruption is estrogen [9]. Despite strong evidence of estrogenic disruptions of these pesticides in in vitro studies [10,11,12,13], strong evidence linking pesticide as an independent risk factor for the estrogen-related disease has not been clearly elucidated. Hence, the need for studies highlighting the role of pesticides in carcinogenic processes.
Nebraska is one of the United States’ agricultural States with a robust repository for data on agrichemical contaminated groundwater. Therefore, this study will take advantage of this database to explore whether there is an ecological correlation between selected estrogen disrupting pesticides (EDP) and estrogen-related cancer (ERC) across Nebraska’s 93 counties. Hence, this study examined the ecological distribution of EDP across Nebraska counties and its association with ERC.

2. Materials and Methods

The Quality-assessed Agrichemical contaminant for the Nebraska Groundwater database, a publicly available repository for agrichemicals detected in Nebraska groundwater/wells, was examined to address our objectives. The concentration of agrichemicals in this database was evaluated based on well-defined criteria. A detailed description of this database is published elsewhere [10]. Forty-seven EDP was obtained from the Quality-assessed Agrichemical Contaminant for Nebraska Groundwater Database from 1 January 1974–31 December 2012. However, only four pesticides-acetochlor, atrazine, deethylatrazine (DEA), and de-isopropyl atrazine (DIA) were substantially detected. While the specific pesticide exposure timeline for carcinogenesis is unknown, exposure timeline which preceded the timeline for the anticipated outcomes according to Bradford Hills criteria [14] was used. These pesticides were tested multiple times within the set timeline from 33,593 unique wells across the 93 counties of Nebraska. All water supply well types such as commercial, irrigation, livestock, domestic, and monitoring wells were included in the data for analysis (Figure 1). These wells were identified using the clearinghouse numbers.
The outcome variable is the age-standardized incidence rate for selected ERC (breast cancer, uterine cancer, and prostate cancer) of the 93 counties in Nebraska. The age-standardized incidence rates for these cancers were obtained from the State reports of the National Cancer Institute (NCI) between 1 January 2013 and 31 December 2017. The incidence rates for the selected ERC were defined as cases per 100,000, adjusted by age according to the U.S. standard population in the year 2000. These rates were calculated using the SEER*Stat (NCI, Bethesda, MD, USA). The denominator of the incidence rates was obtained from the U.S. census population count between 1969 and 2017. All cancers selected for this study were invasive.
Given that carcinogenesis is a complex relationship between several factors, other potential confounders were included in the analysis. Hence, county-level potential confounders for the selected ERC were obtained from the County Health Rankings database for 2010. County Health Rankings is a collaborative program of Robert Wood Johnson Foundation and the University of Wisconsin Population Health Institute. It provides county by county health determinants and outcomes. From this database, we obtained five potential confounders of ERC, such as physically unhealthy days per county, % of adult who smoke per county, % of obese adult per county, % binge drinking per county and % of uninsured per county. The aforementioned county-level confounders were included in the analysis because their carcinogenesis risk is well established [15,16,17,18,19,20,21]. Meanwhile, physically unhealthy days were defined by County Health Rankings as the average days in the last 30 days that an adult in a county reported poor physical health. Physically unhealthy days were obtained from responding to the question: “Thinking about your physical health, which includes physical illness and injury, for how many days during the past 30 days was your physical health not good?”.

Data Analysis

Water supply wells were sampled multiple times for the measurement of EDP. As a result, the pesticides in each water supply well had multiple measurements. While the multiple measurements of the pesticide at different time points provided a detailed history of pesticide contamination in each well. It was redundant information for a time trend analysis of the pesticides because they were not uniform across the wells. However, we were able to identify wells that had tested positive at least once for the pesticides of interest, which met this current study’s goal. Therefore, the percent of wells positive for the selected EDP were calculated per county and included in the analysis as the exposure variable. Moreover, this data’s continuous variables were described using minimum, maximum, 25th-percentile, 75th-percentile, mean, and median. While the categorical variables were described using frequencies and percentages. To demonstrate EDP’s ecological distribution and its association with ERC, a GIS mapping of Nebraska was performed. A county-level choropleth maps were created for age standardized rates of each cancer type (breast, prostate, and uterine) using ArcGIS Pro V2.7. Graduated symbols were used to map the percentage of water supply wells positive for the four types of EDP. Both variables were categorized using the equal distance method.
To test the relationship between EDP and ERC, all three data sources- Nebraska groundwater database, State profile of the NCI, and County Health Rankings—were merged by county to form a single data used for analysis. Given that all variables included in the analysis were continuous variables, the LINE (linearity, independence, normality, and equality of variance) assumptions for linear regression analysis were evaluated. While almost all assumptions were met for all the variables, % pesticide positive wells deviated from normality because several counties have % pesticide positive wells of zero values. Since % pesticide positive wells were the primary exposure for this study, they were subjected to square root transformation to improve its skewed distribution. Square root transformation was applied as the transformation procedure because it works best to transform variables with many zero values [22]. After completing the check for LINE assumptions and transformations, correlations between the variables were determined using the following steps: First, the relationship between age-standardized incidence rates for the ERC and % EDP positive water supply wells were examined in a scatter plot. Secondly, the correlation between potential confounder data from County Health Rankings and the age-standardized ERC rates was calculated using Pearson correlation coefficient, r. To be conservative and parsimonious in the analysis, potential confounding variables with r of at least ±0.2 which were significant at α ≤ 0.1 with any of the ERC were adjusted in a linear regression model between ERC (outcome) and EDP (exposure). Thirdly, collinearity among % EDP positive water supply wells was determined for variables with a correlation coefficient of at least r = 0.50 [23,24,25].
To determine if EDP was associated with ERC, a multiple linear regression model of age-standardized cancer rates as outcome, % pesticides positive wells as exposure and county-level confounders was performed. A significant association between the age-standardized ERC rates and EDP was considered at α ≤ 0.05. Data restructuring and all analysis were performed on Statistical Package for Social Sciences (SPSS) version 26, while the pie chart was done on Microsoft excel 2016.

3. Results

3.1. Characteristics of Estrogen Disrupting Pesticides from Quality-assessed Agrichemical Contaminant for Nebraska Groundwater Database (1 January 1974–31 December 2012)

Of the 47 estrogen disrupting pesticides identified from the database, only 4 (acetochlor, atrazine, DEA and DIA) of these pesticides were adequately detected in the sampled wells across the 93 counties of Nebraska. Among the water supply well types, monitoring wells (75%), livestock (38%), and commercial wells (32%) housed a substantial amount of atrazine. While no acetochlor was detected in commercial and domestic wells, irrigation wells accounted for the highest proportion (5%) of detected acetochlor which is even higher than that of the monitoring wells (2%). Additionally, a substantial amount of atrazine metabolite, DEA, was detected in monitoring (75%) irrigation (28%) and commercial wells (24%) (Table 1). Three ERC with high incidence in Nebraska were selected. These included breast cancer, uterine cancer, and prostate cancer. The incidence of these ERC in Nebraska is higher than the national rates. The age-standardized incidence rate for breast cancer in Nebraska between 2013 and 2017 is 127.4, while that of the United States is 125.9 cases per 100,000. Similarly, the rates of uterine cancer in Nebraska (27.7 cases/100,000) were found to be slightly higher than the national rates (27.0 cases/100,000) between 2013 and 2017. Nebraska rates (116.9 cases/100,000) of prostate cancer were also higher than the national rates (104.5 cases/100,000).

3.2. Characteristics of Estrogen-Related Cancer from State Profile of National Cancer Institute (January 2013–December 2017) and County Level Confounders from County Health Rankings (2010)

The mean and median values of the age-standardized incidence rates for the selected cancers (breast, uterine, and prostate) were approximately equal. Additionally, the county level confounders’ mean and median values (physically healthy days, % Adult smoking, % binge drinking, % uninsured, and % Adult obesity) were approximately equal. Hence, this indicates that the cancer rates and county level confounders have a relatively symmetrical and normal distribution. However, the distribution of % pesticide positive water supply wells deviate from normality as indicated by the disparity between its mean and median (Table 2).

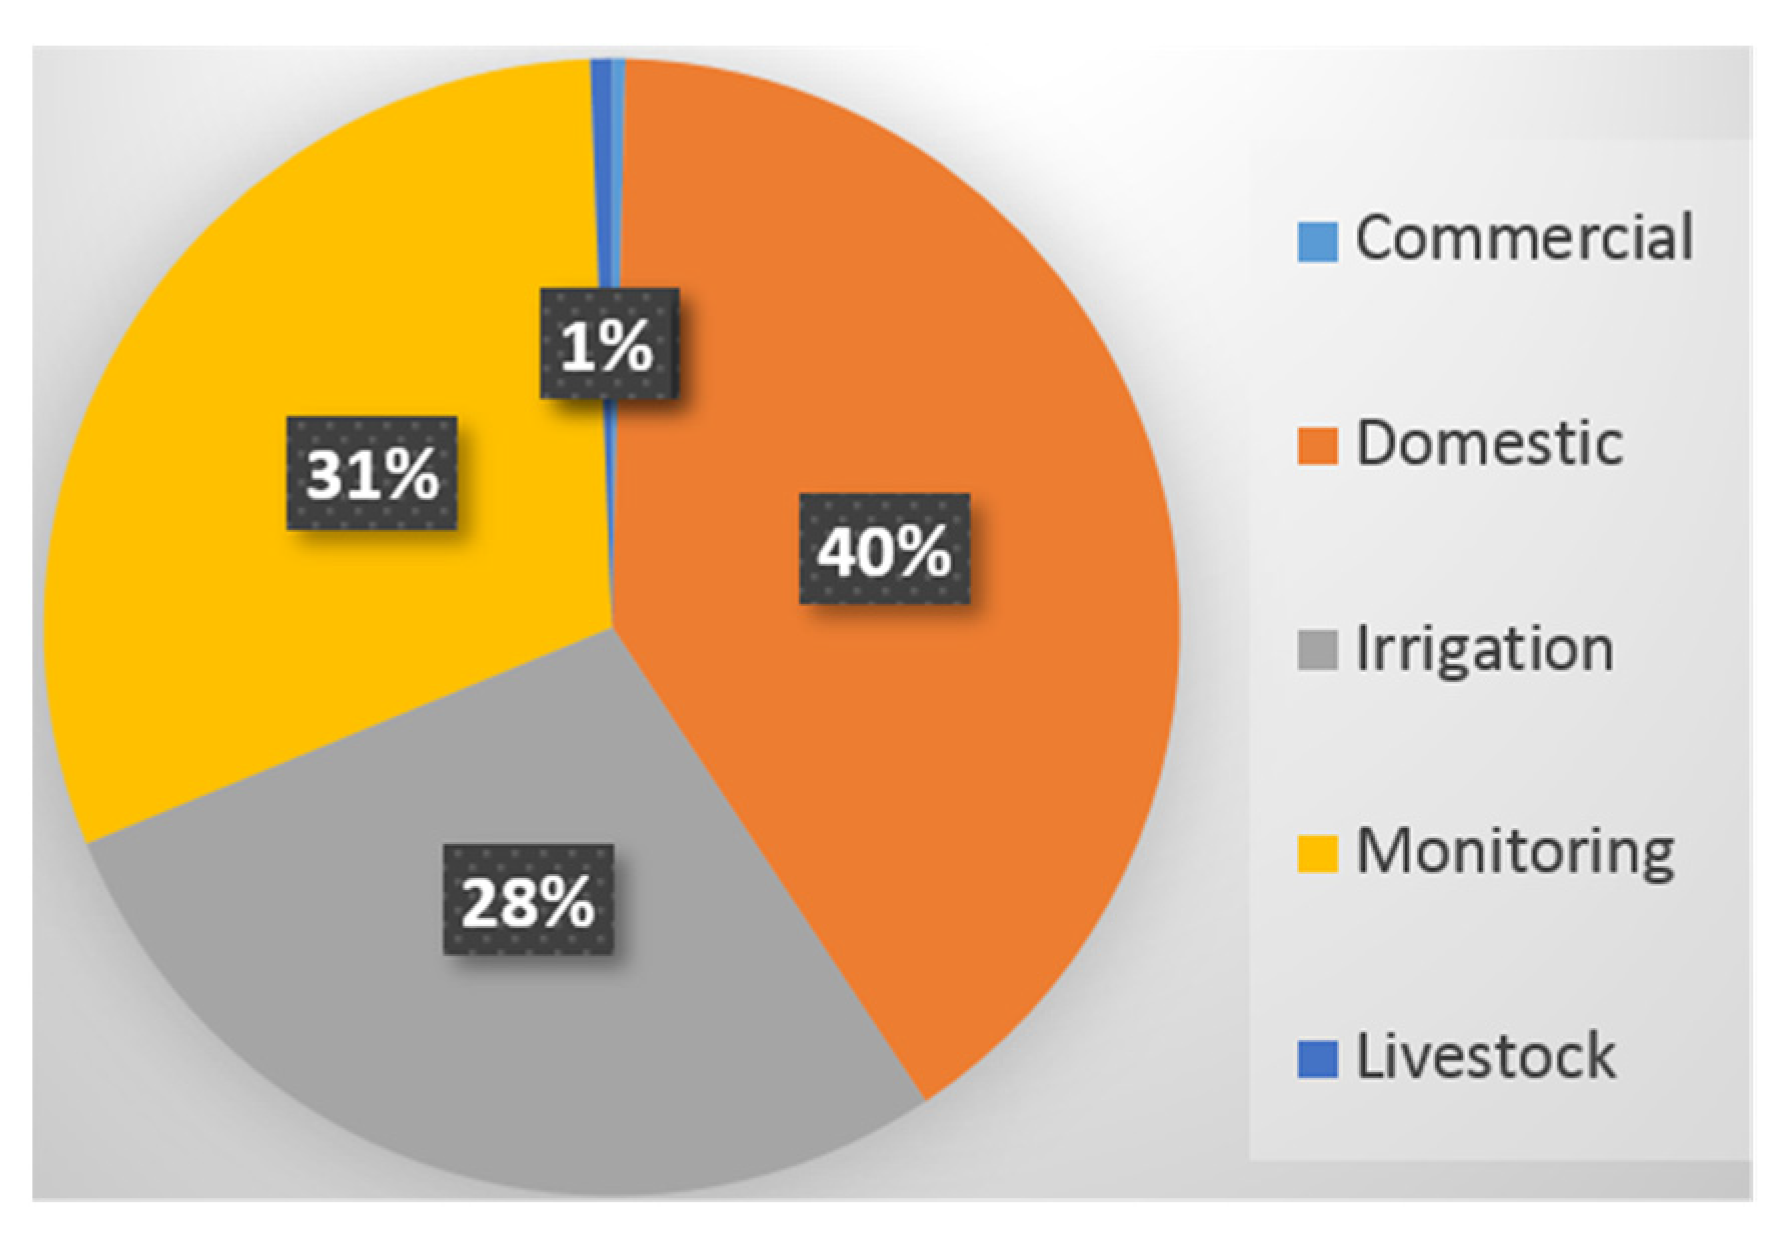
3.3. Ecological Distribution of Estrogen Disrupting Pesticides

The prevalence of DIA and acetochlor positive wells across majority of Nebraska counties was 0–25% (Figure 2a,b). However, atrazine and DEA were found in 25–100% of wells sampled per county in the south and southeast of Nebraska (Figure 2c,d). While no overlap between elevated ERC rates and DIA or acetochlor was observed (Figure 2a,b and Figure 3a,b), counties with higher proportion of atrazine and DEA positive wells had elevated rates of breast cancer (Figure 2c,d) and prostate cancer (Figure 3c,d).

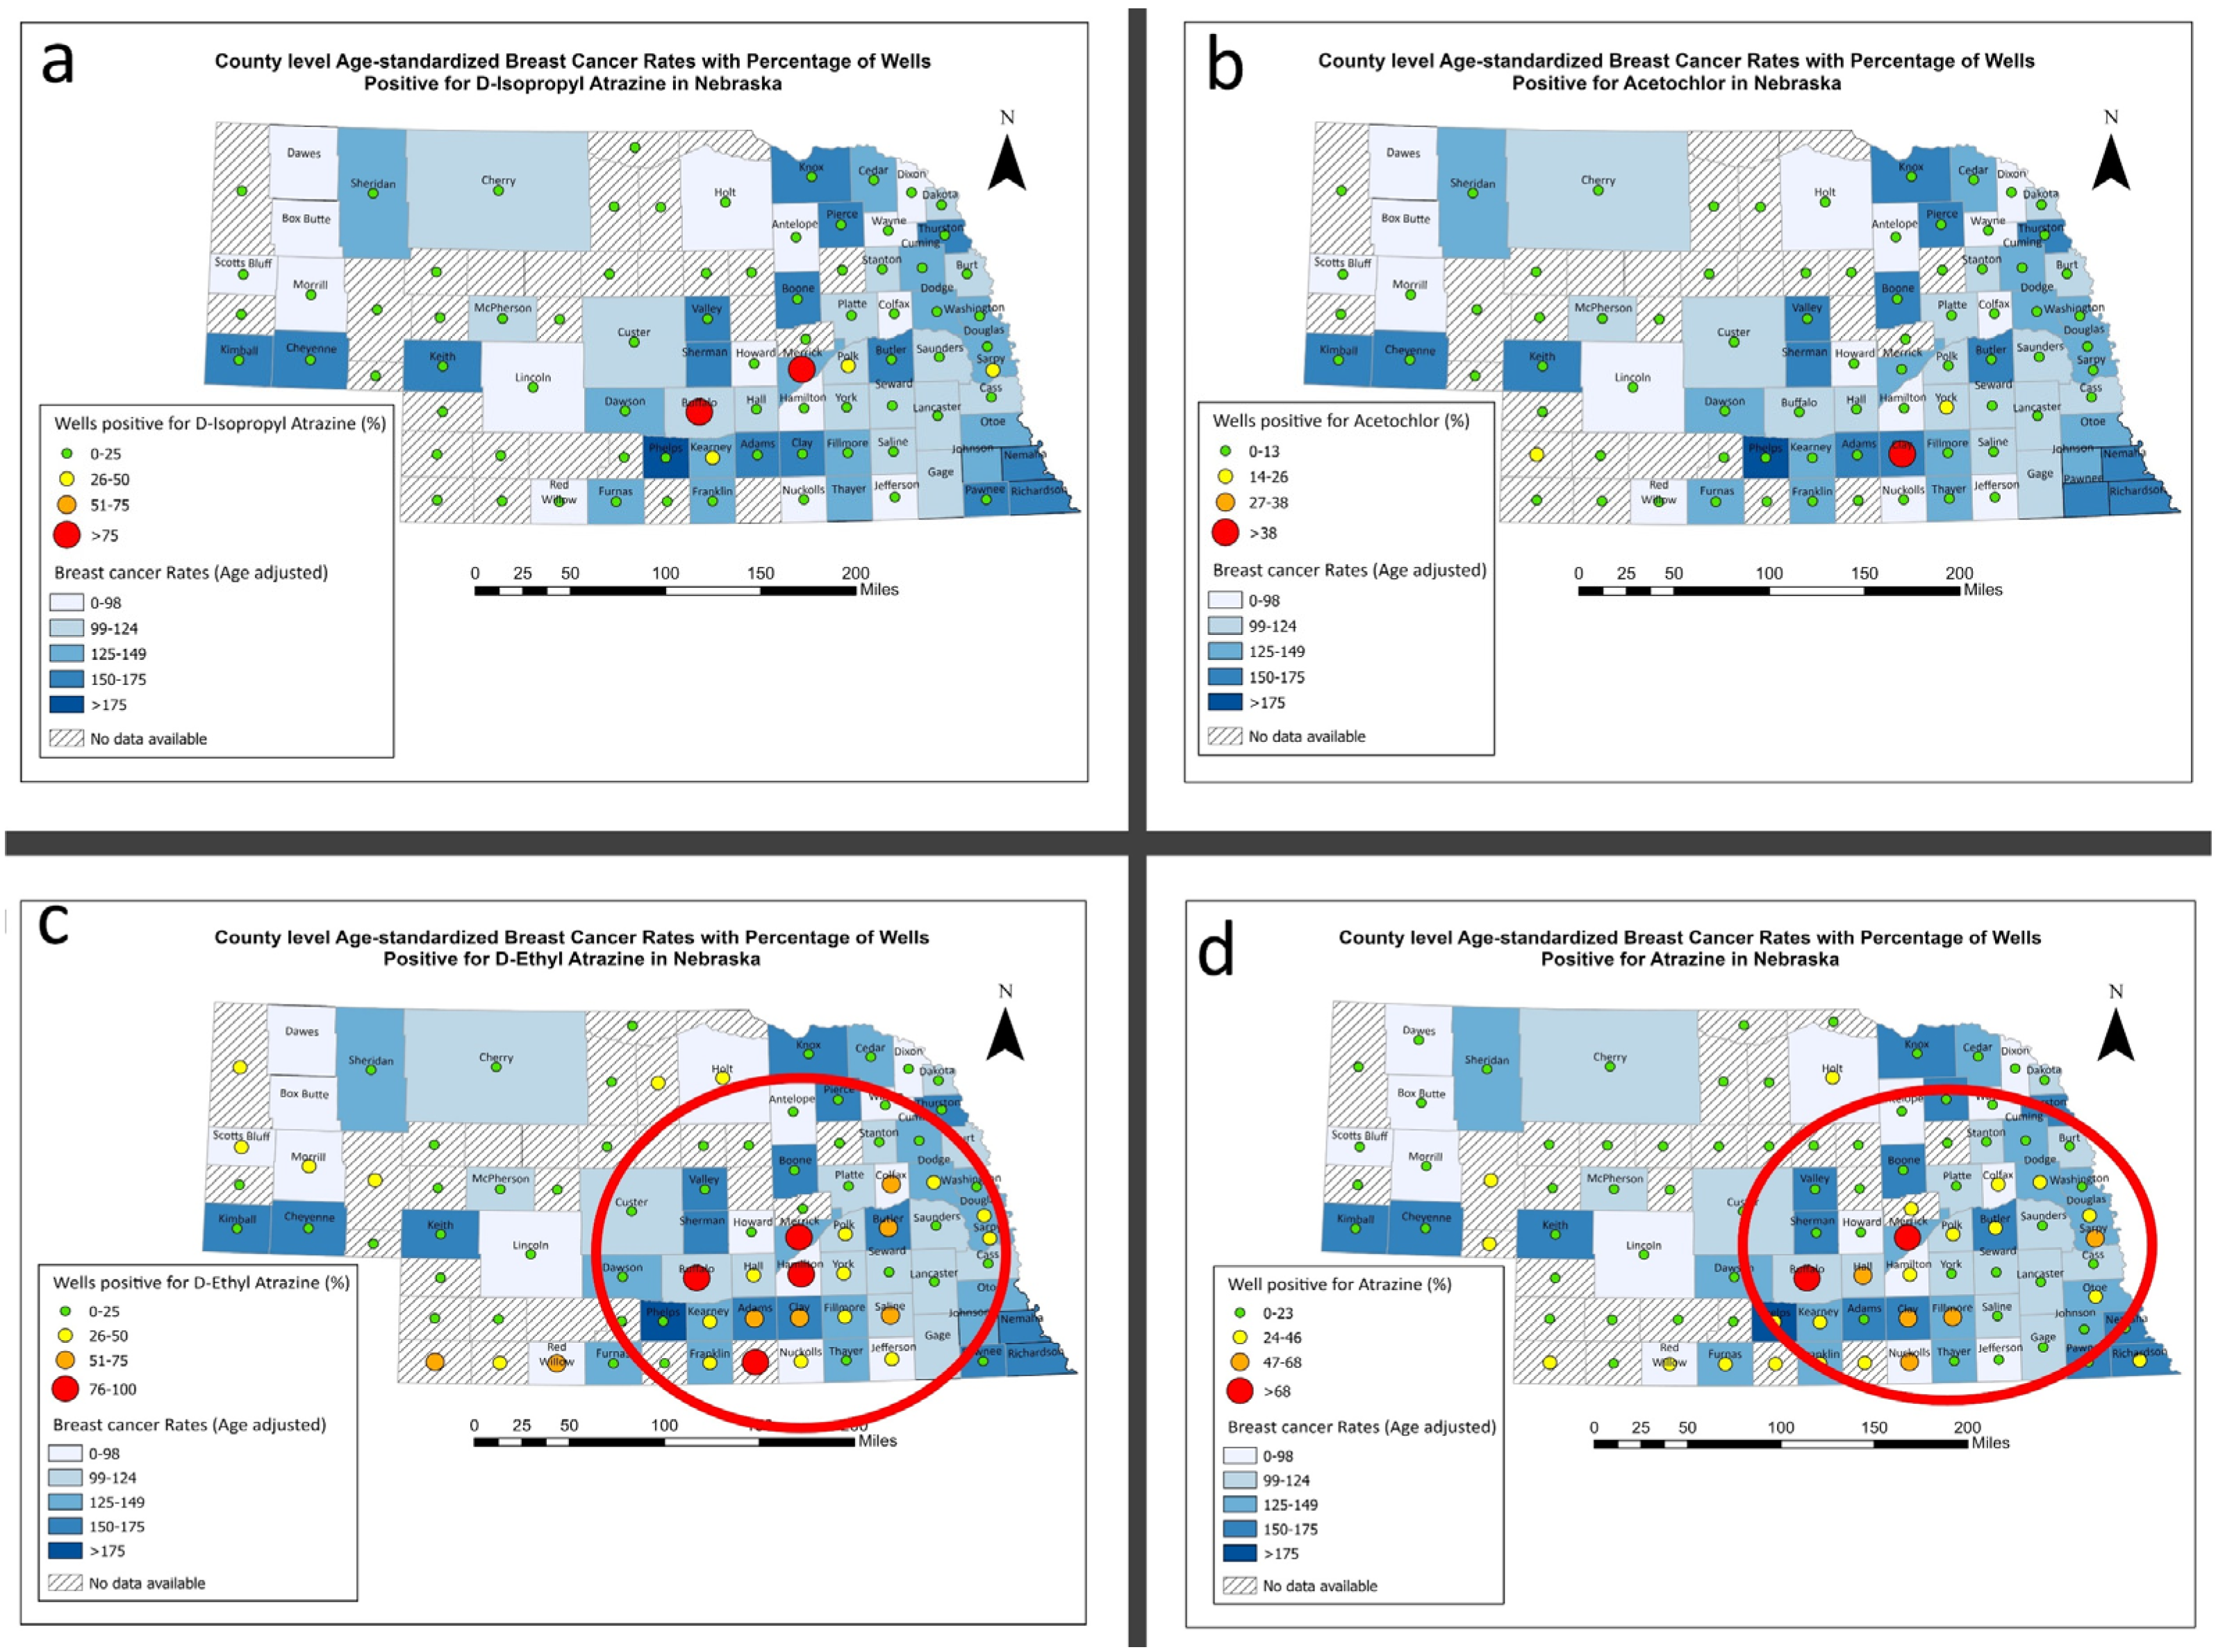
3.4. Breast Cancer and Estrogen Disrupting Pesticides

First, the linear relations between breast cancer rates and % pesticide positive water supply wells were evaluated in a scatter plot. A positive linear relationship between breast cancer and % positive wells for acetochlor, atrazine, and DIA was observed (Figure 4a,b,d). Meanwhile, % DEA positive water supply wells had a negative linear relationship with breast cancer rates on the scatter plot (Figure 4c).
% pesticides positive water supply wells were found to deviate from normality. Therefore, all % pesticide positive water supply wells were subjected to square root transformation before including them in the linear regression model. Meanwhile, evidence of collinearity was observed between atrazine and its metabolites as indicated by the correlation coefficient between atrazine and DEA (r = 0.598, p < 0.0001), and DIA (r = 0.559, p < 0.0001) (Table 3). Therefore, two separate models were generated, one for atrazine and the other for its metabolites. Given that other factors may confound breast cancer, we performed a Pearson correlative analysis between breast cancer and the potential county-level confounders. We found a correlation between physically unhealthy days and breast cancer rates (r = −0.205, p = 0.1) (Table 4). Therefore, physically unhealthy days were adjusted in the two separate models. None of the pesticide-positive water supply wells was significantly associated with breast cancer rates. (Table 5).

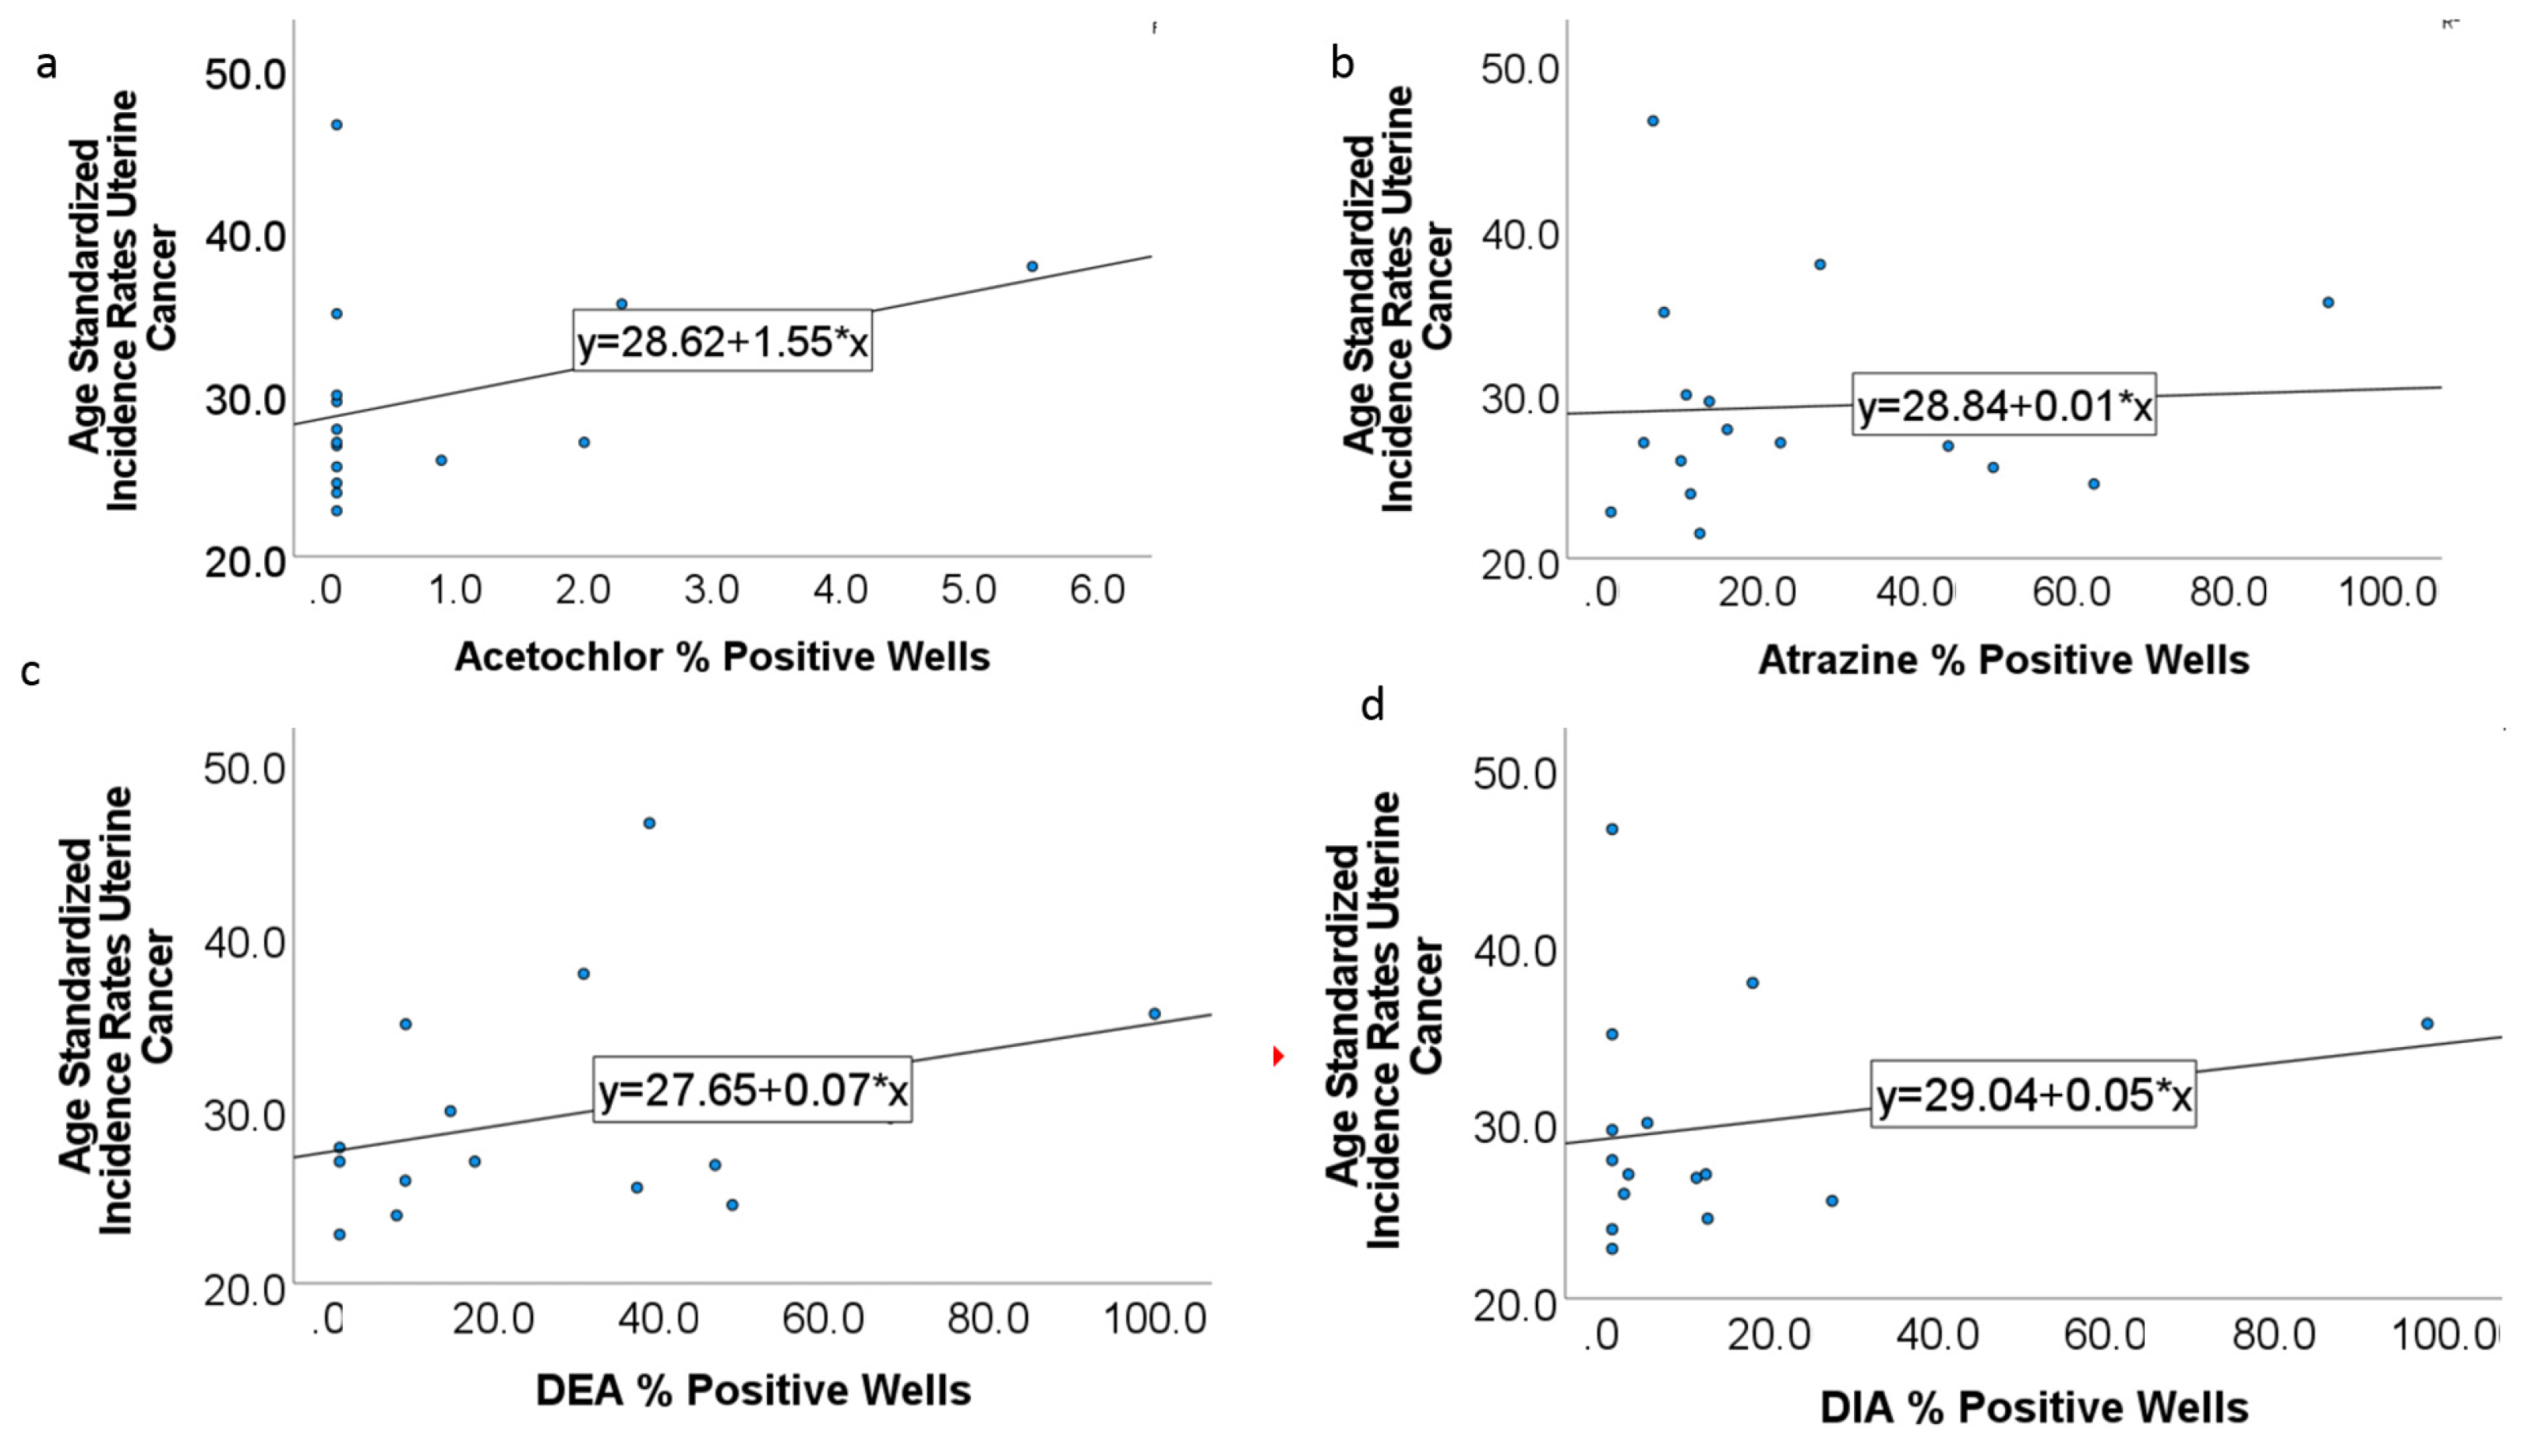
3.5. Uterine Cancer and Estrogen Disrupting Pesticides

% positive wells for acetochlor, atrazine, DIA, and DEA expressed a positive linear relationship with uterine cancer rates (Figure 5a–d), hence justifying why we proceeded with a linear regression analysis. However, uterine cancer rates were significantly correlated with physically unhealthy days (r = 0.52, p = 0.04), and % of binge drinking (r = 0.58, p = 0.02) (Table 4). Therefore, both the aforementioned potential confounders were included in the linear regression analysis. Two separate models were also tested for uterine cancers because of the evidence of collinearity between atrazine and its metabolites (DEA and DIA) (Table 3).
After adjusting for physically unhealthy days and % of binge drinking, only acetochlor positive water supply wells were positively associated with uterine cancer rates in the first model (β = 4.62, p = 0.03) and in the second model (β = 4.01, p = 0.04) (Table 5).

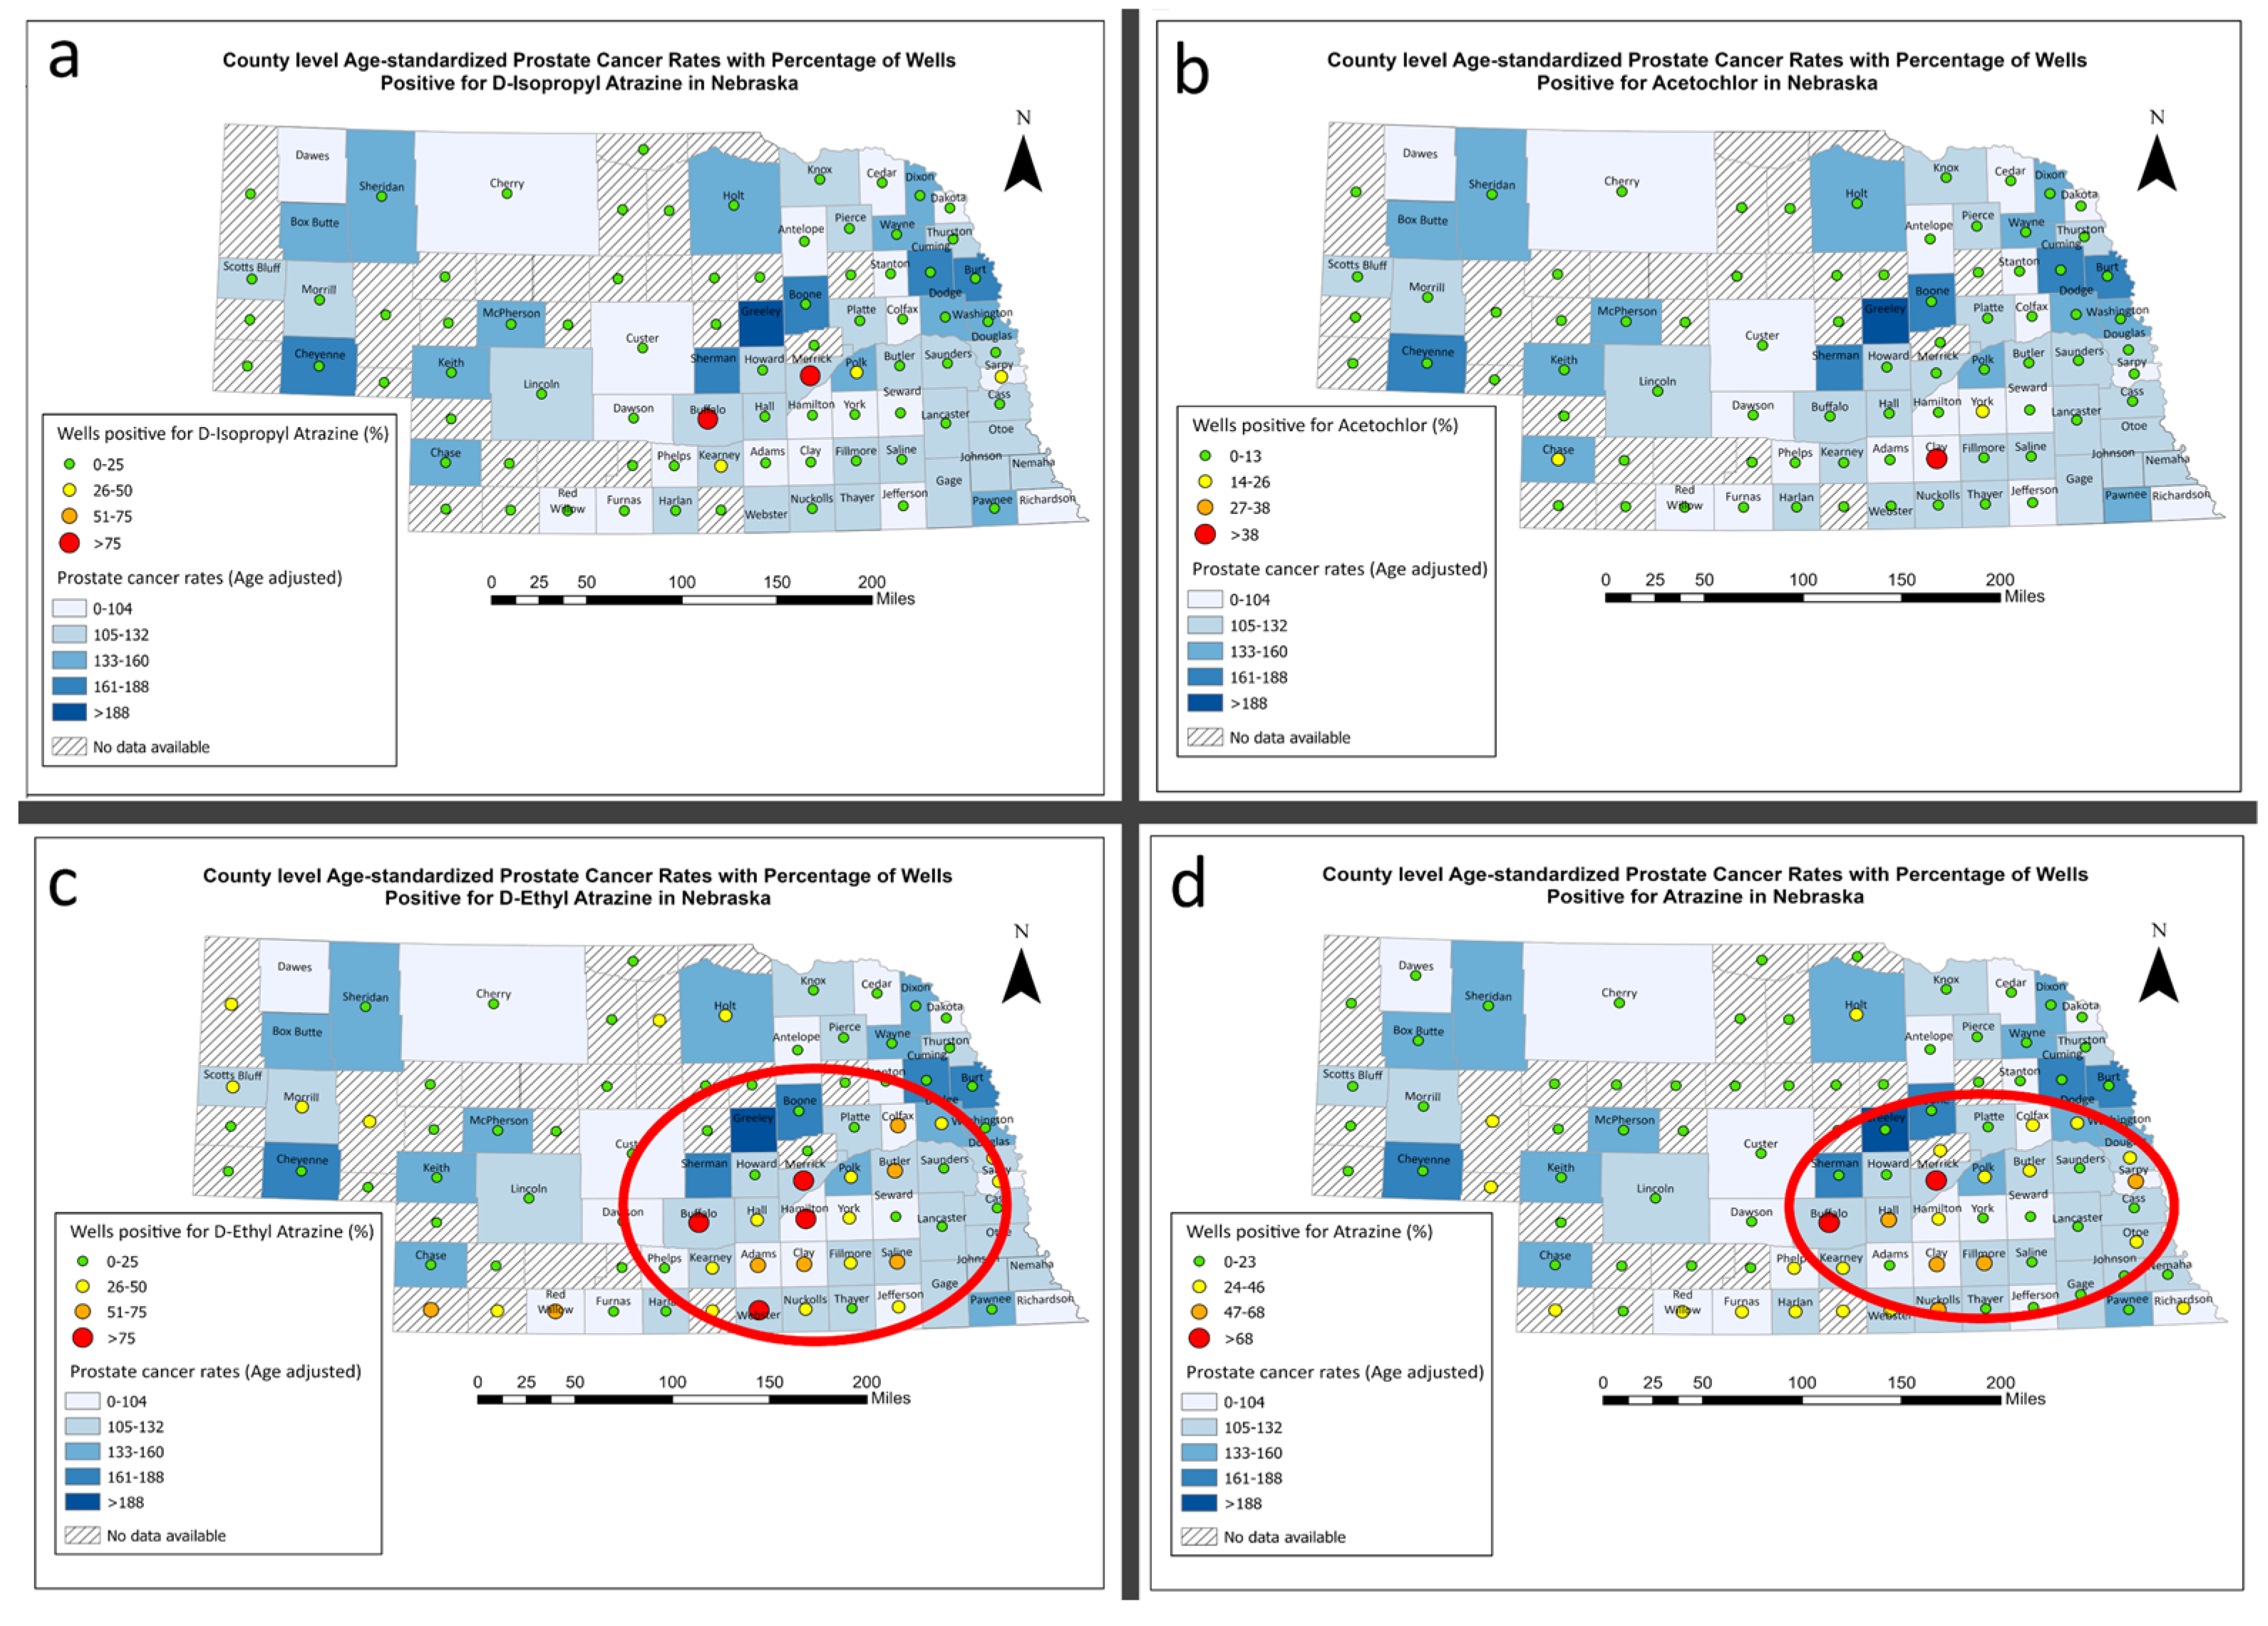
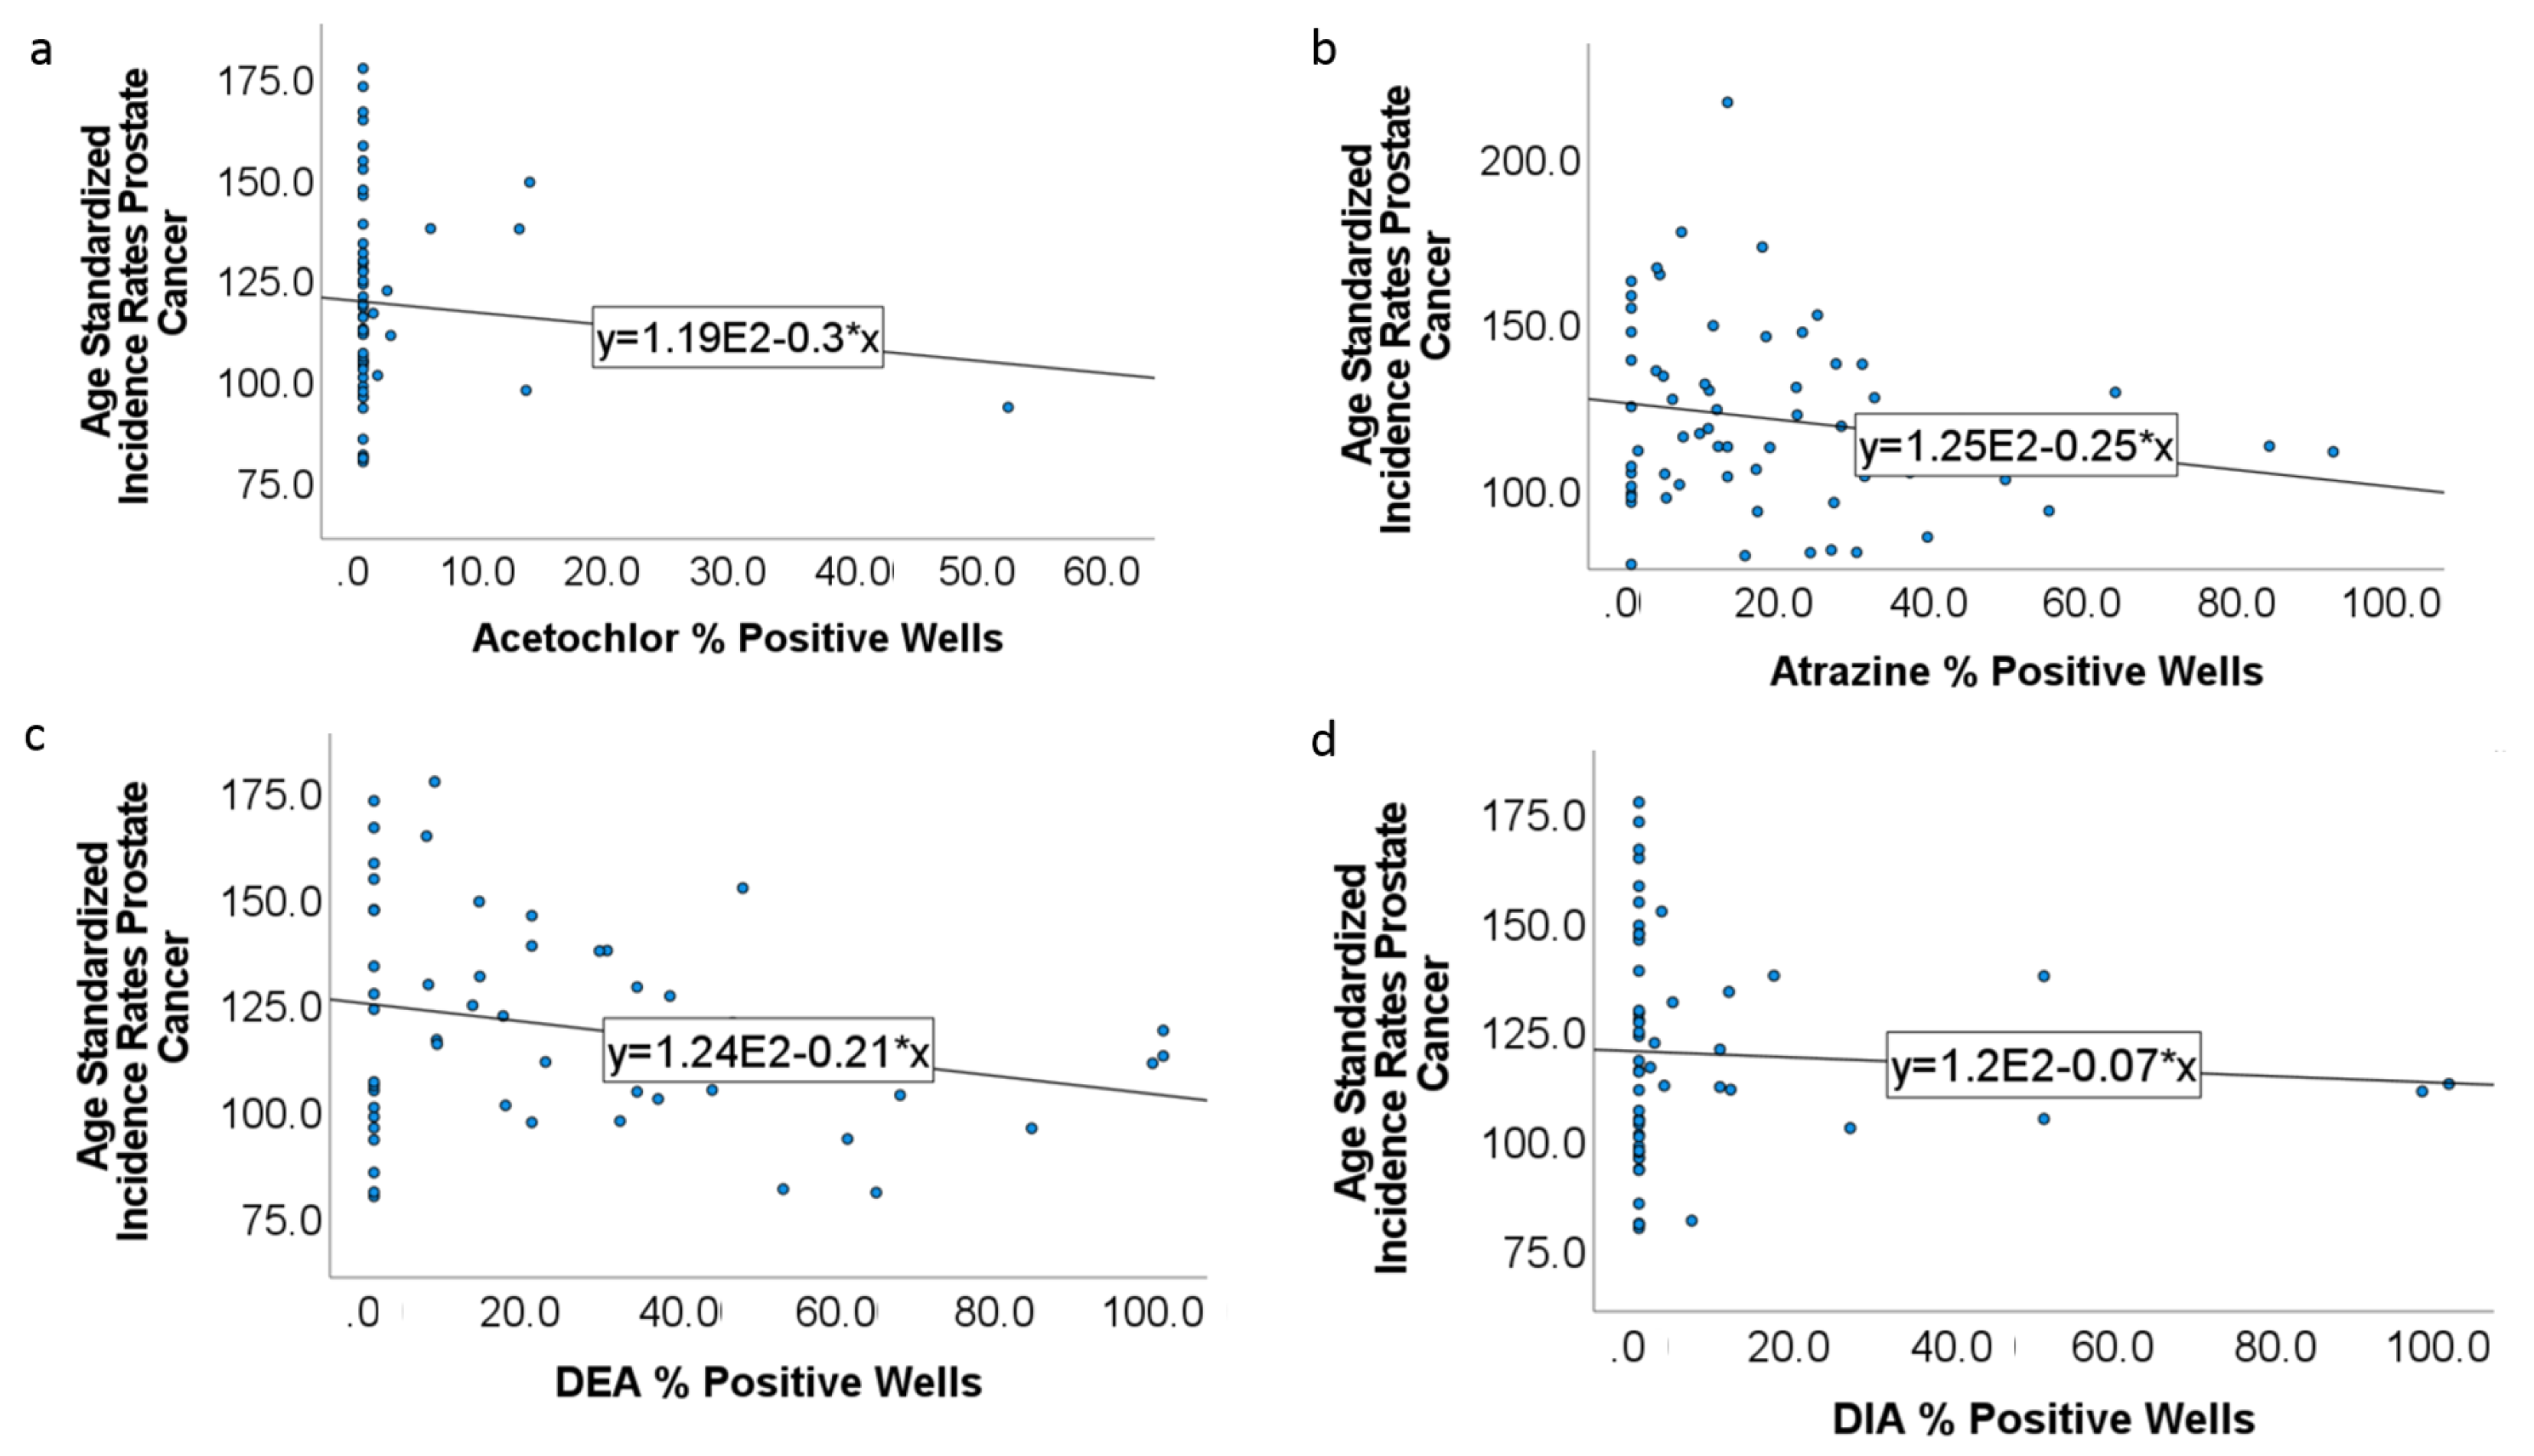
3.6. Prostate Cancer and Estrogen Disrupting Pesticides

In contrast to what was observed in the linear relationships for breast and uterine cancers with % pesticide positive wells, prostate cancer rates had a linear negative relationship with all EDP observed in this study (Figure 6a–d). In the correlative analysis between prostate cancer rates and the potential confounders, only % uninsured was associated (r = 0.39 p = 0.001) with prostate cancer rates (Table 4). Therefore, % uninsured was adjusted in the linear regression model. None of the % pesticide-positive water supply wells were significantly associated with prostate cancer (Table 5).

4. Discussion

The purpose of this paper was to determine the ecological distribution of EDP and its association with ERC by using Nebraska county-level data. Meanwhile Nebraska is an ideal location for this study, given that agrichemicals were previously reported in Nebraska ground and surface water. In fact, most of Nebraska overlies the high plains aquifer providing approximately 88 percent of Nebraska’s drinking water despite its susceptibility to pesticides applied to the land surface [26]. Shallow depths to groundwater levels, sandy soils, and intensely irrigated cropland all contribute to the high occurrence of the pesticides of interest in the water supply wells [27]. While these pesticides are diverse and numerous, in this study, atrazine and its metabolites and acetochlor were detected in high concentration in Nebraska groundwater. Moreover, atrazine or its metabolites are among the most prevalent groundwater contaminant in Nebraska [28].
Despite our ecological study design, we made some profound observations connecting EDP to ERC. Meanwhile, this is not the first study to observe EDP and ERC’s association [29,30,31]. For example, the correlation between DDT, its metabolites, and ERC has been famously described [13,32,33,34,35]. In fact, it was on this account DDT was banned by the United States Environmental Protection Agency (EPA) in 1972 [2]. Today other pesticides with EDP have emerged. However, strong evidence linking adverse estrogenic effects of pesticides is inadequately observed. Hence, this emphasizes the importance of this current study.
Nebraska is one of the leading states in the US concerning agricultural activities. Due to this, agrichemical production has also become one of the most important manufacturing sectors in the State [36]. Consequently, agrichemicals are frequently detected in watersheds and even groundwater [37]. Previous studies have observed the association between co-occurring agrichemicals in Nebraska groundwater and non-Hodgkin lymphoma [38]. Additionally, exposure to pesticides in Nebraska was shown to increase the risks of lung, skin, and hematological cancer [37]. Another population-based case-control study conducted in Nebraska found an increased risk of glioma due to male farmers’ pesticide exposure [39]. Moreover, three pesticides (glyphosate, diazinon, and coumaphos) were found to increase non-Hodgkin lymphoma risk among farmers in four midwestern states, including Nebraska [40]. Here, we will focus on characterizing EDP, given that most of the pesticides detected in Nebraska groundwater between 1974 and 2012 have estrogen disrupting properties.
In this current study, the prevalence of atrazine and DEA contaminated wells were higher in Nebraska’s South and South-Eastern districts. This also is the area with the highest incidence of breast and prostate cancer in the State of Nebraska. While this area is urbanized, significant farming activities occur which may be the source of pesticide contamination in the water supply wells. Also, EDP’s presence in these districts may be contributed by the Platte river that runs to the South East from the West of Nebraska, where the population is very sparse, with robust agricultural activities. Other features in the East and South of Nebraska that may trigger pesticide runoff through the Platte River from the West are its dissected till plains, deep soils, and frequent precipitation [41]. In fact, the high rates of pesticide runoff in Eastern Nebraska were previously reported [42].
Furthermore, ERC in Nebraska were found to be higher than the national rates. A positive linear relationship between breast cancer and % water supply wells positive for acetochlor, atrazine, and DIA was observed. Moreover, wells positive for atrazine and its metabolites (DEA) were observed in counties with elevated breast cancer rates, as indicated on the maps. A similar relationship was previously reported in an ecological study conducted in Kentucky [43]. Although, findings from a different epidemiological study did not observe a significant association between breast cancer and estrogen disrupting pesticides among Latinos in California [44], which is congruent with our observation when breast cancer rates were modeled with % pesticides positive wells in a multiple linear regression analysis. Furthermore, Muir et al., observed similar observation using both epidemiological and ecological designs. Muir et al.’s ecological design observed a correlation between breast cancer and atrazine, whereas there was no observed statistical association between breast cancer and atrazine in the epidemiological study [45]. In contrast, in vitro evidence disclosed the upregulation of GPR30, a G-protein coupled receptor for atrazine, on breast cancer cell lines exposed to atrazine even at doses below the maximum contaminant level for atrazine [12]. Maybe, the disparity in results for atrazine and breast cancer may emerge from differences in study methodologies as ecological studies may not account for other potential risk factors for breast cancer, which are adequately controlled in an epidemiological study. It is possible that atrazine may not be an independent etiology for breast cancer.
Meanwhile, atrazine in aromatase induction, which mediates estrogen synthesis is apparent [46,47]. Although animal studies did not find any causal relationship between atrazine and breast cancer [48], animal models may not sufficiently mimic atrazine mechanisms in humans. While the relationship between atrazine and breast cancer remains inconclusive, atrazine metabolites are another area of great concern in terms of atrazine’s carcinogenicity. Two atrazine metabolites were significantly detected in Nebraska groundwater, this includes, DEA and DIA. While previous epidemiological study conducted on DEA and DIA did not observe potential carcinogenicity [49], DEA positive wells in this study were found in counties with elevated breast cancer rates (from the map). However, this was not accompanied by a positive association in the linear regression analysis. Again, the differential effects of DEA on the map and the linear regression confirm the role of study designs to determine the relationship between environmental carcinogens and health outcomes accurately. Meanwhile, DIA did not produce any breast cancer effects in the linear model and on the map. This may suggest that DEA is a more toxic metabolite of atrazine than DIA, which is also a metabolite of simazine [50]. Hence, additional studies are required to explore the differential carcinogenicity of DEA and DIA. Furthermore, a significant association was previously found between breast cancer and other organochlorines [44,51,52,53], which was not replicated in this current study for acetochlor and breast cancer.
Uterine cancer is another ERC of interest. We observed a positive linear relationship between uterine cancer and all the EDP (atrazine, acetochlor, DEA, and DIA). Which was supported by a study that observed increased uterine fibroids due to atrazine-induced aromatase over-expression [54]. Moreover, an ecological study among the Mayan populace with a high prevalence of uterine cancer reported a high serum concentration of organochlorines [55,56]. This validates our study’s findings, which observed a significant association between uterine cancer and acetochlor after adjusting for physically unhealthy days and % of binge drinking per county in a multiple linear regression analysis. Based on these findings and previous experience with the use of DDT [57,58,59], another organochlorine, it is feared that acetochlor may have detrimental health outcomes.
Among the ERC selected for this study, prostate cancer is the only predominant male cancer. Evidence from animal models has linked prostate cancer to estrogen [60]. Moreover, EDP’s carcinogenic effects on prostate cell lines have been observed in vitro [61,62]. Meanwhile, it must be noted that estrogen and androgen (male hormones) are connected physiologically. In fact, androgens are estrogen precursors mediated by the enzyme aromatase. Moreover, androgen has been shown as an independent etiology for prostate cancer. It was observed in an epidemiological study that African American men with elevated serum androgen have an increased risk of prostate cancer compared to their counterpart Japanese men with low serum androgen [63].
Additionally, prostate treatment’s effectiveness using an androgen deprivation regimen is proof of androgen’s role in the incidence and progression of prostate cancer. Hence, it is not clear what the roles of estrogen are in prostate cancer. However, an animal study revealed that 5α-dihydrotestosterone, which is impossible to convert to estrogen by aromatase, increased prostate cancer risk in animals by 5%. However, when estrogen was added to 5α-dihydrotestosterone, the risk of prostate cancer increased by 3 folds [64]. This suggests that estrogen and androgen conversion may not be related to the incidence of prostate cancer. Another pathway mediated by androgen and estrogen interaction may be responsible for prostate cancer. However, no studies to our knowledge indicated estrogen as an independent etiology for prostate cancer. This may explain why we observed a linear negative association between prostate cancer and wells positive for all the estrogenic pesticides. Although atrazine and DEA positive wells were observed in counties with elevated prostate cancer rates as indicated on the map. Hence, our results may be more consistent in the presence of other androgenic pesticides, which were not observed in this study.
Lumping cancer rates into an age-standardized rate fails to consider the potential differences in breast cancer among younger and older age groups. Moreover, our analysis may have been underpowered by our limited sample size and numerous missing observations in the data. These are the major limitations for the findings of this study. Additionally, county level measurement or assessment of pesticide exposure and outcomes may be flawed by consistent migration of county residents, which were not accounted for in this study’s analysis. Moreover, this study methodology was strictly proxy, which impaired our ability to make conclusions concerning the relationship between pesticides and ERC. In response to this, a direct assessment of consumed pesticides which will consider other potential risk factors for carcinogenesis will significantly improve study outcomes. While this study focused on the possible effects of pesticides predominantly detected in the groundwater during the study period, the potential impact of unaccounted co-occurring pesticides, which may be present in limited quantities, cannot be undermined. Meanwhile, the interactions of co-occurring chemicals is another area of future interest. Despite this study’s limitations, the observed linear relationships between pesticide-positive wells could strongly impact our approach for considering these pesticides in future studies.

5. Conclusions

Our findings have confirmed the study designs’ role in making accurate conclusions on environmental exposures and health outcomes. While we and others repeatedly observed relationships between the EDP and ECR in the ecological study, no significant association was observed in the linear regression models. While it may be tempting to make conclusions based on the association between atrazine, DEA, and ERC observed on the map, ecological studies’ limitations must be recognized. Moreover, acetochlor was observed as potential environmental risk factors for uterine cancers in the linear regression analysis. Additional studies are required to further explore the relationship between EDP and ERC.

Author Contributions

Conceptualization, M.N.-A., and E.G.R.; methodology, M.N.-A.; software, M.N.-A. and Z.N.; validation, E.G.R.; formal analysis M.N.-A.; Mapping, Z.N. and M.N.-A. investigation, M.N.-A.; resources, M.N.-A. and E.G.R.; data curation, M.N.-A.; writing—original draft preparation, M.N.-A.; writing—review and editing, M.N.-A. and E.G.R.; visualization, E.G.R.; supervision, E.G.R.; project administration, M.N.-A. and E.G.R.; funding acquisition, E.G.R. All authors have read and agreed to the published version of the manuscript.

Funding

This project was funded by the Department of Environmental Health, Occupational Health and Toxicology, College of Public Health, University of Nebraska Medical Center, Omaha, Nebraska.

Institutional Review Board Statement

The study was conducted according to the guidelines of the Declaration of Helsinki, and Ethical review and approval were waived for this study, due to REASON the use of publicly available county level data.

Informed Consent Statement

Not applicable.

Data Availability Statement

Acknowledgments

We wish to acknowledge Adams Kusi Apiah for his contributions during results interpretations.

Conflicts of Interest

The authors declare no conflict of interest.

References

  1. Godfray, H.C.J.; Crute, I.R.; Haddad, L.; Lawrence, D.; Muir, J.F.; Nisbett, N.; Pretty, J.; Robinson, S.; Toulmin, C.; Whiteley, R. The future of the global food system. R. Soc. 2010. [Google Scholar] [CrossRef] [Green Version]
  2. United States Environemental Protection Agency, DDT—A Brief History and Status. 2017. Available online: https://www.epa.gov/ingredients-used-pesticide-products/ddt-brief-history-and-status (accessed on 23 December 2020).
  3. Bouwman, H.; Van den Berg, H.; Kylin, H. DDT and malaria prevention: Addressing the paradox. Environ. Health Perspect. 2011, 119, 744–747. [Google Scholar] [CrossRef] [Green Version]
  4. Eve, L.; Fervers, B.; Le Romancer, M.; Etienne-Selloum, N. Exposure to Endocrine Disrupting Chemicals and Risk of Breast Cancer. Int. J. Mol. Sci. 2020, 21, 9139. [Google Scholar] [CrossRef] [PubMed]
  5. Fischer Scientifc, Evolution of Chemical Pesticides. 2016. Available online: https://www.fishersci.com/us/en/scientific-products/publications/lab-reporter/2016/issue-4/the-evolution-chemical-pesticides.html (accessed on 23 December 2020).
  6. Mnif, W.; Hassine, A.I.; Bouaziz, A.; Bartegi, A.; Thomas, O.; Roig, B. Effect of endocrine disruptor pesticides: A review. Int. J. Environ. Res. Public Health 2011, 8, 2265–2303. [Google Scholar] [CrossRef] [PubMed] [Green Version]
  7. Center for Disease Control and Prevention, Agency for Toxic Substances and Disease Registry. Toxicological Profile for Malathion. 2003. Available online: https://www.atsdr.cdc.gov/toxprofiles/tp154.pdf (accessed on 23 December 2020).
  8. Peillex, C.; Pelletier, M. The impact and toxicity of glyphosate and glyphosate-based herbicides on health and immunity. J. Immunotoxicol. 2020, 17, 163–174. [Google Scholar] [CrossRef]
  9. Diamanti-Kandarakis, E.; Bourguignon, J.P.; Giudice, L.C.; Hauser, R.; Prins, G.S.; Soto, A.M.; Zoeller, R.T.; Gore, A.C. Endocrine-disrupting chemicals: An Endocrine Society scientific statement. Endocr. Rev. 2009, 30, 293–342. [Google Scholar] [CrossRef] [PubMed]
  10. Exner, M.E.; Spalding, R.F.; Harrell, D.M. Development of a quality-assessed agrichemical database for monitoring anthropogenic impacts on ground-water quality. Environmental monitoring and assessment 2005, 107, 249–257. [Google Scholar] [CrossRef]
  11. Mesnage, R.; Phedonos, A.; Biserni, M.; Arno, M.; Balu, S.; Corton, J.C.; Ugarte, R.; Antoniou, M.N. Evaluation of estrogen receptor alpha activation by glyphosate-based herbicide constituents. Food Chem. Toxicol. 2017, 108, 30–42. [Google Scholar] [CrossRef] [Green Version]
  12. Florian, C.P.; Mansfield, S.R.; Schroeder, J.R. Differences in GPR30 regulation by chlorotriazine herbicides in human breast cells. Biochem. Res. Int. 2016, 2016. [Google Scholar] [CrossRef] [Green Version]
  13. Pestana, D.; Teixeira, D.; Faria, A.; Domingues, V.; Monteiro, R.; Calhau, C. Effects of environmental organochlorine pesticides on human breast cancer: Putative involvement on invasive cell ability. Environ. Toxicol. 2015, 30, 168–176. [Google Scholar] [CrossRef] [PubMed] [Green Version]
  14. Fedak, K.M.; Bernal, A.; Capshaw, Z.A.; Gross, S. Applying the Bradford Hill criteria in the 21st century: How data integration has changed causal inference in molecular epidemiology. Emerg. Themes Epidemiol. 2015, 12, 1–9. [Google Scholar] [CrossRef] [PubMed] [Green Version]
  15. McDonald, J.A.; Goyal, A.; Terry, M.B. Alcohol Intake and Breast Cancer Risk: Weighing the Overall Evidence. Curr. Breast Cancer Rep. 2013, 5, 208–221. [Google Scholar] [CrossRef] [Green Version]
  16. de Menezes, R.F.; Bergmann, A.; Thuler, L.C. Alcohol consumption and risk of cancer: A systematic literature review. Asian Pac. J. Cancer Prev. 2013, 14, 4965–4972. [Google Scholar] [CrossRef] [Green Version]
  17. Todoric, J.; Antonucci, L.; Karin, M. Targeting Inflammation in Cancer Prevention and Therapy. Cancer Prev. Res. (Phila) 2016, 9, 895–905. [Google Scholar] [CrossRef] [Green Version]
  18. Gallagher, E.J.; LeRoith, D. Obesity and Diabetes: The Increased Risk of Cancer and Cancer-Related Mortality. Physiol. Rev. 2015, 95, 727–748. [Google Scholar] [CrossRef] [Green Version]
  19. De Pergola, G.; Silvestris, F. Obesity as a major risk factor for cancer. J. Obes. 2013, 2013, 291546. [Google Scholar] [CrossRef] [Green Version]
  20. Smith, G.L.; Lopez-Olivo, M.A.; Advani, P.G.; Ning, M.S.; Geng, Y.; Giordano, S.H.; Volk, R.J. Financial Burdens of Cancer Treatment: A Systematic Review of Risk Factors and Outcomes. J. Natl. Compr. Canc. Netw. 2019, 17, 1184–1192. [Google Scholar] [CrossRef]
  21. Jia, H.; Muennig, P.; Lubetkin, E.; Gold, M.R. Predicting geographical variations in behavioural risk factors: An analysis of physical and mental healthy days. J. Epidemiol. Community Health 2004, 58, 150–155. [Google Scholar] [CrossRef]
  22. St-Pierre, A.P.; Shikon, V.; Schneider, D.C. Count data in biology—Data transformation or model reformation? Ecol. Evol. 2018, 8, 3077–3085. [Google Scholar] [CrossRef] [PubMed] [Green Version]
  23. Donath, C.; Gräßel, E.; Baier, D.; Pfeiffer, C.; Bleich, S.; Hillemacher, T. Predictors of binge drinking in adolescents: Ultimate and distal factors—A representative study. BMC Public Health 2012, 12, 263. [Google Scholar] [CrossRef] [PubMed] [Green Version]
  24. Berry, W.D.; Feldman, S.; Stanley Feldman, D. Multiple Regression in Practice; Sage: Thousand Oaks, CA, USA, 1985. [Google Scholar]
  25. Vatcheva, K.P.; Lee, M.; McCormick, J.B.; Rahbar, M.H. Multicollinearity in regression analyses conducted in epidemiologic studies. Epidemiol. (SunnyvaleCalif.) 2016, 6. [Google Scholar] [CrossRef] [Green Version]
  26. Database, Q.-A.A.C.; Water, F.N.G. 2019 Nebraska Groundwater. Quality Monitoring Report. 2019. Available online: http://dee.ne.gov/Publica.nsf/Pages/WAT333 (accessed on 23 December 2020).
  27. Burow, K.R.; Shelton, J.L.; Dubrovsky, N.M. Occurrence of Nitrate and Pesticides in Ground Water Beneath Three Agricultural Land-Use Settings in the Eastern San Joaquin Valley, California, 1993–1995; U.S. Department of the Interior, U.S. Geological Survey: Washington, DC, USA, 1998; Volume 97.
  28. Papiernik, S.K.; Spalding, R.F. Atrazine, deethylatrazine, and deisopropylatrazine persistence measured in groundwater in situ under low-oxygen conditions. J. Agric. Food Chem. 1998, 46, 749–754. [Google Scholar] [CrossRef] [PubMed] [Green Version]
  29. Fenga, C. Occupational exposure and risk of breast cancer. Biomed. Rep. 2016, 4, 282–292. [Google Scholar] [CrossRef] [PubMed] [Green Version]
  30. Zadnik, V.; Krajc, M. Epidemiological trends of hormone-related cancers in Slovenia. Arh. Za Hig. Rada I Toksikol. 2016, 67, 83–92. [Google Scholar] [CrossRef] [PubMed] [Green Version]
  31. Wielsøe, M.; Kern, P.; Bonefeld-Jørgensen, E.C. Serum levels of environmental pollutants is a risk factor for breast cancer in Inuit: A case control study. Environ. Health 2017, 16, 1–16. [Google Scholar] [CrossRef] [PubMed] [Green Version]
  32. United States Environmental Protection Agency, Pesticides Industry Sales and Usage 2013. Available online: https://www.epa.gov/pesticides/pesticides-industry-sales-and-usage-2008-2012-market-estimates (accessed on 23 December 2020).
  33. Romieu, I.; Hernandez-Avila, M.; Lazcano-Ponce, E.; Weber, J.P.; Dewailly, E. Breast cancer, lactation history, and serum organochlorines. Am. J. Epidemiol. 2000, 152, 363–370. [Google Scholar] [CrossRef] [PubMed] [Green Version]
  34. Falck, F., Jr.; Ricci, A., Jr.; Wolff, M.S.; Godbold, J.; Deckers, P. Pesticides and polychlorinated biphenyl residues in human breast lipids and their relation to breast cancer. Arch. Environ. Health 1992, 47, 143–146. [Google Scholar]
  35. Güttes, S.; Failing, K.; Neumann, K.; Kleinstein, J.; Georgii, S.; Brunn, H. Chlororganic pesticides and polychlorinated biphenyls in breast tissue of women with benign and malignant breast disease. Arch. Environ. Contam. Toxicol. 1998, 35, 140–147. [Google Scholar] [CrossRef]
  36. Nebraska. Nebraska Economy. 2017. Available online: https://www.netstate.com/economy/ne_economy.htm#:~:text=Corn%20is%20Nebraska's%20most%20important,beans%2C%20sugar%20beets%20and%20potatoes (accessed on 23 December 2020).
  37. Institute of Agriculture and Natural Resources (UNL). Ag Health Study Examines Pesticide Exposure. 2000. Available online: https://cropwatch.unl.edu/ag-health-study-examines-pesticide-exposure-diseases (accessed on 23 December 2020).
  38. Rhoades, M.G.; Meza, J.L.; Beseler, C.L.; Shea, P.J.; Kahle, A.; Vose, J.M.; Eskridge, K.M.; Spalding, R.F. Atrazine and nitrate in public drinking water supplies and non-Hodgkin lymphoma in Nebraska, USA. Environ. Health Insights 2013, 7, EHI.S10629. [Google Scholar] [CrossRef] [PubMed] [Green Version]
  39. Lee, W.J.; Colt, J.S.; Heineman, E.F.; McComb, R.; Weisenburger, D.D.; Lijinsky, W.; Ward, M.H. Agricultural pesticide use and risk of glioma in Nebraska, United States. Occup Environ. Med. 2005, 62, 786–792. [Google Scholar] [CrossRef] [PubMed] [Green Version]
  40. De Roos, A.J.; Zahm, S.H.; Cantor, K.P.; Weisenburger, D.D.; Holmes, F.F.; Burmeister, L.F.; Blair, A. Integrative assessment of multiple pesticides as risk factors for non-Hodgkin’s lymphoma among men. Occup Environ. Med. 2003, 60, E11. [Google Scholar] [CrossRef] [PubMed] [Green Version]
  41. American Land Brokers, Important Regions of Nebraska. 2019. Available online: https://www.americanlandbroker.com/states/nebraska/articles/nebraska-regions (accessed on 23 December 2020).
  42. U.S. Geological Survey, Water Quality in the Central Nebraska Basins Nebraska, 1992–1995. 1998. Available online: https://pubs.usgs.gov/circ/circ1163/circ1163.pdf (accessed on 23 December 2020).
  43. Hopenhayn-Rich, C.; Stump, M.; Browning, S. Regional assessment of atrazine exposure and incidence of breast and ovarian cancers in Kentucky. Arch. Environ. Contam. Toxicol. 2002, 42, 127–136. [Google Scholar] [CrossRef] [PubMed]
  44. Mills, P.K.; Yang, R. Regression analysis of pesticide use and breast cancer incidence in California Latinas. J. Environ. Health 2006, 68, 15–22. [Google Scholar]
  45. Muir, K.; Rattanamongkolgul, S.; Smallman-Raynor, M.; Thomas, M.; Downer, S.; Jenkinson, C. Breast cancer incidence and its possible spatial association with pesticide application in two counties of England. Public Health 2004, 118, 513–520. [Google Scholar] [CrossRef] [PubMed]
  46. Jin, Y.; Wang, L.; Fu, Z. Oral exposure to atrazine modulates hormone synthesis and the transcription of steroidogenic genes in male peripubertal mice. Gen. Comp. Endocrinol. 2013, 184, 120–127. [Google Scholar] [CrossRef]
  47. Fan, W.; Yanase, T.; Morinaga, H.; Gondo, S.; Okabe, T.; Nomura, M.; Komatsu, T.; Morohashi, K.-I.; Hayes, T.B.; Takayanagi, R. Atrazine-induced aromatase expression is SF-1 dependent: Implications for endocrine disruption in wildlife and reproductive cancers in humans. Environ. Health Perspect. 2007, 115, 720–727. [Google Scholar] [CrossRef] [PubMed]
  48. Simpkins, J.W.; Swenberg, J.A.; Weiss, N.; Brusick, D.; Eldridge, J.C.; Stevens, J.T.; Handa, R.J.; Hovey, R.C.; Plant, T.M.; Pastoor, T.P. Atrazine and breast cancer: A framework assessment of the toxicological and epidemiological evidence. Toxicol. Sci. 2011, 123, 441–459. [Google Scholar] [CrossRef] [PubMed]
  49. Center for Disease Control and Prevention, Agency for Toxic Substances and Disease Registry. Interaction Profile for: Atrazine, Deethylatrazine, Diazinon, Nitrate, and Simazine. 2006. Available online: https://www.atsdr.cdc.gov/interactionprofiles/ip-10/ip10.pdf (accessed on 23 December 2020).
  50. Thurman, E.M.; Scribner, E.A. A decade of measuring, monitoring, and studying the fate and transport of triazine herbicides and their degradation products in groundwater, surface water, reservoirs, and precipitation by the U.S. Geological Survey. Triazine Herbic. 2008, 50, 451–475. [Google Scholar]
  51. Rivero, J.; Henríquez-Hernández, L.A.; Luzardo, O.P.; Pestano, J.; Zumbado, M.; Boada, L.D.; Valerón, P.F. Differential gene expression pattern in human mammary epithelial cells induced by realistic organochlorine mixtures described in healthy women and in women diagnosed with breast cancer. Toxicol. Lett. 2016, 246, 42–48. [Google Scholar] [CrossRef] [PubMed]
  52. Eldakroory, S.; Morsi, D.E.; Abdel-Rahman, R.; Roshdy, S.; Gouida, M.; Khashaba, E. Correlation between toxic organochlorine pesticides and breast cancer. Hum. Exp. Toxicol. 2017, 36, 1326–1334. [Google Scholar] [CrossRef] [PubMed]
  53. Charlier, C.; Albert, A.; Herman, P.; Hamoir, E.; Gaspard, U.; Meurisse, M.; Plomteux, G. Breast cancer and serum organochlorine residues. Occup. Environ. Med. 2003, 60, 348–351. [Google Scholar] [CrossRef] [PubMed]
  54. Bulun, S.E.; Lin, Z.; Imir, G.; Amin, S.; Demura, M.; Yilmaz, B.; Martin, R.; Utsunomiya, H.; Thung, S.; Gurates, B. Regulation of aromatase expression in estrogen-responsive breast and uterine disease: From bench to treatment. Pharmacol. Rev. 2005, 57, 359–383. [Google Scholar] [CrossRef] [PubMed]
  55. Rodríguez, Á.G.P.; López, M.I.R.; Casillas, T.Á.D.; León, J.A.A.; Mahjoub, O.; Prusty, A.K. Monitoring of organochlorine pesticides in blood of women with uterine cervix cancer. Environ. Pollut. 2017, 220, 853–862. [Google Scholar] [CrossRef]
  56. Rodríguez, Á.G.P.; López, M.I.R.; Casillas, T.A.D.; León, J.A.; Prusty, B.A.K.; Cervera, F.J.Á. Levels of persistent organic pollutants in breast milk of Maya women in Yucatan, Mexico. Environ. Monit. Assess. 2017, 189, 59. [Google Scholar] [CrossRef]
  57. Cohn, B.A.; Cirillo, P.M.; Terry, M.B. DDT and Breast Cancer: Prospective Study of Induction Time and Susceptibility Windows. Jnci J. Natl. Cancer Inst. 2019, 111, 803–810. [Google Scholar] [CrossRef] [PubMed]
  58. Jaga, K.; Duvvi, H. Risk reduction for DDT toxicity and carcinogenesis through dietary modification. J. R. Soc. Promot. Health 2001, 121, 107–113. [Google Scholar] [CrossRef] [PubMed]
  59. Harada, T.; Takeda, M.; Kojima, S.; Tomiyama, N. Toxicity and Carcinogenicity of Dichlorodiphenyltrichloroethane (DDT). Toxicol. Res. 2016, 32, 21–33. [Google Scholar] [CrossRef] [PubMed]
  60. Nelles, J.L.; Hu, W.Y.; Prins, G.S. Estrogen action and prostate cancer. Expert Rev. Endocrinol. Metab 2011, 6, 437–451. [Google Scholar] [CrossRef] [Green Version]
  61. Lee, H.H.; Chou, C.T.; Liang, W.Z.; Chen, W.C.; Wang, J.L.; Yeh, J.H.; Kuo, C.C.; Shieh, P.; Kuo, D.H.; Chen, F.A.; et al. Ca²⁺ Movement Induced by Deltamethrin in PC3 Human Prostate Cancer Cells. Chin. J. Physiol 2016, 59, 148–155. [Google Scholar] [CrossRef] [PubMed]
  62. Hu, K.; Tian, Y.; Du, Y.; Huang, L.; Chen, J.; Li, N.; Liu, W.; Liang, Z.; Zhao, L. Atrazine promotes RM1 prostate cancer cell proliferation by activating STAT3 signaling. Int. J. Oncol. 2016, 48, 2166–2174. [Google Scholar] [CrossRef] [PubMed]
  63. Ross, R.K.; Bernstein, L.; Pike, M.; Henderson, B.; Lobo, R.; Stanczyk, F.; Shimizu, H. 5-alpha-reductase activity and risk of prostate cancer among Japanese and U.S. white and black males. Lancet 1992, 339, 887–889. [Google Scholar] [CrossRef]
  64. Weihua, Z.; Lathe, R.; Warner, M.; Gustafsson, J.-Å. An endocrine pathway in the prostate, ERβ, AR, 5α-androstane-3β, 17β-diol, and CYP7B1, regulates prostate growth. Proc. Natl. Acad. Sci. USA 2002, 99, 13589–13594. [Google Scholar] [CrossRef] [PubMed] [Green Version]
Figure 1. Well types included in the data obtained from quality assessed agrichemical contaminants Nebraska database (1 January 1974–31 December 2012).
Water 13 00790 g001
Figure 2. (a) Map showing 93 Nebraska counties with age-standardized incidence rates of breast cancer and % D-Isopropyl Atrazine positive wells. (b) Map showing 93 Nebraska counties with age-standardized incidence rates of breast cancer and % Acetochlor positive wells. (c) Map showing 93 Nebraska counties with age-standardized incidence rates of breast cancer and % D-Ethyl Atrazine positive wells. Areas marked with red cycle have elevated age-standardized incidence rates and high % pesticide positive wells. (d) Map showing 93 Nebraska counties with age-standardized incidence rates of breast cancer and % Atrazine positive wells. Counties with legend indicated as “no data available” were counties missing the calculation of age-standardized incidence rates because they have fewer than three breast cancer cases between January 2013 and December 2017.
Water 13 00790 g002
Figure 3. (a) Map showing 93 Nebraska counties with age-standardized incidence rates of prostate cancer and % D-Isopropyl Atrazine positive wells. (b) Map showing 93 Nebraska counties with age-standardized incidence rates of prostate cancer and % Acetochlor positive wells. (c) Map showing 93 Nebraska counties with age-standardized incidence rates of prostate cancer and % D-Ethyl Atrazine positive wells. Areas marked with red cycle have elevated age-standardized incidence rates and high % pesticide positive wells. (d) Map showing 93 Nebraska counties with age-standardized incidence rates of prostate cancer and % Atrazine positive wells. Counties with legend indicated as “no data available” were counties missing the calculation of age-standardized incidence rates because they have fewer than three breast cancer cases between January 2013 and December 2017.
Water 13 00790 g003
Figure 4. Linear relationship of percent pesticide positive wells (1 January 1974–31 December 2012) and age-standardized incidence rate breast cancer (1 January 2013–31 December 2017) (a) Scatter plot showing the relationship between acetochlor % positive wells and age standardized incidence rates for breast cancer (b) Scatter plot showing the relationship between atrazine % positive wells and age standardized incidence rates for breast cancer (c) Scatter plot showing the relationship between DEA % positive wells and age standardized incidence rates for breast cancer (d) Scatter plot showing the relationship between DIA % positive wells and age standardized incidence rates for breast cancer.
Water 13 00790 g004
Figure 5. Linear relationship of percent pesticide positive wells (1 January 1974–31 December, 2012) and age-standardized incidence rate for uterine cancer (1 January 2013–31 December 2017). (a) Scatter plot showing the relationship between acetochlor % positive wells and age standardized incidence rates for uterine cancer (b) Scatter plot showing the relationship between atrazine % positive wells and age standardized incidence rates for uterine cancer (c) Scatter plot showing the relationship between DEA % positive wells and age standardized incidence rates for uterine cancer (d) Scatter plot showing the relationship between DIA % positive wells and age standardized incidence rates for uterine cancer.
Water 13 00790 g005
Figure 6. Linear relationship of percent pesticide positive wells (1 January 1974–31 December, 2012) and age-standardized incidence rate for Prostate cancer (1 January 2013–31 December 2017). (a) Scatter plot showing the relationship between acetochlor % positive wells and age standardized incidence rates for prostate cancer (b) Scatter plot showing the relationship between atrazine % positive wells and age standardized incidence rates for prostate cancer (c) Scatter plot showing the relationship between DEA % positive wells and age standardized incidence rates for prostate cancer (d) Scatter plot showing the relationship between DIA % positive wells and age standardized incidence rates for prostate cancer.
Water 13 00790 g006
Table 1. The number of groundwater sampled and the number of wells with detectable estrogen disrupting pesticides in the different well types of Nebraska groundwater database (1 January 1974–31 December 2012).
PesticideWell TypesTested
NegativePositive
AtrazineC15 (68)7 (32)
D1913 (92)167 (8)
I939 (73)343 (27)
Q323 (25)956 (75)
S16 (62)10 (38)
AcetochlorC13 (100)0
D178 (100)0
I479 (95)24 (5)
Q963 (98)24 (2)
S7 (100)0
DeethylatrazineC16 (76)5 (24)
D171(91)17 (9)
I449 (72)179 (28)
Q284 (24)874 (75)
S5 (100)0
DeisopropylatrazineC18 (95)1 (5)
D179 (98)3 (2)
I575 (98)13 (2)
Q356 (34)698 (66)
S4 (100)0
C = commercial wells; D = domestic wells; I = irrigation wells; Q = monitoring wells; S = livestock wells.
Table 2. The descriptive statistics of age-standardized cancer rates, cases/100,000 (January 2013–December 2017), % pesticide positive water supply wells (January 1974–December 2012), and the county level confounders (2010).
VariablesMeanMedianMinimumMaximumPercentiles
25th75th
Age Standardized Breast Cancer Incidence124.27124.472.2200.298.7148.825
Age Standardized Uterine Cancer Incidence29.1752721.546.524.7533.65
Age Standardized Prostate Cancer Incidence120.066114.976.5215.7102.45135.8
Acetochlor % Positive Wells1.54120051.6100
Atrazine % Positive Wells15.61119.0909091.15026.1449
DEA % Positive Wells22.240812.50100037.5
DIA % Positive Wells5.36840010000
Physically unhealthy days2.84932.851.45.792.463.13
% Adult Smoking18.099918.291.1729.1914.8921.09
% Adult Obesity28.87628.826.232.428.129.6
% Binge Drinking16.640316.7256.0927.8713.9419.63
% Uninsured18.538718.39.133.213.5521.85
Table 3. Evaluation of collinearity among the % pesticides positive wells (January 1974–December 2012).
% Pesticide Positive WellsSquare Root of Percent Positive Wells for AtrazineSquare Root of Percent Positive Wells for AcetochlorSquare Root of Percent Positive Wells for DEASquare Root of Percent Positive Wells for DIA
Square Root of Percent Positive Wells for AtrazinePearson Correlation10.2040.598 **0.559 **
p value (2-tailed) 0.0750.0000.000
Square Root of Percent Positive Wells for AcetochlorPearson Correlation0.20410.257 *0.121
p value (2-tailed)0.075 0.0240.301
Square Root of Percent Positive Wells for DEAPearson Correlation0.598 **0.257 *10.472 **
p value (2-tailed)0.0000.024 0.000
Square Root of Percent Positive Wells for DIAPearson Correlation0.559 **0.1210.472 **1
p value (2-tailed)0.0000.3010.000
N77757777
*. Correlation is significant at the 0.05 level (2-tailed). **. Correlation is significant at the 0.01 level (2-tailed).
Table 4. Analysis of correlation between county-level potential confounders from County Health Rankings (2010) and county level age-standardized incidence rates of estrogen-related cancers (1 January 2013–31 December 2017).
Potential County Level ConfoundersAge Standardized Breast Cancer IncidenceAge Standardized Uterine Cancer IncidenceAge Standardized Prostate Cancer Incidence
Physically unhealthy daysPearson Correlation−0.2050.518 *−0.012
p value (2-tailed)0.1040.040.924
% Adult SmokingPearson Correlation0.0430.048−0.055
p value (2-tailed)0.7410.8660.67
% Adult ObesityPearson Correlation−0.0780.313−0.107
p value (2-tailed)0.5420.2380.398
% Binge DrinkingPearson Correlation0.033−0.585 *−0.018
p value (2-tailed)0.7970.0220.89
% UninsuredPearson Correlation−0.008−0.2310.387 **
p value (2-tailed)0.9520.3880.001
* Correlation is significant at the 0.05 level (2-tailed). ** Correlation is significant at the 0.01 level (2-tailed).
Table 5. Multiple linear regression analysis between estrogen disrupting pesticides and estrogen related cancers while adjusting county level confounders for Nebraska counties.
Model% Positive Wells (Square Root Transformation)Potential Cofounders Slope, β (p Values)R2
Breast cancer rates
1 Physically unhealthy days−10.30 (0.20)0.037
Atrazine 0.48 (0.74)
Acetochlor 0.94 (0.76)
2 Physically unhealthy days−8.06 (0.32)0.079
DEA −1.90 (0.16)
DIA 2.10 (0.23)
Acetochlor 1.84 (0.56)
Uterine cancer rates
1 Physically unhealthy days13.31 (0.04)0.67
% Binge drinking −0.53 (0.36)
Atrazine 0.26 (0.70)
Acetochlor 4.62 (0.03)
2 Physically unhealthy days15.46 (0.014)0.75
% Binge drinking−0.31 (0.63)
DEA 0.52 (0.39)
DIA 0.36 (0.58)
Acetochlor 4.01 (0.04)
Prostate cancer rates
1 % uninsured 1.36 (0.12)0.085
Atrazine −1.38 (0.30)
Acetochlor −0.64 (0.81)
2 % uninsured1.52 (0.09)0.10
DEA −1.54 (0.22)
DIA 1.18 (0.46)
Acetochlor −0.65 (0.81)
Publisher’s Note: MDPI stays neutral with regard to jurisdictional claims in published maps and institutional affiliations.

