Article

Adaptive Prediction of Water Droplet Infiltration Effectiveness of Sprinkler Irrigation Using Regularized Sparse Autoencoder–Adaptive Network-Based Fuzzy Inference System (RSAE–ANFIS)

1
School of Mechanical and Electrical Engineering, Guangzhou University, Guangzhou 510006, China
2
Guangdong Engineering Research Centre for High Efficient Utility of Water, Fertilizers and Solar Intelligent Irrigation, Guangzhou University, Guangzhou 510006, China
3
Advanced Institute of Engineering Science for Intelligent Manufacturing, Guangzhou University, Guangzhou 510006, China
*
Author to whom correspondence should be addressed.
Water 2021, 13(6), 791; https://doi.org/10.3390/w13060791
Submission received: 13 January 2021 / Revised: 16 February 2021 / Accepted: 10 March 2021 / Published: 14 March 2021
(This article belongs to the Section Water Use and Scarcity)

Abstract

:
As the high productive efficiency of sprinkler irrigation is largely based on balanced soil moisture distribution, it is essential to study the exact effectiveness of water droplet infiltration, which provides a theoretical basis for rationally scheduling the circulation efficiency of groundwater in agricultural irrigation performance. This research carried out adaptive prediction of the droplet infiltration effectiveness of sprinkler irrigation by using a novel approach of a regularized sparse autoencoder–adaptive network-based fuzzy inference system (RSAE–ANFIS), for the purpose of quantifying actual water droplet infiltration and effectiveness results of precision irrigation in various environmental conditions. The intelligent prediction experiment we implemented could be phased as: the demonstration of governing equations of droplet infiltration for sprinkler irrigation modeling; the measurement and computation of probability densities in water droplet infiltration; innovative establishment and working analysis of RSAE–ANFIS; and the adaptive prediction of infiltration effectiveness indexes, such as average soil moisture depth increment (θ, mm), irrigation infiltration efficiency (ea, %), irrigation turn duration efficiency (et, mm/min), and the uniformity coefficient of soil moisture infiltration (Cu, %), which were implemented to provide a comprehensive illustration for the effective scheduling of sprinkler irrigation. Result comparisons indicated that when jetting pressure (Pw) was 255.2 kPa, the impinge angle (Wa) was 42.5°, the water flow rate (Fa) was 0.67 kg/min, and continuous irrigation time (Tc) was 32.4 min (error tolerance = ±5%, the same as follows), thereby an optimum and stable effectiveness quality of sprinkler irrigation could be achieved, whereas average soil moisture depth increment (θ) was 57.6 mm, irrigation infiltration efficiency (ea) was 62.5%, irrigation turn duration efficiency (et) was 34.5 mm/min, and the uniformity coefficient of soil moisture infiltration (Cu) was 53.6%, accordingly. It could be concluded that the proposed approach of the regularized sparse autoencoder–adaptive network-based fuzzy inference system has outstanding predictive capability and possesses much better working superiority for infiltration effectiveness in accuracy and efficiency; meanwhile, a high agreement between the adaptive predicted and actual measured values of infiltration effectiveness could be obtained. This novel intelligent prediction system has been promoted constructively to improve the quality uniformity of sprinkler irrigation and, consequently, to facilitate the productive management of sprinkler irrigated agriculture.

1. Introduction

It is well known that sprinkler irrigated agriculture uses most of the water resources in the world, and it has already been investigated for several decades due to the remarkable population increment, extreme environmental climate, and excessive water resource demands. Since the high performance of sprinkler irrigated agriculture is largely based upon appropriate droplet infiltration, this makes it important to study the exact effectiveness of water infiltration in the interests of understanding balanced water resource distribution and providing a theoretical basis for rationally scheduling the circulation efficiency of groundwater in precision irrigation. Therefore, the adaptive prediction of droplet infiltration effectiveness is necessary to improve irrigation monitoring and ensure crop growth. Here, sprinkler irrigation can be described as an efficient collaboration and precise application of water spraying in tiny droplets on plants, soil or grass, meeting specific requirements of individual plants or management units, and minimizing the related adverse environmental impacts simultaneously. As a holistic collaborative performance, sprinkler irrigation not only enables the emergence of more flexible crop cultivation systems, but also involves the optimal management of agricultural irrigation systems, so that it has been widely employed to solve the growing problem of water scarcity and the need for more effective irrigation practices. Accordingly, the droplet infiltration effectiveness of sprinkler irrigation could be defined here as the working quality of liquid water slowly passing through the filtering soil medium, for the purpose of evaluating the balanced distributive capability of droplet infiltration in soil fields and facilitating the cultivation equilibrium of plants and crops. Mostly, the quantitative calibration of droplet infiltration effectiveness depends upon the complicated inter-relation mechanism among experimental irrigation conditions, water flow properties, and practical implementations of sprinkler irrigation, etc. Theoretical research and working characteristics discussed on this topic can be found from the literature [1,2]. Unfortunately, the adaptive prediction of infiltration effectiveness has rarely been thoroughly investigated. Prompted by the rapid progress of sprinkler irrigation and flow mechanics, the mechanism complexity and investigation depth of droplet infiltration already have traditional process simulations and pure physical comparisons beyond original knowledge scopes [3]. It is regrettable that most current studies cannot solve the existing problems of infiltration effectiveness prediction accurately.
With respect to droplet infiltration quantification, controlled drainage has already been promoted to boost crop yields and reduce subsurface drainage flows or leaching nutrients in the irrigated farm fields [4]. Since uneven water distribution, the misuse of water, and inefficient watering techniques are some of major causes wreaking devastation on water security, Mostafa et al. managed drip irrigation as an effective tool for increasing crop yield, enlarging water productivity, and saving irrigation water for newly reclaimed areas [5]. Recently, a new promising approach integrating soil moisture content measurements with the Community Land Model (CLM) using sequential data assimilation (DA) has been presented to improve the prediction quality of soil water status and efficiently design irrigation strategies [6]. Although the control model of mobile predictive provides novel analysis tools for droplet infiltration, which calibrates the cooperative performance of precision irrigation [7], more comprehensive evaluation approaches concerning droplet infiltration effectiveness are urgently needed for sprinkler irrigation to promote its working efficiency and prediction reliability.
For the purpose of infiltration effectiveness evaluation, Smith et al. used artificial neural networks to estimate the furrow irrigation duration on clay soils [8]. Oker et al. focused on maize production under mobile drip irrigation, and the monitoring of adaptive irrigation efficiency [9]. Meanwhile, an integrated hydrological irrigation optimization modeling system could be learned from the literature [10]. Salem et al. have employed artificial neural network and regression models to calibrate the complicated impact of climate change on groundwater infiltration and irrigation effectiveness [11]. Thereafter, a novel prediction model has been proposed for supplemental irrigation water rights and climate change adaptation in the literature [12]. In the past several years, it is an obvious tendency that more and more intelligent computation system and fuzzy decision-making approaches have been introduced into this field, for instance, the ant colony algorithm, genetic optimization, the simulated annealing-genetic algorithm, Taguchi estimation, artificial neural network-simulated annealing prediction, and the genetically optimized neural network, etc. They have been applied to reach an inspiring goal of high-efficient scheduling and accurate prediction of precision irrigation performance [10,11,12,13,14]. From the above mentioned publications, it could be learned that all these investigations and endeavors give us reliable knowledge to assess the actual effects of soil-moisture interaction and the distribution properties of infiltration rate. Moreover, their inherent superiorities of quantifying the working efficiency of soil moisture infiltration could also be confirmed. The accurate prediction of water droplet infiltration effectiveness should be the priority of our research efforts.
Here in this research, adaptive prediction of the water droplet infiltration effectiveness of sprinkler irrigation has been investigated to give an effective benchmark of soil moisture evaluation and solve the challenges of the accurate calibration of water droplet infiltration infield. To achieve this goal, this paper presents a set of novel methodologies in the following sections.

2. Calibration of Droplet Infiltration Effectiveness

During the actual process of sprinkler irrigation, the moisture infiltration rate decreases when irrigated soil becomes water-saturated, thus the traditional calibration of irrigation infiltration cannot reveal the complicated correlation between the droplet infiltration mechanism and soil moisture conditions, especially in such domains as moisture distribution and flow filtering. Then, the effectiveness of water droplet infiltration was introduced for the calibration of soil humidity, and it could be determined by a completed setup of a moisture sensor array. Figure 1 demonstrates the water droplet infiltration of sprinkler irrigation and the planar meshed grid zone on the soil field, being used for the moisture gauging and position calibration of droplet infiltration effectiveness. According to this setup arrangement, the coordinate positions of droplet infiltration points, conforming to the normal distribution of N(μ,σ), were presented as:
μ = 1 M k 1 N k x k y k d x k d y k / ( M k × N k )
σ = 1 M k 1 N k ( x k y k μ ) 2 d x k d y k = 1 M k 1 N k x k y k 1 M k 1 N k x k y k d x k d y k M k × N k 2 d x k d y k
where xk and yk are the horizontal and vertical coordinates of specific positions on the ground where water droplet infiltration happens, being denoted as the (xk,yk)th meshed grid zone. Mk and Nk denote the number of meshed grids in length and width directions, presupposed as 200 and 400, respectively: 1 ≤ xkMk, and 1 ≤ ykNk. N(μ,σ) denotes the normal coordinate distribution of droplet infiltration positions, while μ is the mean value of the infiltration position coordinate, and σ stands for its corresponding distribution variance. The probability density of water droplet infiltration at the investigated area can be defined as:
I d x k , y k ; μ , σ 2 = 1 σ 2 π exp 1 2 1 M k 1 N k x k μ y k μ d x k d y k σ 2
In order to calibrate the working performance of sprinkler irrigation, the following infiltration effectiveness indexes have been proposed accordingly. Here, the average soil moisture depth increment (θ, mm) due to sprinkler irrigation or net infiltrated moisture depth is calculated as:
θ = θendθantecedent,
where θantecedent and θend denote average antecedent and achieved soil moisture depths (mm), respectively, which propose an accurate calibration of the infiltration rate from the novel perspective of spatial moisture distribution. Although soil moisture depth is frequently acknowledged as an important contributing factor to infiltration effectiveness, the complex link between deep water drainage and soil infiltration efficiency has not been fully recognized. More particularly, they do not indicate the key role of irrigation infiltration in controlling the working efficiency of water drainage. In order to solve this problem, irrigation infiltration efficiency (ea) is proposed to evaluate the working efficiency of soil moisture infiltration into the soil field. This mathematical parameter is defined as the ratio of the net moisture infiltrated depth to the cumulative volume of water consumption, including the parametric variables of cumulative irrigation flow depth (Cf, mm) and cumulative evaporated water flow depth (Ev, mm), in total:
ea = [θ/(Cf + Ev)] × 100%,
where Ev denotes the cumulative water flow depth evaporated at the end of irrigation turn (mm), and θ denotes the average soil moisture depth increment being determined by Equation (4). Based on these preparations, the index of irrigation infiltration efficiency (ea) could be determined by measuring the moisture infiltration depth, the cumulative irrigation flow depth, and the consumed volume of sprinkler irrigation water added to the infield zone. The ratio between them could be defined as the % of irrigation infiltration efficiency during the sprinkler irrigation process.
Meanwhile, the concept of irrigation turn duration efficiency, or the ratio of net infiltrated moisture depth per unit of irrigation time (et, mm/min), can be obtained as:
et = θ/t,
where θ is the average soil moisture depth increment (mm) and t is the irrigation turn duration time (min). Water infiltration uniformity refers to the appropriate spatial distribution of infiltrated moisture, and the uniformity coefficient of soil moisture infiltration (Cu, %) could be proposed here and calculated as:
C u = 1 1 M k 1 N k θ x k , y k θ ¯ e n d d x k d y k M k N k θ ¯ e n d × 100 % ,
θ ¯ e n d = 1 M k 1 N k θ x k , y k d x k d y k / M k N k
where θxk,yk(%) stands for the soil moisture mass proportion at one infiltration measurement grid zone coordinated by (xk,yk), and θ ¯ e n d stands for the average value of soil-moisture mass proportion concerning all infiltration measurement grid zones (%), so that Cu provides a useful tool to evaluate the uniformity state of soil moisture infiltration from novel perspectives. Since the ideal situation regarding infiltration uniformity occurs when all field plants receive the same amount of sprinkling water, we could determine the necessary water supply that produces optimal uniformity coefficients with high computation efficiency. The uniformity coefficient of soil moisture infiltration (Cu, %) is typically expressed in terms of the mathematical difference between the measured and averaged soil moisture mass proportion, and then divided by the area of the objective meshed grid zone, which accurately illustrates the spatial distribution of sprinkler irrigation water infield.
As all these parametric indexes demonstrate the inherent characteristics of soil moisture infiltration from a series of novel effectiveness perspectives of sprinkler irrigation infiltration, they could be applied effectively in the following adaptive prediction of droplet infiltration effectiveness.

3. Experimental Environment of Sprinkler Irrigation

This sprinkler irrigation experiment was carried out at the irrigation field of Guangzhou University (23°03′1.23″ N, 113°24′3.92″ E) with an area of 20 ha, from 5 September 2019 to 4 September in 2020 and from 8:00 to 18:00 every day. Figure 2 gives the exact location of the experimental field where this irrigation experiment was conducted. The soil of the experimental site has a pH value range of 6.62–6.78. Since the electrical conductivity of soil (ECe) provides a standard benchmark to evaluate soil salinity, it could be measured by using a mobile SUP-TDS210-B electromagnetic induction type soil electrical conductivity meter, which is manufactured by Supmea Automation Co., LTD (Hangzhou City, Zhejiang Province, China). In this research, we analyze 20 soil samples collected from 20 reclaimed grid positions, thus the measurement of ECe can be realized as 0.14–0.18 dS/m for experimental soil fields of different textures and salinity levels, which enhances the interpretation of soil electrical conductivity maps and improves the scheduling of site-specific sprinkler irrigation. Next, the average volumetric soil moisture content at field capacity is 40%, and the wilting point of the root zone is 30%. Here, the organic content of the soil field is 22.60 g/kg, the nitrogen content is 1.68 mg/kg, the field capacity is 26.3%, and its mean bulk density varies from 1.35 g/cm3 to 1.55 g/cm3. Guangzhou has a subtropical climate where drought is rarely seen, with a mean annual temperature of 21.5–22.6 °C, precipitation of 1623.6–1899.8 mm, and evapotranspiration of 1603.5 mm, according to the past 60 years of weather records referenced from a local meteorological agency. After detailed considerations and plant comparisons, Zoysia matrella was selected as the experimented plant for sprinkler irrigation, attributed to its robust climate and environmental adaptation capability, making it ideal for irrigation infiltration prediction and growth control in our soil field.

4. Regularized Sparse Autoencoder–Adaptive Network-Based Fuzzy Inference System

4.1. Working Mechanism of Regularized Sparse Autoencoder (RSAE)

RSAE (Regularized Sparse Autoencoder) is an excellent autoencoder that can be used for calculating the probability density from a set of measured raw data of droplet infiltration rates. It is highly valued by incorporating feature extraction and process quantification into a general-purpose fuzzy prediction system [13,14]. According to this approach, the probability density of water droplet infiltration at the objective meshed grid zone is denoted as unlabeled data I d x k , y k ; μ , σ 2 x k = 1 , y k = 1 M k , N k . The RSAE decoder uses the mapping function f to calculate the mathematical features of probability density, as denoted by H R S A E M k , N k , from Id[(xk,yk);μ,σ2] [15,16].
H R S A E M k , N k = f ( I d ( x k , y k ) ; μ , σ 2 ) = σ r ( W R S A E I d ( x k , y k ) ; μ , σ 2 )
where WRSAE denotes the weight matrix of the regularized sparse autoencoder and σr(z) is a rectified linear unit employed as the activation function in the RSAE decoder. Since it allows for more efficient training of network prediction than any other traditional function does, σr(z) encourages sparse activation and be described as:
σ r ( z ) = 0 , i f : z 0 z , i f : z > 0
Then, the RSAE decoder reconstructs I d ( x k , y k ) ; μ , σ 2 by a mapping function gRSAE:
I d ( x k , y k ) ; μ , σ 2 = g R S A E ( H R S A E M k , N k ) = W R S A E 2 H R S A E M k , N k
To learn various features from the measured probability density data of droplet infiltration, the cost function of RSAE is presented by Equation (12).
min W 1 2 M k N k 1 M k 1 N k I d ( x k , y k ) I d ( x k , y k ) 2 d x k d y k + λ x k y k 1 M k 1 N k H R S A E M k N k d x k d y k s . t . W R S A E 1 W R S A E 2 = E
where WRSAE1 and WRSAE2 denote the weight matrix of the regularized sparse autoencoder, ensuring its computational performance is kept in a highly efficient state by using the cost function of RSAE. λxkyk stands for the regular coefficient of RSAE, corresponding to the grid zone coordinated by (xk,yk). Here, WRSAE1 and WRSAE2 are replaced by W and WT, then the optimization problem of the RSAE network minimizes the following cost function:
J R S A E = 1 2 M k N k 1 M k 1 N k W T σ r ( W × I d ( x k , y k ) ) I d ( x k , y k ) 2 d x k d y k + λ x k , y k 1 M k 1 N k σ r ( W × I d ( x k , y k ) ) d x k d y k
Thereafter, we calculate the gradient of JRSAE with respect to W:
J = J R S A E W = 1 M k N k W D + λ x k , y k sgn σ r W x k , y k x k , y k T + 1 M k N k σ r W x k , y k × D T
Here, D = WTσr(W∙(xk,yk)) − (xk,yk), sgn denotes the result of the sign function of σr(W∙(xk,yk)), σr’ denotes the derivative function of rectified linear unit σr, and (xk,yk) stands for the matrix form of (xk) and (yk), so that the reiterative update process of W(i+1,j+1) for RSAE can be described as:
W ( i + 1 , j + 1 ) = W ( i , j ) η ( i , j ) H ( i , j ) J ( i , j )
where i and j are the ith and jth intervals of the update process of WRSAE1 and WRSAE2, respectively, H(i,j) denotes the inverse of the Hessian matrix [17,18], and η denotes the step size of the update process accordingly. In this equation, η(i+1,j+1) can be determined iteratively by:
η ( i + 1 , j + 1 ) = arg min η ( i , j ) > 0   J ( W ( i , j ) η ( i , j ) H ( i , j ) J ( i , j ) )
The weight matrix WRSAE could be regularized by an orthonormality constraint. RSAE is trained an adequate number of times so that the probability density of water droplet infiltration can be accurately calculated and inputted into the Adaptive Neuro Fuzzy Inference System (ANFIS) for the highly efficient prediction of infiltration effectiveness, which provides high-performance adaptive prediction that incorporates neural networks with fuzzy logic principles, making ANFIS a universal and reliable prediction network for sprinkler irrigation effectiveness [19,20].

4.2. Working Mechanism of ANFIS (Adaptive Network-Based Fuzzy Inference System) Integrated with RSAE

After the logic network of RSAE has been established, an intelligent prediction system based on the working principle of the adaptive network-based fuzzy inference system (ANFIS) was developed to predict such droplet infiltration effectiveness indexes as average soil moisture depth increment (θ, mm), irrigation infiltration efficiency (ea, %), irrigation turn duration efficiency (et, mm/min), and the uniformity coefficient of soil moisture infiltration (Cu, %). Here, RSAE identifies the mathematical properties of the probability density of droplet infiltration and ANFIS possesses an excellent capability of adaptive prediction for infiltration effectiveness, which are characterized by their mutual influences and fuzzy correlations [21,22,23]. As Figure 3 and Figure 4 demonstrate the logic diagram of RSAE–ANFIS, this intelligent prediction system could be divided into an RSAE monitoring level and an ANFIS prediction level. The RSAE monitoring level includes the gauging system that quantifies the measured probability density of droplet infiltration. On this level, all data resources of irrigation infiltration connect to the high-performance computation units, such as the data-processing units of monitoring, analyzing, transmitting, and decision making, which are located on the ANFIS adaptive prediction level. By linking the RSAE monitoring level and the ANFIS prediction level together through a set of information transmitting and processing modules taking charge of cognitive calculation, parametric monitoring and operative collaboration, a highly-efficient adaptive prediction system for droplet infiltration effectiveness can be established.
In this research, a sensor array was used for water infiltration measurement. It stably indicates the true moisture content of the soil field with high accuracy and reliable performance. This experimental calculation has been implemented on the computation platform of irrigation effectiveness prediction in the Guangzhou University intelligent irrigation lab. The computation platform we used for RSAE–ANFIS prediction was equipped with an Intel core i9 7900X microprocessor, 32GB of RAM (Random Access Memory), MATLAB R2018b, and Windows 10. Taking a typical case of adaptive prediction, for example, RSAE collects the input data of water droplet infiltration. Herein, the droplet infiltration rates and soil humidity signals are measured from the array of moisture sensors (9 × 9 in each grid zone illustrated by Figure 1), embedded in different soil depths (0–500 cm) and connected with the informative data processing center of the sprinkler irrigation system. Meanwhile, a convective lognormal transfer function was employed to picture the infiltration-stress curves from the measured soil moisture data. Then, RSAE calculates the probability density of droplet infiltration at the targeted grid zone, and operates as a reliable cognitive process classifier to recognize the mathematical characteristics of probability density from various kinds of mass infiltration data [24,25]. After all these computation tasks are completed, ANFIS sends back amend actions/decision signals to the RSAE monitoring level through data representation of effectiveness prediction results. Thereafter, an effective calculation mechanism called adaptive prediction was applied, in which this mechanism architecture compares the calculated and actual measured results of infiltration effectiveness indexes and publishes adaptive instructions to amend the initial predicted value to a more accurate one. Based on this arrangement, the RSAE–ANFIS computation platform accepts the probability density, processes the data signals, and selects appropriate calculation steps to predict infiltration effectiveness indexes (θ, ea, et, and Cu). The obtained effectiveness results could be classified into two groups: actual measured results characterized by stochasticity and nonlinearity, and the calculated results characterized by uniformity and equilibrium [26]. Major differences between them comprise deviation corrections; therefore, a set of specific emendation instructions was presented and operated by sequence. It could be seen that the probability density of water droplet infiltration calculated by RSAE helps ANFIS to obtain higher and stabler computation accuracy for predicting irrigation infiltration effectiveness. Therefore, the high precision and strong robustness of adaptive effectiveness prediction can be ensured.

5. Adaptive Prediction of Water Droplet Infiltration Effectiveness

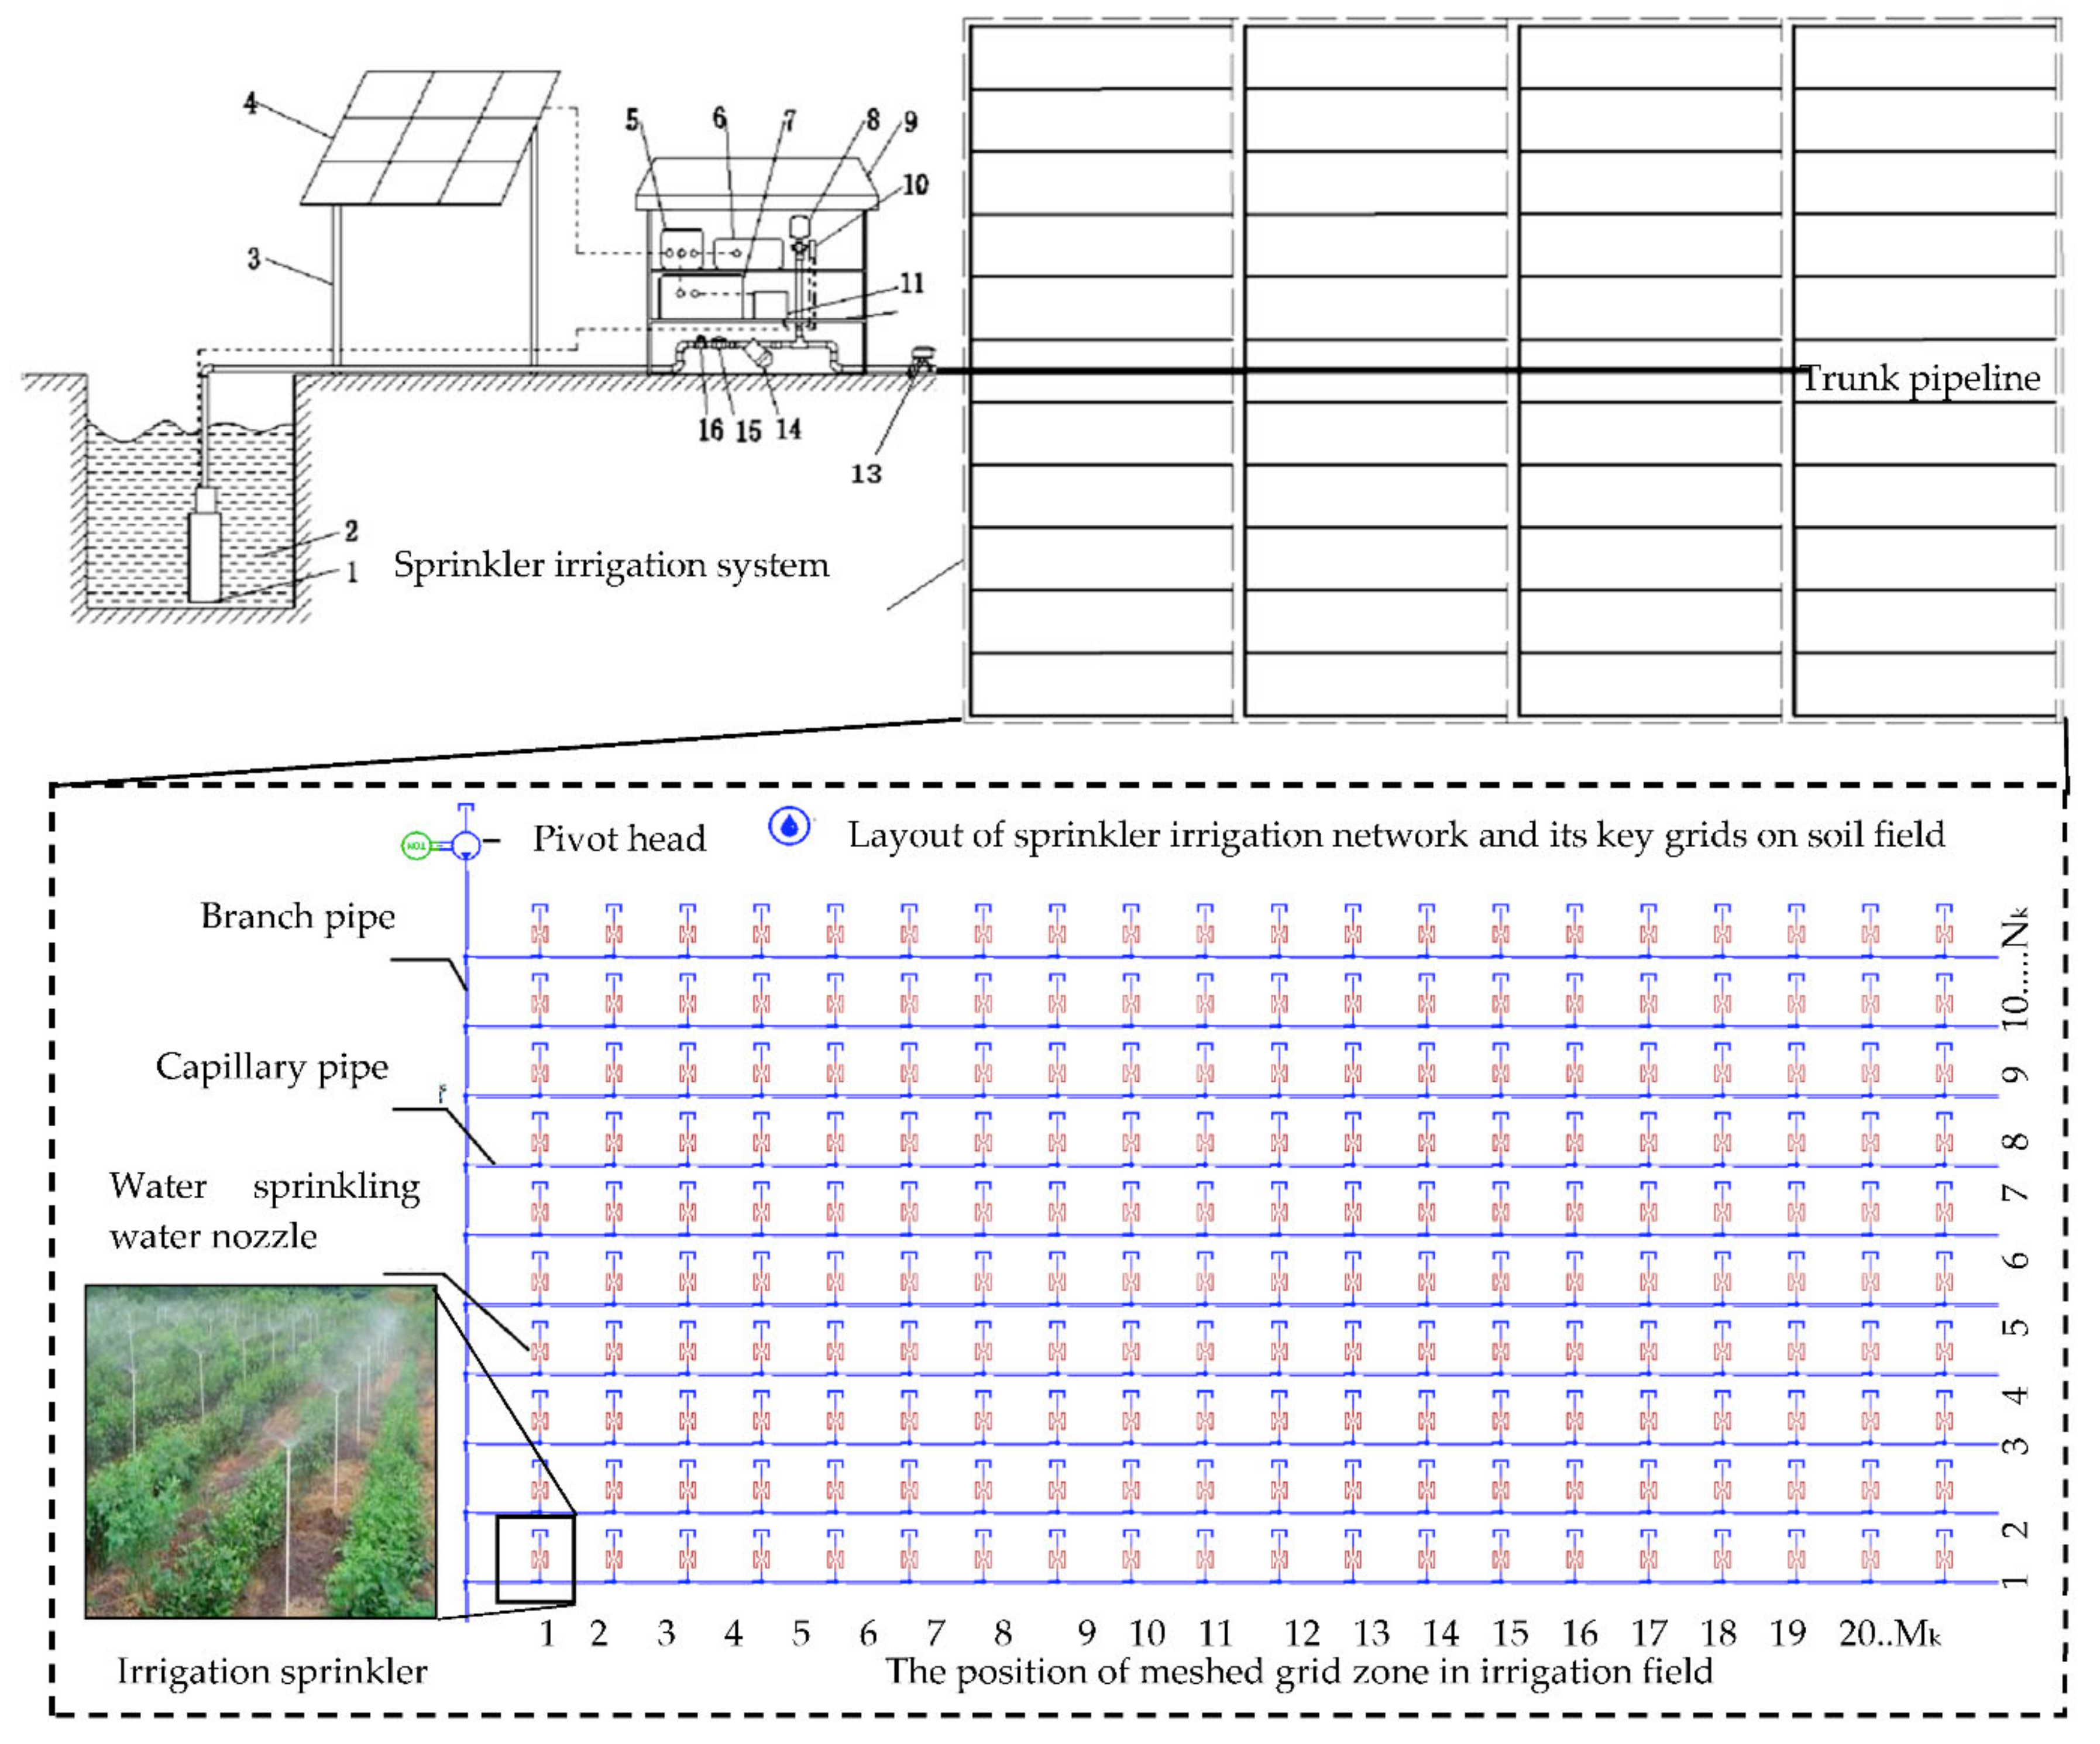
5.1. Sprinkler Irrigation System

In order to realize the adaptive prediction of infiltration effectiveness, it is necessary to build up an applicable sprinkler irrigation system at first. Figure 5 illustrates the tested irrigation system and the spatial layout of the pipeline network. Herein, the sprinkler irrigation system integrates a completed set of mechanical components together, such as the high-performance 350HW-8S fluid-intensifier pumps manufactured by Yancheng Harriston Int’l Co., Ltd. (Yancheng city, Jiangsu Province, China), the revolving HX-3301-1 sprinkler nozzles provided by Taizhou Hengxin Valve Tech. (Taizhou city, Jiangsu Province, China), the NPS2 CLASS150 pressure valves manufactured by Sichuan Saier Valve Mfg. Co., Ltd. (Zigong city, Sichuan Province, China), the irrigation PVC pressure pipes manufactured by Jiangsu Haiwei Plastics Industry Technology Co., Ltd.(Jiangyin city, Jiangsu Province, China), and the BONAD RS485 soil moisture sensors (BND-MS10) manufactured by Shenzhen Bonad Precision Instrument Co., Ltd. (Shenzhen city, Guangdong Province, China), etc. In our irrigation pipeline network, the experimented soil field was equally partitioned into different meshed grids conforming to Figure 1, where each grid zone used for sprinkler irrigation could be positioned by (xk,yk) or being denoted as the (xk,yk)th meshed grid zone (1≤ xkMk, and 1 ≤ ykNk). Since in each grid the volume of surface water was different, according to the measured soil moisture data from the (xk,yk)th grid, the sprinkler irrigation system controls the water supply to a specific grid zone through adjusting the set of water distribution valve modules. Consequently, irrigation water was pressurized into the fluid intensifier pump and stabilized by the flow accumulator, and then appropriate water droplet concentration on every grid zone could be maintained constantly. A moderate flow pressure of 320 kPa was applied in this research to ensure that the infiltrated soil depths could be measured easily. A relatively high nozzle ratio of 6.5:1 (nozzle tube length: nozzle orifice diameter) allows for the effective isolation of stream disturbance from sprinkling water flow. In this case, a pair of sprinkler irrigation heads (the revolving sprinkler nozzles) with a vertical height of 80 mm were placed at a linear interval of 2.5 m to provide an equally distributed soil wetting pattern and guarantee a wetting-diameter overlap of 55–60% all the time. During this experimental irrigation process, the soil moisture content or droplet infiltration rate was checked once every 10 min. To ensure the high repeatability of testing conditions, Table 1 demonstrates the representative environmental conditions, including jetting pressure in the nozzle tube (P, kPa), irrigation time (IT, h), spray discharge amount (Q, L/h), average air temperature (T, °C), average air relative humidity (RH, %), solar radiation (SR), average wind speed (U, m/s), evaporation (E), and wind direction (WD).
In Figure 6, for the accurate prediction of infiltration rates, clods of soil crust with a thickness of 10 cm on different soil depth layers (vertical depth ranged from 0 to −500 cm) were sampled out and observed closely after each irrigation test was completed. The average distribution of water precipitation was measured at a rectangular area of 15 × 15 m2 in calm conditions. Such environmental parameters as average air temperature (T, °C), average air relative humidity (RH, %), and solar radiation (SR) were collected every 10 min. Here, local air temperature was measured by an HW-F7 thermometer (LD Products Inc. California, USA), air relative humidity was determined by using Testo 610 hygrometers (Testo Pty Ltd, Croydon South, Australia), and solar radiation value could be obtained from an LI-1500 irradiance radiometer (HUATEC. Beijing, China). Since wind speed (U, m/s) has a decisive influence on the evaporation loss of soil moisture, it was measured by RK100-02 RS485 wind speed measurement units (RIKA Sensor Inc., Hunan, China). On the other side, the soil moisture evaporation measurements (E, mm) were carried out by 40 sets of newly developed microlysimeter, which equally distributed throughout the whole field area. All these parametric variables were measured at row and inter-row irrigation positions, and then they were averaged across all measurement positions to provide accurate values.
The probability density of droplet infiltration at each grid zone could be computed by RSAE, whereas spline interpolation was used to calculate the infiltration rates at any coordinate position that could not be measured or observed directly. Thereafter, the standard deviations and mean values of the probability density were acquired by sequence [27,28]. According to the infiltration gradient maps highlighted by tests 1–5, Figure 6 pictures the obtained droplet infiltration distribution and its partitioned levels denoted from I to X, based on the measured soil moisture content. For instance, Level I denotes a soil moisture saturability of 0–10%, Level II denotes 10–20% … and Level X denotes 90–100%, etc. Here, specific gradient values of droplet infiltration per cubic space were demonstrated by the scale column on the left, and their scale unit was mm/1000 mm3. The photos in the right column denote the actually obtained images of soil ground in different infiltration rates leveled from I to X, describing the on-the-spot variation of droplet infiltration effectiveness.

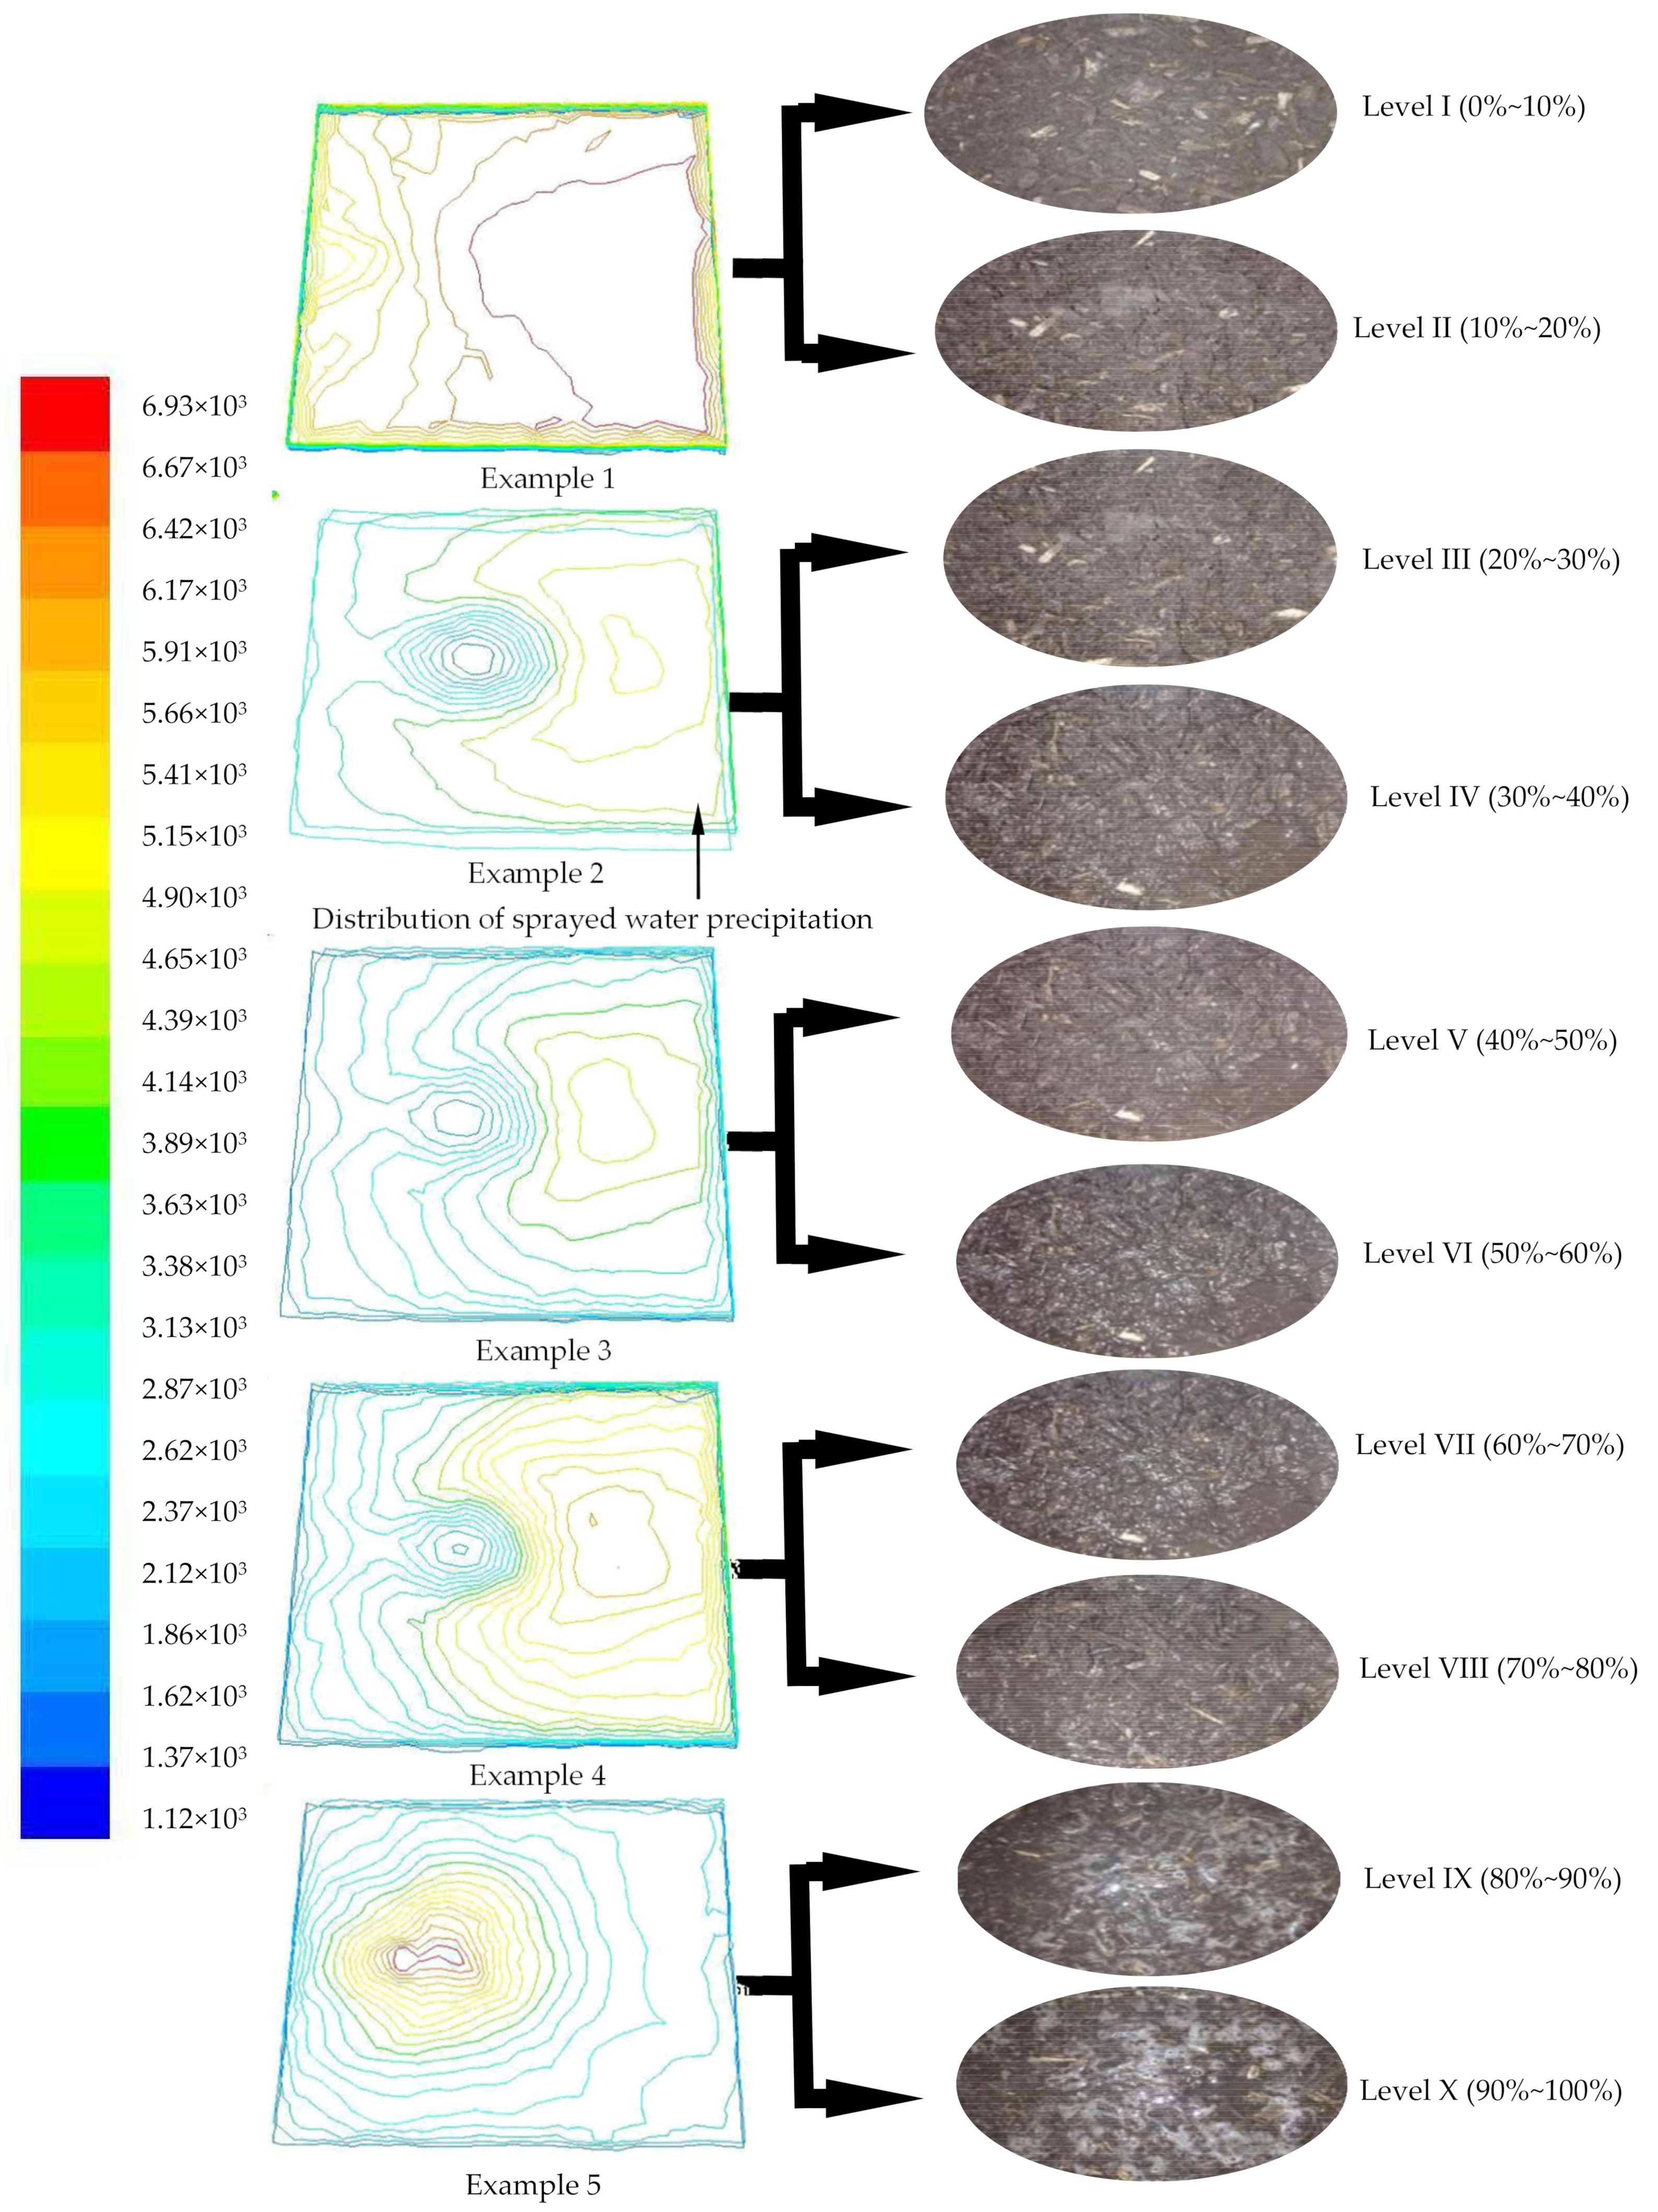
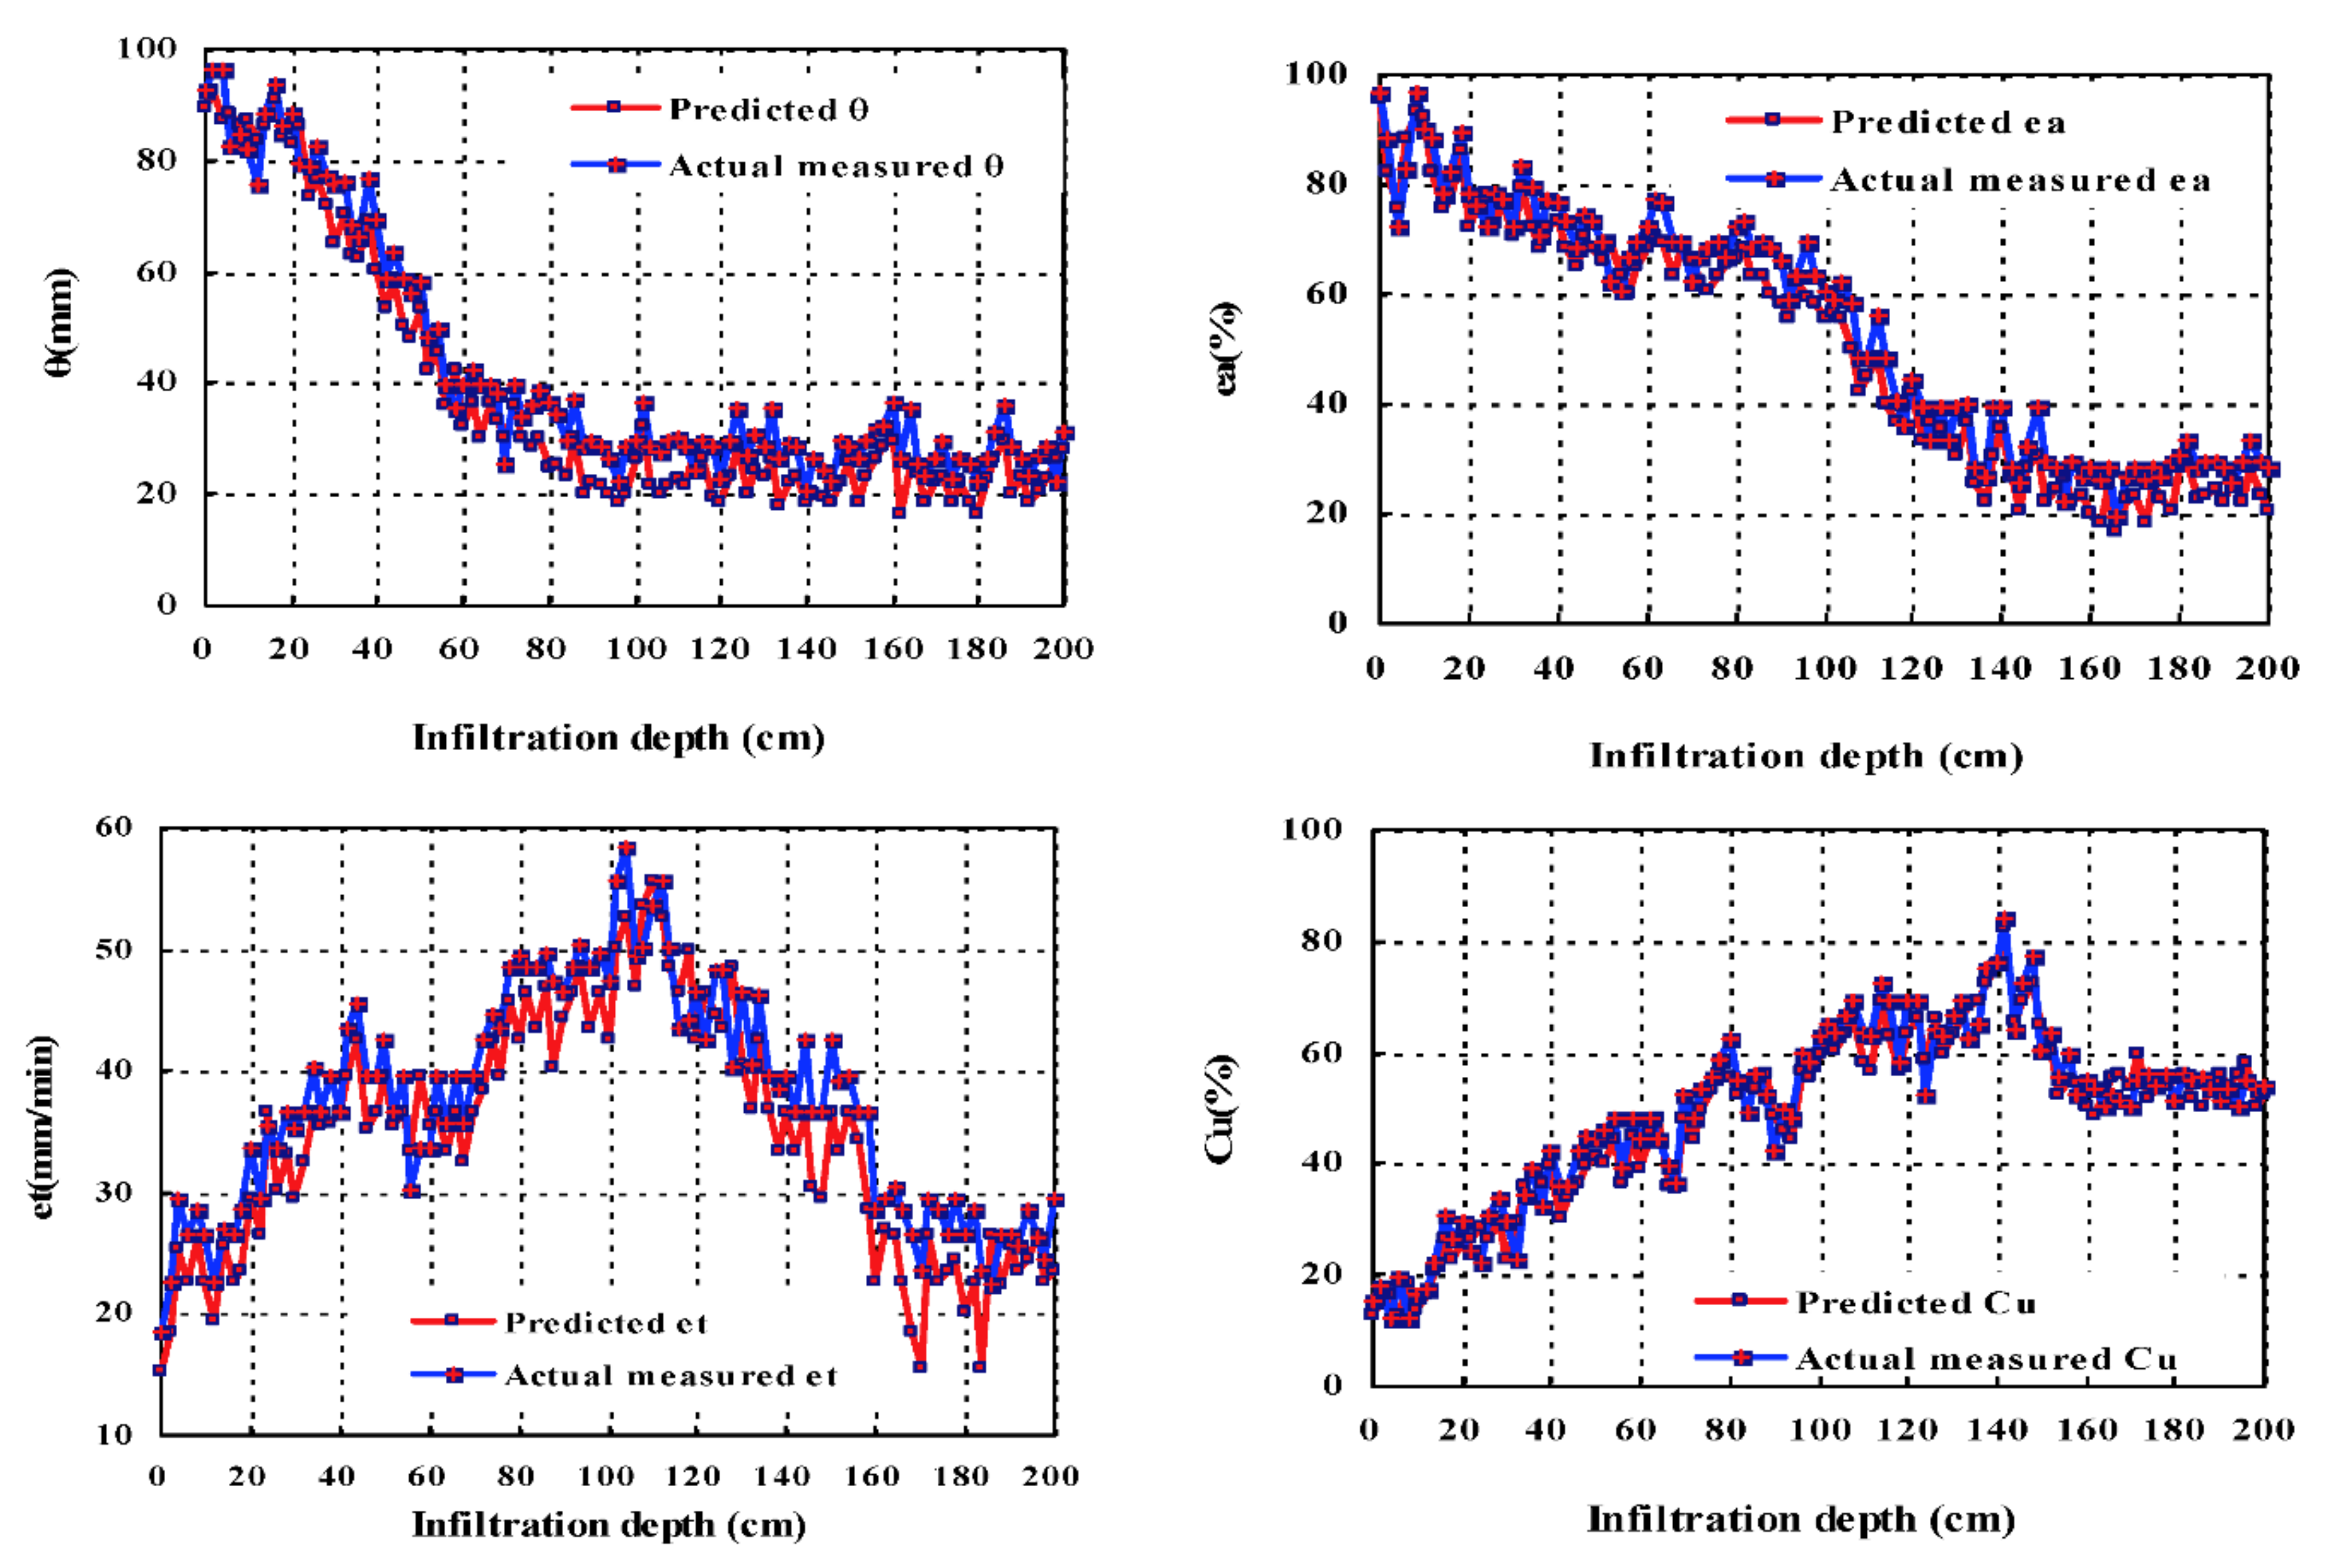
5.2. Adaptive Prediction of Droplet Infiltration Effectiveness

To control the efficiency of sprinkler irrigation, a set of input variables for RSAE–ANFIS prediction was selected, including jetting pressure (Pw/kPa), impinge angle (Wa/°), flow rate of water (Fa/kg/min), and continuous irrigation time (Tc/min). Accordingly, average soil moisture depth increment (θ/mm), irrigation infiltration efficiency (ea/%), irrigation turn duration efficiency (et/mm/min), and the uniformity coefficient of soil moisture infiltration (Cu/%) were applied to profile moisture infiltration [29,30]. Based on the measured coordinates of droplets, the infiltration effectiveness indexes of every grid zone were transmitted to the database and application server of the RSAE–ANFIS network. If mathematical deviations and computational errors emerge, the novel algorithm of adaptive prediction is able to provide corrective feedback guidance to solve them. For the convenience of fuzzy prediction, the input and output variables should be regulated to an identical data range. Table 2 demonstrates the partitioned levels of irrigation parameters and infiltration effectiveness indexes, being used as input and output variables in the RSAE–ANFIS system. The combination of input (Pw, Wa, Fa, Tc) and output (θ, ea, et, Cu) illustrates a set of fuzzy correlations described by logic rules. To predict infiltration effectiveness, 25% of experimental cases (50 turns) were used for network training and others for network testing. Each case was tested for 10 trials to reduce signal disturbances and random errors, by which the resultant effectiveness indexes were averaged by these trials. Table 3 shows the logic rules of the RSAE–ANFIS system. The irrigation parameters are the input levels, and the partitioned levels of effectiveness indexes are the output levels. In this table, the logic rule base was selected via fuzzy reasoning algorithms. As their partitioned levels were referenced from Table 2, original parametric assessment and effectiveness prediction could be simplified to a quantified profile of logic level reasoning. For the purpose of enhancing the applicability and precision of ANFIS computation, the inherent properties of fuzzy logic rules by setting IF-THEN rules were inherited in prediction modules. Take No. 5 cases for instance, IF the experimental run of the input partitioned level of Pw is 2, Wa is 3, Fa is 5, and Tc is 2, THEN the experimental run of the output partitioned level of θ is 10, ea is 1, et is 2, and Cu is 1, accordingly, through a set of logic reasoning and statistical computing. Based on these logic rules and input/output levels, the infiltration effectiveness indexes in different cases could be determined, confirming the reliability and usefulness of RSAE–ANFIS prediction. Considering the current capability of our computation platform, Figure 7 presents the profile comparisons between the predicted and actual measured effectiveness indexes at different soil depths, and Table 4 gives the data comparison. Tests A–K have been implemented sequentially on specific monitoring grid zones described by Figure 1; thereafter, the infiltration effectiveness indexes were measured at different soil depths, denoted by Layer 1: 0–100 cm; Layer 2: 100–200 cm; Layer 3: 200–300 cm; Layer 4: 300–400 cm; and Layer 5: 400–500 cm. When the predicted and measured results (θ, ea, et, Cu) were profiled, the relative errors (RE) between them could be determined to quantify the accuracy and reliability of predicted effectiveness: RE = ((Predicted index − Measured index)/Measured index) × 100%. It was learned from Table 4 that RE kept in a relatively small range of 1.8–7.8%, confirming the high precision of the intelligent prediction system.

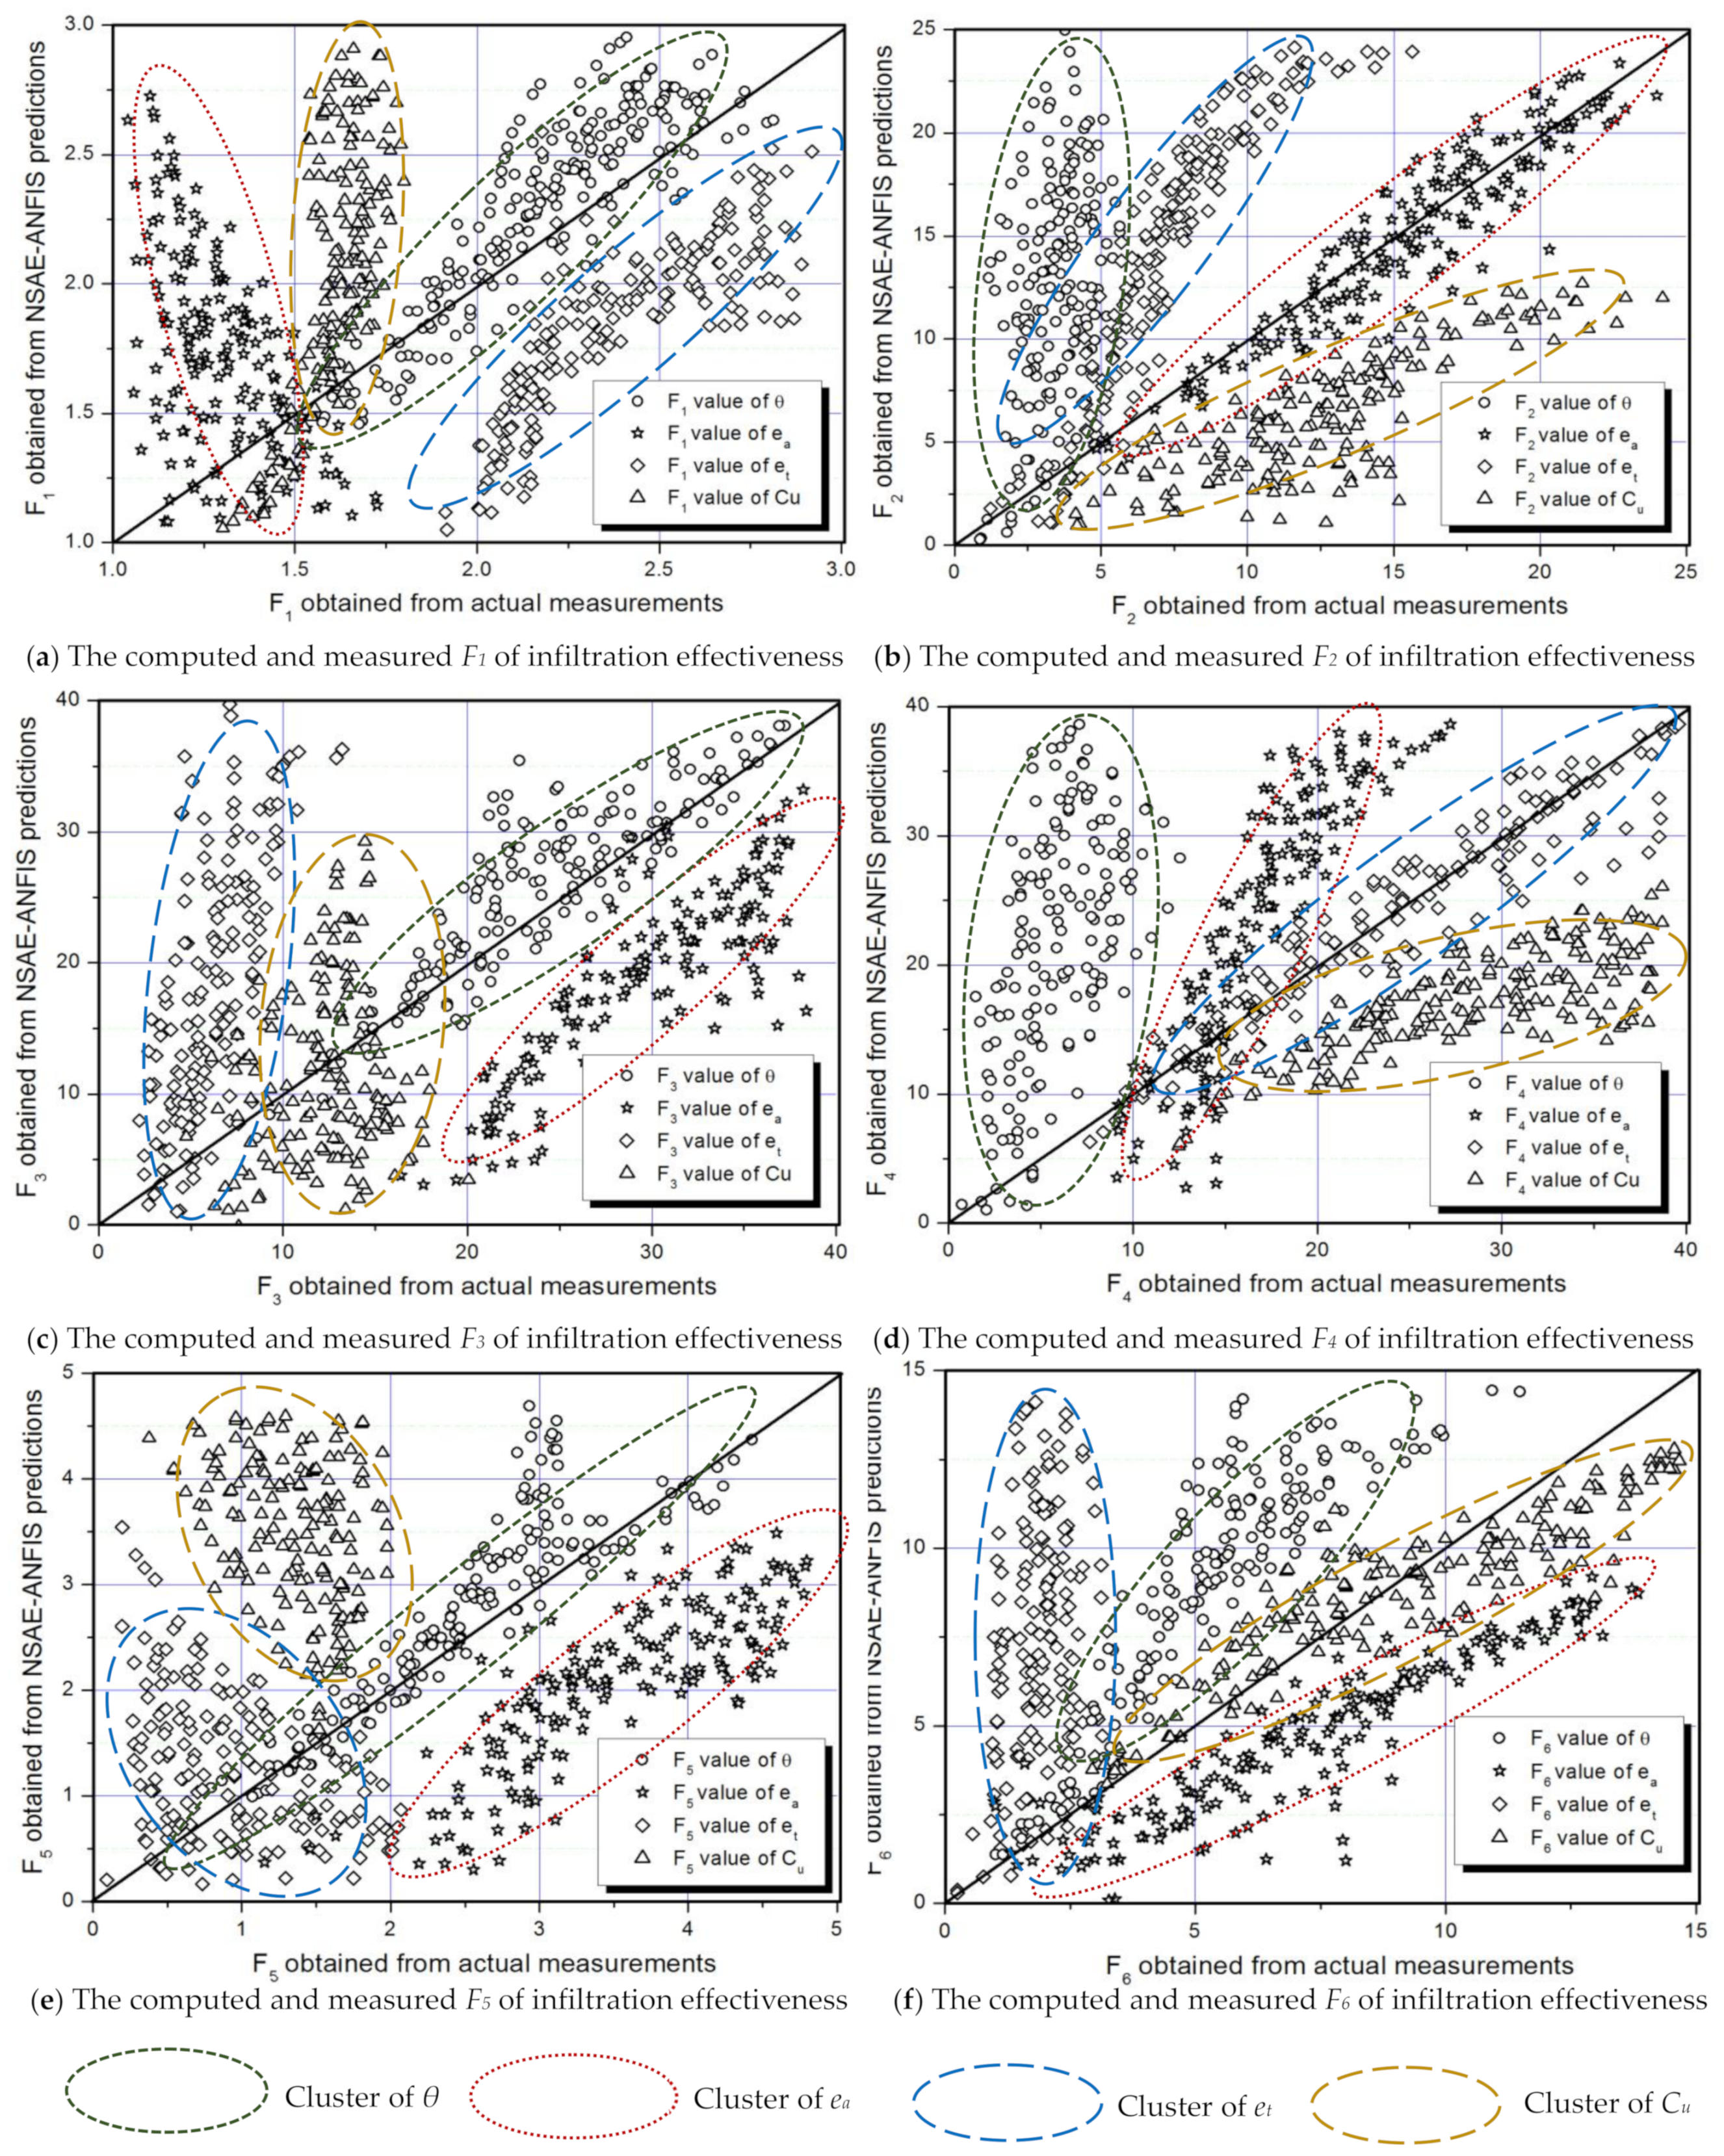
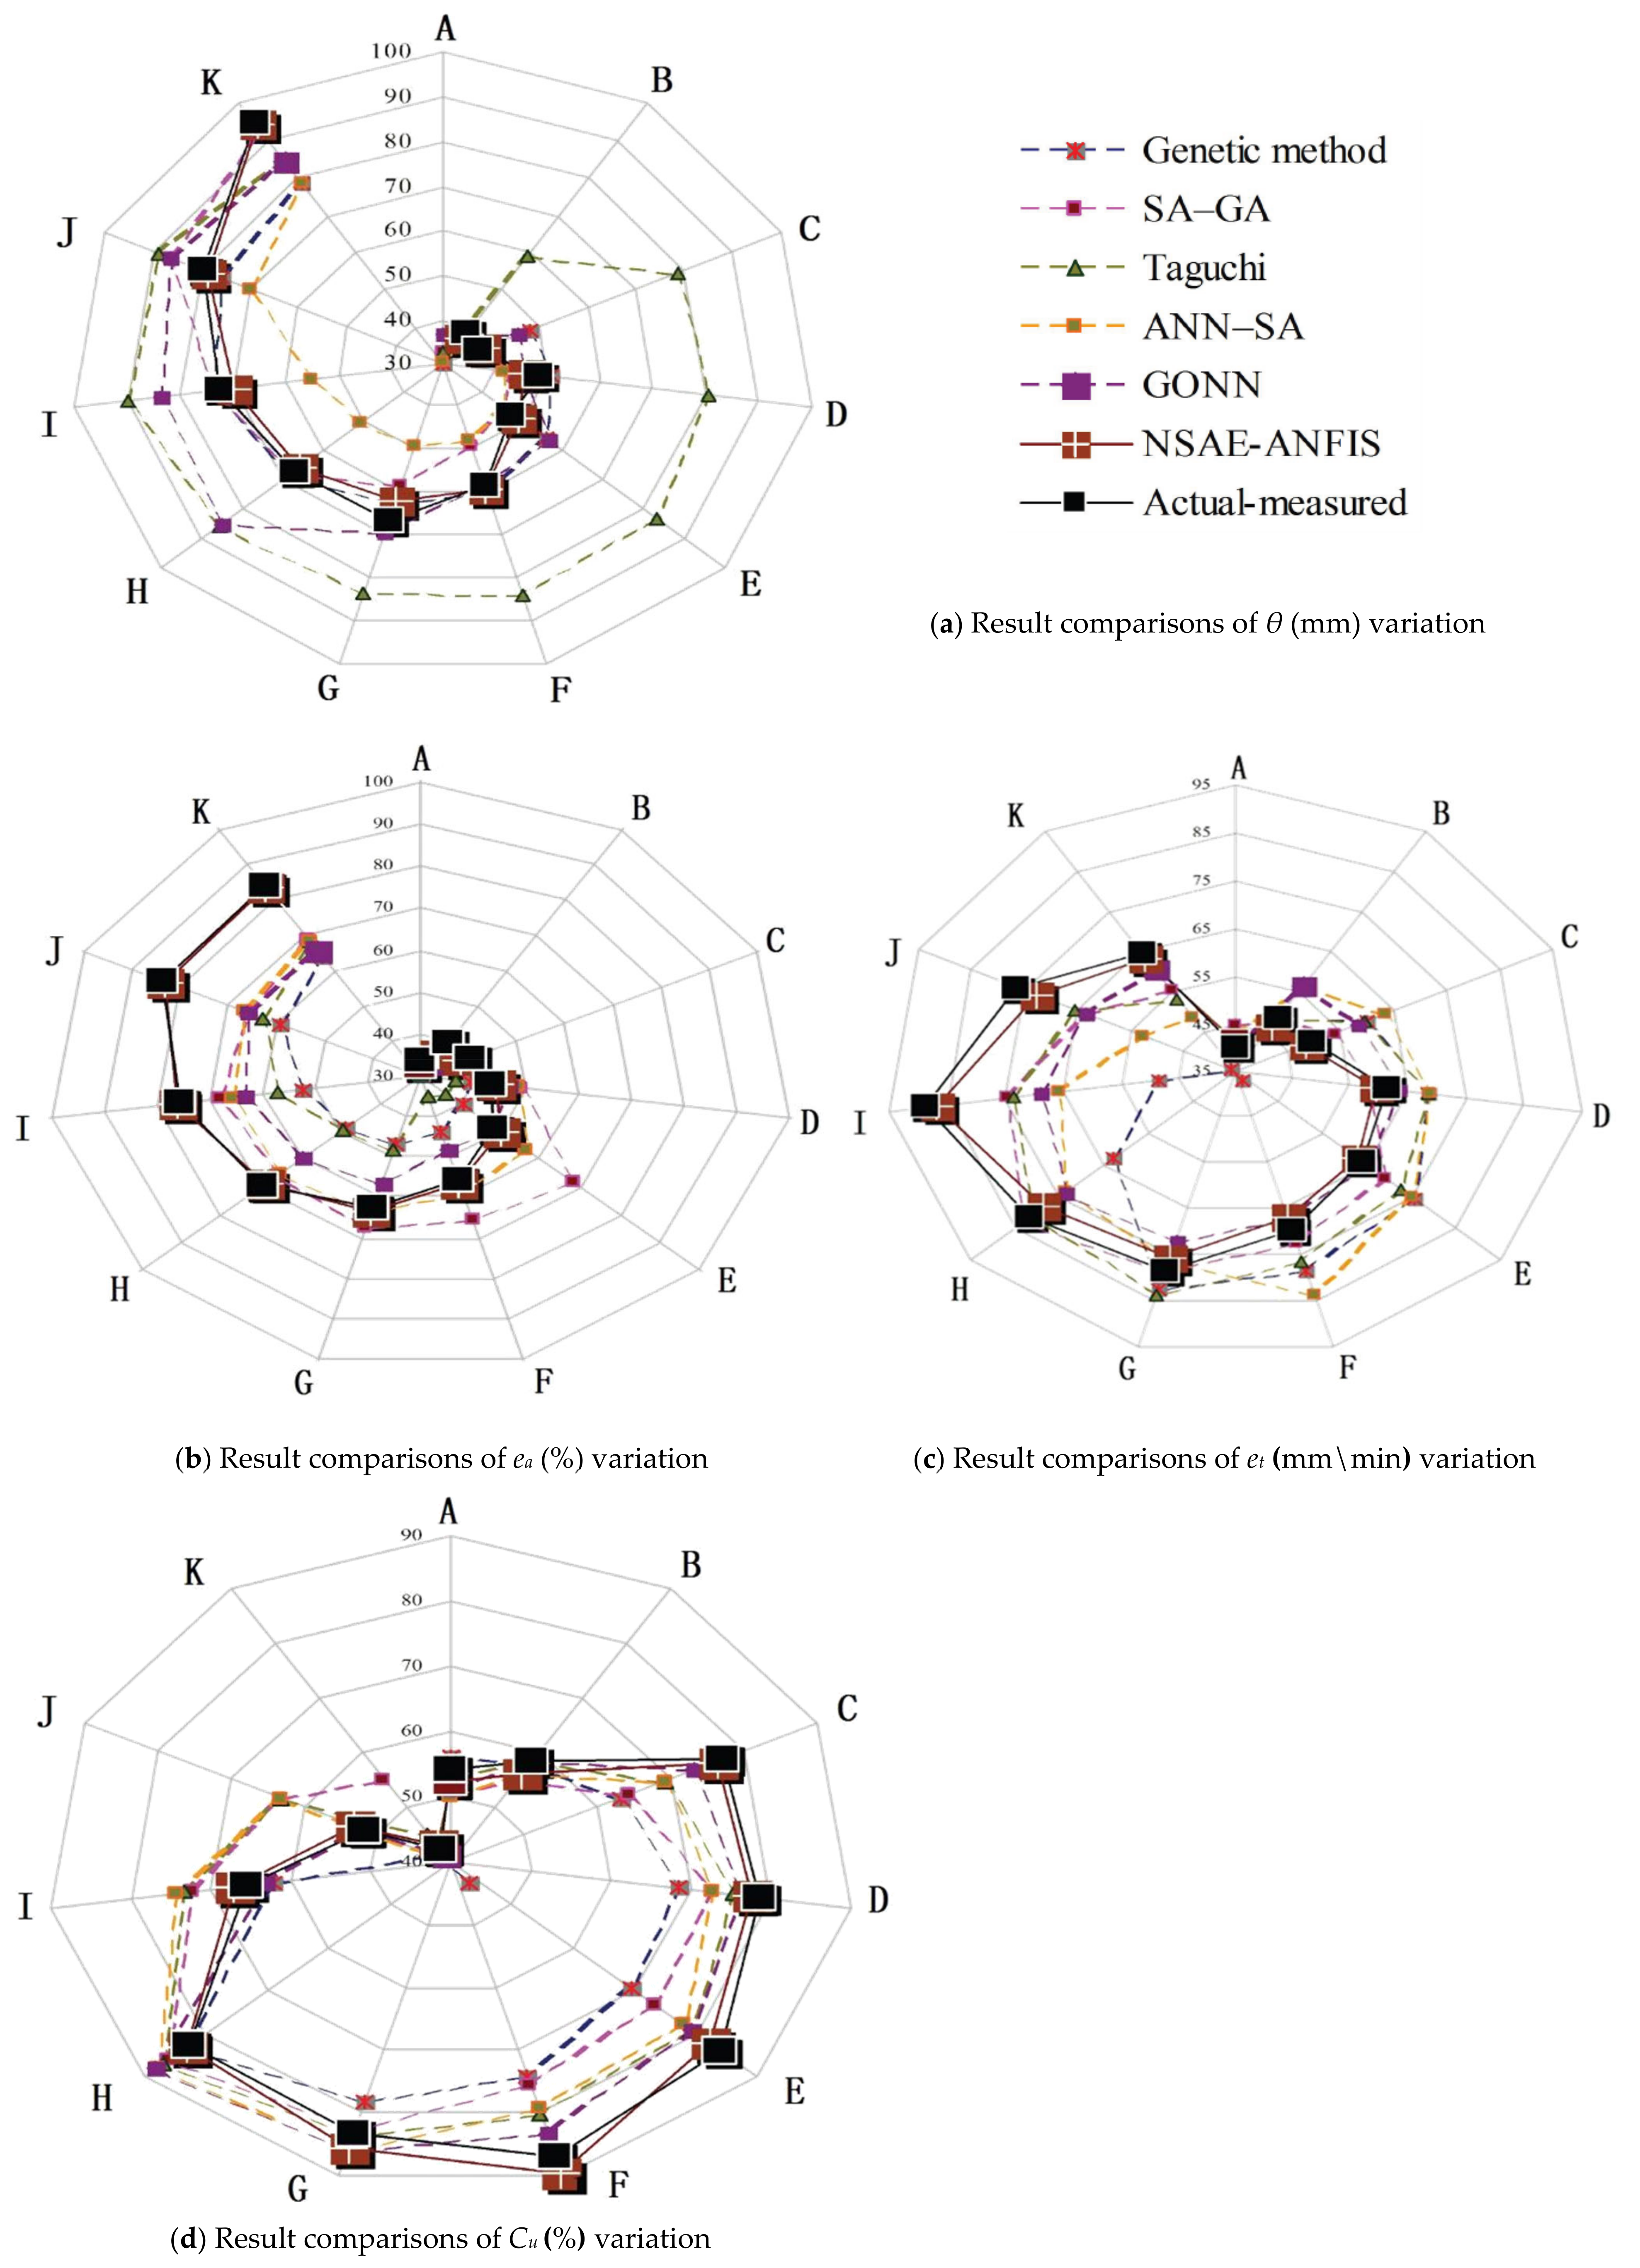
6. Assessments of Adaptive Prediction Quality

The following evaluation indexes were designed or introduced specifically to assess the prediction qualities of infiltration effectiveness [31,32]:
Recursive complexity index:
F 1 = 1 M k N k 1 M k 1 N k G ( x k , y k ) [ n ] 2 d x k d y k / 1 M k N k 1 M k 1 N k G ( x k , y k ) [ n ] d x k d y k
Functional inclusion index:
F 2 = max G ( x k , y k ) [ n ] / 1 M k N k 1 M k 1 N k G ( x k , y k ) [ n ] 2 d x k d y k
where G(xk,yk)[n] represents the predicted effectiveness value of θ, ea, et and Cu in the kth partitioned grid zone coordinated by (xk,yk), n stands for θ, ea, et and Cu, respectively [33].
Computational compactness index:
F 3 = max G ( x k , y k ) [ n ] / 1 M k N k 1 M k 1 N k G ( x k , y k ) [ n ] d x k d y k
Cluster validity index:
F 4 = max G ( x k , y k ) [ n ] / 1 M k N k 1 M k 1 N k G ( x k , y k ) [ n ] d x k d y k 2
Kullback–Leibler divergence index:
F 5 = 1 M k N k 1 M k 1 N k G ( x k , y k ) [ n ] G ( x k , y k ) [ n ] ¯ 4 d x k d y k 1 M k N k 1 M k 1 N k G ( x k , y k ) [ n ] G ( x k , y k ) [ n ] ¯ 2 d x k d y k 4
Fuzzy clustering uniformity index:
F 6 = 1 M k N k 1 M k 1 N k ( G ( x k , y k ) [ n ] G ( x k , y k ) [ n ] ¯ ) 3 d x k d y k 1 M k N k 1 M k 1 N k ( G ( x k , y k ) [ n ] G ( x k , y k ) [ n ] ¯ ) 2 d x k d y k 3
where G ( x k , y k ) [ n ] ¯ denotes the mean value of G(xk,yk)[n]:
G ( x k , y k ) [ n ] ¯ = 1 M k N k 1 M k 1 N k G ( x k , y k ) [ n ] d x k d y k
Figure 8 demonstrates the calculated cluster distribution of F1F6. These graphs were obtained through positioning the computed values of the recursive complexity index (F1), functional inclusion index (F2), computational compactness index (F3), cluster validity index (F4), Kullback–Leibler divergence index (F5), and fuzzy clustering uniformity index (F6), using the predicted and measured effectiveness values of θ, ea, et and Cu, respectively. To identify statistical differences between them, a solid benchmark line represents the standard ratio between the predicted and actual measured results, regulating them into an identical data range. Here, the frames colored by green, red, blue, and brown were utilized to highlight the obtained F1–F6 clusters of θ, ea, et and Cu. Each cluster was illustrated by 120 data points. It could be observed that more data points dispersed around the solid benchmark line means that higher accuracy of the predicted effectiveness values is confirmed.
Figure 8a presents data comparisons between the computed and measured recursive complexity index (F1) of θ, ea, et and Cu, obviously showing that the efficiency and reliability of adaptive prediction maintained remarkable correlation with the recursive complexity of predicted results, especially with regard to Wa and Tc. RSAE–ANFIS makes detailed considerations on the inherent capabilities of irrigated soil fields by adapting to external environmental changes, and this novel approach reached a high predictive precision of θ and ea when irrigation cut-off happened. Furthermore, RSAE–ANFIS offers a solid theoretical foundation for the recursive complexity index of θ, ea, and Cu, which means that the predicted infiltration effectiveness values are demonstrated by ea and Cu in a traditional mathematical sense, and they could be affected by deep moisture percolation, moisture content capacity, or irrigation efficiency of the objective soil field. The droplet infiltration quality identified by et reaches optimal values with regard to Fa, Tc, and Pw, which explains their wide applications in keeping the high circulation efficiency of groundwater irrigation, especially when the moisture content variances of soil fields should be fully considered.
Figure 8b presents data comparisons between the computed and measured functional inclusion index (F2) of θ, ea, et and Cu, which shows that the F2 index of prediction performance with respect to the probability density of droplet infiltration obviously maintains a close relation with θ and et, and places emphasis on Pw and Fa. The working applicability of effectiveness prediction also highly depends upon the consumption rate of water transpiration and soil moisture content during practical sprinkler irrigation. Since this intelligent prediction system showed an improvement tendency in its assessment predictability or computational compatibility, the calculation efficiency of the RSAE–ANFIS system keeps a positive relation with Wa and Tc, according to the conditional determination of ea and Cu in sprinkler irrigation evaluation.
Figure 8c shows data comparisons between the computed and measured computational compactness index (F3) of θ, ea, et and Cu, which gives us an applicable reference criterion related to water use efficiency and the water balance condition when Pw, Fa, and Tc are focused on. Its value variation causes a corresponding fluctuation in the predictive precision of θ and Cu. This assessment index could be employed to identify the distributive rationality of infield infiltration variability, prompting the circulation efficiency and moisture diffusivity of deep moisture percolation. A set of F3 result comparisons demonstrated that, with a moderate reduction in moisture pressure and soil moisture uniformity, ea stays in an invariant value state. Here, droplet infiltration plays an important role in the balanced distributive condition of moisture saturation, the water balance mechanism, and moisture drainage, etc. This assessment index contributes greatly to the stable demonstration of sprinkler irrigation efficiency and moisture infiltration quality on the soil surface.
Figure 8d shows data comparisons between the computed and measured cluster validity index (F4) of θ, ea, et and Cu, describing that F4 keeps a close relation with ea and Cu when Wa, Fa, Tc are carefully examined. This assessment index is also affected heavily by soil moisture redistribution and droplet penetration time. As θ indirectly demonstrates the consumption rate of transpiration and infiltration opportunity time, by focusing on moisture diffusivity or infiltration depth, actual sprinkler irrigation presents objective criteria of Pw and Tc to evaluate droplet infiltration effectiveness, from the novel perspectives of soil moisture storage and moisture uniformity. Therefore, the circulation efficiency of groundwater irrigation could be improved by optimizing the infield infiltration rate. The cluster validity index illustrates that the probability density of droplet infiltration provides useful tools to suppress external computational interference originating from noisy measurement signals or error fuzzy rules, and the prediction robustness of RSAE–ANFIS can be improved for moisture redistribution, soil evaporation, or infiltration efficiency. Furthermore, this assessment index also provides a clear demonstration of the infiltration rate and facilitates a reliable evaluative criterion for soil moisture uniformity.
Figure 8e shows data comparisons between the computed and measured Kullback–Leibler divergence index (F5) of θ, ea, et and Cu, which can be frequently used to regulate RSAE–ANFIS computation and monitor the water circulation efficiency in soil fields. This index quantifies the critical influence of Pw and Wa on the moisture content and saturated hydraulic conductivity of a tested soil portion, and it also highly depends on the value range of θ when Cu and et are deliberately adjusted and closely observed. The Kullback–Leibler divergence index demonstrates the invariant properties of Cu and ea when the droplet infiltration conditions impacted by Fa and Tc are faced, so that the sprinkler irrigation stability can be quantified by the measurements of soil moisture content, infiltration depth, or soil evaporation.
Figure 8f shows data comparisons between the computed and measured fuzzy clustering uniformity index (F6) of θ, ea, et and Cu, which demonstrates that the calculation precision of RSAE–ANFIS heavily influences ea and Cu, and its operational mechanism could be remarkably affected by the value accuracy of Pw, Wa, and Fa. This index assesses the adaptive prediction of infiltration effectiveness in measurement quality and calculation precision through calibrating the relative proportion of drainage water and soil moisture saturation. It could be observed that this assessment index maintains a relatively stable value during the determination of the circulation efficiency of groundwater. Consequently, it contributes greatly to the precise monitoring of moisture infiltration opportunity time. The fuzzy clustering uniformity index could also be utilized to testify the formula veracity of Wa and Tc based on the cumulative depth of infiltrated water and soil moisture uniformity.
To quantify the applicability and efficiency of the RSAE–ANFIS approach with alternative ones, such frequently used approaches as genetic optimization, simulated annealing–genetic algorithm (SA–GA), Taguchi parameter estimation, artificial neural network–simulated annealing (ANN–SA) prediction, and genetically optimized neural network (GONN) have been employed in the experimental conditions prearranged by Table 1 and Table 2 [34,35,36,37,38]. Figure 9a–d showed the value comparisons of θ, ea, et and Cu between the predicted and actual measured results in tests A–K. It could be learned that RSAE–ANFIS (denoted by brown lines) presents θ, ea, et and Cu, keeping closer to actual measured ones (denoted by black lines) than any other approach does. The precision and reliability of the RSAE–ANFIS system could be identified and acknowledged, demonstrating that this proposed approach ensures optimal prediction results of infiltration effectiveness indexes. Table 5 presents a data description about the performance comparisons of the RSAE–ANFIS approach with others. Considering the current calculation capability of our computation station demonstrated in Section 4.2, the reliability and sensitivity of effectiveness prediction by using these typical approaches were verified in terms of reasoning efficiency and calculation precision. From statistical analysis, it is summarized that higher efficient prediction could be returned by RSAE–ANFIS than that of other approaches. Its average computation accuracy reaches 98.25% in network training and 93.47% in performance testing (error tolerance = ±5%, the same as follows). On the value determination stage of θ, ea, et, and Cu, its standard deviation reaches 0.335% in network training and 0.402% in performance testing, respectively. This intelligent prediction system only uses 1.22 s to complete the entire calculation on the computation platform provided. Other excellent properties of RSAE–ANFIS include average computation storage (1855.4 kb), standard error of prediction (3.66%), and upper and lower error limits (4.27% and 4.52%, respectively), with the frequently used confidence interval of 95% being adopted.

7. Conclusions

A new adaptive prediction approach used for droplet infiltration effectiveness by using RSAE–ANFIS was proposed to schedule the circulation efficiency of sprinkler irrigation. This research shows that when jetting pressure (Pw) is 255.2 kPa, the impinge angle (Wa) is 42.5°, the water flow rate (Fa) is 0.67 kg/min, and continuous irrigation time (Tc) is 32.4 min, the optimal and stable effectiveness prediction quality could be ensured: the average soil moisture depth increment (θ) is 57.6 mm, irrigation infiltration efficiency (ea) is 62.5%, irrigation turn duration efficiency (et) is 34.5 mm/min, and the uniformity coefficient of soil moisture infiltration (Cu) is 53.6% (error tolerance = ±5%). This research makes the following contributions to sprinkler irrigation: (1) It predicted water droplet infiltration effectiveness in a more efficient way both theoretically and technically; (2) A novel intelligent prediction system named RSAE–ANFIS was designed, with its working mechanism and constructive influence being explained clearly; (3) A set of effectiveness indexes were presented to assess the moisture infiltration mechanism from innovative perspectives; (4) The efficiency, accuracy and quality of sprinkler irrigation can be planned precisely and monitored instantaneously. This novel intelligent prediction system has outstanding predictive capability and possesses much better calculation reliability for water droplet infiltration effectiveness in accuracy and efficiency. Meanwhile, high agreement between the adaptive predicted and actual measured values of infiltration effectiveness could be obtained. Consequently, the superiority and efficiency of RSAE–ANFIS were confirmed, and the instantaneous supervision and mechanism optimization of sprinkler irrigation were facilitated greatly, too.

Author Contributions

Conceptualization, Z.L.; methodology, Z.L.; validation, X.L. and T.Z.; resources, J.X. All authors have read and agreed to the published version of this manuscript.

Funding

The authors acknowledge the funding received from the following science foundations: National Natural Science Foundation of China (51975136, 51575116, U1601204, 52075109), National Key Research and Development Program of China (2018YFB2000501), the Science and Technology Innovative Research Team Program in Higher Educational Universities of Guangdong Province (2017KCXTD025), the Innovative Academic Team Project of Guangzhou Education System (1201610013), the Special Research Projects in the Key Fields of Guangdong Higher Educational Universities (2019KZDZX1009), the Science and Technology Research Project of Guangdong Province (2017A010102014, 2016A010102022), and the Science and Technology Research Project of Guangzhou (201707010293), which are all appreciated for supporting this work.

Institutional Review Board Statement

Not applicable.

Informed Consent Statement

Not applicable.

Data Availability Statement

The data that support the findings of this study are available from the corresponding author upon reasonable request.

Acknowledgments

We thank the editors for their hard work, and the referees for their comments and valuable suggestions that helped to improve this paper.

Conflicts of Interest

The authors declare no conflict of interest.

Nomenclature

θ ¯ e n d The averaged value of soil moisture proportion (%)
(xk,yk)thThe meshed grid zone of the soil field
H R S A E M k , N k The mathematical features of probability density
I d x k , y k ; μ , σ 2 x k = 1 , y k = 1 M k , N k The probability density of droplet infiltration at a given meshed grid zone
JThe gradient of JRSAE
CfThe cumulative irrigation flow depth (mm)
CuThe uniformity coefficient of soil moisture infiltration (%)
Eevaporation
eaThe irrigation infiltration efficiency
etThe irrigation turn duration efficiency, or the ratio of net infiltrated moisture depth per unit of irrigation time (mm/min)
EvThe cumulative water flow depth evaporated at the end of irrigation turn (mm)
fThe mapping function of the RSAE decoder
F1The recursive complexity index
F2The functional inclusion index
F3The computational compactness index
F4The cluster validity index
F5The Kullback–Leibler divergence index
F6The fuzzy clustering uniformity index
FaThe flow rate of water (kg/min)
gRSAEThe mapping function for the RSAE decoder
H(i,j)The inverse of the Hessian matrix
iThe ith intervals of the update process of WRSAE
Id((xk,yk); μ, σ2) The probability density of water droplet infiltration at the investigated area
ITThe irrigation time (h)
jThe jth intervals of the update process of WRSAE
MkThe number of meshed grids in length directions
N(μ,σ) Normal distribution of droplet infiltration positions on an objective meshed grid zone
NkThe number of meshed grids in width directions
PwThe jetting pressure in the nozzle tube (kPa)
QThe spray discharge amount (L/h)
RHThe average air relative humidity (%)
sgnThe result of the sign function of σr(W∙(xk,yk))
SRThe solar radiation
TThe average air temperature (℃)
tThe irrigation turn duration (min)
TcThe continuous irrigation time (min)
WaThe impinge angle (º)
WRSAEThe weight matrix of the Regularized Sparse Autoencoder
xkThe horizontal coordinates of the specific position where water droplet infiltration happens
ykThe vertical coordinates of the specific position where water droplet infiltration happens
ηThe step size of the update process
θThe average soil moisture depth increment (mm)
θantecedentThe average antecedent soil moisture depths (mm)
θendThe average achieved soil moisture depths (mm)
θxk,ykThe soil moisture proportion at one infiltration measurement position (%)
λxkykThe regular coefficient of RSAE corresponding to the mesh grid zone
μThe mean value of the infiltration position coordinate
σThe corresponding distribution variance
σr(z)The rectified linear unit employed as the activation function in the RSAE decoder
σrThe derivative function of rectified linear unit σr

References

  1. Goodchild, M.; Jenkins, M.; Whalley, W.; Watts, C. A novel dielectric moisture probe enabling precision PID-based irrigation control of polytunnel-grown strawberries in coir. Biosyst. Eng. 2018, 165, 70–76. [Google Scholar] [CrossRef]
  2. Zapata-Sierra, A.; Agugliaro, F. Controlled deficit irrigation for orange trees in Mediterranean countries. J. Clean. Prod. 2017, 162, 130–140. [Google Scholar] [CrossRef]
  3. Martí, R.; Valcárcel, M.; Leiva-Brondo, M.; Lahoz, I.; Campillo, C.; Roselló, S.; Cebolla-Cornejo, J. Influence of controlled deficit irrigation on tomato functional value. Food Chem. 2018, 252, 250–257. [Google Scholar] [CrossRef]
  4. Jouni, H.; Liaghat, A.; Hassanoghli, A.; Henk, R. Managing controlled drainage in irrigated farm fields, A case study in the Moghan plain, Iran. Agric. Water Manag. 2018, 208, 393–405. [Google Scholar] [CrossRef]
  5. Mostafa, H.; Nady, R.; Awad, M.; Ansary, M. Drip irrigation management for wheat under clay soil in arid conditions. Ecol. Eng. 2018, 121, 35–43. [Google Scholar] [CrossRef]
  6. Li, D.; Franssen, H.; Han, X.; Bello, M.; Vereecken, H. Evaluation of an operational real-time irrigation scheduling scheme for droplet irrigated citrus fields in Picassent, Spain. Agric. Water Manag. 2018, 208, 465–477. [Google Scholar] [CrossRef] [Green Version]
  7. Rodríguez, F.L.; Horváth, K.; Martín, J.G.; Maestre, J. Mobile Model Predictive Control for the Évora irrigation test canal. IFAC-PapersOnLine 2017, 50, 6570–6575. [Google Scholar] [CrossRef]
  8. Smith, R.; Uddin, M.; Gillies, M. Estimating irrigation duration for high performance furrow irrigation on cracking clay soils. Agric. Water Manag. 2018, 206, 78–85. [Google Scholar] [CrossRef]
  9. Oker, T.E.; Kisekka, I.; Sheshukov, A.Y.; Aguilar, J.; Rogers, D.H. Evaluation of maize production under mobile drip irrigation. Agric. Water Manag. 2018, 210, 11–21. [Google Scholar] [CrossRef]
  10. Dang, T.; Pedroso, R.; Laux, P.; Kunstmann, H. Development of an integrated hydrological-irrigation optimization modeling system for a typical rice irrigation scheme in Central Vietnam. Agric. Water Manag. 2018, 208, 193–203. [Google Scholar] [CrossRef]
  11. Salem, G.S.A.; Kazama, S.; Shahid, S.; Dey, N.C. Impacts of climate change on groundwater level and irrigation cost in a groundwater dependent irrigated region. Agric. Water Manag. 2018, 208, 33–42. [Google Scholar] [CrossRef]
  12. Bigelow, D.P.; Zhang, H. Supplemental irrigation water rights and climate change adaptation. Ecol. Econ. 2018, 154, 156–167. [Google Scholar] [CrossRef]
  13. Jia, F.; Lei, Y.; Guo, L.; Lin, J.; Xing, S. A neural network constructed by deep learning technique and its application to intelligent fault diagnosis of machines. Neurocomputing 2018, 272, 619–628. [Google Scholar] [CrossRef]
  14. Liang, Z.; Liu, X.; Xiao, J.; Liu, C. Adaptive prediction of abrasive impacting pressure effectiveness in strengthen jet grinding using NSAE-ANFIS. Int. J. Adv. Manuf. Technol. 2020, 106, 2805–2828. [Google Scholar] [CrossRef]
  15. Liang, Z.; Shan, S.; Liu, X.; Wen, Y. Fuzzy prediction of AWJ turbulence characteristics by using typical multi-phase flow models. Eng. Appl. Comput. Fluid Mech. 2017, 11, 225–257. [Google Scholar] [CrossRef] [Green Version]
  16. Ren, Y.; Wei, S.; Cheng, K.; Fu, Q. Valuation and Pricing of Agricultural Irrigation Water Based on Macro and Micro Scales. Water 2018, 10, 1044. [Google Scholar] [CrossRef] [Green Version]
  17. Paranage, K. Understanding the Relationship between Water Infrastructure and Socio-Political Configurations: A Case Study from Sri Lanka. Water 2018, 10, 1402. [Google Scholar] [CrossRef] [Green Version]
  18. Ćosić, M.; Stričević, R.; Djurović, N.; Lipovac, A.; Pavlović, M. Effects of irrigation regime and application of kaolin on canopy temperatures of sweet pepper and tomato. Sci. Hortic. 2018, 238, 23–31. [Google Scholar] [CrossRef]
  19. Liu, D.C.; Nocedal, J. On the limited memory BFGS method for large scale optimization. Math. Program. 1989, 45, 503–528. [Google Scholar] [CrossRef] [Green Version]
  20. Liu, X.; Liang, Z.; Wen, G.; Yuan, X. Waterjet machining and research developments: A review. Int. J. Adv. Manuf. Technol. 2018, 102, 1257–1335. [Google Scholar] [CrossRef]
  21. Liu, Y.; Yang, H.; Li, J.; Li, Y.; Yan, H. Estimation of irrigation requirements for droplet-irrigated maize in a sub-humid climate. J. Integr. Agric. 2018, 17, 677–692. [Google Scholar] [CrossRef]
  22. Liu, J.; Bi, X.; Ma, M.; Jiang, L.; Du, L.; Li, S.; Sun, Q.; Zou, G.; Liu, H. Precipitation and irrigation dominate soil water leaching in cropland in Northern China. Agric. Water Manag. 2019, 211, 165–171. [Google Scholar] [CrossRef]
  23. Zhang, S.; Wang, M.; Shi, W.; Zheng, W. Construction of intelligent water saving irrigation control system based on water balance. IFAC-PapersOnLine 2018, 51, 466–471. [Google Scholar] [CrossRef]
  24. Du, Y.-D.; Niu, W.-Q.; Gu, X.-B.; Zhang, Q.; Cui, B.-J.; Zhao, Y. Crop yield and water use efficiency under aerated irrigation: A meta-analysis. Agric. Water Manag. 2018, 210, 158–164. [Google Scholar] [CrossRef]
  25. Yu, Y.; Liu, J.; Wang, Y.; Xiang, C.; Zhou, J. Practicality of using solar energy for cassava irrigation in the Guangxi Autonomous Region, China. Appl. Energy 2018, 230, 31–41. [Google Scholar] [CrossRef]
  26. Elshaikh, A.E.; Jiao, X.; Yang, S.-H. Performance evaluation of irrigation projects: Theories, methods, and techniques. Agric. Water Manag. 2018, 203, 87–96. [Google Scholar] [CrossRef]
  27. Stärke, F.; Awiszus, F.; Lohmann, C.; Stärke, C. The effect of irrigation time and type of irrigation fluid on cartilage surface friction. J. Mech. Behav. Biomed. Mater. 2018, 77, 187–191. [Google Scholar] [CrossRef]
  28. Delgoda, D.; Malano, H.; Saleem, S.K.; Halgamuge, M.N. Irrigation control based on model predictive control (MPC): Formulation of theory and validation using weather forecast data and AQUACROP model. Environ. Model. Softw. 2016, 78, 40–53. [Google Scholar] [CrossRef]
  29. Basga, S.D.; Tsozue, D.; Temga, J.P.; Balna, J.; Nguetnkam, J.P. Land use impact on clay dispersion/flocculation in irrigated and flooded vertisols from Northern Cameroon. Int. Soil Water Conserv. Res. 2018, 6, 237–244. [Google Scholar] [CrossRef]
  30. Dong, L.; Zhang, H.; Wang, L.; Yu, D.; Yang, F.; Shi, X.; Saleem, H.; Akhtar, M.S. Irrigation with sediment-laden river water affects the soil texture and composition of organic matter fractions in arid and semi-arid areas of Northwest China. Geoderma 2018, 328, 10–19. [Google Scholar] [CrossRef]
  31. Liang, Z.; Liao, S.; Wen, Y.; Liu, X. Working parameter optimization of strengthen waterjet grinding with the orthogonal-experiment-design-based ANFIS. J. Intell. Manuf. 2019, 30, 833–854. [Google Scholar] [CrossRef]
  32. Brinkhoff, J.; Hornbuckle, J.; Barton, J.L. Assessment of Aquatic Weed in Irrigation Channels Using UAV and Satellite Imagery. Water 2018, 10, 1497. [Google Scholar] [CrossRef] [Green Version]
  33. Ayyad, S.; Al Zayed, I.S.; Ha, V.T.T.; Ribbe, L. The Performance of Satellite-Based Actual Evapotranspiration Products and the Assessment of Irrigation Efficiency in Egypt. Water 2019, 11, 1913. [Google Scholar] [CrossRef] [Green Version]
  34. Liang, Z.; Liu, X.; Wen, G.; Yuan, X. Influence analysis of sprinkler irrigation effectiveness using ANFIS. Int. J. Agric. Biol. Eng. 2019, 12, 135–148. [Google Scholar] [CrossRef]
  35. Liang, Z.; Liu, X.; Wen, G.; Xiao, J. Effectiveness prediction of abrasive jetting stream of accelerator tank using normalized sparse autoencoder-adaptive neural fuzzy inference system. Proc. Inst. Mech. Eng. Part B J. Eng. Manuf. 2020, 234, 1615–1639. [Google Scholar] [CrossRef]
  36. Zaki, N.A.; Haghighi, A.T.; Rossi, P.M.; Xenarios, S.; Kløve, B. An Index-Based Approach to Assess the Water Availability for Irrigated Agriculture in Sub-Saharan Africa. Water 2018, 10, 896. [Google Scholar] [CrossRef] [Green Version]
  37. Zhang, X.; Qiu, J.; Leng, G.; Yang, Y.; Gao, Q.; Fan, Y.; Luo, J. The Potential Utility of Satellite Soil Moisture Retrievals for Detecting Irrigation Patterns in China. Water 2018, 10, 1505. [Google Scholar] [CrossRef] [Green Version]
  38. Liang, Z.; Liu, X.; Xiong, J.; Xiao, J. Water Allocation and Integrative Management of Precision Irrigation: A Systematic Review. Water 2020, 12, 3135. [Google Scholar] [CrossRef]
Figure 1. Water droplet infiltration of sprinkler irrigation and the planar meshed grid on soil field, used for the moisture gauging and position calibration of droplet infiltration effectiveness.
Water 13 00791 g001
Figure 2. Location of Guangzhou University where sprinkler irrigation experiment was conducted.
Water 13 00791 g002
Figure 3. The measurement and adaptive prediction levels of the Regularized Sparse Autoencoder–Adaptive Network-based Fuzzy Inference System (RSAE–ANFIS), in which droplet infiltration could be measured from soil moisture sensors and transmitted to intelligent prediction network.
Water 13 00791 g003
Figure 4. Diagram of RSAE–ANFIS computational mechanism in which the droplet infiltration properties could be computed and determined for the interests of adaptive prediction.
Water 13 00791 g004
Figure 5. The tested sprinkler irrigation system and the spatial layout of pipeline network: 1. high-performance fluid intensifier pump; 2. water source; 3. holder; 4. solar cell panel; 5. charging controller; 6. storage battery; 7. inverter; 8. storage; 9. electric control box; 10. pressure valve; 11. circuit controller; 12. irrigation pipe network; 13. irrigation controller; 14. strainer; 15. main valve; 16. check valve.
Water 13 00791 g005
Figure 6. The droplet infiltration distribution and partitioned infiltration levels I–X of sprinkler irrigation.
Water 13 00791 g006
Figure 7. Profile comparisons between the predicted and actual measured droplet infiltration indexes at different soil depths.
Water 13 00791 g007
Figure 8. Cluster distribution of F1F6 used for the prediction evaluation of infiltration effectiveness indexes, where the computed and measured indexes of recursive complexity, functional inclusion, computational compactness, cluster validity, Kullback–Leibler divergence, fuzzy clustering uniformity for describing infiltration effectiveness could be calibrated.
Water 13 00791 g008
Figure 9. Value comparisons of θ, ea, et and Cu between the predicted and actual measured results originating from tests A–K. Where Figure 9 (a) denotes the data variation trend of average soil moisture depth increment (θ, mm), Figure 9 (b) denotes the irrigation infiltration efficiency (ea), Figure 9 (c) denotes the ratio of net infiltrated moisture depth per unit of irrigation time (et, mm/min), and Figure 9 (d) denotes the uniformity coefficient of soil moisture infiltration (Cu, %). Besides, Genetic method denotes genetic optimization, SA-GA stands for the simulated annealing- genetic algorithm, Taguchi is Taguchi parameter estimation method, ANN-SA denotes the artificial neural network- simulated annealing prediction method, and GONN stands for the genetically optimized neural network.
Water 13 00791 g009
Table 1. The experimented environmental conditions for sprinkler irrigation tests: jetting pressure in nozzle tube (P, kPa), irrigation time (IT, h), spray discharge amount (Q, L/h), average air temperature (T, °C), average air relative humidity (RH, %), solar radiation (SR), average wind speed (U, m/s), evaporation (E, mm), and wind direction (WD).
ConditionP (kPa)IT (h)Q (L/h)T (°C)RH (%)SR (MJ/m2)U (m/s)E (mm)WD
12502.5178525.68815.20.520.2Northeast
23302.6174424.16211.41.131.4Southeast
32403.1156228.67517.21.228.2Northeast/North
42803.2182330.27419.20.926.2South/Southwest
52603.3149231.26915.30.530.2Southwest
62702.8152232.56616.50.824.3West
73302.7163829.57214.80.637.5Northeast
83102.9172929.37615.61.128.2Northwest
93502.4156228.68517.21.331.2North/Northeast
103602.6188224.69218.81.433.2Southeast
112502.6148525.99117.31.834.2East/Northeast
122802.1192528.86815.61.530.6Northeast
132902.0154726.97514.50.928.2Southeast/South
143202.5148228.77718.20.837.2Southeast
153102.5155633.28419.21.428.9North
163303.2157233.68814.21.627.6Northwest
172803.6198234.58616.21.824.2Northeast
182603.1156326.58714.51.723.2Southeast
192703.0142528.58217.21.534.1Northwest
202803.0182524.98518.21.436.2North
212602.6147226.38615.51.728.2Northeast/East
222402.8163528.49214.21.535.3East/North
232502.7185226.39014.61.224.7Northeast
242603.5147225.88616.21.635.2Southeast
252603.6188224.77518.21.228.2Southwest
263103.5166426.37415.60.833.2Southeast
273303.4159225.98314.20.634.2North
283503.2182233.68118.20.837.2South
293203.3142532.58814.40.426.3Southwest/West
303403.6163236.28616.20.832.1Northwest
313603.4147234.18418.21.138.2West
323803.8158226.99217.21.528.2Northeast/East
333702.9155632.48216.61.437.2Southeast
342602.5148225.67618.21.236.2North/Northwest
352802.7172528.47718.21.834.2Northeast
Table 2. The partitioned levels of irrigation parameters and infiltration effectiveness indexes, used as input and output variables of RSAE–ANFIS system for infiltration effectiveness prediction.
Irrigation ParametersValue Levels
12345678910
Jetting pressure (Pw/kPa)160180200220240260280300320340
Impinge angle (Wa/°)10.015.020.025.030.035.040.045.050.055.0
Flow rate of water (Fa/kg/min)0.200.300.400.500.600.700.800.901.001.10
Continuous irrigation time (Tc/min)25303540455055606570
Infiltration Effectiveness IndexesValue Levels
Average soil moisture depth increment (θ/mm)10.020.030.040.050.060.070.080.090.0100.0
Irrigation infiltration efficiency (ea/%)20.025.030.035.040.045.050.055.060.065.0
Irrigation turn duration efficiency (et/mm/min)10.015.020.025.030.035.040.045.050.055.0
The uniformity coefficient of soil moisture infiltration (Cu/%)10.020.030.040.050.060.070.080.090.0100.0
Table 3. Logic rules of RSAE–ANFIS system. The partitioned levels of irrigation parameters, such as jetting pressure (Pw/kPa), impinge angle (Wa/°), flow rate of water (Fa/kg/min), and continuous irrigation time (Tc/min), are input variables. The partitioned levels of infiltration effectiveness indexes, including average soil moisture depth increment (θ/mm), irrigation infiltration efficiency (ea/%), irrigation turn duration efficiency (et/mm/min), and the uniformity coefficient of soil moisture infiltration (Cu/%), are output variables.
NoIF: Experimental Run of Input LevelsTHEN: Experimental Run of Output Levels
PwWaFaTcθeaetCu
111115366
211216246
312317258
412422325
5235210121
623626424
724738545
824834652
935937212
10351045776
1136142889
1236242232
1347353654
1447454461
15485568410
1648665915
1759768225
1859868216
195109774110
205101074552
2161172445
2261285755
2362386164
2462484441
2573592583
2673695683
2774799195
287481042106
298591055210
308510101522
3186191845
3286295856
3397393968
3497485147
35985871104
3698689221
371097710565
38109875412
…………………………
10010101065856
Table 4. Comparisons between the predicted and measured infiltration effectiveness indexes on different soil depth layers.
Tests Infiltration Effectiveness Indexes Investigated in Our Experiment.
Average Soil Moisture Depth Increment (θ, mm)Irrigation Infiltration Efficiency (ea, %)Irrigation Turn Duration Efficiency (et, mm/min)Uniformity Coefficient of Soil Moisture Infiltration (Cu, %)
RSAE–
ANFIS
MeasuredRE
(%)
RSAE–
ANFIS
MeasuredRE
(%)
RSAE–
ANFIS
MeasuredRE
(%)
RSAE–
ANFIS
MeasuredRE
(%)
Test A152.3353.652.46 36.2235.302.61 15.2214.157.56 63.2561.253.27
262.1465.154.62 56.5552.657.41 36.2533.059.68 88.1583.255.89
382.1186.324.88 47.2143.338.9533.4236.147.53 47.2545.144.67
434.0237.569.42 39.2536.098.76 56.2552.257.66 63.2566.583.51
553.2650.555.36 55.4152.006.56 27.5526.145.39 33.5834.923.84
Test B142.1146.9510.31 28.4426.049.22 29.5427.288.28 38.9537.314.40
259.3256.554.90 62.1468.068.70 30.1433.8510.96 41.2543.585.35
385.1486.441.50 60.2267.1110.27 45.2241.588.75 46.2545.226.55
475.2279.144.95 50.1453.656.54 50.0654.458.06 47.2244.476.18
564.1568.145.86 23.0425.068.06 48.2245.585.79 82.6286.584.57
Test C163.9568.176.19 28.4426.059.1747.0143.448.22 55.2653.263.76
268.2566.213.08 38.0035.018.54 43.5146.987.39 63.2466.586.02
347.2243.548.45 36.1438.034.97 39.2536.487.59 53.2657.146.79
469.2564.147.97 30.2533.068.50 33.0135.657.41 45.2649.256.13
548.2246.224.33 46.2547.252.12 35.0536.955.14 90.2593.553.53
Test D132.5535.979.51 44.1745.061.98 42.0646.259.06 91.0096.515.71
214.2515.176.0642.5646.298.06 18.4917.485.78 65.2566.251.51
316.5515.884.22 63.2267.225.95 17.2216.991.35 48.2646.664.54
417.2516.146.8855.8956.280.69 25.6123.658.29 47.2545.144.67
582.5589.177.42 52.4757.258.35 28.4826.487.55 66.3263.025.24
Test E146.2348.224.1356.9052.139.1536.2533.328.7926.0528.047.10
254.1253.141.8455.0253.153.5237.4836.283.3137.8239.252.74
366.3261.477.8940.3644.338.9633.0534.253.5034.2636.543.98
482.5686.985.0843.8147.056.8928.4926.059.3748.2547.142.35
592.1498.886.8248.0746.114.2530.1532.176.2846.9244.156.27
Test F145.2647.985.67 45.6248.265.47 48.0543.4810.51 40.1543.257.17
244.2546.885.61 41.0944.257.14 46.2242.179.60 30.2532.587.15
341.5643.895.31 35.0436.333.55 38.1536.145.56 36.9538.753.81
463.2569.659.19 38.1936.255.35 48.7545.626.86 38.1536.144.57
565.4768.955.05 35.6239.239.20 53.2551.842.72 62.1566.957.17
Test G166.2968.192.79 40.2243.226.9449.6646.147.63 66.8562.147.58
248.2543.6510.54 46.2547.252.12 27.5825.657.52 75.1878.253.92
339.2537.145.68 48.2244.159.22 39.1536.846.27 70.0273.654.93
447.2545.164.63 46.9244.066.49 38.1436.484.55 65.1468.044.26
544.5648.989.02 50.1855.339.31 48.1547.142.14 73.0579.257.82
Test H153.3655.224.0238.2539.252.5525.1123.656.1885.4589.654.69
259.2258.172.0146.2547.743.1326.3325.951.4789.2586.543.14
372.1374.693.4343.7846.225.2828.1427.173.5787.2483.624.33
470.3272.513.0250.3653.215.3634.1435.634.1979.5277.153.08
559.2256.385.0448.7246.215.4426.9525.854.2688.3284.654.34
Test I148.2546.144.5862.1465.555.2124.5825.874.9986.4584.252.62
247.2249.224.0763.2566.344.6627.4526.473.7177.4573.335.62
363.2165.894.0748.2946.254.4126.3525.652.7379.2175.125.45
455.2657.483.8757.1254.235.3336.1537.894.6075.4878.223.51
558.1455.484.8066.3263.684.1536.5535.473.0582.4580.112.92
Test J136.5439.327.0749.2546.256.4938.2437.561.8180.1283.544.10
239.5837.146.5756.2154.473.2029.5428.473.7678.6577.112.00
342.1545.557.4743.2644.983.8328.4829.985.0177.4875.962.01
444.3646.214.0144.7846.253.1828.8827.564.7982.3686.544.83
542.7844.473.8058.2554.596.7135.6536.983.6083.1487.224.68
Test K153.2656.475.6963.2166.985.6337.4138.984.0382.6488.216.32
252.7855.544.9765.4767.242.6437.1639.656.2876.9875.142.45
355.3656.982.8559.2556.245.3629.5428.563.4477.2575.112.85
459.2456.474.9134.2136.085.1937.2538.984.4475.4873.253.05
557.1556.101.8839.2537.255.3728.4127.363.8478.2976.212.73
Note: 1. Relative error (RE) = ((The predicted index value—The measured index value)/The measured index value) × 100%; 2. Soil depth of Layer 1: 0–100 cm; Layer 2: 100–200 cm; Layer 3: 200–300 cm; Layer 4: 300–400 cm; Layer 5: 400–500 cm.
Table 5. Performance comparisons of RSAE–ANFIS approach with others, such as SA-GA, simulated annealing-genetic algorithm; ANN, artificial neural network; GONN, genetically optimized neural network.
Performance Accuracy and Computational EfficiencyRepresentative Prediction Approaches (Error Tolerance = ±5%)
RSAE–ANFISGeneticSA-GATaguchiANN-SAGONN
Network trainingComputation accuracy (%)98.2591.0296.5591.4191.2692.95
Standard deviation (%)0.3350.5620.6620.6230.4850.635
Network testingComputation accuracy (%)93.4787.2586.3387.5889.2584.56
Standard deviation (%)0.4020.5680.5960.5530.5630.725
Average computation storage (kb)1855.41556.51472.51566.21695.21475.2
Computation time (s)1.22s1.85s1.87s1.76s1.85s1.95s
Standard error of prediction (%)3.664.785.686.655.685.85
Confidence interval 95%Upper error limit (%)4.276.246.286.476.986.52
Lower error limit (%)4.526.856.546.586.885.69
Publisher’s Note: MDPI stays neutral with regard to jurisdictional claims in published maps and institutional affiliations.

