
Integrating Satellite Rainfall Estimates with Hydrological Water Balance Model: Rainfall-Runoff Modeling in Awash River Basin, Ethiopia

 , and
, and
Abstract
:1. Introduction
2. Data and Methods
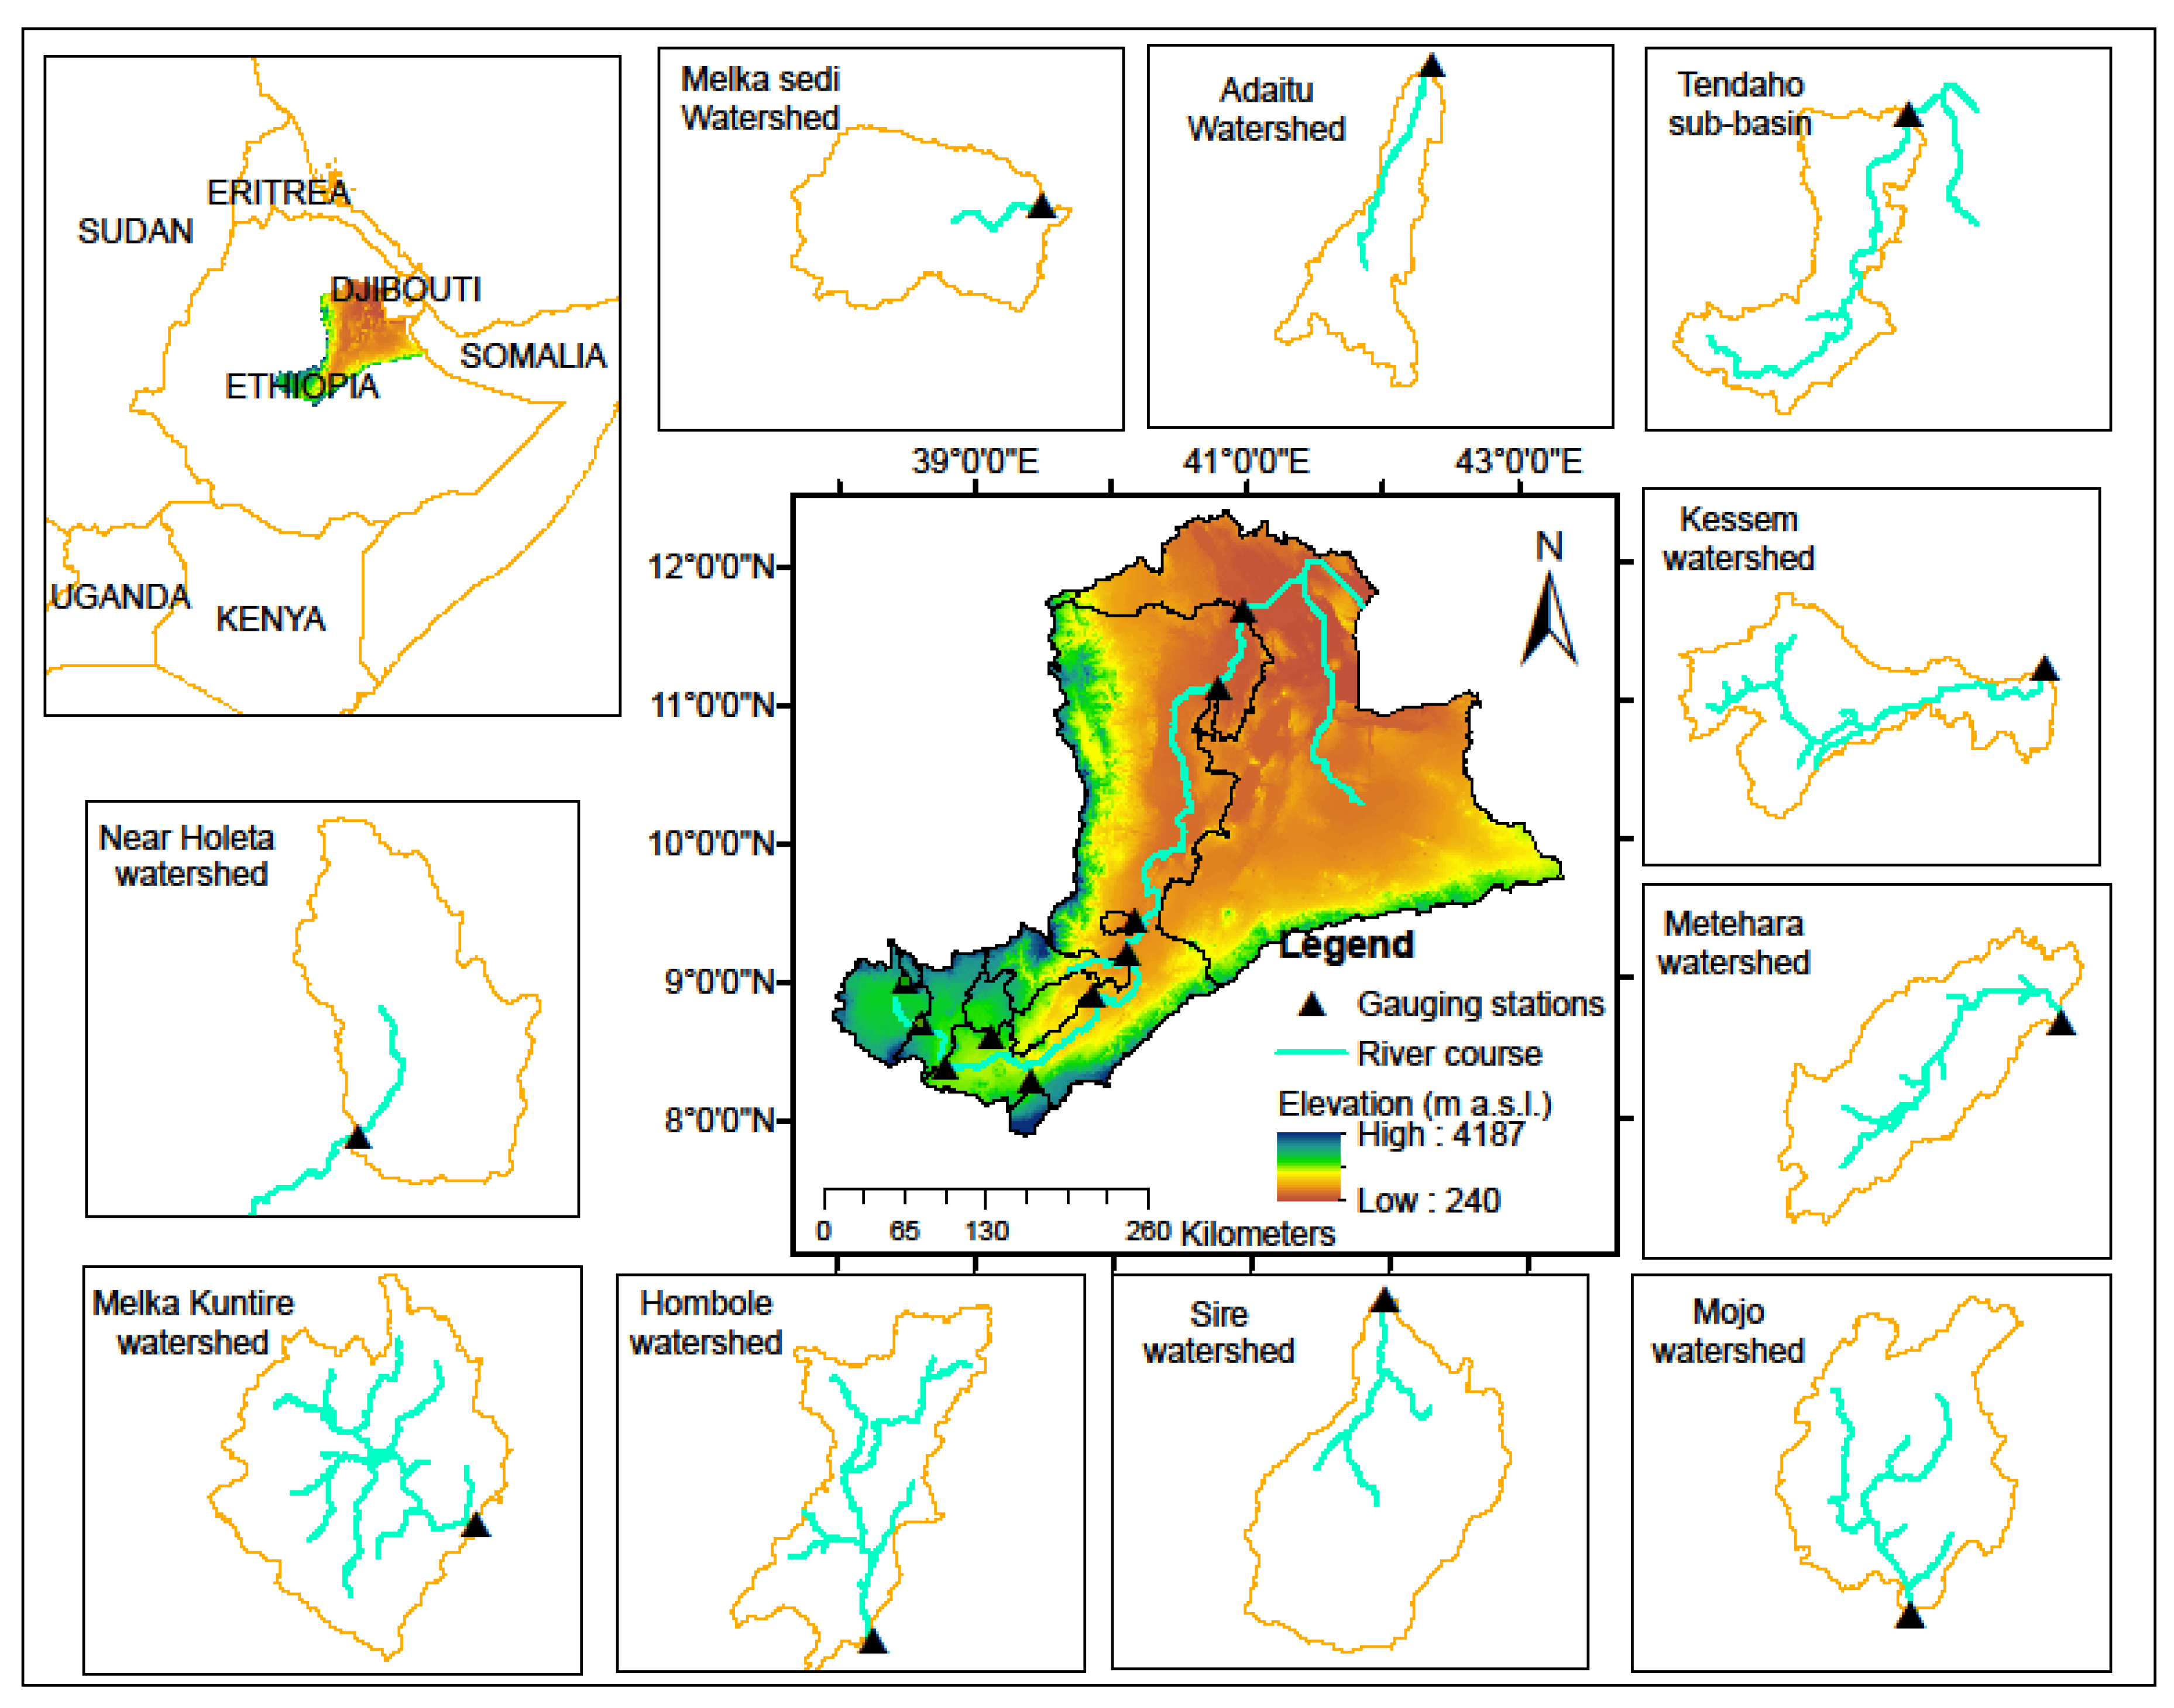
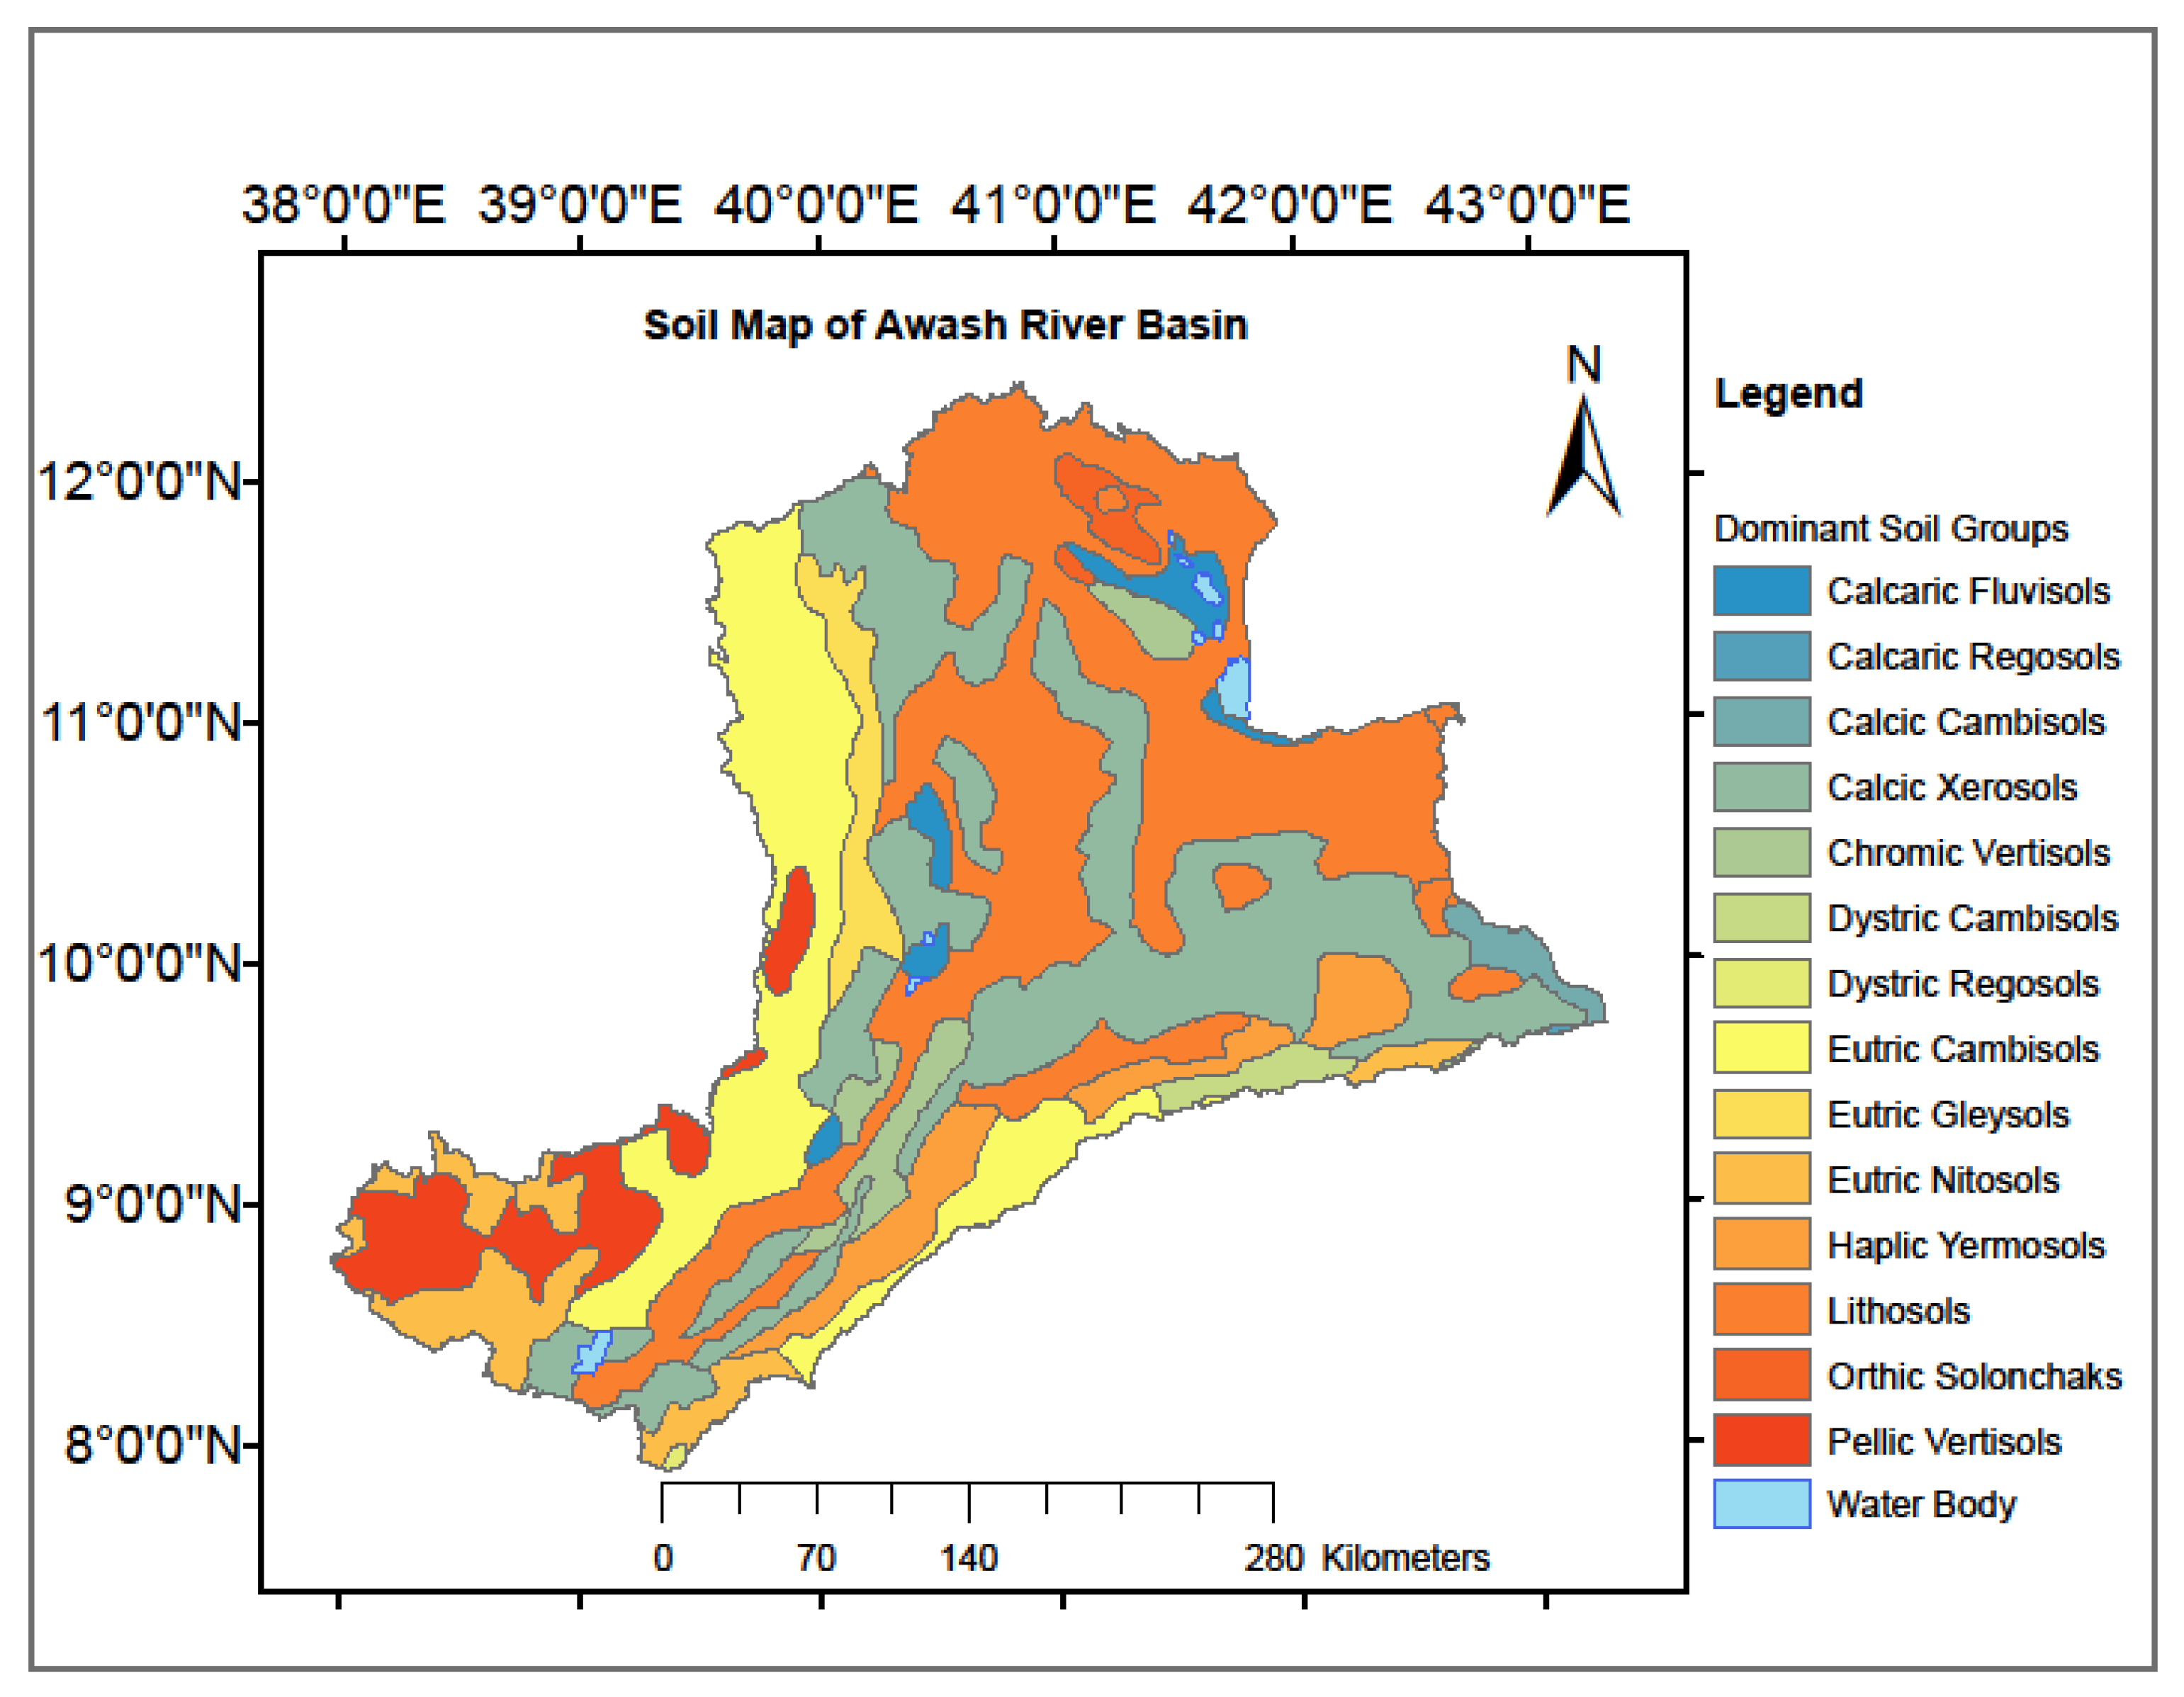
2.1. Study Area
2.2. Data Sources
2.3. Preliminary Data Analysis
2.4. Methods
2.4.1. Soil Water Holding Capacity (SWHC)
2.4.2. GR2M Hydrological Modeling
2.4.3. Satellite Rainfall and Hydrological Model Evaluation Criteria
3. Results and Discussion
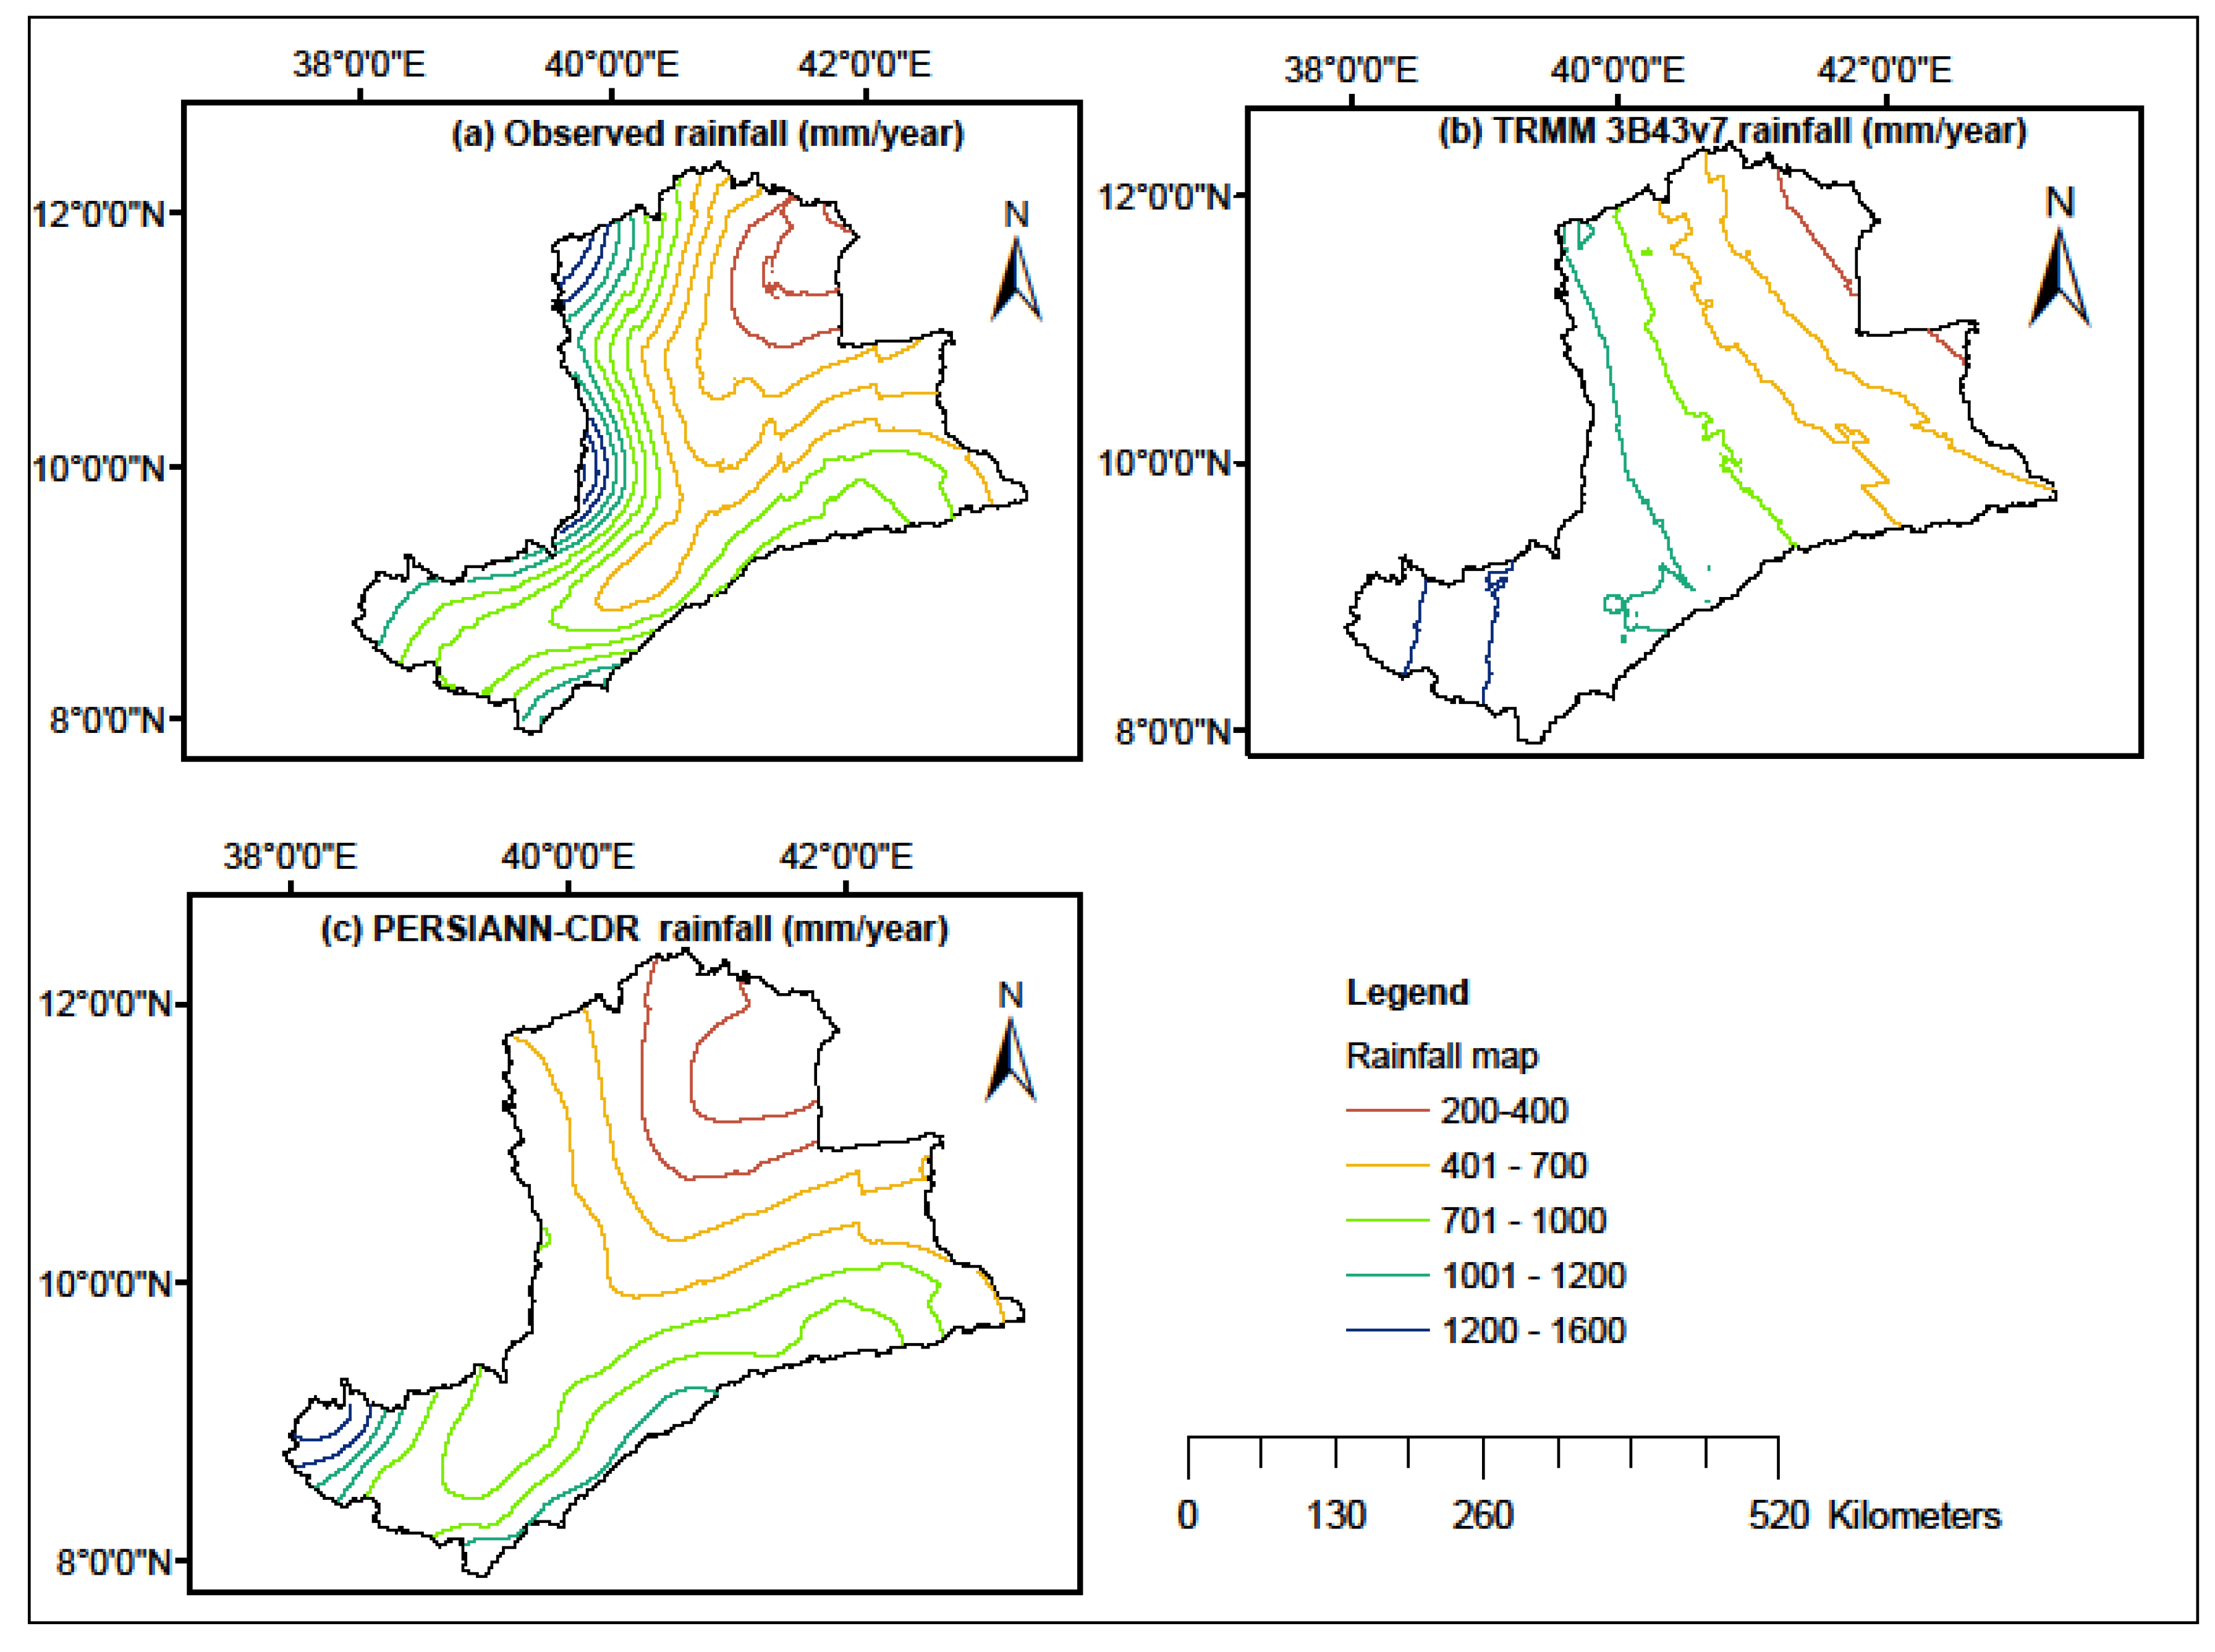
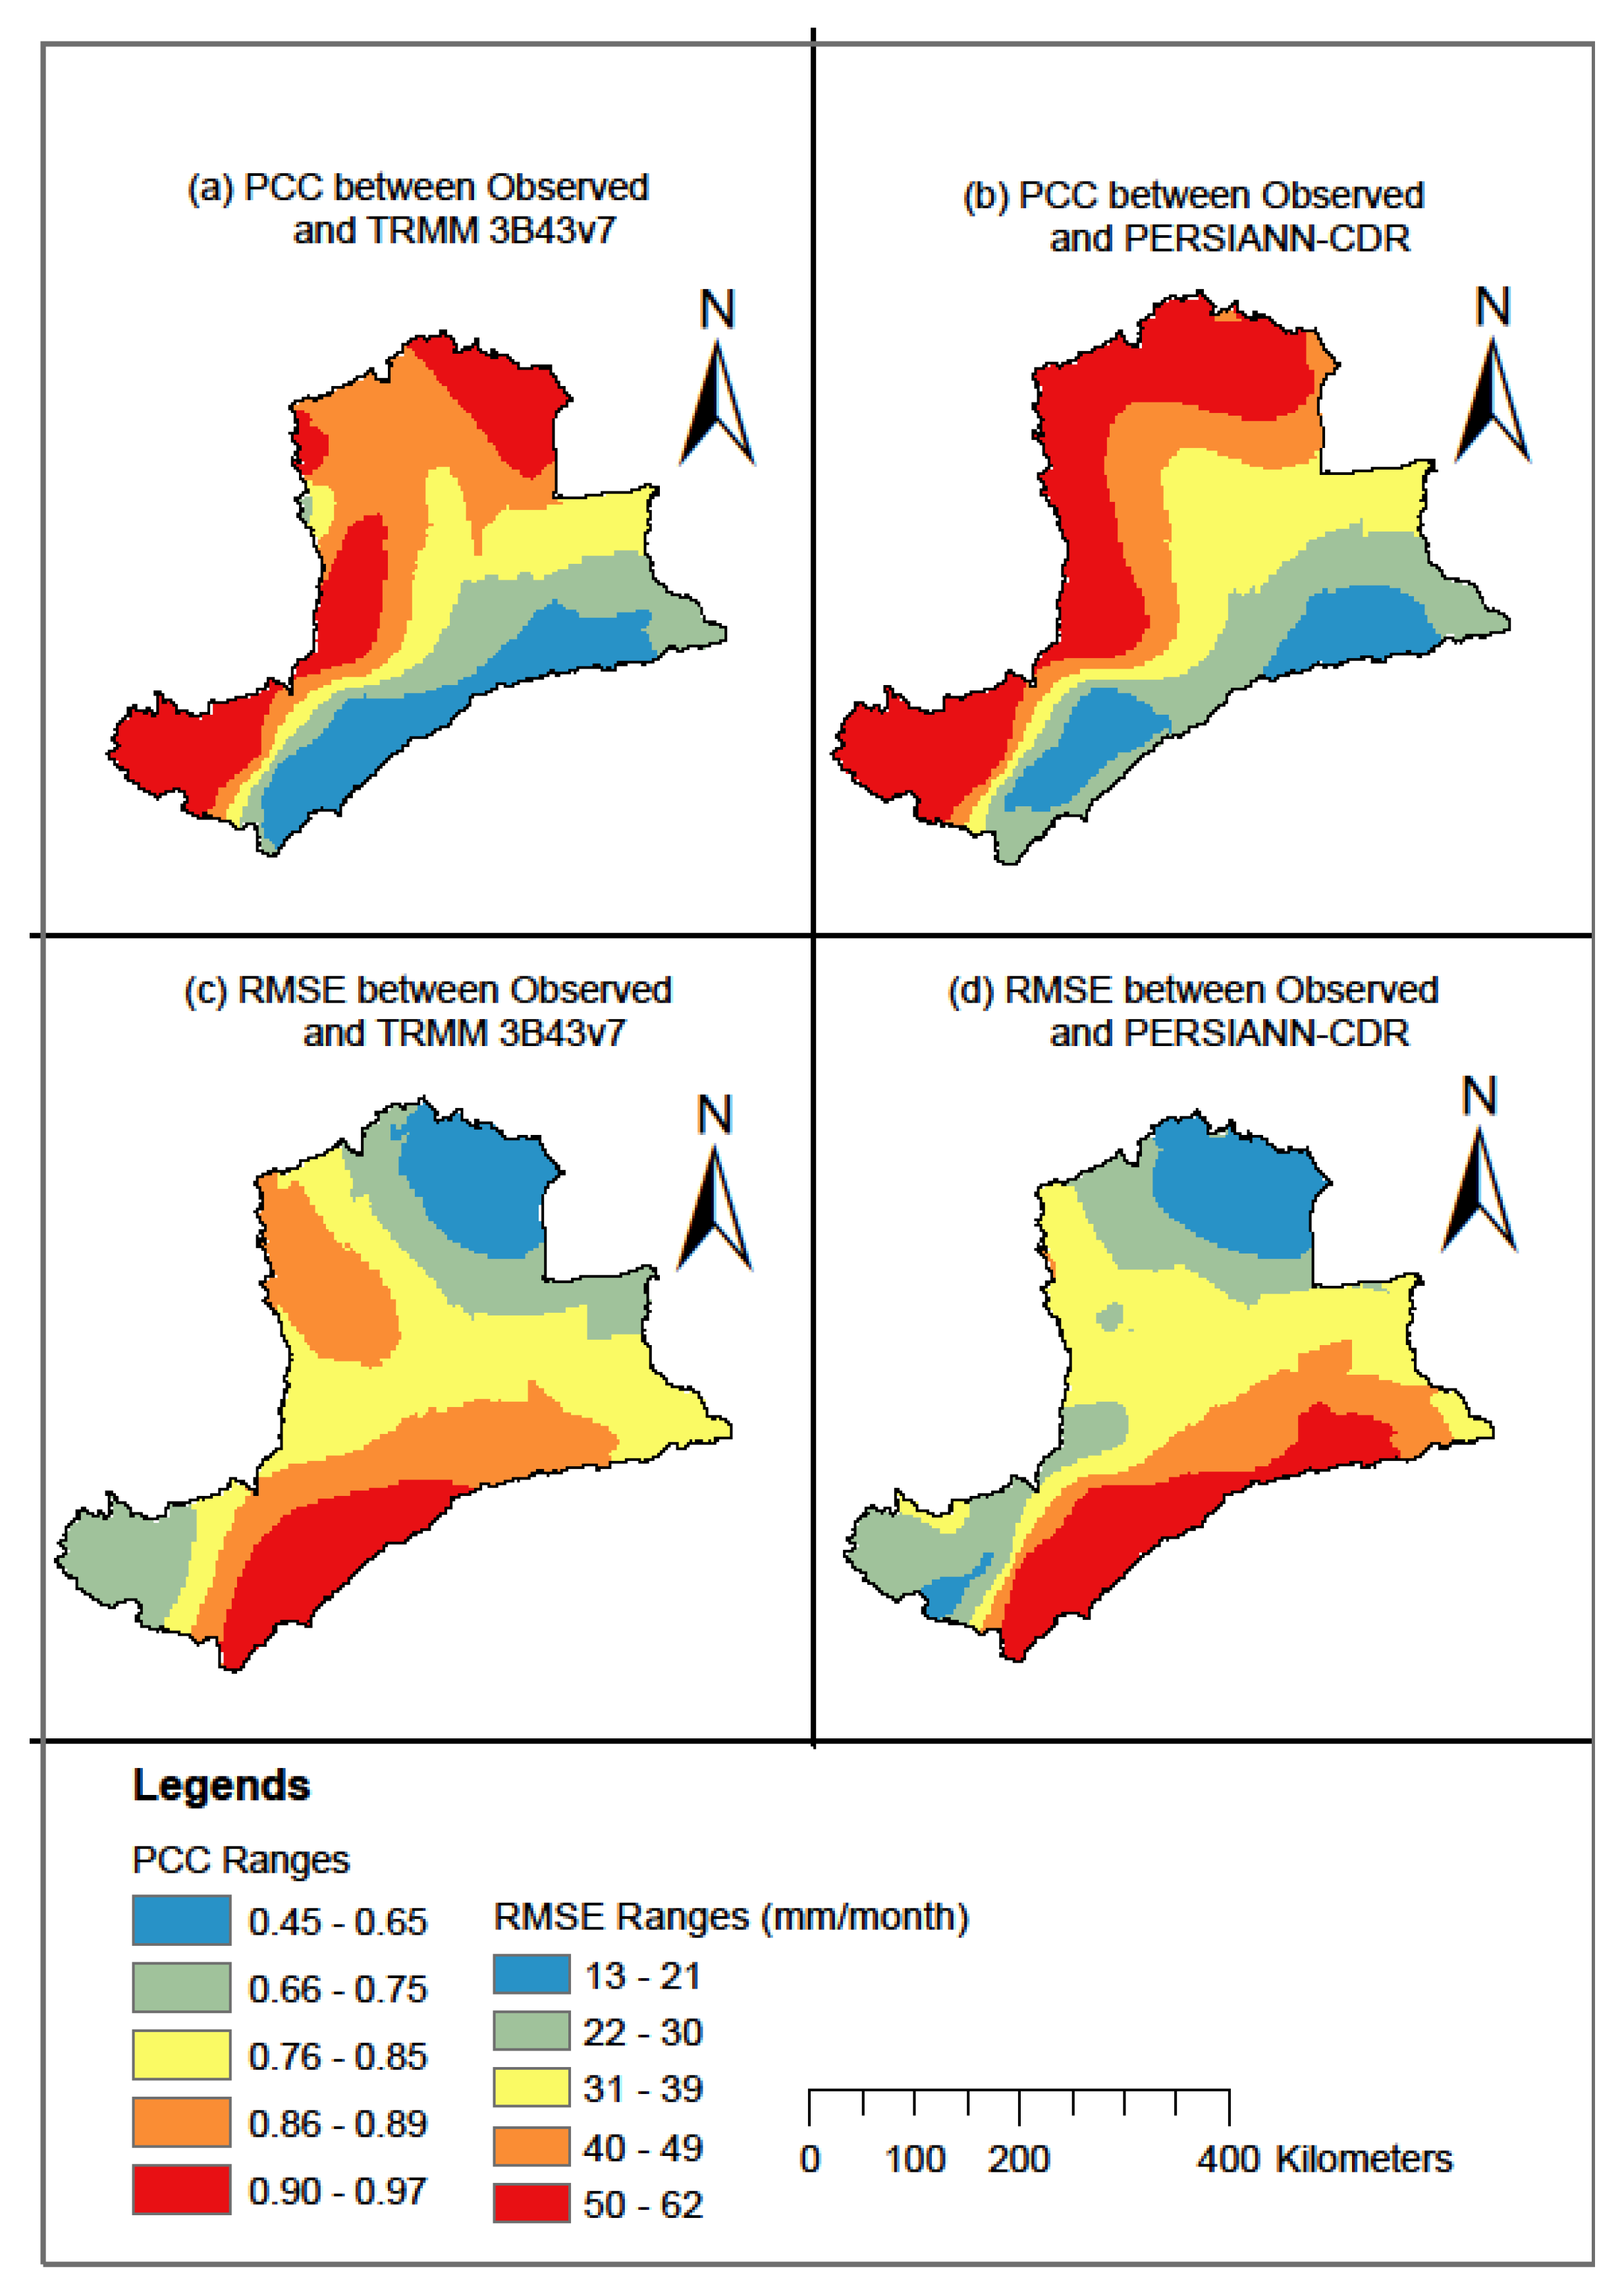
3.1. Comparison of Satellite Rainfall with Observed Rainfall
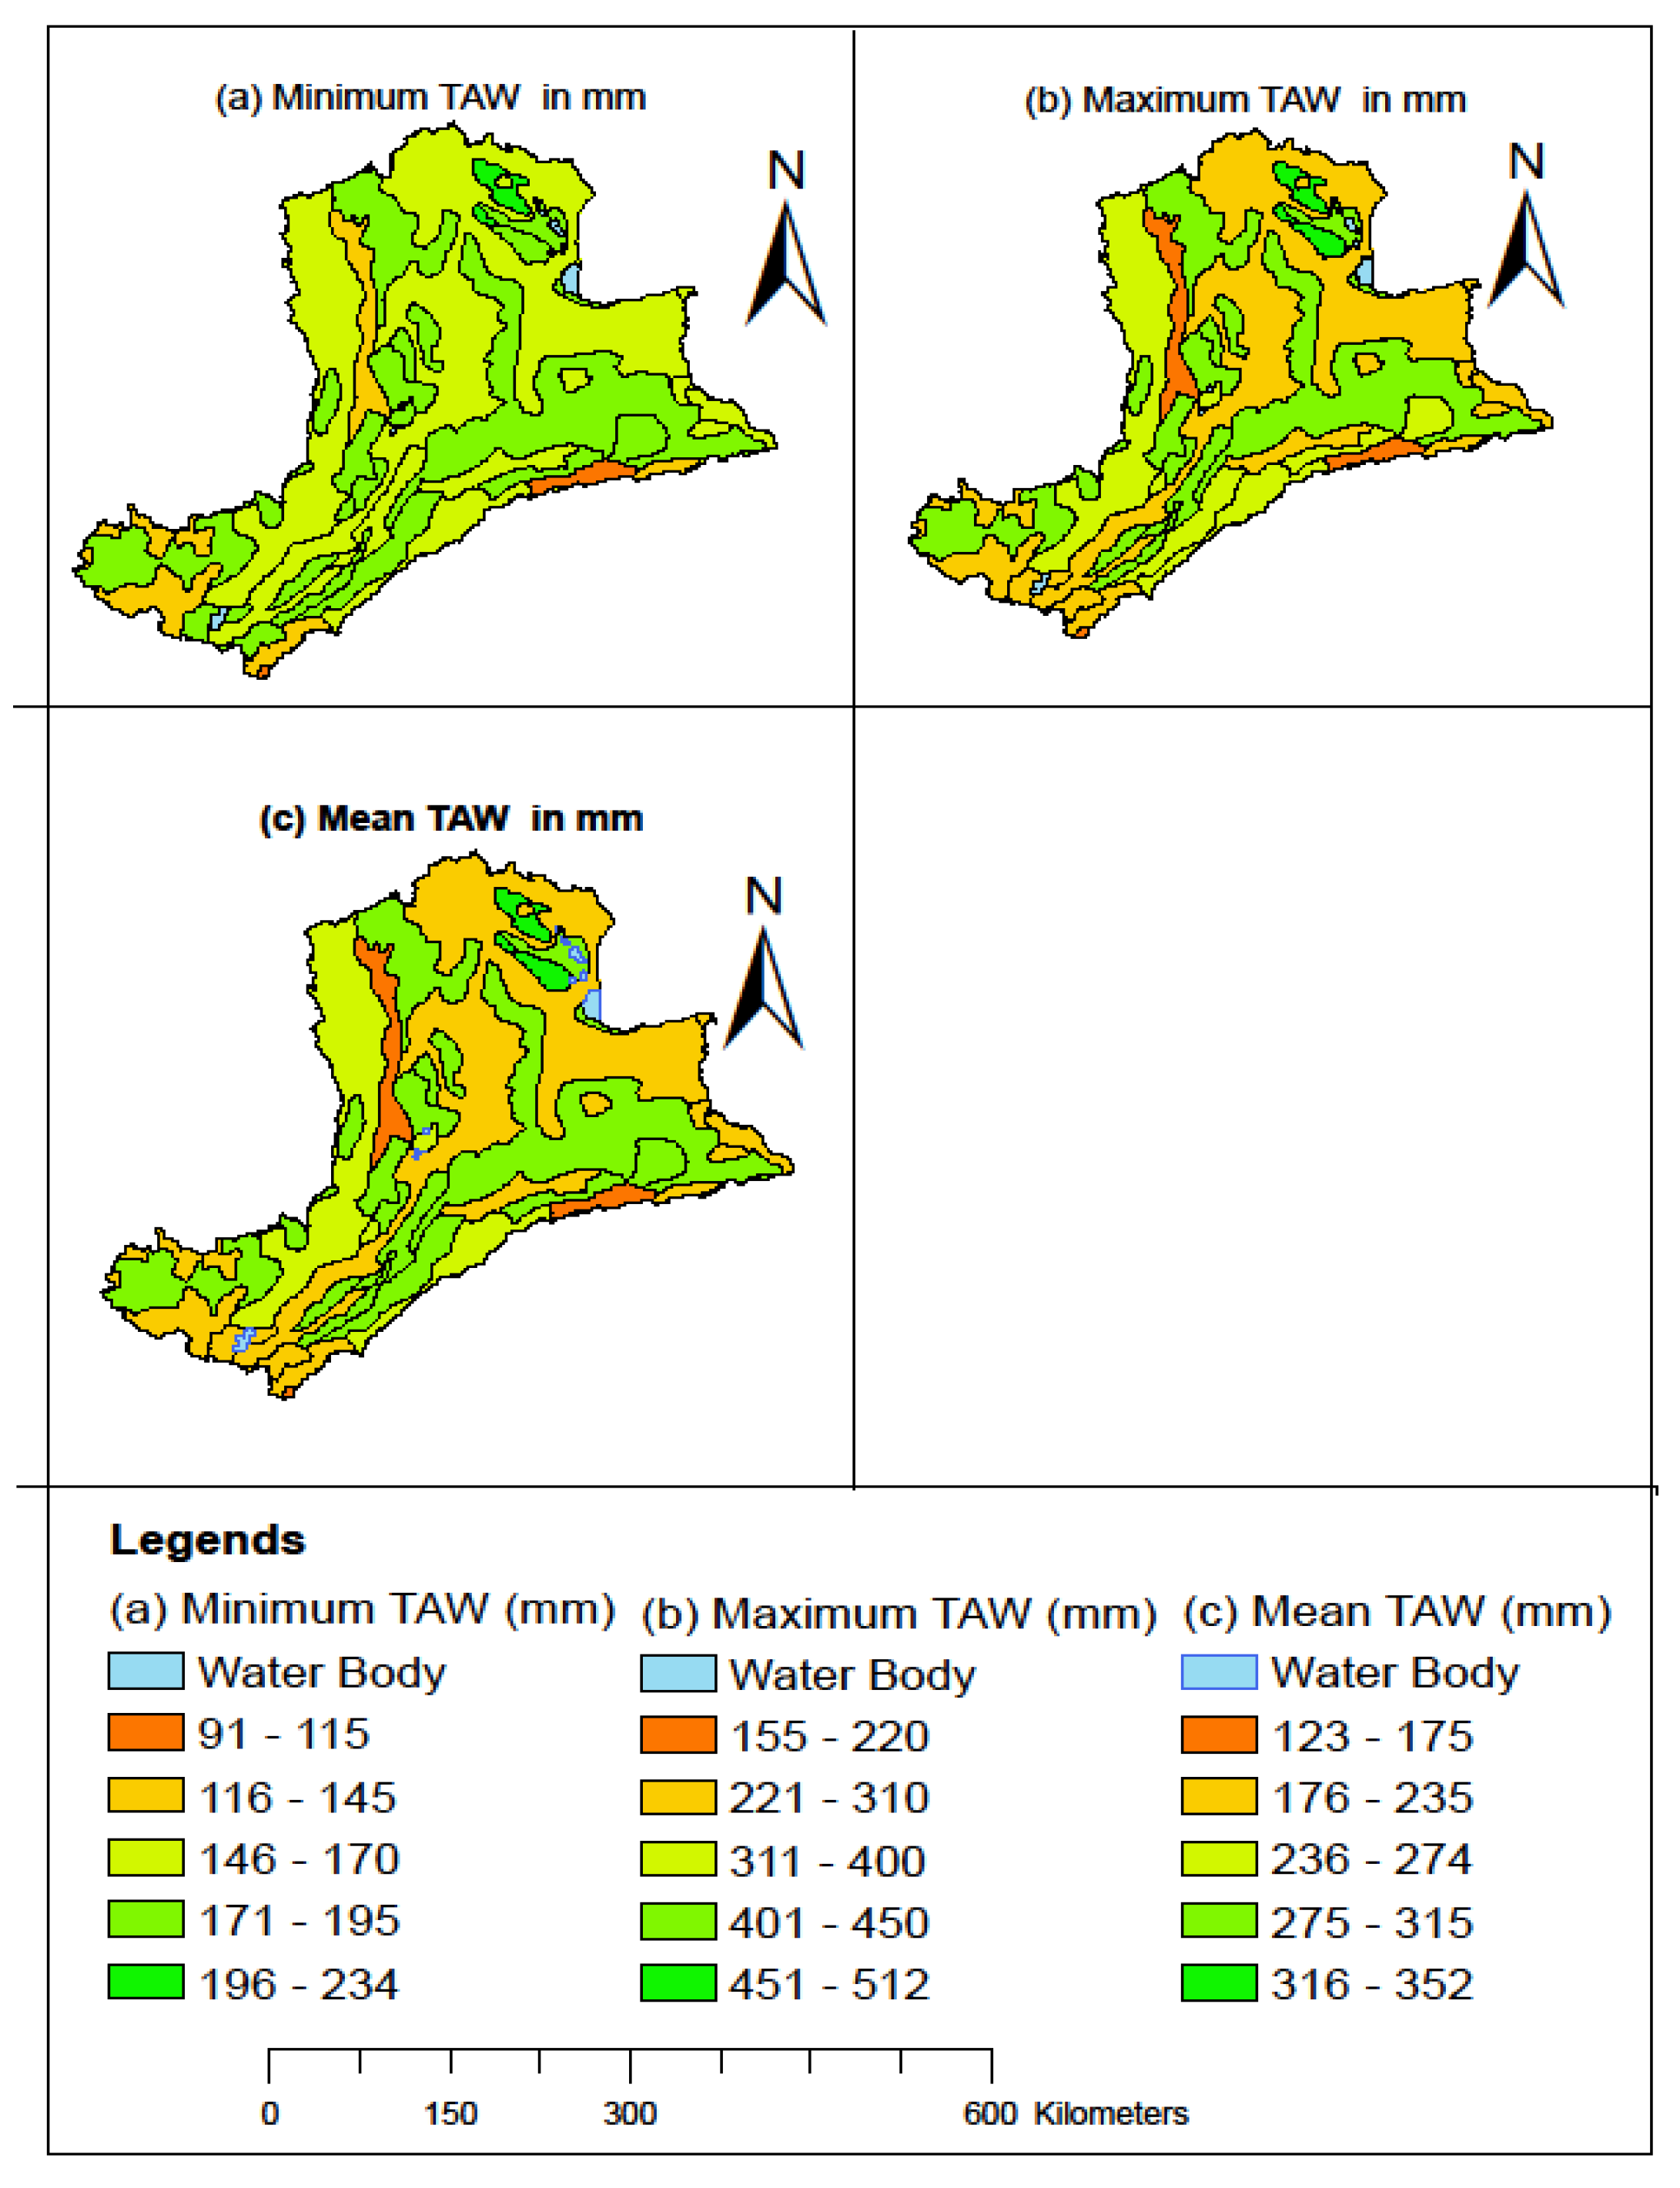
3.2. SWHC/TAW
3.3. GR2M Hydrological Modeling
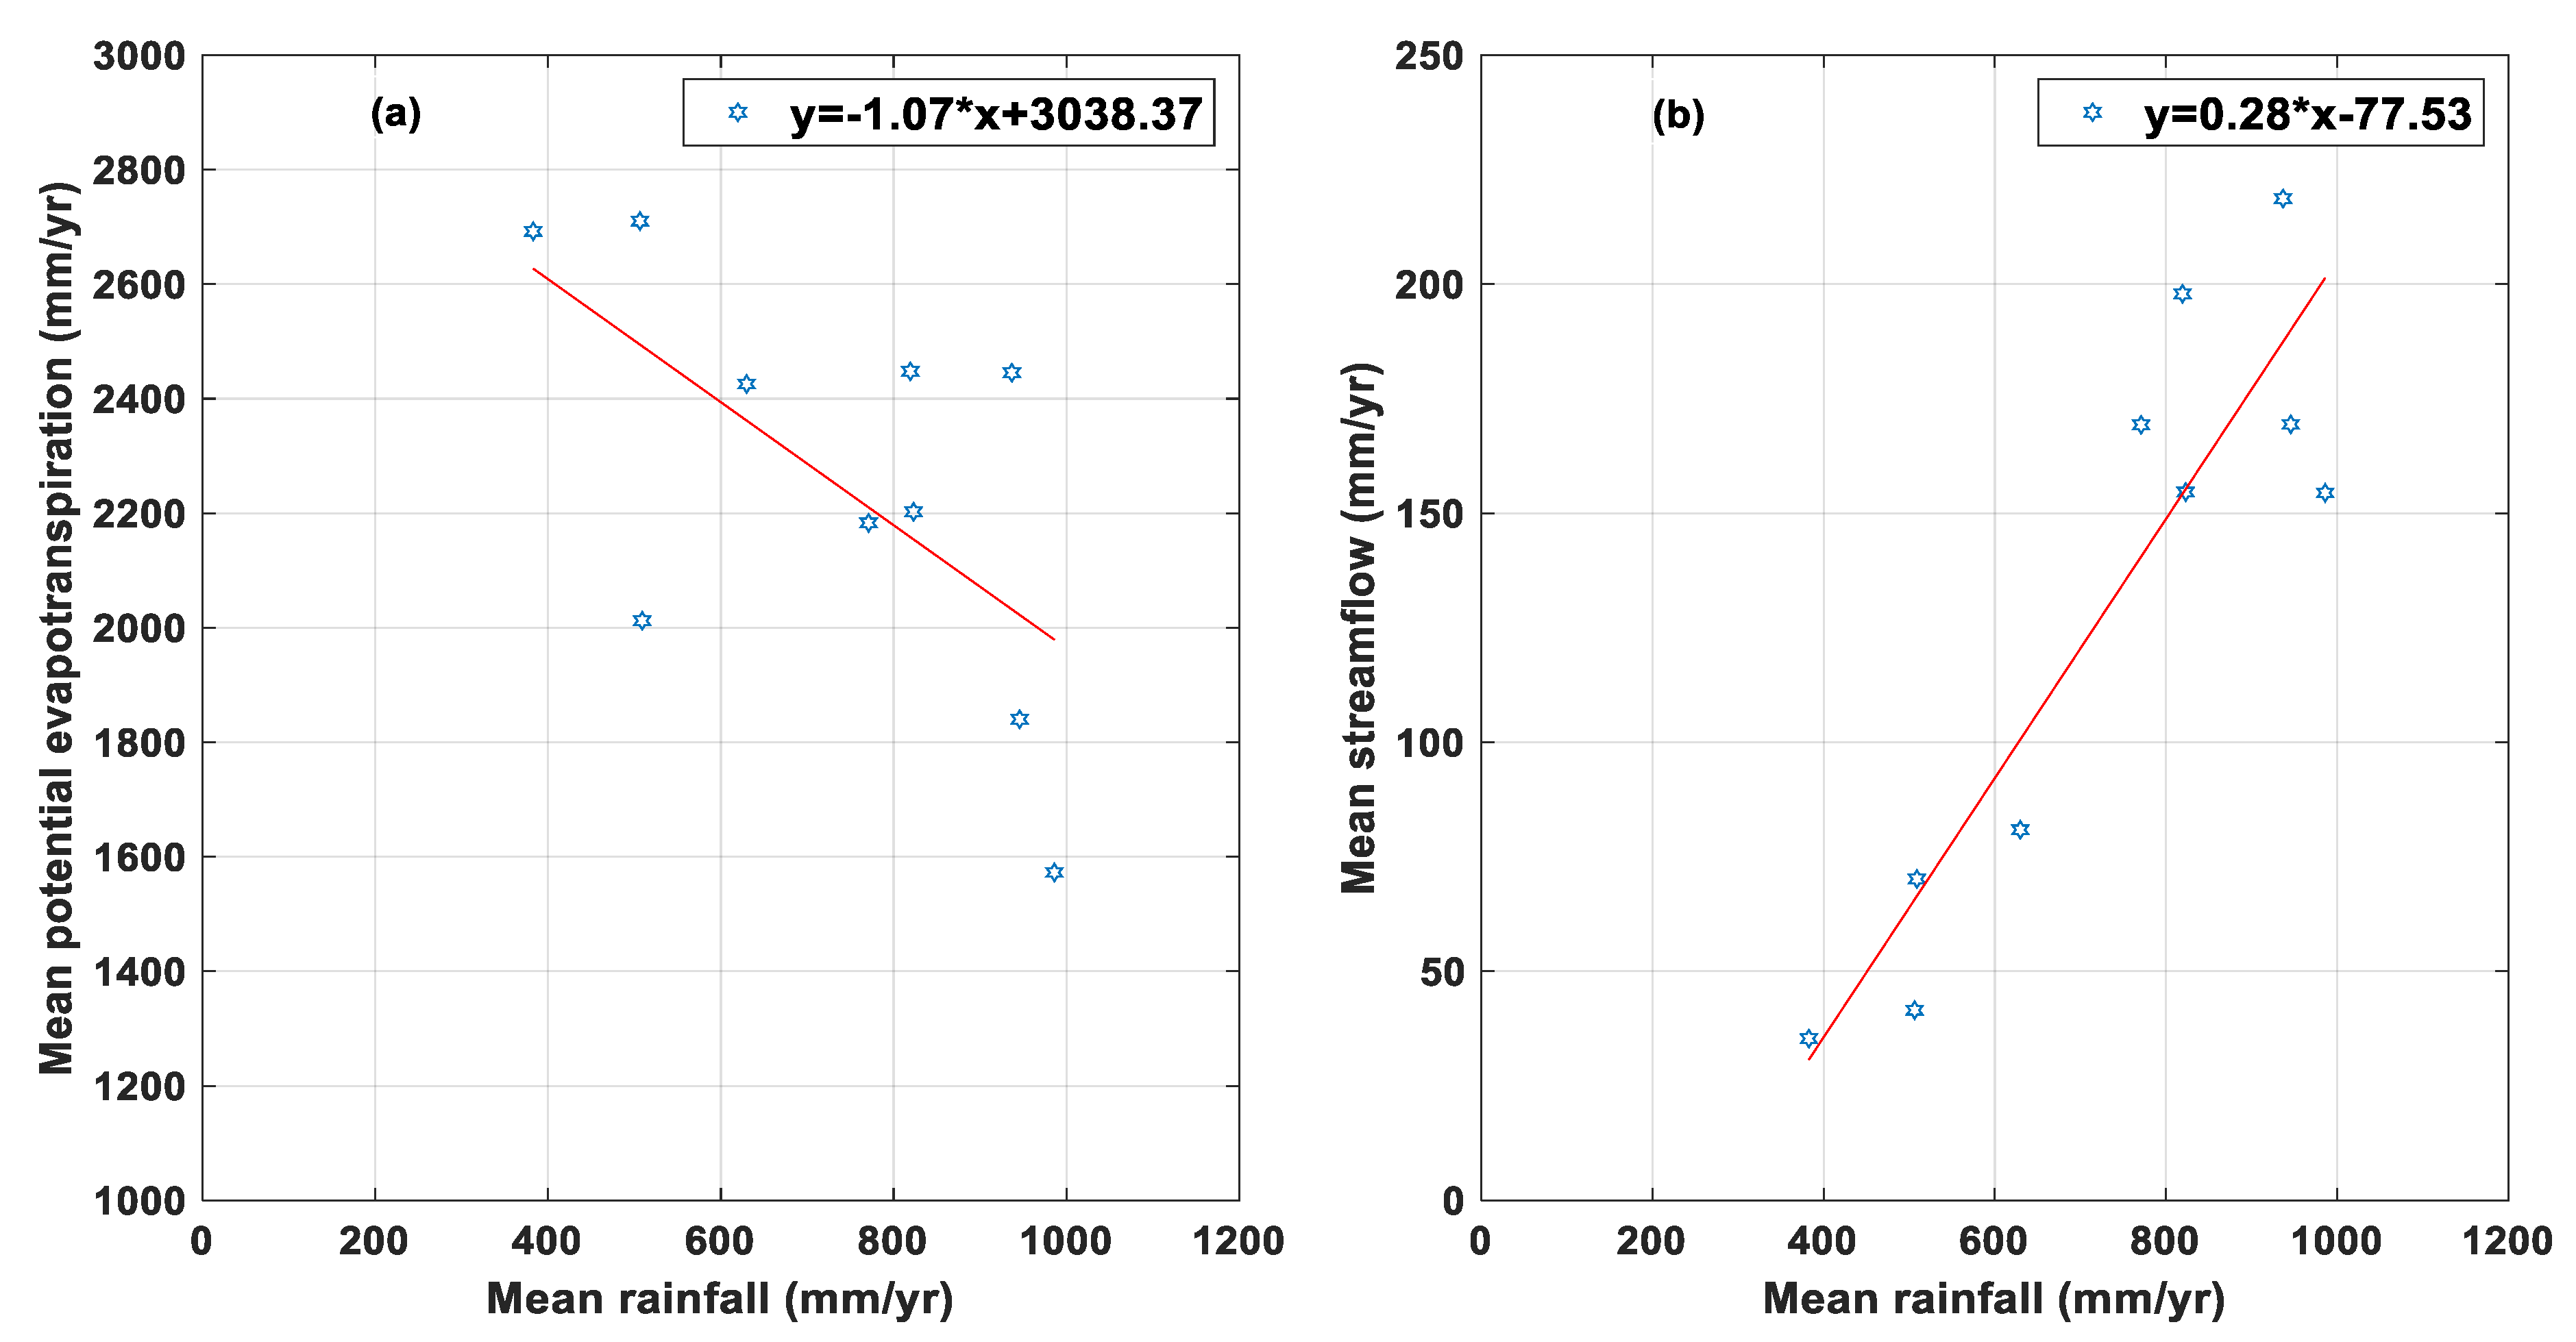
3.3.1. Relationship of Mean PET, Streamflow vs. Rainfall
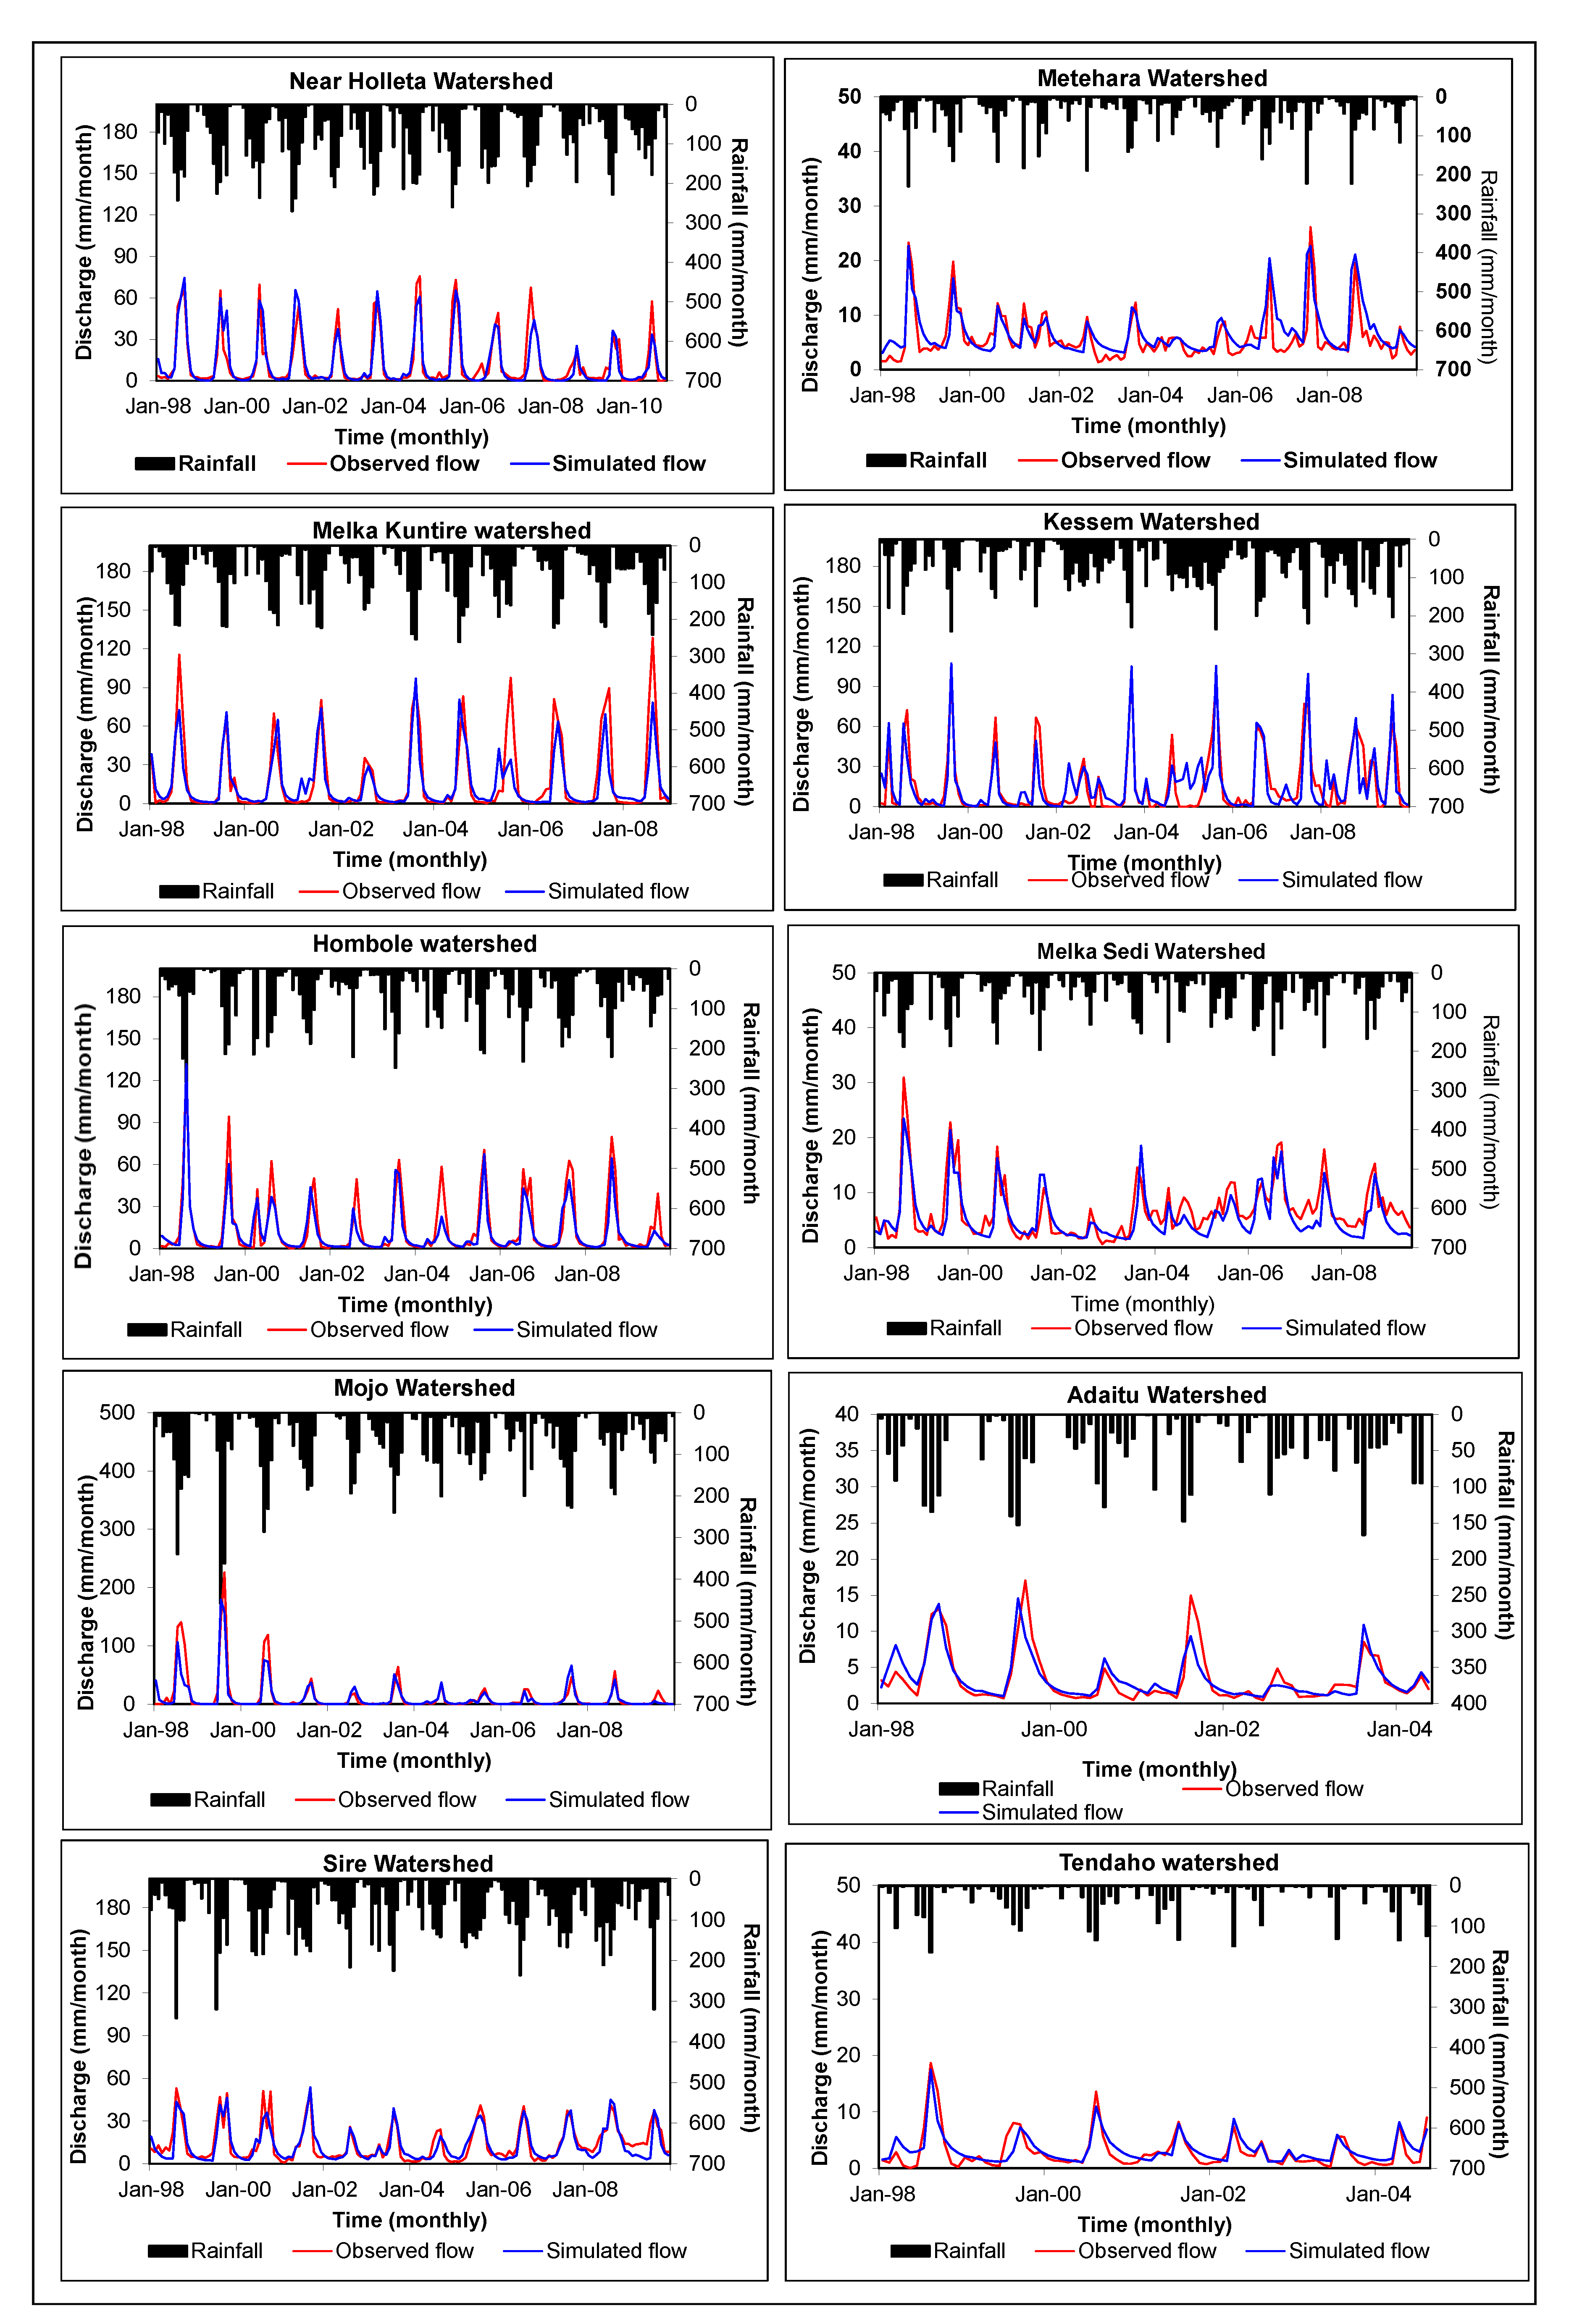
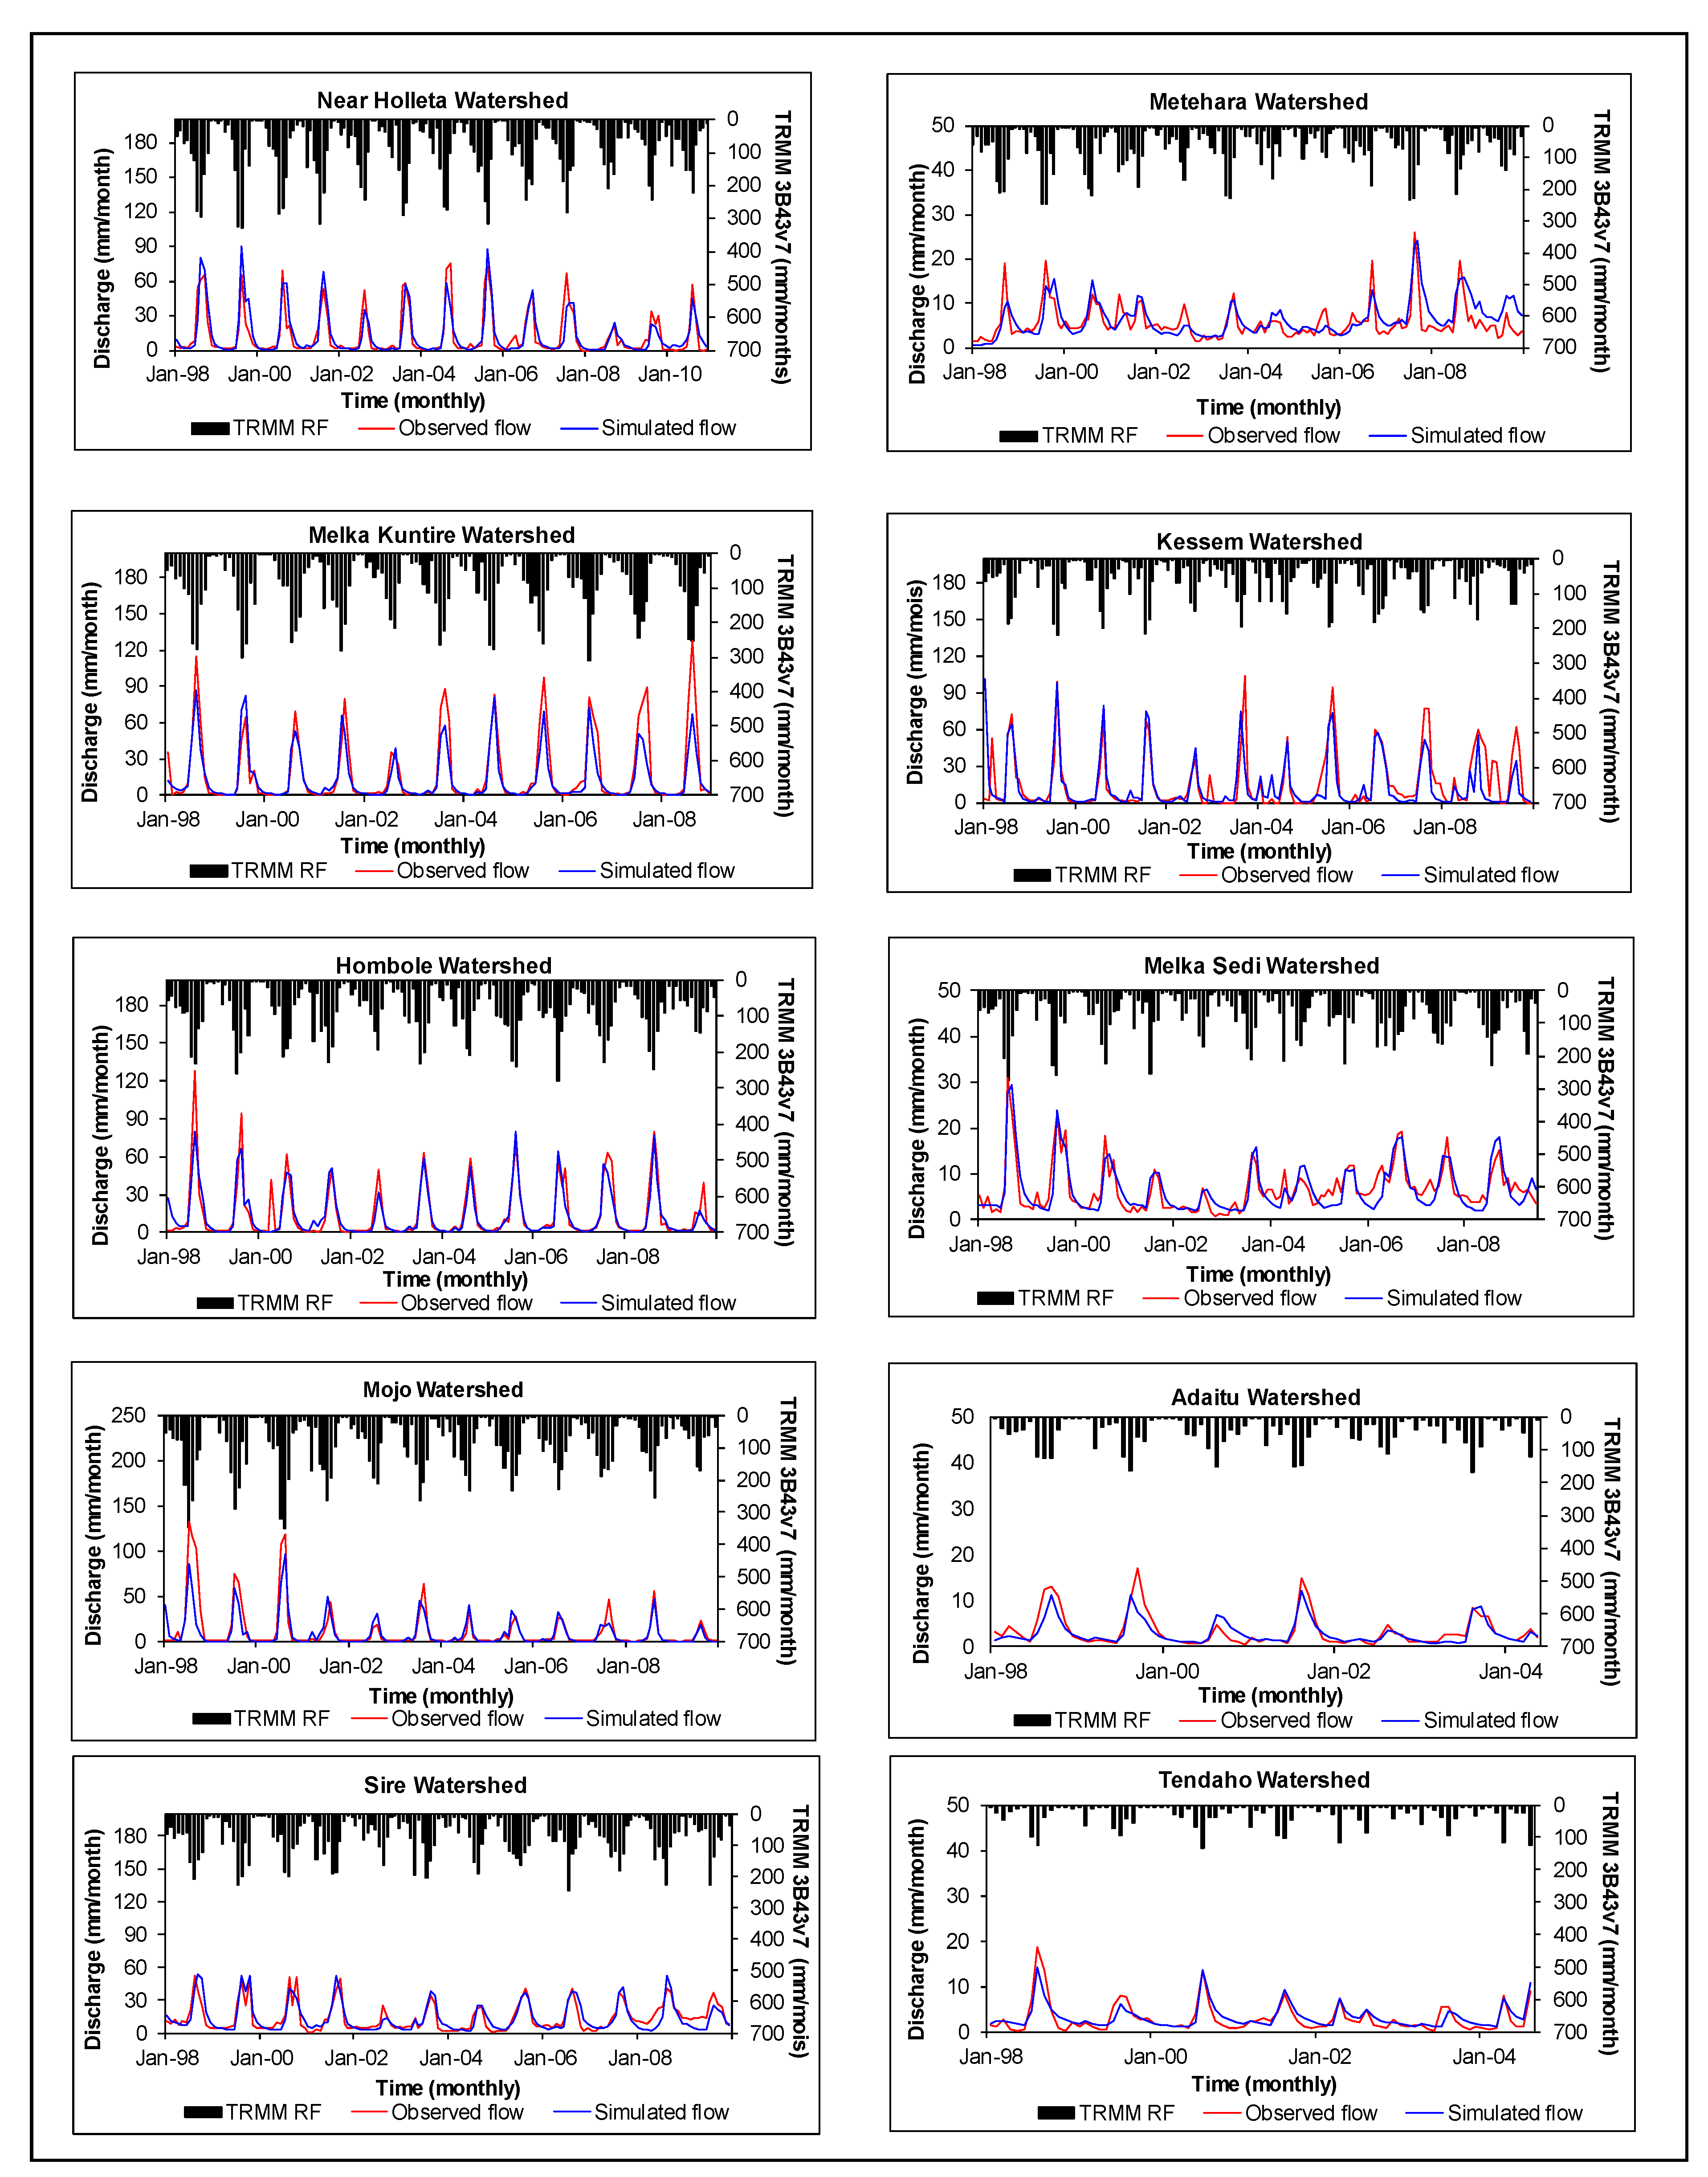
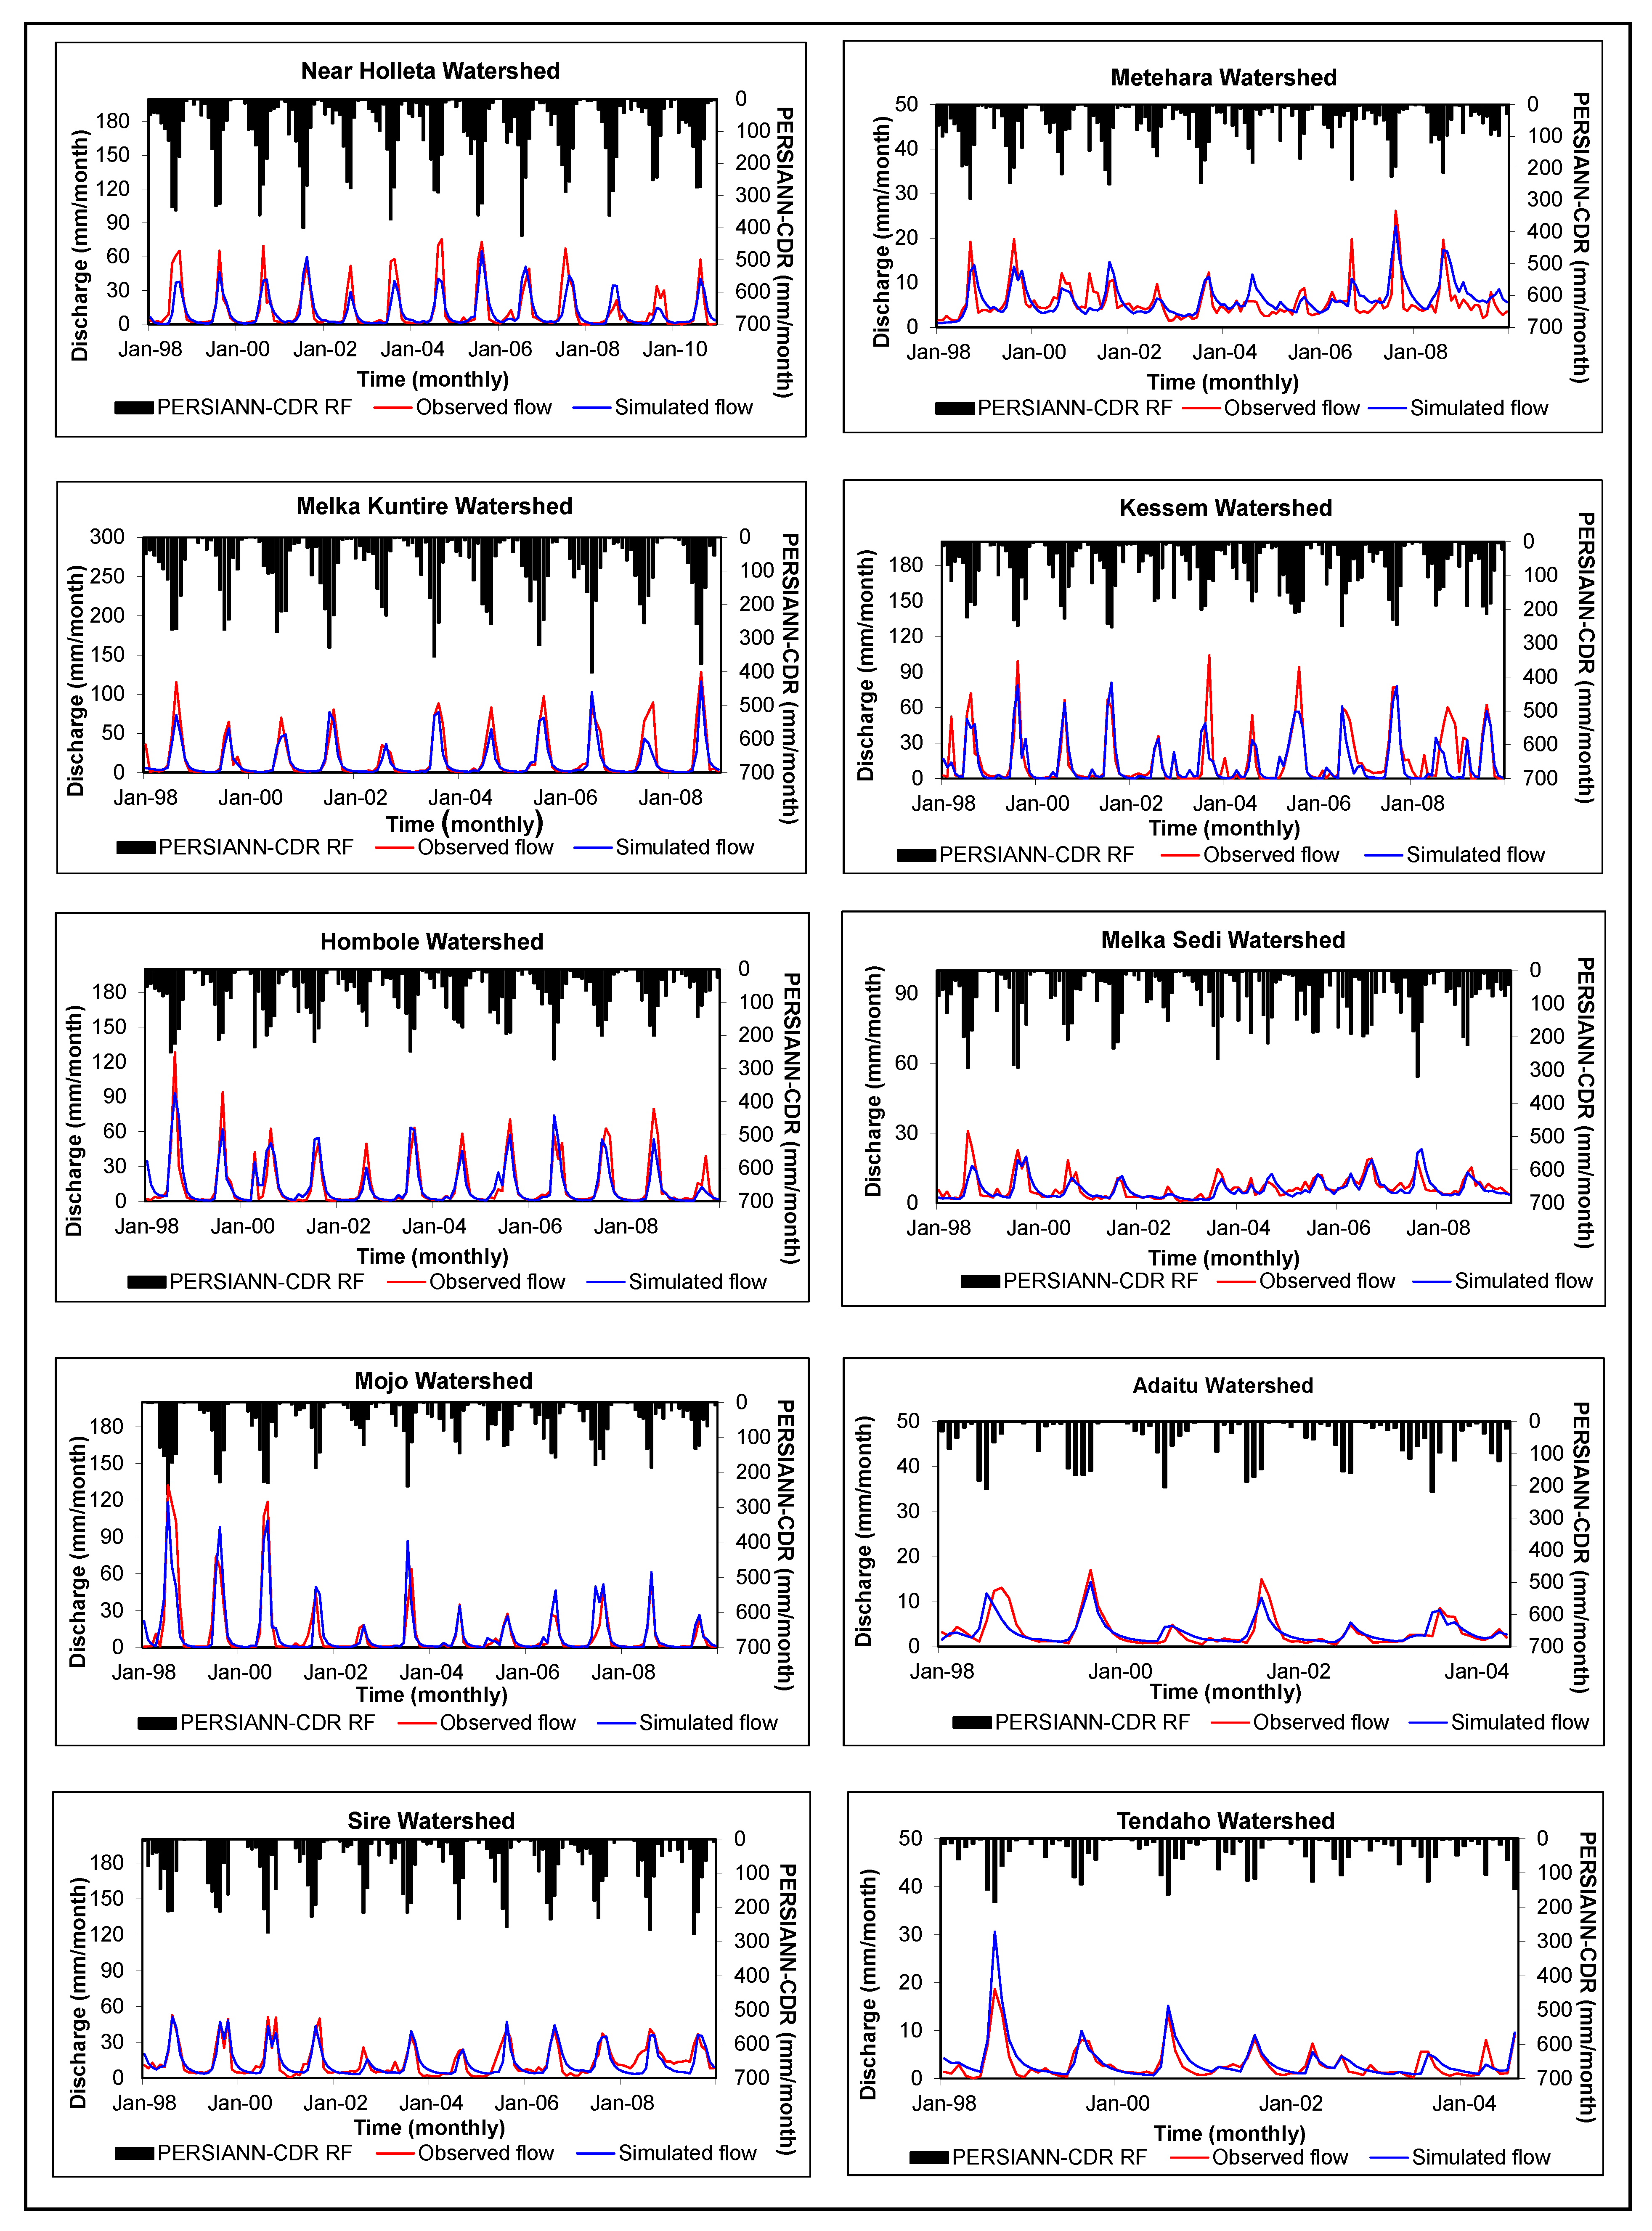
3.3.2. GR2M Model Performance
3.4. Discussion
4. Conclusions and Recommendations
- Both satellite rainfall estimations showed a higher PCC with areal observed rainfall in the Uplands, the Western highlands, and the Lower sub-basins. However, the correlations in the Upper valley and the Eastern catchments of the basin were weak. Therefore, the satellite rainfall data in a watershed that are weakly associated need to be bias-corrected to improve the performance for integration with the GR2M model.
- The findings of the assimilated satellite rainfall products with GR2M model exhibited that 80% of the calibrated and 60% of the validated watersheds in a basin had lower magnitude of PBIAS (<±10), which resulted in better accuracy in flow simulation.
- The hydrologic model validation results revealed that 80% of the validated watersheds using observed and satellite rainfall data sets showed a “good” or higher performance rating when the NSE and RSR were used as evaluation criteria. In contrast, 20% of them were unsatisfactory for integration with the GR2M model.
- The PBIAS results showed that the majority of the rainfall dataset of the watershed (73%) underestimated the simulated flow while integrating with the GR2M model. A higher PBIAS value, indicating unsatisfactory results, was observed only in the Melka Kuntire (TRMM 3B43v7 and PERSIANN-CDR), Mojo (PERSIANN-CDR), Metehara (all rainfall data set), and Kessem (TRMM 3B43v7) watersheds.
- Integrating these satellite rainfall data, particularly in data-scarce basins, with hydrological data generally appears to be useful in the environmentally diversified climate and topography of ARB. However, this requires validation with the ground-observed data.
- In general, this conceptual lumped model displayed better performance in majority of the ARB parts and is recommended to be tested in other river basins of Ethiopia for effective water resource planning and management.
Author Contributions
Funding
Institutional Review Board Statement
Informed Consent Statement
Data Availability Statement
Acknowledgments
Conflicts of Interest
References
- Pande, S.; Savenije, H.H.G.; Bastidas, L.A.; Gosain, A.K. A Parsimonious hydrological model for a data scarce dryland region. Water Resour. Manag. 2011, 26, 909–926. [Google Scholar] [CrossRef] [Green Version]
- Tarawneh, E.; Bridge, J.; Macdonald, N. A pre-calibration approach to select optimum inputs for hydrological models in data-scarce regions. Hydrol. Earth Syst. Sci. 2016, 20, 4391–4407. [Google Scholar] [CrossRef] [Green Version]
- Dinku, T. Challenges with availability and quality of climate data in Africa. In Extreme Hydrology and Climate Variability; Melesse, A.M., Abtew, W., Senay, G.B., Eds.; Elsevier: Amsterdam, The Netherlands, 2019; pp. 71–80. ISBN 978-0-12-815998-9. [Google Scholar]
- Tegegne, G.; Park, D.K.; Kim, Y.-O. Comparison of hydrological models for the assessment of water resources in a data-scarce region, the upper blue nile river basin. J. Hydrol. Reg. Stud. 2017, 14, 49–66. [Google Scholar] [CrossRef]
- Tegegne, G.; Park, D.K.; Kim, Y.; Kim, Y.-O. Selecting hydrologic modelling approaches for water resource assessment in the Yongdam watershed. J. Hydrol. 2017, 56, 155. [Google Scholar]
- Dinku, T.; Ceccato, P.; Grover-Kopec, E.; Lemma, M.; Connor, S.J.; Ropelewski, C.F. Validation of satellite rainfall products over East Africa’s complex topography. Int. J. Remote Sens. 2007, 28, 1503–1526. [Google Scholar] [CrossRef]
- Hirpa, F.A.; Gebremichael, M.; Hopson, T. Evaluation of high-resolution satellite precipitation products over very complex terrain in ethiopia. J. Appl. Meteorol. Clim. 2010, 49, 1044–1051. [Google Scholar] [CrossRef]
- Bekele, D.; Alamirew, T.; Kebede, A.; Zeleke, G.; Melesse, A.M. Land use and land cover dynamics in the Keleta watershed, Awash River basin, Ethiopia. Environ. Hazards 2018, 18, 246–265. [Google Scholar] [CrossRef]
- Korecha, D.; Barnston, A.G. Predictability of june–september rainfall in ethiopia. Mon. Weather Rev. 2007, 135, 628–650. [Google Scholar] [CrossRef]
- Keraga, A.S.; Kiflie, Z.; Engida, A.N. Spatial and temporal water quality dynamics of Awash River using multivariate statistical techniques. Afr. J. Environ. Sci. Technol. 2017, 11, 565–577. [Google Scholar]
- Nigatu Mersha, A.; de Fraiture, C.; Mehari, A.; Masih, I.; Alamirew, T. Integrated water resources management: Contrasting principles, policy, and practice, Awash River Basin, Ethiopia. Water Policy 2016, 18, 335–354. [Google Scholar] [CrossRef]
- Castiglioni, S.; Lombardi, L.; Toth, E.; Castellarin, A.; Montanari, A. Calibration of rainfall-runoff models in ungauged basins: A regional maximum likelihood approach. Adv. Water Resour. 2010, 33, 1235–1242. [Google Scholar] [CrossRef]
- Ibrahim, B.; Wisser, D.; Barry, B.; Fowe, T.; Aduna, A. Hydrological predictions for small ungauged watersheds in the Sudanian zone of the Volta basin in West Africa. J. Hydrol. Reg. Stud. 2015, 4, 386–397. [Google Scholar] [CrossRef] [Green Version]
- Montanari, A.; Castiglioni, S.; Castellarin, A. Calibration of rainfall-runoff models in ungauged basins: A regional approach. AGUFM 2009, 2009, H21F-0911. [Google Scholar]
- Dakhlaoui, H.; Ruelland, D.; Tramblay, Y.; Bargaoui, Z. Evaluating the robustness of conceptual rain-fall-runoff models under climate variability in northern Tunisia. J. Hydrol. 2017, 550, 201–217. [Google Scholar] [CrossRef]
- Niel, H.; Paturel, J.-E.; Servat, E. Study of parameter stability of a lumped hydrologic model in a context of climatic variability. J. Hydrol. 2003, 278, 213–230. [Google Scholar] [CrossRef]
- Coron, L.; Thirel, G.; Delaigue, O.; Perrin, C.; Andréassian, V. The suite of lumped GR hydrological models in an R package. Environ. Model. Softw. 2017, 94, 166–171. [Google Scholar] [CrossRef]
- Folton, N.; Lavabre, J. Regionalization of a monthly rainfall-runoff model for the southern half of France based on a sample of 880 gauged catchments. IAHS Publ. 2006, 307, 264. [Google Scholar]
- Makhlouf, Z.; Michel, C. A two-parameter monthly water balance model for French watersheds. J. Hydrol. 1994, 162, 299–318. [Google Scholar] [CrossRef]
- Casimiro, W.S.L.; Labat, D.; Guyot, J.L.; Ronchail, J.; Ordonez, J.J. TRMM rainfall data estimation over the Peruvian Amazon-Andes basin and its assimilation into a monthly water balance model. In Proceedings of the New Approaches to Hydrological Prediction in Datasparse Regions, Proceedings of Symposium HS, Hyderabad, India, 6–12 September 2009; Volume 2, pp. 207–216. [Google Scholar]
- Rau, P.; Bourrel, L.; Labat, D.; Ruelland, D.; Frappart, F.; Lavado, W.; Dewitte, B.; Felipe, O. Assessing multidecadal runoff (1970–2010) using regional hydrological modelling under data and water scarcity conditions in Peruvian Pacific catchments. Hydrol. Process. 2019, 33, 20–35. [Google Scholar] [CrossRef] [Green Version]
- Lyon, S.W.; King, K.; Polpanich, O.; Lacombe, G. Assessing hydrologic changes across the Lower Mekong Basin. J. Hydrol. Reg. Stud. 2017, 12, 303–314. [Google Scholar] [CrossRef]
- Zolfaghari, M.; Mahdavi, M.; Rezaei, A.; Salajegheh, A. Evaluating GR2M model in some small watersheds of Iran (Case study Gilan and Mazandaran Provinces). J. Basic Appl. Sci. Res. 2013, 3, 463–472. [Google Scholar]
- Bachir, S.; Nouar, B.; Hicham, C.; Azzedine, H.; Larbi, D. Application of GR2M for rainfall-runoff modeling in Kébir Rhumel Watershed, north east of Algeria. World Appl. Sci. J. 2015, 33, 1623–1630. [Google Scholar]
- Boulariah, O.; Longobardi, A.; Meddi, M. Statistical comparison of nonlinear rainfall-runoff models for simulation in Africa North-West semi-arid areas. In Proceedings of the 15th International Conference on Environment Science and Technology, Rhodes, Greece, 31 August–2 September 2017. [Google Scholar]
- Nounangnonhou, T.C.; Fifatin, F.; Lokonon, B.E.; Acakpovi, A.; Sanya, E.A. Modelling and prediction of Ouémé (Bénin) river flows by 2040 based on GR2M approach. LARHYSS J. 2018, 33, 71–91. [Google Scholar]
- Ibrahim, B.; Karambiri, H.; Polcher, J. Hydrological Impacts of the changes in simulated rainfall fields on nakanbe basin in burkina faso. Climate 2015, 3, 442–458. [Google Scholar] [CrossRef] [Green Version]
- Tadesse, A.; Dai, W. Prediction of sedimentation in reservoirs by combining catchment based model and stream based model with limited data. Int. J. Sediment Res. 2019, 34, 27–37. [Google Scholar] [CrossRef]
- Setegn, S.G.; Srinivasan, R.; Dargahi, B. Hydrological Modelling in the Lake Tana Basin, Ethiopia Using SWAT Model. Open Hydrol. J. 2008, 2, 49–62. [Google Scholar] [CrossRef] [Green Version]
- Mekonnen, M.A.; Wörman, A.; Dargahi, B.; Gebeyehu, A. Hydrological modelling of Ethiopian catchments using limited data. Hydrol. Process. 2009, 23, 3401–3408. [Google Scholar] [CrossRef]
- Uhlenbrook, S.; Mohamed, Y.; Gragne, A.S. Analyzing catchment behavior through catchment modeling in the Gilgel Abay, Upper Blue Nile River Basin, Ethiopia. Hydrol. Earth Syst. Sci. 2010, 14, 2153–2165. [Google Scholar] [CrossRef] [Green Version]
- Abdo, K.S.; Fiseha, B.M.; Rientjes, T.H.M.; Gieske, A.S.M.; Haile, A.T. Assessment of climate change impacts on the hydrology of Gilgel Abay catchment in Lake Tana Basin, Ethiopia. Hydrol. Process. 2009, 23, 3661–3669. [Google Scholar] [CrossRef]
- Rodriguez, E.; Sanchez, I.; Duque, N.; Lopez, P.; Kaune, A.; Werner, M.; Arboleda, P. Combined use of local and global hydrometeorological data with regional and global hydrological models in the Magdalena-Cauca river basin, Colombia. In Proceedings of the EGU General Assembly Conference Abstracts, Vienna, Austria, 23–28 April 2017; p. 10477. [Google Scholar]
- National Meteorology Agency of Ethiopia Meteorological Station Information. Available online: http://www.ethiomet.gov.et/stations/information (accessed on 19 May 2020).
- Dinku, T.; Connor, S.J.; Ceccato, P. Comparison of CMORPH and TRMM-3B42 over mountainous regions of Africa and South America. In Satellite Rainfall Applications for Surface Hydrology; Gebremichael, M., Hossain, F., Eds.; Springer: Dordrecht, The Netherlands, 2010; pp. 193–204. [Google Scholar]
- Li, X.; Zhang, Q.; Xu, C.-Y. Assessing the performance of satellite-based precipitation products and its de-pendence on topography over Poyang Lake basin. Theor. Appl. Climatol. 2014, 115, 713–729. [Google Scholar] [CrossRef]
- Stisen, S.; Sandholt, I. Evaluation of remote-sensing-based rainfall products through predictive capability in hydrological runoff modelling. Hydrol. Process. 2010, 24, 879–891. [Google Scholar] [CrossRef]
- Gella, G.W. Statistical evaluation of high resolution satellite precipitation products in arid and semi-arid parts of Ethiopia: A note for hydro-meteorological applications. Water Environ. J. 2018, 33, 86–97. [Google Scholar] [CrossRef]
- Romilly, T.G.; Gebremichael, M. Evaluation of satellite rainfall estimates over Ethiopian river basins. Hydrol. Earth Syst. Sci. 2011, 15, 1505–1514. [Google Scholar] [CrossRef] [Green Version]
- Adeba, D.; Kansal, M.L.; Sen, S. Assessment of water scarcity and its impacts on sustainable development in Awash basin, Ethiopia. Sustain. Water Resour. Manag. 2015, 1, 71–87. [Google Scholar] [CrossRef] [Green Version]
- Adane, G.B.; Hirpa, B.A.; Lim, C.-H.; Lee, W.-K. Spatial and temporal analysis of dry and wet spells in up-per awash river basin, ethiopia. Water 2020, 12, 3051. [Google Scholar] [CrossRef]
- Karimi, P.; Bastiaanssen, W.G.M. Spatial evapotranspiration, rainfall and land use data in water accounting—Part 1: Review of the accuracy of the remote sensing data. Hydrol. Earth Syst. Sci. 2015, 19, 507–532. [Google Scholar] [CrossRef] [Green Version]
- Adane, G.B.; Hirpa, B.A.; Song, C.; Lee, W.-K. Rainfall Characterization and Trend Analysis of Wet Spell Length across Varied Landscapes of the Upper Awash River Basin, Ethiopia. Sustain. J. Rec. 2020, 12, 9221. [Google Scholar] [CrossRef]
- Ngongondo, C.; Xu, C.-Y.; Gottschalk, L.; Alemaw, B. Evaluation of spatial and temporal characteristics of rainfall in Malawi: A case of data scarce region. Theor. Appl. Clim. 2011, 106, 79–93. [Google Scholar] [CrossRef] [Green Version]
- Searcy, J.K.; Hardison, C.H. Double-Mass Curves. Manual of Hydrology: Part I, General Surface Water Techniques; United States Government Printing Office: Washington, DC, USA, 1960; Volume 1541, pp. 31–40.
- Food Agriculture Organization. Report on the Agro-Ecological Zones Project; FAO: Rome, Italy, 1978. [Google Scholar]
- Zingore, S.; Murwira, H.K.; Delve, R.J.; Giller, K.E. Soil type, management history and current resource allocation: Three dimensions regulating variability in crop productivity on African smallholder farms. Field Crop. Res. 2007, 101, 296–305. [Google Scholar] [CrossRef]
- Allen, R.G.; Pereira, L.S.; Raes, D.; Smith, M. Crop Evapotranspiration-Guidelines for Computing Crop Water Requirements-FAO Irrigation and Drainage Paper 56; FAO: Rome, Italy, 1998. [Google Scholar]
- Verelst, L.; Wiberg, D. HWSD Viewer Version 1.21; FAO: Rome, Italy; IIASA: Luxemburg, Austria, 2012. [Google Scholar]
- Mouelhi, S.; Madani, K.; Lebdi, F. A structural overview through GR(s) Models characteristics for better yearly runoff Simulation. Open J. Mod. Hydrol. 2013, 3, 179–187. [Google Scholar] [CrossRef] [Green Version]
- Mouelhi, S.; Michel, C.; Perrin, C.; Andréassian, V. Stepwise development of a two-parameter monthly water balance model. J. Hydrol. 2006, 318, 200–214. [Google Scholar] [CrossRef]
- Moriasi, D.N.; Arnold, J.G.; Van Liew, M.W.; Bingner, R.L.; Harmel, R.D.; Veith, T.L. Model evaluation guide-lines for systematic quantification of accuracy in watershed simulations. Trans. ASABE 2007, 50, 885–900. [Google Scholar] [CrossRef]
- Nash, J.E.; Sutcliffe, J. V River flow forecasting through conceptual models part I—A discussion of principles. J. Hydrol. 1970, 10, 282–290. [Google Scholar] [CrossRef]
- Thirel, G.; Andréassian, V.; Perrin, C.; Audouy, J.-N.; Berthet, L.; Edwards, P.; Folton, N.; Furusho, C.; Kuentz, A.; Lerat, J.; et al. Hydrology under change: An evaluation protocol to investigate how hydrological models deal with changing catchments. Hydrol. Sci. J. 2015, 60, 1184–1199. [Google Scholar] [CrossRef]


| River | Stations | Lat. (°N) | Long. (°E) | Altitude (m a.s.l.) | RF (mm/yr) | Tmean (°C) | RHmean (%) | Length of Record |
|---|---|---|---|---|---|---|---|---|
| Holeta | Holeta | 9.00 | 38.49 | 2221 | 1167.8 | 16.9 | 60.3 | 1998–2010 |
| Awash | Melka Kuntire | 8.71 | 38.60 | 2003 | 1007.1 | 25.3 | 38.8 | 1998–2009 |
| Awash | Homboloe | 8.38 | 38.78 | 1709 | 897.5 | 19.6 | 49.6 | 1998–2010 |
| Mojo | Mojo | 8.61 | 39.12 | 1772 | 1011.8 | 19.9 | 48.6 | 1998–2010 |
| Keleta | Sire | 8.29 | 39.40 | 1595 | 1116.5 | 18.8 | 56.9 | 1998–2010 |
| Awash | Metehara | 8.90 | 39.85 | 754 | 610.0 | 27.3 | 39.6 | 1998–2009 |
| Kessem | Awara Melka | 9.20 | 40.10 | 763 | 673.5 | 25.3 | 38.8 | 1998–2010 |
| Awash | Melka sedi | 9.44 | 40.15 | 732 | 567.1 | 27.3 | 40.5 | 1998–2010 |
| Awash | Adaitu | 11.13 | 40.78 | 505 | 527.7 | 30.9 | 32.7 | 1998–2010 |
| Awash | Tendaho | 11.68 | 40.96 | 411 | 213.0 | 30.3 | 32.7 | 1998–2010 |
| Performance Rating | RSR | NSE | PBIAS (%) |
|---|---|---|---|
| Very good | 0.00 ≤ RSR ≤ 0.50 | 0.75 ≤ NSE ≤ 1.00 | PBIAS < ±10 |
| Good | 0.50 < RSR ≤ 0.60 | 0.65 < NSE ≤ 0.75 | ±10 ≤ PBIAS < ±15 |
| Satisfactory | 0.60 < RSR ≤ 0.70 | 0.50 < NSE ≤ 0.65 | ±15 ≤ PBIAS < ±25 |
| Unsatisfactory | RSR > 0.70 | NSE ≤ 0.50 | PBIAS ≥ ±25 |
| Rainfall Type | * RFmin (mm) | RFmax (mm) |
|---|---|---|
| Observed | 242 | 1536 |
| TRMM 3B43v7 | 430 | 1185 |
| PERSIANN-CDR | 413 | 1457 |
| No. | Watershed | Rainfall Set | Calibration | |||||
|---|---|---|---|---|---|---|---|---|
| NSE | PBIAS | R2 | RSR | Performance Rating | Remarks | |||
| 1 | Near Holleta | Observed | 0.85 | −3.03 | 0.85 | 0.38 | Vg | Oe |
| TRMM 3B43v7 | 0.77 | −0.47 | 0.77 | 0.40 | Vg | Oe | ||
| PERSIANN-CDR | 0.79 | 1.45 | 0.79 | 0.46 | Vg | Ue | ||
| 2 | Melka Kuntire | Observed | 0.87 | −3.27 | 0.87 | 0.37 | Vg | Oe |
| TRMM 3B43v7 | 0.80 | 6.91 | 0.81 | 0.44 | Vg | Ue | ||
| PERSIANN-CDR | 0.85 | 9.20 | 0.85 | 0.39 | Vg | Ue | ||
| 3 | Hombole | Observed | 0.80 | 11.06 | 0.78 | 0.49 | Vg | Ue |
| TRMM 3B43v7 | 0.82 | 2.89 | 0.82 | 0.42 | Vg | Ue | ||
| PERSIANN-CDR | 0.83 | −2.66 | 0.84 | 0.41 | Vg | Oe | ||
| 4 | Mojo | Observed | 0.90 | 9.51 | 0.90 | 0.31 | Vg | Ue |
| TRMM 3B43v7 | 0.83 | 10.48 | 0.86 | 0.41 | Vg | Ue | ||
| PERSIANN-CDR | 0.78 | −4.80 | 0.79 | 0.47 | Vg | Oe | ||
| 5 | Sire | Observed | 0.80 | −1.84 | 0.80 | 0.44 | Vg | Oe |
| TRMM 3B43v7 | 0.80 | −0.25 | 0.81 | 0.45 | Vg | Oe | ||
| PERSIANN-CDR | 0.82 | 2.73 | 0.82 | 0.50 | Vg | Ue | ||
| 6 | Metehara | Observed | 0.76 | 3.36 | 0.77 | 0.49 | Vg | Ue |
| TRMM 3B43v7 | 0.60 | 0.93 | 0.63 | 0.63 | S | Ue | ||
| PERSIANN-CDR | 0.56 | 7.79 | 0.59 | 0.66 | S | Ue | ||
| 7 | Melka Sedi | Observed | 0.76 | 3.92 | 0.76 | 0.49 | Vg | Ue |
| TRMM 3B43v7 | 0.76 | −4.34 | 0.77 | 0.49 | Vg | Oe | ||
| PERSIANN-CDR | 0.71 | 2.92 | 0.71 | 0.54 | G | Ue | ||
| 8 | Kessem | Observed | 0.93 | 7.24 | 0.93 | 0.27 | Vg | Ue |
| TRMM 3B43v7 | 0.87 | −18.68 | 0.92 | 0.36 | Vg | Oe | ||
| PERSIANN-CDR | 0.87 | −12.40 | 0.88 | 0.36 | Vg | Oe | ||
| 9 | Adaitu | Observed | 0.70 | 0.79 | 0.72 | 0.79 | G | Ue |
| TRMM 3B43v7 | 0.73 | 4.67 | 0.76 | 0.52 | G | Ue | ||
| PERSIANN-CDR | 0.85 | 0.39 | 0.89 | 0.39 | Vg | Ue | ||
| 10 | Tendaho | Observed | 0.68 | 2.78 | 0.69 | 0.56 | G | Ue |
| TRMM 3B43v7 | 0.74 | −12.11 | 0.76 | 0.51 | G | Oe | ||
| PERSIANN-CDR | 0.77 | −10.68 | 0.82 | 0.48 | Vg | Oe | ||
| No. | Watershed | Rainfall Set | Validation | |||||
|---|---|---|---|---|---|---|---|---|
| NSE | PBIAS | R2 | RSR | Performance Rating | Remarks | |||
| 1 | Near Holleta | Observed | 0.75 | 14.60 | 0.76 | 0.50 | G | Ue |
| TRMM 3B43v7 | 0.74 | 4.78 | 0.75 | 0.51 | G | Ue | ||
| PERSIANN-CDR | 0.69 | 13.16 | 0.75 | 0.56 | G | Ue | ||
| 2 | Melka Kuntire | Observed | 0.63 | 19.13 | 0.65 | 0.61 | S | Ue |
| TRMM 3B43v7 | 0.73 | 34.24 | 0.86 | 0.52 | G | Ue | ||
| PERSIANN-CDR | 0.76 | 26.27 | 0.81 | 0.49 | Vg | Ue | ||
| 3 | Hombole | Observed | 0.75 | 14.68 | 0.83 | 0.50 | G | Ue |
| TRMM 3B43v7 | 0.87 | 12.11 | 0.88 | 0.36 | Vg | Ue | ||
| PERSIANN-CDR | 0.75 | 16.20 | 0.78 | 0.48 | Vg | Ue | ||
| 4 | Mojo | Observed | 0.70 | 7.34 | 0.74 | 0.55 | G | Ue |
| TRMM 3B43v7 | 0.82 | 3.69 | 0.82 | 0.44 | Vg | Ue | ||
| PERSIANN-CDR | 0.67 | −31.03 | 0.81 | 0.57 | G | Oe | ||
| 5 | Sire | Observed | 0.69 | 14.44 | 0.79 | 0.55 | G | Ue |
| TRMM 3B43v7 | 0.68 | 4.80 | 0.73 | 0.56 | G | Ue | ||
| PERSIANN-CDR | 0.62 | 9.37 | 0.67 | 0.62 | S | Ue | ||
| 6 | Metehara | Observed | 0.34 | −27.23 | 0.59 | 0.81 | NS | Oe |
| TRMM 3B43v7 | 0.34 | −29.76 | 0.57 | 0.81 | NS | Oe | ||
| PERSIANN-CDR | 0.46 | −25.13 | 0.59 | 0.73 | NS | Oe | ||
| 7 | Melka Sedi | Observed | 0.42 | 23.60 | 0.64 | 0.76 | NS | Ue |
| TRMM 3B43v7 | 0.39 | 9.04 | 0.63 | 0.78 | NS | Ue | ||
| PERSIANN-CDR | 0.40 | 7.44 | 0.58 | 0.78 | NS | Ue | ||
| 8 | Kessem | Observed | 0.65 | −2.96 | 0.67 | 0.59 | S | Oe |
| TRMM 3B43v7 | 0.60 | 33.81 | 0.68 | 0.62 | S | Ue | ||
| PERSIANN-CDR | 0.61 | 24.04 | 0.64 | 0.70 | S | Ue | ||
| 9 | Adaitu | Observed | 0.76 | −0.57 | 0.85 | 0.49 | Vg | Oe |
| TRMM 3B43v7 | 0.79 | 10.44 | 0.82 | 0.46 | Vg | Ue | ||
| PERSIANN-CDR | 0.65 | −2.39 | 0.73 | 0.53 | S | Oe | ||
| 10 | Tendaho | Observed | 0.70 | −23.37 | 0.77 | 0.54 | G | Oe |
| TRMM 3B43v7 | 0.62 | −24.67 | 0.68 | 0.62 | S | Oe | ||
| PERSIANN-CDR | 0.51 | 4.20 | 0.52 | 0.70 | S | Ue | ||
Publisher’s Note: MDPI stays neutral with regard to jurisdictional claims in published maps and institutional affiliations. |
© 2021 by the authors. Licensee MDPI, Basel, Switzerland. This article is an open access article distributed under the terms and conditions of the Creative Commons Attribution (CC BY) license (http://creativecommons.org/licenses/by/4.0/).
Share and Cite
Adane, G.B.; Hirpa, B.A.; Gebru, B.M.; Song, C.; Lee, W.-K. Integrating Satellite Rainfall Estimates with Hydrological Water Balance Model: Rainfall-Runoff Modeling in Awash River Basin, Ethiopia. Water 2021, 13, 800. https://doi.org/10.3390/w13060800
Adane GB, Hirpa BA, Gebru BM, Song C, Lee W-K. Integrating Satellite Rainfall Estimates with Hydrological Water Balance Model: Rainfall-Runoff Modeling in Awash River Basin, Ethiopia. Water. 2021; 13(6):800. https://doi.org/10.3390/w13060800
Chicago/Turabian StyleAdane, Girma Berhe, Birtukan Abebe Hirpa, Belay Manjur Gebru, Cholho Song, and Woo-Kyun Lee. 2021. "Integrating Satellite Rainfall Estimates with Hydrological Water Balance Model: Rainfall-Runoff Modeling in Awash River Basin, Ethiopia" Water 13, no. 6: 800. https://doi.org/10.3390/w13060800