
Research on the Influence of Small-Scale Terrain on Precipitation

1
School of Binjiang, Nanjing University of Information Science & Technology, Nanjing 210044, China
2
School of Applied Meteorology, Nanjing University of Information Science & Technology, Nanjing 210044, China
*
Author to whom correspondence should be addressed.
Water 2021, 13(6), 805; https://doi.org/10.3390/w13060805
Submission received: 14 February 2021
/
Revised: 7 March 2021
/
Accepted: 13 March 2021
/
Published: 15 March 2021
(This article belongs to the Special Issue Rainfall Measurement and Its Application)
Abstract
:Terrain plays an important role in the formation, development and distribution of local precipitation and is a major factor leading to locally abnormal weather in weather systems. Although small-scale topography has little influence on the spatial distribution of precipitation, it interferes with precipitation fitting. Due to the arbitrary combination of small, medium and large-scale terrain, complex terrain distribution is formed, and small-scale terrain cannot be clearly defined and removed. Based on the idea of bidimensional empirical mode decomposition (BEMD), this paper extracts small-scale terrain data layer by layer to smooth the terrain and constructs a macroterrain model for different scales in Central China. Based on the precipitation distribution model using multiple regression, precipitation models (B0, B1, B2 and B3) of different scales are constructed. The 18-year monthly average precipitation data of each station are compared with the precipitation simulation results under different scales of terrain and TRMM precipitation data, and the influence of different levels of small-scale terrain on the precipitation distribution is analysed. The results show that (1) in Central China, the accuracy of model B2 is much higher than that of TRMM model A and monthly precipitation model B0. The comprehensive evaluation indexes are increased by 3.31% and 1.92%, respectively. (2) The influence of different levels of small-scale terrain on the precipitation distribution is different. The first- and second-order small-scale terrain has interference effects on precipitation fitting, and the third-order small-scale terrain has an enhancement effect on precipitation. However, the effect of small-scale topography on the precipitation distribution is generally reflected as interference.
1. Introduction
Precipitation is a key element in describing climate change and an important component of meteorology [1], ecological hydrology [2], agriculture [3] and urban planning [4,5]. Precipitation is an important parameter in the study of climate change [6,7]. High-quality precipitation modelling is crucial for reliable estimation of precipitation.
Research on precipitation can be divided into two categories [8]: observational research and model research. Research based on observations includes early rain gauge measurements or single radar observations [9] and modern composite field operations characterized by aircraft field measurements, remote sensing technologies, etc. [10]. Its disadvantage lies in the limitation of the distribution of rain gauges and observations. Model-based research is usually based on observation data from meteorological stations and that of topographic factors (altitude, slope direction and slope). Bosch and Davis [11] used the inverse distance weighting method to calculate the amount of precipitation in the southeastern United States. Marquinez et al. [12] used a multivariate statistical method to simulate precipitation in mountainous areas combined with geographical and topographic factors. Naoum et al. [13] proposed a multiple regression model of topographic precipitation. In recent years, precipitation analysis products and DEM data have been added to the regression method to improve the spatial resolution of precipitation estimation. Jia et al. [14] developed 1-km spatial resolution precipitation data based on NDVI, TRMM 3B43 products and DEM data in the Qaidam Basin, China. Shi et al. [15] used linear regression, exponential regression and random forest methods to reduce the original TRMM 3B43 product to a finer grid with a spatial resolution of 1 km. However, these studies mainly focus on the estimation of annual precipitation, which has difficulty in achieving regional and local precipitation estimations at a high resolution. Zhu et al. [16] proposed a monthly precipitation model based on the physical significance of topography to precipitation distribution. However, the model uses the terrain data of meteorological stations to represent the terrain characteristics of the study area and ignores the impact of small-scale terrain on precipitation. The influence of small-scale topography on precipitation distribution is complex and changeable; some small-scale topographic features can enhance the spatial distribution of precipitation, such as the windward slope effect of topography [17,18] and the enhancement of trumpet topography on precipitation [19]. Most small-scale terrain has no effect on precipitation distribution, but small-scale terrain will alter the slope and aspect data of the macroterrain, thus disturbing the precipitation fitting results. Therefore, the study of the effect of small-scale terrain on precipitation distribution is conducive to improving the accuracy of precipitation estimations and is key to flood prevention.
However, due to the arbitrary combination of small, medium and large-scale terrain, complex terrain distributions are formed, and small-scale terrain cannot be clearly defined and removed, which interferes with the impact of small-scale terrain on the spatial distribution of precipitation. In this paper, we use bidimensional empirical mode decomposition (BEMD) to process the terrain data and extract small-scale terrain features layer by layer to smooth the macroterrain to construct different scale terrains. The BEMD method [20,21] is a two-dimensional signal decomposition method that smooths noise by constructing mean enveloping surfaces. Its advantage is that it does not need to set up initial basis functions. At present, this method has been widely used in image fusion [22], image denoising [23], image compression [24] and image enhancement [25]. This paper presents DEM data [26] as a set of two-dimensional signals, uses the BEMD method [27] to smooth the macroscopic topography at all levels and obtains the residual topography at different scales. Different scales of terrain include various grades of small-scale terrain, which reflect the macrodistribution trend of the terrain. Research on the influence of different scales of terrain on the spatial distribution of precipitation can be used to analyse the influence of different levels of small terrain on precipitation fitting.
2. Materials and Methods
2.1. Site Description
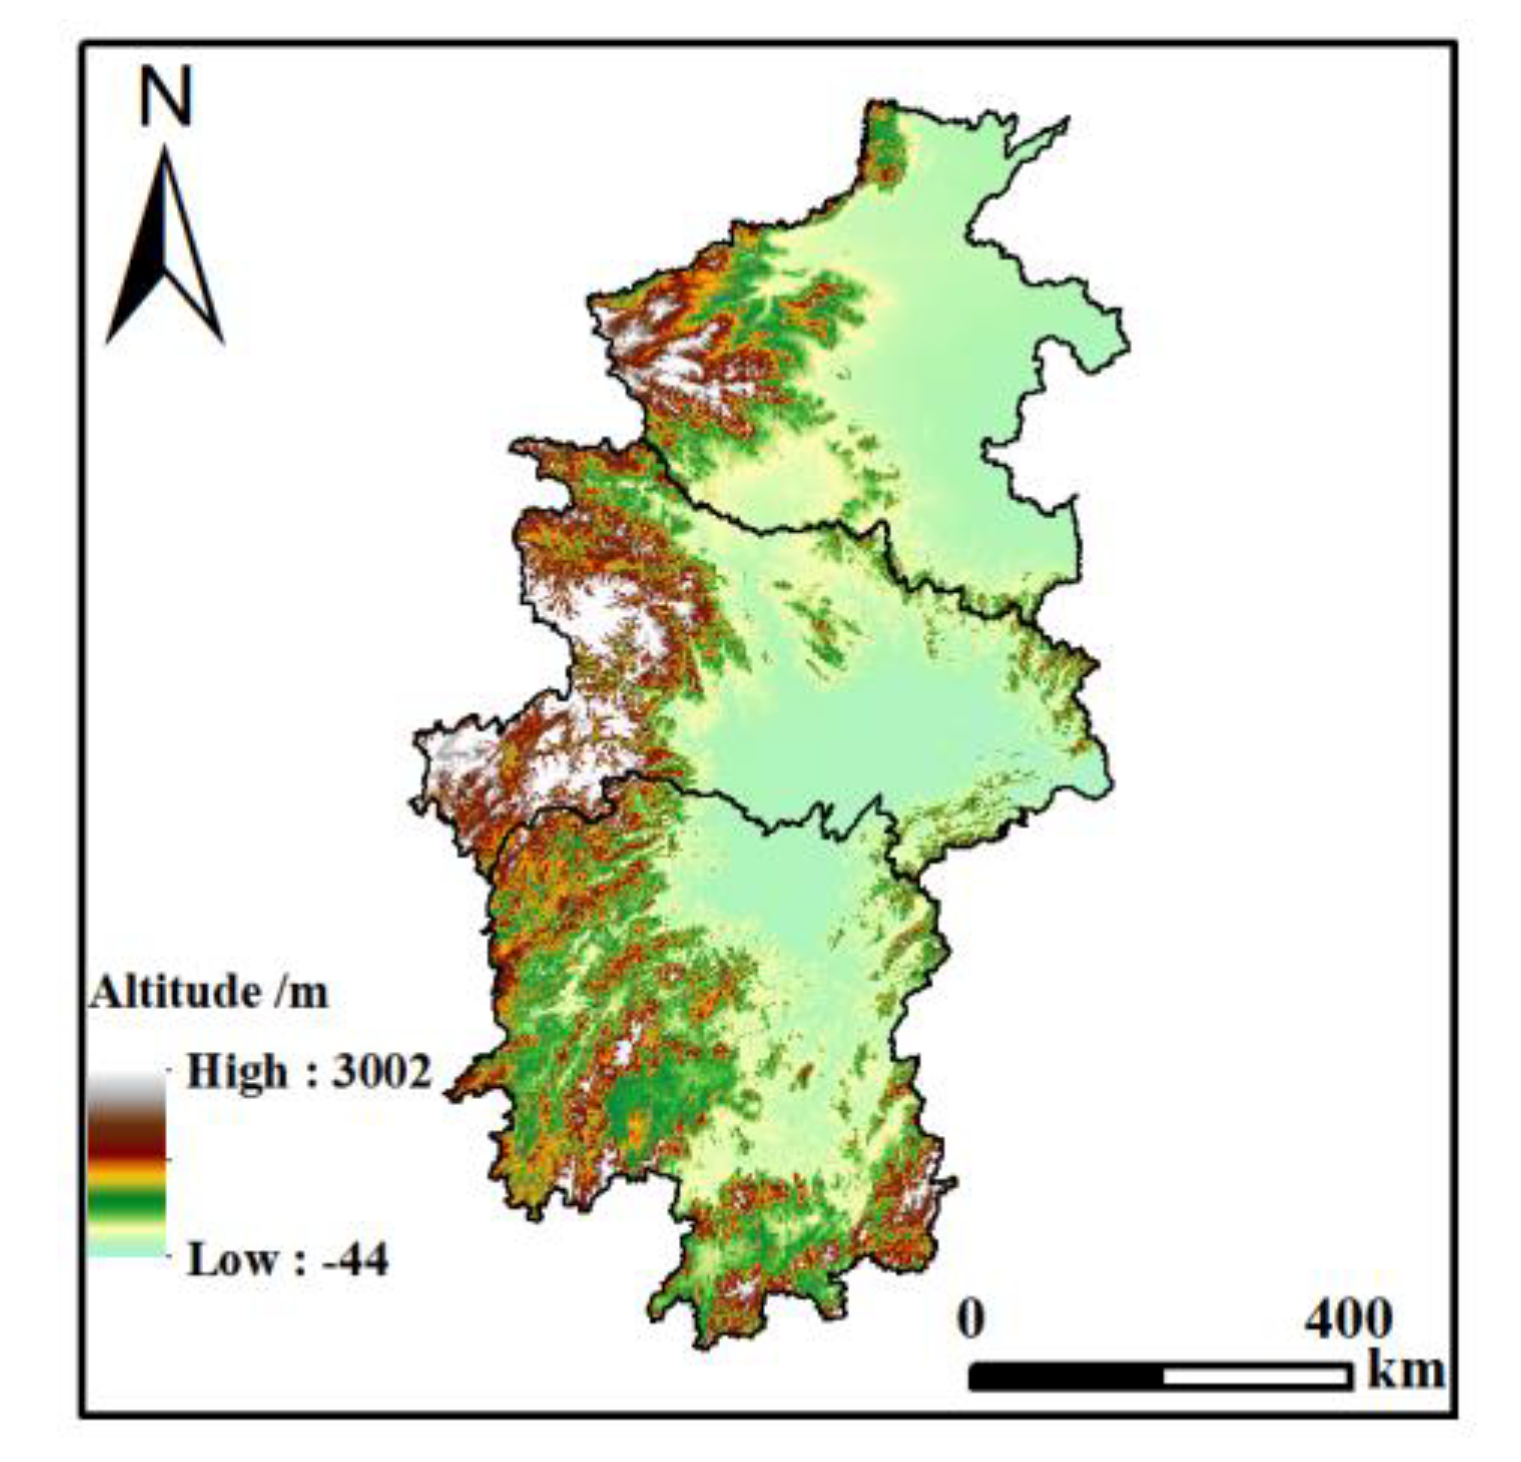
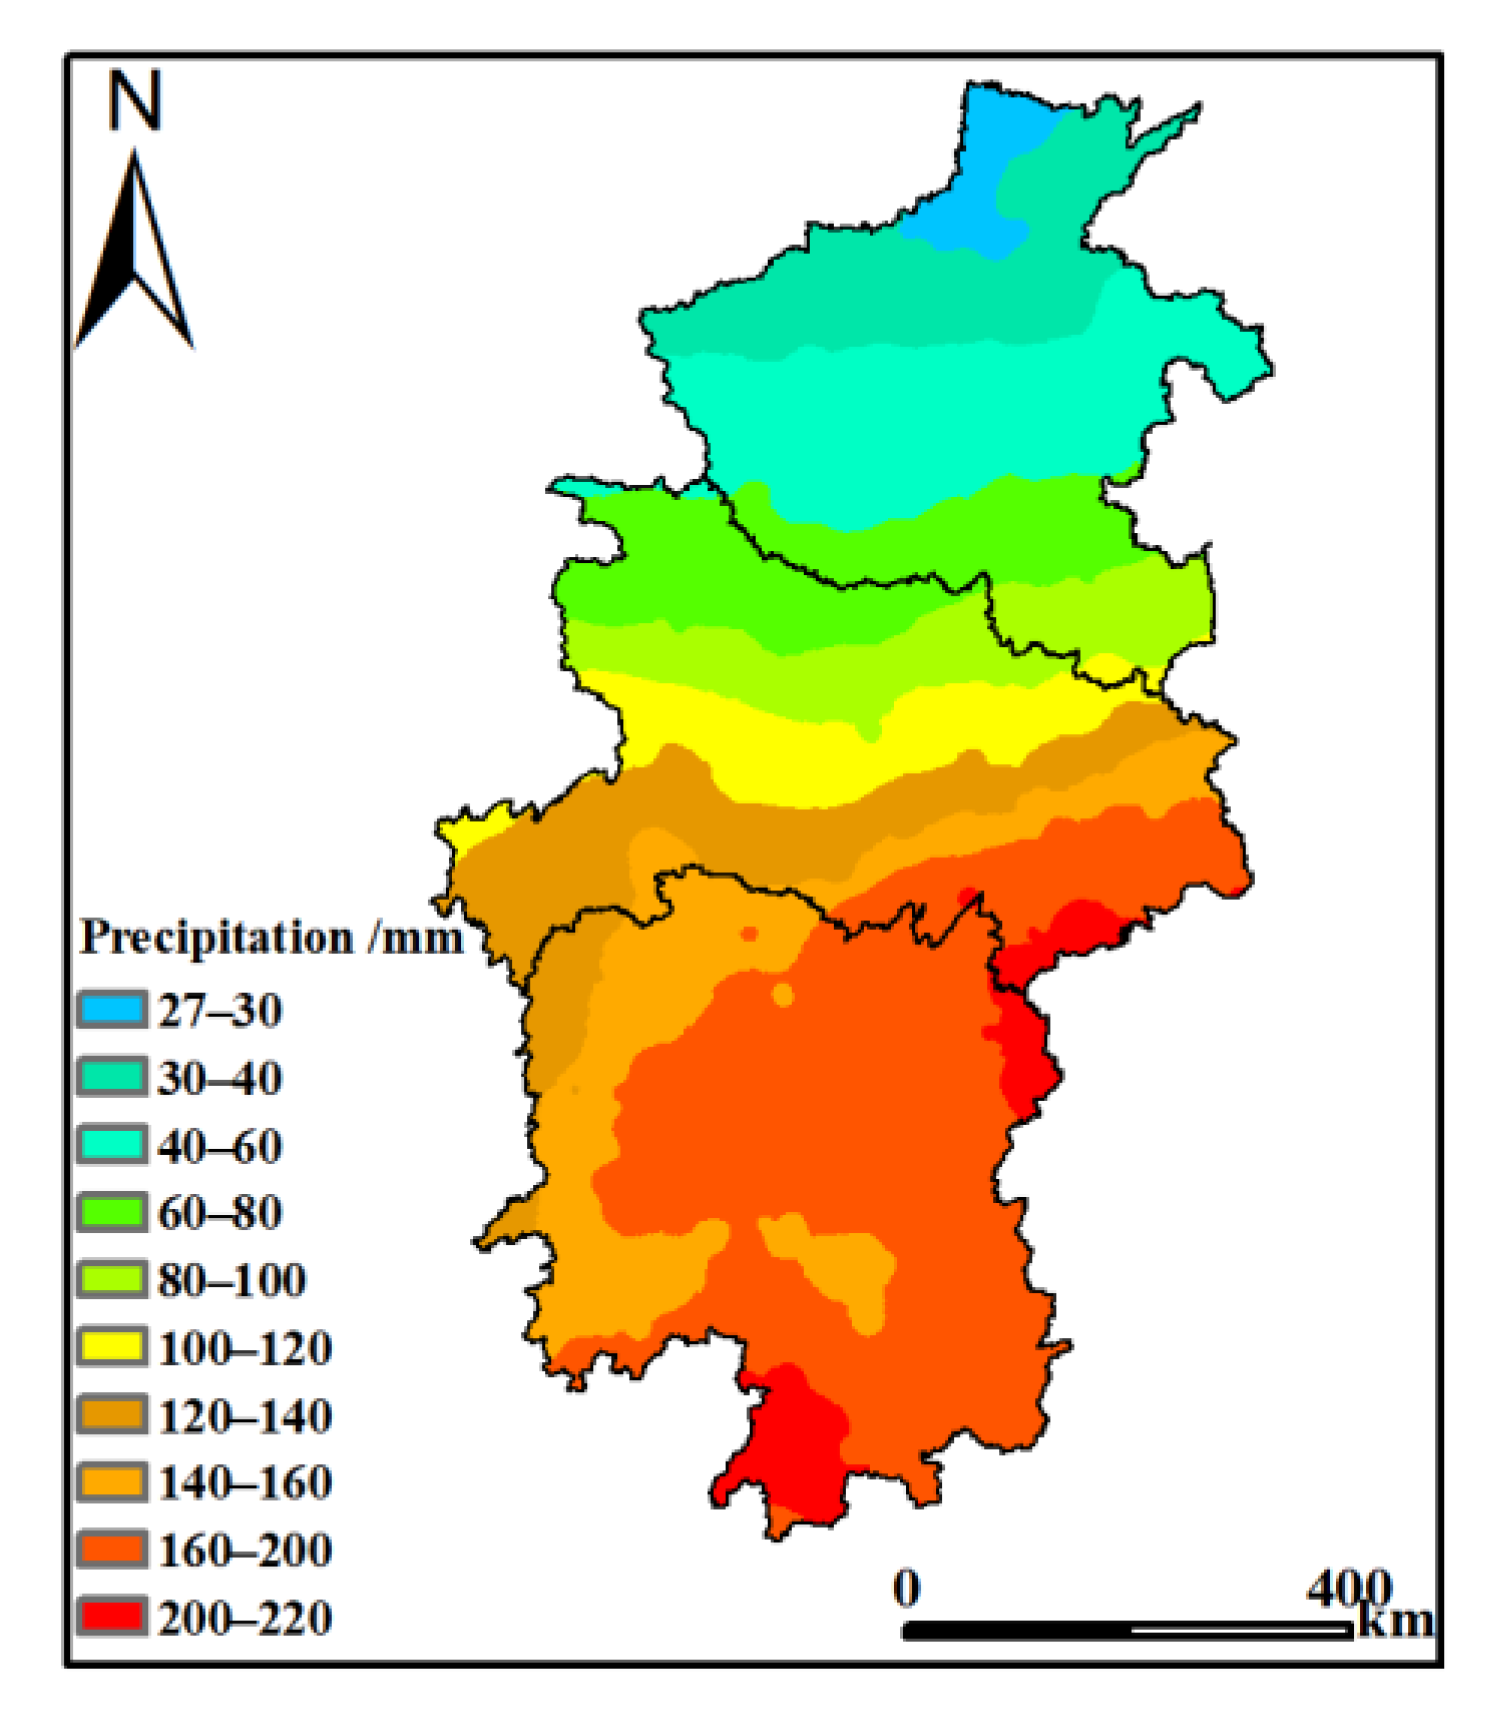
Central China is one of seven geographical regions in China; it includes Henan, Hubei and Hunan provinces. The landforms in Central China are mainly plains, hills, basins and mountains, with many mountains and complicated and changeable landform combinations. The climatic environment in Central China consists of a temperate monsoon climate and a subtropical monsoon climate. Among them, Henan Province has a temperate monsoon climate with an average annual precipitation of 532.5–1380.6 mm. Hubei Province has a subtropical monsoon humid climate, with an annual average precipitation of 800–1600 mm. The regional distribution of precipitation shows a decreasing trend from south to north. Hunan Province has a subtropical monsoon humid climate, with an annual average precipitation between 1150 and 2100 mm. The DEM data in Central China used in this paper can be obtained from the resource and environment data cloud platform and are generated by resampling based on SRTM V4.1 data in 2000 (http://www.resdc.cn/data.aspx?DATAID=123, accessed on 14 March 2021). The data are projected by the WGS84 ellipsoid, and the spatial resolution is 1 km × 1 km, as shown in Figure 1.
The TRMM 3B43 precipitation data used in this paper are from National Aeronautics and Space Administration (NASA) [28]. Precipitation data from 2000 to 2017 are selected on a monthly scale, and the monthly average hourly precipitation (mm/h) is recorded. Because of the low resolution of the data, we downscale the data and take the downscaling products as the macro trend of precipitation.
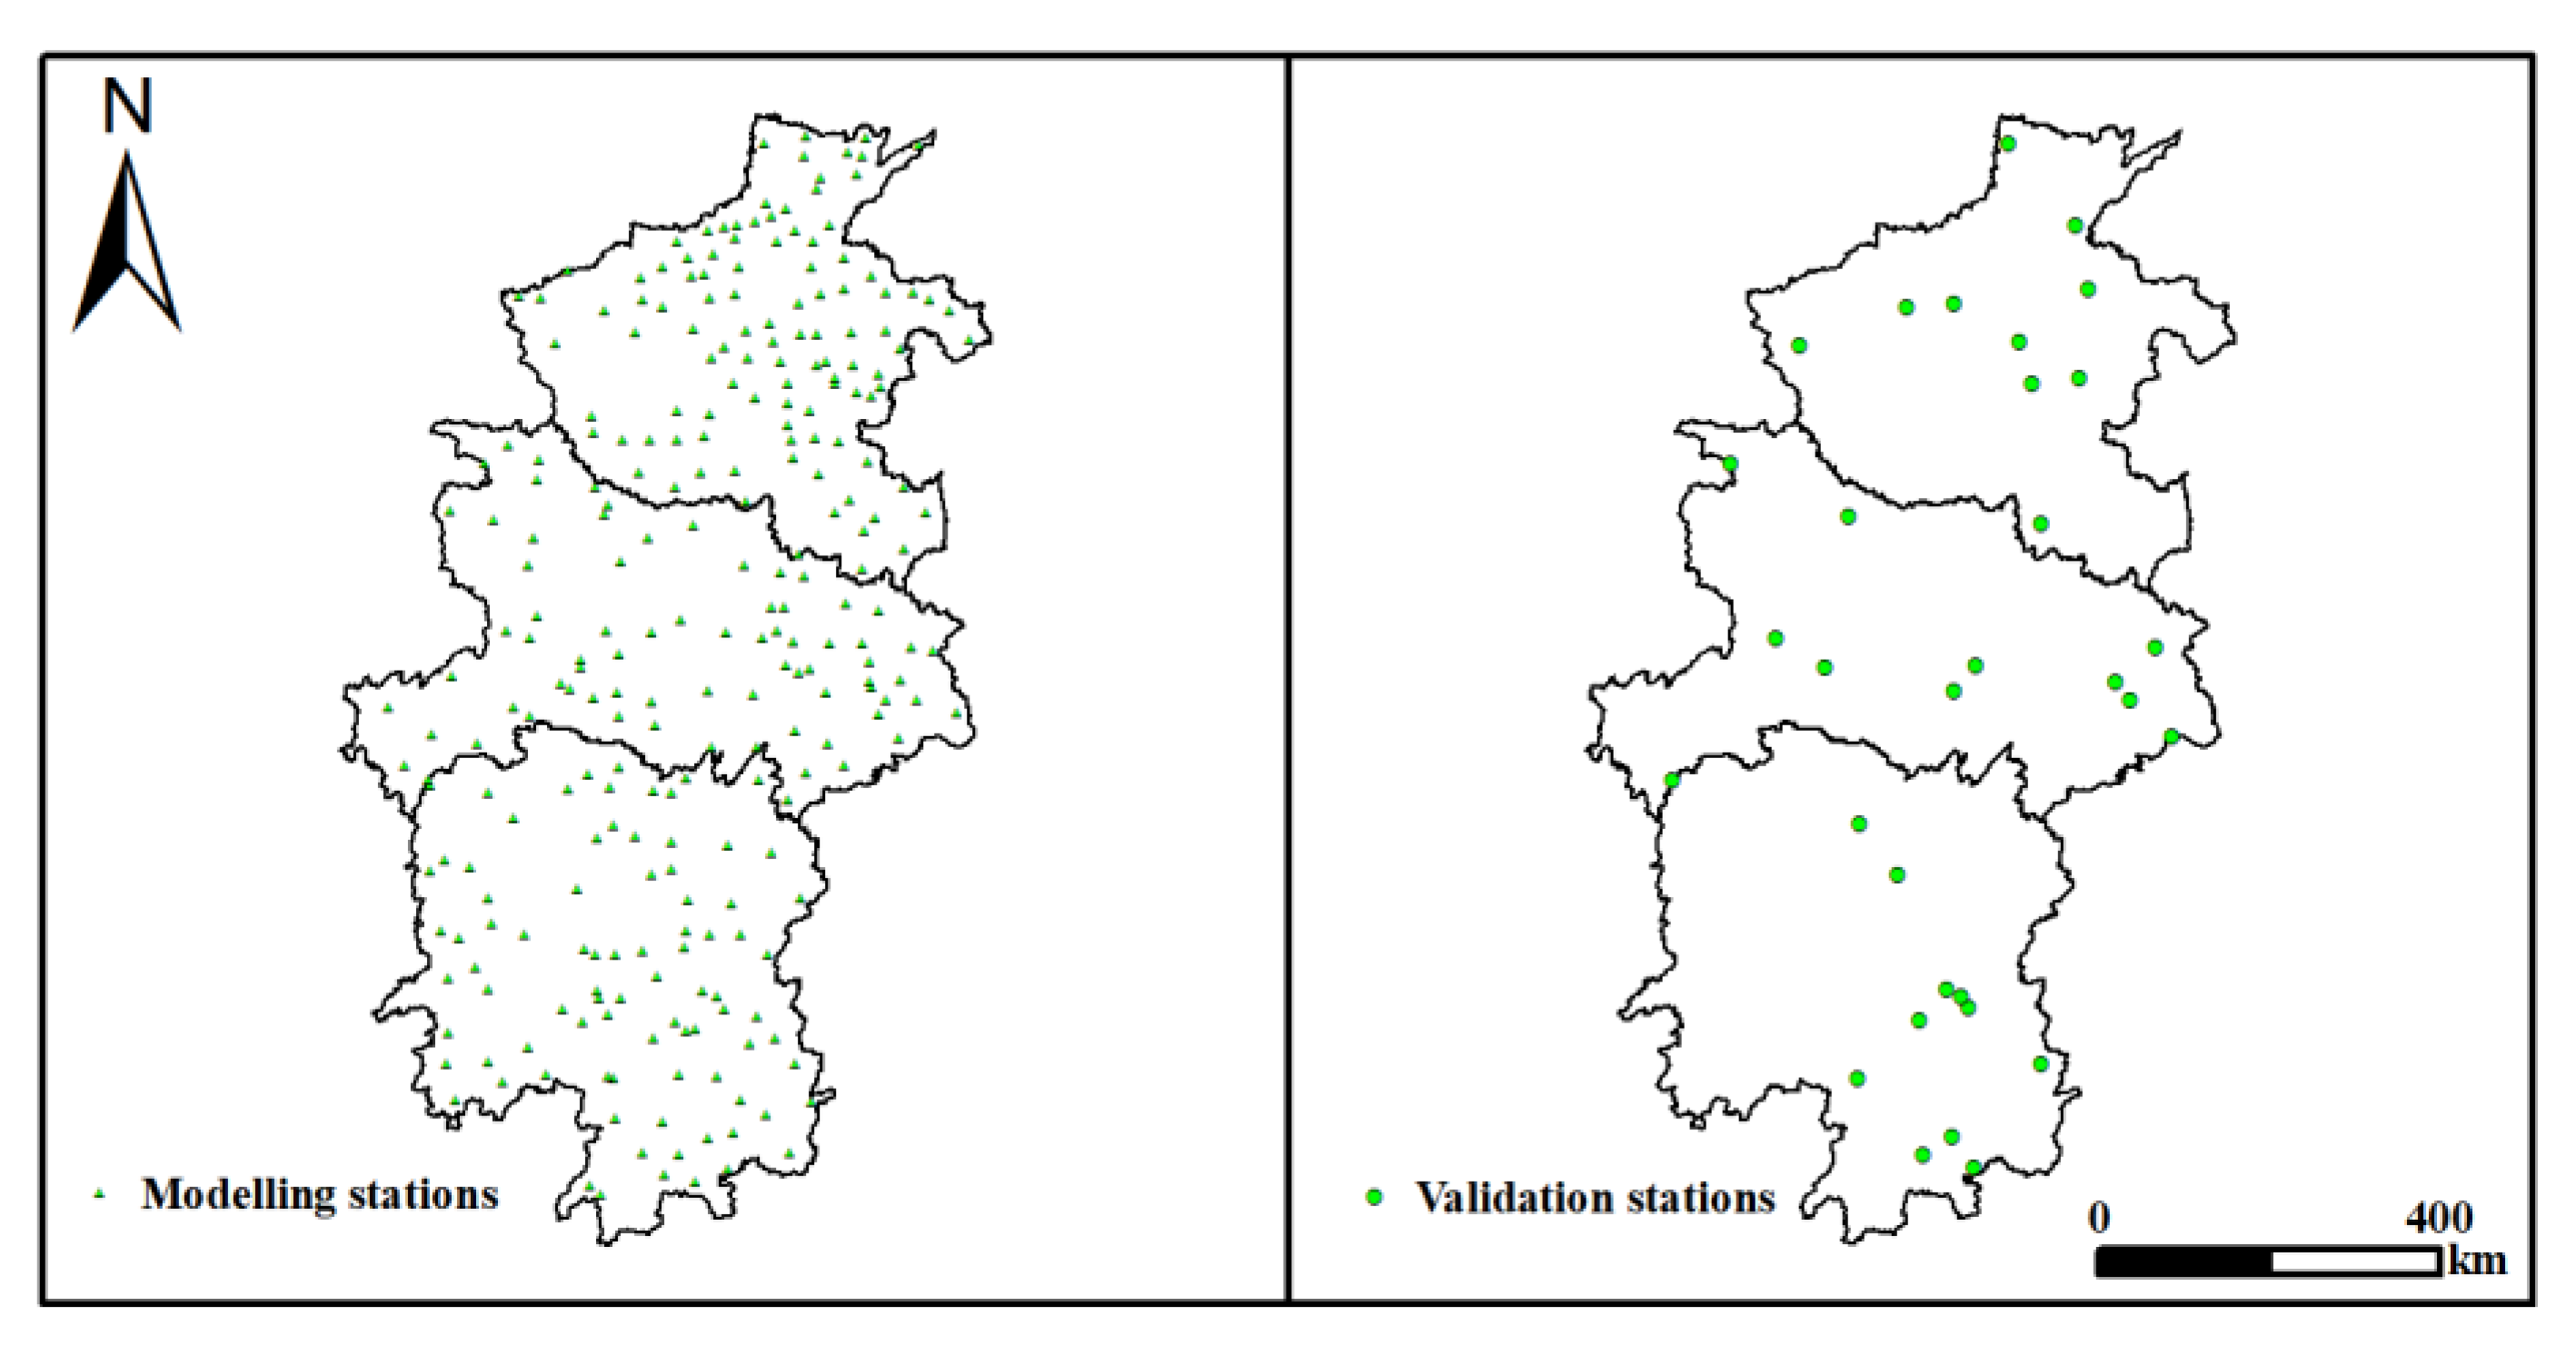
After selecting precipitation data from surface meteorological stations and stations in Central China, a total of 297 stations with complete monthly precipitation observation data from 2000 to 2017 are selected after strict quality testing and screening. According to the climatological data collation method of the China Meteorological Administration, the precipitation data are statistically collated to generate the monthly average precipitation data of each station. The precipitation in Central China is strongly affected by monsoons in January and July, so the influence of small-scale topography on the precipitation distribution is not significant. We do not study the influence of topography on the precipitation of these two months. Finally, according to the spatial uniform sampling algorithm, all the stations are divided into two parts: one group contains a total of 269 modelling stations, and the other group contains a total of 28 validation stations, as shown in Figure 2. These validation stations are distributed across various geomorphic areas in Central China, which can be used to objectively test the simulation results.
2.2. Research Methods
This study constructs precipitation models based on the results of topographic decomposition. Details of the datasets are described as follows.
2.2.1. Two-Dimensional Empirical Mode Decomposition
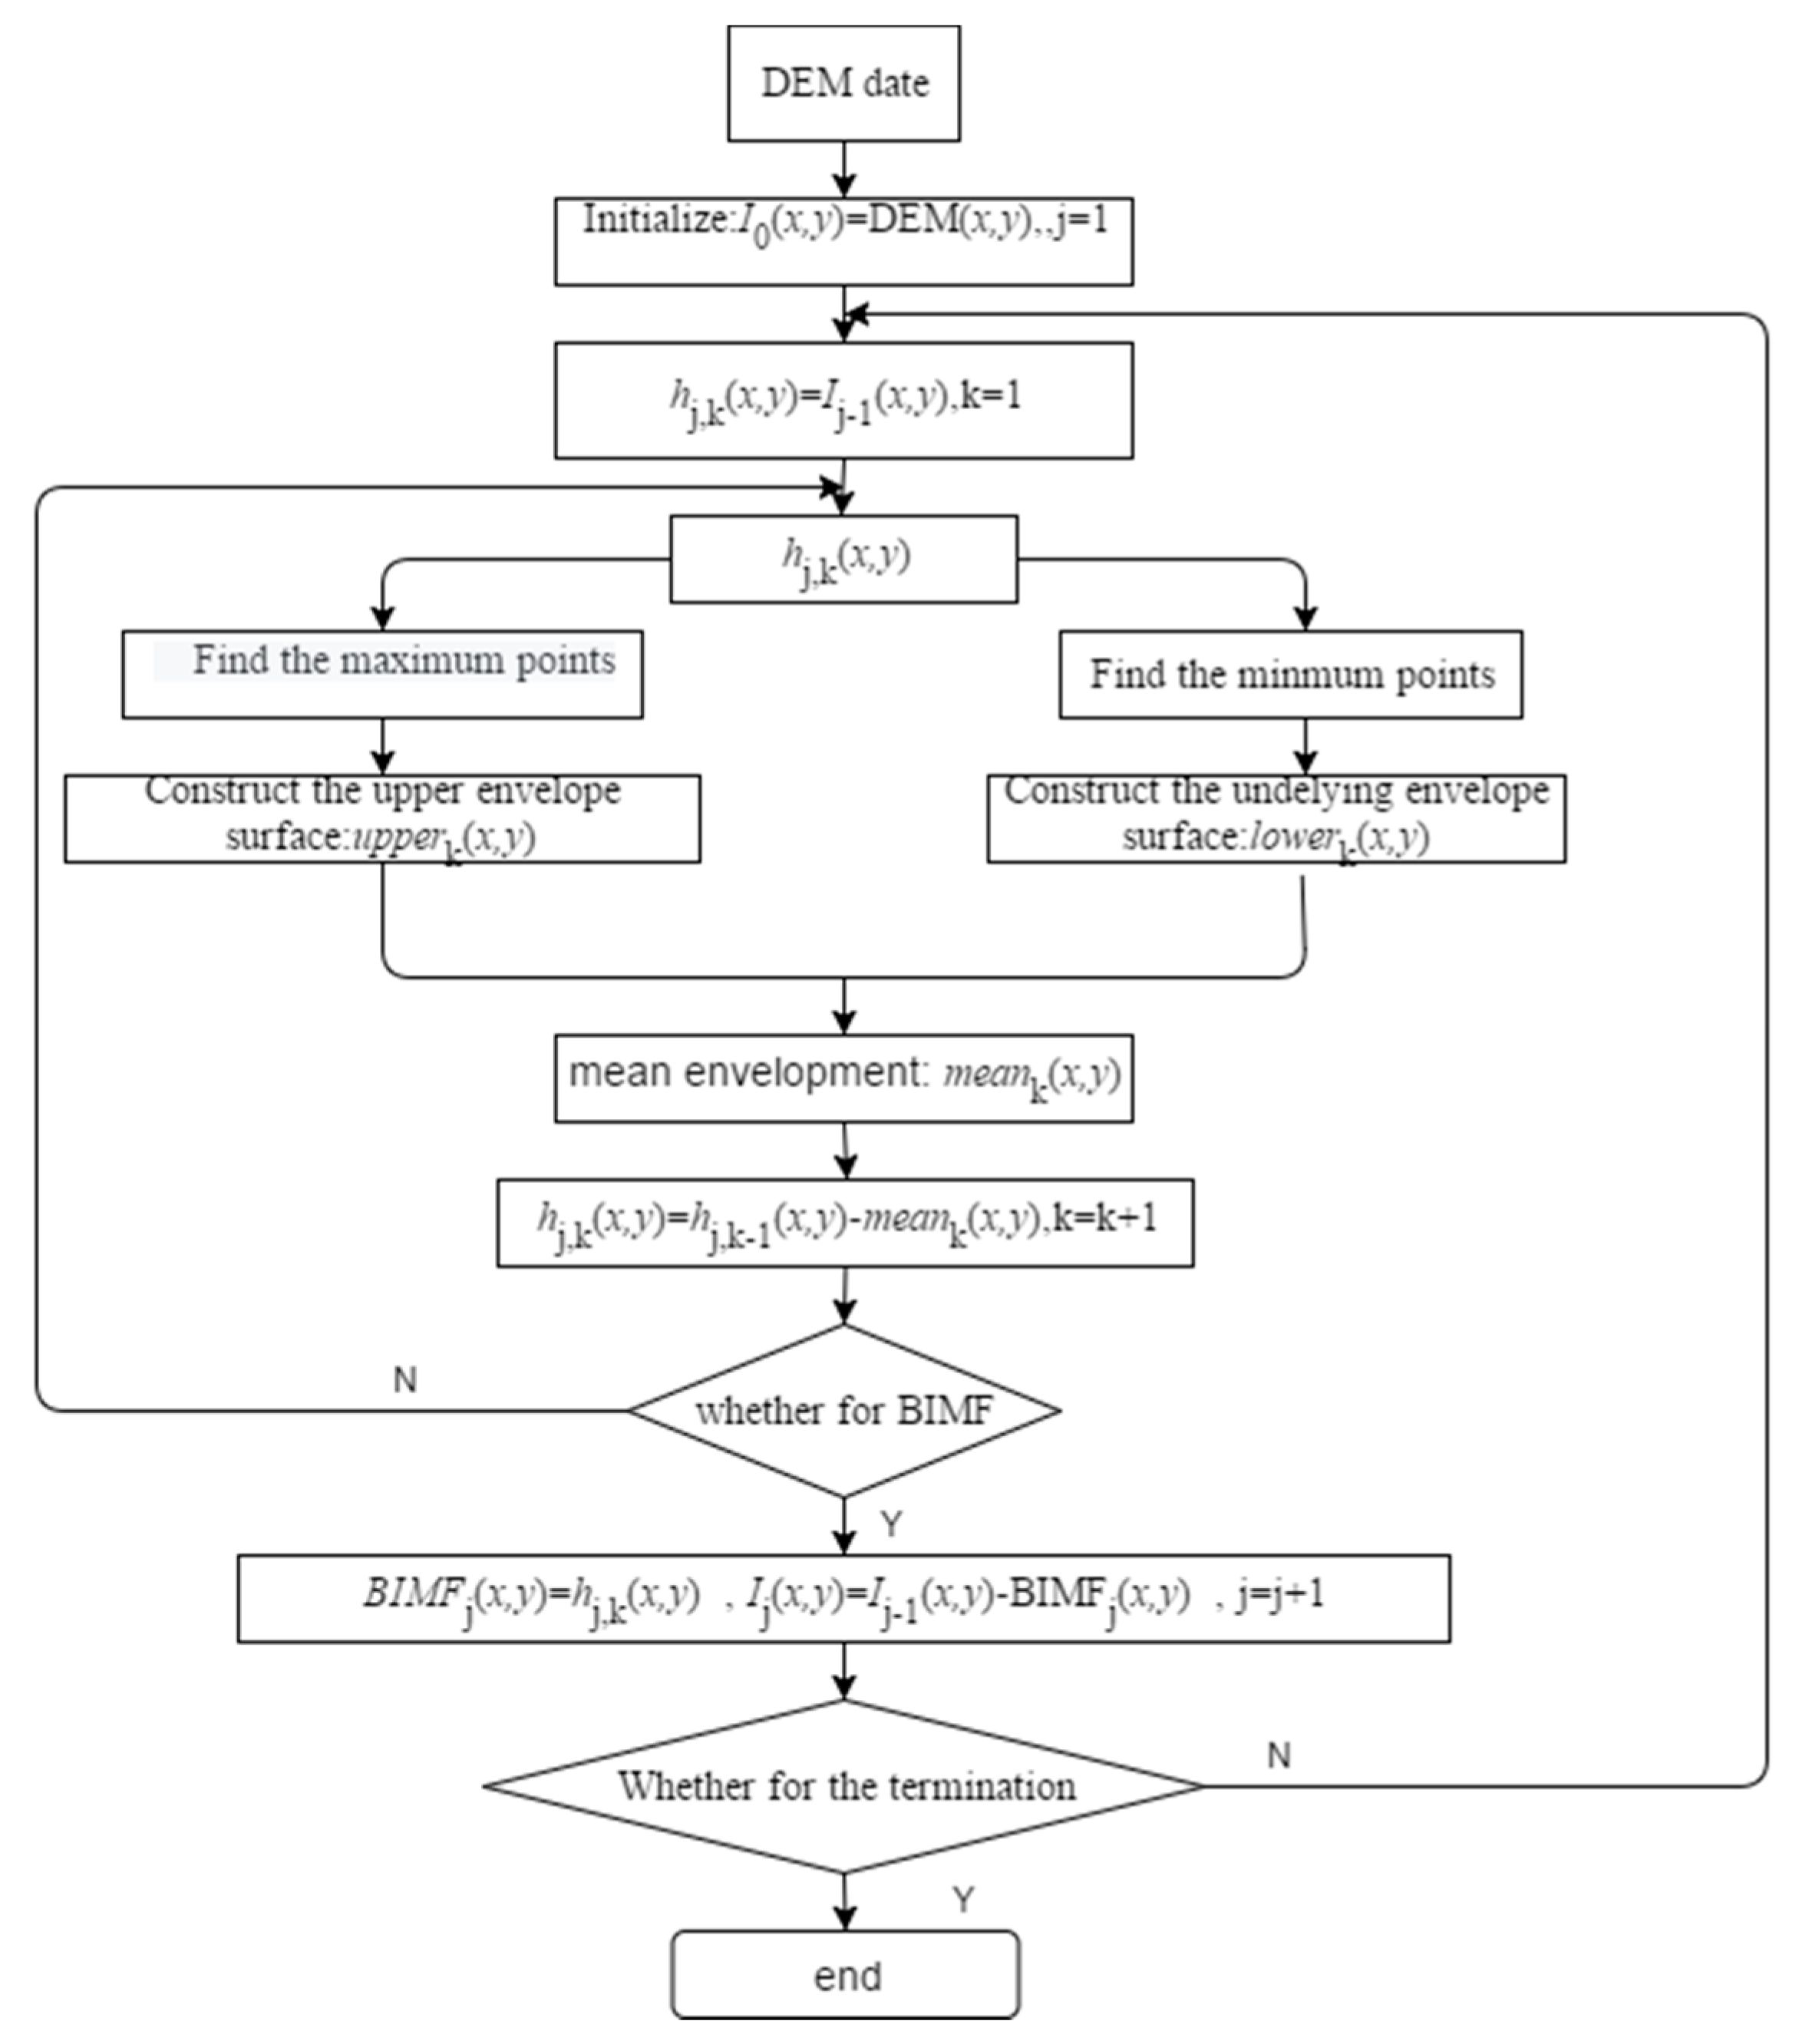
In 2003, Nunes et al. proposed a BEMD model based on a two-dimensional envelope function. The BEMD method can be used to analyse two-dimensional signals such as images and decompose the signals into multiple intrinsic mode functions with frequencies ranging from high to low and their corresponding residuals. At present, the algorithm has been widely used in image fusion, image denoising, image compression and image enhancement. In this paper, DEM data with a spatial resolution of 1 km × 1 km are taken as topographic signals, set as DEM(x,y), and decomposed using the BEMD method. After layer-by-layer screening, the BEMD method decomposes the original data into a finite number of two-dimensional intrinsic mode functions (BIMF(x,y)) with frequencies ranging from high to low and their corresponding residuals (Res(x,y)). Through screening, the following results can be obtained:
where x is the row coordinate and y is the column coordinate. A BIMF screening process for DEM data can be summarized as the following steps:
(1) A 3 × 3 window is created along the rows and columns of two-dimensional surface data, and the neighbourhood search method is adopted to calculate the local maximum and minimum point sets of two-dimensional surface data;
(2) The upper and lower enveloping surfaces are constructed by surface fitting for maximum and minimum point sets, respectively, and the mean enveloping surfaces are obtained.
(3) Subtract the mean enveloping surface from the original surface;
(4) Determine whether the termination condition is satisfied according to the value:
where X is the row index set, Y is the column index set, x is the row coordinate, and y is the column coordinate. The value of SD is an empirical value, which is generally 0.2–0.3, and 0.3 in this paper. is the data of two-dimensional surface, which satisfies the following:
where and are the upper and lower enveloping surfaces, respectively.
Procedures (1)–(3) are repeated until the given termination condition is satisfied to obtain a two-dimensional intrinsic mode function of the first layer (BIMF1). The residual of the first layer h1(x,y) is obtained by subtracting the intrinsic mode function of the first layer from the original image. Steps 1 to 4 are repeated for the residual to obtain the n-layer small-scale terrain function (two-dimensional intrinsic mode functions) and the n-layer residual of DEM terrain data, as shown in Figure 3.
The BEMD method can be used to obtain the n-layer small-scale terrain functions (2-D intrinsic mode function) and the corresponding N-layer residual data. The n-layer residual data are the macroterrain data obtained from the original DEM data after stripping the small-scale terrain layer by layer. These macroterrain data retain the macroterrain features of the terrain from fine to coarse and form the macroterrain with different levels and slight differences between adjacent levels.
2.2.2. Precipitation Spatial Model
The size and distribution of surface precipitation are affected by weather conditions and topography. The former constitutes the macrotrend term of precipitation, while the latter constitutes the local correction term of precipitation. In this paper, the monthly precipitation model proposed by Zhu et al. [16] is adopted:
where P′ is the estimated precipitation; P0 is the trend term of precipitation model; h is the altitude; PPD is the prevailing precipitation direction; is the slope direction; is slope; and is the coefficients to be determined.
2.2.3. Definition of PPD
PPD is the prevailing precipitation direction, which represents the sources of precipitation and may greatly influence spatial distribution of precipitation at local scales, especially in mountain areas characterized by complex terrain [16].
We set each station as the target station, then we set azimuth . Based on the aspect of the location, the stations near the target station were divided into two groups. All of the stations with an absolute value of angle less than 90° between the terrain aspect and the azimuth were defined as forward stations, and all of the stations with an absolute value of angle of greater than 90° were defined as backward stations. The average precipitation difference between the forward and backward stations can be used as an indicator to measure the impact of forward and backward terrain on the precipitation distribution. In the range of semicircle (−90°,90°), we rotated by a certain angle . For each the average precipitation difference between the forward and backward directions could be calculated:
where is the maximum difference in precipitation between the forward and backward directions. The direction that corresponds to is PPD.
3. Results
3.1. Results of Model Decomposition
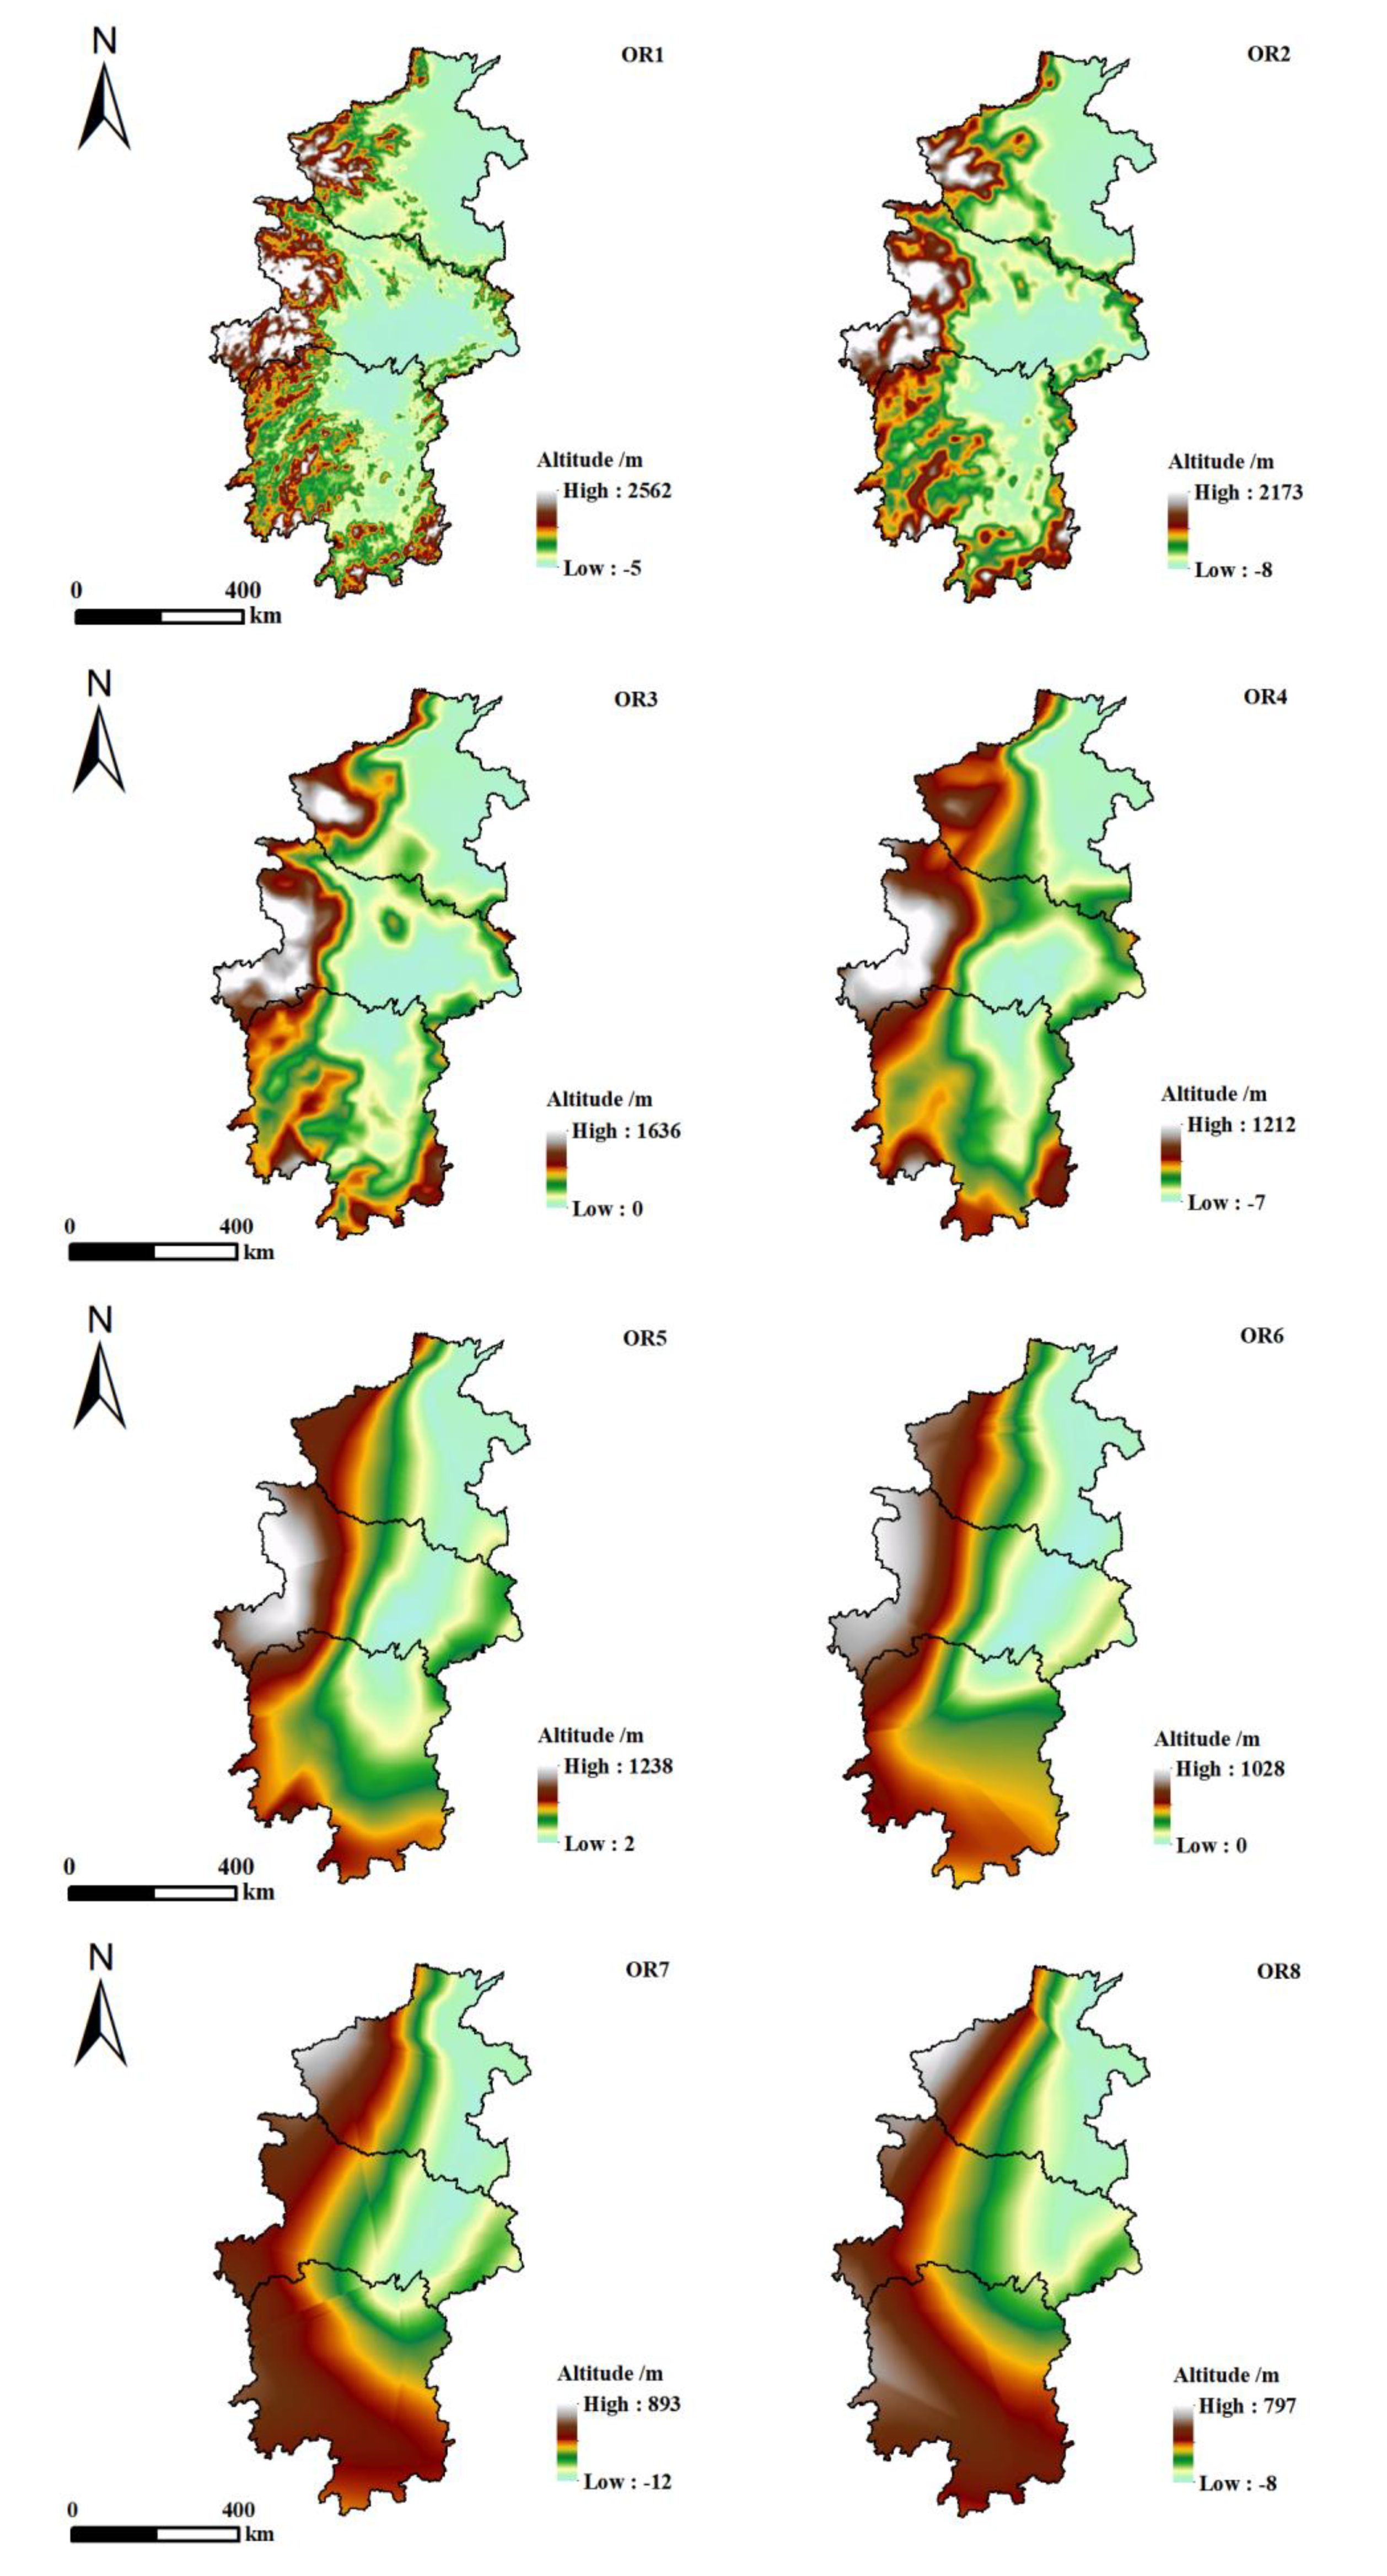
In the process of mode decomposition, the boundary of the signal may be divergent and distorted. This phenomenon may pollute the whole data set inward with the decomposition, resulting in data distortion. This phenomenon is boundary pollution. In order to avoid the boundary pollution caused by BEMD decomposition, this paper decomposes the national DEM data and obtains eight intrinsic mode functions (BIMF1~BIMF8) with frequencies from high to low and their corresponding residual topographic data. We select the residual topographic data (ORIG1~ORIG8) of central China, as shown in Figure 4. Obviously, with terrain decomposition, the residual terrain changes from fine to rough when keeping the macroterrain distribution characteristics of high in the west and low in the mid-east portion of Central China. This process is realized by continuously extracting small-scale terrain areas that are equivalent to noise. By extracting different levels of noise data, small-scale terrain is gradually assimilated by the surrounding terrain, and its impact on the precipitation distribution is smoothed to the surrounding terrain. Therefore, the influence of topography on the precipitation distribution can be divided into two parts: the influence of macrotopography and the influence of small-scale topography. The difference in precipitation distribution under different scale topographies is caused by small-scale topography.
The BEMD method gradually extracts different levels of noise data and obtains different scales of residual terrain, as shown in Figure 4. Obviously, the adjacent residual topography differs little, that at such as OR1 and OR2 and OR7 and OR8. As a result, the simulation results of precipitation based on the margin terrain differ very little. To reflect the significant changes in downward water flow from different scales, the residual terrain is classified in this paper.
3.2. Research on Residual Terrain Classification
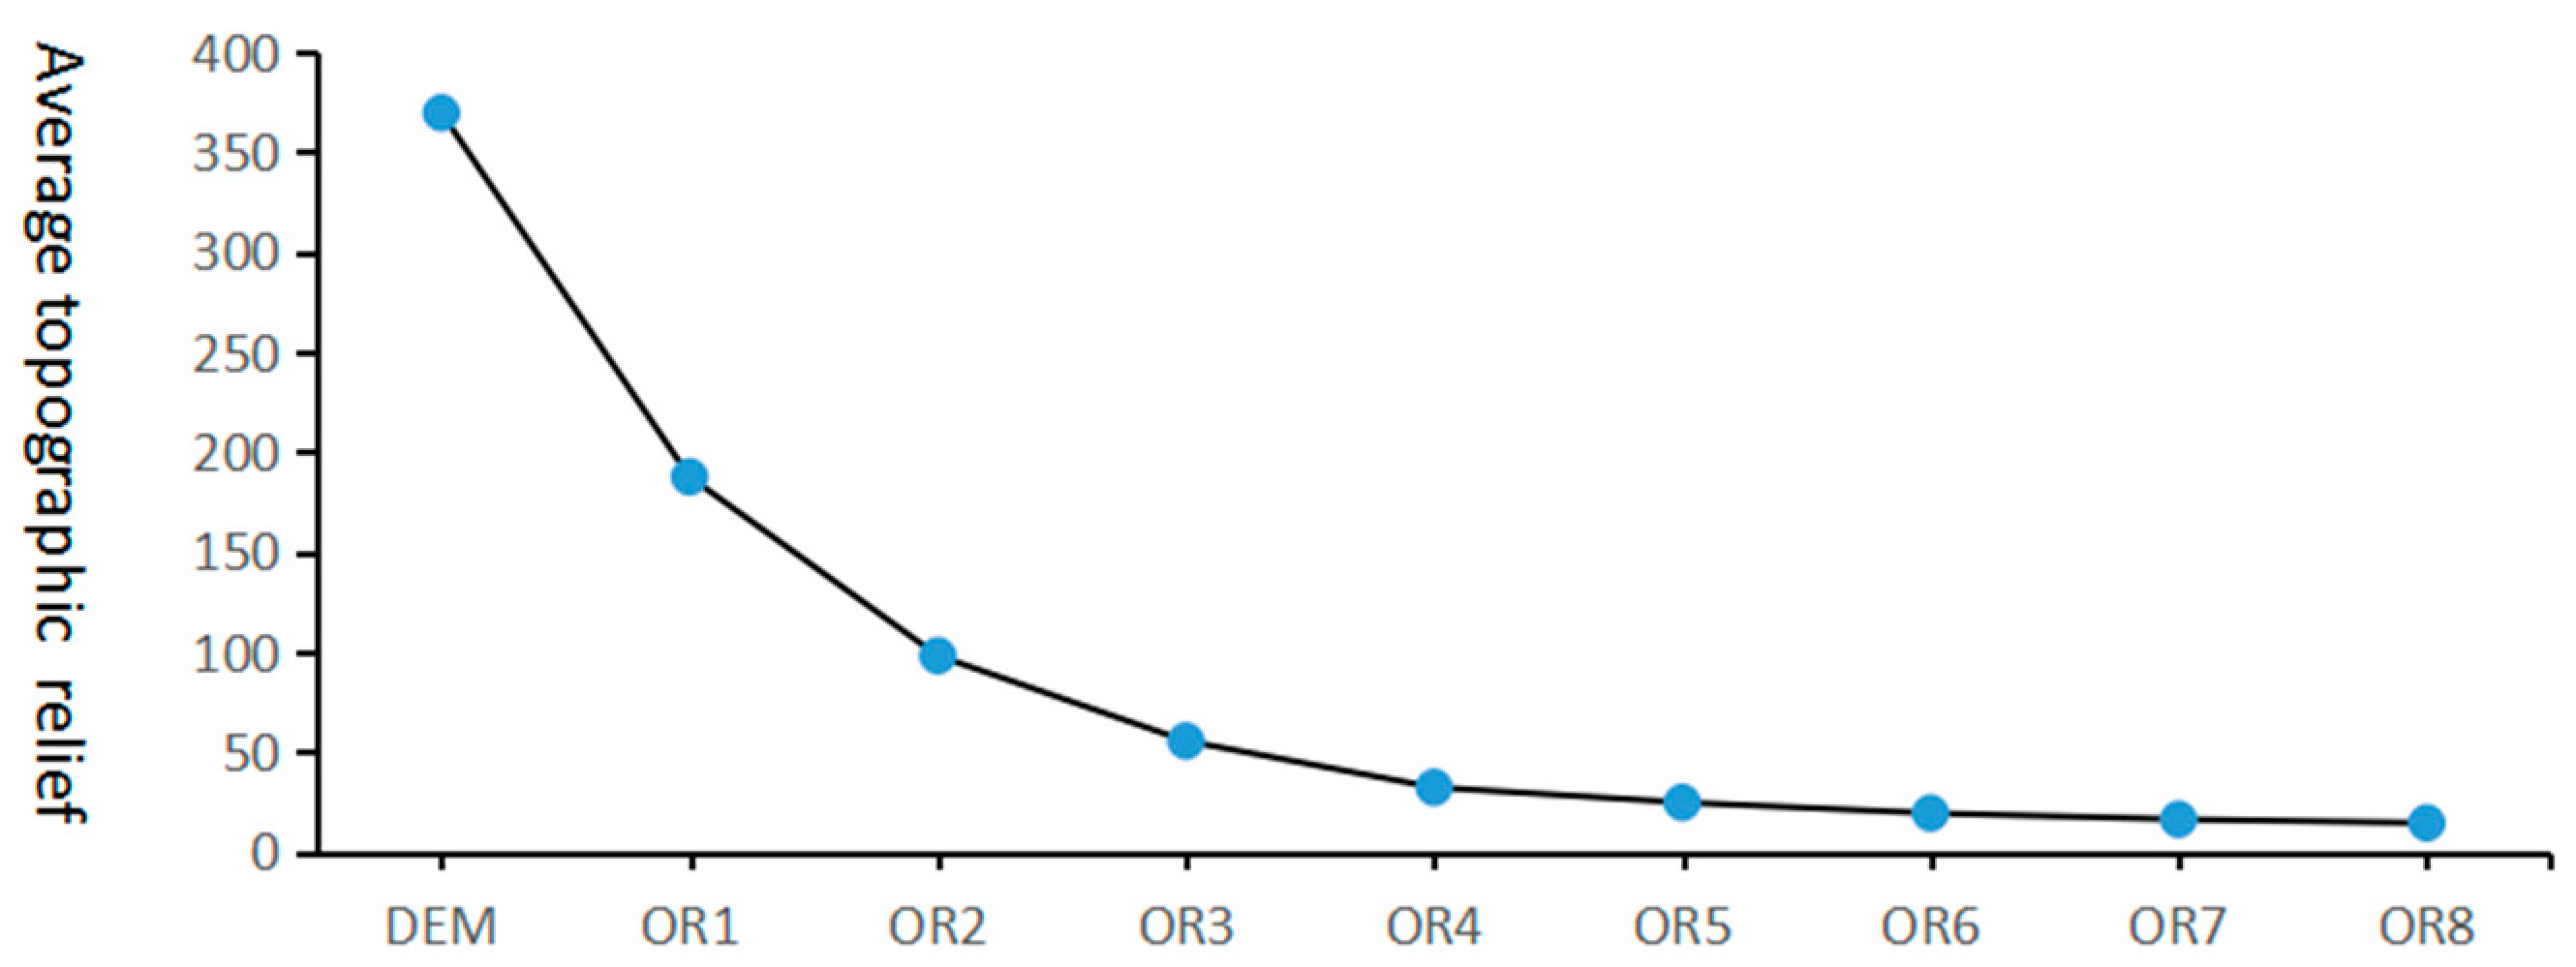
Using the neighbourhood analysis function in ArcGIS, a 9 × 9 grid is adopted as the optimal statistical unit of different levels of macroterrain [29]. The variation rules of average topographic relief under the optimal statistical unit of the original DEM and 8 residual topographic relief were calculated, as shown in Figure 5.
Obviously, under the original DEM, the average topographic relief is maximized, and the mean value of relief gradually decreases with the progression of topographic decomposition, which is obviously consistent with the essence of the data smoothing process in the process of topographic decomposition of BEMD. In addition, from the original DEM terrain to the OR3 terrain, the average topographic relief decreases rapidly, and the rate of change is large. In the process from OR3 to OR5, the average topographic relief still decreases, but the rate of decline obviously becomes slower. During the change process from OR5 to OR8, the downward trend of the average topographic relief is no longer obvious. This means that after OR6, the terrain is relatively smooth, and the terrain changes are not significant. This also shows the correctness of selecting 8 groups of decomposition results to study, as shown in Table 1.
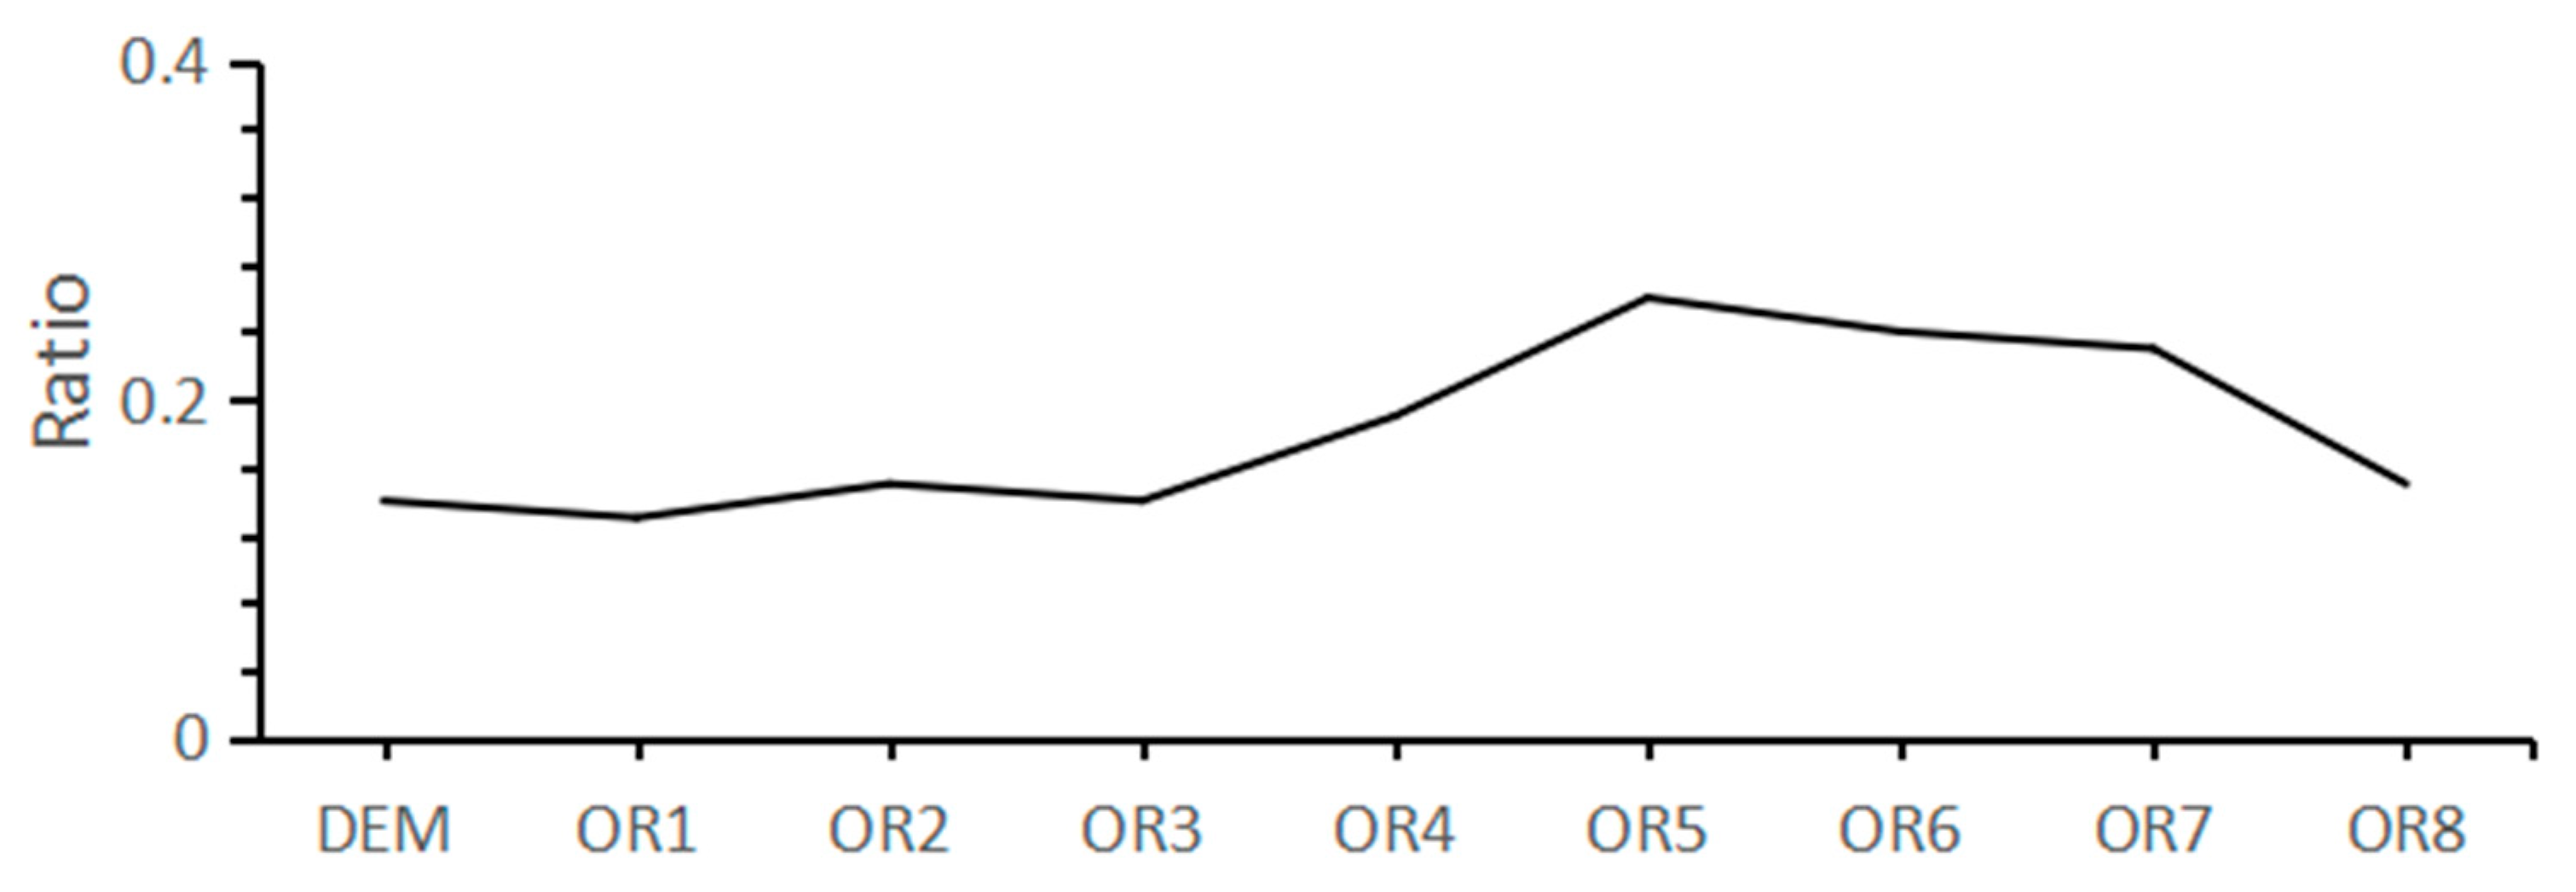
To discuss the rule of ratio changes with terrain scale more intuitively, the trend of ratio change is shown in Figure 6.
According to the ratio variation diagram with various terrain scales, the ratios under the first three scale terrains are very close to that under the original terrain, and the change is stable. Therefore, the microscopic terrains corresponding to the first three scale terrains can be classified into one category. is defined as the first level of small-scale terrain, and OR3 is the corresponding macroterrain. The ratios of OR4 scale terrain and OR5 scale terrain change significantly and show an obvious upward trend. The ratio reaches its maximum value in the OR5 scale terrain. Therefore, they are regarded as one category. is defined as second-level small-scale terrain, and OR5 is the corresponding macroterrain. Under the OR6, OR7 and OR8 terrains, the ratios show a significant downward trend. Therefore, these three different scale terrains are classified into one category; then, is defined as the third-level small-scale terrain, and OR8 is the corresponding macroterrain.
3.3. Simulation Results of Precipitation Model
The influence of small-scale terrain on the spatial distribution of precipitation depends on the distribution of the macroterrain. Therefore, this paper transforms the research on the influence of small-scale terrain on precipitation into the research on the influence of various scale terrains on the spatial distribution of precipitation. Based on the conclusion of different scale terrain classification in the previous section, the research on the influence of microterrain on precipitation can be summarized as the research on the influence of DEM Terrain, OR3, OR5 and OR8 terrain on precipitation. This paper selects one month to test the effectiveness of the method and constructs the precipitation model under different scales of terrain.
In this paper, the HIGH, PPD, β and α of DEM, OR3, OR5 and OR8 are calculated, and the parameters are simulated by a step-by-step multiple regression algorithm. Then, the model is established. Since the model has six model coefficients, at least the six closest meteorological stations to the modelling station are required for modelling. In addition, there is no inevitable relationship between the accuracy of the model and the number of stations. This paper selects the closest 6–40 meteorological stations to each meteorological station for modelling. After proper quality control, the model with the highest correlation coefficient among the 35 sets of models for each station is selected as the precipitation model for this station. That is, each meteorological station uses the precipitation model with the highest correlation coefficient, and each model has 6 parameters. Six planar model coefficients in Central China can be obtained by inverse distance weighted interpolation of these six parameters. Then, the simulated precipitation in Central China can be obtained by using the precipitation model and extracting the model coefficients and model factors. The spatial distribution of simulated precipitation in Central China in April under various scales of terrain is presented in this paper, as shown in Figure 7.
The fineness of the spatial distribution map of precipitation simulated under different scales corresponds to the fineness of the terrain; with increasing terrain scales, the terrain precision gradually decreases, and the characterization ability of precipitation simulation also gradually becomes rough. The simulated spatial distribution characteristics of precipitation in Central China are as follows: (1) under different scales of terrain, the precipitation decreases gradually from south to north and from east to west. The area with the least precipitation is located in the north of Henan Province, and the area with the largest precipitation is distributed in the south and northeast of Hunan Province and the southeast of Hubei Province, which is in line with the precipitation distribution law of Central China. (2) The areas along approximately 112° E, 32° N, and 115° E, 37° N are low precipitation areas and are located east of the mountains. This feature is reflected in the original DEM, OR3 and OR5 terrain. However, with increasing terrain scales, the terrain becomes smooth, and the small value area decreases or even disappears. In addition, in the 111° E–112° E and 27° N–28° N regions, the precipitation distribution reflects the characteristics of the distribution along the mountain. Obviously, with the increase in terrain scale, the detailed characteristics of the precipitation distribution gradually weaken. (3) The windward and leeward slope effects of precipitation change with increasing terrain scales. In the original terrain, the windward slope effect of terrain is the most significant. In the OR3 and OR5 terrains, the precipitation distribution gradually presents a patchy and banded distribution, and the windward slope effect of terrain gradually weakens. In the OR8 terrain, the strip and patch effects of precipitation are more significant.
4. Discussion
To facilitate the description of the model, the models under different scales are named in this paper. The precipitation models corresponding to the DEM, OR3, OR5 and OR8 scales are referred to as B0, B1, B2 and B3, respectively. In order to make the datasets have the same scale (the elevation, the aspect and the slope at a spatial resolution of 1 km; TRMM 3B43 data at spatial resolution of 0.25°), we used “raster computing” tool in ArcGIS 10.3 to generate downscaling products. The spatial resolution of the final downscaling precipitation is 1 km. The precipitation data retrieved from Central China were recorded as model A, as shown in Figure 8.
4.1. Analysis of Precipitation Simulation Results
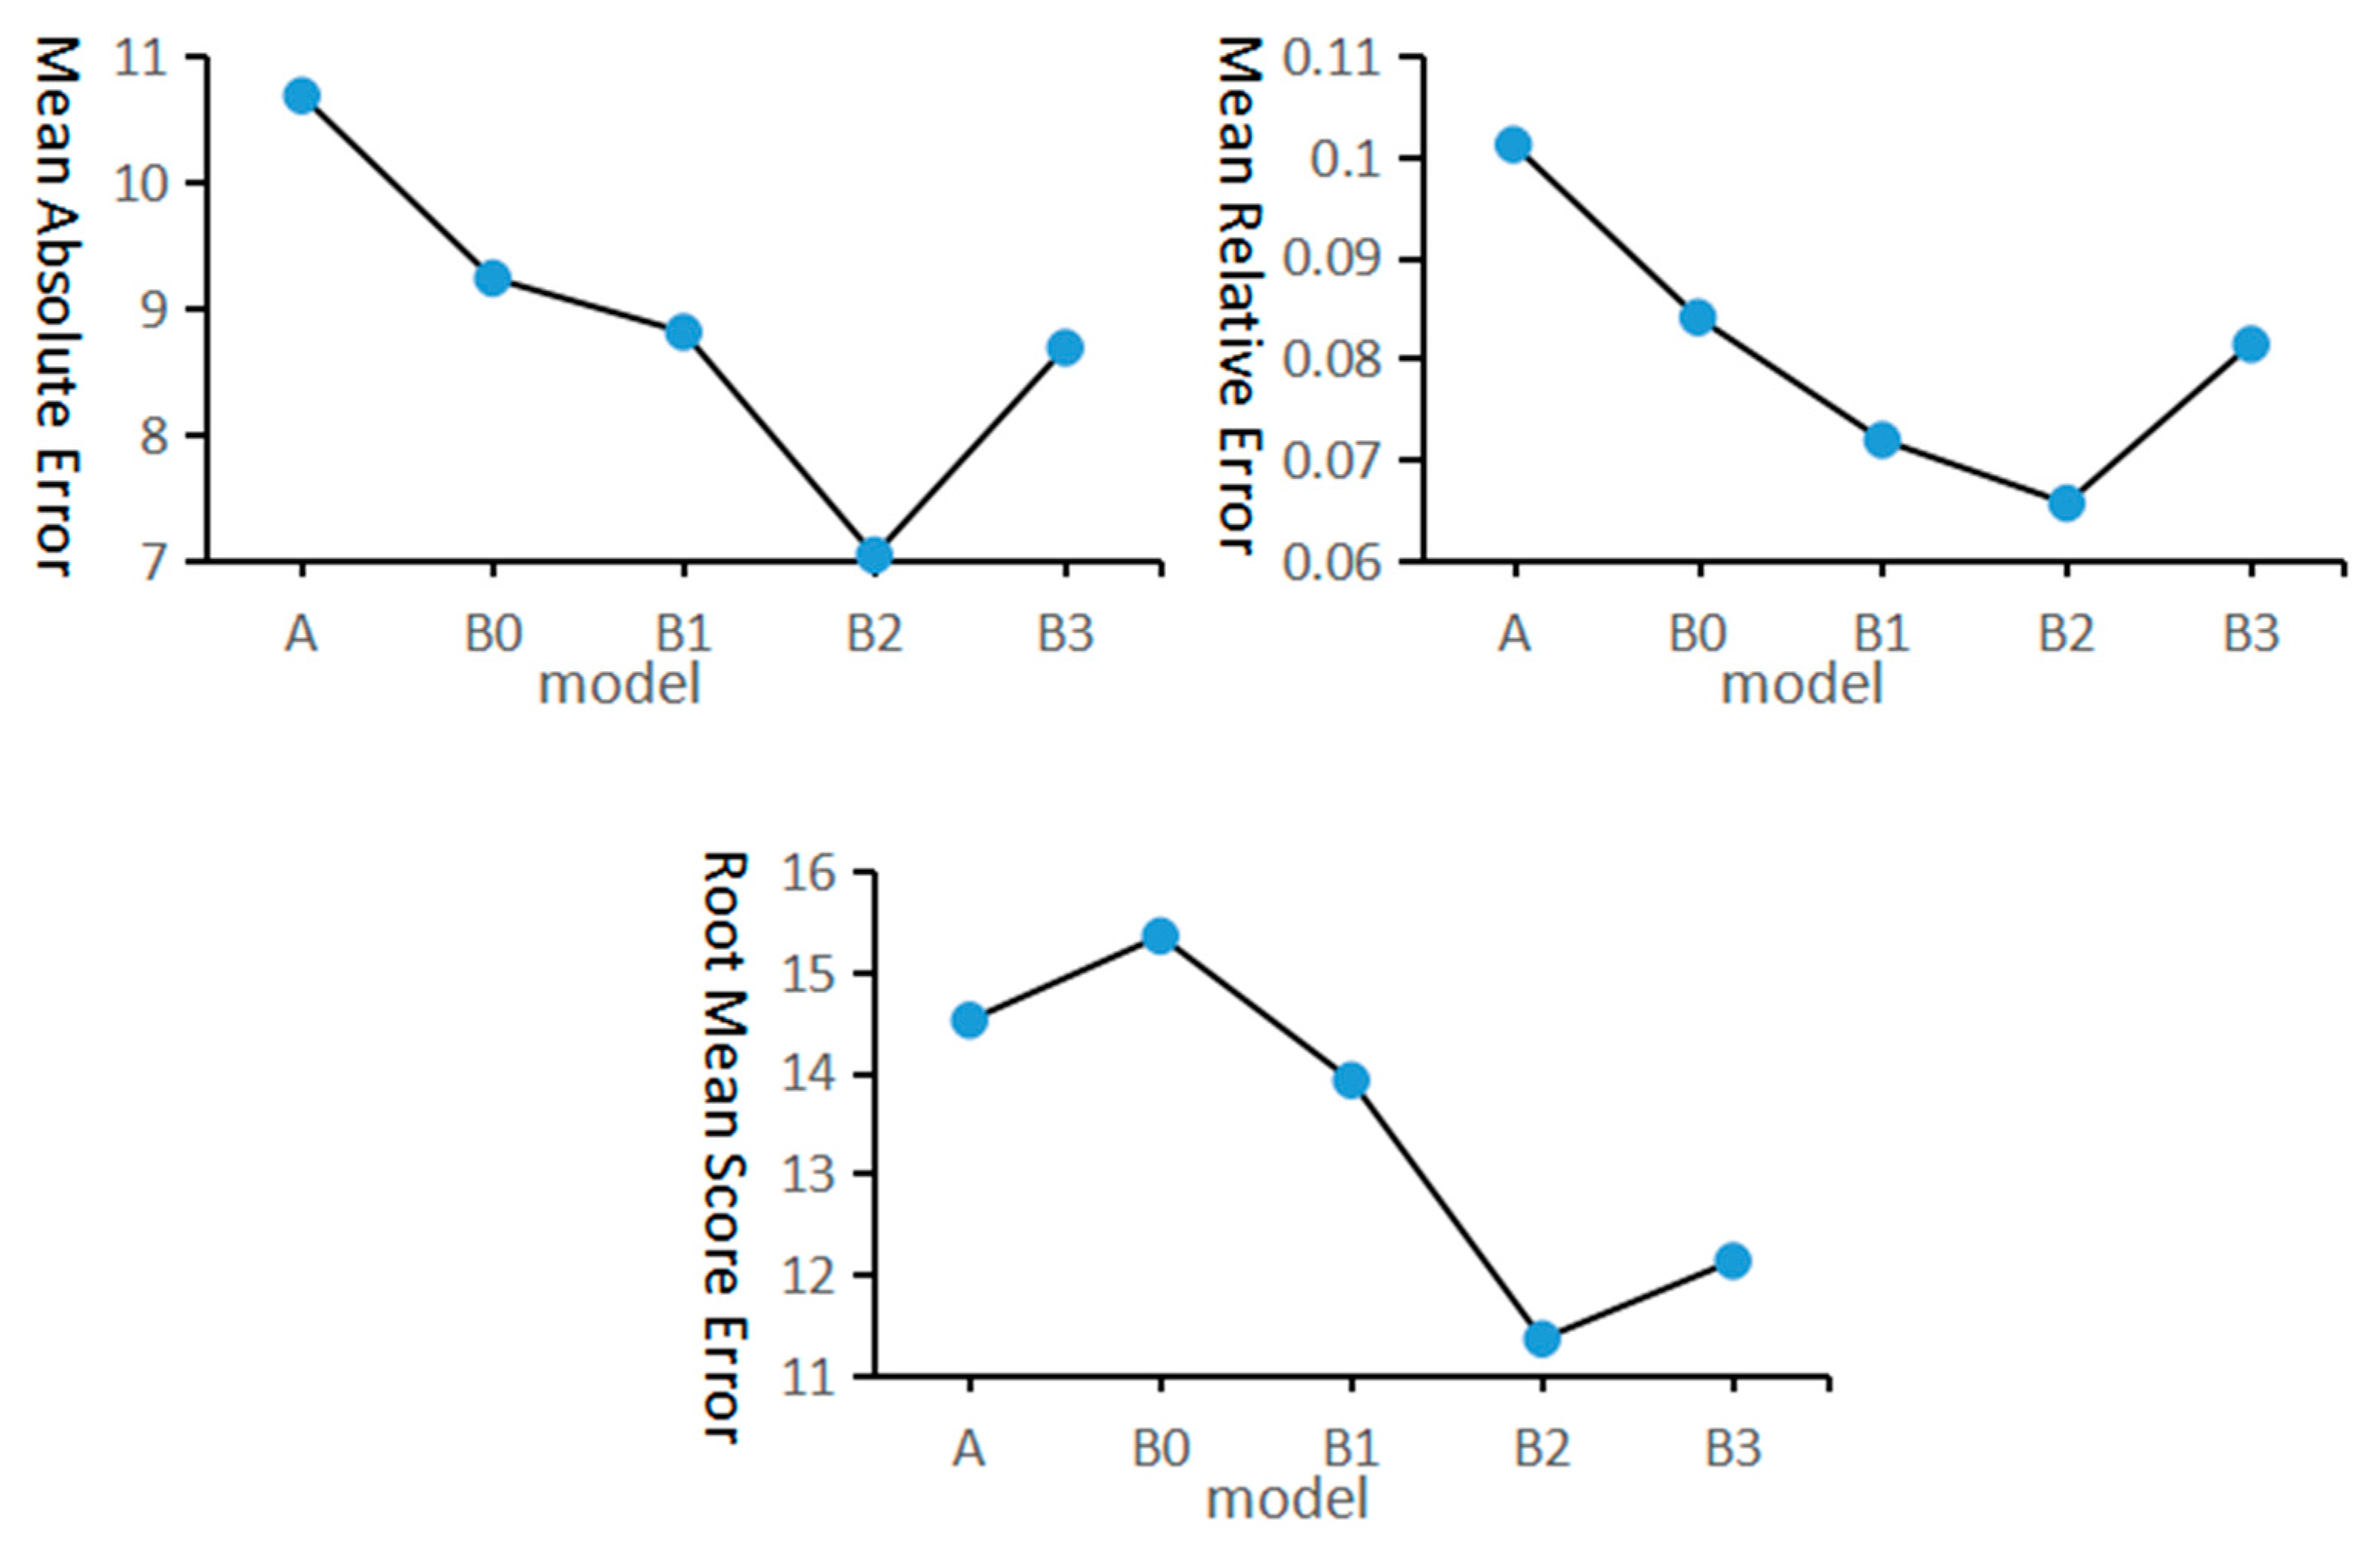
Twenty-eight observation stations in Central China were selected, and then statistical indexes such as correlation coefficient (R), mean absolute error (MAE), mean relative error (MRE) and root mean square error (RMSE) were used to test the accuracy of estimated the precipitation models (B0, B1, B2 and B3) and model A. In the literature, R is used to measure the correlation between two variables, mean absolute error is the mean difference between the estimated and ground-observed data, and mean relative error measures the mean error between the estimated and ground-observed data, as shown in Table 2.
In April, the correlation coefficient of each precipitation model was above 0.97 under all terrains. As shown in Table 2, the correlation coefficient had no significant difference. However, the MAE and the MRE of each model varied significantly, as shown in Figure 9.
According to the MAE and the MRE of each model, the accuracy of the TRMM precipitation data is much lower than that of the precipitation model with the terrain term, which indicates that terrain factors have a significant impact on the spatial distribution of precipitation. From OR3 to OR5, the MAE and the MRE of precipitation show a significant downward trend, which shows that the accuracy of precipitation fitting is significantly improved after extracting the first- and second-order small-scale terrain. That is, the first- and second-order small terrain interferes with the fitting of precipitation. Although the MAE and the MRE of the model under the OR8 terrain are lower than those under the original terrain, they are significantly higher than those under the OR5 terrain, which indicates that the three-level small-scale terrain can enhance the effect of precipitation fitting. Comparing the accuracy of precipitation fitting under the DEM terrain and OR8 terrain, it can be seen that the accuracy of precipitation fitting under the OR8 terrain is slightly higher than that under the original terrain, which shows that the macroterrain plays a leading role in the distribution of precipitation, and the small-scale terrain plays an interference role in the overall results of precipitation fitting.
4.2. Selection and Comparison of Optimal Models
The RMSE is used to measure the deviation between the observed value and the true value. The smaller the RMSE is, the smaller the deviation between the observed value and the true value is, and the higher the accuracy of the model is. Therefore, if the RMSE is used as the evaluation index, model B2 is the optimal model. In addition, for each precipitation spatial distribution model, the larger the R of the model is, the higher the accuracy of the model; the smaller the MAE of the model is, the higher the accuracy of the model; and the smaller the MRE of the model is, the higher the accuracy of the model is. That is, the accuracy of the model is directly proportional to the R of the model and is negatively correlated with the MAE and the MRE of the model. In addition, the MAE, the MRE and the R of the models have a quantitative difference of 100 times, so the MAE of the models is divided by 100 to achieve the comparability of the accuracy indexes of the models. According to the above analysis, we can build a linear comprehensive evaluation index CE. Then, a linear programming [30] is established to meet the maximum accuracy difference between model B2 and model A to simulate the coefficients of CE model:
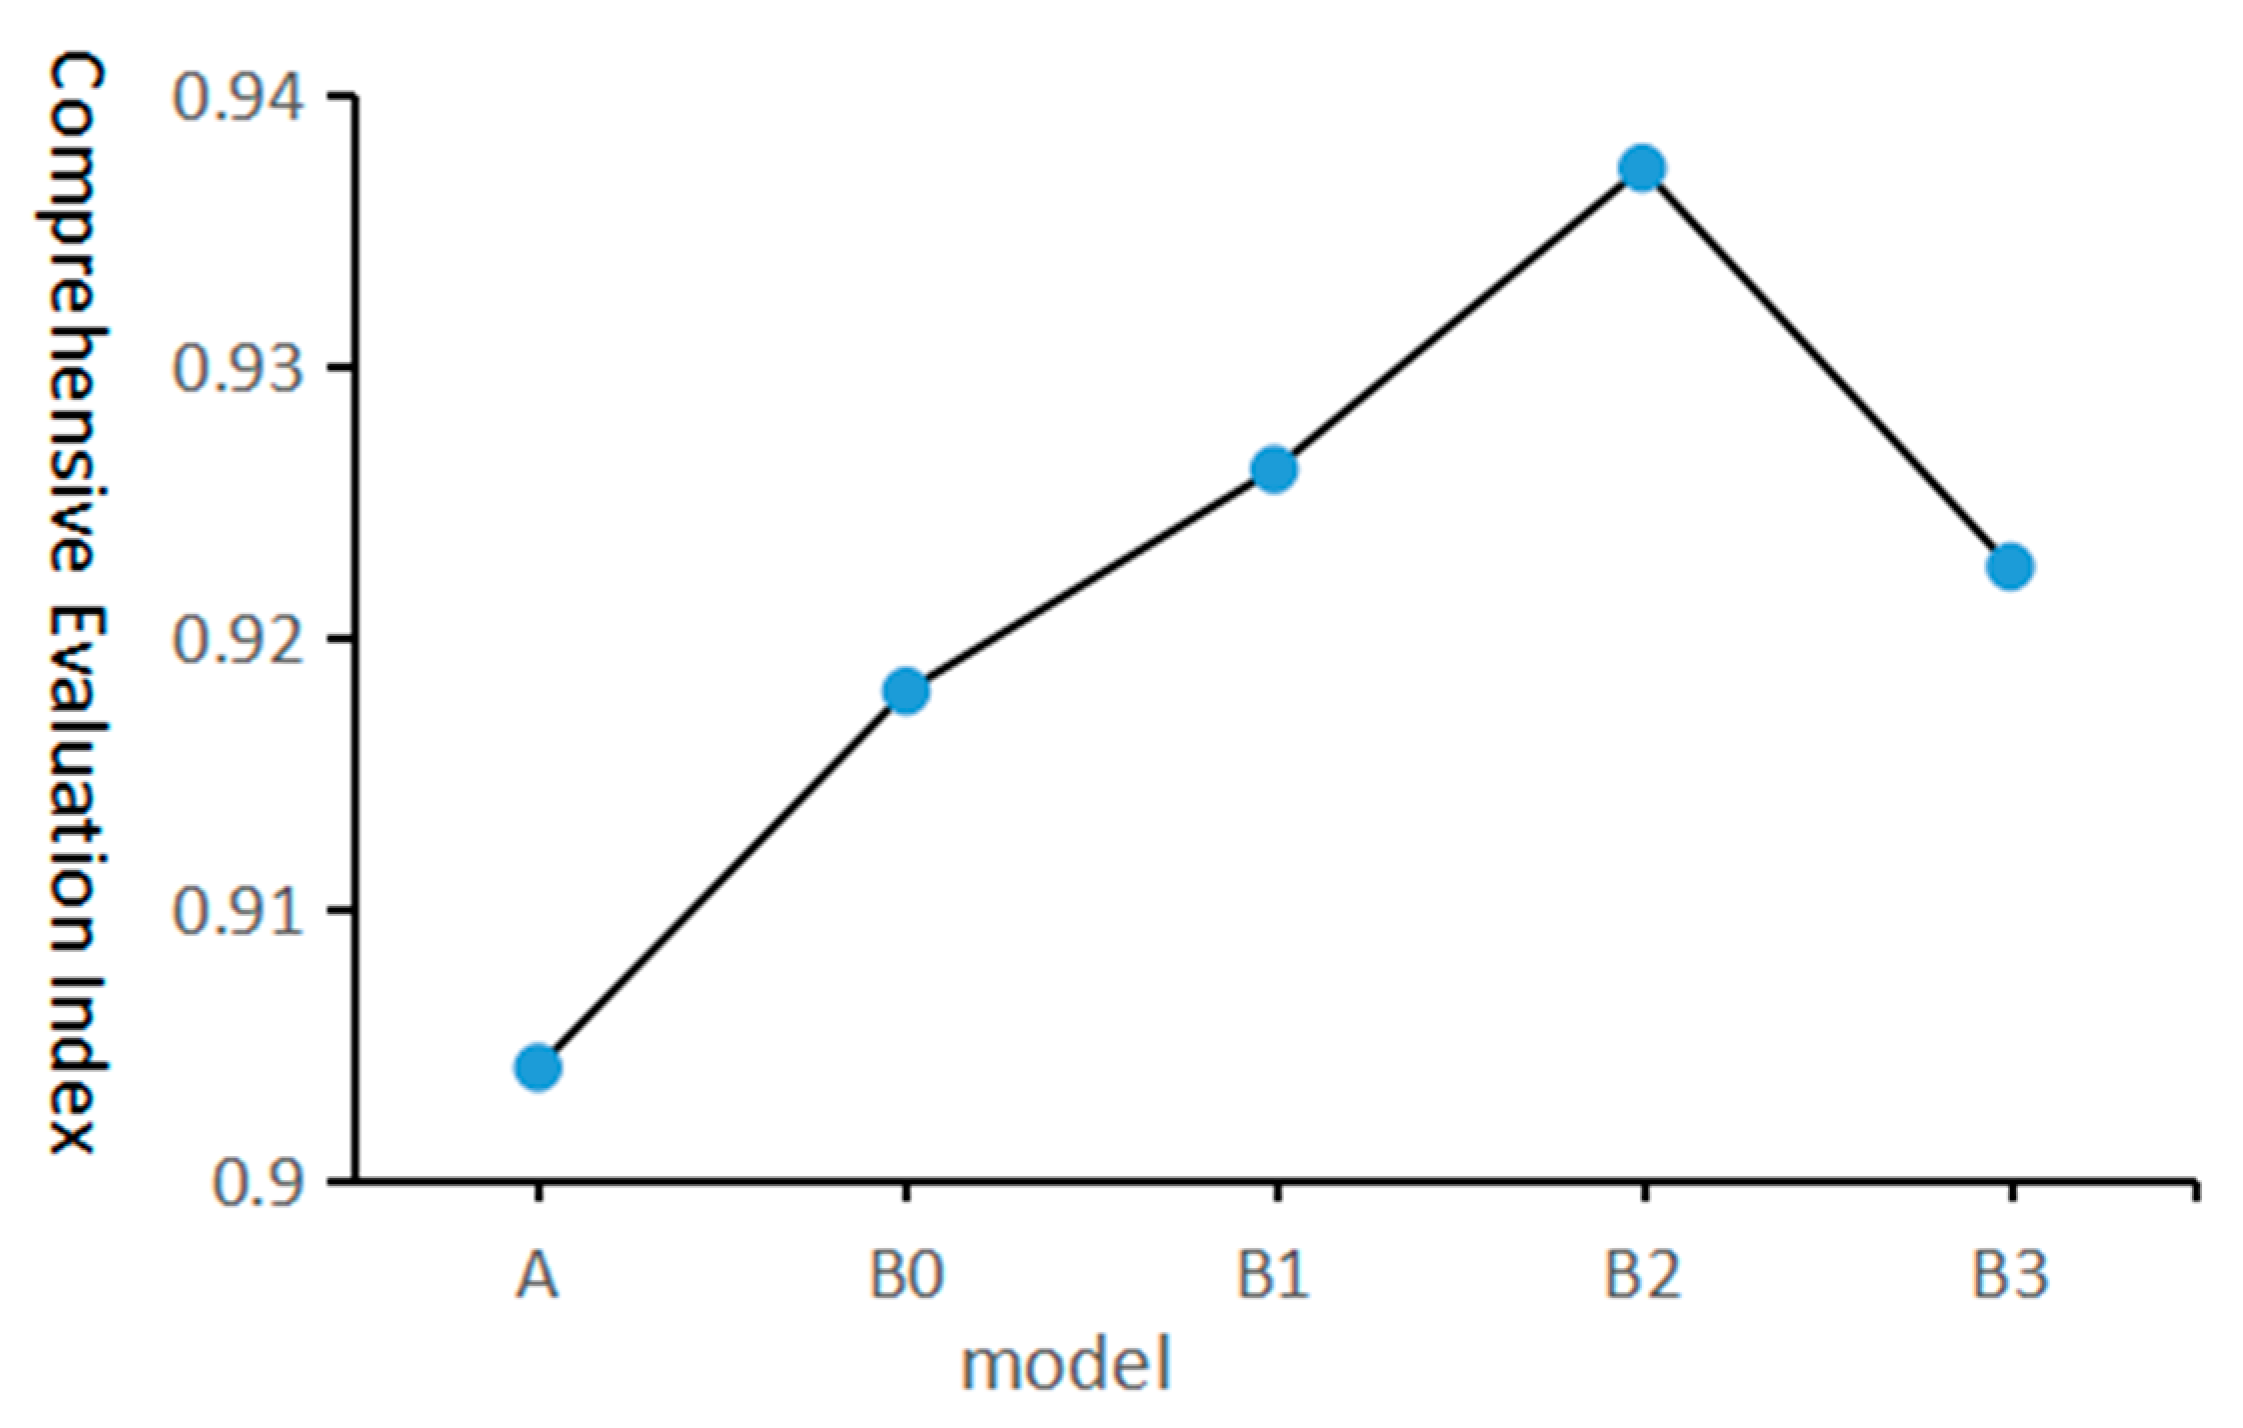
Using the linear comprehensive evaluation index CE, the accuracy of each precipitation model in April in Central China was evaluated, as shown in Figure 10.
Obviously, in all the precipitation models, the comprehensive evaluation index of model A is the lowest; after adding the terrain factor, the comprehensive evaluation index of the monthly precipitation model significantly improves; with the extraction of small-scale terrain, the accuracy of the monthly precipitation model first increases and then decreases and reaches the maximum in model B2. Compared with TRMM model A, the comprehensive evaluation index of model B2 increases by 3.31%; compared with monthly precipitation model B0, the comprehensive evaluation index of model B2 increases by 1.92%. According to Table 2, the error of the B2 model is the smallest, the stability is the highest, and the simulation result is the best.
By comparing model B2 with model A, which is inverted by TRMM 3B43 precipitation data, the MAE of model B2 is 3.64% lower than that of model A, the MRE is 3.54% lower than that of model A and the RMSE is 3.15 lower, as shown in Table 2. The precipitation model B2 based on topographic decomposition was compared with the stepwise regression model used by Zhu et al. [16]. The results show that throughout the whole country, the value of R of Zhu’s model is 0.986, the MAE is 50.7 mm, and the MRE is 6.2%. In Central China, the value of R of the model is 0.984, the MAE is 8.1 mm, and the MRE is 8.78%. Clearly, model B2 provides a more accurate estimate. In addition, Guan et al. [31] used the method with an MAE of 50.7 mm. PRISM’s monthly MAE was approximately 8.2 mm in eastern North America, 4.7 mm in Central America, and 5.7 mm in western North America [32], while model B2’s monthly MAE was approximately 7 mm in Central China. Compared with PRISM’s model accuracy, the model’s accuracy is lower than that of Central America and western North America. However, only 269 meteorological stations and 6 parameters are used in the construction of the precipitation model, which is far lower than PRISM (>13,000 observation stations and >20 parameters of).
5. Conclusions
Based on the idea of terrain decomposition, this paper extracts the small-scale terrain of Central China layer by layer to form a gradually smooth macroterrain distribution. Based on the study of the variation law of the relief degree of the macro terrain, each small-scale terrain is divided into three levels to obtain three macroterrain scales corresponding to the three-level small-scale terrain. Because the influence of small-scale terrain on precipitation is based on the macroterrain distribution, this paper transforms the research on the influence of small-scale terrain on precipitation distribution into research on the influence of different scale terrains on precipitation distribution and verifies it with the precipitation data of meteorological stations. The following can be concluded:
- (1)
- By comparing the comprehensive evaluation indexes of all precipitation models in Central China based on the correlation coefficient, average relative error and average absolute error, model B2 is better than TRMM model A and monthly precipitation model B0.
- (2)
- In Central China, the macrotopography plays a leading role in the precipitation distribution in April, while the small-scale topography interferes with the precipitation fitting.
- (3)
- Different levels of small-scale terrain have different effects on precipitation. In Central China, the first- and second-order small-scale terrain has interference effects on precipitation fitting, and the third-order small-scale terrain has an enhancement effect on precipitation. Therefore, eliminating primary and secondary small-scale terrain features is conducive to improving the accuracy of the model.
This paper studies the influence of small-scale terrains on precipitation in the central region in April. In the northern part of Central China, a negative fitting value of precipitation appears at various scales. In addition, whether the effects of microscopic terrain on precipitation in other months and other regions have different results has not been discussed, and further studies are needed.
Author Contributions
W.G. and X.Q., methodology, software and data curation. X.M., formal analysis. W.G., conceptualization, writing, and original draft preparation. X.Z., validation, resources, writing, review and editing, supervision, project administration, and funding acquisition. All authors have read and agreed to the published version of the manuscript.
Funding
This research was funded by the National Key R&D Program of China (2019YFB2102003), the National Natural Science Foundation of China Project (41805049 and 41971298), Research Start-up Funds of Nanjing University of Information Science and Technology (2018r009), Research Innovation Program for Postgraduates of Ordinary Universities in Jiangsu Province (grant number KYLX_0850), and The Subject of Binjiang School (No. 2019bjyng005).
Institutional Review Board Statement
Not applicable.
Informed Consent Statement
Not applicable.
Data Availability Statement
DEM data in Central China used in this paper come from the resource and environment data cloud platform and are generated by resampling based on SRTM V4.1 data in 2000 (http://www.resdc.cn/data.aspx?DATID=123). The TRMM 3B43 precipitation data used in this paper are from NASA.
Conflicts of Interest
The authors declare no conflict of interest.
References
- North, G.R. Climate change 1994: Radiative forcing of climate change and an evaluation of the IPCC IS92 emission scenarios. Intergovernmental panel on climate change (IPCC). Glob. Planet. Chang. 1997, 15, 59–60. [Google Scholar] [CrossRef]
- Bennett, M.E.; Tobin, K.J. Adjusting Satellite Precipitation Data to Facilitate Hydrologic Modeling. J. Hydrometeorol. 2010, 11, 966–978. [Google Scholar]
- Hou, A.Y.; Kakar, R.K.; Neeck, S.; Azarbarzin, A.A.; Kummerow, C.D.; Kojima, M. The Global Precipitation Measurement Mission. Bull. Am. Meteorol. Soc. 2014, 95, 701–722. [Google Scholar] [CrossRef]
- Jabareen, Y. The Risk City: Countering Climate Change: Emerging Planning Theories and Practices around the World; Springer: Berlin, Germany, 2015. [Google Scholar]
- Cattani, E.; Merino, A.; Levizzani, V. Evaluation of Monthly Satellite-Derived Precipitation Products over East Africa. J. Hydrometeorol. 2016, 17, 2555–2573. [Google Scholar] [CrossRef]
- Goovaerts, P. Geostatistical approaches for incorporating elevation into the spatial interpolation of rainfall. J. Hydrolol. 2000, 228, 113–129. [Google Scholar] [CrossRef]
- Langella, G.; Basile, A.; Bonfante, A. High-resolution space–time rainfall analysis using integrated ANN inference systems. J. Hydrol. 2010, 387, 328–342. [Google Scholar] [CrossRef]
- Jiang, Q. Precipitation over Concave Terrain. J. Atmos. Sci. 2006, 63, 2269–2288. [Google Scholar] [CrossRef]
- LEE, W.C. Tropical Cyclone Kinematic Structure Retrieved from Single-Doppler Radar Observations. Part I: Interpretation of Doppler Velocity Patterns and the GBVTD Technique. Mon. Weather Rev. 1999, 127, 2419–2439. [Google Scholar] [CrossRef]
- Bougeault, P.; Buzzi, A.; Dirks, R. The MAP Special Observing Period. Bull. Am. Meteorol. Soc. 2001, 82, 433–462. [Google Scholar] [CrossRef] [Green Version]
- Bosch, D.D.; Davis, F.M. Rainfall Variability and Spatial Patterns for the Southeast. In Proceedings of the Fourth International Conference on Precision Agriculture; John Wiley & Sons, Ltd.: Hoboken, NJ, USA, 2015. [Google Scholar]
- Marquínez, J.; Lastra, J.; García, P. Estimation models for precipitation in mountainous regions: The use of GIS and multivariate analysis. J. Hydrol. 2003, 270, 1–11. [Google Scholar] [CrossRef]
- Naoum, S.; Tsanis, I.K. Orographic Precipitation Modeling with Multiple Linear Regression. J. Hydrol. Eng. 2004, 9, 79–101. [Google Scholar] [CrossRef]
- Jia, S.; Zhu, W.; Lű, A.; Yan, T. A statistical spatial downscaling algorithm of TRMM precipitation based on NDVI and DEM in the Qaidam Basin of China. Remote Sens. Environ. 2011, 115, 3069–3079. [Google Scholar] [CrossRef]
- Shi, Y.; Song, L.; Xia, Z.; Lin, Y.; Myneni, R.B.; Choi, S.; Wang, L.; Ni, X.; Lao, C.; Yang, F. Mapping Annual Precipitation across Mainland China in the Period 2001–2010 from TRMM3B43 Product Using Spatial Downscaling Approach. Remote Sens. 2015, 7, 5849–5878. [Google Scholar] [CrossRef] [Green Version]
- Zhu, X.; Qiu, X.; Zeng, Y.; Ren, W.; Tao, B.; Pan, H.; Gao, T.; Gao, J. High-resolution precipitation downscaling in mountainous areas over China: Development and application of a statistical mapping approach. Int. J. Climatol. 2018, 38, 77–93. [Google Scholar] [CrossRef]
- Demko, J.C.; Geerts, B. A Numerical Study of the Evolving Convective Boundary Layer and Orogra. Mon. Weather Rev. 2010, 138, 3603–3622. [Google Scholar] [CrossRef] [Green Version]
- Fu, P.; Zhu, K.; Zhao, K.; Zhou, B.; Xue, M. Role of the Nocturnal Low-level Jet in the Formation of the Morning Precipitation Peak over the Dabie Mountains. Adv. Atmos. Sci. 2019, 36, 17–30. [Google Scholar] [CrossRef]
- Zhang, H.; Zhai, P. Temporal and spatial characteristics of extreme hourly precipitation over eastern China in the warm season. Adv. Atmos. Sci. 2011, 28, 1177–1183. [Google Scholar] [CrossRef]
- Nunes, J.C.; Niang, O.; Bouaoune, Y.; Delechelle, E.; Bunel, P. Bidimensional Empirical Mode Decomposition Modified for Texture Analysis. In Proceedings of the Scandinavian Conference on Image Analysis, Halmstad, Sweden, 29 June–2 July 2003; Springer: Berlin, Germany, 2003. [Google Scholar]
- Nunes, J.C.; Guyot, S.; Delechelle, E. Texture analysis based on local analysis of the Bidimensional Empirical Mode Decomposition. Mach. Vis. Appl. 2005, 16, 177–188. [Google Scholar] [CrossRef]
- Yang, J.; Guo, L.; Yang, H. A new multi-focus image fusion algorithm based on BEMD and improved local energy. IEEJ Trans. Electr. Electron. Eng. 2015, 10, 447–452. [Google Scholar] [CrossRef]
- Lahmiri, S. Image denoising in bidimensional empirical mode decomposition domain: The role of Student’s probability distribution function. Healthc. Technol. Lett. 2016, 3, 15–28. [Google Scholar] [CrossRef] [Green Version]
- Tian, Y.; Zhao, K.; Xu, Y.; Peng, F. An image compression method based on the multi-resolution characteristics of BEMD. Comput. Math. Appl. 2011, 61, 2142–2147. [Google Scholar] [CrossRef] [Green Version]
- Ma, M.; Feng, G. Remote sensing image texture enhancement based on HSV-BEMD algorithm. In Proceedings of the Eleventh International Conference on Digital Image Processing (ICDIP 2019), Guangzhou, China, 10–13 May 2019. [Google Scholar]
- Broucke, S.V.; Wouters, H.; Demuzere, M.; van Lipzig, N.P.M. The influence of convection-permitting regional climate modeling on future projections of extreme precipitation: Dependency on topography and timescale. Clim. Dyn. 2019, 52, 5303–5324. [Google Scholar] [CrossRef]
- Ding, S.; Du, P.; Zhao, X. BEMD image fusion based on PCNN and compressed sensing. Soft Comput. 2019, 23, 10045–10054. [Google Scholar] [CrossRef]
- Simpson, J.; Tao, W.K. The Goddard Cumulus Ensemble Model. Part II: Applications for studying cloud precipitating processes and for NASA TRMM. Terr. Atmos. Ocean. Sci. 1993, 4, 73–116. [Google Scholar] [CrossRef]
- Zhang, K.; Ba, M.; Meng, H.; Sun, Y. Correlation Analysis of Elevation and the Relief Degree of Land Surface in Henan Province. In Proceedings of the 2018 2nd International Conference on Applied Mathematics, Modelling and Statistics Application (AMMSA 2018), Sanya, China, 27–28 May 2018. [Google Scholar]
- Benichou, M.; Gauthier, J.M.; Hentges, G.; Ribiere, G. The efficient solution of large-scale linear programming problems—some algorithmic techniques and computational results. Math. Program. 1977, 13, 280–322. [Google Scholar] [CrossRef]
- Guan, H.; Wilson, J.L.; Makhnin, O. Geostatistical mapping of mountain precipitation incorporating autosearched effects of terrain and climatic characteristics. J. Hydrometeorol. 2005, 6, 1018–1031. [Google Scholar] [CrossRef]
- Daly, C.; Neilson, R.P.; Phillips, D.L. A statistical-topographic model for mapping climatological precipitation over mountainous terrain. J. Hydrometeorol. 1994, 33, 140–158. [Google Scholar] [CrossRef] [Green Version]
Figure 1.
DEM spatial distribution map of 1 km × 1 km resolution in Central China.

Figure 2.
Spatial distribution of meteorological observation stations in the central part of China (269 modelling stations; 28 validation stations).
Figure 2.
Spatial distribution of meteorological observation stations in the central part of China (269 modelling stations; 28 validation stations).

Figure 3.
BEMD terrain decomposition process.

Figure 4.
Terrain decomposition results of BEMD in Central China.

Figure 5.
Variation curve of the average topographic relief with topographic decomposition.

Figure 6.
Variation pattern of ratios with terrain scales.

Figure 7.
Water simulation results of topographic drop in Central China at various scales.

Figure 8.
Average of TRMM data with spatial resolution of 1 km in Central China from 2000 to 2017 in April.
Figure 8.
Average of TRMM data with spatial resolution of 1 km in Central China from 2000 to 2017 in April.

Figure 9.
MAE, MRE and RMSE under various scales in Central China.

Figure 10.
Comprehensive evaluation index of precipitation models in Central China.


Table 1.
Shows the change of ratio with terrain scale.
| Terrain | DEM | OR1 | OR2 | OR3 | OR4 | OR5 | OR6 | OR7 | OR8 |
|---|---|---|---|---|---|---|---|---|---|
| Ratio | 0.14 | 0.13 | 0.15 | 0.14 | 0.19 | 0.26 | 0.24 | 0.23 | 0.15 |
Table 2.
Statistical results of the precipitation model in Central China verified by encryption stations.
Table 2.
Statistical results of the precipitation model in Central China verified by encryption stations.
| Model Category | TRMM | Precipitation Models | ||||
|---|---|---|---|---|---|---|
| Model Scale | Null | DEM | OR3 | OR5 | OR8 | |
| Mode Code | A | B0 | B1 | B2 | B3 | |
| April | R | 0.97 | 0.97 | 0.97 | 0.98 | 0.98 |
| MAE | 10.68 | 9.238 | 8.81 | 7.04 | 8.68 | |
| MRE | 10.11% | 8.4% | 7.19% | 6.57% | 8.14% | |
| MARE | 14.51 | 15.35 | 13.92 | 11.36 | 12.13 | |
Publisher’s Note: MDPI stays neutral with regard to jurisdictional claims in published maps and institutional affiliations. |
© 2021 by the authors. Licensee MDPI, Basel, Switzerland. This article is an open access article distributed under the terms and conditions of the Creative Commons Attribution (CC BY) license (http://creativecommons.org/licenses/by/4.0/).
Share and Cite
MDPI and ACS Style
Gu, W.; Zhu, X.; Meng, X.; Qiu, X. Research on the Influence of Small-Scale Terrain on Precipitation. Water 2021, 13, 805. https://doi.org/10.3390/w13060805
AMA Style
Gu W, Zhu X, Meng X, Qiu X. Research on the Influence of Small-Scale Terrain on Precipitation. Water. 2021; 13(6):805. https://doi.org/10.3390/w13060805
Chicago/Turabian StyleGu, Wenya, Xiaochen Zhu, Xiangrui Meng, and Xinfa Qiu. 2021. "Research on the Influence of Small-Scale Terrain on Precipitation" Water 13, no. 6: 805. https://doi.org/10.3390/w13060805
Note that from the first issue of 2016, this journal uses article numbers instead of page numbers. See further details here.