Article

Efficiency and Energy Demand in Polishing Treatment of Wastewater Treatment Plants Effluents: Photoelectrocatalysis vs. Photocatalysis and Photolysis

by
Maria Cristina Collivignarelli
1,2,
Marco Carnevale Miino
1,
Hamed Arab
3,
Massimiliano Bestetti
3 and
Silvia Franz
3,*
1
Department of Civil Engineering and Architecture, University of Pavia, 27100 Pavia, Italy
2
Interdepartmental Centre for Water Research, University of Pavia, 27100 Pavia, Italy
3
Department of Chemistry, Materials and Chemical Engineering “Giulio Natta”, Politecnico di Milano, 20131 Milano, Italy
*
Author to whom correspondence should be addressed.
Water 2021, 13(6), 821; https://doi.org/10.3390/w13060821
Submission received: 22 February 2021 / Revised: 9 March 2021 / Accepted: 10 March 2021 / Published: 17 March 2021

Abstract

:
Photoelectrocatalysis (PEC), photolysis (PL), and photocatalysis (PC) were applied to increase the biodegradability of wastewaters effluents sampled from a plant collecting both municipal wastewaters and aqueous waste. In PEC, the catalyst was a porous TiO2 photoanode obtained by plasma electrolytic oxidation and electrically polarized during operation. In PC a dispersion of TiO2 powders was used. The same irradiation shielding, and similar catalyst surface areas were set for PC and PEC, allowing a straightforward evaluation of the catalytic effect of the electrical polarization of TiO2 during operation. Results showed that the chemical oxygen demand (COD) and color removal rates follow the order: PEC > PL and PEC > PC. The specific biodegradability rate (SBR) increased following the same order, the PEC process allowing SBR values more than twice higher than PL and PC. The operating costs were calculated based on the electrical energy per order of COD, color, and SBR values, demonstrating that at the laboratory scale the energy demand of PEC is significantly lower than the other two tested processes.

1. Introduction

Wastewaters (WWs) usually contain a number of different contaminants, including chromophores, heavy metals, pesticides, surfactants, and solvents [1]. Given the extremely different composition of the industrial and municipal WWs both in terms of nature and concentration of pollutants, a universal strategy for water remediation is not feasible. Additionally, most of the conventional wastewater treatment plants (WWTPs) have not been designed to remove those classes of pollutants, therefore the same contaminants often remain in the wastewater treatment plant effluents (WWTPEs) representing a possible threat for both the human health and the aquatic system [2,3,4]. Several techniques including physical approaches, biological treatments, conventional chemical, and advanced oxidation processes have been proposed for the finishing of WWs [5,6,7,8,9]. Among them, advanced oxidation processes (AOPs) demonstrated a great potential in removing persistent organic pollutants and in increasing the biodegradability of WWs, and for this reason, they are often suggested in combination with conventional biological treatments [10,11,12,13]. The strength of AOPs lies in the generation of hydroxyl (OH) radical species characterized by low reaction selectivity and high oxidation potential (E●OH/H2O = 2.80 V vs. SHE at Troom) thus theoretically able to induce complete mineralization of almost any pollutant. Among the several advanced oxidation techniques reported in literature or already implemented at the industrial scale, photoelectocatalysis (PEC) for water treatment is relatively unexplored [14].
However, the potential of this technique is evident to the academic community and dedicated reviews on PEC applied to water treatment recently appeared [15,16]. PEC can be considered a combination of heterogeneous photocatalysis (PC) and electrochemistry. Upon suitable irradiation of a semiconductor catalyst, electrons in the valence band (VB) are excited to the conduction band (CB), leaving holes in the VB which can undergo several pathways: (i) direct oxidation of the organic species; (ii) production of hydroxyl radicals from water oxidation. The photanode catalyst in PEC is immobilized on conductive substrates, thus the electron-hole recombination, which usually hampers PC processes, in PEC can be minimized by the application of an electrical bias, which brings the electrons from the conduction band to the counter electrode (cathode). This mechanism increases the photocatalytic efficiency of the supported semiconductor, compensating for the reduced surface area with respect to dispersed powders preferentially used in PC [17,18]. Therefore, PEC can overcome some practical disadvantages of PC processes, usually based on free-suspended catalysts, by increasing the process efficiency, avoiding the loss of catalyst particles and their recovery at the end of the treatment.
PEC photoanodes can be made of a number of semiconductors, such as TiO2, ZnO, MgO, WO3, etc. [19,20], among which TiO2-based materials are the most investigated because of low cost, availability, chemical and photochemical stability, and catalytic activity [21,22,23,24,25]. Several techniques are used to synthesize photoactive supported TiO2 films, including sol-gel, chemical vapor deposition, radio frequency magnetron sputtering, plasma spray, electron beam evaporation, and finally anodic oxidation and plasma electrolytic oxidation (PEO) [26,27,28,29,30,31,32]. Among them, PEO presents some advantages, such as strong mechanical adhesion and good electrical contact with the substrate [33], short processing time, high growth rates (~1 µm/min), and instantaneous oxide crystallization [34,35,36]. Moreover, PEO is already implemented at the industrial scale for the synthesis of protective coatings on Al and Mg alloys, therefore no issues are foreseen for the scaling-up.
Several recent works demonstrated that PEC is more efficient than both PC and photolysis (PL) processes [32,37,38,39]. However, results mostly concerned model contaminated solutions so that the feasibility of PEC treatment of real wastewaters is still an issue. For instance, Garcia-Segura et al. [40] highlighted that the considerable differences between the concentrations of the target pollutants tested in the laboratory and the environmental ones could determine real removal kinetics decidedly different from those obtained in the studies conducted on synthetic matrices. Recently the authors applied PEC processes to the decolorization of pharmaceutical WWs [7] and to the degradation of recalcitrant and emerging organic pollutants [37,38], showing that PEC, combined with H2O2 if necessary, has higher efficiency than PL and PC both in terms of degradation kinetics, number of dangerous by-products and energy costs.
In this study, a step forward has been done in view of the application of PEC as a polishing treatment of WWTPE. This study aims to verify the feasibility of the application of PEC on this type of water with a view to its practical application in WWTP authorized to treat also aqueous waste (AW). PEC has been carried out on TiO2 photoanodes obtained by PEO, whose activity in the field of water treatment is of emerging interest. Several parameters of environmental interest such as color, organic matter, and biodegradability were monitored, and the energy demand of the tested processes was evaluated.

2. Materials and Methods

In this work, a real WWTPE (described in Section 2.1) has been treated with PL, PC, and PEC. The production of the TiO2 photoanode used in PEC tests is described in Section 2.2. Section 2.3 focuses on the experimental setup. Finally, the analysis and calculations used to evaluate the effectiveness of treatments and the energy consumption is presented in Section 2.4.

2.1. Chemical and Biochemical Properties of the Treated WWTPE

The WWTPE was collected from a plant authorized to treat both municipal WW and AW. The AW was pre-treated by biological and physico-chemical steps in the operative unit I, then it was mixed with the municipal WW before the operative unit II, which includes conventional WW treatment stages (without primary settler). The sampling point was located downstream the unit II, i.e., after a conventional active sludge (CAS) system with a pre-denitrification and before the discharge into the nearby river. The chemical and biochemical properties of the effluents are reported in Table 1. In particular, the total suspended solids (TSS) were almost absent. The effluents showed a very low biodegradability (SOUR: 0.8–1.7 mg O2 gVSS−1 h−1) and yellow color.

2.2. Production of the TiO2 Photoanode

An expanded metal mesh of commercially pure Grade 1 titanium (Nanomaterials S.r.l., Milano, Italy) having a geometrical area of 327 cm2 was treated by PEO following the approach described by Franz et al. [34,36,42]. After PEO, the oxidized mesh was rinsed with water and dried in a stream of air. Several smaller specimens of 18 cm2 area were also synthesized in the same conditions for destructive characterization. Surface morphology was observed by Scanning electron microscopy (SEM) (Zeiss EVO 50, Carl Zeiss Jena GmbH, Jena, Germany). The same instrument was used to assess the TiO2 film thickness using cross-section SEM images. Crystalline structure was determined by a PW1830 diffractometer (Malvern Panalytical Ltd., Malvern, UK and Almelo, The Netherlands) operating at 40 kV voltage and 40 mA filament current. The indexing of the X-ray diffraction (XRD) patterns was based on powder diffraction files (PDF) (International Center for Diffraction Data), namely PDF 44-1294, PDF 21-1272, and PDF 21-1276, for titanium, anatase, and rutile, respectively, and the weight fraction of anatase was evaluated following Spurr and Myers [43].
Photoelectrochemical activity was investigated by measuring the current flowing in the reactor in a 4 mM KCl aqueous solution with and without irradiation of a 30 W low-pressure Hg vapor lamp (S.I.T.A. S.r.l., Genova, Italy) using the stainless-steel reactor described in Section 2.3 as electrochemical cell, where the TiO2 photoanode and the steel body of the reactor were employed as working and counter electrode, respectively. Photocurrent measurements as a function of the applied bias and Cyclic Voltammetry (CV) tests were conducted utilizing a ModuLab® XM ECS high-performance potentiostat/galvanostat system (Solartron Analytical, XM PSTAT 1 MS/s, Ametek Inc., Berwyn, IL, USA). The radiant density flux of the irradiation source at 254 nm was measured by actinometry tests using 10 mM uridine (CAS Number 58-96-8, Sigma-Aldrich, St. Louis, MO, USA).
The surface area of the catalyst was measured both by Brunauer–Emmett–Teller (BET) and electrochemical surface area (ECSA) techniques. BET surface area was determined at 77 K by adsorption of N2 gas probe (Tristar II 3020, Micromeritics Instruments Corp., Norcross, GA, USA) after outgassing the samples at 80 °C for 24 h under nitrogen flux, and the nitrogen isotherms were analyzed by BET theory using the instrumental software (Version 1.03). The ECSA of TiO2 films was determined from the electrochemical capacitance by cyclic voltammetry [44]: five CV cycles were recorded at different scan rates (50, 100, 200, 300, and 400 mV s−1) in a 1.0 M NaOH solution (CAS 1310-73-2, Sigma-Aldrich, St. Louis, MO, USA) in a potential window of ±50 mV centered at open circuit potential. The average capacitive currents measured in the middle of the potential range were plotted as a function of the potential sweep rates.

2.3. Experimental Set-Up

Three different working conditions were tested:
(A)
Photolysis (PL)
(B)
Photocatalysis (PC) onto suspended TiO2 powders
(C)
Photoelectrocatalysis (PEC) with TiO2 photoanode
The diverse tests were carried out for a reaction time of 2 h.
The PEC and PL tests were carried out in a 1 L laboratory-scale stainless-steel tubular reactor connected to a 2.8 L buffer reservoir and working in semi-batch mode [39,45]. The body of the reactor contained a tubular 30 W low-pressure Hg vapor UV-C lamp emitting at 254 nm (S.I.T.A. S.r.l., Genova, Italy) and having a surface area of 232 cm2, surrounded by a tubular expanded metal mesh (327.5 cm2) supporting the TiO2 catalyst. TiO2 photoanode has been produced according to Section 2.2. The radiant density flux of the UV light, measured by actinometry, was 0.16 W cm−2 at 254 nm, out of which 0.08 W cm−2 were adsorbed by the photoanode mesh when present. An electrical bias of 4 V was applied to the photoanode by means of a potentiostat/galvanostat (2549 Model, Amel S.r.l., Milano, Italy) while the stainless-steel reactor was used as counter electrode (CE). All tests were repeated three times.
The photocatalytic tests were performed using a batch reactor equipped with the same tubular 30 W low-pressure Hg vapor lamp used in the photoelectrocatalytic tests. The surface area in contact with the matrix was 107 cm2 and the radiant density flux of the UV light at 254 nm was 0.15 W cm−2. The matrix volume was 1 L. The catalyst was a Degussa/Evonik TiO2 powder (CAS-No 13463-67-7, Evonik Industries AG, Essen, Germany), consisting of anatase and rutile crystalline phases with 80:20 ratio, surface area of 50 m2 g−1, and average diameter of 30 nm. The concentration of the TiO2 powder was 100 mg L−1.

2.4. Evaluation of the Effectiveness of Treatments and Energy Consumption

Absorbance at 254 nm (Ab254), color, and COD values of the matrix was periodically monitored during the tests. Ab254 was determined by means of UV/Vis spectrophotometry (HP 8453, Agilent Technologies Deutschland GmbH, Waldbronn, Germany) in the range from 190 to 820 nm. Color was evaluated by integration of the UV-Vis absorbance spectrum of the treated matrix in the range from 356 to 700 nm. The resulting integrated absorbance (IA) is proportional to the sample color. Accordingly, the relative residual color (Colori.Color0−1) was calculated following Equation (1):
Color. Color0−1 (unitless) = IAi/IA0
where IA0 is the initial value of integrated absorbance and IAi is the value of integrated absorbance of the i-th sample. Further details on this approach can be found in previous works [46,47,48,49].
The COD concentration was measured using kits purchased from Hach Company (Loveland, CL, USA) and UV-Vis spectrophotometry. Before the COD analysis, the possible interference from chlorides was excluded by verifying that the maximum chloride concentration accepted for this method was not exceeded.
Electrical conductivity and pH of the untreated waters were measured using a portable multiparameter instrument (WTW 3410 SET4, Xylem Analytics Germany Sales GmbH, Weilheim, Germany): pH was determined using the probe WTW-IDS, Model SenTix® 940 (Xylem Analytics Germany Sales GmbH, Weilheim, Germany); electrical conductivity was measured using the probe WTW-IDS, model TetraCon® 925 (Xylem Analytics Germany Sales GmbH, Weilheim, Germany).
Oxygen Uptake Rate (OUR) tests were carried out at 20 °C adopting the ISO 8192 procedure [41], using the mesophilic biomass withdrawn from the same WWTP. In order to calculate the specific oxygen uptake rate (SOUR) and understand the amount of oxygen used to degrade the organic substrate, the following equation was applied:
SOUR (mgO2 gVSS−1 h−1) = OURexogenous−OURendogenous
where: (i) exogenous OUR represents the consumption of oxygen for biomass respiration and organic substrate degradation, and (ii) endogenous OUR represents the consumption of oxygen only for biomass respiration. Considering that the SOUR value is dependent from the quantity of organic substance contained in the tested water [50], the specific biodegradation rate (SBR) by the mesophilic biomass of waters was calculated relating the SOUR value to the COD (Equation (3)) [45]:
SBR (mgO2 gVSS−1 gCOD−1 h−1) = SOUR/COD
The energy consumption was calculated on the basis of Ab254, COD, color removal and SBR in terms of Electrical energy per order (EEO) according to Equation (4) [51,52]:
EEO (kWh m−3 order−1) = (P × t × 103)/(V × log10(Ci/Cf))
where P is the nominal power of the system (kW), t (h) is the processing time, V (L) is the volume of water treated and C represents the concentration of contaminants (either Ab254, COD, color or SBR, respectively). The nominal power was assumed to be equal to the total power consumption of the lamp and the power supply. In the present study, the concentration of contaminants was presumably low, due to previous treatment in the WWTP, and it was assumed that the amount of electrical energy required to reduce the contaminant concentration by one order of magnitude was independent of the initial concentration [8,51,53]. For sake of comparison with the energy consumption calculated based on the other parameters, in the case of SBR the corresponding modulus was given.

3. Results and Discussion

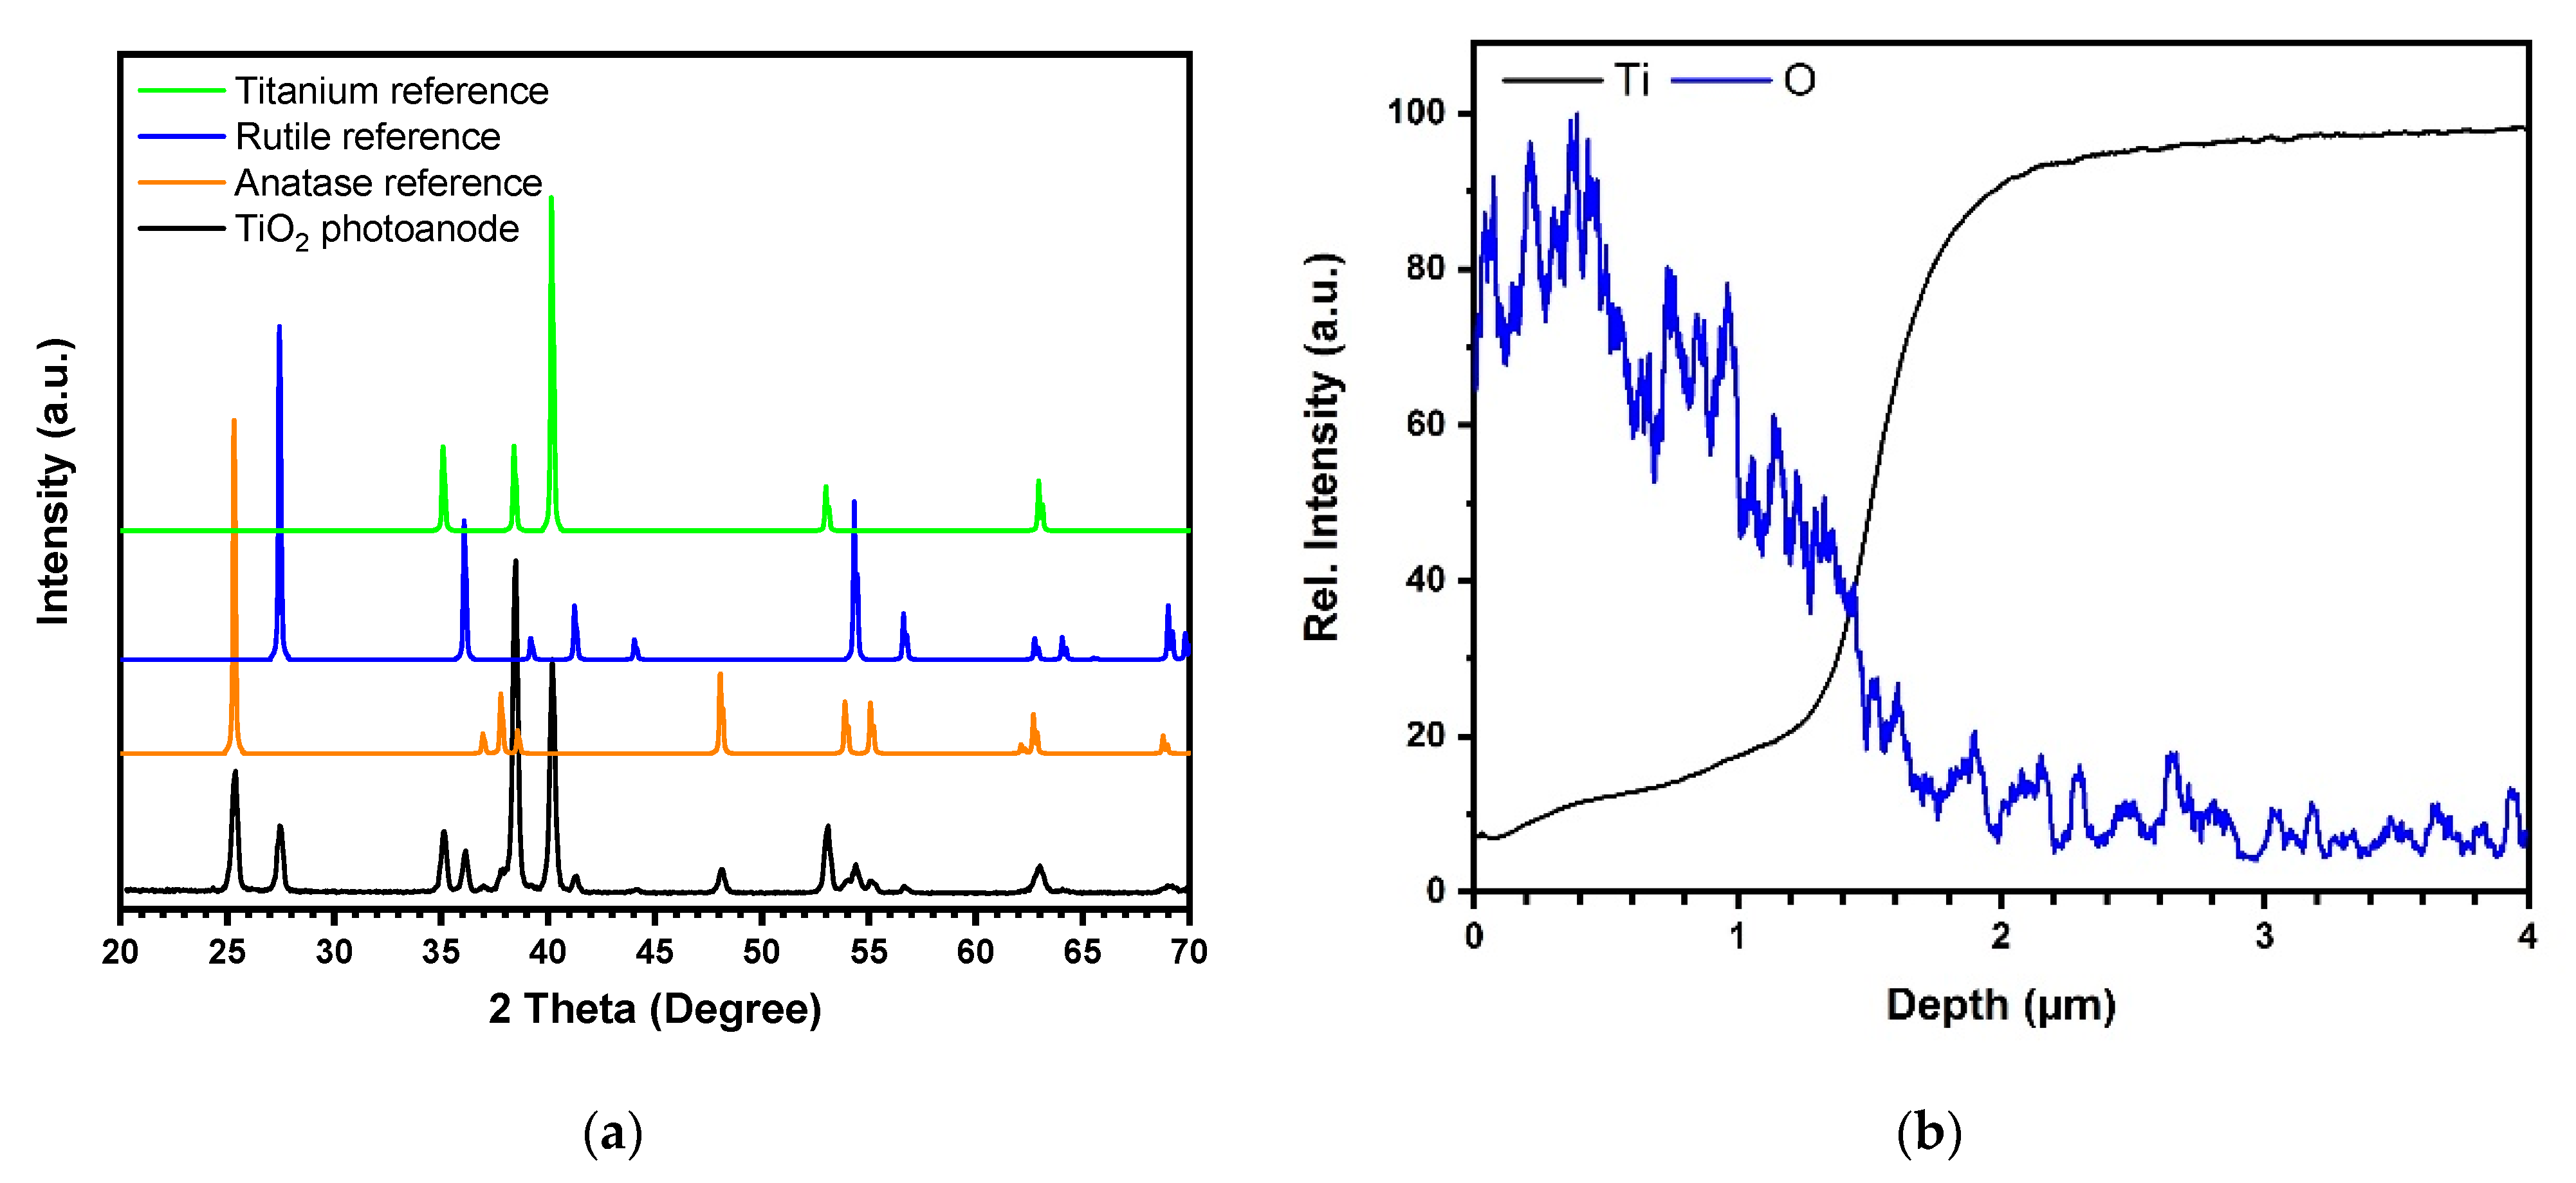
3.1. Characterization of the TiO2 Photoanode

As shown in Figure 1a (inset), the surface of the TiO2 photoanode is characterized by a sub-micrometric porous morphology, typical of titanium dioxide obtained by PEO, with a sponge-like structure becoming more compact at the TiO2/Ti interface [42]. The TiO2 film shows a strong adhesion to the Ti substrate as experienced by bending Ti/TiO2 and fracturing the oxide to observe its cross-section. Both the fractured section shown in Figure 1a and the GD-OES in-depth profiles, reported in Figure A1 in Appendix A, revealed that the oxide average thickness was ≈1.5–2 μm, an optimal range according to literature to optimize the photoactivation of the catalyst, being a compromise between high surface area and low probability of electron-hole recombination given the penetration depth of the light into titanium dioxide [29,42]. According to the XRD pattern in Figure A1, the as-prepared TiO2 film was crystalline and consisted of a mixture of two allotropic phases, anatase and rutile. Following the Spurr equation [43], the estimated weight content of anatase and rutile were 52% and 48%, respectively. The ECSA per unit mass was about 5.2 m2.g−1, in good agreement with the BET surface area values of 6.3 m2.g−1 [38]. The slight discrepancy between the ECSA and BET values may be explained considering that the two approaches are based on different physical phenomena: BET relies on accessible pores for adsorption of N2 gas molecules while ECSA depends on the accessibility of the porous structure for ions. Based on ECSA specific values and given the thickness of the TiO2 film and the geometrical area of the mesh (327.5 cm2), the surface area of the immobilized catalyst was about 1.8 m2.
To assess the photoelectrochemical activity of the TiO2 photoanode, current measurements were performed in dark and under UV-C irradiation scanning the cell voltage from 0 to 6 V. The photocurrent curve in Figure 1a shows a typical trend with a steep initial increase followed by saturation, in this specific case at 1 mA.cm−2 and around 4 V cell bias.

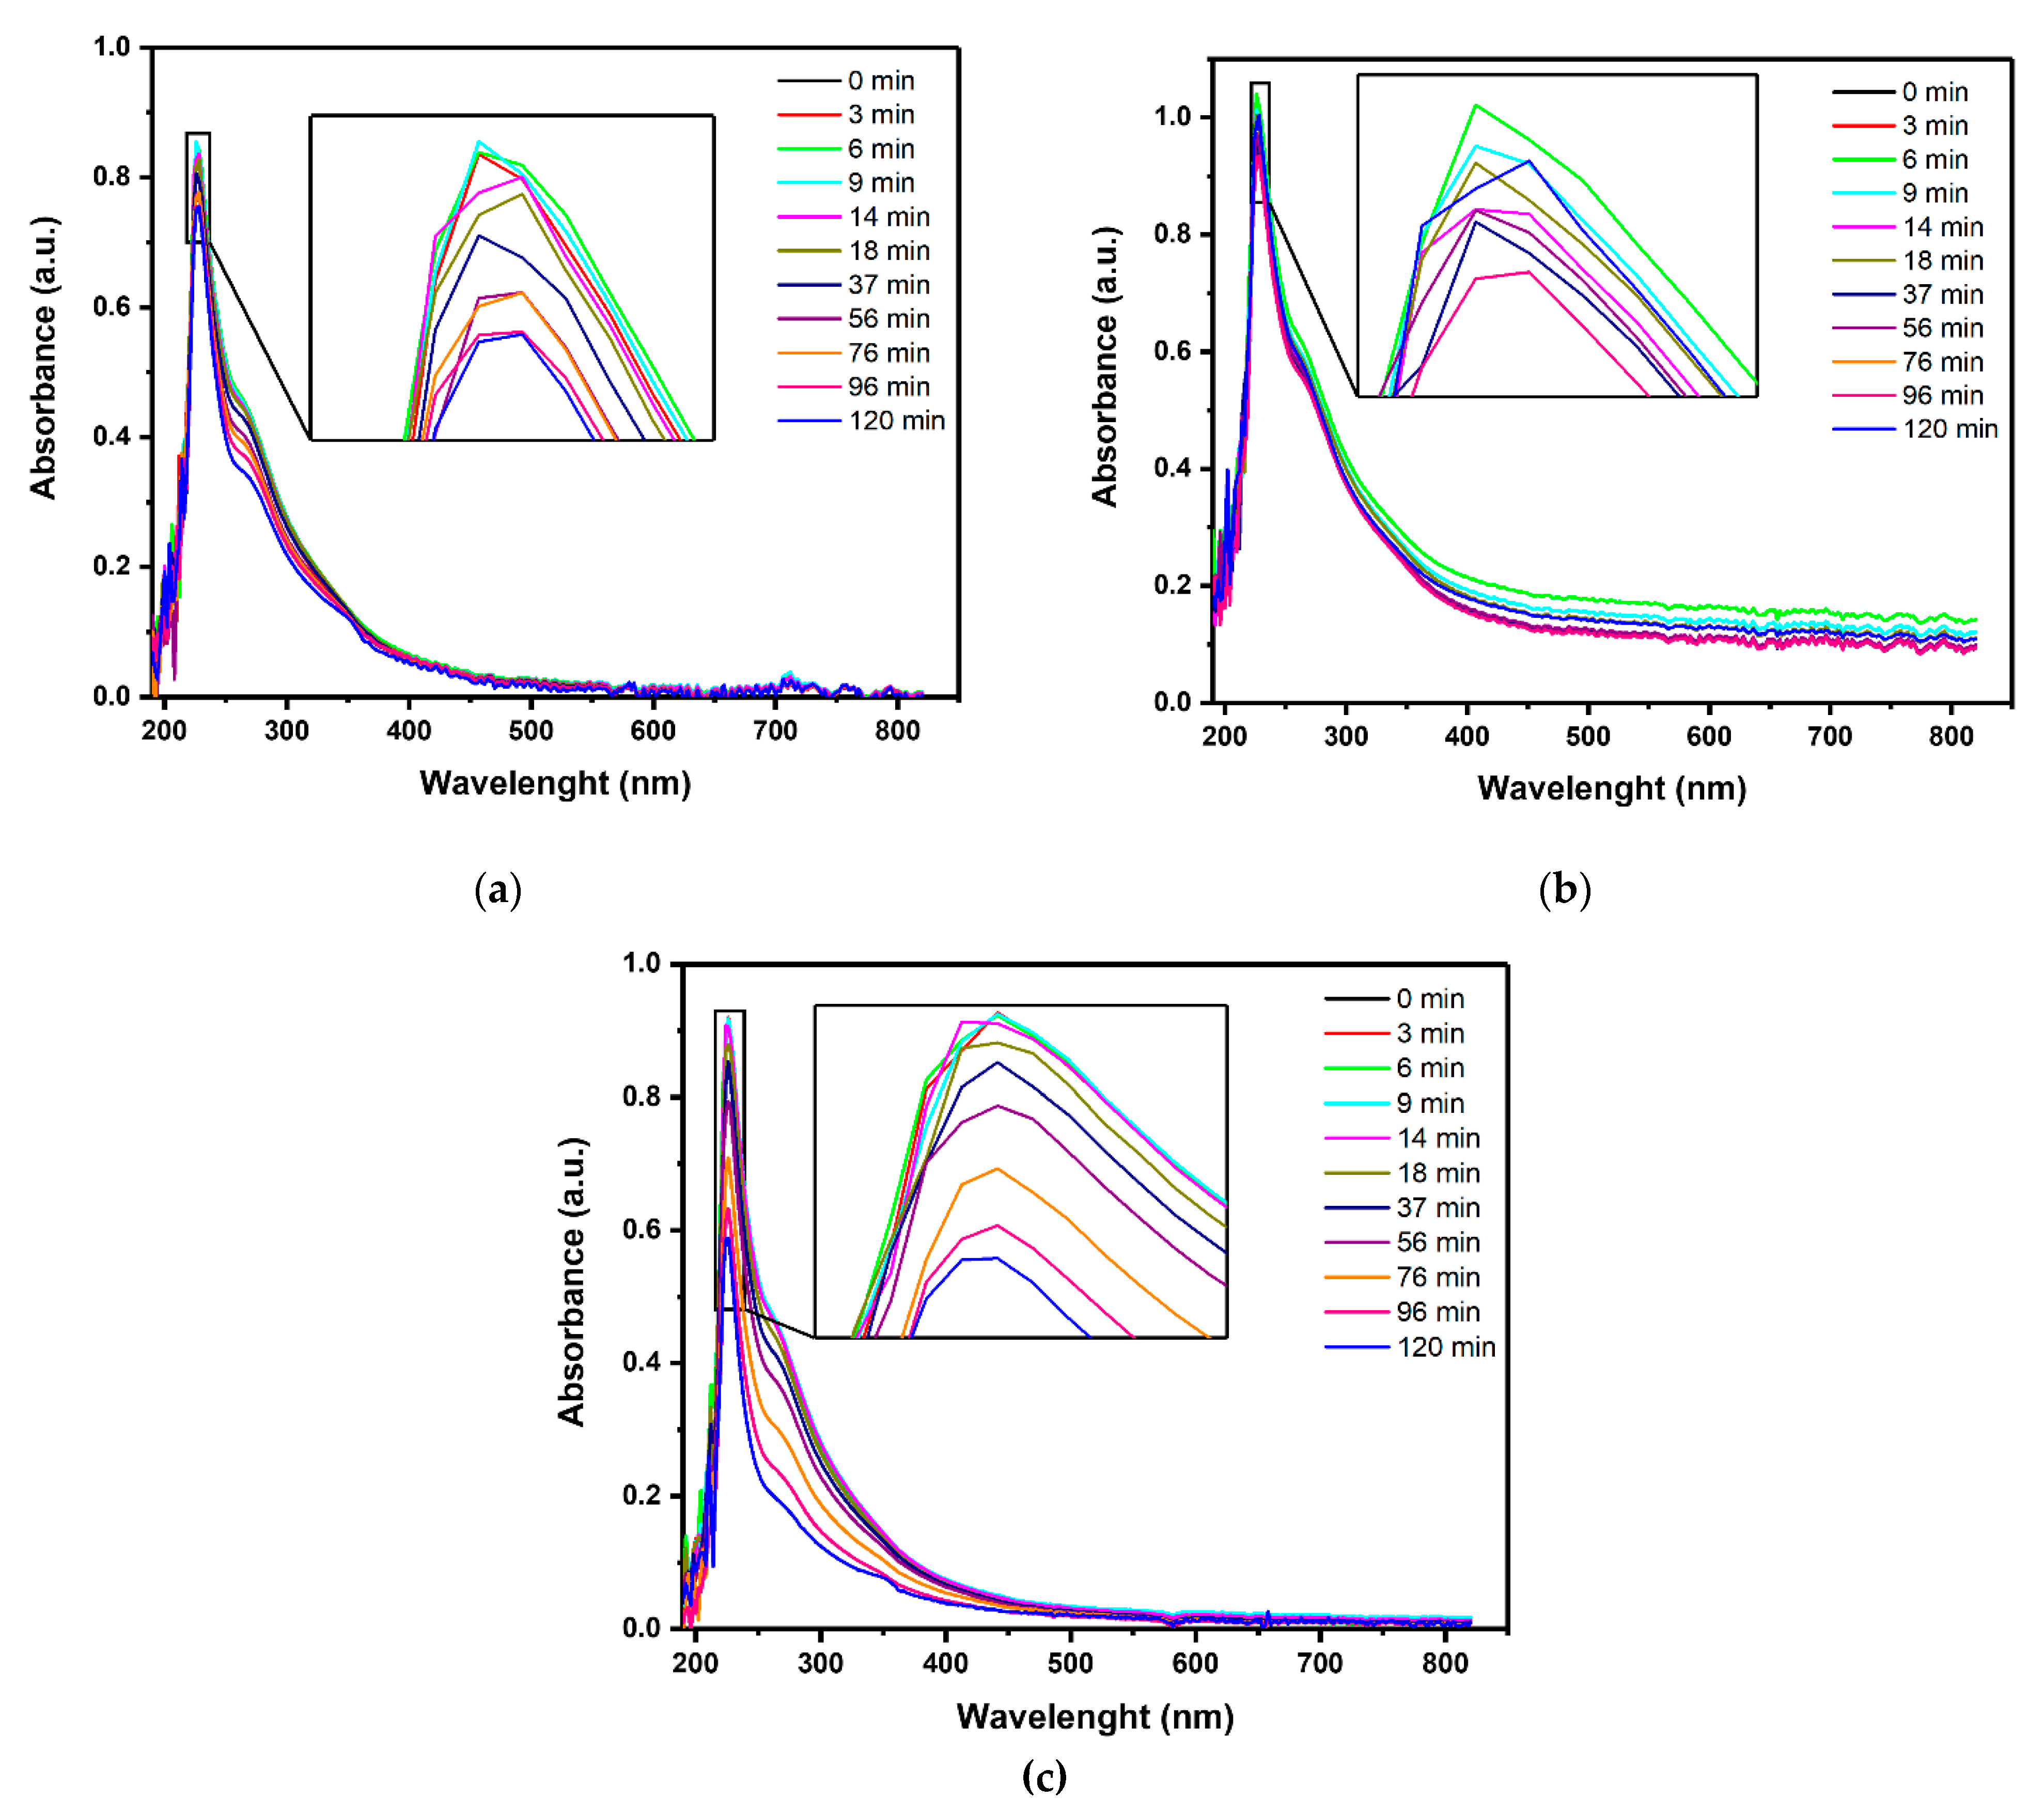
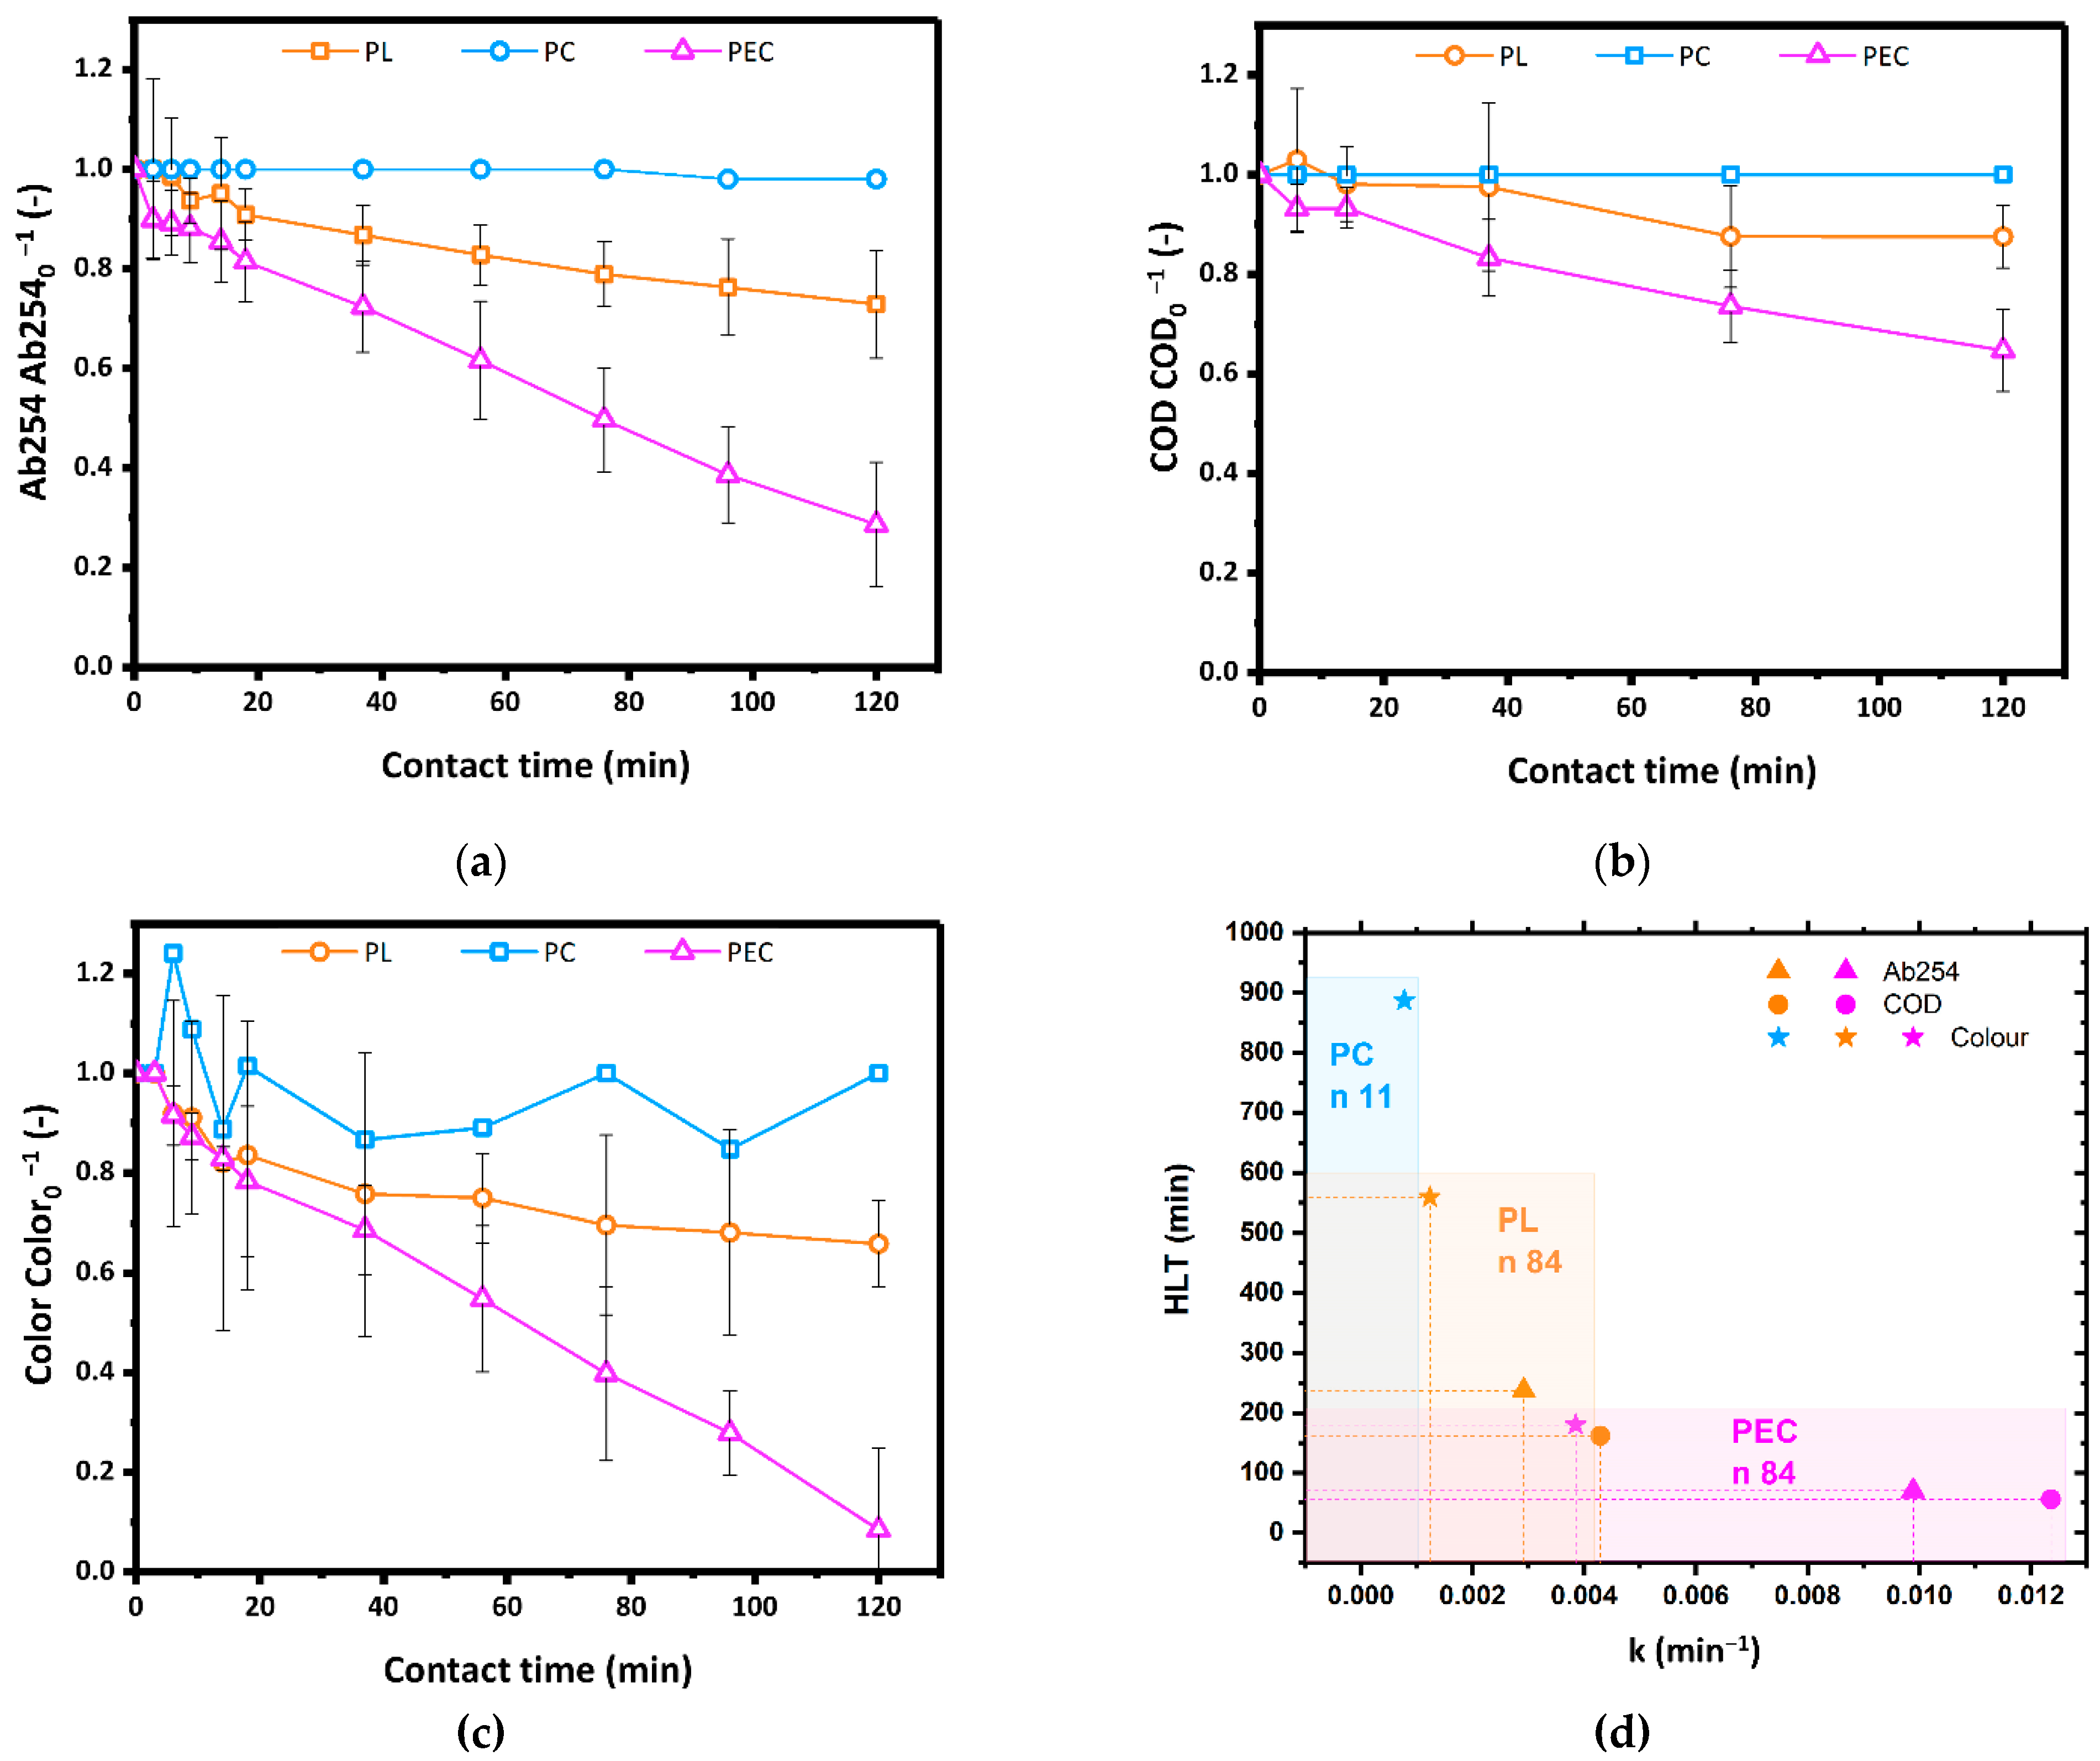
3.2. Degradation of Organic Pollutants and Decolorization

The WWTPE were treated by three different processes: photolysis (PL), photocatalysis onto suspended TiO2 powders (PC), and photoelectrocatalysis with TiO2 photoanode (PEC). As the focus of the study is the evaluation of PEC, the experimental set-up of the three tests was chosen in order to allow a direct comparison between PEC and either PL and PC, and not between PL and PC. Indeed, as shown in Figure 1b, in PL tests the radiant flux density was 0.16 W cm−2, corresponding to a total radiant flux of 37.12 W. Because of the shielding effect of the photoanode surrounding the UV source, in PEC tests the radiant density flux decreased by 50%, attaining at the value of 0.08 W cm−2. Thus, in PEC configuration the total irradiation flux was 18.56 W and the irradiation power shielded by the photoanode was 18.56 W. To assess the effect of the electrical polarization of the catalyst, similar irradiation shielding was purposely chosen for the PC tests, where the radiant density flux was 0.15 W cm−2 and a smaller UV lamp was used, resulting in a total radiance of 15.90 W and a shielded radiance of 21.22 W (Figure 1b). Correspondingly, the catalyst surface areas in PC and PEC tests were 5.0 m2 (based on a nominal value of 50 m2 g−1) and 1.8 m2 (based on ECSA measurements), respectively.
The overall content of organic pollutants was evaluated by monitoring the absorbance at 254 nm, the relative residual color, and the COD values. Ab254 and relative residual color were obtained from the UV-Vis spectra shown in Figure 2.
As shown in Figure 3a,b, after 2 h of reaction time, PC did not affect Ab254 and COD, and PL tests resulted in a reduction of the same parameters by 30% and 10%, respectively. In the present study, PC and PL cannot be directly compared since they were carried out in cylindrical reactors having same volume but different shapes. Indeed, the set-up for PC tests was conceived to achieve similar catalyst light-shielding values as for PEC, thus allowing a direct comparison between PEC and PC but not between PL and PC. Compared to both PL and PC, PEC tests showed the highest efficiency, reducing Ab254 by 70% and COD by 30%. As shown in Figure 3c, the PEC process was also the most effective in removing the color: within a reaction time of 2 h over 90% of the color was removed by PEC, while only 30% by PL and no decolorization was obtained by PC. Expectedly, the color removal results agreed with the corresponding Ab254 and COD data. Despite the nominal surface area of the TiO2 powders (5 m2) was more than twice the electrochemical surface area of the immobilized catalyst (1.8 m2), under similar radiance values PEC significantly outperformed PC. This can be reasonably ascribed to the lower photocatalytic efficiency of titania powders with respect to the immobilized catalyst, where the electrical polarization during operation effectively reduced the electron-hole recombination phenomena usually impairing photocatalytic processes.
The Langmuir–Hinshelwood kinetic model reduced to first order was applied to evaluate the kinetic parameters of the degradation tests (Equations (5) and (6)) [39,54]:
ln(Ct/C0) = −k × t
HLT = ln (2)/k
where C0 and Ct are either Ab254, COD or relative residual color values at t = 0 and after a contact time t respectively, k is the apparent rate constant of the process and HLT is the half-life time. The calculated parameters are reported in Table A1. The model was applicable to photocatalysis on TiO2 powders only based on color values.
As shown in Figure 3d, the kinetic constants of PEC tests were 9.89 × 10⁻³ min−1 (Ab254), 12.36 × 10⁻³ min−1 (relative residual color), and 3.85 × 10⁻³ min−1 (COD), around three times higher than the kinetic constants in PL tests. PEC also showed the smallest HLT values, which were 70 min (Ab254) and 56 min (relative residual color), about one-third lower than PL tests (237 min and 162 min, respectively). Correspondingly, the HLT based on COD was 180 min in PEC and 559 min in PL. The significant reduction of the HLT values with respect to photolysis demonstrates that PEC would be more suitable than PL to integrate the mesophilic CAS processes usually employed in WWTPs.

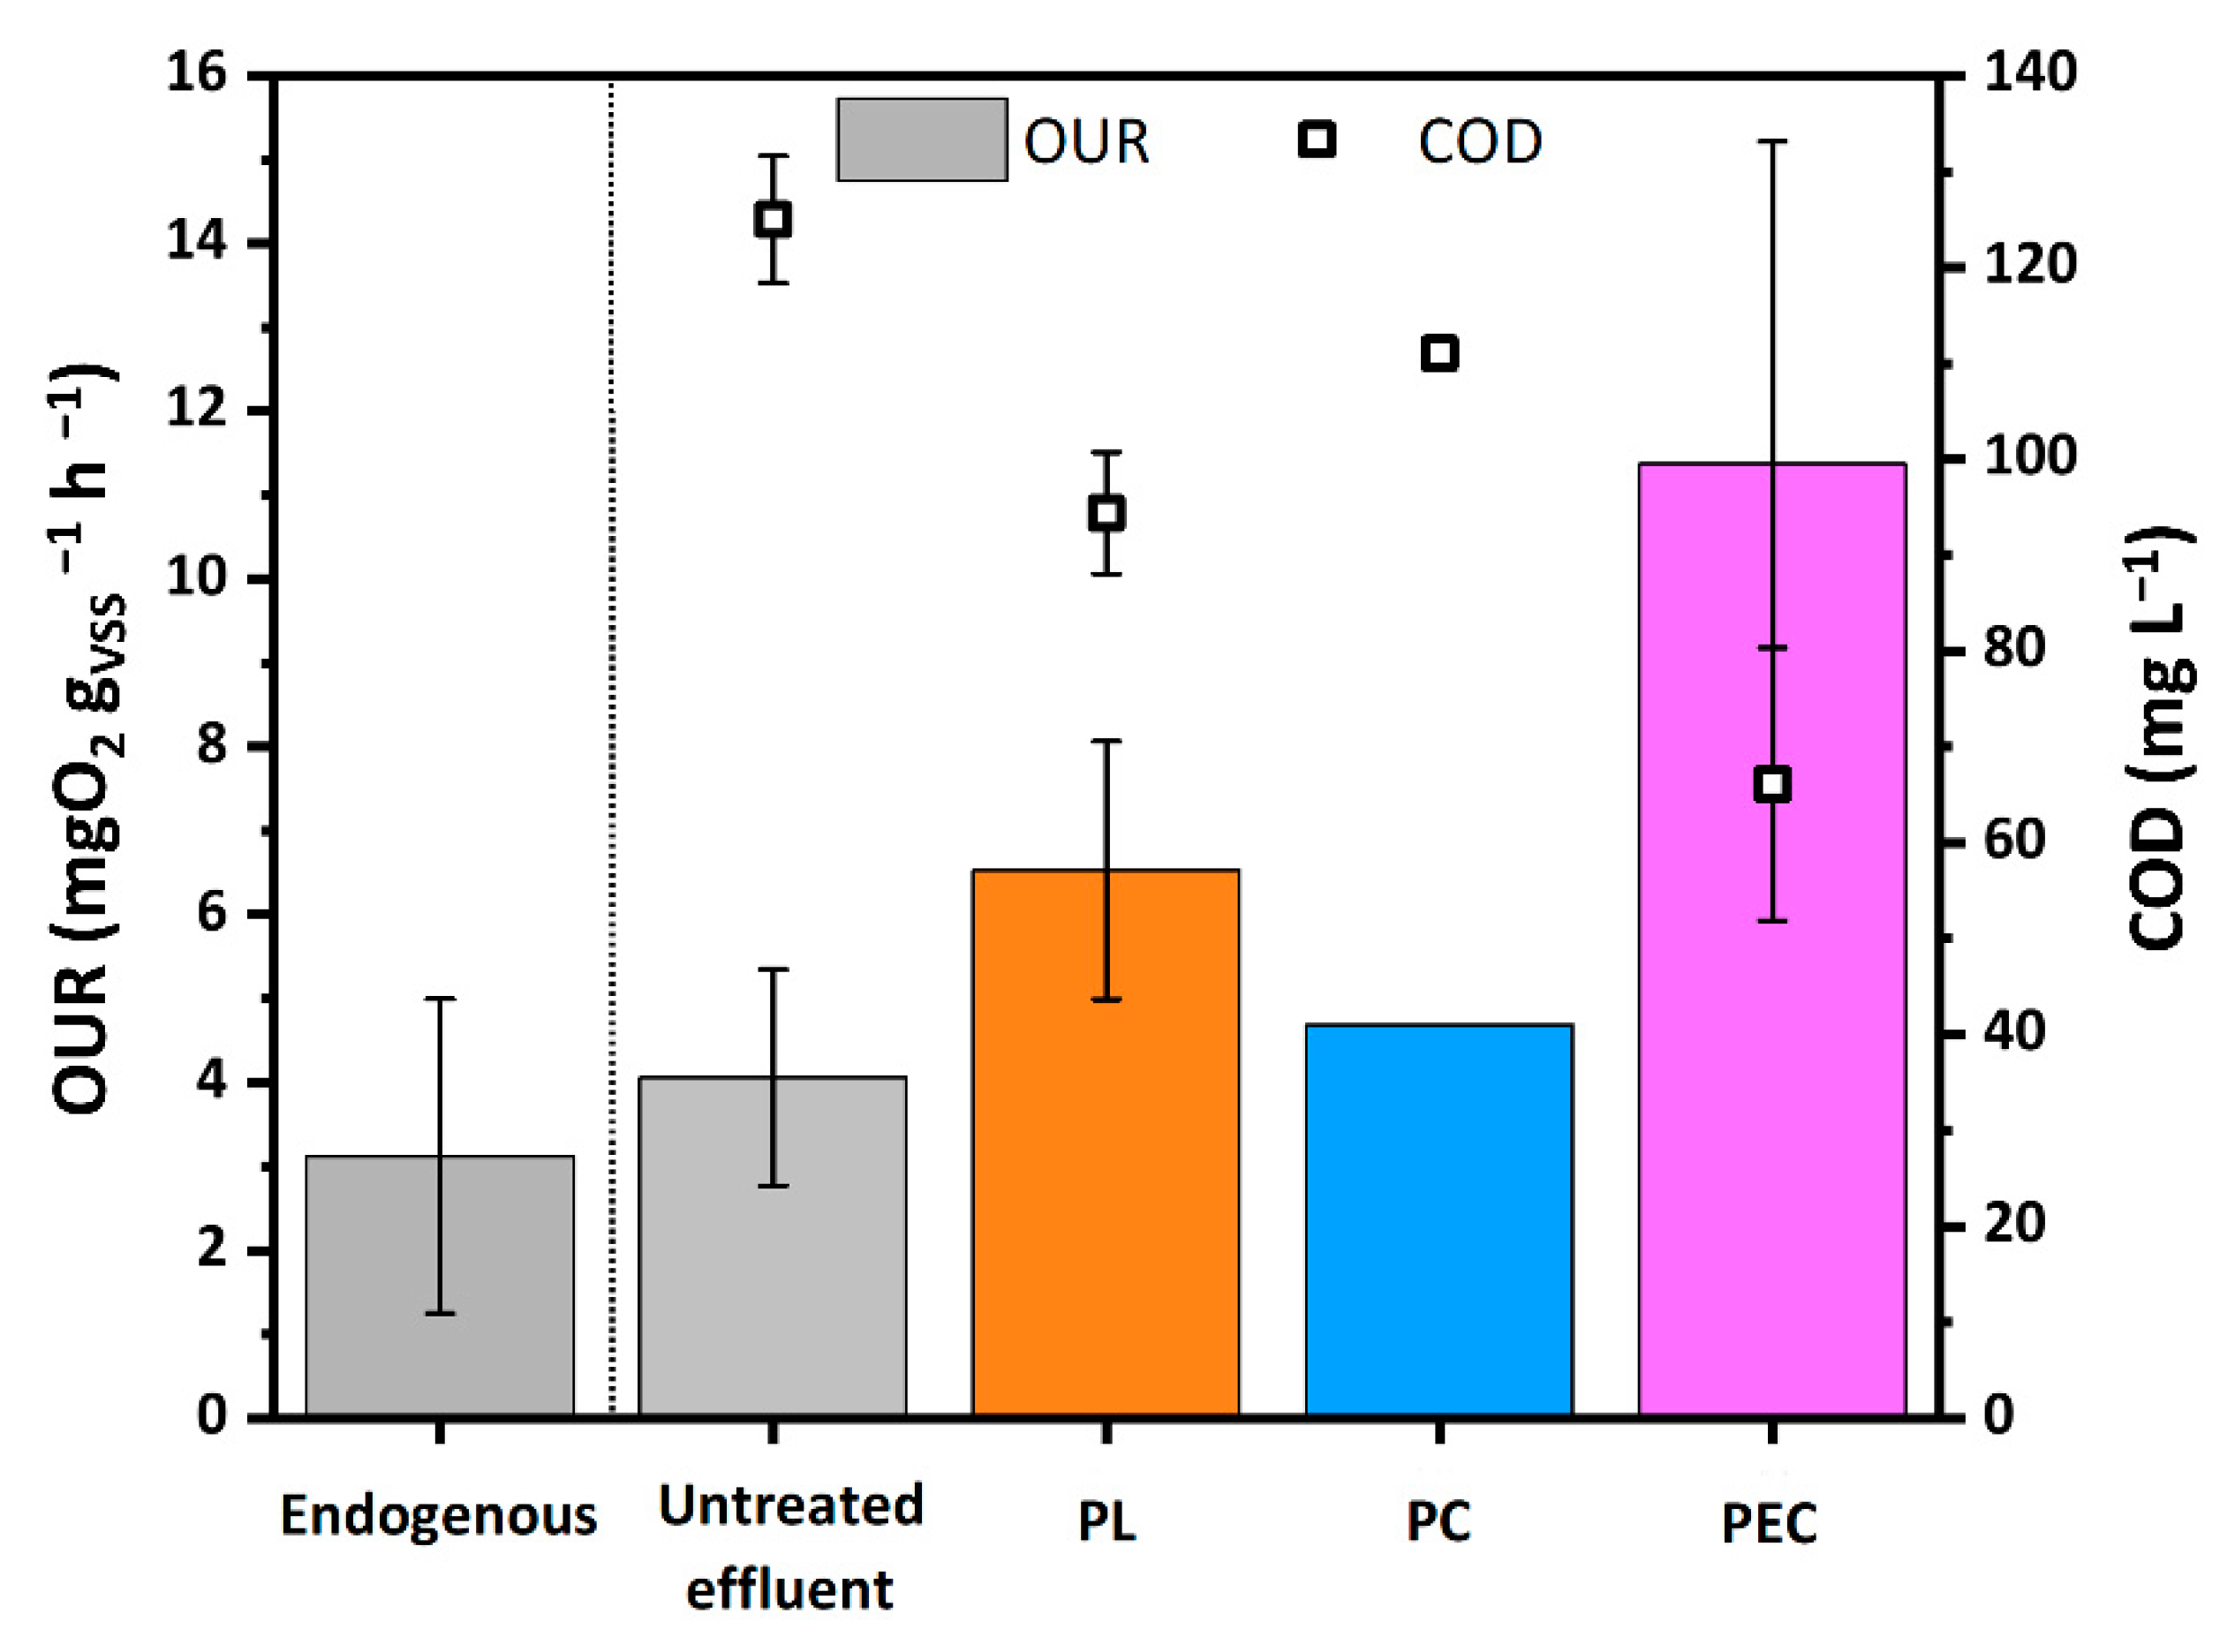
3.3. Biodegradability

In order to evaluate the biodegradability of the treated effluents, the OUR was measured and compared with the corresponding COD (Figure 4).
The OUR value of the untreated effluent (4.0 mgO2 gVSS−1h−1) is almost equal to the endogenous value of the biomass (3.2 mgO2 gVSS−1h−1), meaning that the biodegradability of the untreated effluent by the mesophilic biomass was very limited and confirming that the CAS process in WWTP effectively removed almost the biodegradable organic substances initially present in the WW.
Among the considered processes, photocatalysis showed the smallest impact on biodegradability. In fact, PC shows OUR values even lower than expected considering the corresponding COD, which discrepancy being attributable to partial inhibition of the biomass by the TiO2 powders [55]. In particular, the PC test increased the OUR value from 4.06 mgO2 gVSS−1h−1 to 4.69 mgO2 gVSS−1h−1, and correspondingly decreased the COD value from 125 to 111 mg L−1. Comparatively, by photolysis, the OUR increased to 6.53 mgO2 gVSS−1h−1 and COD decreased to 94.38 mg L−1. The corresponding SBR values increased by five (PL) and three (PC) times with respect to the untreated matrix (Table 2). The lower efficiency of PC with respect to PL can be explained considering that the radiation flux was halved because of the shielding effect of the titania powders. Indeed, in the experimental conditions the photocatalytic activity of the TiO2 powders did not compensate for the reduced radiation flux.
The PEC process had the greatest impact on biodegradability. The OUR increased to 11.4 mg O2 gVSS−1h−1, despite the reduced initial COD content and the SBR increased by one order of magnitude compared to the untreated sample. This is in agreement with our previous studies on real pharmaceutical wastewaters [7] and can be attributed to a more effective production of •OH radicals with respect to PC.
The improved biodegradability of the effluents treated with PEC (SBR), along with the reduced values of Ab254, COD, and residual color, confirmed that the PEC process gives the best complementarity with the CAS processes implemented in WWTPs and entails a lower impact of the effluent on the ecosystem, as the organic substance contained in the effluent becomes more easily removable by the microorganisms exploited in CAS processes and/or naturally present in the surface water bodies [56,57,58].

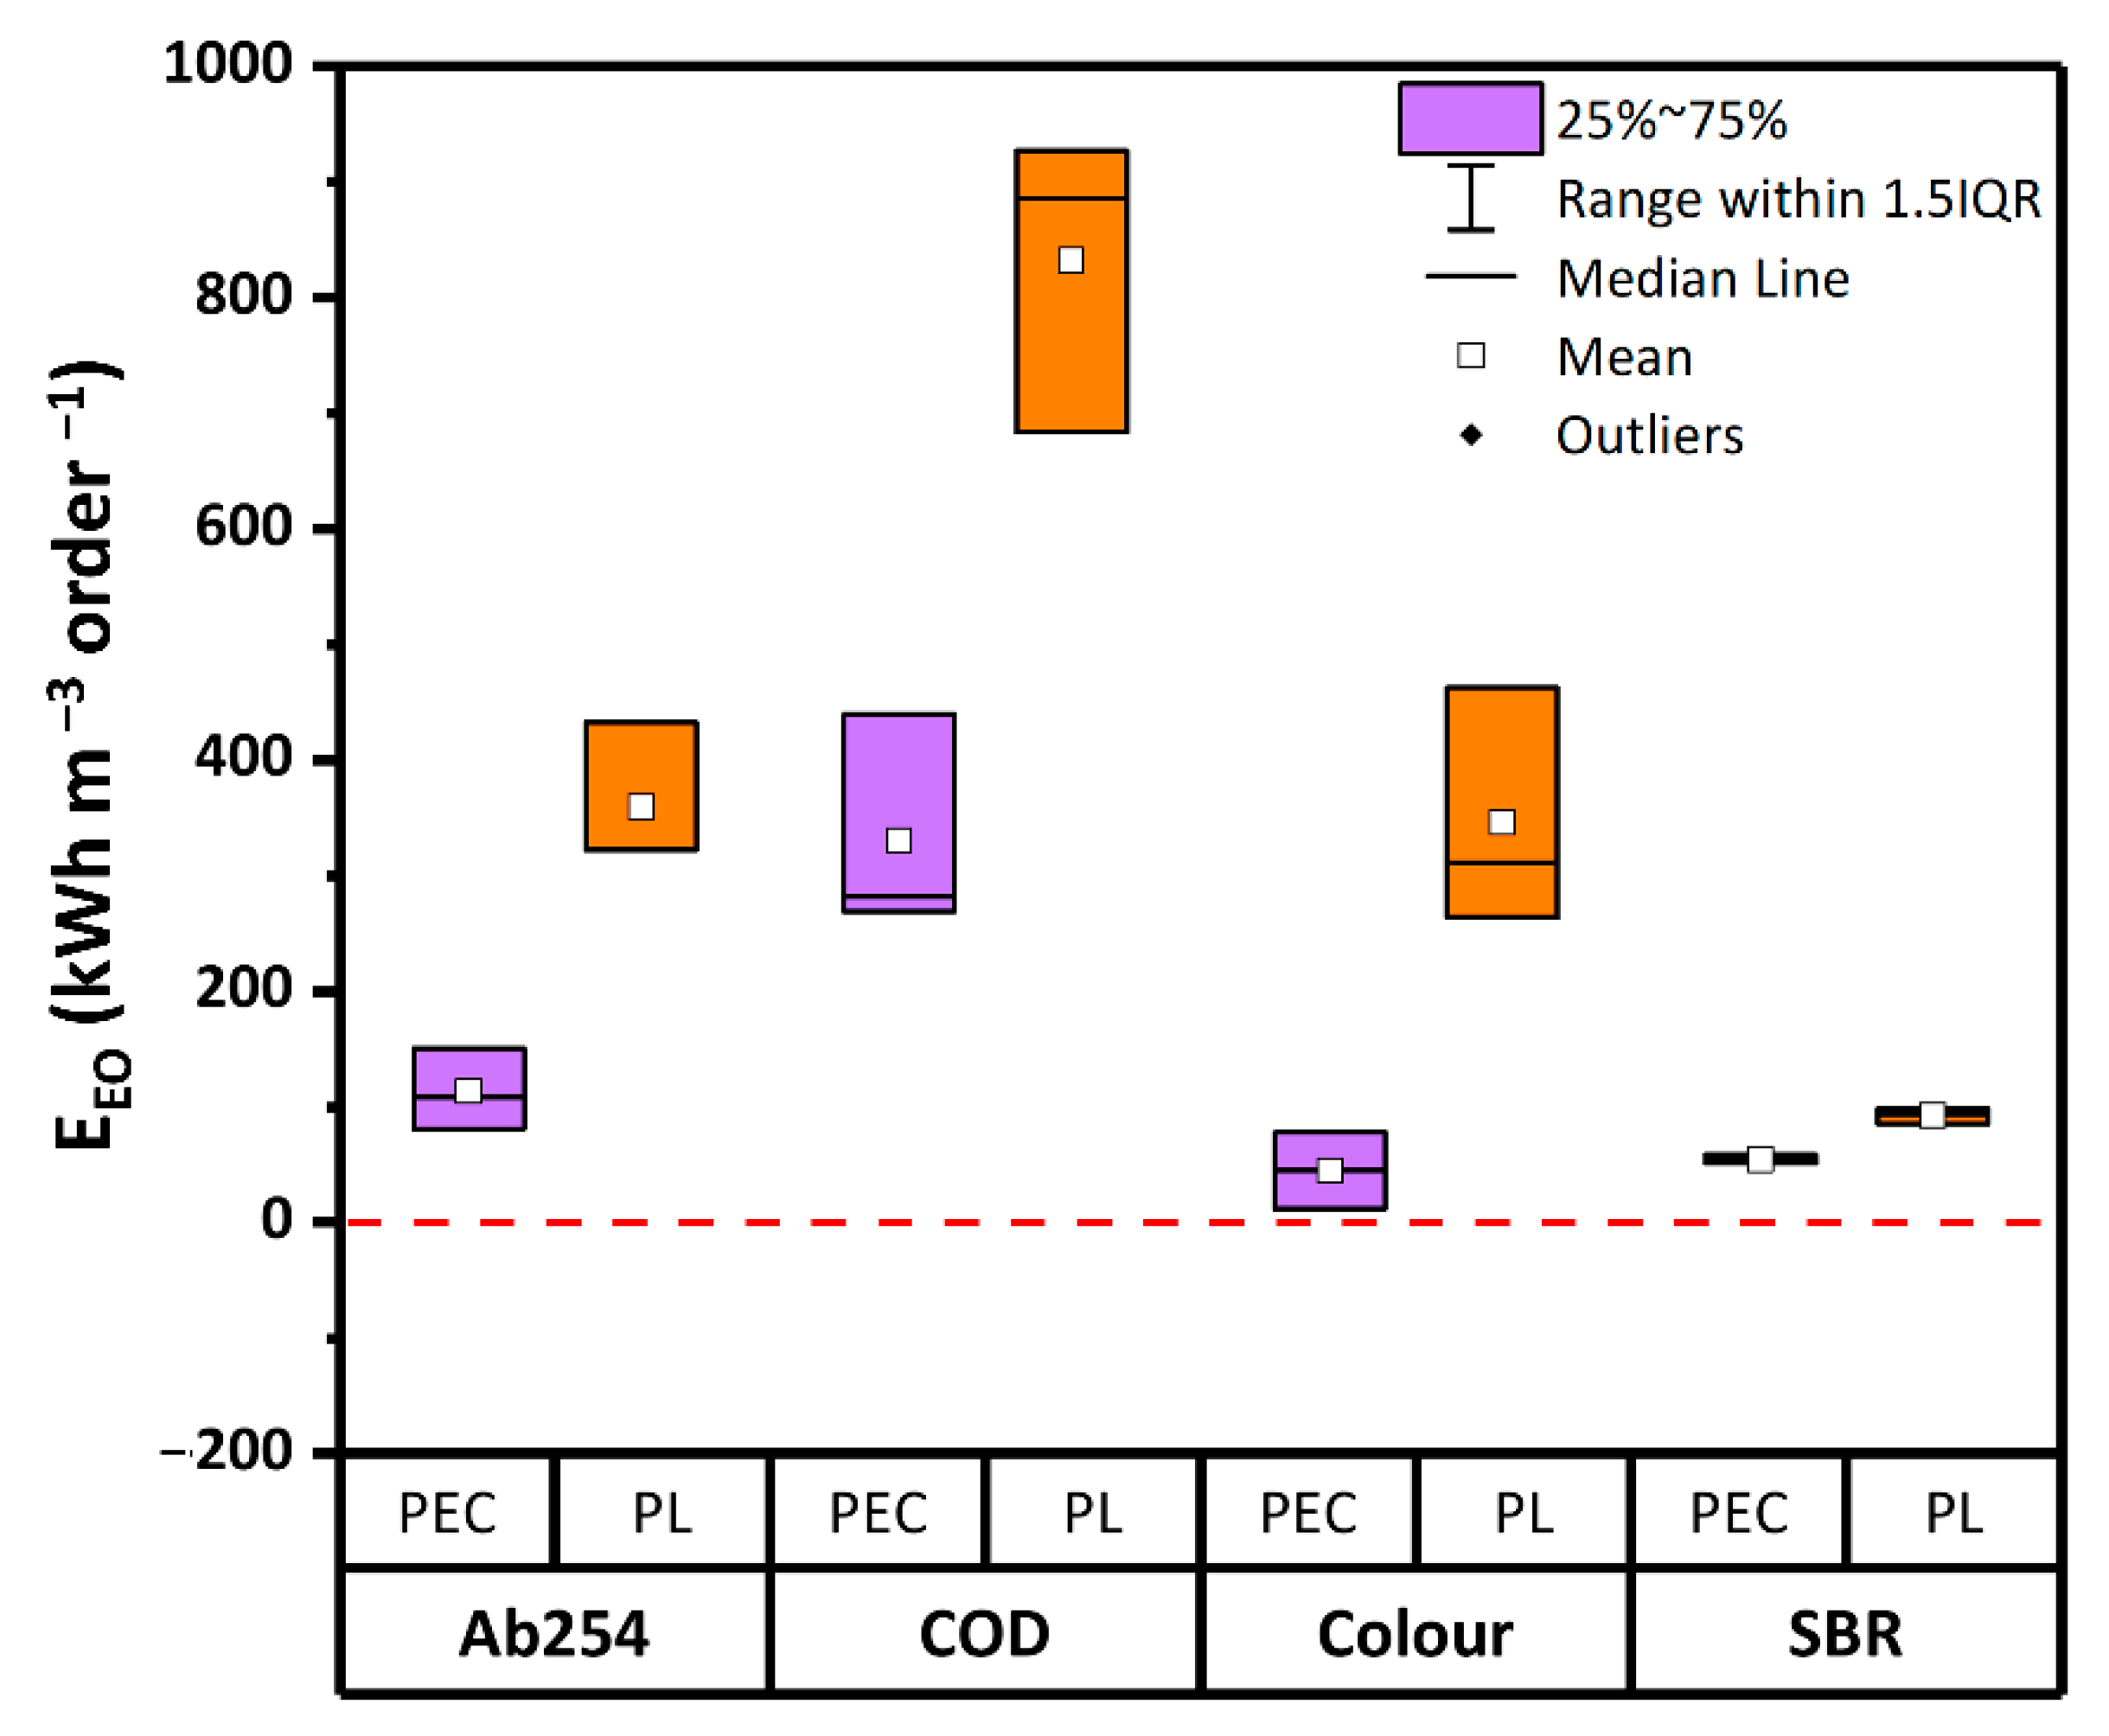
3.4. Energy Consumption

Energy consumption represents one of the main operation costs of electrochemical treatments of WWs [7,52,59]. In the present study, the values of electrical energy per order (EEO) based on Ab254, COD, and residual color were calculated both for PL and PEC. PC was not considered due to the negligible impact on the chemical parameters (Ab254 and COD) and on biodegradability (Section 3.2 and Section 3.3).
In Figure 5 the values of EEO after 2 h of reaction time are shown. Overall, based on Ab254 and COD the energy demand of PEC (113 kWh m−3 order−1 and 330 kWh m−3 order−1, respectively) was over 60% lower than PL (359 kWh m−3 order−1 and 832 kWh m−3 order−1). As for the residual color, the EEO in PEC was 80% less than in PL. Similarly, the lowest energy consumption was calculated on the basis of the SBR values. Indeed, in PEC the energy consumption based on SBR was 50% lower than in PL. Therefore, in terms of energy consumption, PEC proved to be far more efficient than PL.
It is quite established that the energy demand of degradation processes significantly depends on several parameters such as type and configuration of the reactor, distance between UV lamp and catalyst mesh, target contaminant, chemical properties of the water matrix [60]. Thus, although energy consumption values of several orders of magnitude lower can be found in literature (e.g., [8,61]), the EEO values obtained by different laboratories using diverse water samples and reactors can be hardly compared to each other. To overcome this limit, the comparative study here reported has been carried out in the same reactor geometries and/or reproducing similar light-shielding effects for the different tests. Following this approach, it can be concluded that PEC had a significantly lower specific energy demand for the treatment of the considered WWTPE with respect to PL. Compared to the EEO found in previous experiments carried out by the same authors with the same reactors, the here reported values for color removal are of the same order of magnitude as those obtained treating emerging contaminants [38].

4. Conclusions

PEC was validated for improving the biodegradability of real WWTPE collected downstream a WWTP treating both municipal WWs and AW. Color and COD content were more rapidly removed compared to photolysis. The kinetic constants of PEC tests were 9.89 × 10⁻³ min−1 (Ab254), 12.36 × 10⁻³ min−1 (relative residual color), and 3.85 × 10⁻³ min−1 (COD), around three times higher than the kinetic constants in PL tests. Correspondingly, PEC significantly increased the biodegradability, showing SBR values (567.56 ± 224.20 mg O2 gVSS−1 gCOD−1 h−1) more than twice of those measured by PL (262.07 ± 89.27 mgO2 gVSS−1 gCOD−1 h−1) and three times of those measured by PC (154.36 mg O2 gVSS−1 gCOD−1 h−1). Operating costs demonstrated that the investigated process is less energy demanding for obtaining the same SBR increase and Ab254, color, and COD removal. These results prove that PEC can outperform PL and PC onto suspended powders in decreasing the impact of WWTP effluents on the ecosystem, showing a very effective action as a polishing treatment. In particular, this work lays the foundation for investigating the effectiveness of the PEC on WWTPEs in order to subsequently reuse water in the perspective of a circular economy. Further work is suggested in order to: (i) improve the energy efficiency of the PEC process and the kinetics of removal of pollutants (the need for a shorter contact time means a lower volume of the reactor at industrial scale and therefore lower construction costs), (ii) investigate the disinfection effect, (iii) develop and validate this AOP at the industrial scale.

Author Contributions

Conceptualization, M.C.C., M.C.M. and S.F.; methodology, M.C.C., and S.F.; validation, M.C.C., M.B. and S.F.; formal analysis, M.C.C., M.C.M. and H.A.; investigation, M.C.M. and H.A.; resources, M.C.C., M.B. and S.F.; data curation, M.C.M. and H.A.; writing—original draft preparation, M.C.M., H.A. and S.F.; writing—review and editing, M.C.C. and M.B.; visualization, M.C.M. and H.A.; supervision, M.C.C., M.B. and S.F.; funding acquisition, M.C.C., M.B. and S.F. All authors have read and agreed to the published version of the manuscript.

Funding

This research was partially funded by ASMortara S.p.A. (Lombardy, Italy).

Data Availability Statement

All data generated or analyzed during this study are included in this published article.

Acknowledgments

The authors acknowledge ASMortara S.p.A. (Lombardy, Italy) and Eleonora Giorgi (University of Pavia) for giving the technical support to the experimental research.

Conflicts of Interest

The authors declare no conflict of interest.

Nomenclature

Ab254: Absorbance at 254 nm; AOP: Advanced oxidation process; AW: Aqueous waste; BET: Brunauer- Emmett-Teller; CAS: Conventional active sludge; CB: Conduction band; ECSA: Electrochemical surface area; EEO: Electrical energy per order; OUR: Oxygen uptake rate; PC: Photocatalysis; PDF: Powder diffraction file; PEC: Photoelectrocatalysis; PEO: Plasma electrolytic oxidation; PL: Photolysis; SBR: Specific biodegradation rate; SEM: Scanning electron microscopy; SOUR: Specific oxygen uptake rate; TSS: Total suspended solids; VB: Valence band; WW: Wastewater; WWTPE: Wastewater treatment plant effluent; XRD: X-ray diffraction.

Appendix A

Figure A1. (a) XRD pattern of the TiO2 photoanode (black curve) and literature reference diffractograms of anatase (ICDD-PDF 21-1272), rutile (ICDD-PDF 21-1276), and titanium ((ICDD-PDF 44-1294); (b) GD-OES in depth profile of the TiO2 film showing the signals of oxygen and titanium. (Source: Author’s own calculation/conception).
Water 13 00821 g0a1
Table A1. First-order kinetic constant (k) and half-life time (HLT) relative to the Ab254, COD and color values during degradation by photolysis (PL), photocatalysis (PC), and photoelectrocatalysis (PEC) using the Langmuir-Hinshelwood model. n= number of total data; n.a.: not applicable. (Source: Author’s own calculation/conception).
R2kHLTn
(-)(min−1)(min)(-)
PL
Ab2540.977250.00292237.433
COD0.905890.00124559.018
Relative residual color0.908600.00429161.633
PC
Ab254n.a.n.a.n.a.11
CODn.a.n.a.n.a.6
Relative residual color0.163237.81329 × 10−4887.211
PEC
Ab2540.992710.0098970.133
COD0.984490.00385180.018
Relative residual color0.991540.0123656.133

References

  1. Henze, M.; Comeau, Y. Wastewater characterization. In Biological Wastewater Treatment: Principles Modelling and Design; IWA Publishing: London, UK, 2008; pp. 33–52. [Google Scholar]
  2. Robinson, T.; McMullan, G.; Marchant, R.; Nigam, P. Remediation of dyes in textile effluent: A critical review on current treatment technologies with a proposed alternative. Bioresour. Technol. 2001, 77, 247–255. [Google Scholar] [CrossRef]
  3. Gao, P.; Ding, Y.; Li, H.; Xagoraraki, I. Occurrence of pharmaceuticals in a municipal wastewater treatment plant: Mass balance and removal processes. Chemosphere 2012, 88, 17–24. [Google Scholar] [CrossRef] [PubMed]
  4. Deblonde, T.; Cossu-Leguille, C.; Hartemann, P. Emerging pollutants in wastewater: A review of the literature. Int. J. Hyg. Environ. Health 2011, 214, 442–448. [Google Scholar] [CrossRef] [PubMed]
  5. Collivignarelli, M.C.; Abbà, A.; Bestetti, M.; Crotti, B.M.; Carnevale Miino, M. Electrolytic Recovery of Nickel and Copper from Acid Pickling Solutions Used to Treat Metal Surfaces. Water Air Soil Pollut. 2019, 230, 101. [Google Scholar] [CrossRef]
  6. Collivignarelli, M.C.; Abbà, A.; Carnevale Miino, M.; Damiani, S. Treatments for color removal from wastewater: State of the art. J. Environ. Manag. 2019, 236, 727–745. [Google Scholar] [CrossRef]
  7. Collivignarelli, M.C.; Abbà, A.; Carnevale Miino, M.; Arab, H.; Bestetti, M.; Franz, S. Decolorization and biodegradability of a real pharmaceutical wastewater treated by H2O2-assisted photoelectrocatalysis on TiO2 meshes. J. Hazard. Mater. 2020, 387, 121668. [Google Scholar] [CrossRef]
  8. Cardoso, J.C.; Bessegato, G.G.; Boldrin Zanoni, M.V. Efficiency comparison of ozonation, photolysis, photocatalysis and photoelectrocatalysis methods in real textile wastewater decolorization. Water Res. 2016, 98, 39–46. [Google Scholar] [CrossRef] [Green Version]
  9. Liu, Y.; Zhu, L. Enhanced treatment of dispersed dye-production wastewater by self-assembled organobentonite in a one-step process with poly-aluminium chloride. Sci. Rep. 2017, 7, 6843. [Google Scholar] [CrossRef] [PubMed] [Green Version]
  10. Oturan, M.A.; Aaron, J.-J. Advanced Oxidation Processes in Water/Wastewater Treatment: Principles and Applications. A Review. Crit. Rev. Environ. Sci. Technol. 2014, 44, 2577–2641. [Google Scholar] [CrossRef]
  11. Oller, I.; Malato, S.; Sánchez-Pérez, J.A. Combination of Advanced Oxidation Processes and biological treatments for wastewater decontamination—A review. Sci. Total Environ. 2011, 409, 4141–4166. [Google Scholar] [CrossRef] [PubMed]
  12. Del Moro, G.; Mancini, A.; Mascolo, G.; Di Iaconi, C. Comparison of UV/H2O2 based AOP as an end treatment or integrated with biological degradation for treating landfill leachates. Chem. Eng. J. 2013, 218, 133–137. [Google Scholar] [CrossRef]
  13. Del Moro, G.; Prieto-Rodríguez, L.; De Sanctis, M.; Di Iaconi, C.; Malato, S.; Mascolo, G. Landfill leachate treatment: Comparison of standalone electrochemical degradation and combined with a novel biofilter. Chem. Eng. J. 2016, 288, 87–98. [Google Scholar] [CrossRef]
  14. Brillas, E.; Garcia-Segura, S. Benchmarking recent advances and innovative technology approaches of Fenton, photo-Fenton, electro-Fenton, and related processes: A review on the relevance of phenol as model molecule. Sep. Purif. Technol. 2020, 237, 116337. [Google Scholar] [CrossRef]
  15. Garcia-Segura, S.; Brillas, E. Applied photoelectrocatalysis on the degradation of organic pollutants in wastewaters. J. Photochem. Photobiol. C Photochem. Rev. 2017, 31, 1–35. [Google Scholar] [CrossRef]
  16. Bessegato, G.G.; Guaraldo, T.T.; de Brito, J.F.; Brugnera, M.F.; Zanoni, M.V.B. Achievements and Trends in Photoelectrocatalysis: From Environmental to Energy Applications. Electrocatalysis 2015, 6, 415–441. [Google Scholar] [CrossRef] [Green Version]
  17. Noorjahan, M.; Pratap Reddy, M.; Durga Kumari, V.; Lavédrine, B.; Boule, P.; Subrahmanyam, M. Photocatalytic degradation of H-acid over a novel TiO2 thin film fixed bed reactor and in aqueous suspensions. J. Photochem. Photobiol. A Chem. 2003, 156, 179–187. [Google Scholar] [CrossRef]
  18. Zertal, A.; Molnár-Gábor, D.; Malouki, M.A.; Sehili, T.; Boule, P. Photocatalytic transformation of 4-chloro-2-methylphenoxyacetic acid (MCPA) on several kinds of TiO2. Appl. Catal. B Environ. 2004, 49, 83–89. [Google Scholar] [CrossRef]
  19. Fresno, F.; Portela, R.; Suárez, S.; Coronado, J.M. Photocatalytic materials: Recent achievements and near future trends. J. Mater. Chem. A 2014. [Google Scholar] [CrossRef]
  20. Montenegro-Ayo, R.; Barrios, A.C.; Mondal, I.; Bhagat, K.; Morales-Gomero, J.C.; Abbaszadegan, M.; Westerhoff, P.; Perreault, F.; Garcia-Segura, S. Portable point-of-use photoelectrocatalytic device provides rapid water disinfection. Sci. Total Environ. 2020, 737, 140044. [Google Scholar] [CrossRef] [PubMed]
  21. Malato, S. Removal of Emerging Contaminants in Waste-Water Treatment: Removal by Photo-Catalytic Processes; Springer: Berlin/Heidelberg, Germany, 2008; pp. 177–197. [Google Scholar]
  22. Rimoldi, L.; Ambrosi, C.; Di Liberto, G.; Lo Presti, L.; Ceotto, M.; Oliva, C.; Meroni, D.; Cappelli, S.; Cappelletti, G.; Soliveri, G.; et al. Impregnation versus Bulk Synthesis: How the Synthetic Route Affects the Photocatalytic Efficiency of Nb/Ta:N Codoped TiO2 Nanomaterials. J. Phys. Chem. C 2015, 119, 24104–24115. [Google Scholar] [CrossRef]
  23. Antonello, A.; Soliveri, G.; Meroni, D.; Cappelletti, G.; Ardizzone, S. Photocatalytic remediation of indoor pollution by transparent TiO2 films. Catal. Today 2014, 230, 35–40. [Google Scholar] [CrossRef]
  24. Luster, E.; Avisar, D.; Horovitz, I.; Lozzi, L.; Baker, M.A.; Grilli, R.; Mamane, H. N-Doped TiO2-Coated ceramic membrane for carbamazepine degradation in different water qualities. Nanomaterials 2017, 7, 206. [Google Scholar] [CrossRef] [PubMed] [Green Version]
  25. Ghosh, M.; Lohrasbi, M.; Chuang, S.S.C.; Jana, S.C. Mesoporous Titanium Dioxide Nanofibers with a Significantly Enhanced Photocatalytic Activity. ChemCatChem 2016, 8, 2525–2535. [Google Scholar] [CrossRef]
  26. Chen, X.; Mao, S.S. Titanium dioxide nanomaterials: Synthesis, properties, modifications, and applications. Chem. Rev 2007, 107, 2891–2959. [Google Scholar] [CrossRef] [PubMed]
  27. Robinson, B.W.; Tighe, C.J.; Gruar, R.I.; Mills, A.; Parkin, I.P.; Tabecki, A.K.; De Villiers Lovelock, H.L.; Darr, J.A. Suspension plasma sprayed coatings using dilute hydrothermally produced titania feedstocks for photocatalytic applications. J. Mater. Chem. A 2015. [Google Scholar] [CrossRef] [Green Version]
  28. Chiarello, G.L.; Dozzi, M.V.; Selli, E. TiO2-based materials for photocatalytic hydrogen production. J. Energy Chem. 2017, 26, 250–258. [Google Scholar] [CrossRef]
  29. Chiarello, G.L.; Zuliani, A.; Ceresoli, D.; Martinazzo, R.; Selli, E. Exploiting the Photonic Crystal Properties of TiO2 Nanotube Arrays to Enhance Photocatalytic Hydrogen Production. ACS Catal. 2016, 6, 1345–1353. [Google Scholar] [CrossRef]
  30. Bestetti, M.; Franz, S.; Cuzzolin, M.; Arosio, P.; Cavallotti, P.L. Structure of nanotubular titanium oxide templates prepared by electrochemical anodization in H2SO4/HF solutions. Thin Solid Films 2007, 515, 5253–5258. [Google Scholar] [CrossRef]
  31. Bestetti, M.; Sacco, D.; Brunella, M.F.; Franz, S.; Amadelli, R.; Samiolo, L. Photocatalytic degradation activity of titanium dioxide sol-gel coatings on stainless steel wire meshes. Mater. Chem. Phys. 2010, 124. [Google Scholar] [CrossRef]
  32. Eskandarloo, H.; Hashempour, M.; Vicenzo, A.; Franz, S.; Badiei, A.; Behnajady, M.A.; Bestetti, M. High-temperature stable anatase-type TiO2 nanotube arrays: A study of the structure-activity relationship. Appl. Catal. B Environ. 2016. [Google Scholar] [CrossRef]
  33. Zlamal, M.; Macak, J.M.; Schmuki, P.; Krýsa, J. Electrochemically assisted photocatalysis on self-organized TiO2 nanotubes. Electrochem. Commun. 2007, 9, 2822–2826. [Google Scholar] [CrossRef]
  34. Franz, S.; Perego, D.; Marchese, O.; Lucotti, A.; Bestetti, M. Photoactive TiO2 coatings obtained by Plasma Electrolytic Oxidation in refrigerated electrolytes. Appl. Surf. Sci. 2016, 385, 498–505. [Google Scholar] [CrossRef]
  35. Arab, H.; Chiarello, G.L.; Selli, E.; Bomboi, G.; Calloni, A.; Bussetti, G.; Albani, G.; Bestetti, M.; Franz, S. Ni-Doped Titanium Dioxide Films Obtained by Plasma Electrolytic Oxidation in Refrigerated Electrolytes. Surfaces 2020, 3, 13. [Google Scholar] [CrossRef] [Green Version]
  36. Franz, S.; Arab, H.; Lucotti, A.; Castiglioni, C.; Vicenzo, A.; Morini, F.; Bestetti, M. Exploiting Direct Current Plasma Electrolytic Oxidation to Boost Photoelectrocatalysis. Catalysts 2020, 10, 325. [Google Scholar] [CrossRef] [Green Version]
  37. Franz, S.; Falletta, E.; Arab, H.; Murgolo, S.; Bestetti, M.; Mascolo, G. Degradation of Carbamazepine by Photo(electro)catalysis on Nanostructured TiO2 Meshes: Transformation Products and Reaction Pathways. Catalysts 2020, 10, 169. [Google Scholar] [CrossRef] [Green Version]
  38. Murgolo, S.; Franz, S.; Arab, H.; Bestetti, M.; Falletta, E.; Mascolo, G. Degradation of emerging organic pollutants in wastewater effluents by electrochemical photocatalysis on nanostructured TiO2 meshes. Water Res. 2019, 164, 114920. [Google Scholar] [CrossRef] [PubMed]
  39. Franz, S.; Perego, D.; Marchese, O.; Bestetti, M. Photoelectrochemical advanced oxidation processes on nanostructured TiO2 catalysts: Decolorization of a textile azo-dye. J. Water Chem. Technol. 2015, 37, 108–115. [Google Scholar] [CrossRef] [Green Version]
  40. Garcia-Segura, S.; Nienhauser, A.B.; Fajardo, A.S.; Bansal, R.; Coonrod, C.L.; Fortner, J.D.; Marcos-Hernández, M.; Rogers, T.; Villagran, D.; Wong, M.S.; et al. Disparities between experimental and environmental conditions: Research steps toward making electrochemical water treatment a reality. Curr. Opin. Electrochem. 2020, 22, 9–16. [Google Scholar] [CrossRef]
  41. Water Quality—Test for Inhibition of Oxygen Consumption by Activated Sludge for Carbonaceous and Ammonium Oxidation; ISO 8192:2007; International Organization for Standardization (ISO): Geneva, Switzerland, 2007.
  42. Franz, S.; Arab, H.; Chiarello, G.L.; Bestetti, M.; Selli, E. Single-Step Preparation of Large Area TiO2 Photoelectrodes for Water Splitting. Adv. Energy Mater. 2020, 2000652. [Google Scholar] [CrossRef]
  43. Spurr, R.A.; Myers, H. Quantitative Analysis of Anatase-Rutile Mixtures with an X-Ray Diffractometer. Anal. Chem. 1957, 29, 760–762. [Google Scholar] [CrossRef]
  44. Trasatti, S.; Petrii, O.A. Real surface area measurements in electrochemistry. J. Electroanal. Chem. 1992, 327, 353–376. [Google Scholar] [CrossRef]
  45. Collivignarelli, M.C.; Abbà, A.; Carnevale Miino, M.; Bertanza, G.; Sorlini, S.; Damiani, S.; Arab, H.; Bestetti, M.; Franz, S. Photoelectrocatalysis on TiO2 meshes: Different applications in the integrated urban water management. Environ. Sci. Pollut. Res. 2021. [Google Scholar] [CrossRef] [PubMed]
  46. Wu, J.; Doan, H.; Upreti, S. Decolorization of aqueous textile reactive dye by ozone. Chem. Eng. J. 2008, 142, 156–160. [Google Scholar] [CrossRef]
  47. Wu, J.; Eiteman, M.A.; Law, S.E. Evaluation of Membrane Filtration and Ozonation Processes for Treatment of Reactive-Dye Wastewater. J. Environ. Eng. 1998, 124, 272–277. [Google Scholar] [CrossRef]
  48. Wu, J.; Wang, T. Ozonation of aqueous azo dye in a semi-batch reactor. Water Res. 2001, 35, 1093–1099. [Google Scholar] [CrossRef]
  49. Tauchert, E.; Schneider, S.; de Morais, J.L.; Peralta-Zamora, P. Photochemically-assisted electrochemical degradation of landfill leachate. Chemosphere 2006, 64, 1458–1463. [Google Scholar] [CrossRef]
  50. Zheng, D.; Chang, Q.; Li, Z.; Gao, M.; She, Z.; Wang, X.; Guo, L.; Zhao, Y.; Jin, C.; Gao, F. Performance and microbial community of a sequencing batch biofilm reactor treating synthetic mariculture wastewater under long-term exposure to norfloxacin. Bioresour. Technol. 2016, 222, 139–147. [Google Scholar] [CrossRef]
  51. Bolton, J.R.; Bircher, K.G.; Tumas, W.; Tolman, C.A. Figures-of-merit for the technical development and application of advanced oxidation technologies for both electric- and solar-driven systems (IUPAC Technical Report). Pure Appl. Chem. 2001, 73, 627–637. [Google Scholar] [CrossRef]
  52. Bessegato, G.G.; de Souza, J.C.; Cardoso, J.C.; Zanoni, M.V.B. Assessment of several advanced oxidation processes applied in the treatment of environmental concern constituents from a real hair dye wastewater. J. Environ. Chem. Eng. 2018, 6, 2794–2802. [Google Scholar] [CrossRef] [Green Version]
  53. Malpass, G.R.P.; Miwa, D.W.; Mortari, D.A.; Machado, S.A.S.; Motheo, A.J. Decolorisation of real textile waste using electrochemical techniques: Effect of the chloride concentration. Water Res. 2007, 41, 2969–2977. [Google Scholar] [CrossRef]
  54. Jiménez-Becerril, J.; Moreno-López, A.; Jiménez-Reyes, M. Radiocatalytic degradation of dissolved organic compounds in wastewater. Nukleonika 2016, 61, 473–476. [Google Scholar] [CrossRef] [Green Version]
  55. Stasinakis, A.S. Use of selected advanced oxidation processes (AOPs) for wastewater treatment—A mini review. Glob. NEST J. 2013, 10, 376–385. [Google Scholar] [CrossRef]
  56. Choi, Y.-Y.; Baek, S.-R.; Kim, J.-I.; Choi, J.-W.; Hur, J.; Lee, T.-U.; Park, C.-J.; Lee, B. Characteristics and Biodegradability of Wastewater Organic Matter in Municipal Wastewater Treatment Plants Collecting Domestic Wastewater and Industrial Discharge. Water 2017, 9, 409. [Google Scholar] [CrossRef] [Green Version]
  57. Yu, J.T.; Bouwer, E.J.; Coelhan, M. Occurrence and biodegradability studies of selected pharmaceuticals and personal care products in sewage effluent. Agric. Water Manag. 2006, 86, 72–80. [Google Scholar] [CrossRef]
  58. Adamek, E.; Baran, W.; Sobczak, A. Assessment of the biodegradability of selected sulfa drugs in two polluted rivers in Poland: Effects of seasonal variations, accidental contamination, turbidity and salinity. J. Hazard. Mater. 2016, 313, 147–158. [Google Scholar] [CrossRef]
  59. Mehrjouei, M.; Müller, S.; Möller, D. Catalytic and photocatalytic ozonation of tert-butyl alcohol in water by means of falling film reactor: Kinetic and cost–effectiveness study. Chem. Eng. J. 2014, 248, 184–190. [Google Scholar] [CrossRef]
  60. Keen, O.; Bolton, J.; Litter, M.; Bircher, K.; Oppenländer, T. Standard reporting of Electrical Energy per Order (EEO) for UV/H2O2 reactors (IUPAC Technical Report). Pure Appl. Chem. 2018, 90, 1487–1499. [Google Scholar] [CrossRef] [Green Version]
  61. Bessegato, G.G.; Cardoso, J.C.; da Silva, B.F.; Zanoni, M.V.B. Combination of photoelectrocatalysis and ozonation: A novel and powerful approach applied in Acid Yellow 1 mineralization. Appl. Catal. B Environ. 2016, 180, 161–168. [Google Scholar] [CrossRef] [Green Version]
Figure 1. (a) Current density of the TiO2 photoanode in the dark (black) and under irradiation (blue), and corresponding photocurrent density (orange); in the inset, SEM surface and fracture micrograph of the TiO2 film; (b) radiance flux density measured by actinometry during photolysis (PL), photoelectrocatalysis (PEC) and photocatalysis onto suspended TiO2 powders (PC). To acquire the cross-section SEM image, the TiO2 film was intentionally fractured. (Source: author’s own calculation/conception).
Water 13 00821 g001
Figure 2. UV-Vis absorbance spectra of the effluent treated by (a) PL, (b) PC, and (c) PEC at increasing reaction times (repetition 1 out of 3). (Source: author’s own calculation/conception).
Water 13 00821 g002
Figure 3. (a) Ab254, (b) COD and (c) residual color (Color.Color0−1) relative to the corresponding parameters at t = 0 during PL, PC using 110 mg L−1 TiO2 powders and PEC using a TiO2 photoanode. Confidence intervals have been calculated based on three repetitions. (d) Kinetic constants and HLT of PL and PEC for Ab254, COD and color removal; n: number of data (Source: author’s own calculation/conception).
Water 13 00821 g003
Figure 4. OUR and COD of the biomass, of the untreated WWTPE and of the treated WWTPE after 2 h contact time PL, PC and PEC tests. Confidence intervals have been calculated based on three repetitions. (Source: author’s own calculation/conception).
Water 13 00821 g004
Figure 5. Values of electrical energy per order (EEO) after 2 h of reaction time in PL and PEC, based on Ab254, COD, and residual color. Boxplots represent the distance between the first and third quartiles, while whiskers are set as the most extreme (lower and upper) data point not exceeding 1.5 times the quartile range from the median. (Source: author’s own calculation/conception).
Water 13 00821 g005
Table 1. Chemical and biochemical properties of the WW at the sampling point. (Source: author’s own calculation/conception).
ParameterValue
Measured
Ab254 (a) (A.U.)0.58–0.73
COD (b) (mg L−1)115–130
pH 7.9–8.0
EC (c) (mS cm−1)0.05–1.33
TSS (d) (mg L−1)15–27
Calculated
SOUR (e) (mg O2 gVSS−1 h−1)0.8–1.7
(a) Ab254: value of absorbance at 254 nm. (b) COD: chemical oxygen demand. (c) EC: electrical conductivity. (d) TSS: total suspended solids. (e) SOUR: specific oxygen uptake rate calculated as difference between the exogenous and the endogenous values of OUR measured with tests carried out at 20 °C (adopting the ISO 8192 procedure [41]).
Table 2. COD, OUR, SOUR, and SBR values of untreated waters and waters treated by PL, PC, and PEC. n: number of data. (Source: Author’s own calculation/conception).
UntreatedPLPCPEC
(n = 5)(n = 3)(n = 1)(n = 3)
OUR (mgO2 gVSS−1 h−1)4.06 ± 1.296.53 ± 1.534.6911.37 ± 3.84
SOUR (mgO2 gVSS−1 h−1)1.21 ± 0.304.48 ± 1.523.437.48 ± 3.37
COD (mg L−1)125 ± 6.6294.38 ± 6.3411166.13 ± 14.20
SBR (mgO2 gVSS−1 gCOD−1 h−1)50.63 ± 11.79262.07 ± 89.27154.36567.56 ± 224.20
Publisher’s Note: MDPI stays neutral with regard to jurisdictional claims in published maps and institutional affiliations.

