
Experimental Study on the Inlet Discharge Capacity under Different Clogging Conditions

1
China Institute of Water Resources and Hydropower Research, Beijing 100038, China
2
Research Center on Flood & Drought Disaster Reduction of the Ministry of Water Resources, Beijing 100038, China
3
College of Hydraulic and Environmental Engineering, China Three Gorges University, Yichang 443002, China
*
Author to whom correspondence should be addressed.
Water 2021, 13(6), 826; https://doi.org/10.3390/w13060826
Submission received: 18 February 2021
/
Revised: 12 March 2021
/
Accepted: 15 March 2021
/
Published: 18 March 2021
(This article belongs to the Section Hydraulics and Hydrodynamics)
Abstract
:Storm drainage inlets transport urban runoff and discharge to underground sewer systems. If the inlet structure is blocked, the urban drainage system is hampered, leading to urban flooding. To quantitatively analyze the influence of clogging conditions on inlet discharge capacity, laboratory experiments were conducted to address the impact of different inlet clogging conditions on inlet discharge capacity under different upstream discharge conditions. These were based on a two-layer platform that mimicked a complete inlet structure including a drainage grate, a rainwater well, and a connecting pipe. The results show that the water flow near the inlet was similar to weir flow when the rainwater well was not full, whereas the water flow state near the inlet behaved similarly to orifice flow after becoming full. In addition, it was found that the clogging extent and position can significantly influence the comprehensive discharge capacity of the street inlet. The experimental dataset was used to calculate the inlet discharge coefficients of the weir and orifice flow states under different clogging conditions. The results are applicable to research addressing the formation mechanisms of urban floods. Additionally, this study is of practical significance for early warning systems and emergency response support during heavy rainfall.
1. Introduction
Urban inundation due to rapid urbanization and climate change is a serious problem for many cities worldwide, which affects human life and property [1,2,3,4,5,6,7,8]. In urban areas, storm drainage systems are designed to reduce the damage caused by heavy storm events and alleviate urban flooding [9,10,11]. Moreover, storm inlets are an important part of the urban drainage system, as they control the amount of water conveyed from the ground surface to the drainage system [12]. The increased worldwide flood events in recent years have attracted the attention of many scholars seeking to understand the urban drainage process.
This interest has led to several studies describing the hydraulic performance and discharge capacity of different inlet types [13,14,15,16,17,18]. Lee et al. [13] performed scaled experiments to measure the inlet discharge coefficients of weirs and orifices into storm drains. Leandro et al. [14] and Martins et al. [16] studied the hydrodynamic effects of flows in gullies and proposed drainage flow coefficients. However, the hydraulic behavior of the storm drainage system could be affected by clogging, which is caused by surface runoff carrying leaves, plastic bags, and other debris during heavy rainfall events [19]. This is a notable cause of urban flooding [12,20,21].
Currently, the clogging impact of inlets’ hydraulic capacity is often overlooked in urban flood analysis. Taking clogging conditions into account, municipalities and some researchers suggest a constant reduction factor of inlet capacity. Municipalities propose an inlet capacity reduction factor of 50% and 25% for clogging conditions in the USA and Italy, respectively [22,23]. While Guo [24] suggests reducing inlet sizes, Almedeij et al. [25] suggest a reduction factor of 50% for inlets located in low-lying terrain. Gómez et al. [26] measured grated inlets throughout the urban catchment system in Barcelona and found that clogging can reduce 26.5–67.4% of inlet capacity based on a one-year visual inspection. This highlights the importance of clogging impact on inlet hydraulic behavior. To date, few studies have carried out laboratory tests to systematically research the clogging impact on inlet discharge capacity. In addition, most previous studies [13,14,15,16,17,18] mainly adopted drainage grates to explore the inlet discharge capacity. Thus, it is necessary to carry out an experimental study to explore the clogging impact on discharge capacity, which can accurately describe inlet discharge characteristics under different clogging conditions. Moreover, the experimental results can be applied to flood models to improve drainage system planning in urban areas.
This paper adopted a scale experiment to explore the clogging impact on inlet capacity based on a two-layer platform. In view of the inlet structure in real urban areas, this experiment utilized a complete side-ditch inlet structure primarily used for paved areas with curbs. In addition, the complete inlet structure consisted of a drainage grate, a rainwater well, and a connecting pipe. A series of experiments were performed in a specific laboratory flume based on different clogging conditions. Considering these conditions, experimental data can identify proper discharge coefficients, which can be adopted in a numerical model. Moreover, this study also discusses the impact of the inlet structure and different clogging conditions on inlet discharge capacity.
2. Materials and Methods
2.1. Experimental Facility
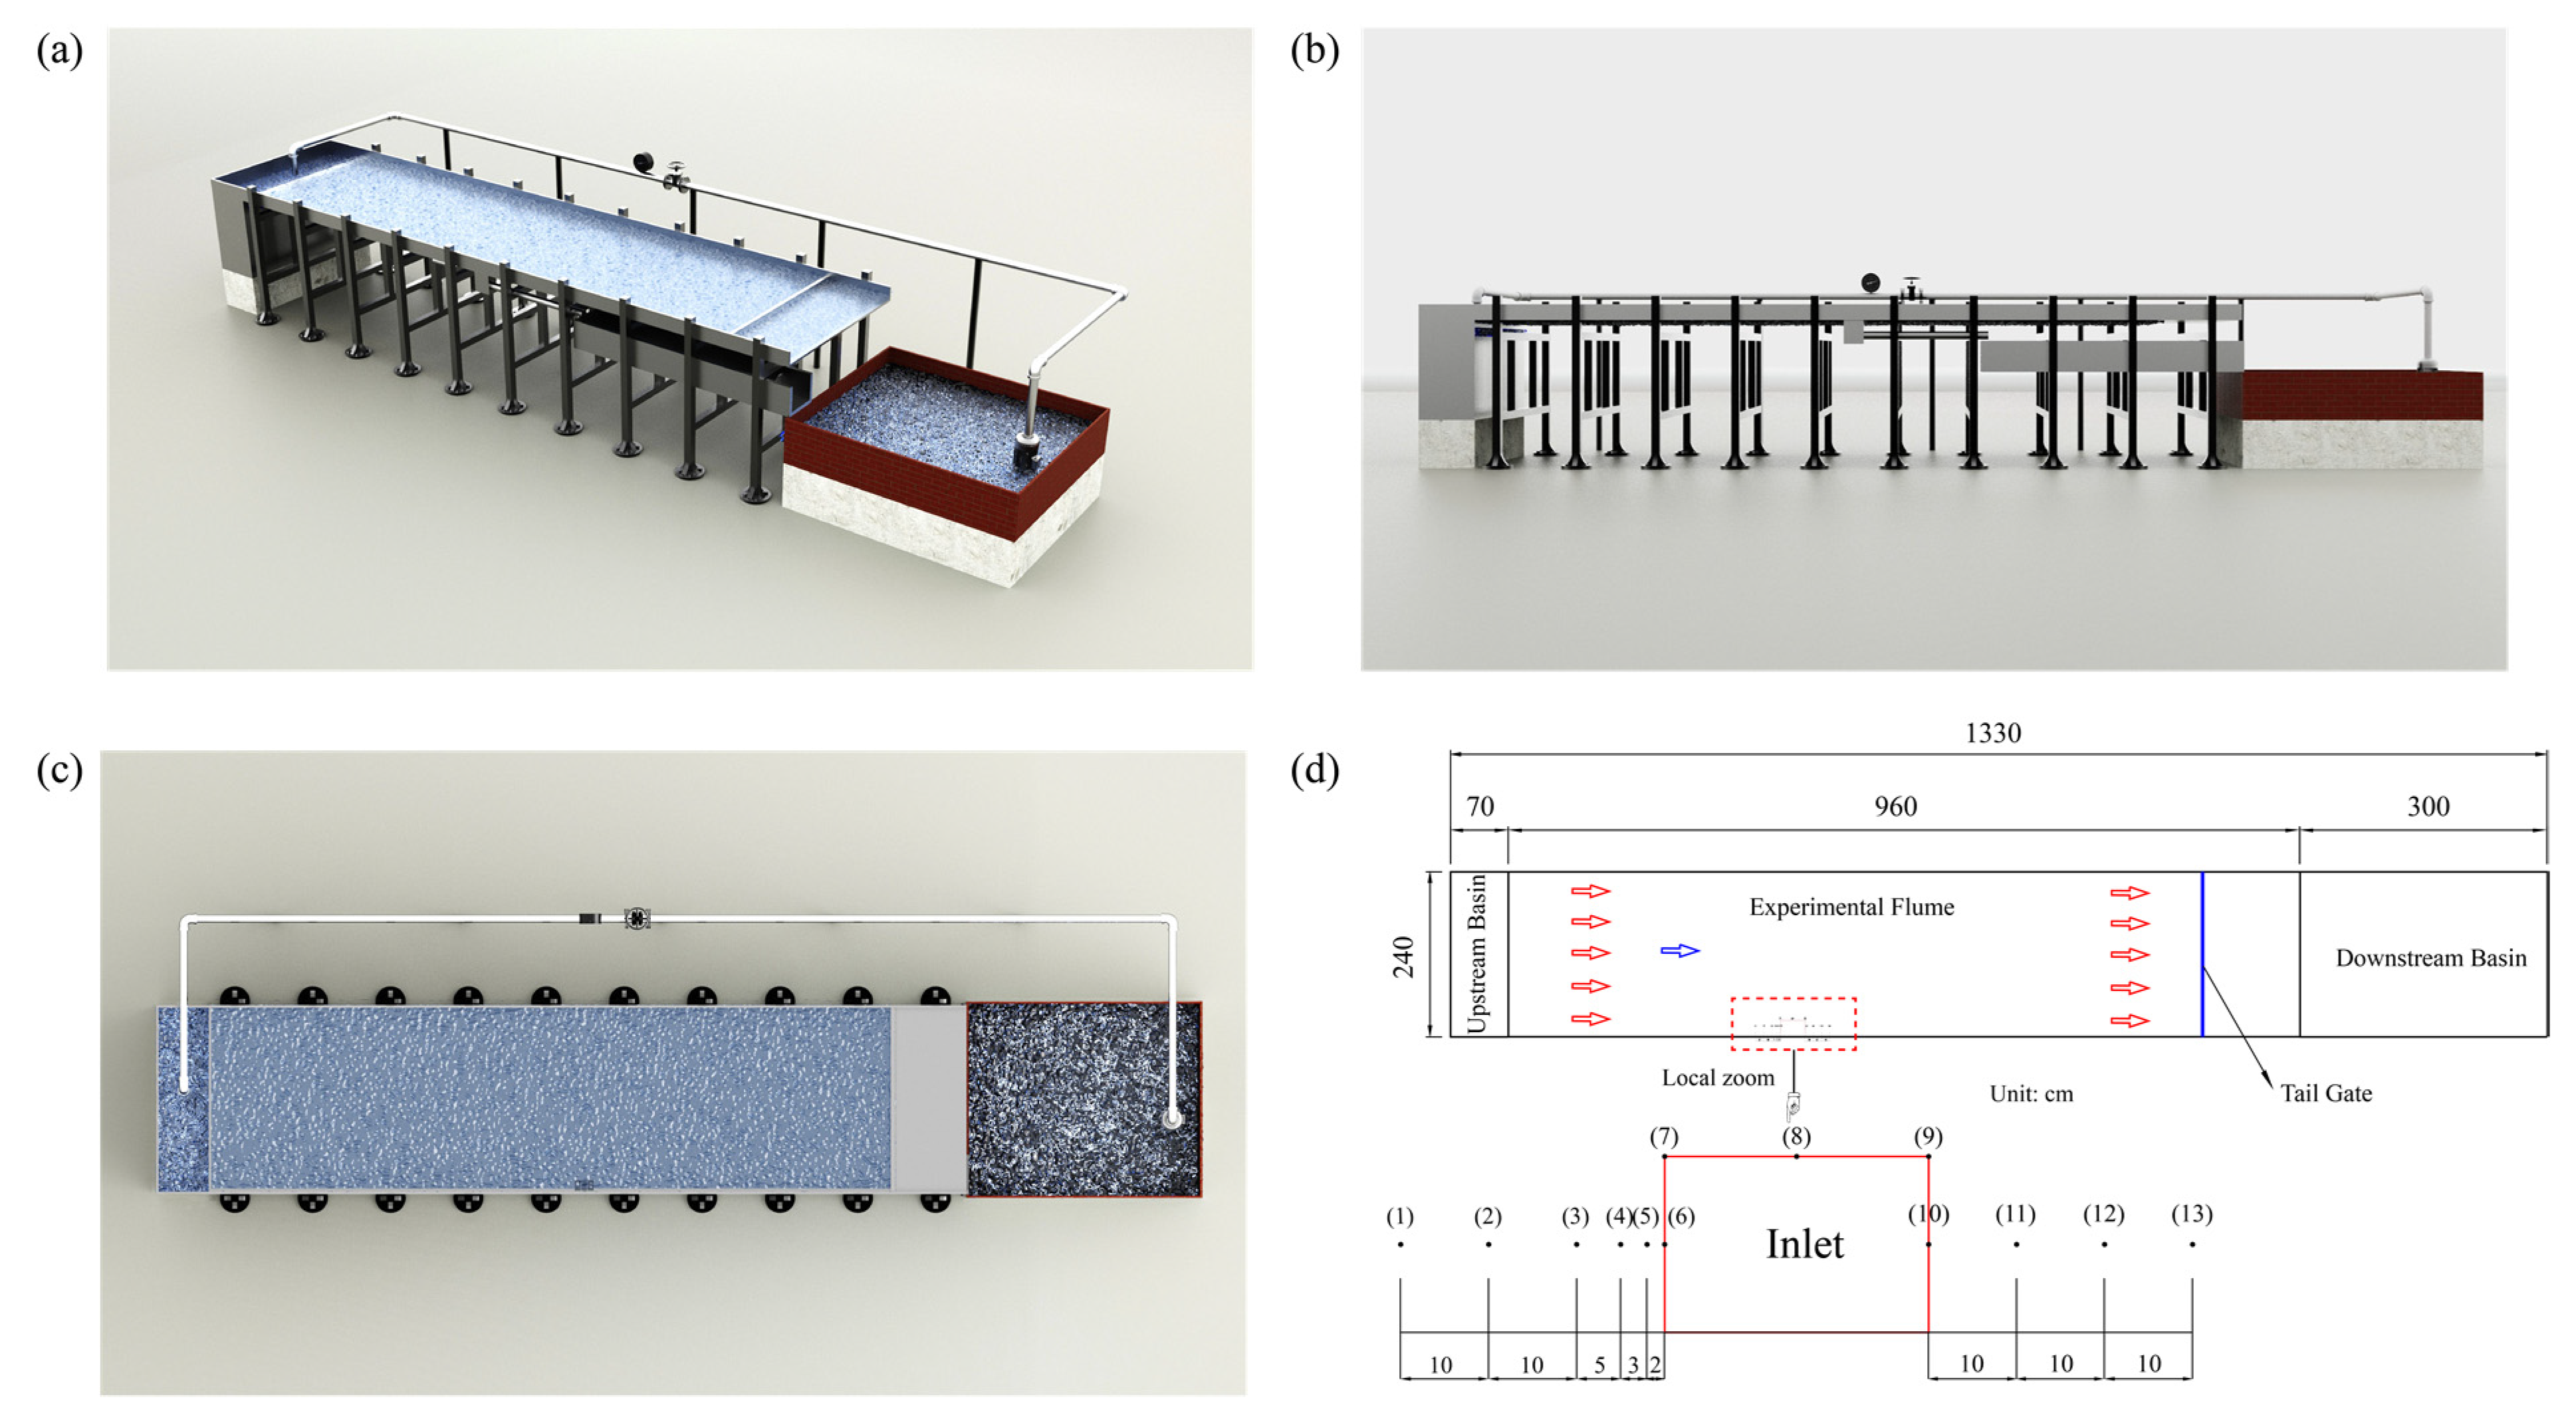
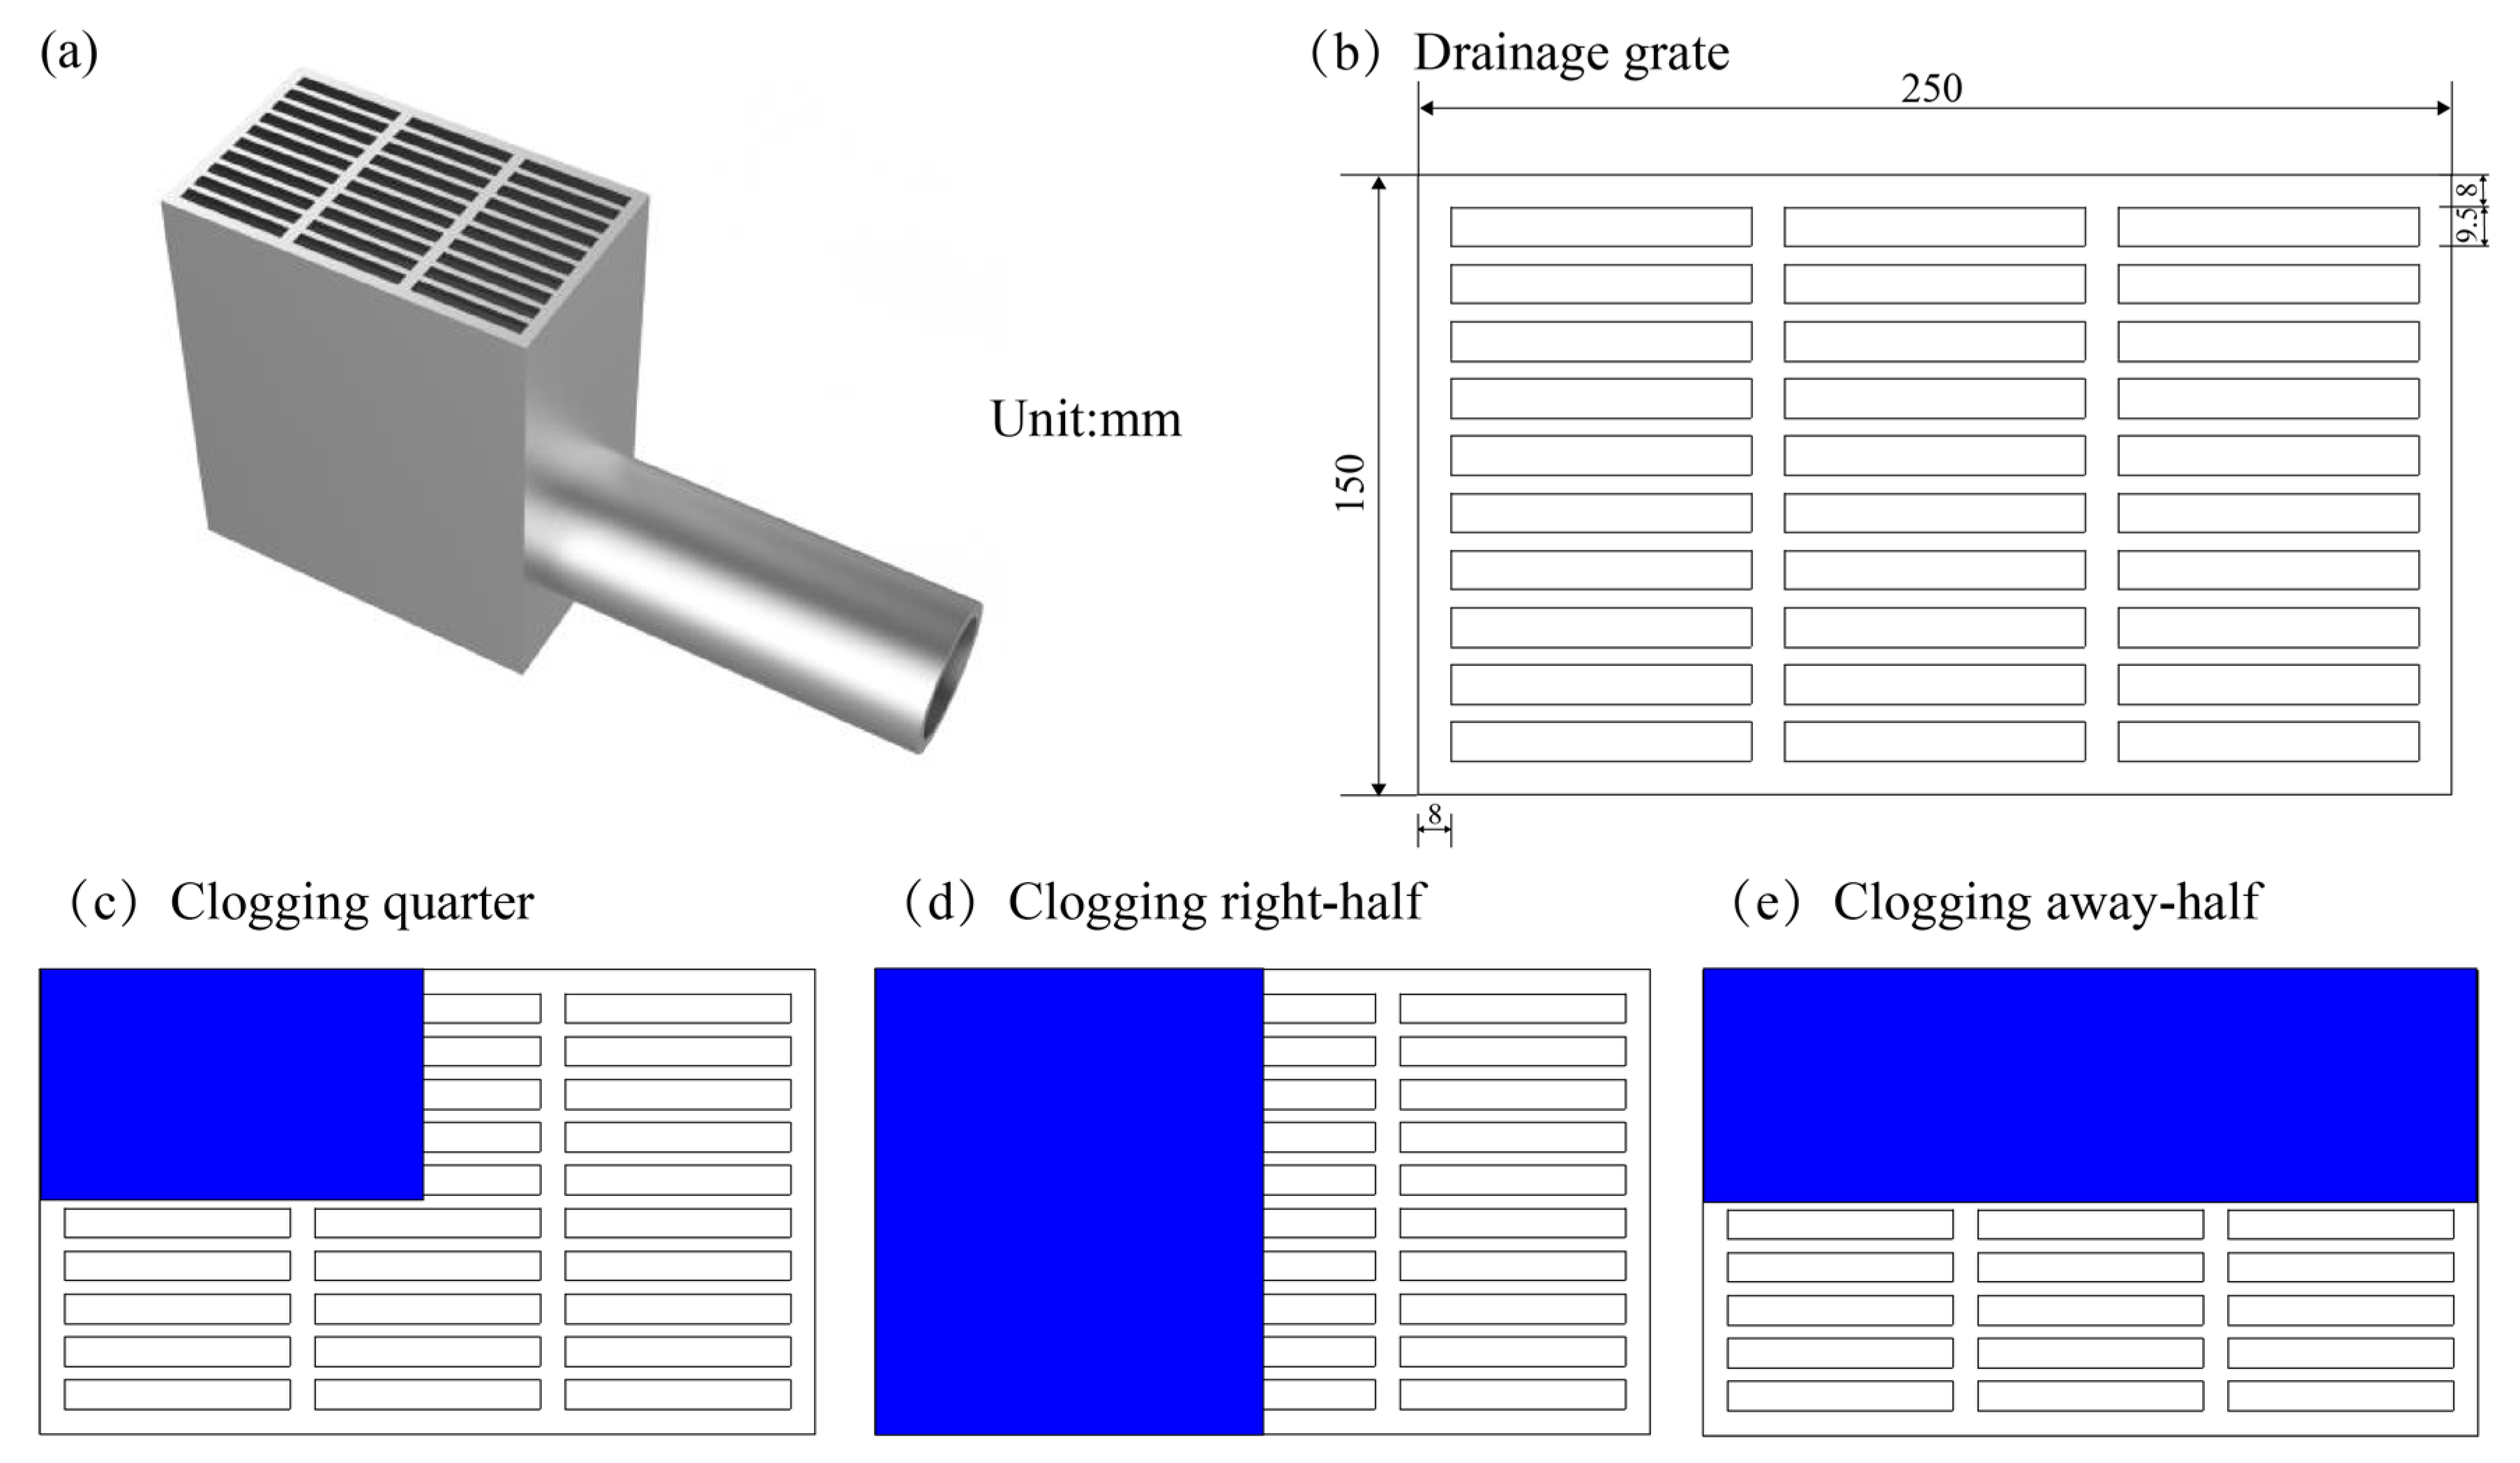
A scale model was constructed to determine discharge coefficients that can be applied for urban inundation modeling. The experimental scale was assumed to be 1/3, which showed a ratio between the real scale and experimental scale based on the similarity law of Froude, as shown in Table 1. The experimental facility is shown in Figure 1 which illustrates the ground surface and storm drainage parts. Figure 1a shows the overall view of the experimental setup, and Figure 1b,c show the side and plan views of the flume. The experimental size of the upper ground surface section was approximately 9.6 m long and 2.4 m wide, as shown in Figure 1d. The slope of the upper section was 1.5% from upstream to downstream. A basin located on the upstream side of the upper section was used to generate surface runoff. In addition, the experimental facility included an energy dissipation device. These structures can enable smooth upstream runoff flow into the ground surface. Furthermore, a basin located downstream of the flume was used to store surface runoff, including surface water drained through the drainage grate and surface water that was not collected. The lower storm drain included a complete inlet structure and a V-shaped weir. The drainage grate occupied approximately one-third of the flume and was 0.25 m × 0.15 m in size. Figure 2a,b show the inlet structure and the size of the adopted drainage grate. The thickness of the inlet type was approximately 0.023 m. The rainwater well, which was 0.15 m × 0.25 m × 0.3 m, was below the drainage grate, and the connecting pipe was located on the side of the rainwater well, which was 0.5 m long and 0.1 m wide.
To evaluate the inlet discharge capacity by taking different clogging conditions into account, a series of experiments were performed under the different clogging conditions listed in Table 2. In this experiment, three different clogging conditions were used to determine the discharge coefficient, as shown in Figure 2c–e, where the clogging extent is determined by the ratio of clogging area to total area. There were two different clogging extents (0.25 and 0.50) and clogging positions. The clogging quarter condition was the quarter clogging extent of the grate, as shown in Figure 2c. The clogging right-half condition was the half clogging extent of the grate, as shown in Figure 2d, where the clogging position was parallel with the direction of the upstream flow. The clogging away-half condition was the half clogging extent of the grate, as shown in Figure 2e, where the clogging position was not parallel with the direction of the upstream flow.
2.2. Measurement and Instrumentation
The upstream inflow smoothly discharged into the ground surface, which was dissipated by the upstream basin and energy dissipation device. The upstream basin inflow discharges were controlled by the degree of valve opening and were measured using an electromagnetic flowmeter installed in the intake pipe, as shown in Figure 1. The maximum permissible error of the adopted electromagnetic flowmeter was ±0.5%. For each experiment, the upstream inflow source was adjusted by the degree of valve opening to obtain a certain discharge. A test was carried out until a steady-state flow condition was reached. In the process, upstream discharges were recorded 3–5 times, and then the average discharge was applied to later experimental analysis. In the upper flume, water depths were measured by a needle water level gauge and a ruler attached outside the flume, and the values were recorded 3–5 times by two individuals. Similarly, the average value was applied to later experimental analysis. The surface velocities were measured by the LGY-III multifunctional intelligent velocity instrument, and the measurement position was approximately 0.2 times the water depth below the surface. Each point velocity was automatically and continuously measured three times, with 10 s for each measurement time. Velocity and water depths were measured at strategic locations, shown as black points (no. (1–13)) in Figure 1d. The inlet drainage discharges were measured using the V-shaped weir, having a measurement error within ±1.4%. The excess surface runoff, which was not collected by the drainage inlet, flowed directly downstream of the flume and entered the downstream basin.
Under four different clogging conditions, the upstream inflow was increased in the range of 0–20 L/s. For each clogging condition, this study considered approximately 35 groups of different upstream inflow conditions. Approximately 140 groups of experiments were performed in total.
3. Experimental Results
3.1. Experimental Phenomena
When taking different clogging conditions into account during the experimental process, the experimental phenomena appeared to be very similar. The upper surface water depth increased as the upstream inflow increased. Moreover, the surface runoff patterns into the inlet can be divided into non-submerged (weir) and submerged (orifice) types as the surface water depth changes based on previous studies [13,14,15,16,17,18]. The experimental phenomena can be described as follows:
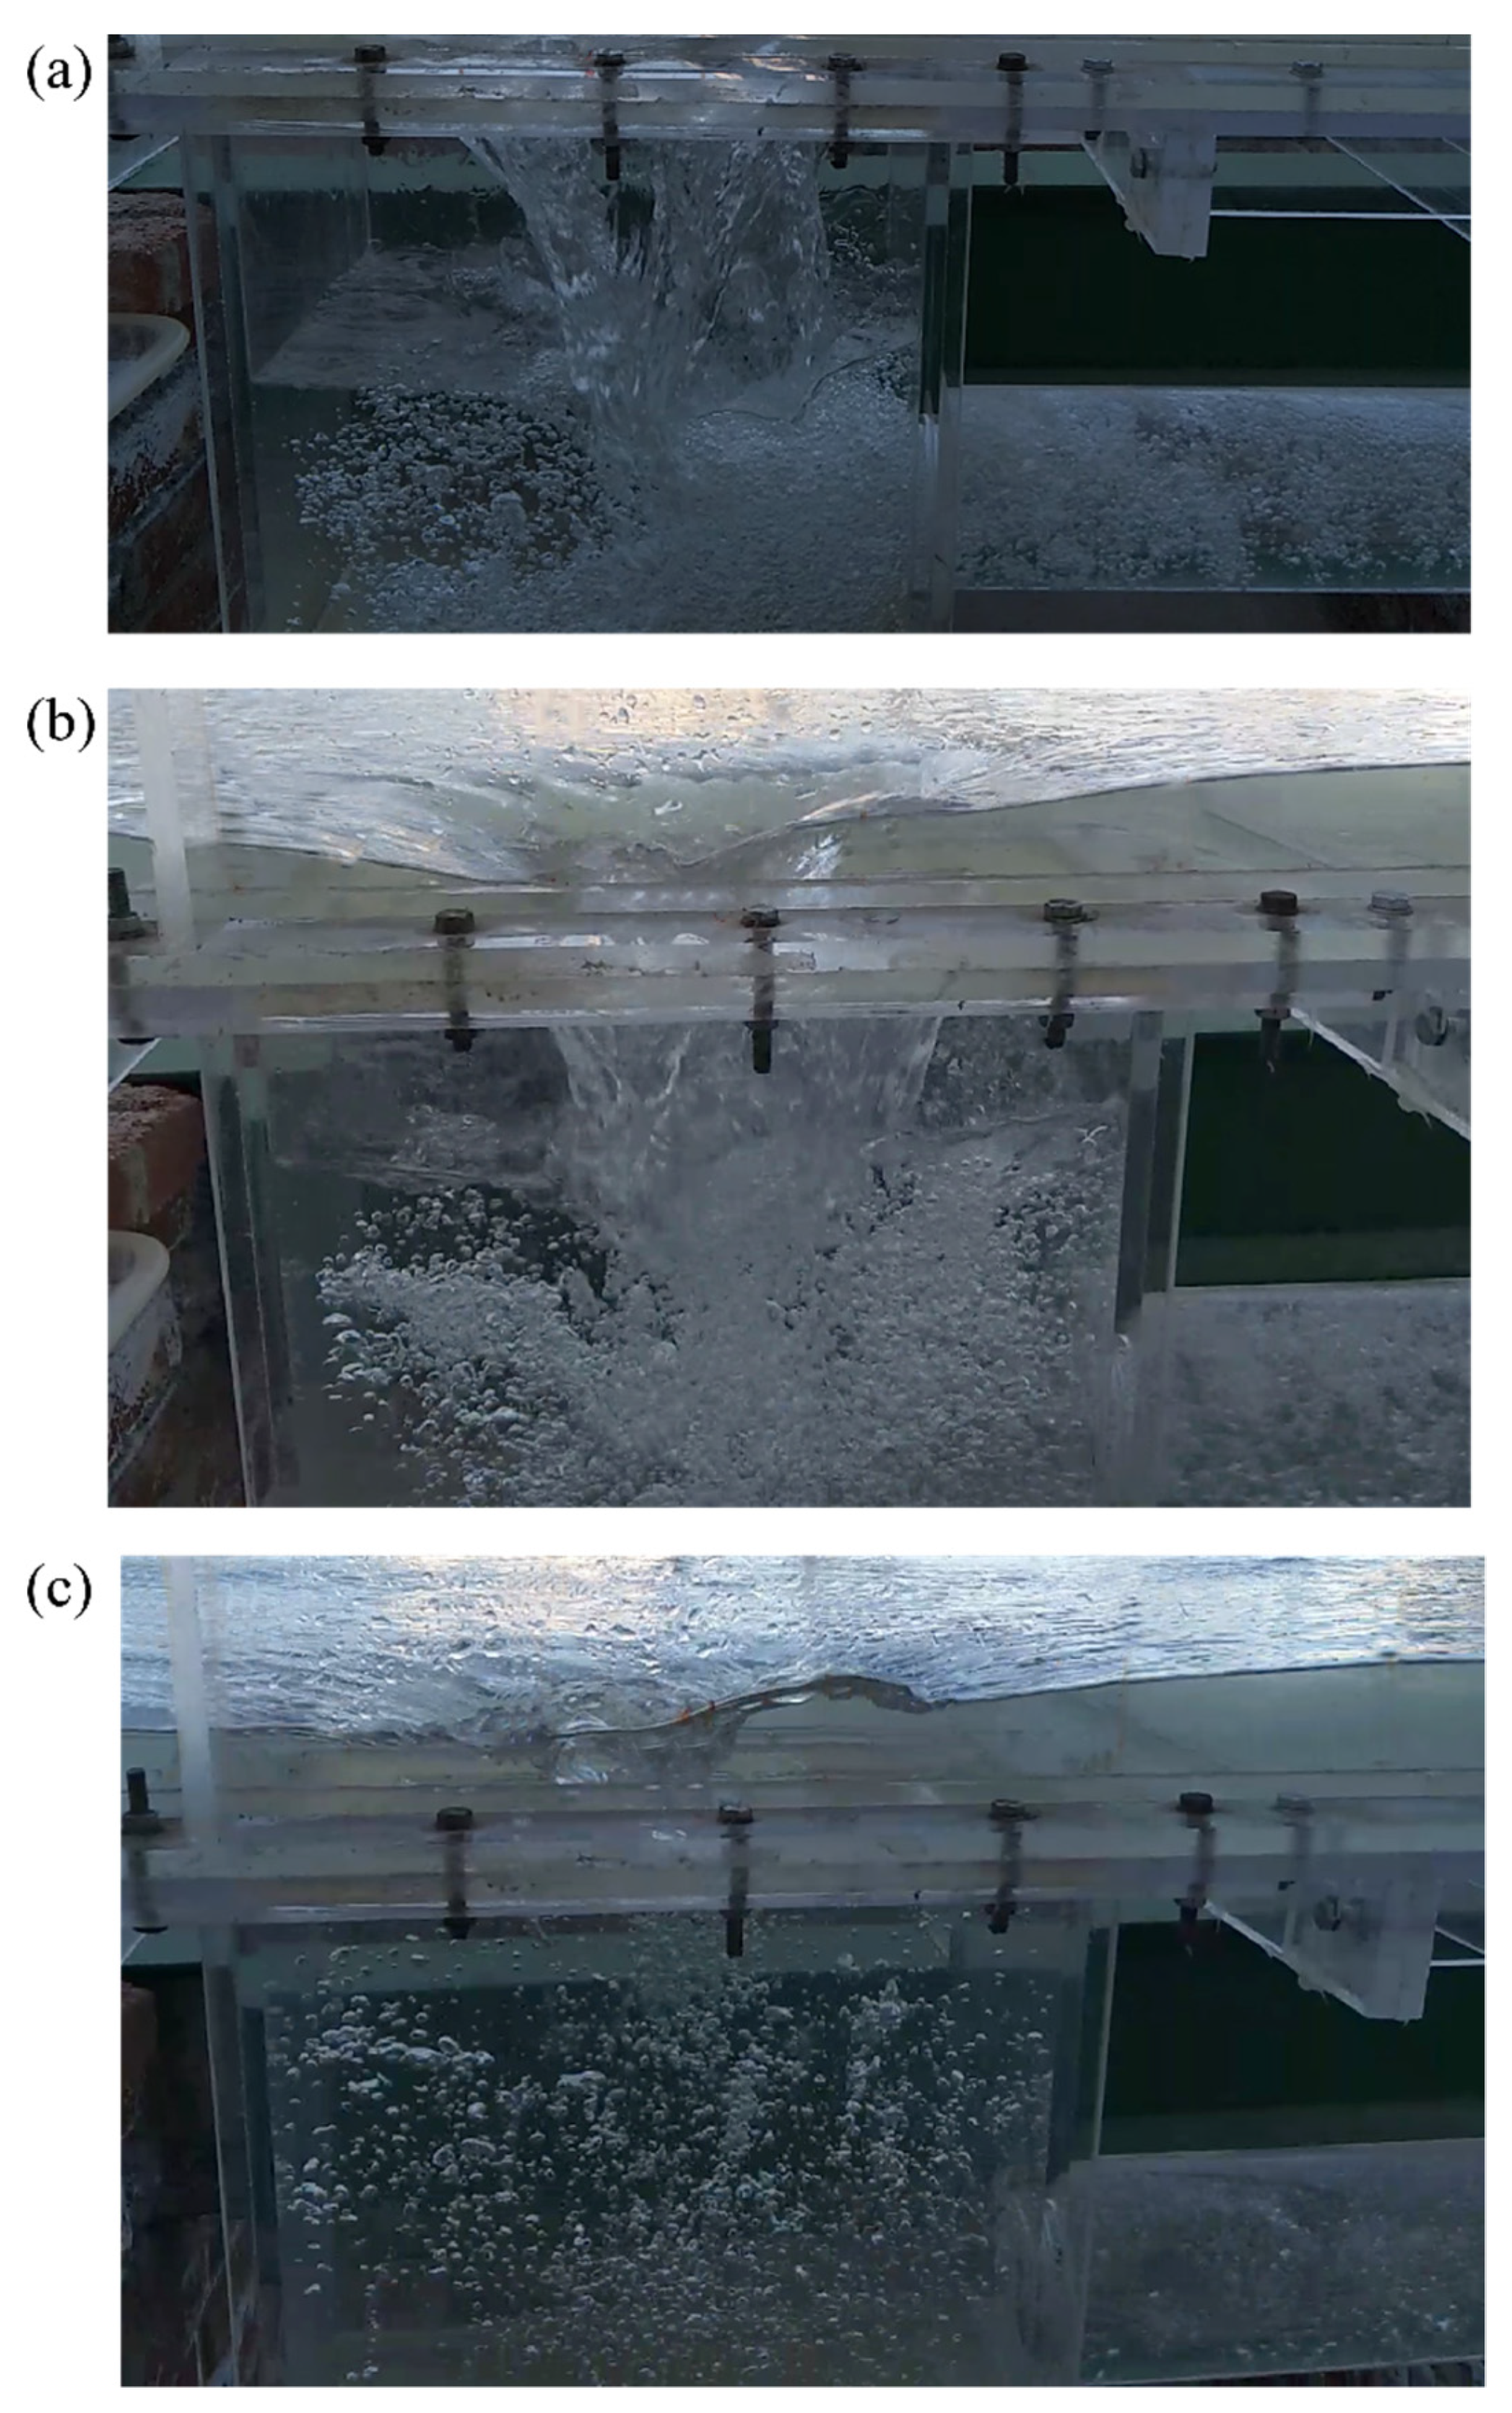
- When the surface water depth was shallow, the flow state of the water near the inlet was similar to the weir flow. Here, the outflow discharge of the connecting pipe was almost the drainage discharge of the grate. Less water was stored in the rainwater well, and the water level in the rainwater well was below the grate, as shown in Figure 3a.
- Subsequently, when the water depth of the upper flume increased, the water in the rainwater well gradually increased, and a small water spiral began to appear around the grate. The rate of increase in the connecting pipe outflow discharge was less than that of the grate drainage discharge. The water level in the rainwater well was still below the grate, as shown in Figure 3b.
- With the increase in water depth, the drainage grate was submerged by water flow, where a vortex flow could be clearly observed. In addition, the vortex flow was discontinuous and contained bubbles. In this moment, the rainwater well reached a critical flow state.
- As the water depth continued to increase, the rainwater well was filled completely. At this point, the rate of increase in the grate drainage discharge was reduced due to the effect of the connecting pipes. In addition, the flow state of water draining into the inlet resembled an orifice flow, as shown in Figure 3c.
Moreover, there were few differences in the drainage discharge under different clogging conditions when the upstream inflow was small. With the increase in upstream inflow, the inlet discharge capacity clearly decreased with the increase in clogging extent, and the inlet clogging position could have also influenced the discharge capacity of the inlet.
3.2. Analysis of Experimental Results
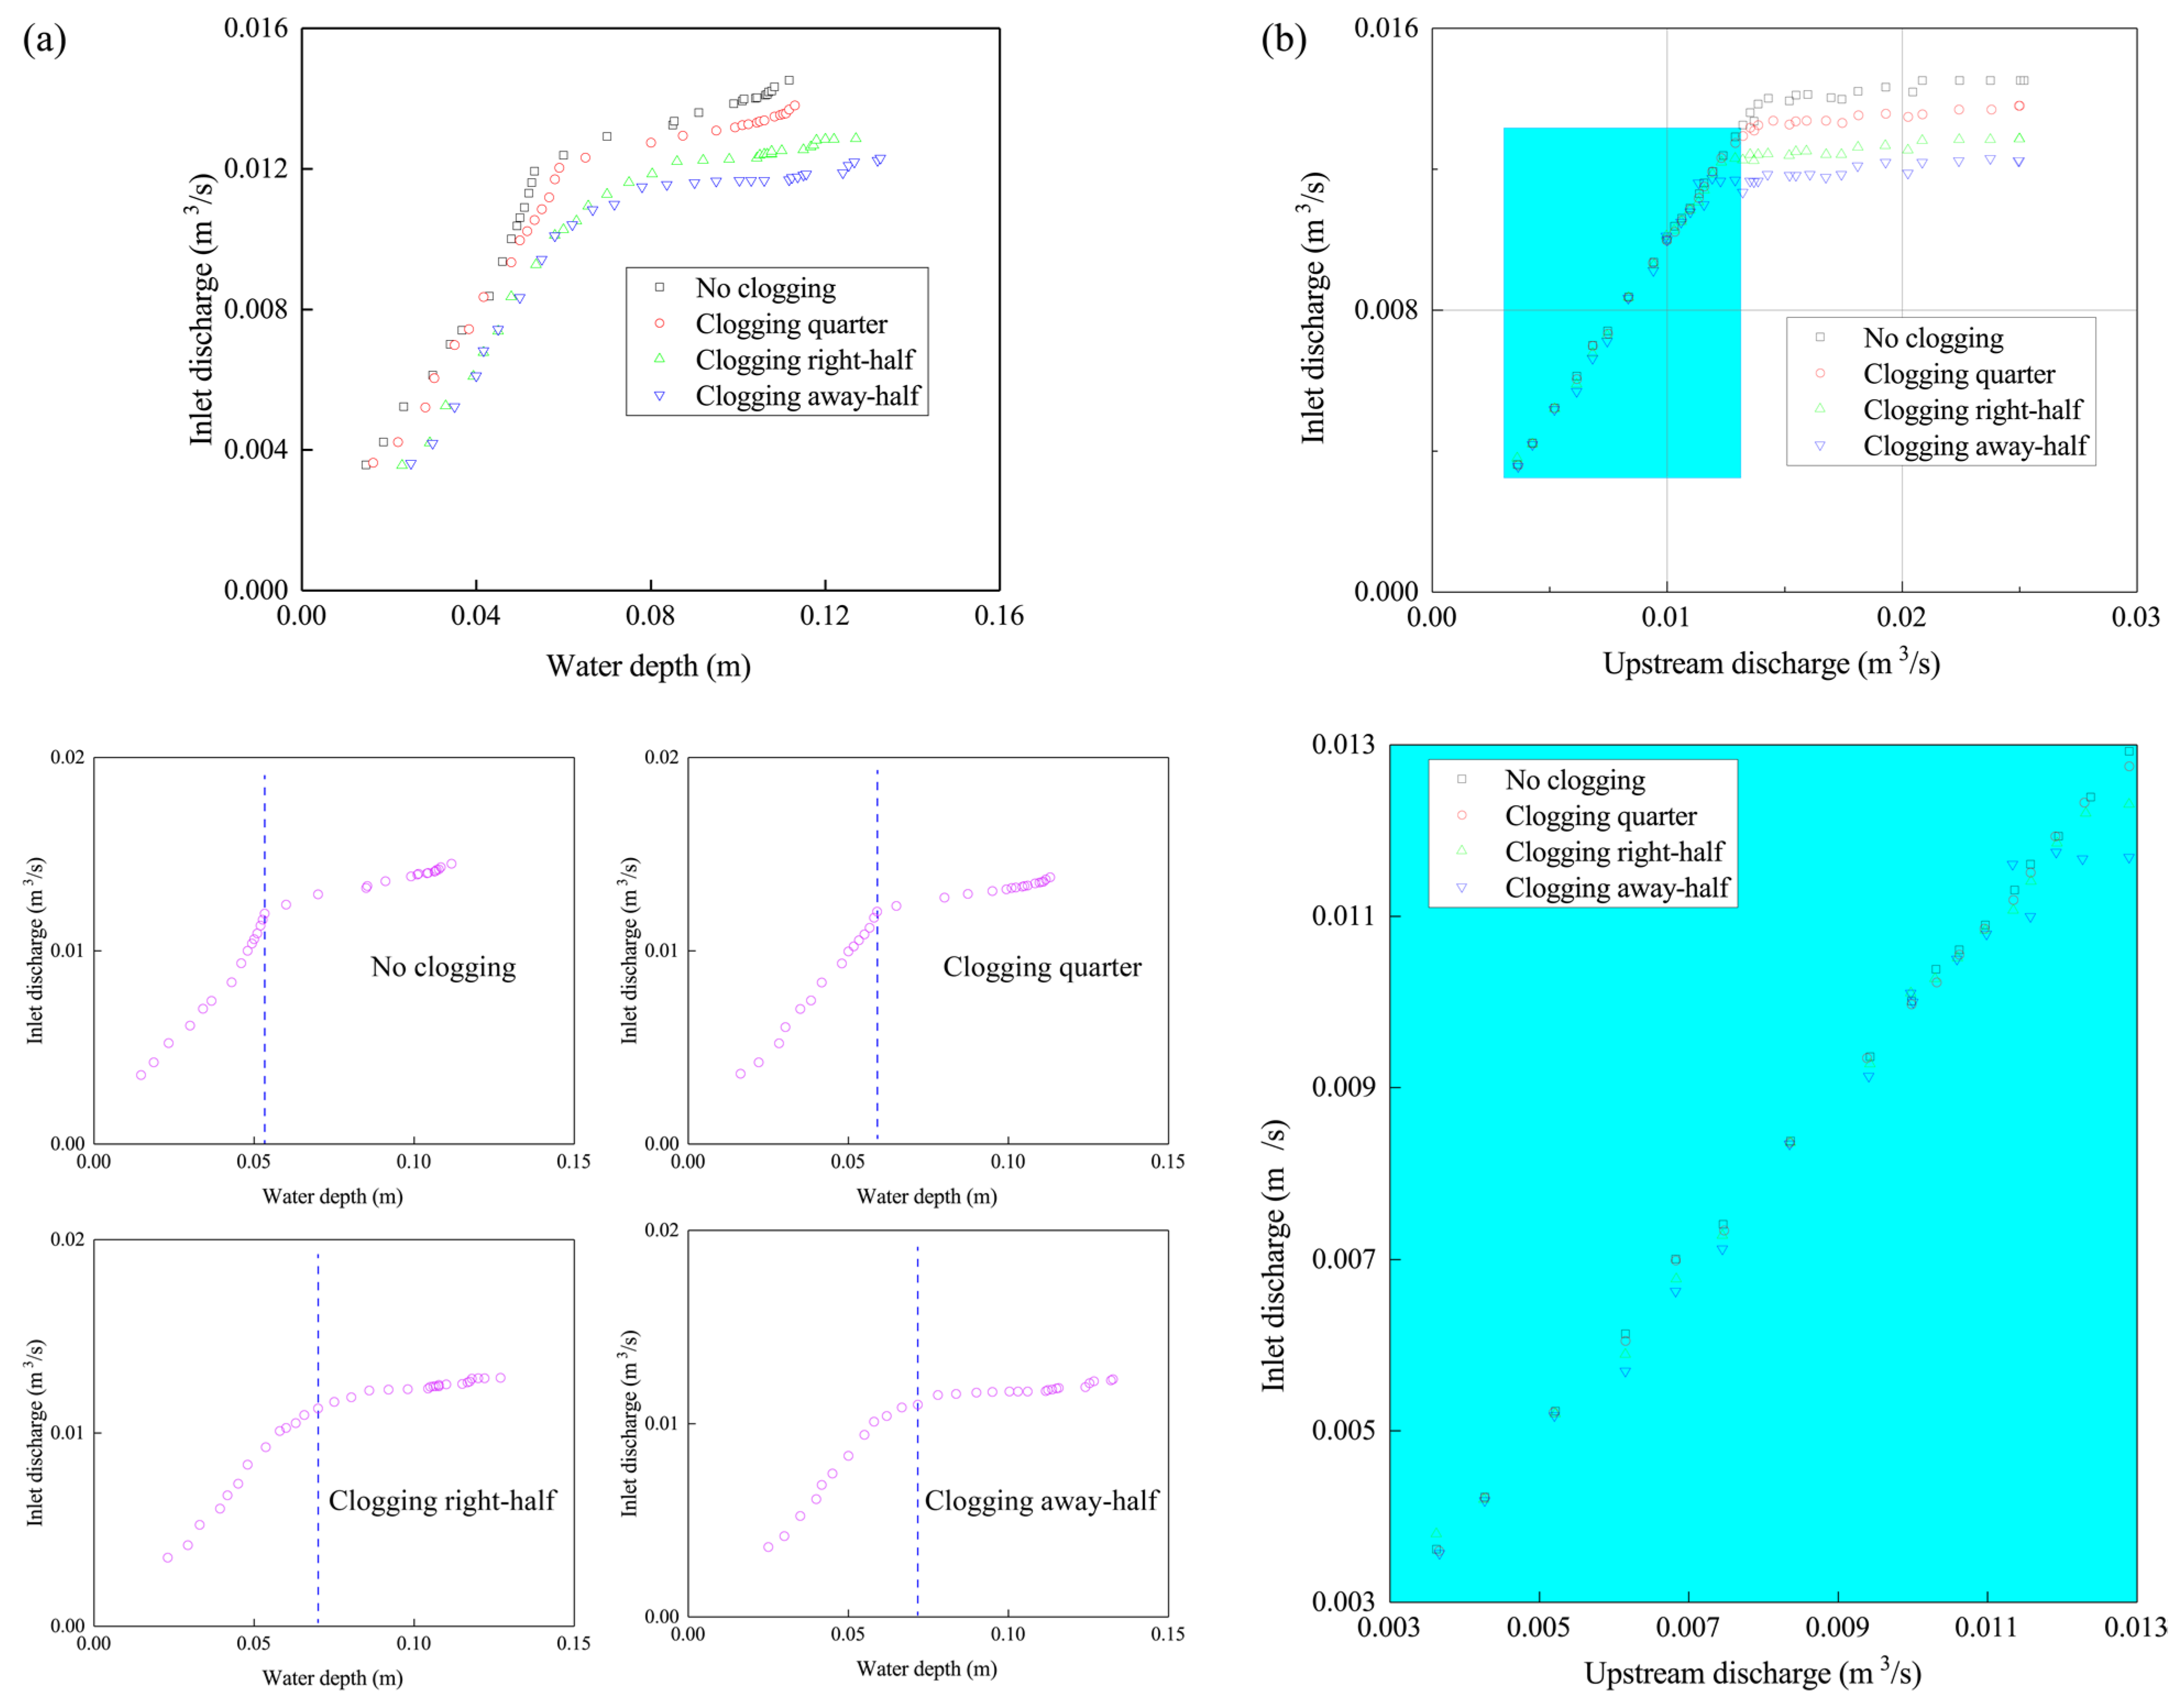
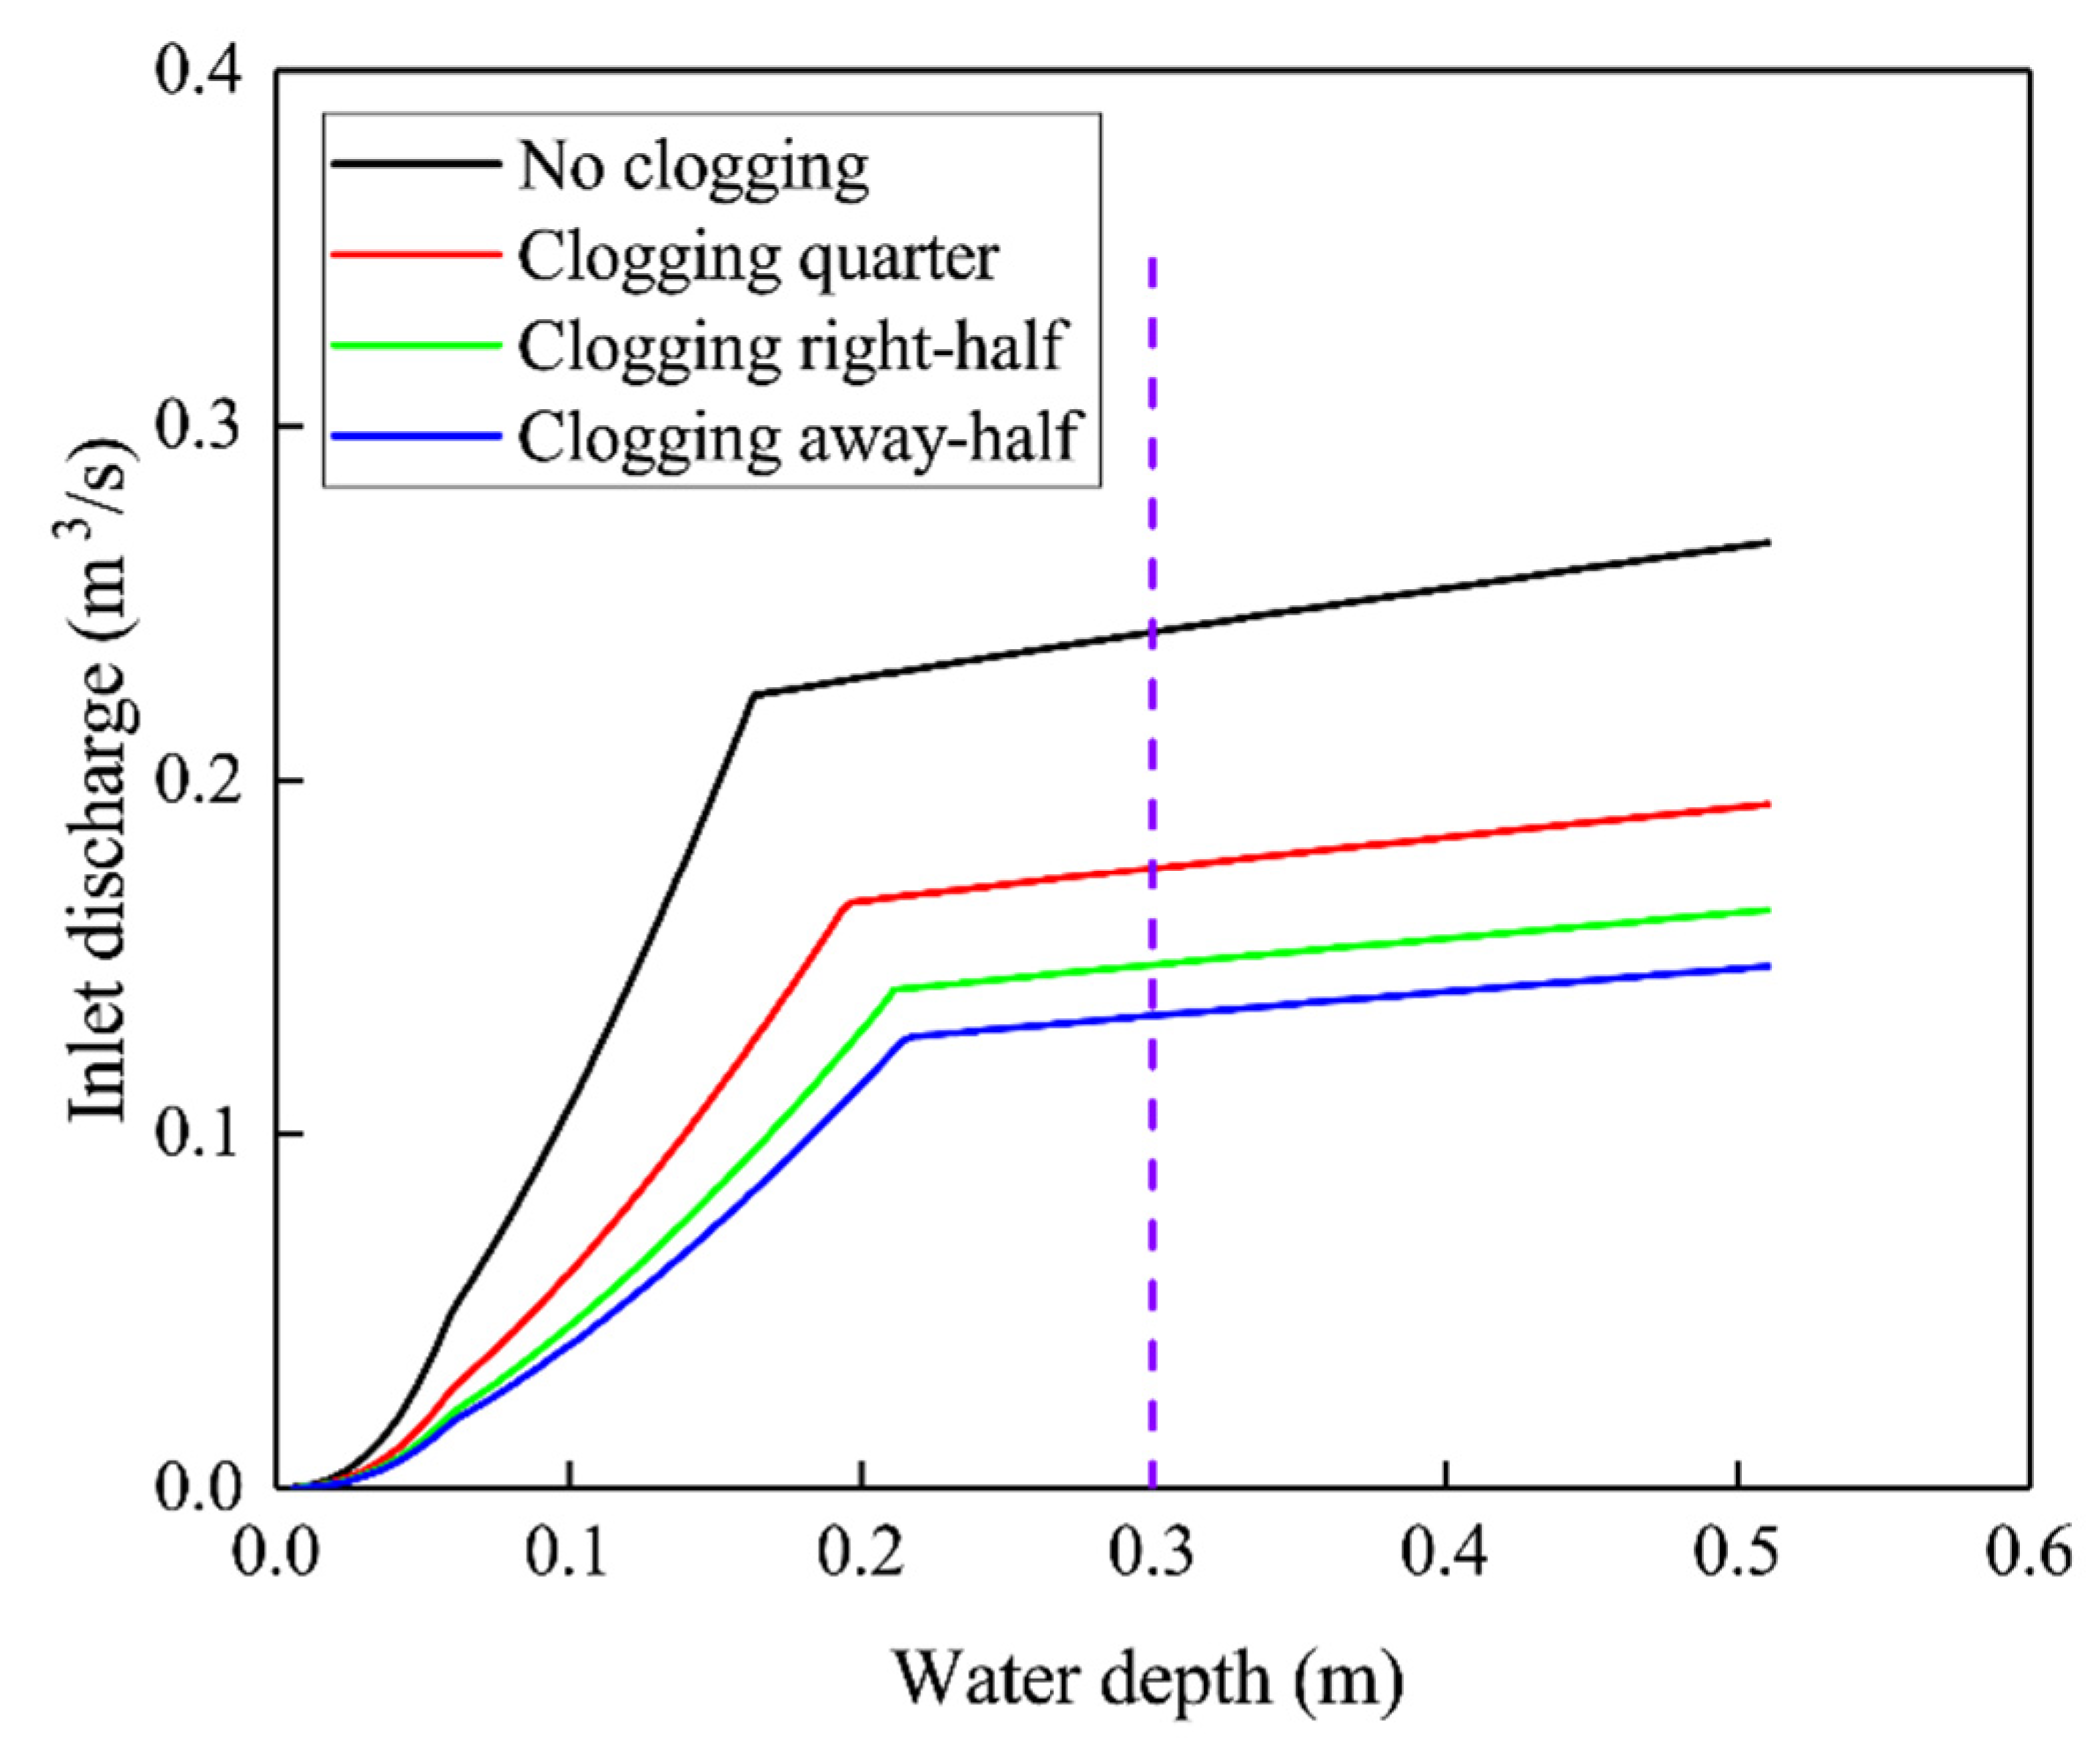
In the experiments of this study, four different clogging conditions were assessed, and the Supplementary Materials shows the different experimental conditions and results for which each clogging condition. In addition, this study used an experimental dataset to plot the relationships between the incoming water depth and discharge capacity of the inlet, and the upstream discharge and discharge capacity of the inlet, as shown in Figure 4a,b, respectively.
As shown in Figure 4, for each experiment conducted under different clogging conditions, the inlet discharge capacity showed two periods of clearly increasing trends with increasing upstream discharge or incoming water depth. From these experimental points in Figure 4a, it is clear that the variation rate of the inlet discharge capacity is high, with increasing incoming water depth when the incoming water depth is shallow. In this process, the upper water flows into the rainwater well in a weir flow pattern. When the rainwater well was filled completely, the flow pattern changed from a weir condition to an orifice condition. Moreover, the variation rate is relatively smooth when the incoming water is deep. In this process, the upper water flows into the rainwater well in an orifice flow pattern.
In this study, the critical flow state is defined as the approximately critical point from weir flow to orifice flow. Figure 4a shows the approximate location of the critical flow state as a dotted line under different clogging conditions. Moreover, the approximate water depth values of the critical flow state were estimated, as shown in Table 3. Combined with these data, this result shows that the incoming water depth of the critical flow state gradually increased with the increase in clogging extent. Moreover, when the clogging position was away-half, the critical flow state water depth was higher than that when the clogging position was right-half.
The experimental points from Figure 4b, combined with the above-mentioned experimental phenomena, demonstrate that the rainwater well was not full when the water reached the weir flow state, and the inlet discharge capacity slightly decreased with the increase in clogging extent. When the clogging position was right-half, the inlet discharge capacity was slightly greater than that when the clogging position was away-half. The rainwater well was almost full when the water reached the orifice flow state, and the inlet discharge capacity clearly decreased with the increase in clogging extent. When the clogging position was right-half, the inlet discharge capacity was clearly greater than that when the clogging position was away-half. The above phenomenon is consistent with the experimental phenomenon.
In this study, a scale experiment was performed to study the inlet discharge capacity under different clogging conditions. Comparing the inlet drainage process under different clogging conditions, this study found that the incoming water depth increased as the clogging extent increased. When the clogging position was right-half, the water depth of the critical flow state was higher than that when the clogging position was away-half. Moreover, the discharge capacity decreased with an increase in the clogging extent. Moreover, under the same clogging extent, when the clogging position was right-half, the discharge capacity was greater than that when the clogging position was away-half.
3.3. Discharge Coefficient Analysis under Different Clogging Extents of Inlet
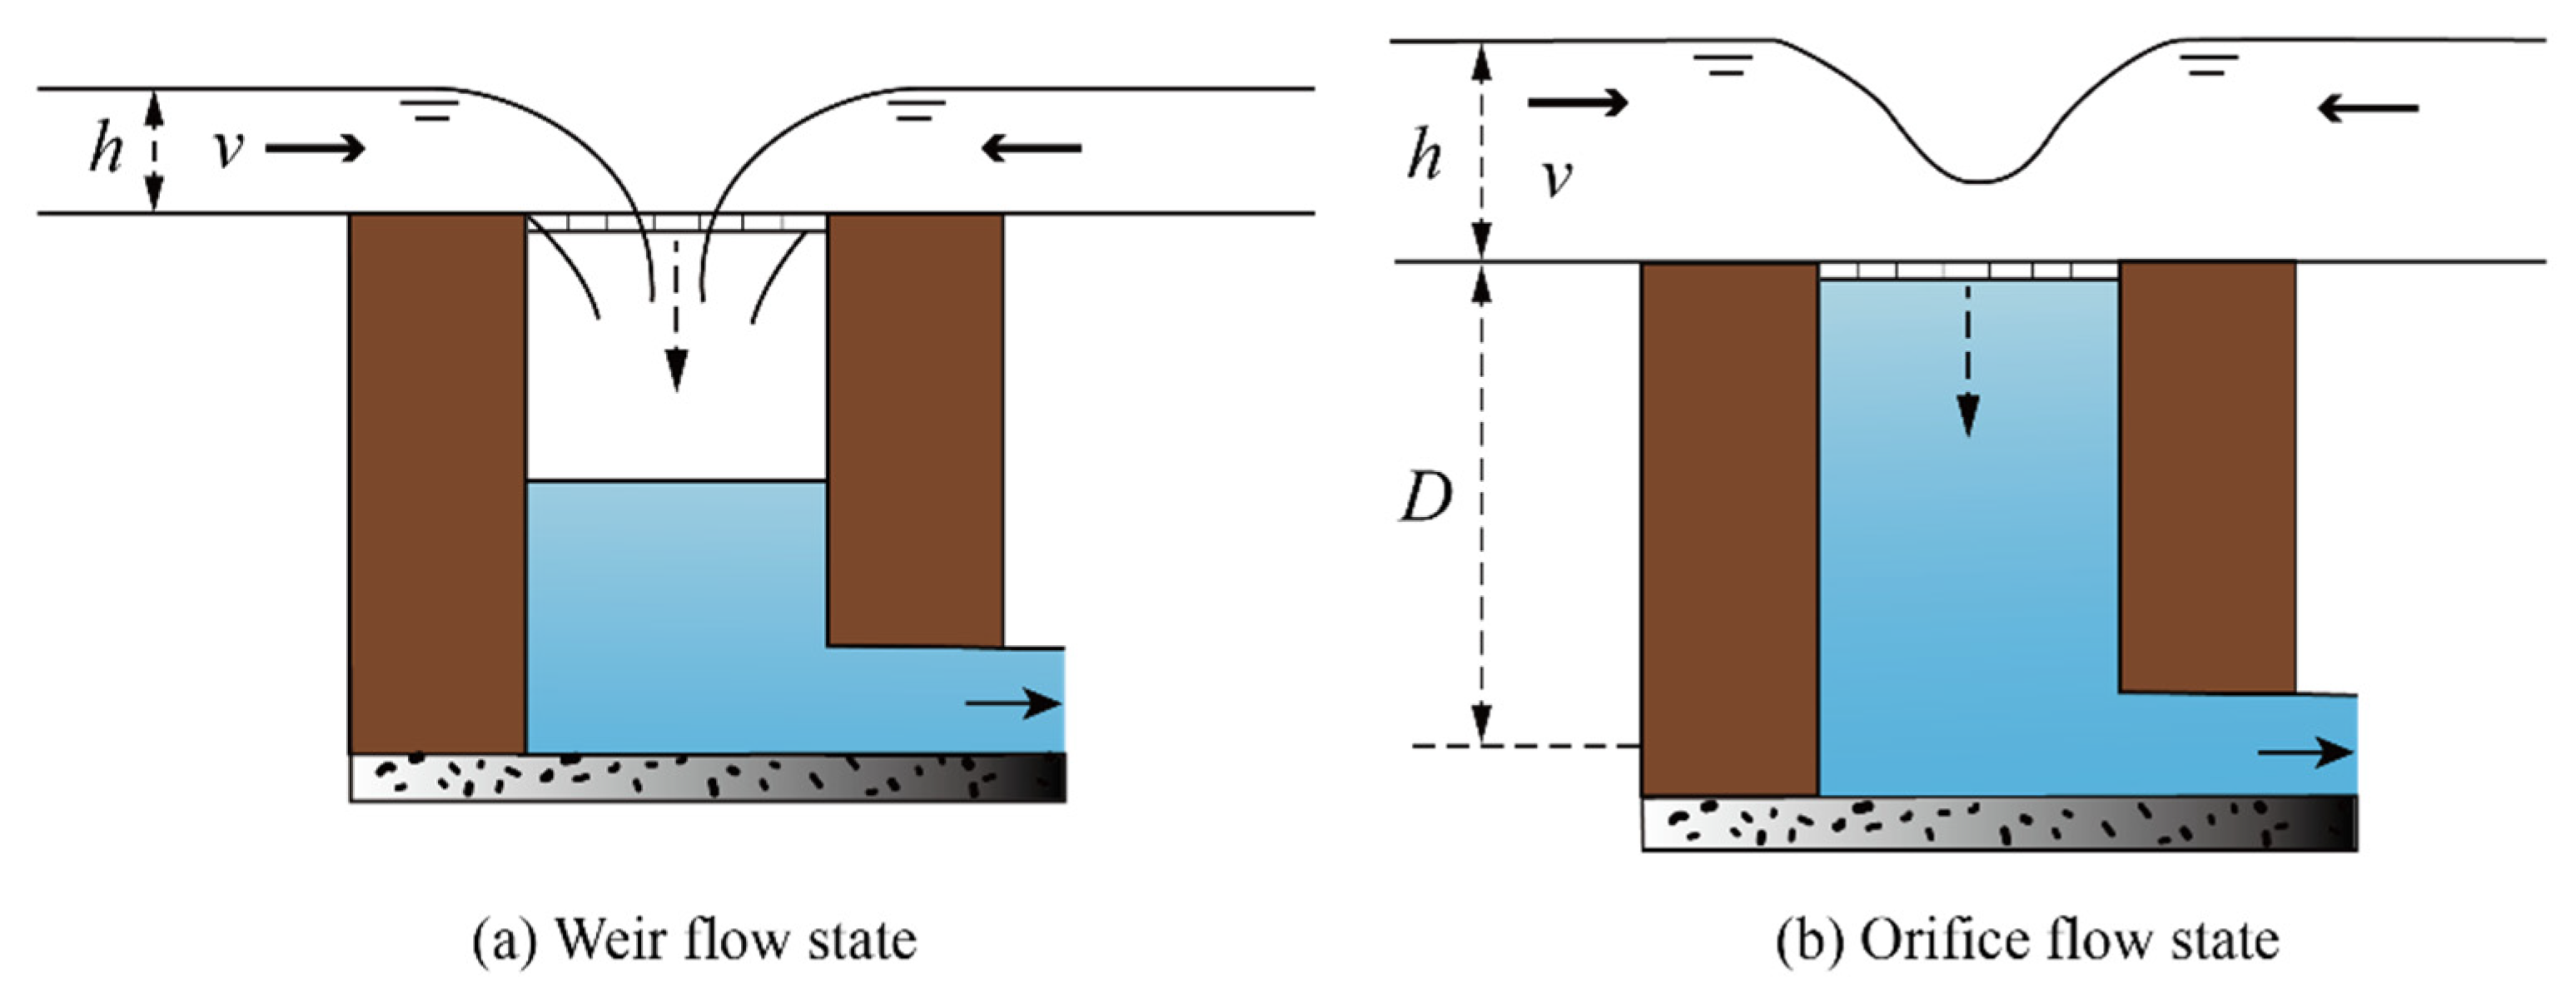
As the upstream inflow changes, the surface runoff patterns into the inlet can be divided into non-submerged (weir) and submerged (orifice) types, as shown in Figure 5. Surface runoff can freefall into the rainwater well along the grate boundary. This drainage process can be similar to the weir flow state. However, when the upstream inflow is large, the rainwater well is completely submerged. The connecting pipe affects the inlet drainage process, and the inlet drainage process is considered to reflect the orifice flow state.
When the upstream discharge is small and the incoming water depth is shallow, the weir formula can be used to calculate the inlet discharge through the storm drains. The weir formula is expressed as (1):
where Q is the inlet discharge (m3/s); Cw is the discharge coefficient for the weir; P is the wetted perimeter (m), and the wetted perimeter adopts the same values to simplify the calculation when taking each clogging condition into account. H is the total head approximately 30 cm before the grate, , and g is the acceleration of gravity (m/s2).
When the upstream flow is high and the incoming water depth is deep, the orifice formula can be used to calculate the inlet discharge through the storm drains. The orifice formula is expressed as (2):
where H1 is the total head between the free water surface and the center of the connecting pipe approximately 30 cm before the grate (m), ; Co is the discharge coefficient for the orifice, and As is the cross-sectional area of the connecting pipe (m2).
The experimental datasets are used to calculate the inlet discharge coefficients of the weir and orifice flow states under different clogging conditions. Based on the weir and orifice equation, the formula can be transformed as follows:
From the two formulas, it can be found that the weir and orifice discharge coefficients were the function of and . Considering the different storm inlet clogging conditions, the discharge coefficients of weir and orifice flow patterns were calculated based on fitting the curve of and , respectively. Moreover, the calculation results of these discharge coefficients are shown in Table 4. From Table 4, it is evident that the discharge coefficient is significantly different under different clogging conditions. The discharge coefficients of the orifice flow state decrease with an increase in the clogging extent. In addition, when the clogging position is right-half, the discharge coefficients of the orifice flow state are higher than when the clogging position is away-half. The variation trend of the orifice discharge coefficient is essentially consistent with the inlet discharge capacity under different clogging conditions. Furthermore, the variation trend of the discharge coefficients under the weir flow state is the same as the orifice flow state; however, there is a marginal difference under different clogging conditions.
4. Discussion
4.1. Effect of the Inlet Structure
Numerous studies have been conducted on storm drain grate inlet discharge capacities. In this study, the testing adopted a complete inlet structure. Unlike previous studies, this experiment added the inlet structure of the rainwater well and the connecting pipe. Based on the mentioned phenomenon in Section 3.1, the rainwater well and the connecting pipe can affect the inlet drainage process. The connecting pipe obstructs the inlet drainage process, especially when the rainwater well is filled completely. In actual road surface runoff processes, the runoff is collected by the grate and then drained into the rainwater well and the connecting pipe, which transports the water to the main pipeline. The experiment considered the obstruction effect of the rainwater well and the connecting pipe, which more accurately represented the actual process.
Moreover, previous studies adopted the incoming water depth (H) and the width of the grate (b) to determine weir and orifice flow. These studies suggested that H/b is a criterion that can divide weir and orifice flow. The H/b values are shown in Table 5 under different clogging conditions; these differed from the H/b values determined in previous studies [27]. Therefore, the previous research criterion cannot effectively determine the inlet drainage patterns.
4.2. Effect of the Inlet Clogging Condition
4.2.1. Effect of the Inlet Clogging Condition on Discharge Capacity
When the incoming water depth is shallow, the outflow discharge of the connecting pipe is almost equal to the drainage discharge of the grate. The inlet discharge capacity slightly decreases with an increase in clogging extent. This is due to the decreasing wetted perimeters as the degree of clogging increases. Under the same clogging extent, the inlet discharge capacity when clogging right-half is slightly greater than that when clogging away-half. This is because the direction of the upstream inflow is consistent with the direction of the grate. Meanwhile, this variation trend is marginal when the upstream inflow is low. As the upstream inflow discharge increases, this variation trend is clearer.
Figure 6 shows a comparison of inlet discharge capacity under different clogging conditions. From this figure, it can be seen that different clogging conditions significantly influence the discharge capacity of the street inlet. The intersection point of the lines is the inlet discharge capacity in this condition, based on an incoming water depth of 0.3 m. When the clogging extent is 0.25, the inlet discharge coefficient is reduced to ~73% of the no-clogging state. When the clogging position is the right-half and away-half, the inlet discharge capacity is reduced to ~61% and ~55%, respectively, of the no-clogging state. Thus, the clogging extent and the clogging position significantly influence the discharge capacity of the inlet, and the clogging extent has a greater impact on the inlet discharge capacity compared to the clogging position.
4.2.2. Effect of the Inlet Clogging Condition on Discharge Coefficients
Based on the discharge coefficients shown in Table 4, the extent of the clogging and the clogging position significantly influenced the discharge coefficients of the street inlets. Meanwhile, when the water reached the orifice flow state, this research compared the discharge coefficients under different clogging conditions. When the clogging extent was 0.25, the inlet discharge coefficients was reduced to ~73% of the no-clogging state. When the clogging position was the right-half, the inlet discharge capacity was reduced to ~61% of the no-clogging state. When the clogging position was the away-half, the inlet discharge capacity was reduced to ~55% of the no-clogging state. This shows that previous studies are limited, owing to the adoption of a fixed clogging coefficient to represent the decreasing degree of inlet discharge capacity, or the method of decreasing inlet sizes to represent the degree of clogging.
The variation in discharge coefficients agrees with that of the discharge capacity under different clogging conditions. The analysis of discharge coefficients is similar to the inlet discharge capacity under different conditions. This can be summarized as follows: (1) the inlet discharge coefficients decrease with an increase in the clogging extent; (2) when the clogging position of the grate is parallel to the direction of the upstream inflow, the discharge coefficients are higher than that when clogging is unparallel to the direction of the upstream inflow.
5. Conclusions
The impact of different clogging conditions on inlet capacity in urban environments has been described and discussed using a series of experiments in a scale experimental flume, including the upper surface part and the lower storm drain part. In addition, this study adopted a complete inlet structure consisting of a drainage grate, a rainwater well, and a connecting pipe. A detailed description of experimental phenomena and relevant experimental analysis are presented, and the inlet discharge coefficients are calculated by taking different clogging conditions into account.
The flow pattern through the inlet changes significantly, increasing in the upstream incoming water depth and changing from a weir condition to an orifice condition. The experimental setup described in this paper adopted a complete inlet structure, unlike previous studies. The experimental phenomena show that the rainwater well and the connecting pipe can affect the inlet drainage. The study results show that the clogging extent and the clogging position have a significant influence on the discharge capacity of the street inlet, and the clogging extent has a greater impact on the inlet discharge capacity than the clogging position. Moreover, it also shows that the inlet discharge capacity decreases when the incoming water depth is high. Once blockage of the inlet structures occurs, the inlet discharge capacity further decreases. This process increases urban flood risk. It is of great practical significance to study the evolutionary mechanism of urban flooding and early warning indicators. Furthermore, based on the weir and orifice equation, both the weir and orifice discharge coefficients were calculated under different clogging conditions. The experimental setup described in this paper is scale designed by the reference of inlets (16S518) in China, and the inlet discharge coefficients are calculated in the above Section 3.3 based on the real scale dataset transformed from the physical model scale dataset. It is therefore of great practical significance for this to be applied to numerical models and to protect against and alleviate the impacts of urban flooding-based clogging patterns.
Supplementary Materials
The following are available online at https://www.mdpi.com/2073-4441/13/6/826/s1, Table S1: Experimental conditions and results under different clogging conditions.
Author Contributions
Conceptualization, J.M. and X.H.; methodology, X.H.; validation, J.M., H.S. and X.H.; formal analysis, X.H.; investigation, H.S.; resources, J.M.; data curation, H.S.; writing–original draft preparation, X.H.; writing–review and editing, X.H. and J.M.; visualization, H.S.; supervision, J.M.; All authors have read and agreed to the published version of the manuscript.
Funding
This research was funded by the National Key Research and Development Program, grant number “2017YFC1502703”, and the project was funded by the National Natural Science Foundation of China, grant number “52009147”.
Institutional Review Board Statement
Not applicable.
Informed Consent Statement
Not applicable.
Data Availability Statement
The data presented in this study are available on request from the corresponding author.
Acknowledgments
The authors are thankful to the Department of Hydraulics of China Institute of Water Resources and Hydropower Research for providing the experimental site.
Conflicts of Interest
The authors declare no conflict of interest.
References
- Noh, S.J.; Tachikawa, Y.; Shiiba, M.; Kim, S. Ensemble Kalman Filtering and Particle Filtering in a Lag-Time Window for Short-Term Streamflow Forecasting with a Distributed Hydrologic Model. J. Hydrol. Eng. 2013, 18, 1684–1696. [Google Scholar] [CrossRef]
- Praskievicz, S.; Chang, H. A Review of hydrological modelling of basin-scale climate change and urban development impacts. Prog. Phys. Geogr. 2009, 33, 650–671. [Google Scholar] [CrossRef]
- Sto Domingo, N.D.; Refsgaard, A.; Mark, O.; Paludan, B. Flood analysis in mixed-urban areas reflecting interactions with the complete water cycle through coupled hydrologic-hydraulic modelling. Water Sci. Technol. 2010, 62, 1386–1392. [Google Scholar] [CrossRef]
- Arnell, N.W.; Brown, S.; Gosling, S.N.; Gottschalk, P.; Hinkel, J.; Huntingford, C.; Lloydhughes, B.; Lowe, J.; Nicholls, R.J.; Osborn, T.J. The impacts of climate change across the globe: A multi-sectoral assessment. Clim. Chang. 2016, 134, 457–474. [Google Scholar] [CrossRef] [Green Version]
- Winsemius, H.; Jongman, B.; Veldkamp, T.; Bangalore, M.; Ward, P.J. Disaster risk, climate change, and poverty: Assessing the global exposure of poor people to floods and droughts. Policy Res. Work. Pap. Ser. 2015, 16, 17–52. [Google Scholar]
- Schulz, K.; Bernhardt, M. The end of trend estimation for extreme floods under climate change. Hydrol. Process. 2016, 30, 1804–1808. [Google Scholar] [CrossRef]
- Jun, X.; Chunzhen, L.; Zhiyu, L.; Yong, L. Impact of climate change and adaptive strategy on terrestrial water cycle and water resources in East Monsoon Area of China. Chin. J. Nat. 2016, 38, 167–176. [Google Scholar]
- Jianyun, Z.; Yintang, W.; Cuishan, L.; Ruimin, H. Discussion on the standards of urban flood and waterlogging prevention in China. J. Hydroelectr. Eng. 2017, 36, 1–6. [Google Scholar]
- Butler, D.; Davies, J. (Eds.) Urban Drainage; Spon Press: London, UK, 2011; Volume 165, p. 60. [Google Scholar]
- Leitāo, J.; Almeida, M.d.C.; Simōes, N.E.; Martins, A. Methodology for qualitative urban flooding risk assessment. Water Sci. Technol. 2013, 68, 829–838. [Google Scholar] [CrossRef]
- Qianqian, Z. A Review of Sustainable Urban Drainage Systems Considering the Climate Change and Urbanization Impacts. Water 2014, 6, 976–992. [Google Scholar]
- Despotovic, J.; Plavsic, J.; Stefanovic, N.; Pavlovic, D. Inefficiency of storm water inlets as a source of urban floods. Water Sci. Technol. 2005, 51, 139. [Google Scholar] [CrossRef] [PubMed]
- Lee, S.; Nakagawa, H.; Kawaike, K.; Zhang, H. Study on inlet discharge coefficient through the differnt shapes of storm drains for urban inundation analysis. J. Jpn. Soc. Civ. Eng. 2012, 68, I_31–I_36. [Google Scholar]
- Leandro, J.; Lopes, P.; Carvalho, R.; Páscoa, P.; Martins, R.; Romagnoli, M. Numerical and experimental characterization of the 2D vertical average-velocity plane at the center-profile and qualitative air entrainment inside a gully for drainage and reverse flow. Comput. Fluids 2014, 102, 52–61. [Google Scholar] [CrossRef]
- Lopes, P.; Leandro, J.; Carvalho, R.F.; Páscoa, P.; Martins, R. Numerical and experimental investigation of a gully under surcharge conditions. Urban Water J. 2015, 12, 468–476. [Google Scholar] [CrossRef]
- Martins, R.; Leandro, J.; De Carvalho, R.F. Characterization of the hydraulic performance of a gully under drainage conditions. Water Sci. Technol. 2014, 69, 2423–2430. [Google Scholar] [CrossRef] [PubMed]
- Rubinato, M.; Martins, R.; Kesserwani, G.; Leandro, J.; Djordjevic, S.; Shucksmith, J. Experimental calibration and validation of sewer/surface flow exchange equations in steady and unsteady flow conditions. J. Hydrol. 2017, 552, 421–432. [Google Scholar] [CrossRef]
- Fraga, I.; Cea, L.; Puertas, J. Validation of a 1D-2D dual drainage model under unsteady part-full and surcharged sewer conditions. Urban Water J. 2015, 14, 74–84. [Google Scholar] [CrossRef]
- Russo, B.; Gómez, M. Methodology to estimate hydraulic efficiency of drain inlets. Water Manag. 2011, 164, 81–90. [Google Scholar]
- Liang, Z.; Lu, Y.U.; Xin-Xin, R.; Xiang, S. Construction Strategy of Sponge City Based on Historical Waterlogging Survey in Shenzhen. China Water Wastewater 2015, 31, 120–124. [Google Scholar]
- Veldhuis, J.A.E.; Clemens, F.; Van Gelder, P.H.A.J.M. Quantitative fault tree analysis for urban water infrastructure flooding. Struct. Infrastruct. Eng. 2011, 7, 809–821. [Google Scholar] [CrossRef]
- Young, G.K.; Stein, J. Hydraulic Design of Drainage for Highways. In Hydraulic Division Center Handbook; McGraw-Hill: Denver, CO, USA, 2000. [Google Scholar]
- Artina, S.; Calenda, G.; Calomino, F. Sistemi di fognature, manuale di progettazione. In Hoepi Editore; HOEPLI: Milan, Italy, 2001. [Google Scholar]
- Guo, J.C.Y. Design of Street Curb Opening Inlets Using a Decay-Based Clogging Factor. J. Hydraul. Eng. 2006, 132, 1237–1241. [Google Scholar] [CrossRef] [Green Version]
- Almedeij, J.; Alsulaili, A.; Alhomoud, J. Assessment of grate sag inlets in a residential area based on return period and clogging factor. J. Environ. Manag. 2006, 79, 38–42. [Google Scholar] [CrossRef] [PubMed]
- Gómez, M.; Joan, P.; Beniamino, R.; Eduardo, M.-G. Methodology to quantify clogging coefficients for grated inlets. Application to SANT MARTI catchment (Barcelona). J. Flood Risk Manag. 2019, 12, e12479-1. [Google Scholar] [CrossRef] [Green Version]
- Miahr, H.C.; Aoki, S.I.; Maruyama, M. Unsteady Two-Dimensional Orifice Flow: A Large-Size Experimental Investigation. J. Hydraul. Res. 2002, 40, 63–71. [Google Scholar]
Figure 1.
Experimental flume setup. (a) Overall view of the flume; (b) Side view of the flume; (c) Plan view of the flume; (d) Size of the experimental flume.
Figure 1.
Experimental flume setup. (a) Overall view of the flume; (b) Side view of the flume; (c) Plan view of the flume; (d) Size of the experimental flume.

Figure 2.
Inlet structure under different clogging conditions.

Figure 3.
Flow state under different conditions. (a,b) are weir flow patterns of inlet with few and more water in rainwater well, respectively; (c) orifice flow pattern of inlet.
Figure 3.
Flow state under different conditions. (a,b) are weir flow patterns of inlet with few and more water in rainwater well, respectively; (c) orifice flow pattern of inlet.

Figure 4.
(a) Relationships between incoming water depth and inlet discharge capacity under different clogging conditions; (b) Relationships between upstream discharge and inlet discharge capacity under different clogging conditions.
Figure 4.
(a) Relationships between incoming water depth and inlet discharge capacity under different clogging conditions; (b) Relationships between upstream discharge and inlet discharge capacity under different clogging conditions.

Figure 5.
Sketch of inlet flow state. (a,b) are weir pattern and orifice pattern of inlet, respectively.
Figure 5.
Sketch of inlet flow state. (a,b) are weir pattern and orifice pattern of inlet, respectively.

Figure 6.
Comparison of the inlet discharge capacity under different clogging conditions.


Table 1.
Ratio between real scale and experimental scale.
| Index | Ratio |
|---|---|
| Length | 1/3 |
| Velocity | 1/1.732 |
| Discharge | 1/15.588 |
| Roughness coefficient | 1/1.201 |
Table 2.
Incoming critical state water depth under different clogging conditions.
| Clogging Conditions | Clogging Extent | Direction to Flow |
|---|---|---|
| No clogging | 0 | / |
| Clogging quarter | 0.25 | / |
| Clogging right-half | 0.5 | Parallel |
| Clogging away-half | 0.5 | Not parallel |
Table 3.
Incoming critical state water depth under different clogging conditions.
| Clogging Conditions | Clogging Extent | Direction to Flow | Incoming Water Depth (m) |
|---|---|---|---|
| No clogging | 0 | / | 0.053 |
| Clogging quarter | 0.25 | / | 0.065 |
| Clogging right-half | 0.5 | Parallel | 0.070 |
| Clogging away-half | 0.5 | Not parallel | 0.072 |
Table 4.
Discharge coefficients of weir and orifice flow under different clogging extents of inlet.
| Clogging Conditions | Clogging Extent | Direction to Flow | Cw | Co |
|---|---|---|---|---|
| No clogging | 0 | / | 0.051 | 1.262 |
| Clogging quarter | 0.25 | / | 0.049 | 0.922 |
| Clogging right-half | 0.5 | Parallel | 0.048 | 0.770 |
| Clogging away-half | 0.5 | Not parallel | 0.045 | 0.695 |
Table 5.
Incoming critical state water depth under different clogging conditions.
| Clogging Conditions | Clogging Extent | Direction to Flow | H/b in This Study | H/b by Chanson |
|---|---|---|---|---|
| No clogging | 0 | / | 0.356 | 0.43–0.51 |
| Clogging quarter | 0.25 | / | 0.433 | |
| Clogging right-half | 0.5 | Parallel | 0.473 | |
| Clogging away-half | 0.5 | Not parallel | 0.580 |
Publisher’s Note: MDPI stays neutral with regard to jurisdictional claims in published maps and institutional affiliations. |
© 2021 by the authors. Licensee MDPI, Basel, Switzerland. This article is an open access article distributed under the terms and conditions of the Creative Commons Attribution (CC BY) license (http://creativecommons.org/licenses/by/4.0/).
Share and Cite
MDPI and ACS Style
Hao, X.; Mu, J.; Shi, H. Experimental Study on the Inlet Discharge Capacity under Different Clogging Conditions. Water 2021, 13, 826. https://doi.org/10.3390/w13060826
AMA Style
Hao X, Mu J, Shi H. Experimental Study on the Inlet Discharge Capacity under Different Clogging Conditions. Water. 2021; 13(6):826. https://doi.org/10.3390/w13060826
Chicago/Turabian StyleHao, Xiaoli, Jie Mu, and Hongjian Shi. 2021. "Experimental Study on the Inlet Discharge Capacity under Different Clogging Conditions" Water 13, no. 6: 826. https://doi.org/10.3390/w13060826
Note that from the first issue of 2016, this journal uses article numbers instead of page numbers. See further details here.