
Effect of a Submerged Vane-Field on the Flow Pattern of a Movable Bed Channel with a 90° Lateral Diversion

1
Civil Engineering Research and Innovation for Sustainability (CERIS), Instituto Superior Técnico, Universidade de Lisboa, 1049-001 Lisbon, Portugal
2
Hydraulics and Environment Department, Laboratório Nacional de Engenharia Civil (LNEC), 1700-066 Lisbon, Portugal
3
Civil Engineering Department, İzmir Katip Çelebi University, 33/2, İzmir 35620, Turkey
*
Author to whom correspondence should be addressed.
Water 2021, 13(6), 828; https://doi.org/10.3390/w13060828
Submission received: 22 January 2021
/
Revised: 2 March 2021
/
Accepted: 14 March 2021
/
Published: 18 March 2021
(This article belongs to the Section Hydraulics and Hydrodynamics)
Abstract
:This laboratory study focused on the effect of a submerged vane-field on the flow pattern and bed morphology near and inside the entrance reach of a movable bed 90° lateral diversion. The system was modelled under live bed conditions for a water discharge ratio of ≈0.2. Two experiments were run until bed equilibrium was reached: with and without a vane-field installed close to the diversion entrance to control the transfer of sediments into the diversion channel. The equilibrium bed morphology and the associated 3D flow field were measured in great detail. The bed load diverted into the diversion was reduced by approximately one quarter due to the action of the vane-field. The vanes prevented the formation of the diversion vortex in the main channel, upstream of the diversion’s entrance, thus contributing to that decrease. They also created a main channel vortex that started at the most upstream vanes and further decreased the amount of bed load entering the diversion. The flow separation zone inside the diversion was larger with vanes, but conveyance was balanced through a slightly deeper scour trench therein. The flow structures described were confirmed through the measurements of the turbulent kinetic energy.
1. Introduction
Lateral diversions in natural and man-made movable bed channels influence and reflect the division of water and sediment in bifurcating channels. In nature, bifurcations occur, for example, in braided rivers and deltas Bertoldi et al. [1]. Examples of man-made lateral diversions include (see, among others, Nakato et al. [2], Sruthi et al. [3], Wang et al. [4]) the entrance to a secondary channel (i) used as a by-pass for flood alleviation, (ii) integrated into a navigation or irrigation project, or (iii) connected to a settling basin designed to reduce the sediment load passing to a water system. Therefore, depending on the objective of the man-made lateral diversion, it is frequently necessary to control the sediment entrainment into the side channel, which can be difficult to achieve.
A potential technique for such control consists of placing a submerged vane-field in front of the lateral diversion (Odgaard and Spoljaric [5], Wang et al. [4] and Barkdoll et al. [6]). According to these authors, vanes are panels installed vertically on the riverbed to modify the flow pattern. They can influence the sediment distribution in the bifurcation by creating a secondary circulation. According to Barkdoll et al. [6], the streamwise velocity combined with the secondary circulation created by the vanes lead to the formation of a tip vortex downstream from the vanes similar to that of an airplane wing. This helical motion causes transverse shear stresses on the channel bed, transporting the sediments in a direction transverse to the flow direction.
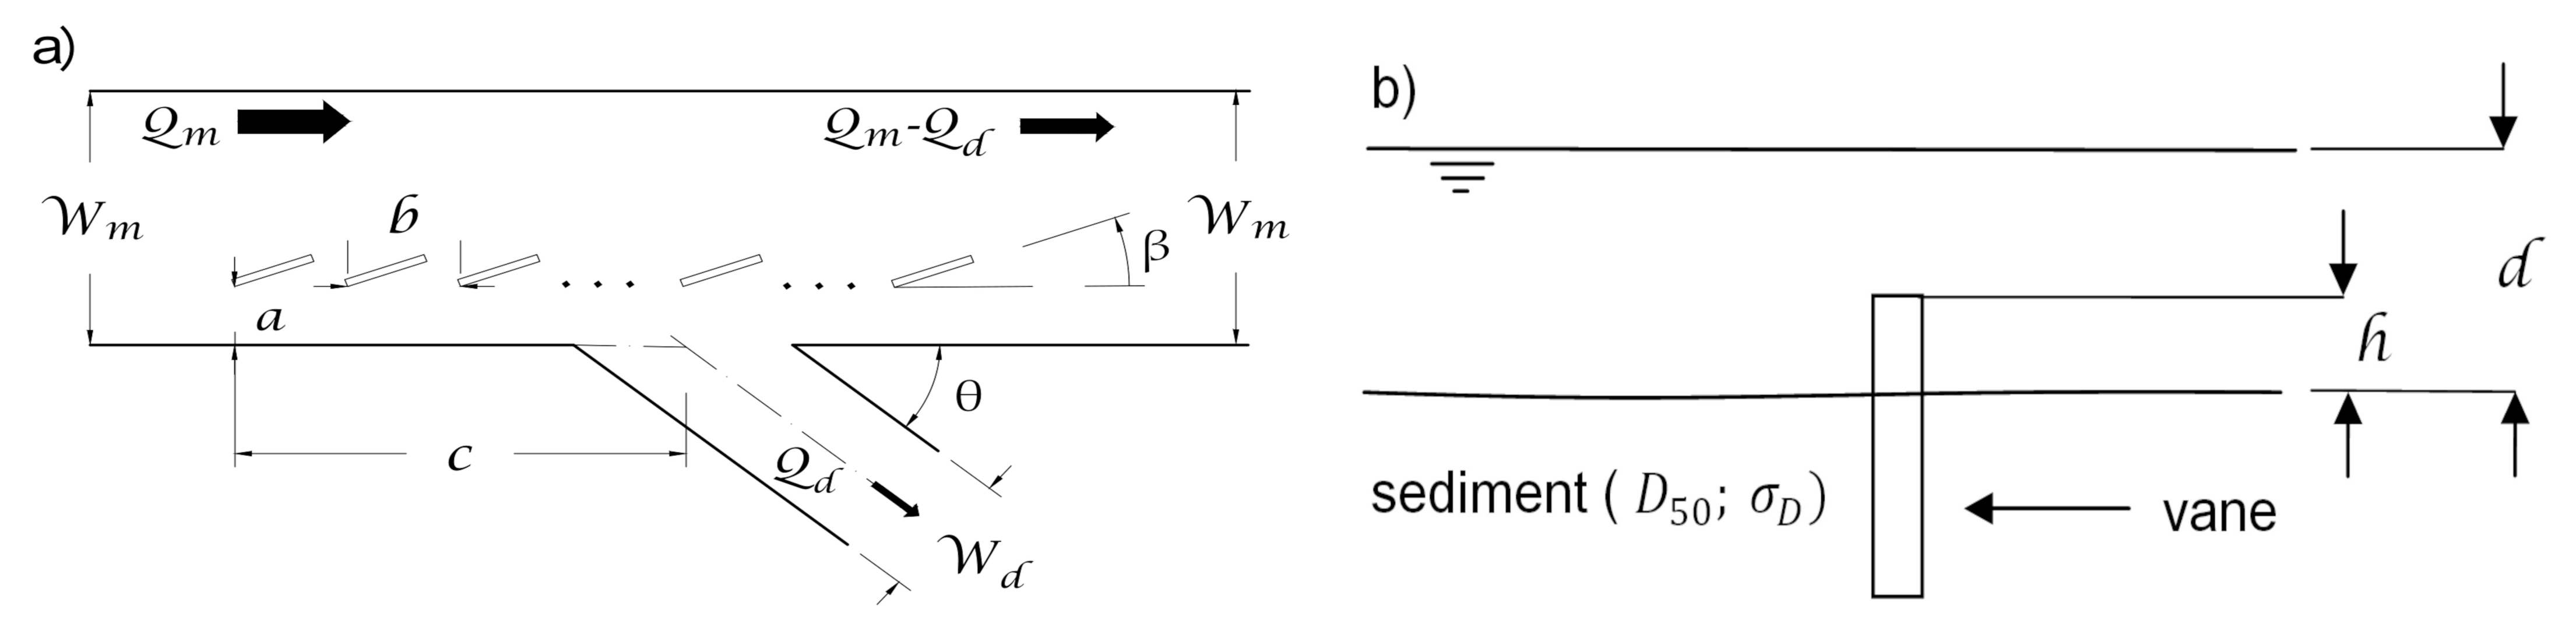
Vane-fields were first investigated by Odgaard and Kennedy [7], in 1983, to protect the outer bank of curved channels. Since then, vane-fields have been shown to potentially reduce the entrainment of bed sediments from alluvial channels into diversions (Barkdoll et al. [6]). Many variables influence the vanes’ desilting performance. For rough subcritical flows, a given geometry of the diverging channels and a given configuration of the diversion entrance, those variables include (Figure 1) the diversion discharge ratio (Barkdoll et al. [6]; Herrero et al. [8]), , where is the diversion discharge and is the discharge in the main channel upstream, the diversion angle (Alomari et al. [9]), (angle between the banks forming the downstream diversion corner), the channels’ width ratio (Alomari et al. [9]), , being the width of the diversion channel and standing for the upstream main channel width and, according to Wang et al. [4], the properties of the bed sediments (the median diameter, , and the gradation coefficient, ), and the number of vanes, their alignment and disposal ( and b), longitudinal and transverse location relative to the lateral diversion (c and a, respectively) and height above the bed, h, relative to the water depth, d.
Research studies on lateral diversions cover both fixed and movable bed channels. For the former, the reader is referred to the studies of Karami et al. [10] and Sarhadi and Jabbari [11] for detailed information on the effect of a vane-field on the flow structure close to the fixed bed diversion entrance. In the case of movable bed channels, only a few real size field studies on lateral water intakes equipped with a vane-field are mentioned in the literature, for example, those of Michell et al. [12] or Nakato et al. [13]. There are, however, an important number of laboratory and numerical studies on idealized movable bed diversions which will be detailed below. These studies address three topics: (i) the morphodynamics of diversions in the absence of vane-fields (uncontrolled diversions); (ii) the design of vane-fields to control the flux of sediments into diversion channels; (iii) the detailed flow field at diversions either uncontrolled or controlled by vane-fields.
Barkdoll et al. [6] covered all three topics. These authors and Herrero et al. [8] addressed the effect of the discharge ratio, , on the sediment transport into uncontrolled diversions. Both studies considered rectangular channels with a diversion angle = 90°. The diversion channel of Barkdoll et al. [6] depicted a fixed bed, leveled with the initial sand bed of the main channel. These authors found that the amount of sediment entering the diversion increased with the unit discharge ratio, ( being the unit discharge in the diversion and the unit discharge in the main channel), until = 0.9, when it decreased for higher values of . They also observed the formation of a separation zone attached to the inner wall of the diversion and concluded that the amount of sand deposited in the separation zone, at the diversion entrance, decreased with , for , as the size of that zone decreased too. Additionally, the scour trench became deeper along the inner wall of the main channel downstream, due to the local increase of the flow velocity associated with higher values of . Herrero et al. [8] studied a diversion where both channel beds were movable and was equal to 1.0. They found that, for , the equilibrium bed of the diversion zone was characterized by a deep and elongated scour trench. This trench occurred in the main channel along the inner wall, immediately downstream of the downstream diversion corner. For , they also found that the majority of the sediments coming from upstream moved into the diversion. Contrastingly, for , the diverging channels were characterized by a more uniform bed morphology between upstream and downstream of the diversion and by a higher proportion of the sediment discharge continuing in the main channel. Alomari et al. [9] also worked on the first topic, i.e., the morphodynamics of uncontrolled diversions. They studied the effects of the angle of diversion, , as well as of the channels’ width ratio, , on the depth of the scour trench observed in the main channel. These authors concluded that the scour depth increased with the diversion angle and that, for a given diversion angle, it also increased with the width ratio due to the inherent increase of the discharge ratio.
According to Odgaard and Wang [14], in most straight and curved channels the vane-fields perform better for vane heights from 0.2 to 0.4 times the flow depth and vane lengths equal to 2 to 3 times the vane height. These results have been used so far in the design of vane-fields in front of diversions (Barkdoll et al. [6]; Karami et al. [10], Sruthi et al. [3], and Nakato et al. [13]. The capacity of vane-fields to control the sediment entry into a lateral diversion (second topic) was also assessed by Barkdoll et al. [6]. The authors observed that a two row vane-field prevented the entrance of sediments into the diversion for values of smaller than ≈0.2 and concluded that a third row would not improve the desilting performance. For values of greater than ≈0.2, the vane-field was less effective and did not eliminate the flux of sediments into the diversion due to the development of vortices that re-suspends sediments prone to be transported. Firozjaei et al. [15] simulated numerically the flow field and solved the advection-diffusion equation in a diversion comprising two rectangular channels forming an angle of diversion = 45°. They [15] observed that the installation of a vane near the entrance of the diversion increased the amount of sediment deposited in the diversion zone as compared with the case with no vanes. They also concluded that the vane-field led to more water and fewer sediments moving into the diversion. Further studies on the design of vane-fields were made by Sruthi et al. [3], who investigated the effects of vane alignment and the number of vane rows on the amount of sediments diverted into a = 45° diversion channel. The best desilting performance was achieved (Sruthi et al. [3]) for a vane-field formed by two rows of vanes with a spacing between the vanes of approximately half of the diversion’s width (), installed at a skew angle of = 15°, the skew angle being the smaller angle between the alignments of the main channel and the vanes (Figure 1).
The third topic—detailed flow field at diversions—was addressed by Barkdoll et al. [6], Herrero et al. [8], Firozjaei et al. [15] and Moghadam et al. [16] among others. Firozjaei et al. [15] concluded that the installation of a single vane directed most of the main channel flow into the diversion. For this configuration (single vane), a circulation cell between the inner wall of the main channel and the vane was identified by Firozjaei et al. [15]. Barkdoll et al. [6] stated that the presence of vanes moved the dividing stream surface (starting upstream of the diversion and joining the downstream diversion corner) to near the diversion channel and, thus, decreasing the near-bed flow entering the diversion. Moreover, Herrero et al. [8] identified three vortical structures acting in the diversion zone: one horizontal vortex (hereafter, named the diversion vortex) acting across part of the main channel and along the diversion outer wall, one horizontal vortex acting along the inner wall of the main channel downstream of the diversion (the main channel vortex), one intermittent vertical-axis vortex system formed around the central part of the scour trench developing around the downstream diversion corner. Moghadam et al. [16] studied the influence of the discharge ratio, , the vanes’ alignment, , and the vanes arrangement (parallel or zigzagging) on the transverse Reynolds stresses inside the diversion and near the bed of a = 55° diversion. These authors found that the transverse bed shear stress at the diversion’s entrance was much smaller in the presence of a vane-field than with no vanes in accordance with, for example, Barkdoll et al. [6] and others. If the distance of the vane-field to the diversion entrance was larger than 1.6 times the diversion width, the bed shear stress values for the with and without vanes cases tended to be closer.
To the authors’ best knowledge, (i) most of the studies with vane-fields at diversions with movable bed were performed under live-bed flow conditions, (ii) these studies were dedicated mainly to evaluating the impact of vane-fields on the budget of sediments moving through the diversion channel and only a few (Barkdoll et al. [6] and Firozjaei et al. [15]) included an overall description of the flow field near the diversion entrance and around the vane-field. Therefore, we decided to carry out this study on the detailed description of the 3D flow structure in a movable bed = 90° diversion, without and with a vane-field placed in front of the diversion entrance. Our specific goals were (i) the confirmation of the flow field described in the literature in the zone of the diversion, without vanes, and (ii) above all, the identification of changes of the flow field induced by the vanes, trying to relate them with possible changes of the bed morphology. The velocity field was measured at the equilibrium stage in both cases, which allowed the characterization of the bed morphology at equilibrium. The data collected and analyzed also constitutes a robust data set made available to calibrate and validate Computational Fluid Dynamics (CFD) and sediment transport codes designed to predict the flow field, the bed morphology and desilting performance of diversions with different configurations.
2. Experimental Set-up and Procedure, and Data Processing
2.1. Experimental Set-Up and Procedure
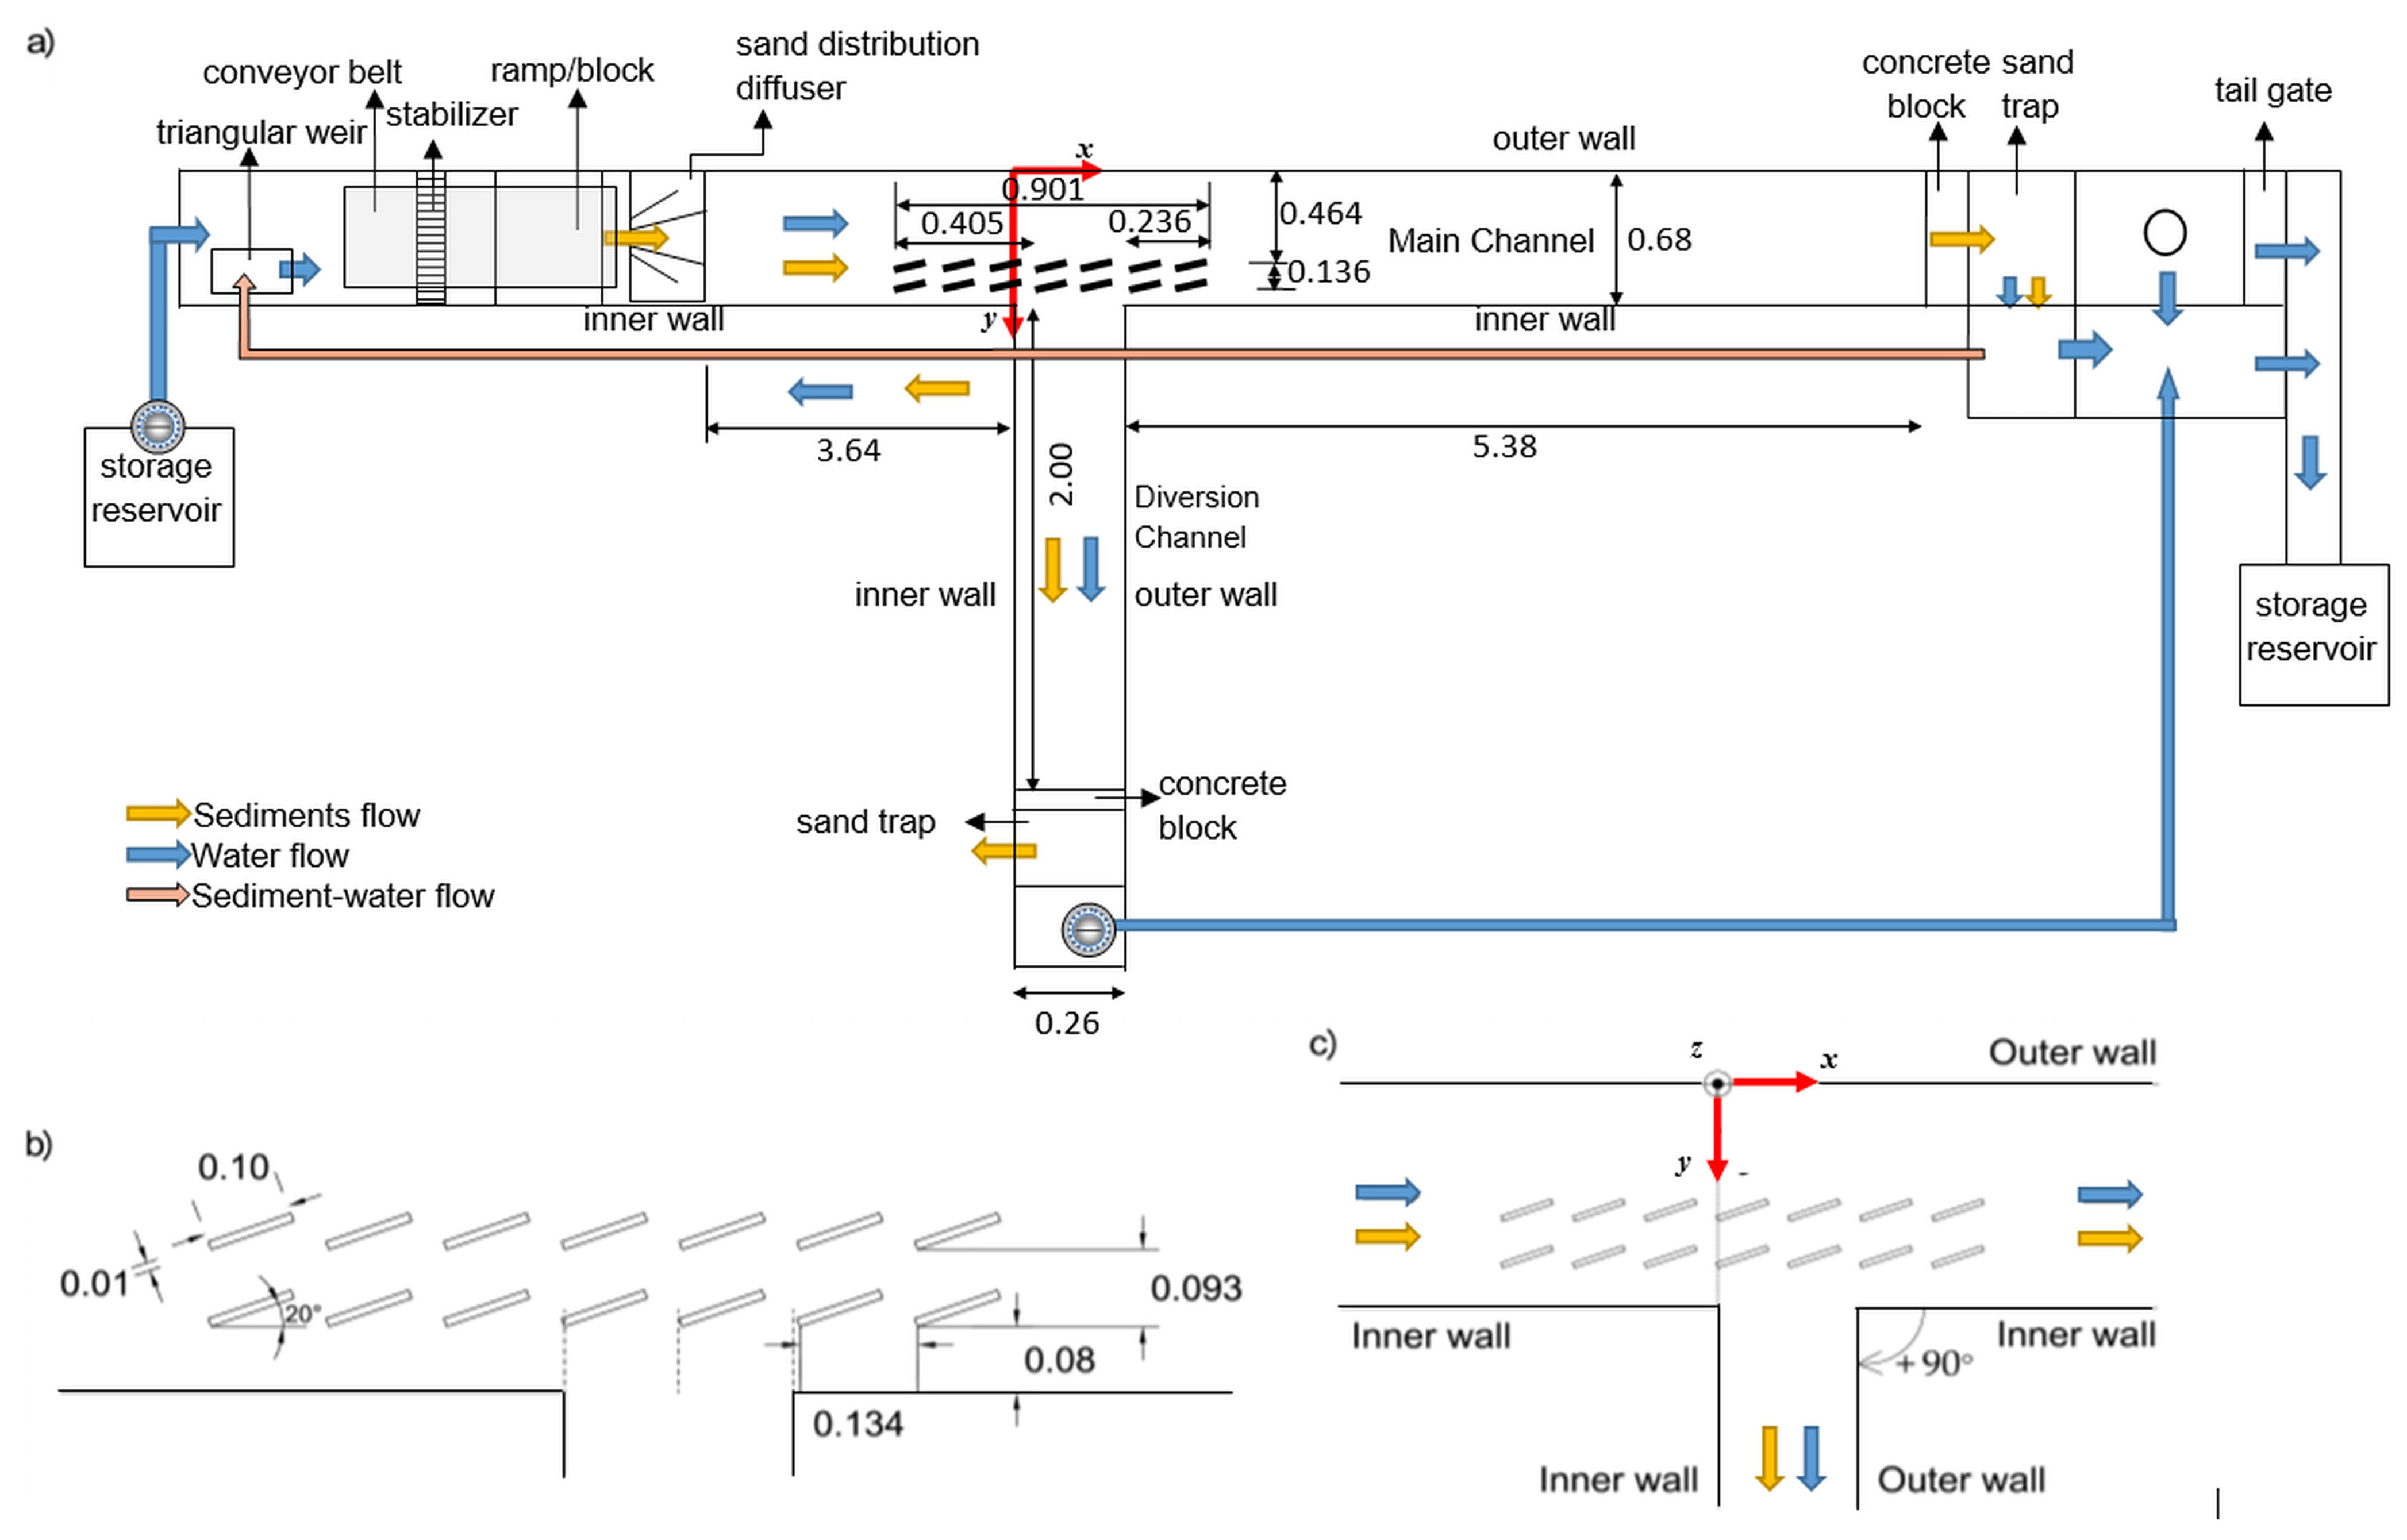
Two laboratory experiments were performed: one refers to a diversion with no vanes (hereafter, named NV) and the other one to a diversion with a vane-field in front of the entrance (named VF). Both experiments were conducted in a recirculating flume at the Hydraulics Laboratory of Instituto Superior Técnico. The experimental facility consisted of a 9.28 m long (net length), 0.68 m wide, and 0.40 m deep rectangular main channel and a 2.0 m long, 0.26 m wide, and 0.40 m deep rectangular diversion channel (see Figure 2). The diversion channel was connected to the main channel 3.64 m downstream of its entrance through a concordant bed at a diversion angle of = 90°. The outer wall and the bed of the main channel were made of smooth concrete, whereas the diversion walls and the main channel’s inner wall were made of PVC. Both channel’s beds were covered with a layer of uniform sand, slightly inclined downstream (slope 0.002). The sand mixture was characterized by a median diameter, , equal to 0.86 mm and a gradation coefficient, , equal to 1.35. In front of the diversion channel, the initial sand bed thickness was 0.170 m.
The difference between the two experiments was the existence of a vane-field in the main channel in the VF case. The vane-field was designed according to some recommendations of Odgaard and Wang [14], and taking into account the data of Barkdoll et al. [6], Karami et al. [10] and Sruthi et al. [3]. Thus, it comprised two rows aligned with the main channel. Each row was composed of seven vanes, three of which were placed upstream of the diversion entrance, two in its front and two downstream (Figure 2a). The inner row started at = 0.08 m (Figure 2b) from the main channel’s inner wall. The streamwise space between the centers of two consecutive vanes was = 0.134 m (half of the diversion width) and the transverse distance between them was 0.093 m (Figure 2b). The vanes, made of PVC, were 0.10 m long and 0.01 m thick, protruded vertically = 0.03 m into the flow column above the initial sand bed and exhibited a = 20° skew angle [6,10] (Figure 2b).
Water entering the main channel passed a flow stabilizer and moved downstream, with some of it being extracted into the diversion channel through a pump installed at its exit. The water flowing in both channels returned to a large reservoir, from where it was pumped back to the main channel. The discharge in the upstream main channel was regulated to be = 0.029 m3·s−1 and the outflow from the diversion channel was imposed to be = 0.006 m3·s−1, the discharge ratio, , being ≈0.2. The flow depth, d, along the main channel was controlled by a tailgate as 0.10 m above the sand bed. This means that the vanes protruded 30% of the flow depth into the water column, in accordance with Odgaard and Wang [14]. It could also be concluded that the approach flow in the main channel upstream of the diversion was subcritical since the Froude number, (U standing for the average flow velocity, and g for the aceleration of gravitity), was equal to 0.43, and it was also rough turbulent since the Reynolds number, ( standing for the cinematic viscosity), was equal to .
A constant-speed conveyor belt was operated upstream of the main channel to feed into the system the sand characterized above. Every 1.5 h, a total of = 23.9 kg of sand was distributed over the belt. The belt poured it into the channel through a diffuser that guaranteed its uniform distribution in the cross-section. The sand transported as bed load along the channels was captured by sand traps placed at the end of each channel; this sand was removed, drained, and weighted every 1.5 h or 3.0 h through a digital scale to the accuracy of ±0.1 kg.
During each experiment, the bed topography and the water level were frequently surveyed, in both channels, with mini-echo-sounder and ultrasonic sensor, respectively, both with an accuracy of ±0.001 m. The measuring equipment was attached to a robotic arm (Figure 3) moving on top of the channel, able to move in the three spatial directions with a placing accuracy of ±0.0001 m. The arm was controlled and the data recorded by software specifically developed for this purpose.
Each experiment was run until the equilibrium bed was reached. In accordance with Guillén-Ludeña et al. [17] and Herrero et al. [8], equilibrium was assumed to occur when the combined sand outflow from the main and diversion channels was equal to the sand inflow, within an error margin of ±10% The equilibrium stage was observed after = 12 h in the first experiment and after = 13:30 h in the second one. These durations are comparable with those on confluences tests performed in the same experimental facility by Guillén-Ludeña et al. [17] and Bombar and Cardoso [18]. Then, the flume was carefully drained after decreasing the water discharge to 0 m3·s−1. Once it was drained, the bed was covered with a thin cement layer protected with varnish. The topography was again measured using the ultrasonic sensors. Then, the flume was slowly filled again with water and the flow was reestablished. In this phase, there was no sediment feed. For the equilibrium deformed bed, 3D velocity measurements were made at more than 5000 points, distributed over more than 30 flow cross-sections, using a side-looking Acoustic Doppler Velocimeter (ADV) attached to the robotic arm (Figure 3). Velocities were measured along verticals at points separated by 0.005 m or 0.01 m, starting close to the bed. Depending on the flow depth, some profiles included only 10 points; others had over 40 points. The sampling frequency was 100 Hz and the acquisition time per point was 180 s.
2.2. Data Processing
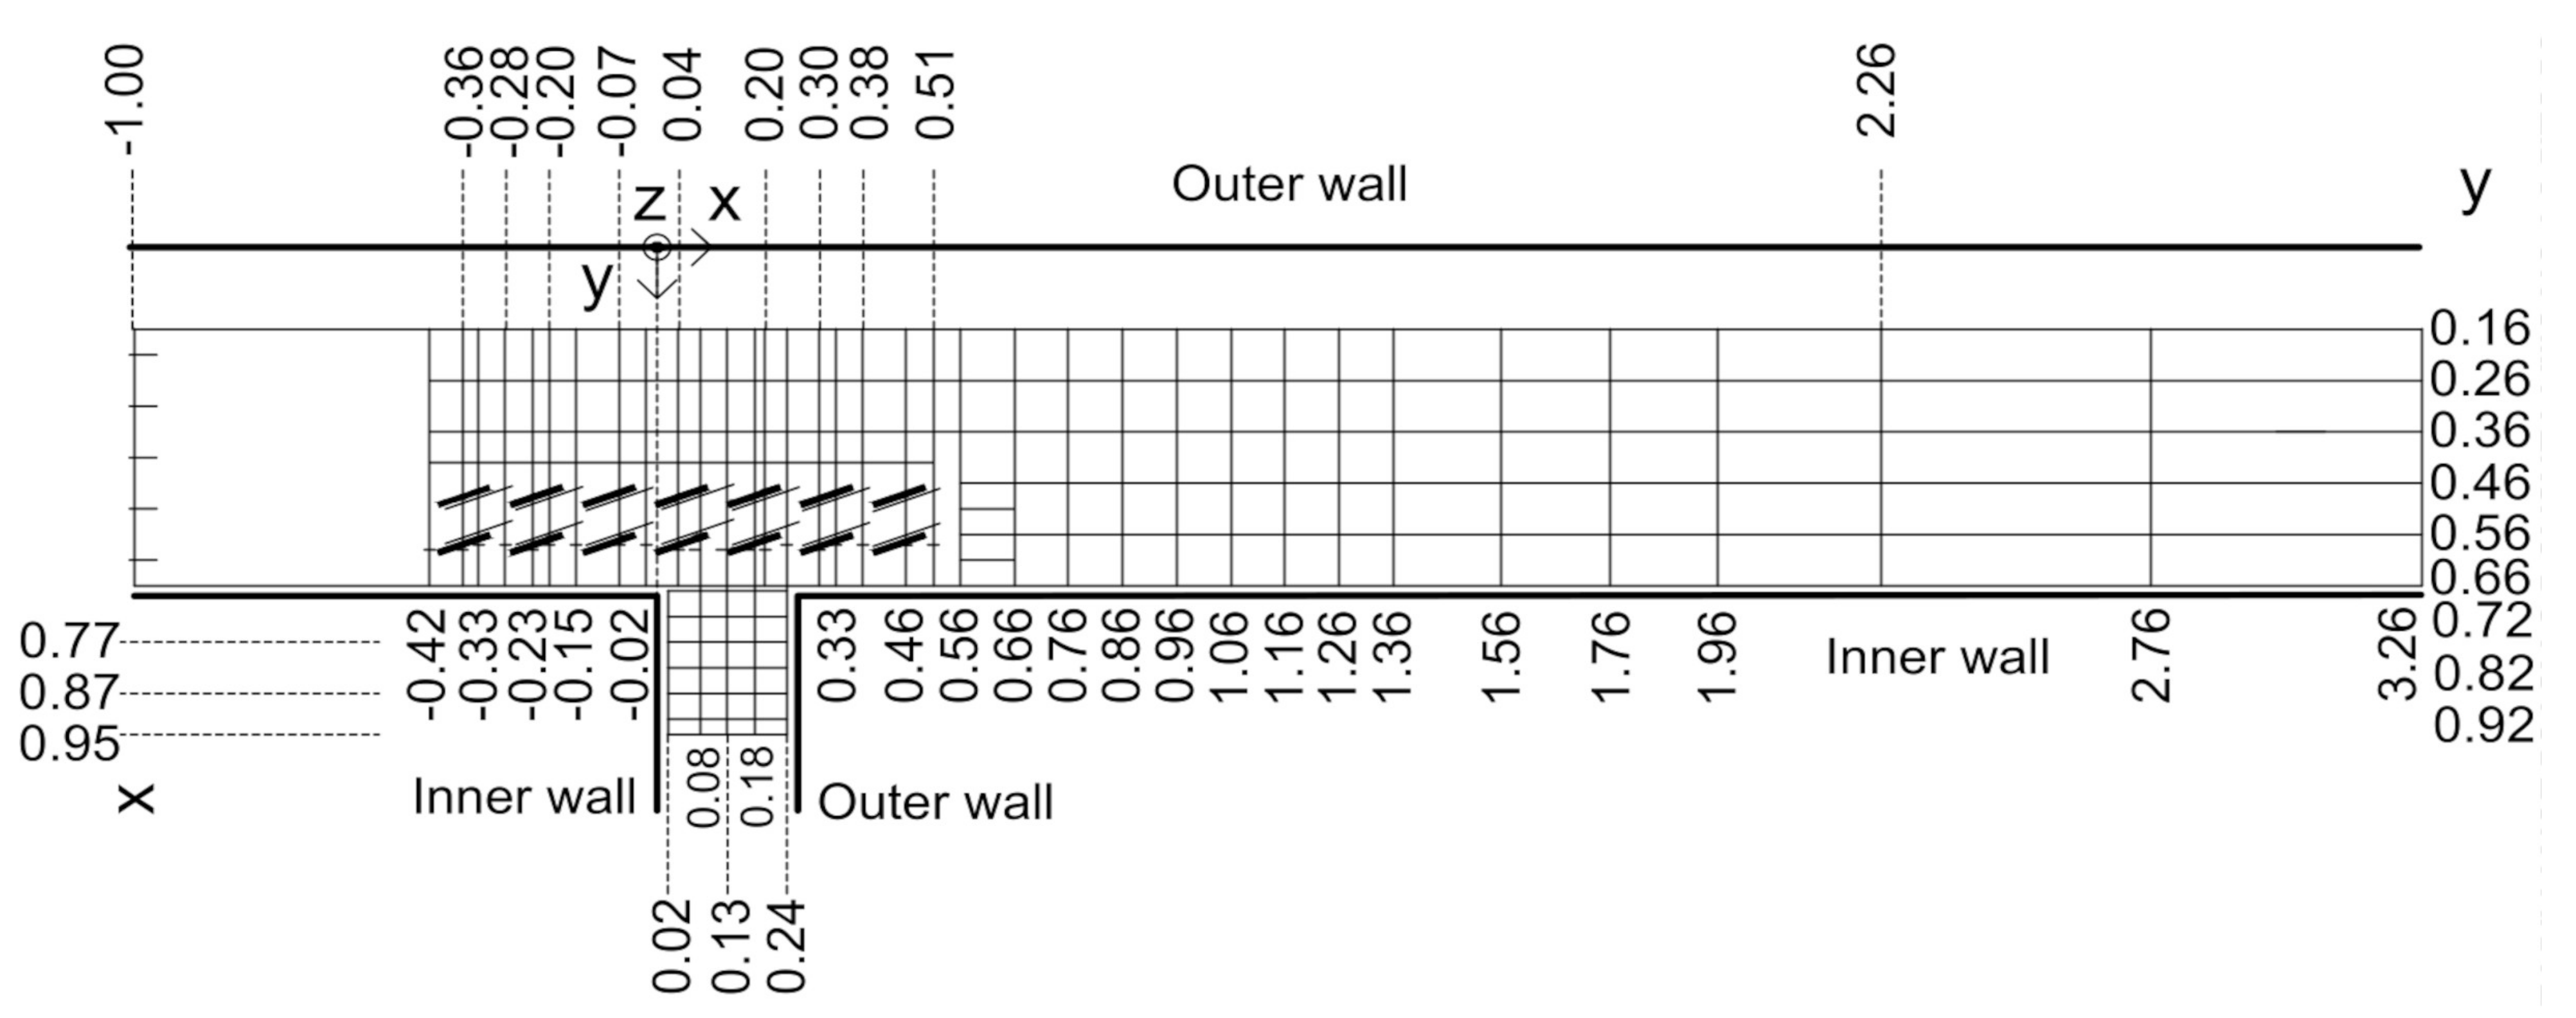
The origin of the coordinate system adopted in this study was defined at the main channel outer wall (Figure 2c and Figure 4) and the x axis was horizontal and aligned with the wall; the crosswise axis, y, was aligned with the upstream wall of the diversion. The vertical direction, z, was positive upward with its origin at 0.17 m above the main channel concrete bed.
The x and y coordinates of the verticals along which the velocities were measured for the VF experiment were defined in two ranges (Figure 4): (i) m m and 0.16 m 0.66 m in the main channel; (ii) 0.02 m 0.24 m and 0.67 m 0.95 m in the diversion. The x values in ≈[−0.40, 0.40] in the NV case differed at most 0.03 m from the values in the VF case.
In the preliminary analysis of the data, points with average correlation below 70% or Signal-to-Noise Ratio (SNR) below 15 dB (Chanson [19]) were discarded; in some records obtained close to the water surface, only the correlation of the vertical velocity component was below 70% and therefore only that component was discarded from the point records. The velocity data was then “despiked” using the implemented phase-space thresholding technique (Goring and Nikora [20]).
Since velocities were measured at each point for 180 s with a sampling frequency of 100 Hz, every record included 18,000 values per point of each velocity component. Taking the average of these values, the time average velocities in the x, y, and z directions, respectively, u, v, and w, were obtained. The u, v and w values were used to represent the flow field in figures through color plots and vector arrows indicating the magnitude and direction of the average velocities . In some figures, the water level (W. L.), the bed level (B. L.), and the vanes are also represented. It should be noted that u and v become, respectively, the crosswise and the streamwise velocities inside the diversion channel.
The time-averaged structure of the turbulent flow was further analyzed through the characterization of the turbulent kinetic energy per unit fluid mass, k (m2·s−2), obtained as
where , and are the Reynolds decompositions of the instantaneous velocities , and , and , and are their fluctuating components relative to the averaged velocities u, v and w, respectively. At each point, the averaged fluctuations products are given as
where = 18,000 is the number of values of each velocity component record and refers to the j-value of the velocity component record.
To evaluate the flow deflection near the diversion entrance, the flow angle defined as
where , , was also calculated, for both experiments (see Figure 1 for positive angles).
3. Results and Discussion
3.1. Bed Morphology
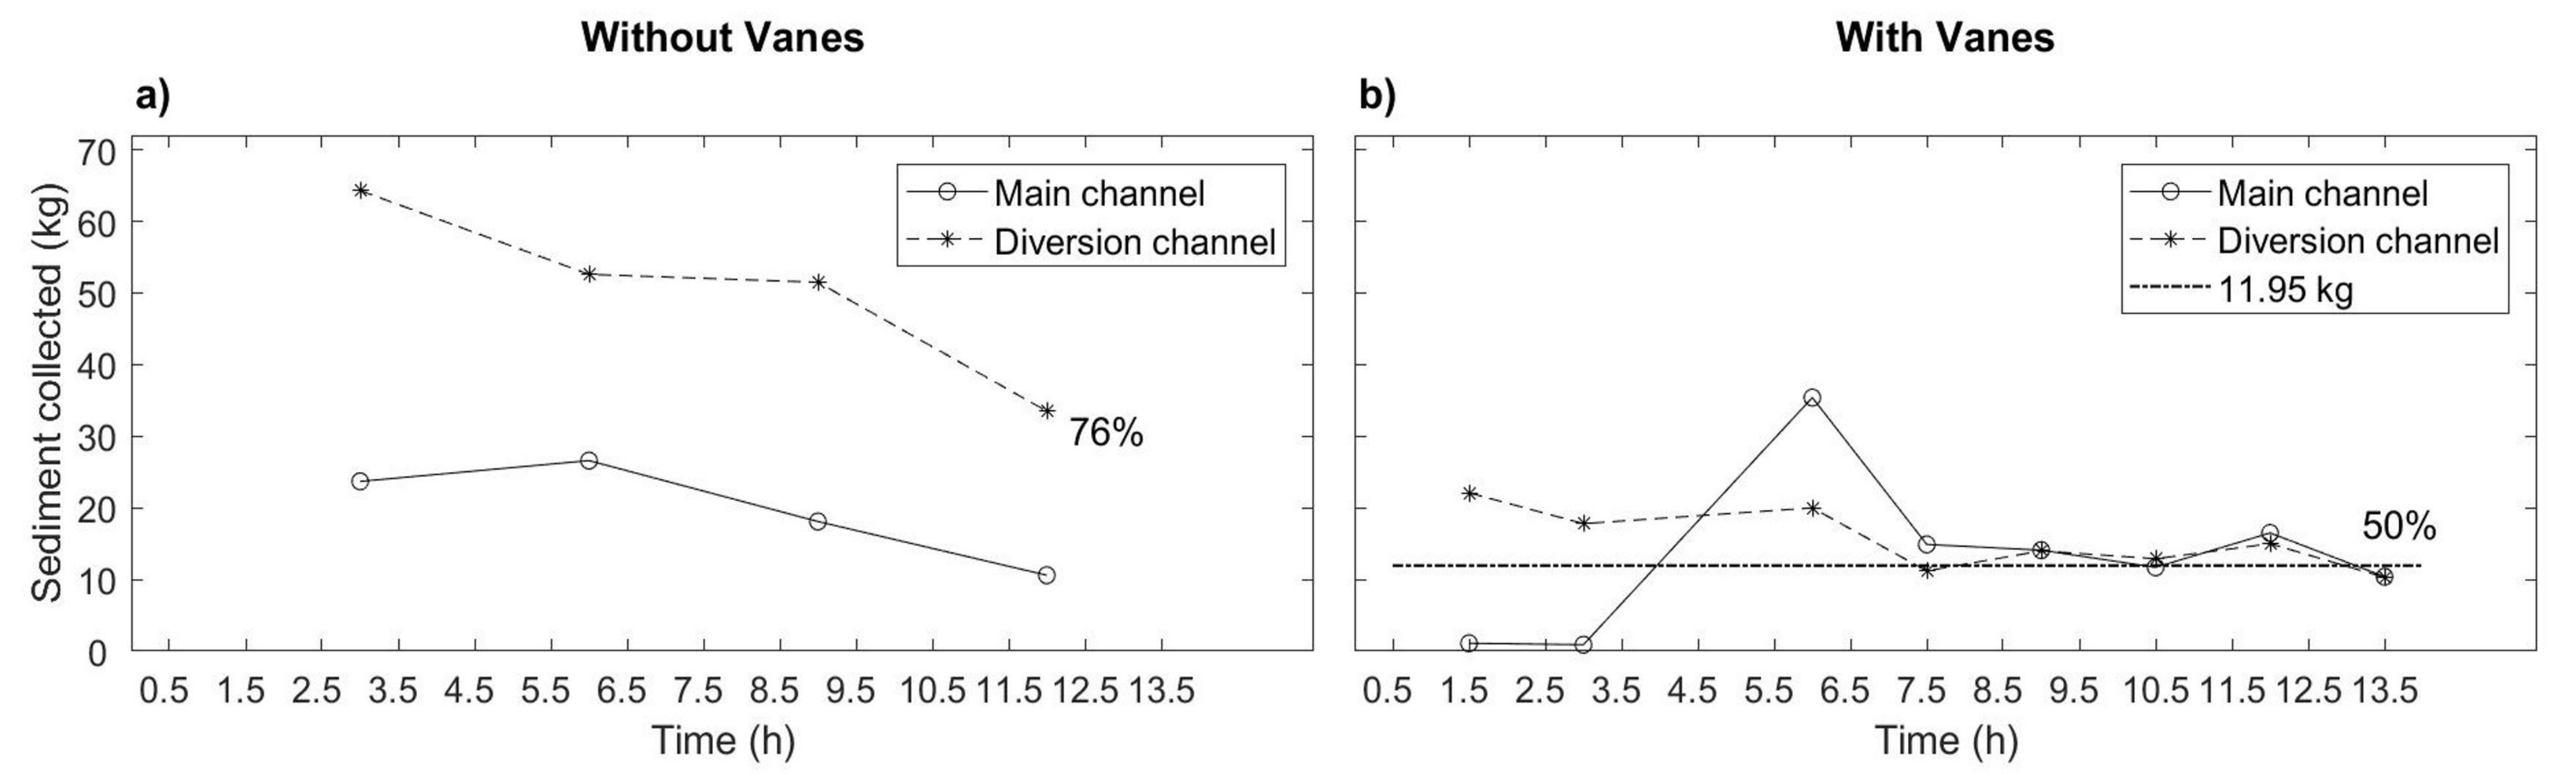
It became clear that, for NV, at equilibrium the major part of the sediment (76%) moved along the diversion (Figure 5a), i.e., at = 12 h. This result, corresponding to , contrasts with the findings of Herrero et al. [8], who reported a larger amount of sediment from the main channel than from the diversion as soon as . More importantly, the presence of vanes altered this behavior since both quantities became approximately equal, after 9 h, until equilibrium was reached at = 13:30 h (Figure 5b). Therefore, the presence of vanes caused a reduction of ≈26% in the amount of sand entering the diversion channel.
No clear bedforms were observed in the sand bed at equilibrium (Figure 6). This result was expected as the flow intensity, (where the subscript c refers to the threshold condition for initiation of motion), was only slightly above 1.0.
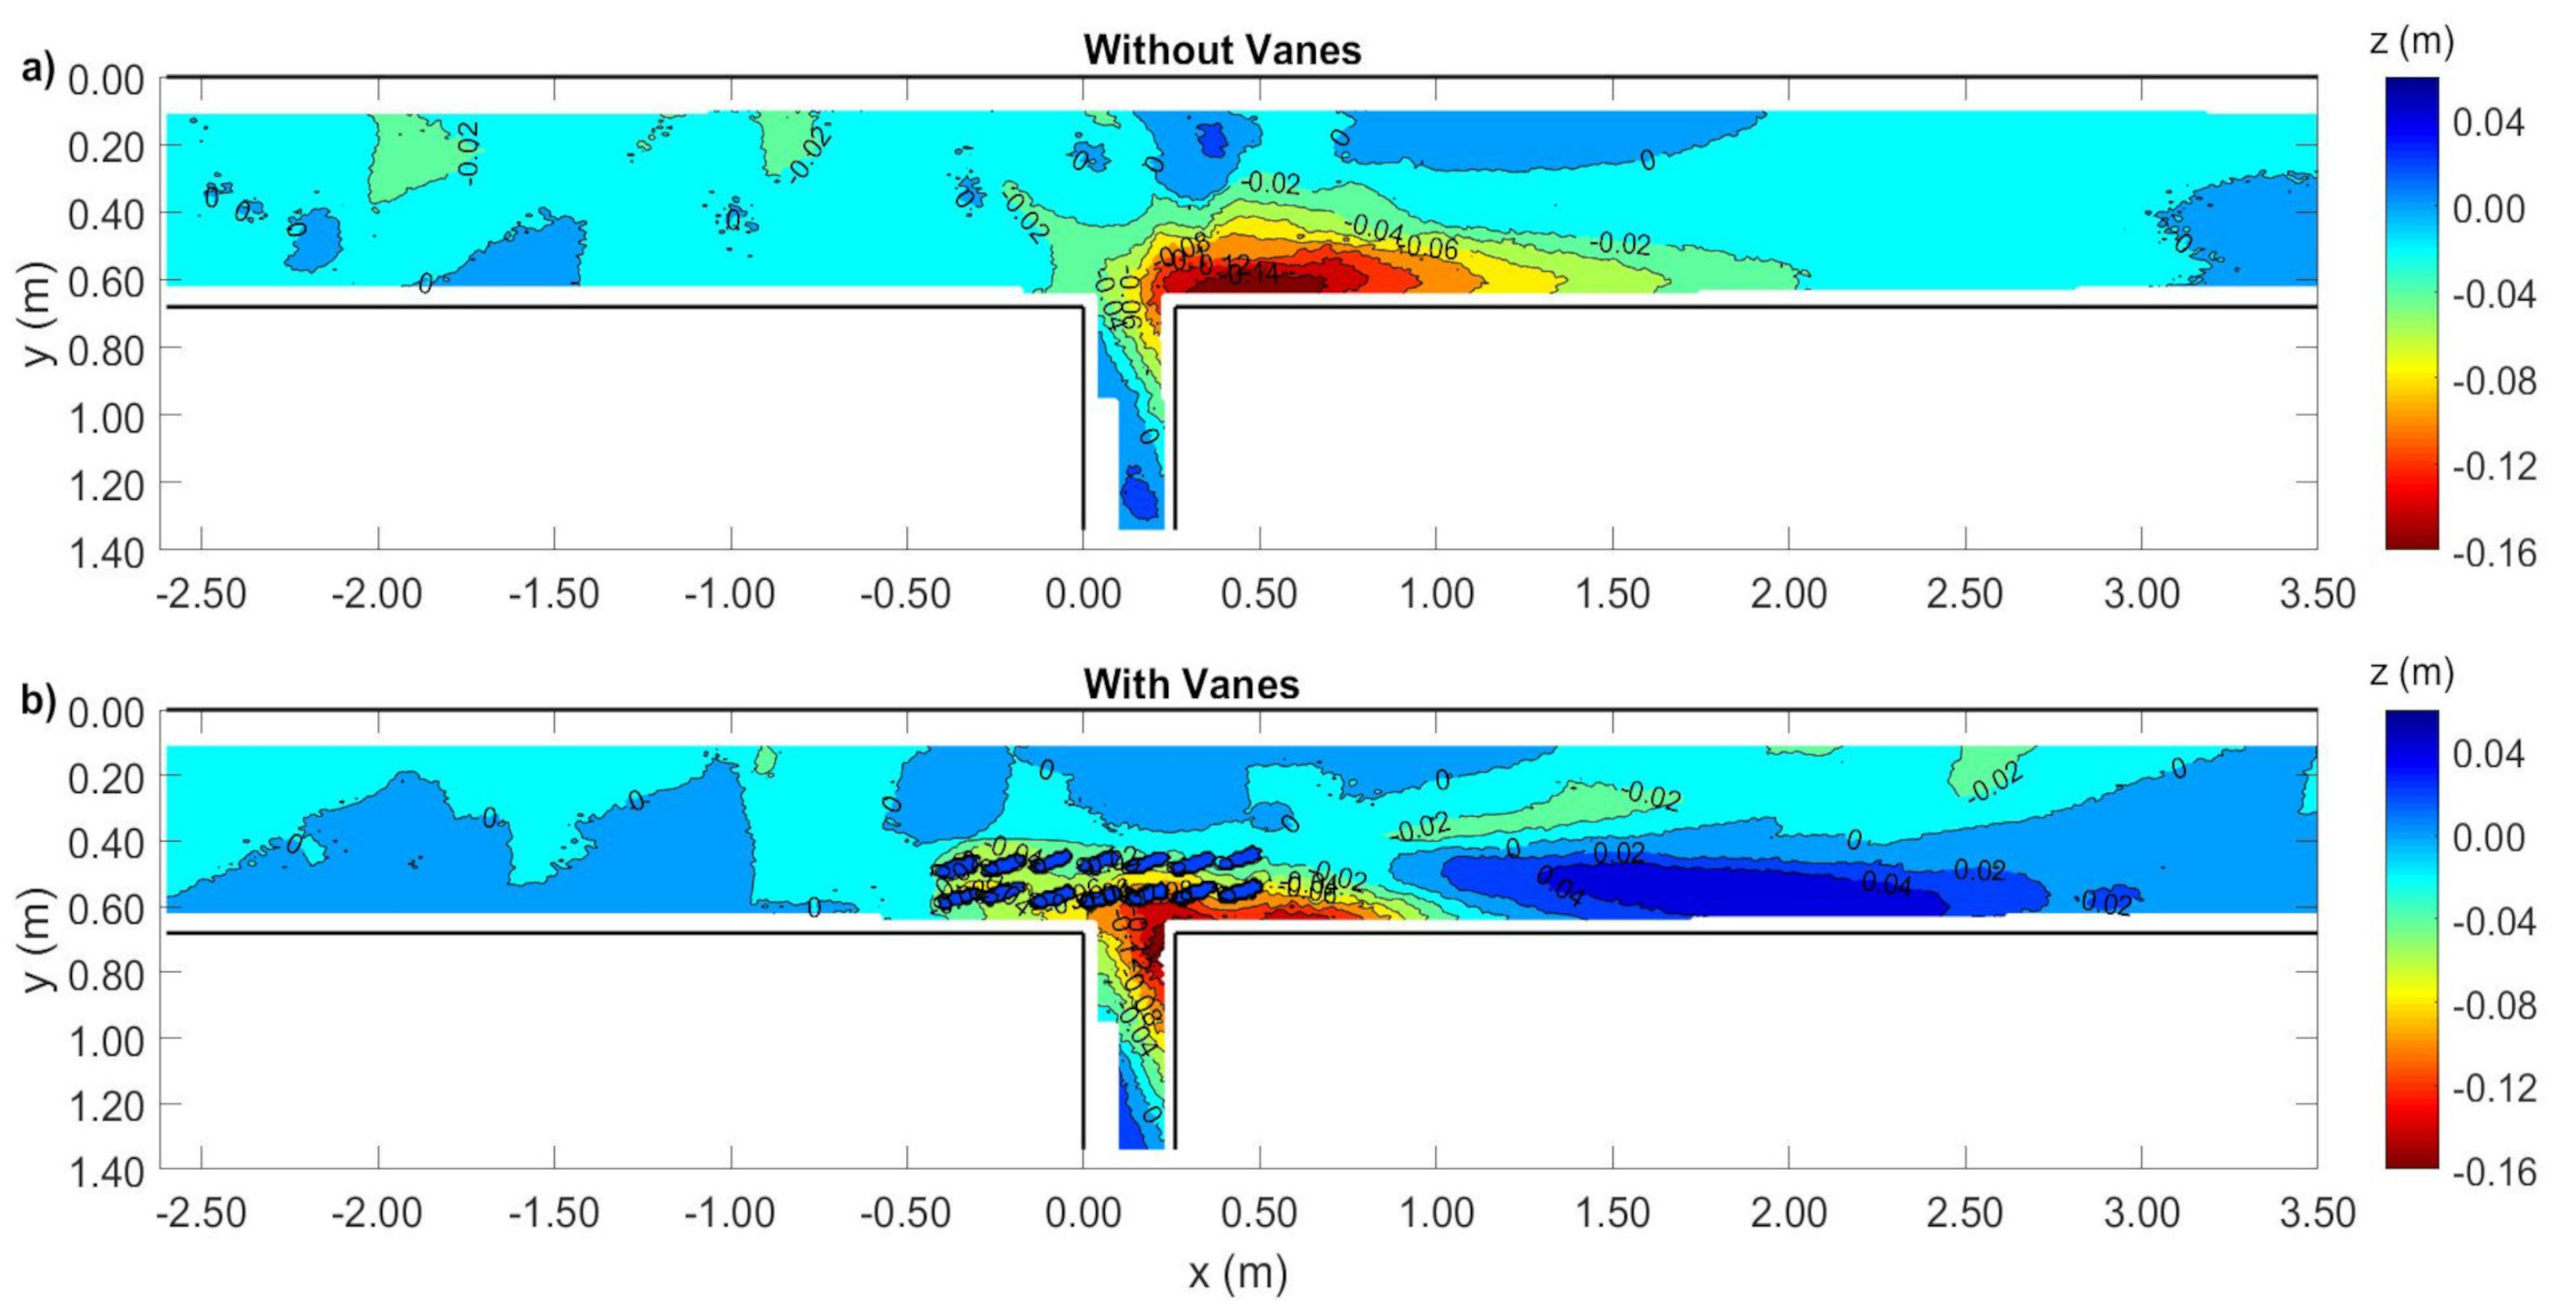
Minor bed level variations were registered upstream of the diversion as well as at m, for the case of NV (Figure 6a). For the VF case (Figure 6b), the more uniform bed zones were only found at m and at m. The greater differences between the two cases were observed at the entrance and close downstream of the diversion, where significant scour trenches were created in both cases in the main channel. Notice that similar trenches were observed by Barkdoll et al. [6], Herrero et al. [8] and Alomari et al. [9] in their experiments on diversions without vanes.
Comparing both bed topographies at equilibrium (Figure 6a,b), it was observed that the region of bed level below m started further upstream in the case of VF ( m) than for NV ( m). On the contrary, the scoured region finished closer to the diversion when vanes were used ( m) than in the vane free case ( m), due to the action of vanes. Consequently, the maximum length of the scour trench decreased for the VF, to approximately 1.5 m, from 2.2 m in the case of NV; the maximum width also decreased for VF to approximately 0.25 m, from 0.36 m. Furthermore, a region of sediment deposition occurred along the main channel inner wall, between m and m, that did not exist in the NV experiment. The length and width of this deposition were ≈1.7 m and ≈0.2 m, respectively.
Though scouring was more significant in the main channel than in the diversion, there was also a distinct trench close to the outer wall of the diversion in both tested scenarios (Figure 6a,b). This trench was more pronounced in the VF experiment. Indeed, in this case, the region of levels below m spread from the main to the diversion channel. Moreover, the area of bed levels below m was practically non-existent close to the inner wall of the main channel and it extended towards the diversion entrance, contrary to what happened for the NV case. The bed’s deepest point was found in the diversion channel for the VF experiment.
Despite these differences on the extent of the trench region, the maximum scour depth was practically the same in the two experiments: 0.158 m for NV (a greater value than the one of ≈0.12 m found by Alomari et al. [9] for similar values of and ), and 0.166 m for VF.
3.2. Average Flow Field
3.2.1. Data Presentation
In the absence of vanes, Barkdoll et al. [6] and Herrero et al. [8] identified a small number of flow structures in the flow diversion area, considered to cover the flow diversion entrance and the main channel reach influenced by the lateral water extraction. These flow structures are identified in Figure 7. Herrero et al. [8] , in particular, referred to a recirculation zone (Figure 7, n° 5) but they did not show clear evidence of its existence. Both Barkdoll et al. [6] and Herrero et al. [8] also mentioned the presence of vortical structures over or within the scoured areas that develop in both channels downstream of the downstream diversion corner, notably those referred to in the Introduction. Next, the average velocity measurements are presented and discussed, separately, in four flow zones that roughly correspond to the most important flow structures observed around uncontrolled diversions (Barkdoll et al. [6] and Herrero et al. [8]). Our four flow zones are (i) the approach flow zone ( m), (ii) the flow deflection zone in the main channel ( m m), (iii) the diversion entrance zone ( m m) and (iv) the flow recovery zone ( m).
3.2.2. Approach Flow Zone ( m)
For the NV case, the flow velocity was predominantly oriented downstream at 1.00 m upstream of the diversion (Figure 8a), displaying a comparatively small crosswise component towards the main channel’s outer wall. Contrastingly, this component pointed towards the inner wall in the VF case (Figure 8b), except in the two vertical profiles closest to that wall. Moving to m upstream of the diversion, the direction of the v velocity component switched in the NV case (Figure 8c), pointing towards the inner wall, as in the VF case (Figure 8d), which indicates that the flow started to be drawn towards the diversion. In the latter case (VF), the vane-field induced a significant increase in the v and w velocity components at m (Figure 8d), which in turn, led to a lower bed close to the inner wall of the main channel (see Figure 6).
Reaching the vane-field, at m (Figure 8f), the flow was altered when compared with the flow in the most upstream cross-sections of the VF case, with a circulation created around the vanes. At m, the streamwise velocity, u, also decreased significantly close and slightly below to their tips. Near the vertical surface of the inner vane facing the inner wall, the crosswise velocity component, v, decreased and the vertical component, w, increased in magnitude and pointed downwards (Figure 8f), as reported by Firozjaei et al. [15]; in the vertical profiles between the two vanes, the velocity components pointed to the outer vane, leading to the appearance of the tip vortex referred to by Barkdoll et al. [6] on the tip of that vane. The downflow created near the vanes for m was most likely responsible for scouring around them.
3.2.3. Flow Deflection Zone in the Main Channel ( m 0.70 m)
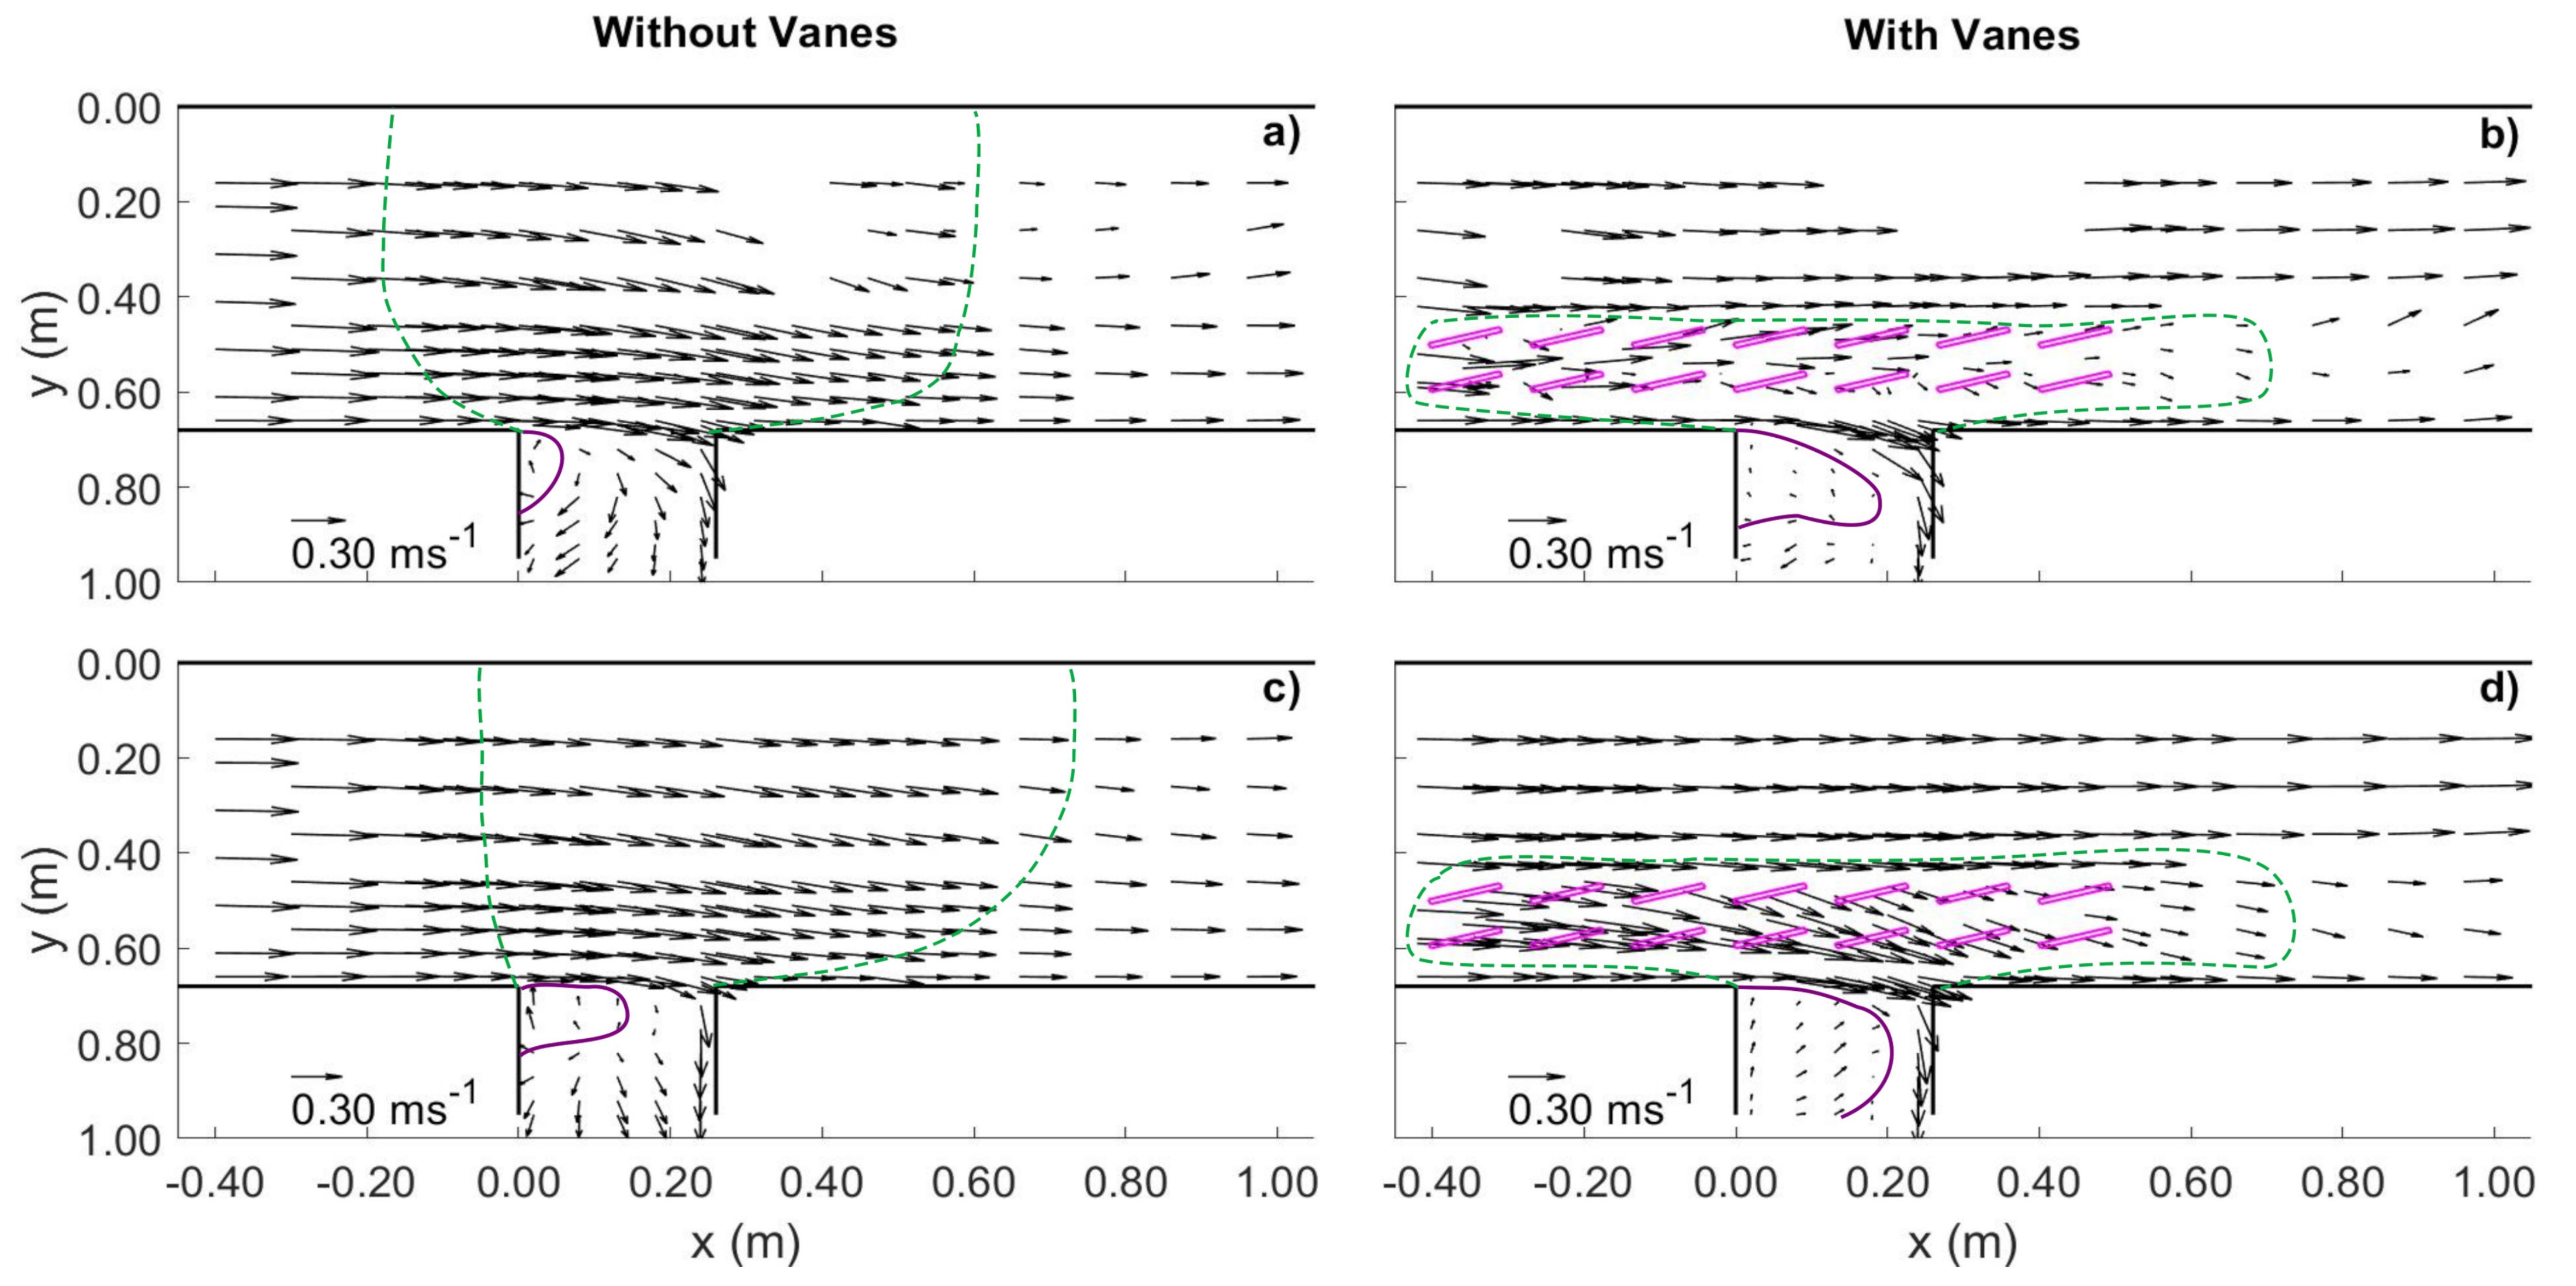
In the NV case (Figure 9a,c), the flow showed some deflection towards the downstream diversion corner, partly entering the diversion and moving adjacently to its outer wall. This flow spread across the diversion channel as the flow went downstream. At m, the flow in the main channel was no longer deflecting at m (Figure 9a) and it moved predominantly downstream; close to the outer wall, the velocity components presented lower values than at the rest of the main channel but no recirculation was visible, which did not corroborate the suggestion of Herrero et al. [8]. This difference is possibly due to the rather different width ratios of Herrero et al. [8] and our studies. In our case, was equal to 0.38, reducing the impact of the diversion on the flow field downstream of the diversion channel compared with the same impact for , in their case.
In the VF case, it is quite evident that the flow streamlines remained practically unchanged between the outer wall of the main channel and the vane-field. In addition, the flow in the main channel on top of the vanes (Figure 9d) was strongly deflected towards the diversion channel and the main channel inner wall (similar to what was found by Firozjae et al. [15]), meaning that the magnitude of the v component increased relatively to the plane below the top of the vanes. Downstream of the vane-field, until m, the velocity components at m (Figure 9b) were very small, indicating a tendency to stagnation along x. At m (Figure 9d), the flow still presented a significant v component moving towards the inner wall, until m, in opposition to what was found at m (Figure 9b).
The angle (see Section 2.2) was obtained at m (at the outer zone near the vane-field) along m 0.50 m and at m (the closest measuring plane to the diversion entrance) along 0.02 m 0.24 m. For the NV case and at m (Figure 10a), the flow angle assumed positive values smaller than ≈5° upstream of the diversion and, as the flow approached the diversion entrance, it gradually increased, reaching ≈20° in front of the downstream diversion corner. For the VF case (Figure 10b), the presence of the vanescaused the flow deviation to be outwards, closely parallel to them, with a negative v component for z values approximately equal or below the vanes’ top level. Above the vanes, the flow angle was greater than in the NV case, at comparable z values, especially in front of the diversion channel. This can also be seen in Figure 9d where the flow deflection could be identified from the outer row of the vane-field. For the NV case, at m (Figure 10c), it is noticed that the flow angle presented higher values close to the bed than at the free surface, similar to what happened at m (Figure 10a). This is clearer at the downstream diversion corner. Additionally, next to the upstream diversion corner and near the free surface, the angle was close to 0° (see also Figure 9a,c). In the VF experiment (Figure 10d), the flow angle did not change significantly through the water column along 0.08 m 0.24 m, being approximately equal to 20°; it was strongly negative near the upstream diversion corner. Since the scour trench inside the diversion was slightly deeper in the VF case, the diverted water was conveyed with a lower v velocity component, which complied with the equally smaller amount of sedimententering the diversion at equilibrium. To the authors best knowledge, no similar data on the flow deflection angle in front and at the entrance of lateral diversions has been published so far. Our results seem plausible but cannot yet be compared with other sources.
It became clear that the diversion vortex was formed near the bed in the absence of vanes (Figure 11a). This vortex was centered at m and aligned parallel to the longitudinal axis of the diversion, as observed and explained by Herrero et al. [8], who suggested that it continues into the diversion channel. No such vortex appeared in the VF case (Figure 11b), meaning that the vane-field inhibited its development, thus reducing the amount of sediment entering the diversion as, in the absence of vanes, this flow structure can drive a large amount of the main-channel bed load with the diverted water.
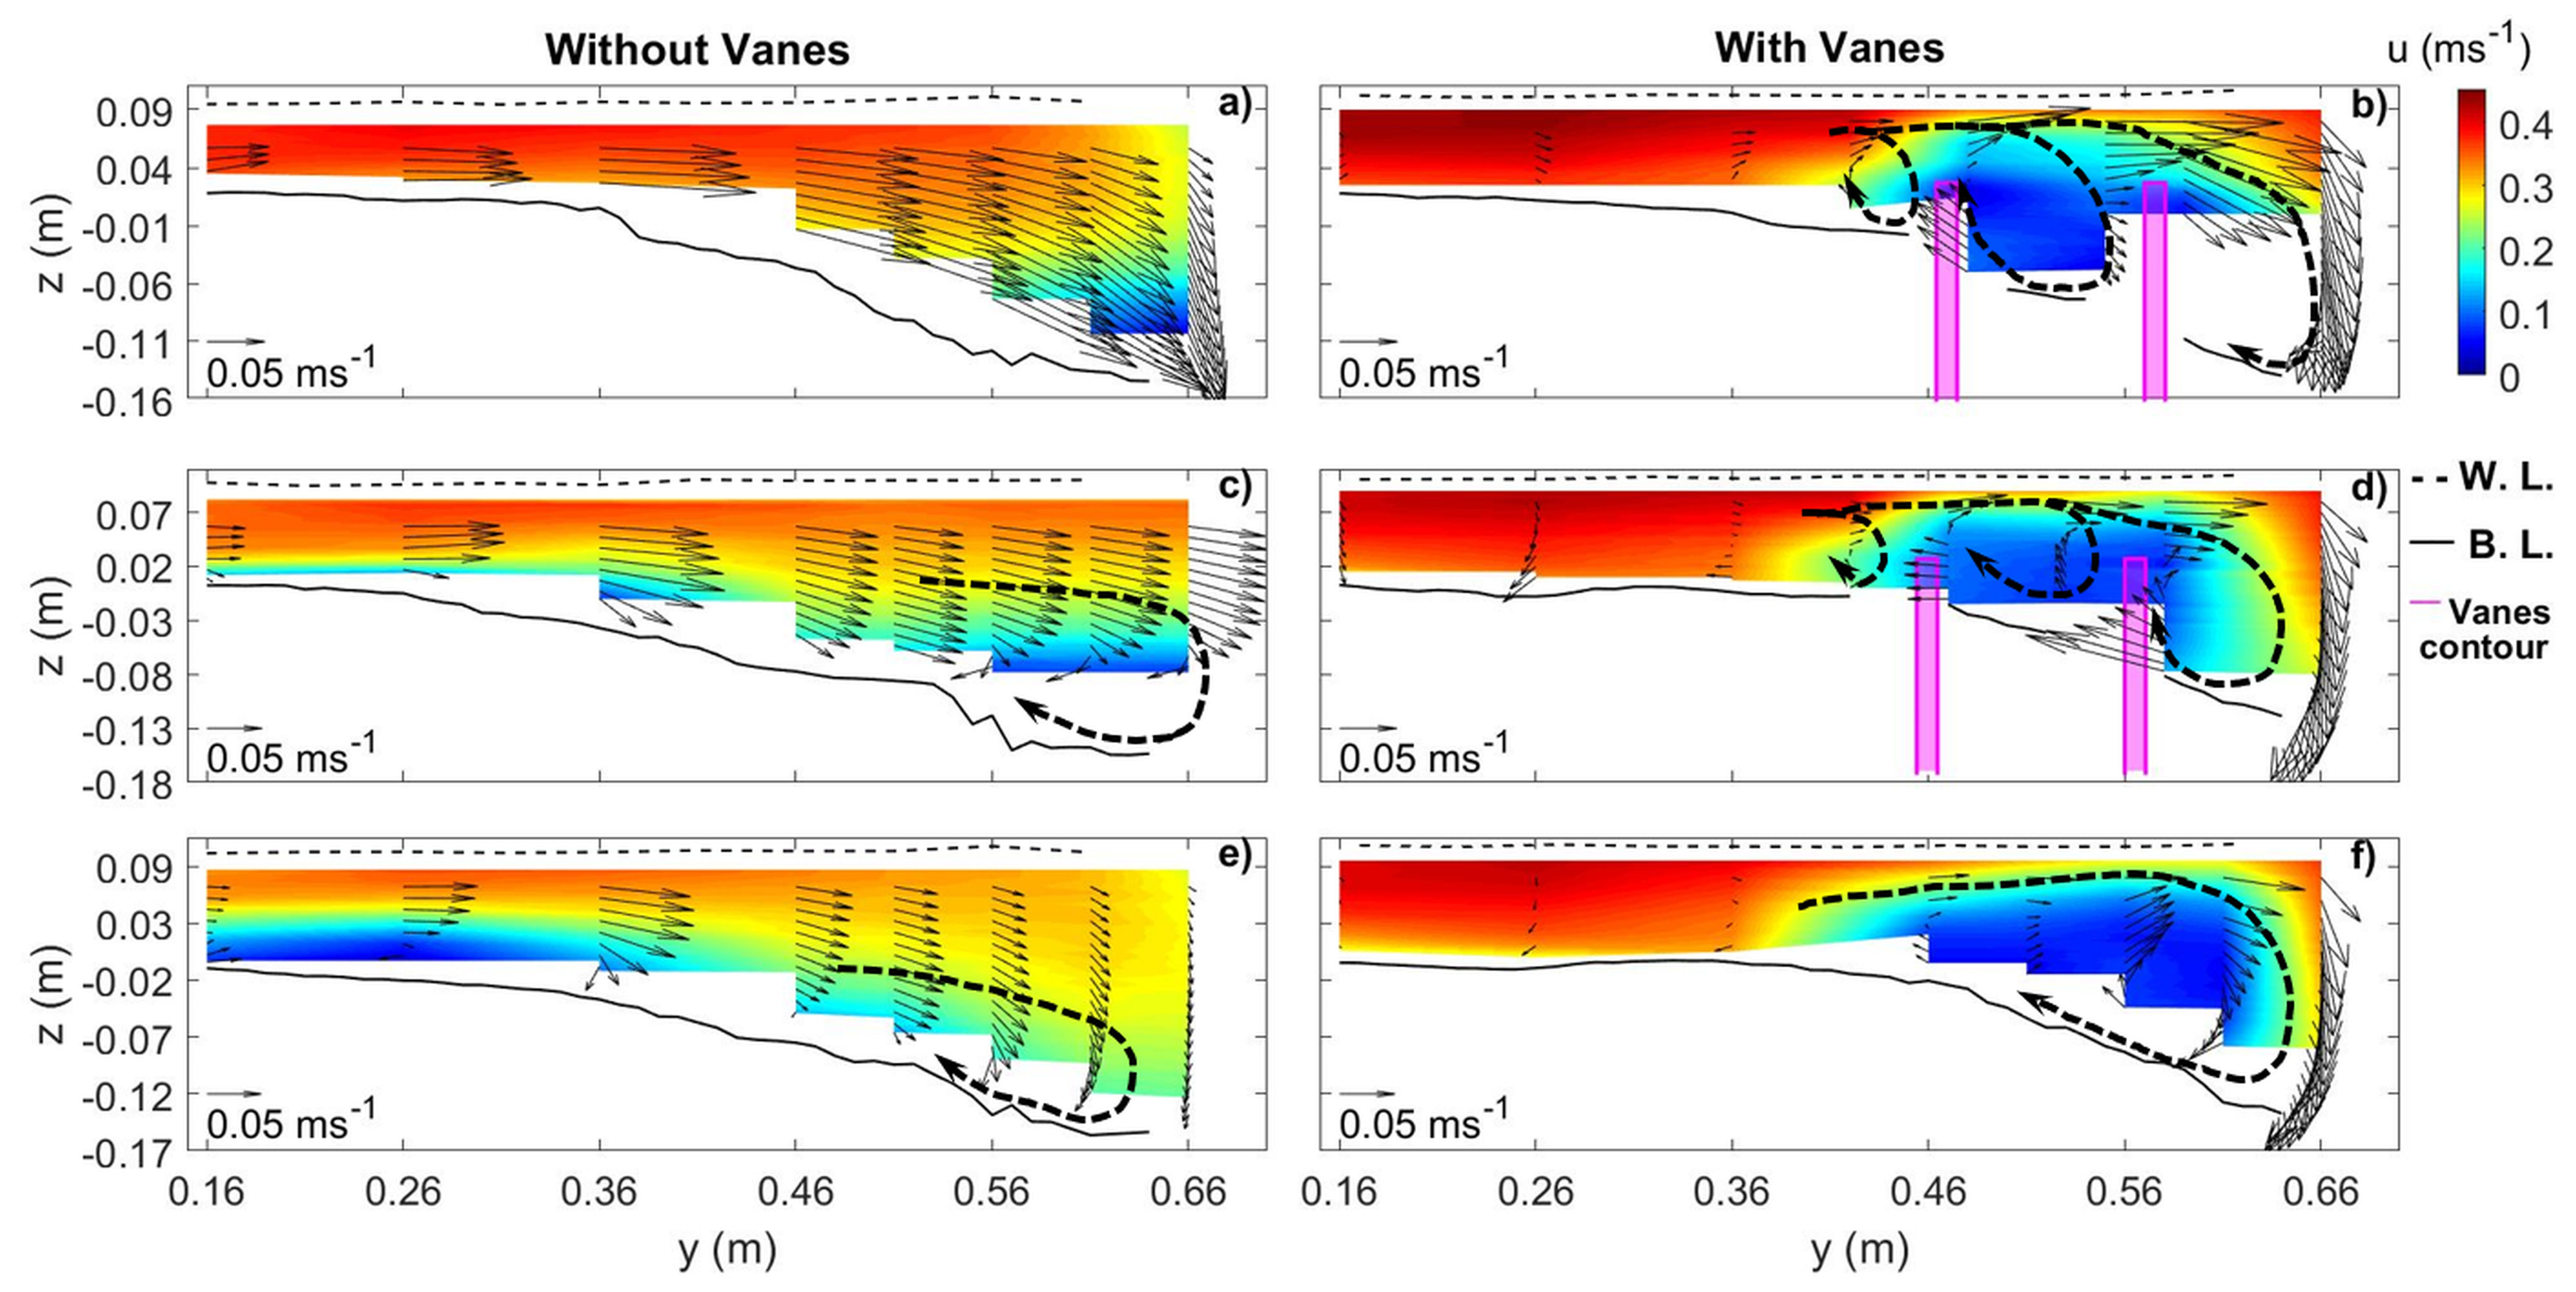
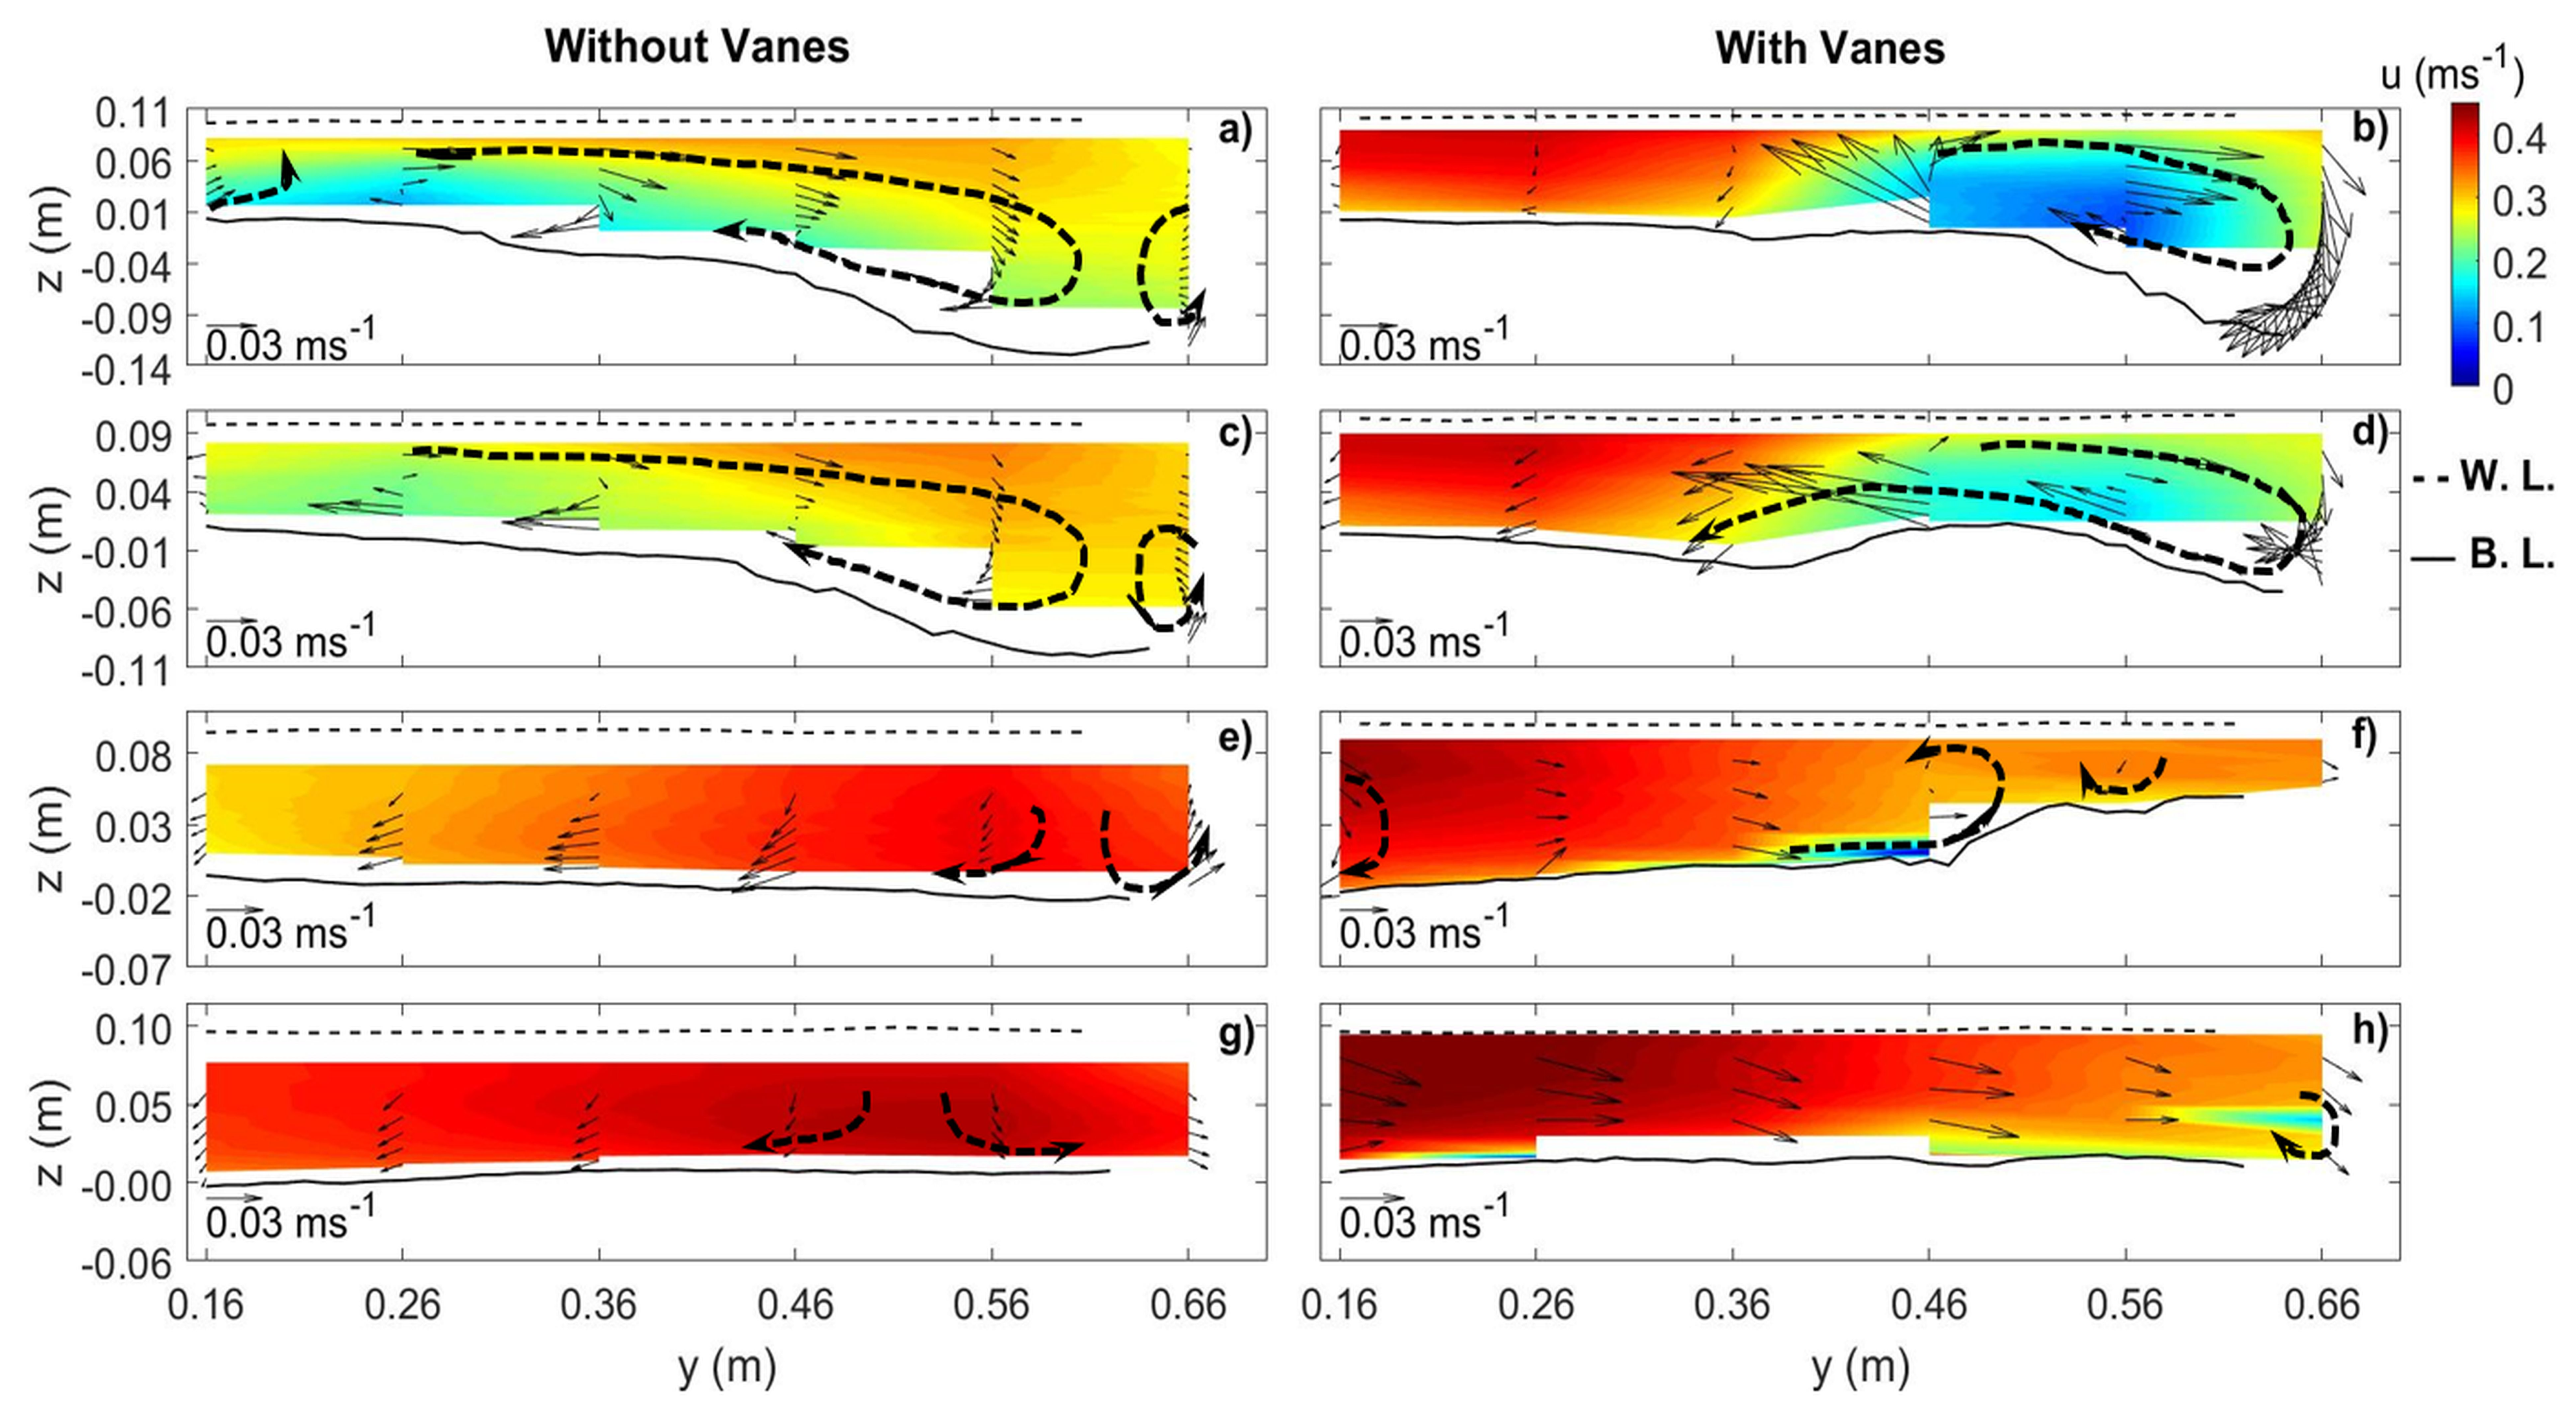
In the NV case, the v velocity component pointed towards the inner wall of the main channel at m, i.e., at 0.05 m beyond the downstream diversion corner (Figure 12a); the w velocity component pointed systematically downwards for m whereas the longitudinal velocity, u, approached zero below m. Further downstream (Figure 12c,e), the flow developed into another vortical structure close to the bed (the main channel vortex observed by Herrero et al. [8]), along the main channel inner wall, resulting in the scour trench. Clearly, it did not initiate in front of the diversion entrance; it rather resulted from the flow hitting the inner wall and generating a descending flow that excavated the bed and led to the helical flow through continuity. At cross-section m (Figure 12e), there was a zone with practically null streamwise and crosswise velocities between the outer wall of the main channel and its center, indicating the presence therein of a low flow velocity zone.
For the VF case, the u component was much higher from the main channel outer wall until its center than in the outer half channel, particularly below the top level of the vanes (Figure 12b,d). Above the vanes, the crosswise velocity was important at m (Figure 12b), where the deflected flow impinged on the inner wall and led to a clear downflow which seemed to develop into a vortical structure close to the bed, contributing to the scouring process, as in the NV case. This vortex added to the main channel vortical flow generated by the vanes (Figure 12b,d) downstream of the vane field, namely at m, where only one clear vortex was identified (Figure 12f).
3.2.4. Diversion Entrance Zone (0.67 m 0.95 m)
Three organized flow structures were identified in the diversion entrance zone (Figure 13 and Figure 14): a separation zone starting at the upstream corner of the diversion channel and developing along the inner wall of this channel ( m); an effective flow conveyance zone along its outer wall (defined at m); a rising flow zone close to or associated with the separation zone.
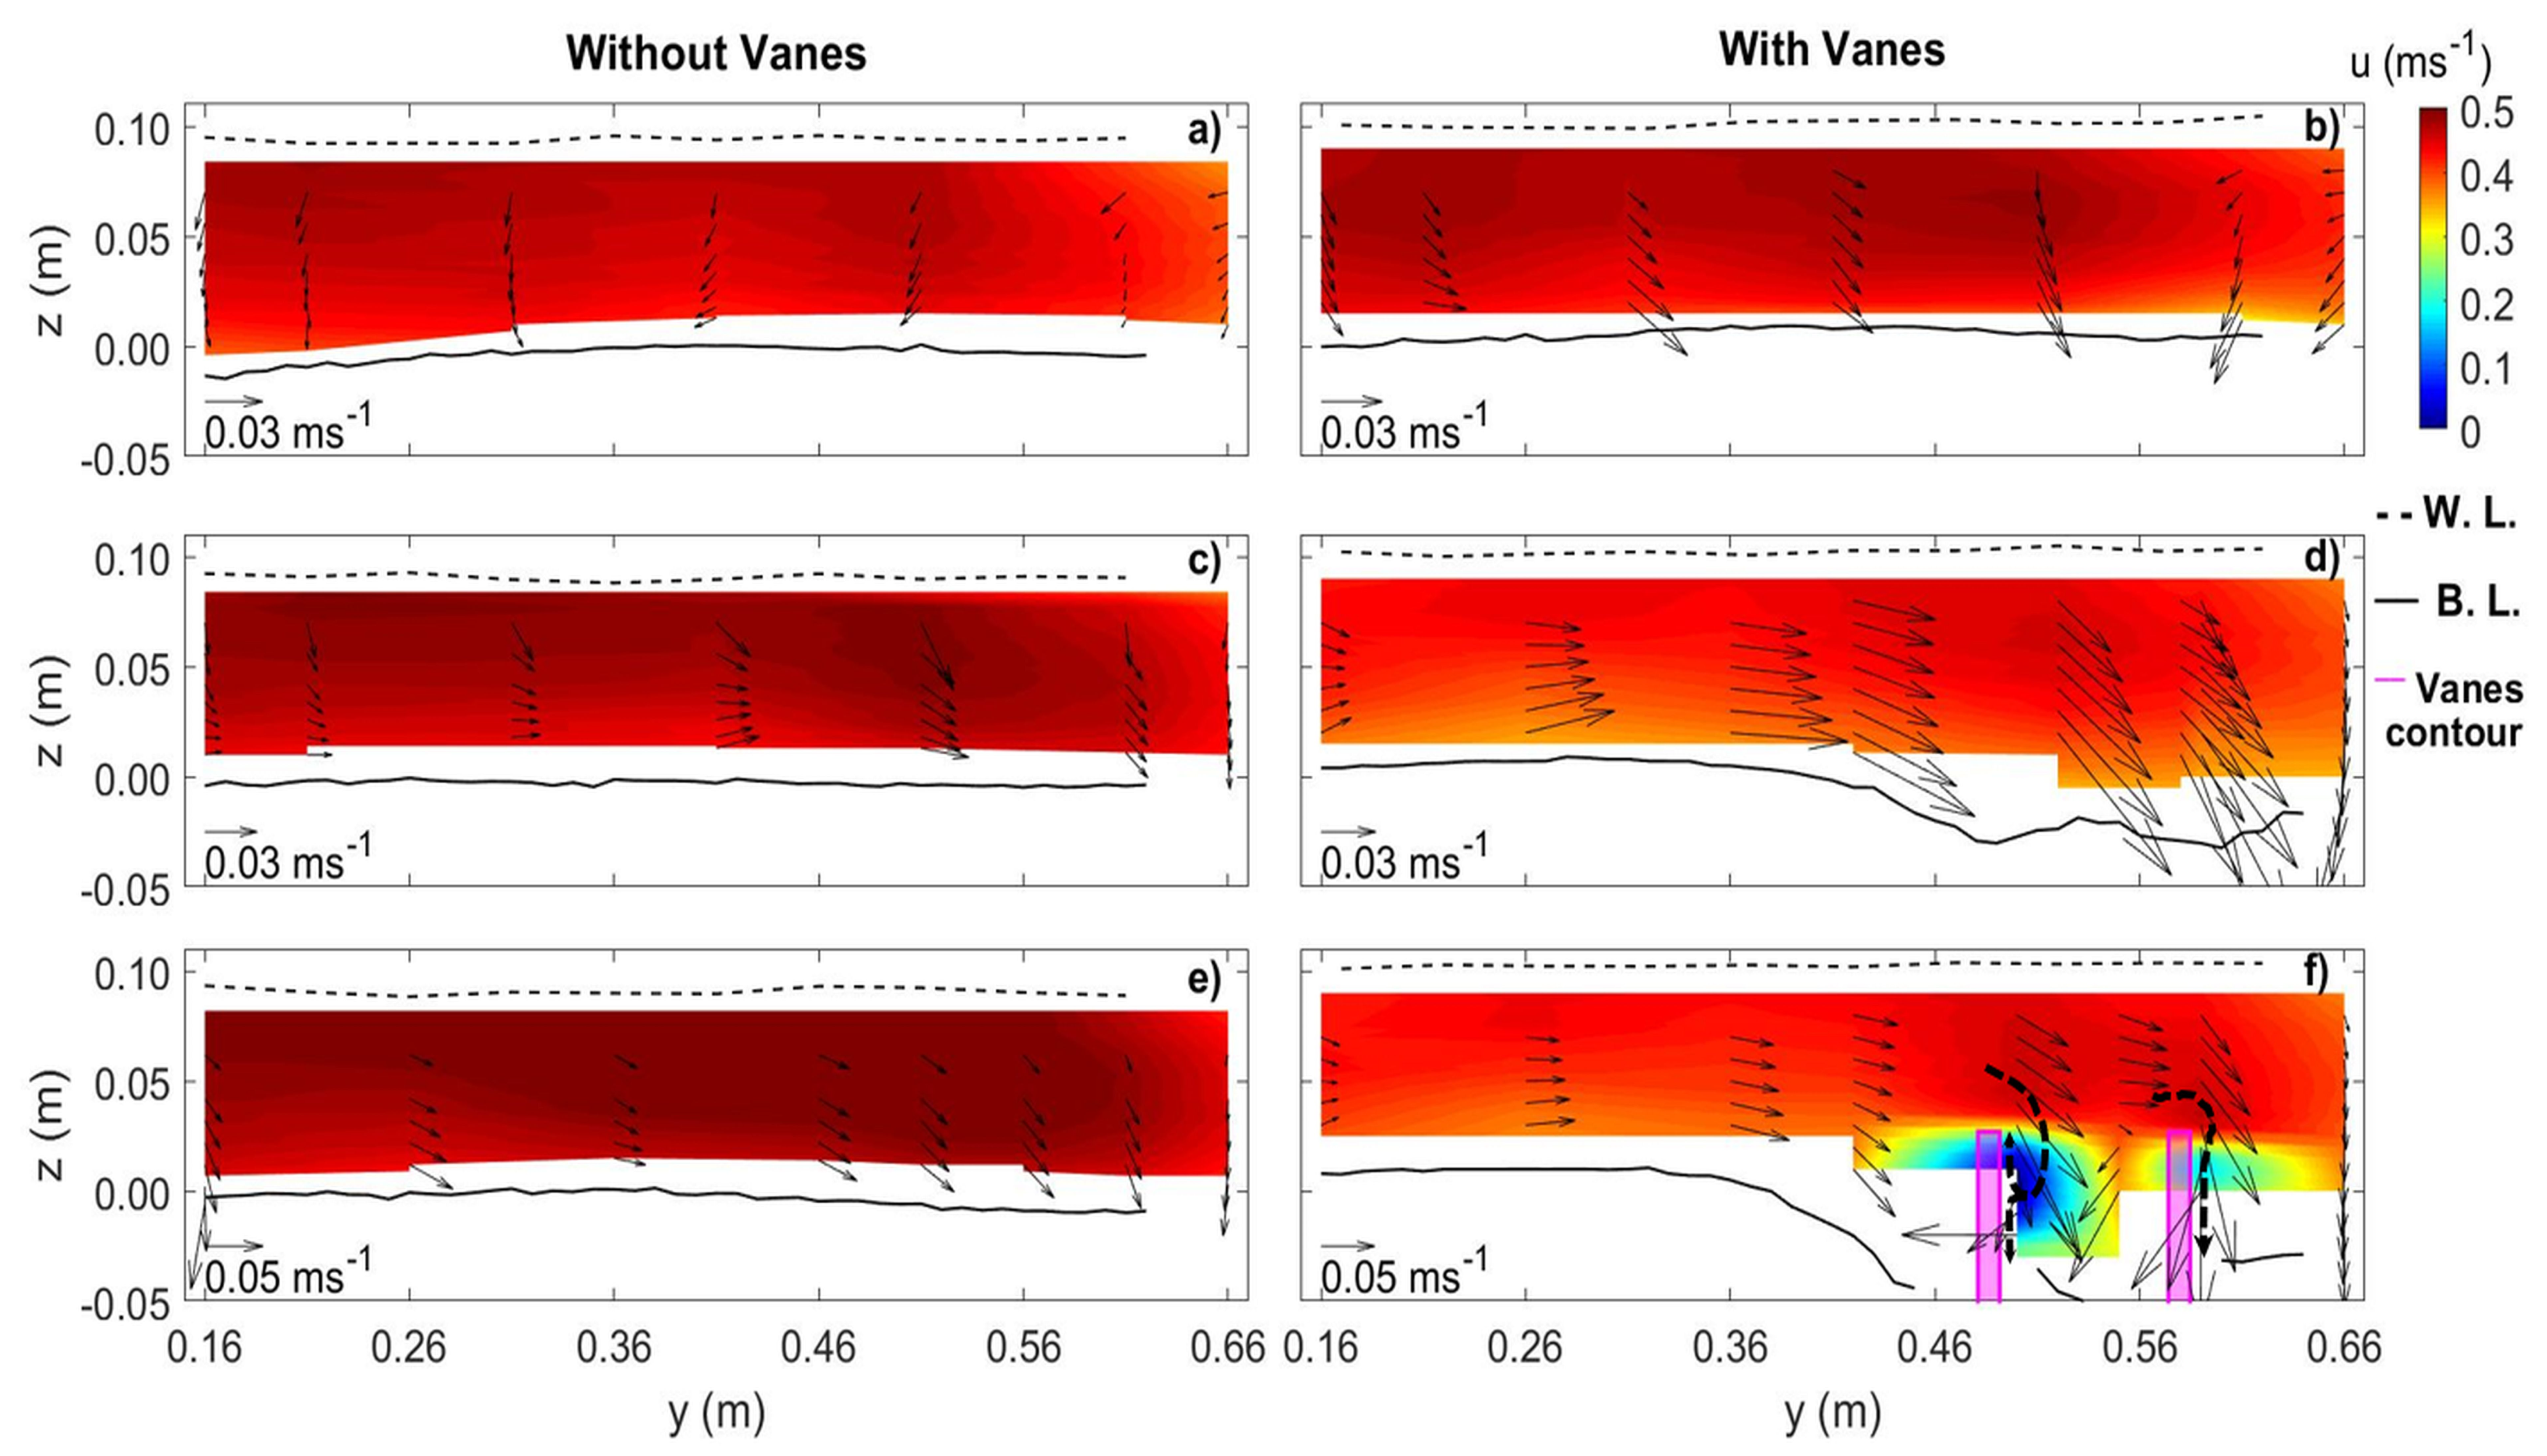
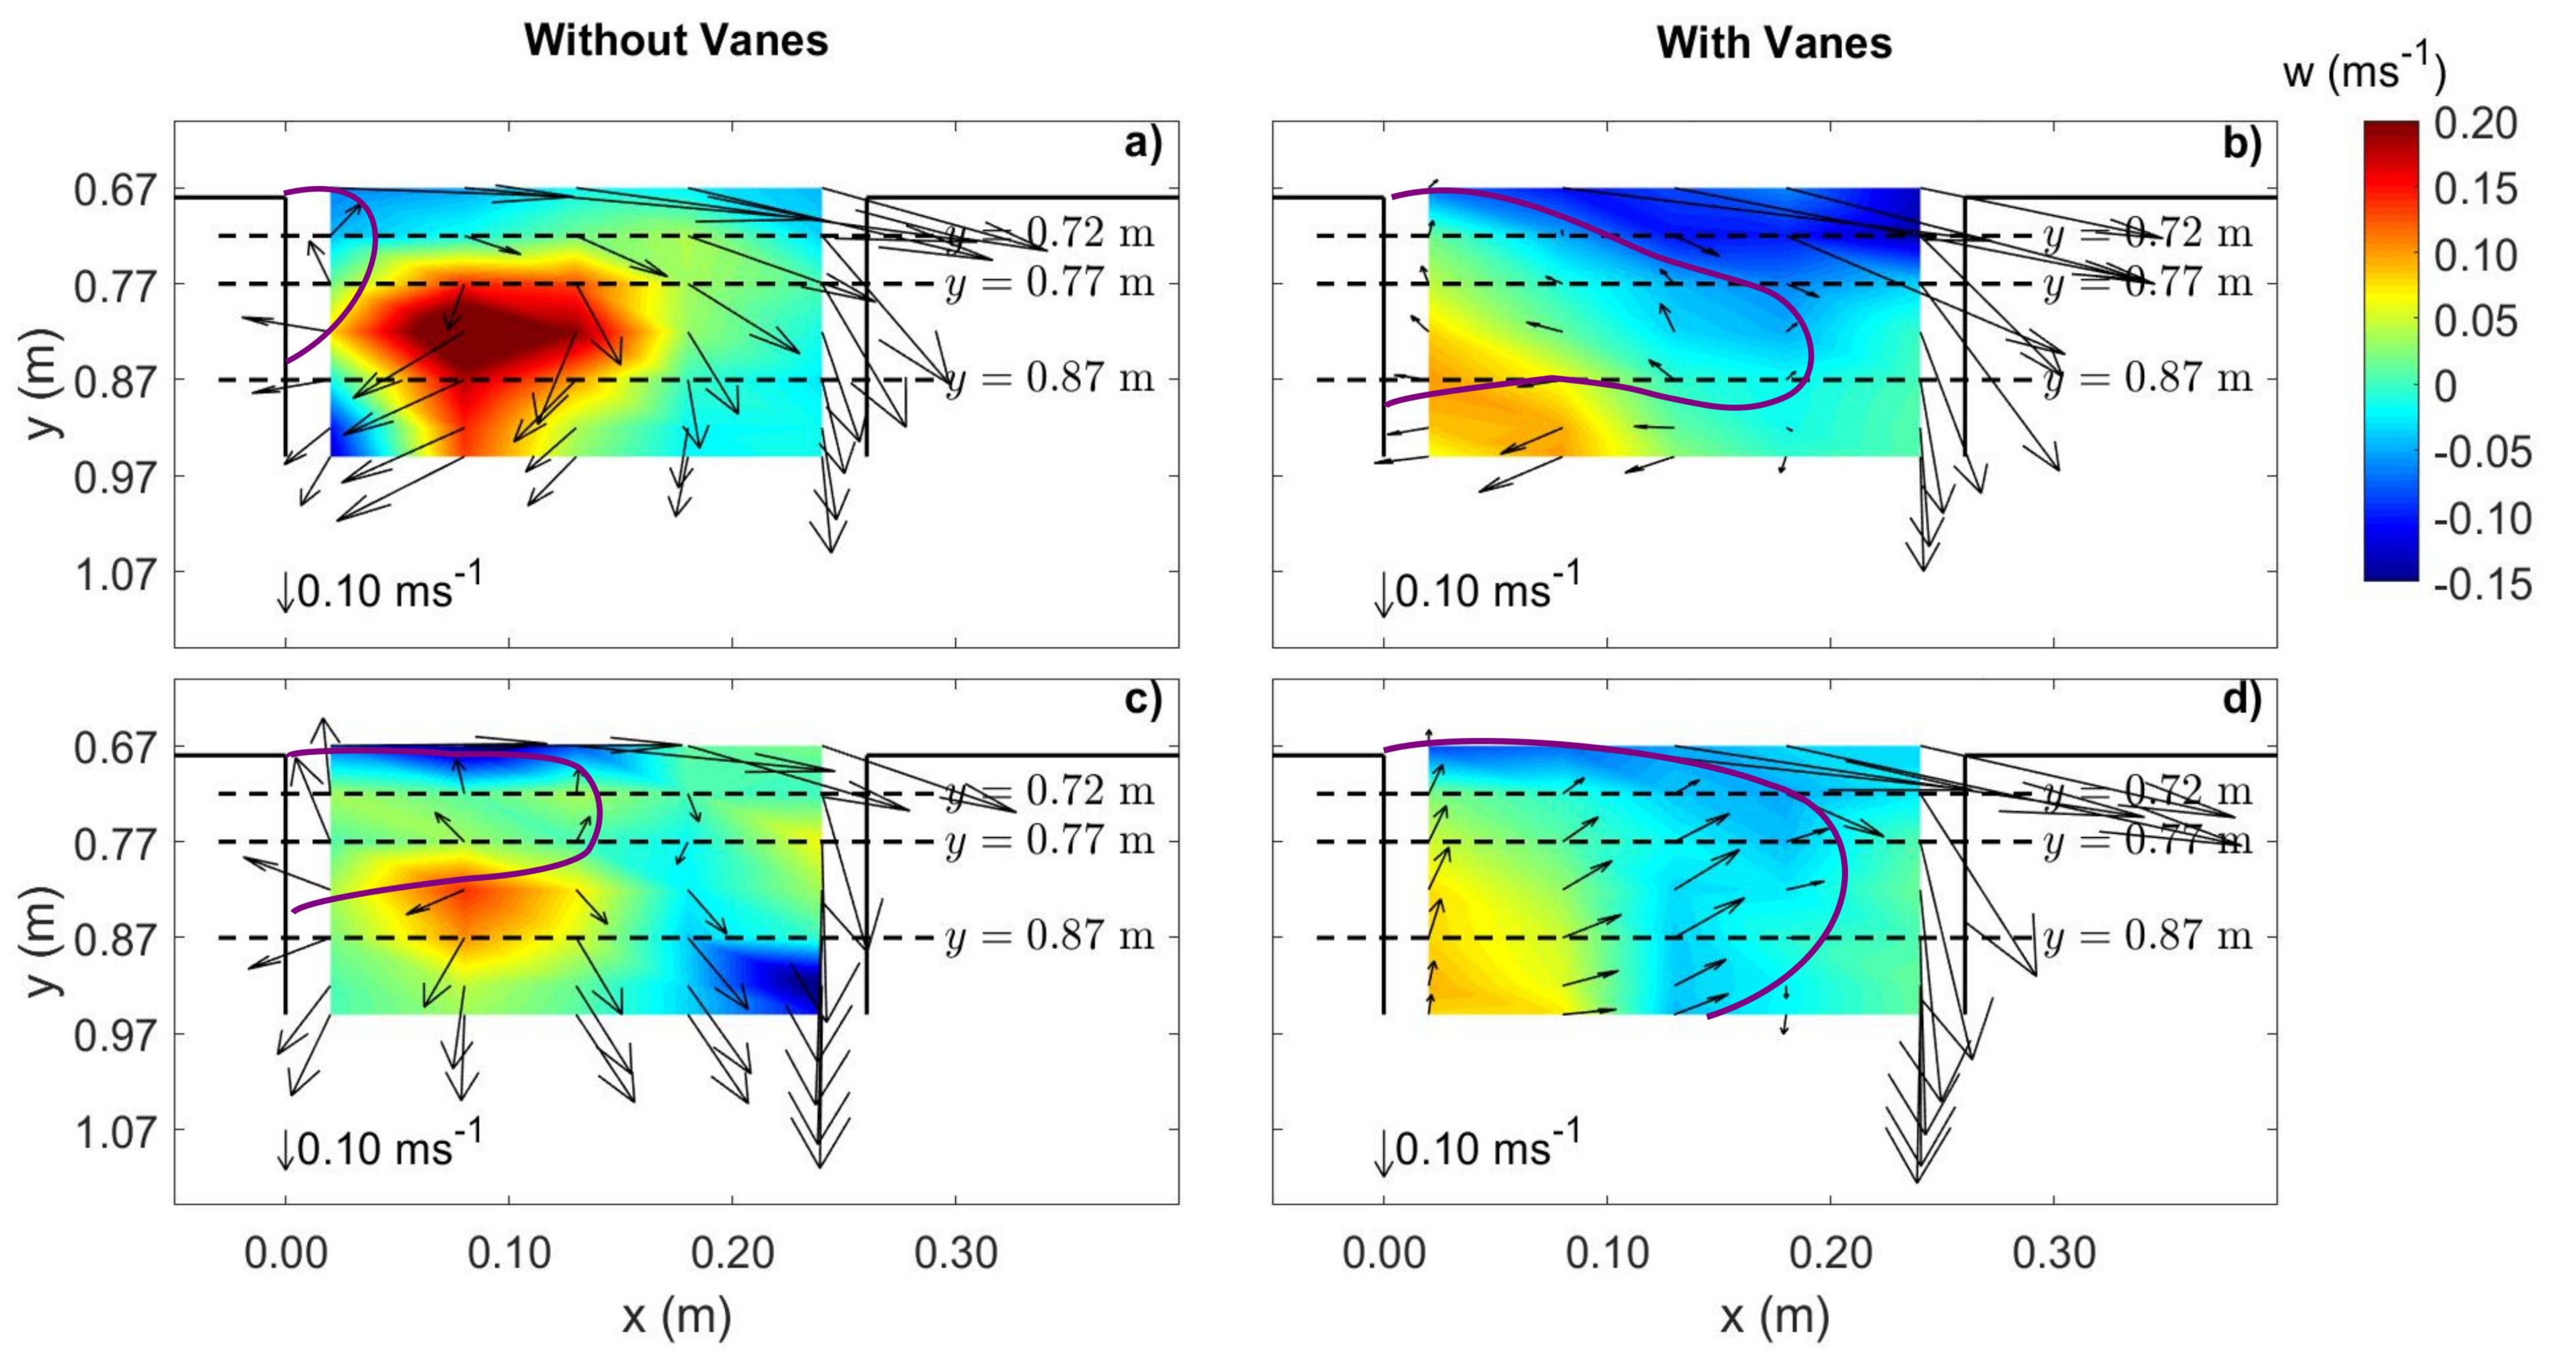
The flow separation at the upstream vertical edge connecting both channels was physically inevitable and it was also reported by Barkdoll et al. [6] and Karami et al. [10]. In our experiments, the area occupied by the separation zone increased upwards, according to the purple borders qualitatively drawn in Figure 13 and confirmed in Figure 14. In the NV case, the separation zone widened from ≈0.03 m to ≈0.13 m as z increased from 0.017 m to 0.062 m (Figure 13a,c), the maximum length being ≈0.15 m at both levels. Contrastingly, in the VF case, the maximum width of the separation zone was ≈0.18 m (≈70% of m) at both m (Figure 13b,d), whereas its length increased from ≈0.20 m to more than 0.30 m at those levels, ending beyond the measuring reach for m (Figure 13d). The separation zone was also thicker in the VF case (Figure 14). Concomitantly, the flow conveyance at equilibrium was guaranteed through a deeper cross-section, in this case, mostly scoured along the outer wall of the diversion.
The rising flow spread and contributed, through continuity, to the backward flow inside the separation zone as well as to the conveyance of the diversion downstream of that zone in both NV and VF cases. To the authors’ best knowledge, the rising flow was not mentioned in the literature published so far on movable bed diversions. It was much clearer (maximum ms−1) in the NV case (Figure 13a,c), where it was observed side by side, underneath (Figure 14c) or immediately downstream of the separation zone, between m and m and extending from m to m, with no evident contact with the inner wall of the diversion. In the VF case, the magnitude of w in the rising flow was smaller (maximum ms−1), but it extended downstream of the measuring reach in contact with the inner wall of the diversion, occupying a narrower portion of the diversion width at comparable y and z values.
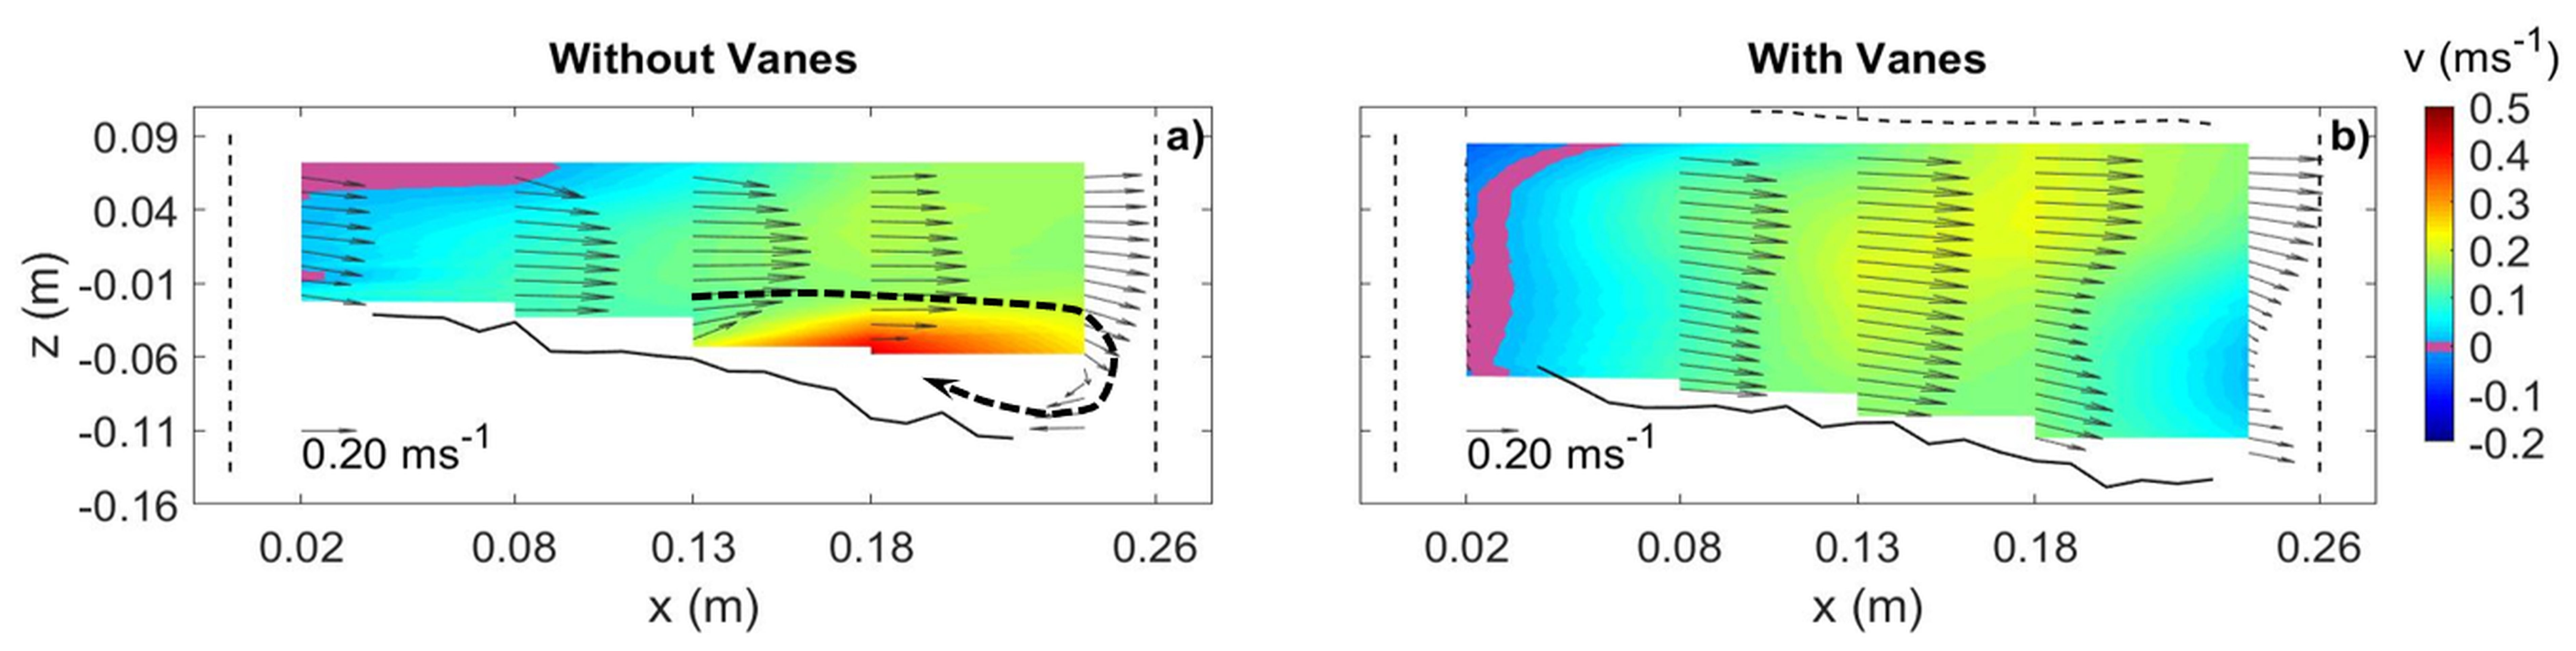
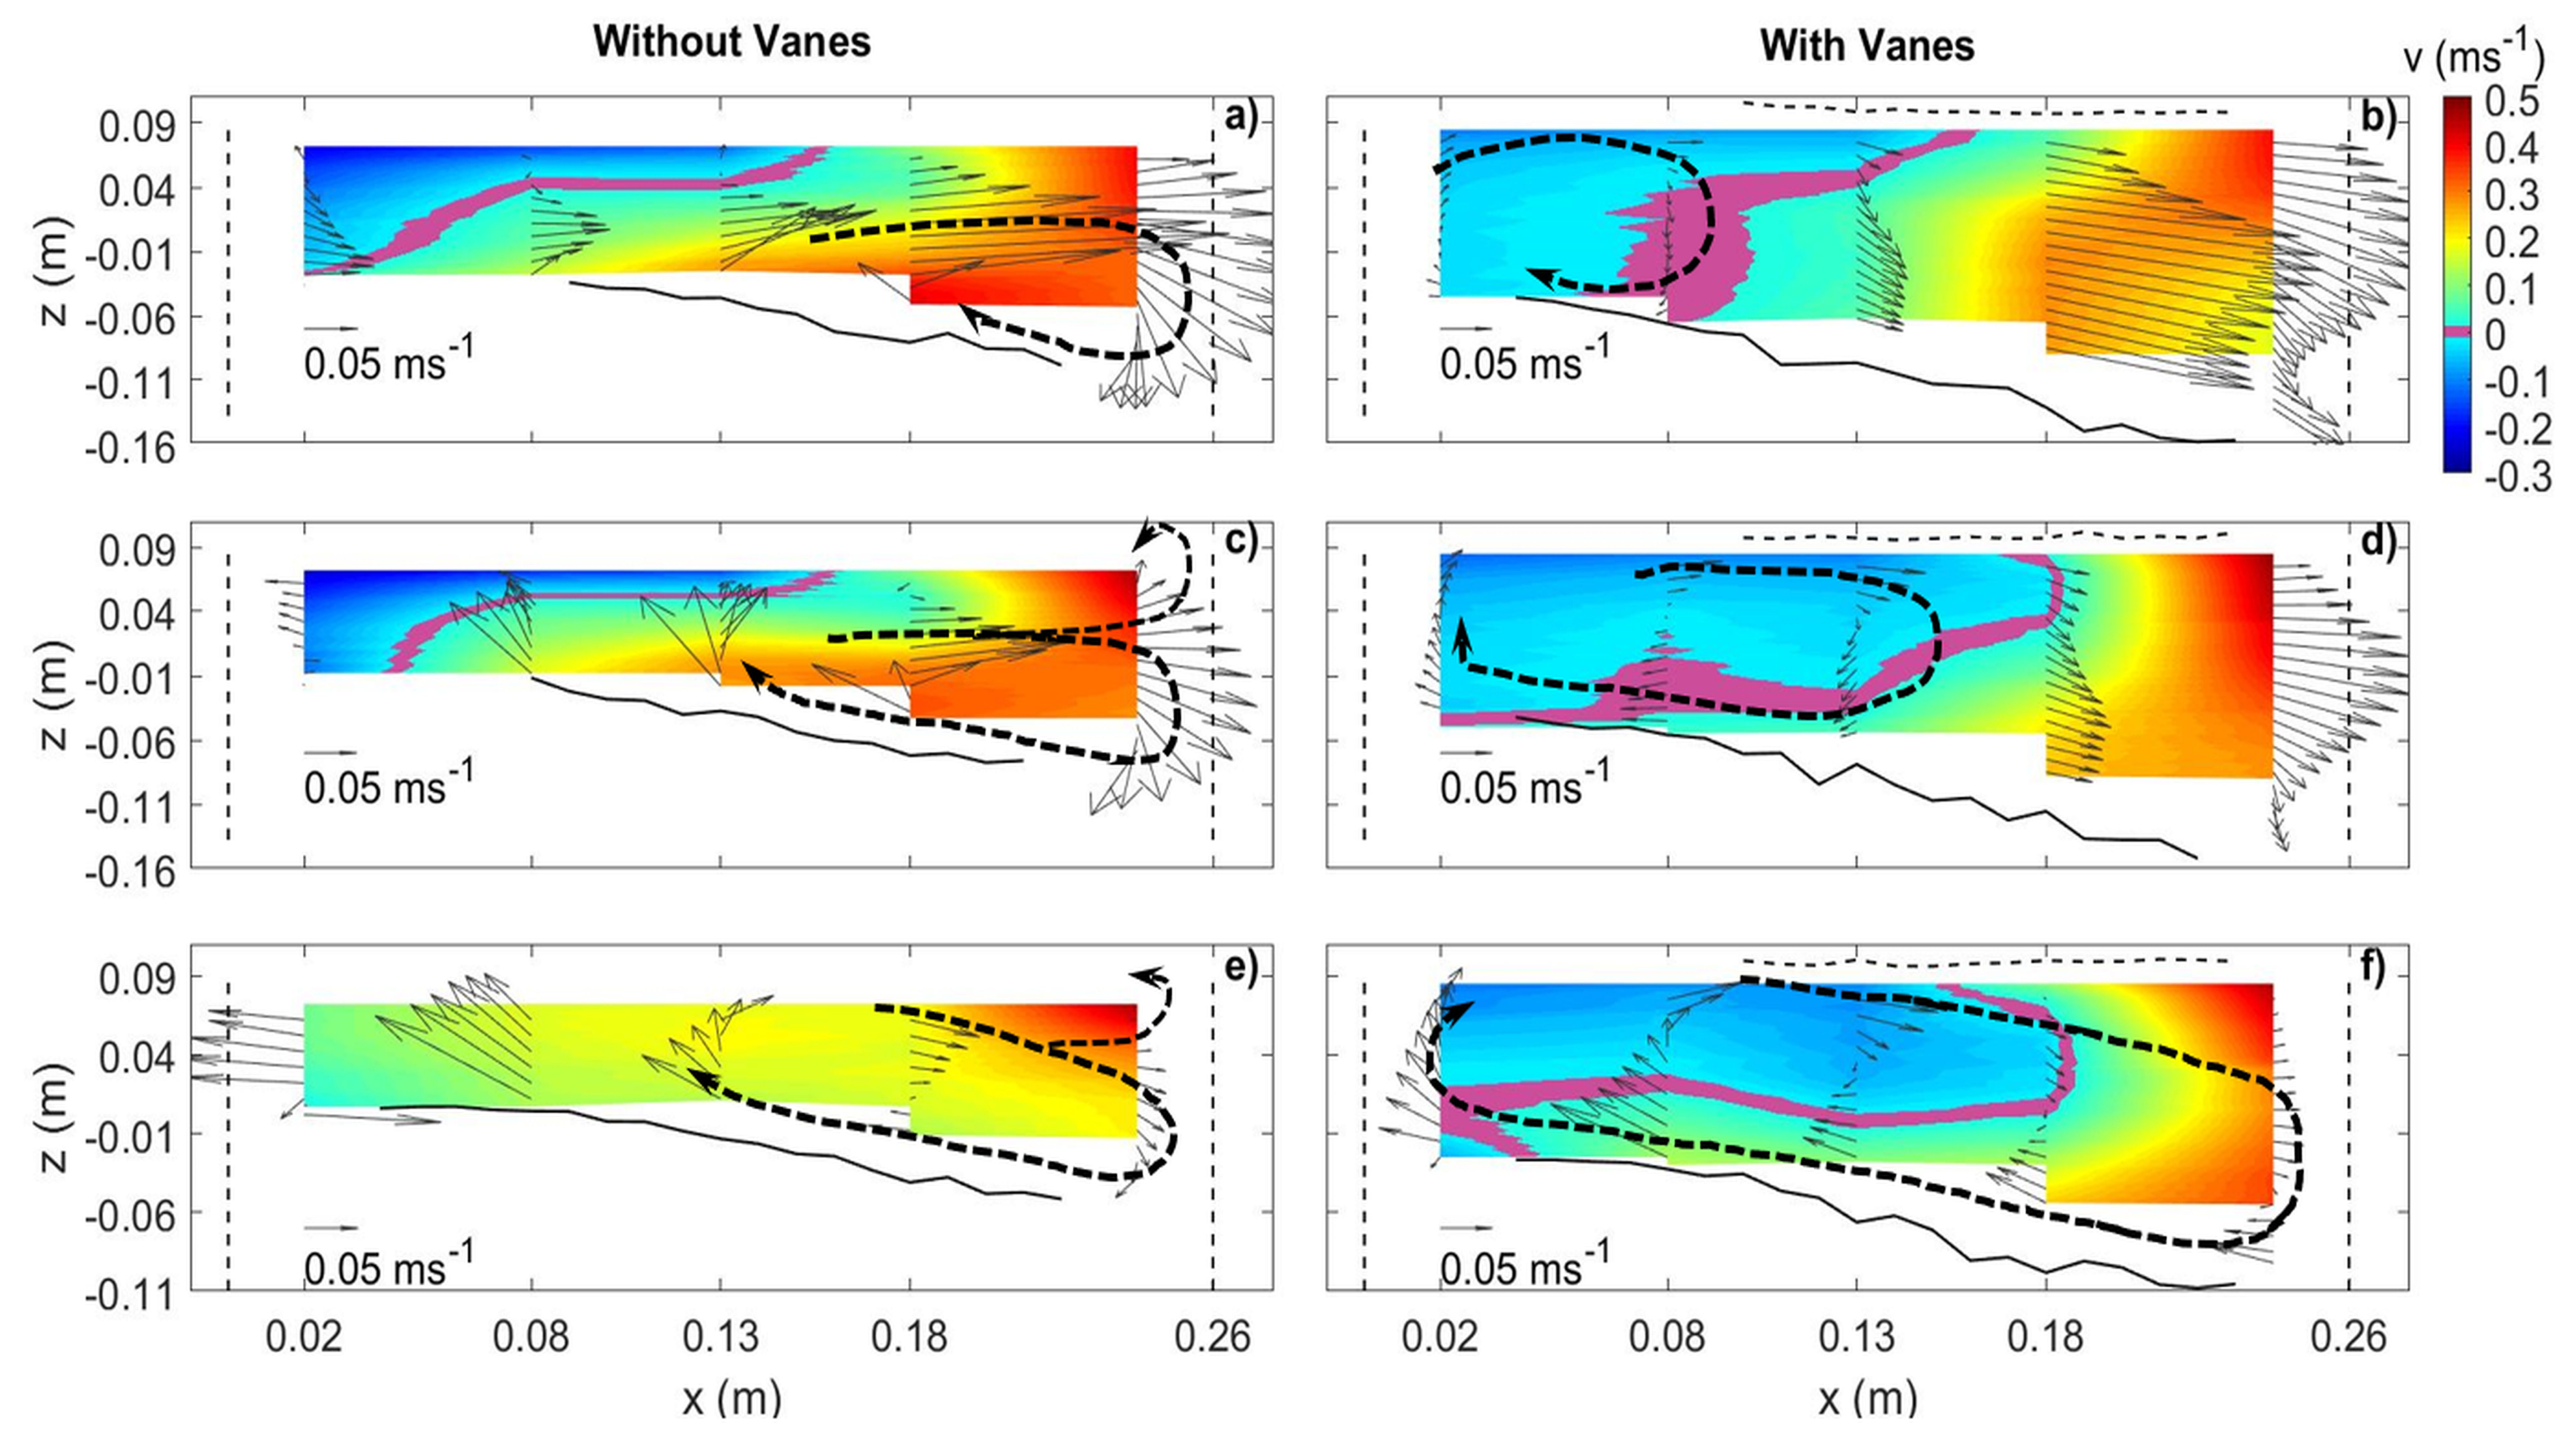
An important feature depicted in Figure 14 deletedwasis the presence of the diversion vortex (Figure 14a,c,e) in the NV case, as already reported in relation to the main channel flow close to the diversion entrance (Figure 11a), confirming the proposal of Herrero et al. [8]. Though decaying with y, this vortex continued all along the outer wall of the measuring reach within the diversion channel, reflecting also the fact that the upper flow layer hit that wall (Figure 14c,e), leading to a small bow wave at the free surface as observed by Ramamurthy et al. [21], a well-defined downflow close to the same wall and to the concomitant vortex. Contrastingly, in the VF case, a vortical flow started close to the upstream corner of the diversion ( m, Figure 14b) which conveyed water back to the main channel, since it displayed negative values of v in its core. This backwards movement reflected into negative values of in this zone. The same vortex was clearer at m where it occupied the core of the cross-section but did not interact with the outer wall of the diversion; it expanded further downstream, reaching that wall only at m. From there on, a large portion of this vortical flow already contributed to the conveyance of water into the diversion, close to its outer wall as well as under the separated flow (Figure 14f). Figure 14d,f also confirms that the rising flow occurred further downstream and closer to the inner wall of the diversion channel in the VF case, whereas it did not appear close to the same wall in the NV case (Figure 14a,c,e), as mentioned above.
From these observations, it can be concluded that, differently from the NV case, the vane-field inhibited the formation of the diversion vortex within the main channel close upstream of the diversion entrance, i.e., for y values smaller than 0.68 m. In the absence of this vortical structure at the diversion entrance, the movement of sediment into the diversion decreased in the VF case and it can be postulated that the corresponding equilibrium bed morphology was settled for flow conditions closer to the threshold for the initiation of motion. Consequently (Melville and Coleman [22]), the scour trench that developed along the diversion outer wall was deeper than in the NV case. In this case, part of the stream power was spent in transporting a greater amount of sediment into the diversion by the vortex, slightly reducing the scour of the bed.
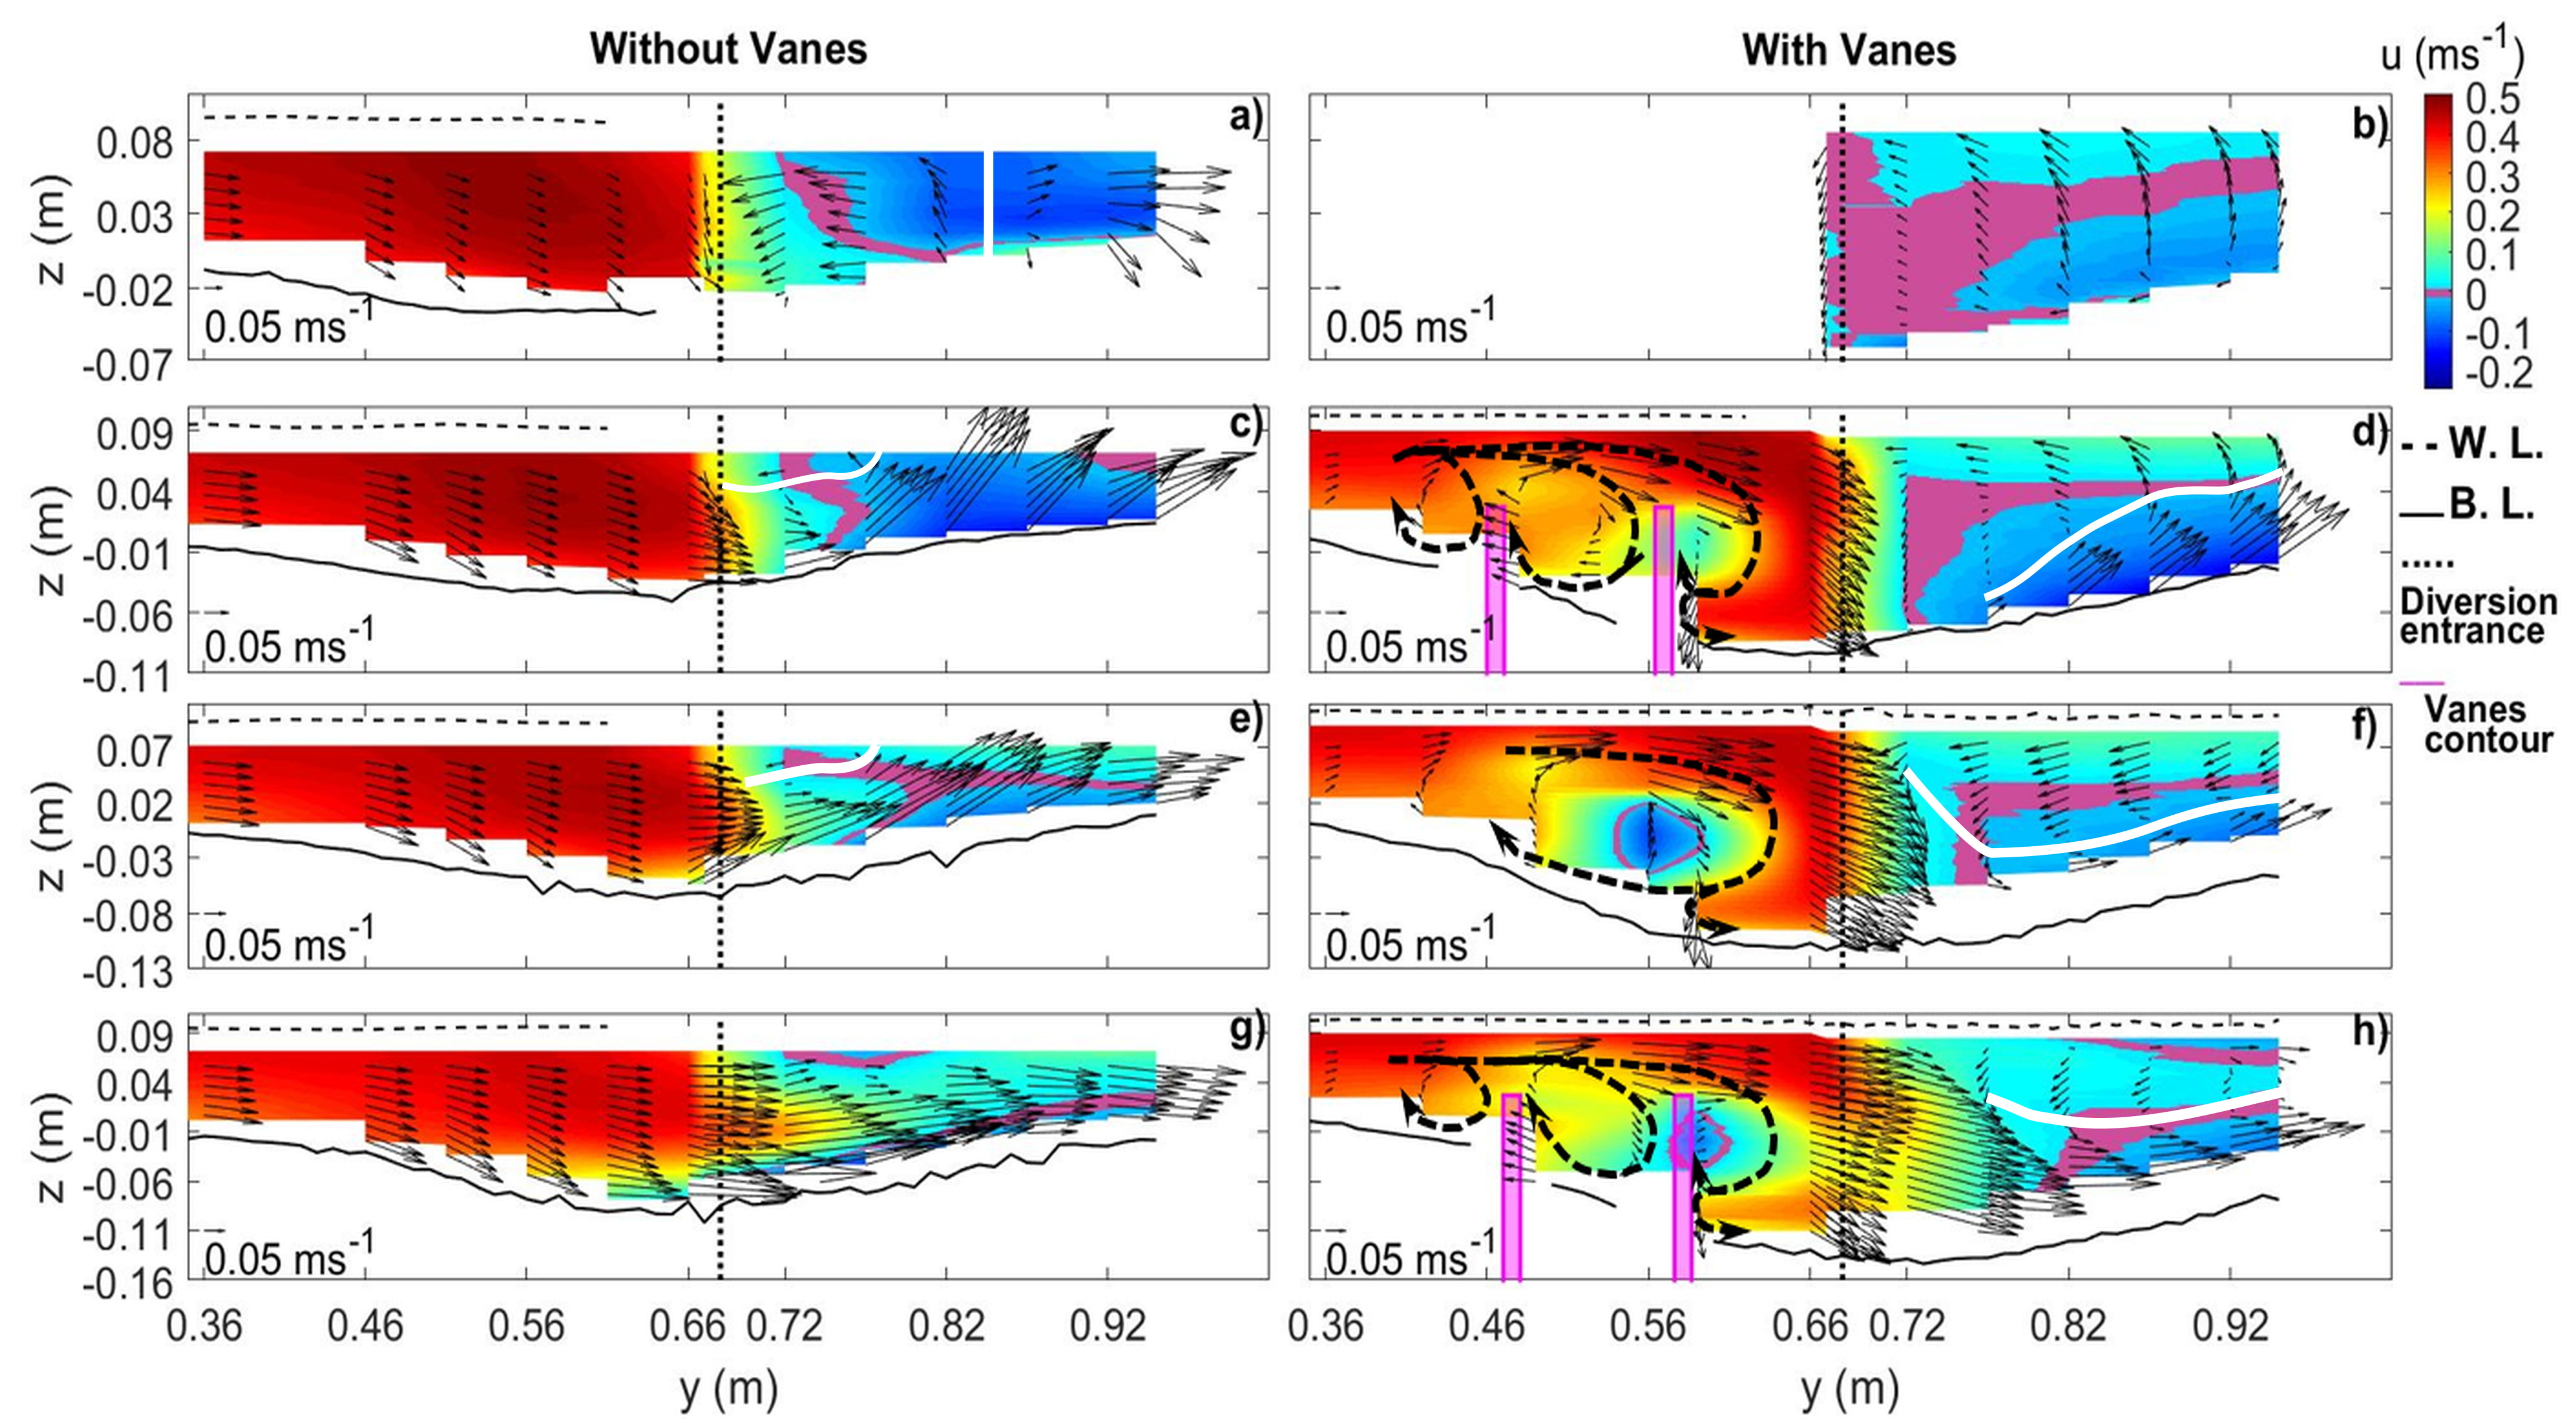
Two major differences between the NV and the VF cases are made clear in Figure 15. The first concerns the slightly plunging flow originated from above the vanes in the latter case at m, the exception occurring at m. This flow continued along the diversion channel as a form of a jet moving underneath the separation zone at m (Figure 15d,f,h; see also Figure 14b,d) and climbing the slope of the bed. The second difference refers to the flow structure in the main channel in front of the diversion entrance. It is clear that no main channel vortex existed in the NV case, in front of the diversion entrance, meaning that it started further downstream in the main channel, close to the bed of the inner main channel wall (see Section 3.2.3). In the VF case, a distinct vortex was observed at m (Figure 15f). The core of this vortex depicted very small or negative u velocity components and it interacted with the vanes at cross-sections m, shifting the low u velocity zones towards the downstream face of the vane closest to the diversion entrance. There, a well-defined downflow also occurred (Figure 15d,f,h). Differently from the NV case, this vortical structure started in the approach flow zone, where it was already visible at cross-section m (Figure 8f). The same as in that zone, it also continued all along the flow deflection zone (Figure 12b,d,f), as suggested by Barkdoll et al. [6] and Odgaard and Wang [14], contributing to further excavation of the bed.
3.2.5. Flow Recovery Zone ( 0.70 m)
It is clear that the main channel vortex still existed in both cases (NV and VF) at cross-sections m (Figure 16a–d), i.e., at eight to ten times the flow depth downstream of the diversion as suggested by Herrero et al. [8] and Alomari et al. [9]. The velocity components pointed towards the inner wall and slightly downwards in the upper part of the flow, whereas they pointed towards the outer wall and slightly upwards near the bed. In the VF case (Figure 16b,d), the v velocity component was stronger close to the bed than in the NV case. This seems to be related to the bed level rise in the former. Indeed, Figure 9b shows that downstream of the vane-field, at 0.70 m 1.00 m, the flow was slightly deflected outwards near the bed, due to the existence of the sand deposit shown in Figure 6, unlike what happens in the NV case, where the flow was predominantly directed downstream with ms−1 (Figure 9a).
Moving downstream to m, the velocity component u increased significantly along the cross-section, in the NV case (Figure 16e), and in the inner half channel, in the VF case (Figure 16f), reflecting and shaping a more regular bed morphology, with no scour trenches anymore. Still, at m in the NV case, the velocity components pointed towards the main channels’ outer wall and downward, at all vertical profiles, except at the one close to the inner wall ( m), where they were directed towards that wall, integrating a small secondary cell there. Differently, at the same cross-section of the VF case (Figure 16f), the vectors pointed mainly to the inner wall, except on top of the deposit found at m, where another secondary cell was also visible.
For the cross-section defined at m, the streamwise flow velocity u became even more uniform and the influence of the diversion decayed strongly as expected. In the NV case, the secondary cells changed their sizes (Figure 16g), meaning that the secondary cell adjacent to the inner wall widened from less than 0.10 m (at m) to almost 0.20 m (at m). This secondary cell was still incipient in the VF case (Figure 16h), where the v velocity component pointed to the inner wall at all measuring verticals. It seems reasonable to conclude that, irrespective of the case, the influence of the flow diversion vanished slightly further downstream, meaning that it was present for more than thirty times the flow depth. This length of the recovery reach was of the same order of magnitude as in the channel confluences reported by Bombar and Cardoso [18].
3.3. Turbulent Kinetic Energy
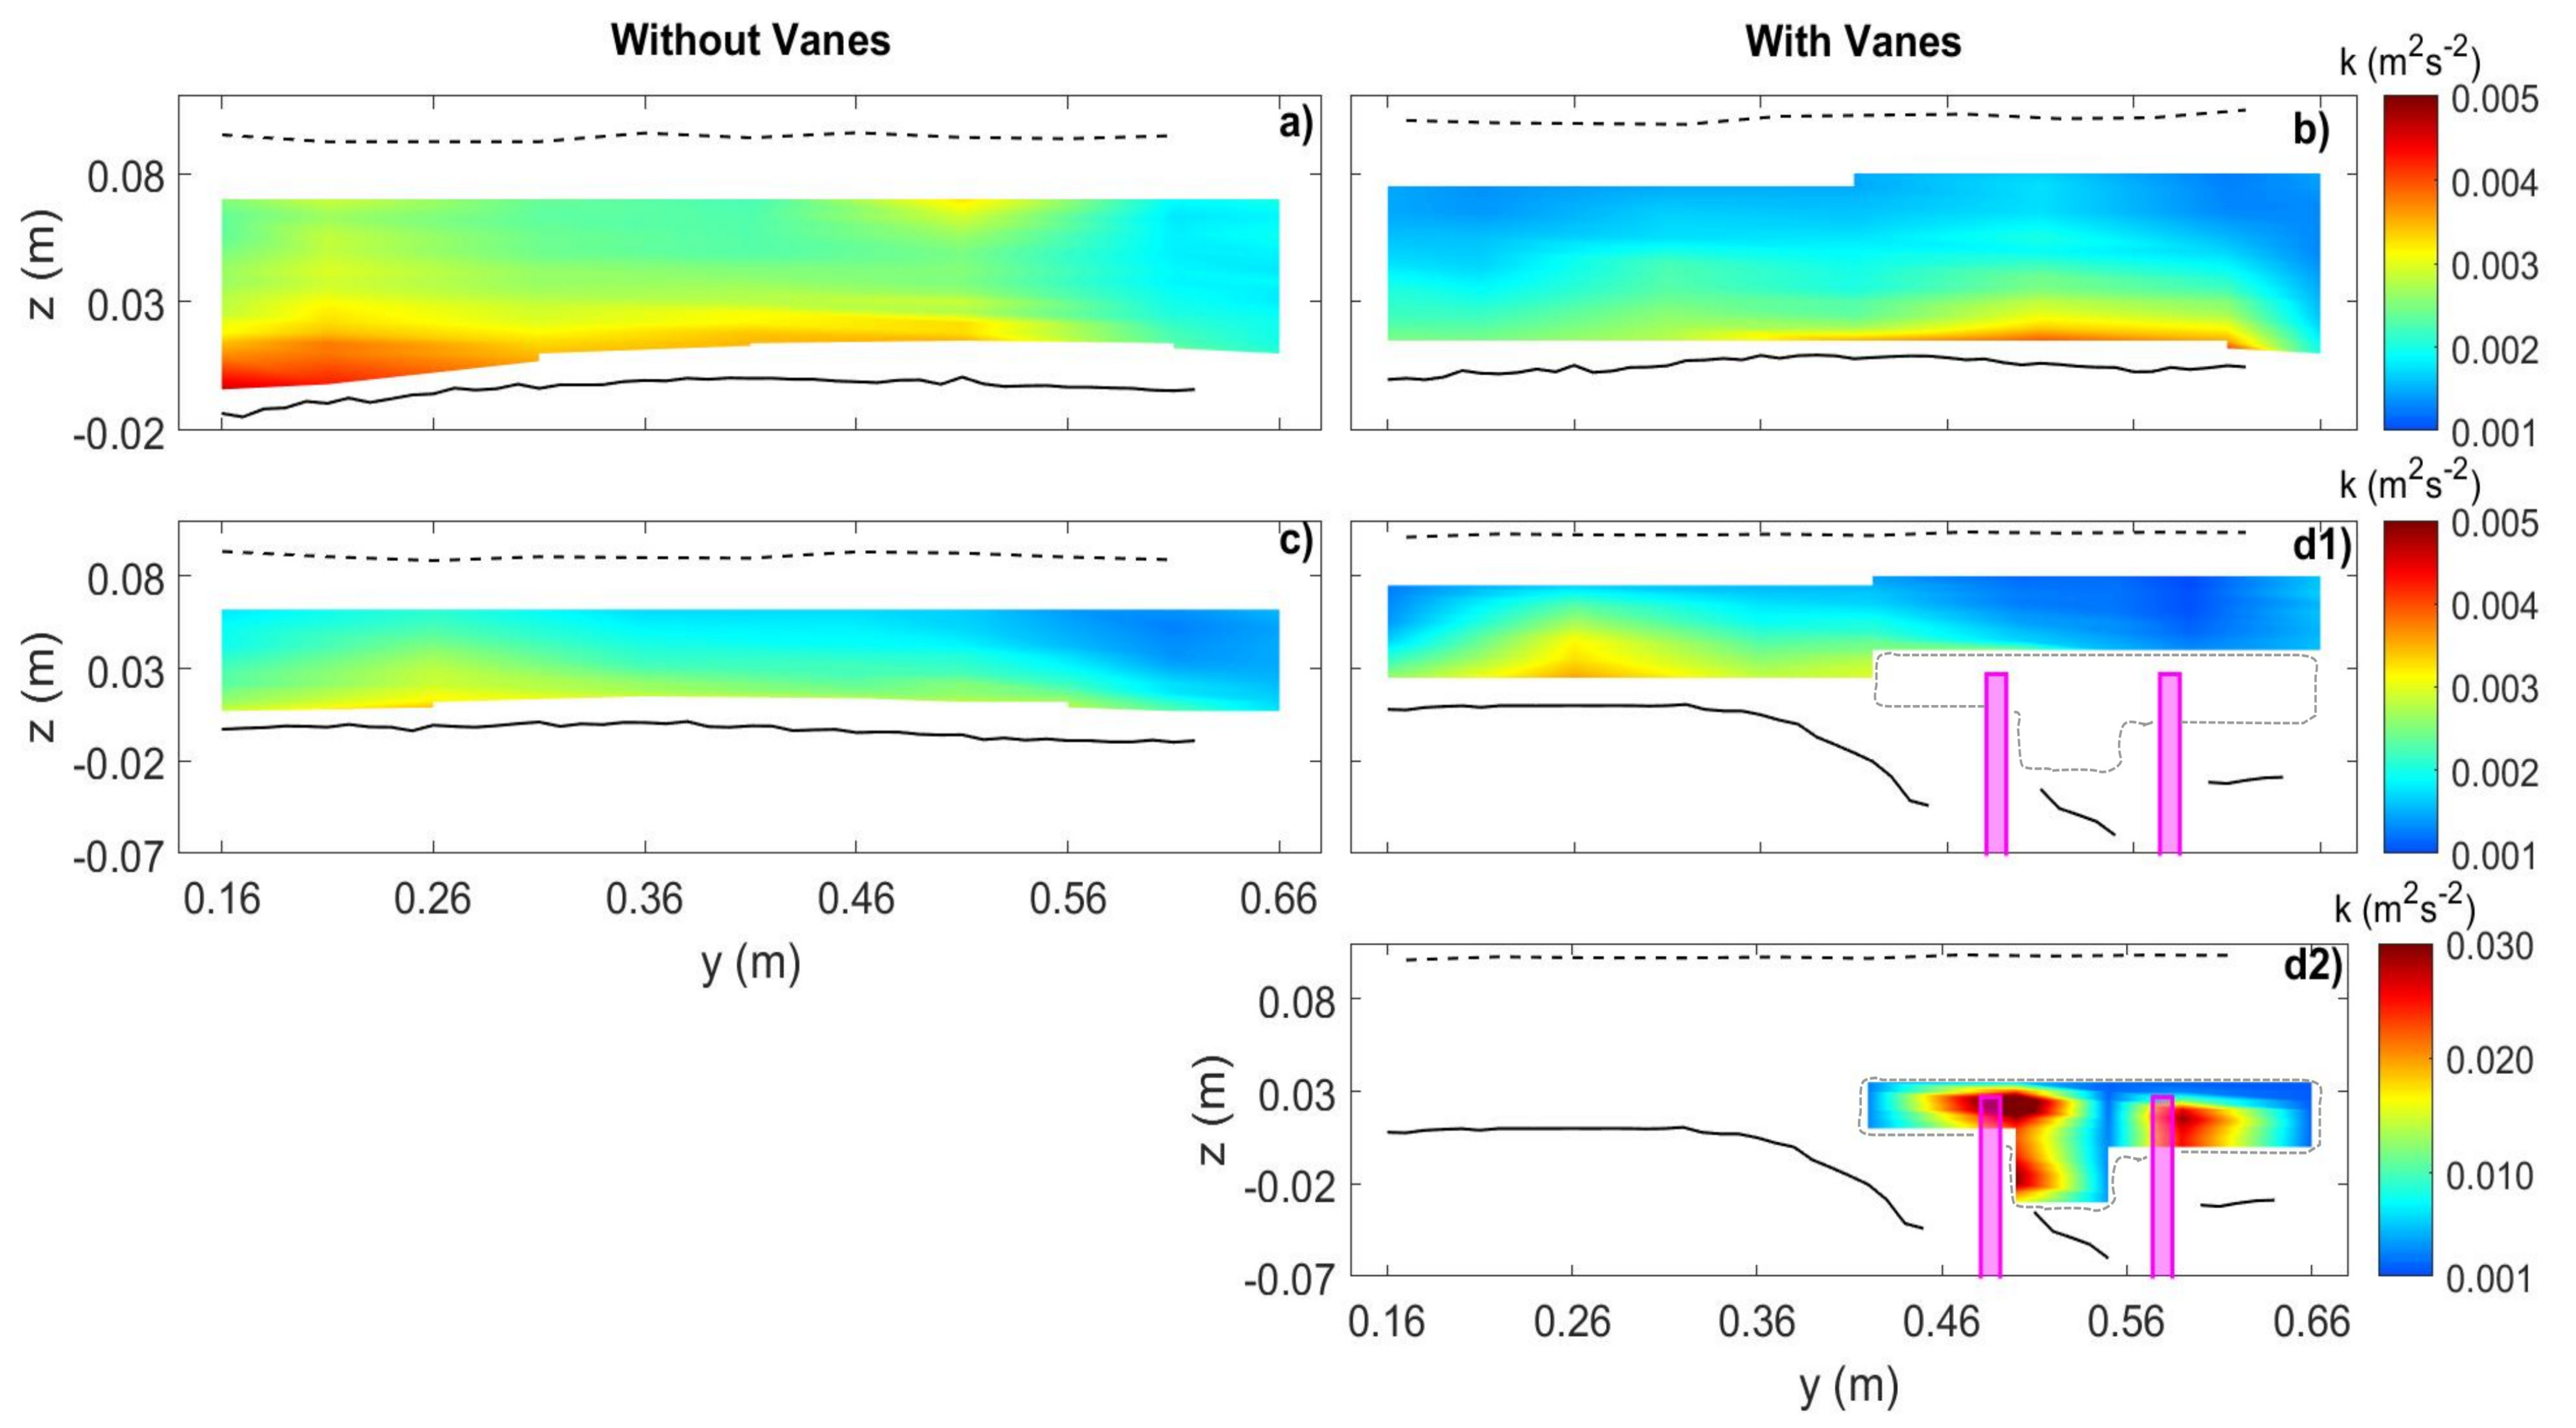
The turbulent kinetic energy, k, was stronger close to the bed at the most upstream cross-sections for both cases (Figure 17a,b), decreasing towards the free surface, which is the typical behavior of self-similar open-channel flows (Nezu and Nakagawa [23]). Two cores of maxima k were observed close to the bed and, respectively, near the outer and inner walls of the main channel, for the NV and the VF cases (Figure 17a,b). These cores coincided with the locations where secondary currents were more pronounced (see Figure 8a,b). More importantly, two other cores of much higher energy were observed slightly below the top and along the downstream face of the vanes (Figure 17(d2)) in the VF experiment. It should be noted here that two plots with different color scales were created for m in the VF case (Figure 17(d1,d2)) to account for the much higher turbulence intensity observed in this cross-section. The cores, depicted in Figure 17(d2), are the imprint of the tip vortices created around the vanes (Figure 8f), as suggested by Barkdoll et al. [6]. It can be postulated, in accordance with Sharma and Ahmad [24], that, as the water participated in the vortical motion towards the surrounding flowing water, it strained the neighboring flow layers. The generation of excessive strain in these layers resulted in enhanced Reynolds stresses, which in turn enhanced the turbulent fluctuations and the turbulent kinetic energy.
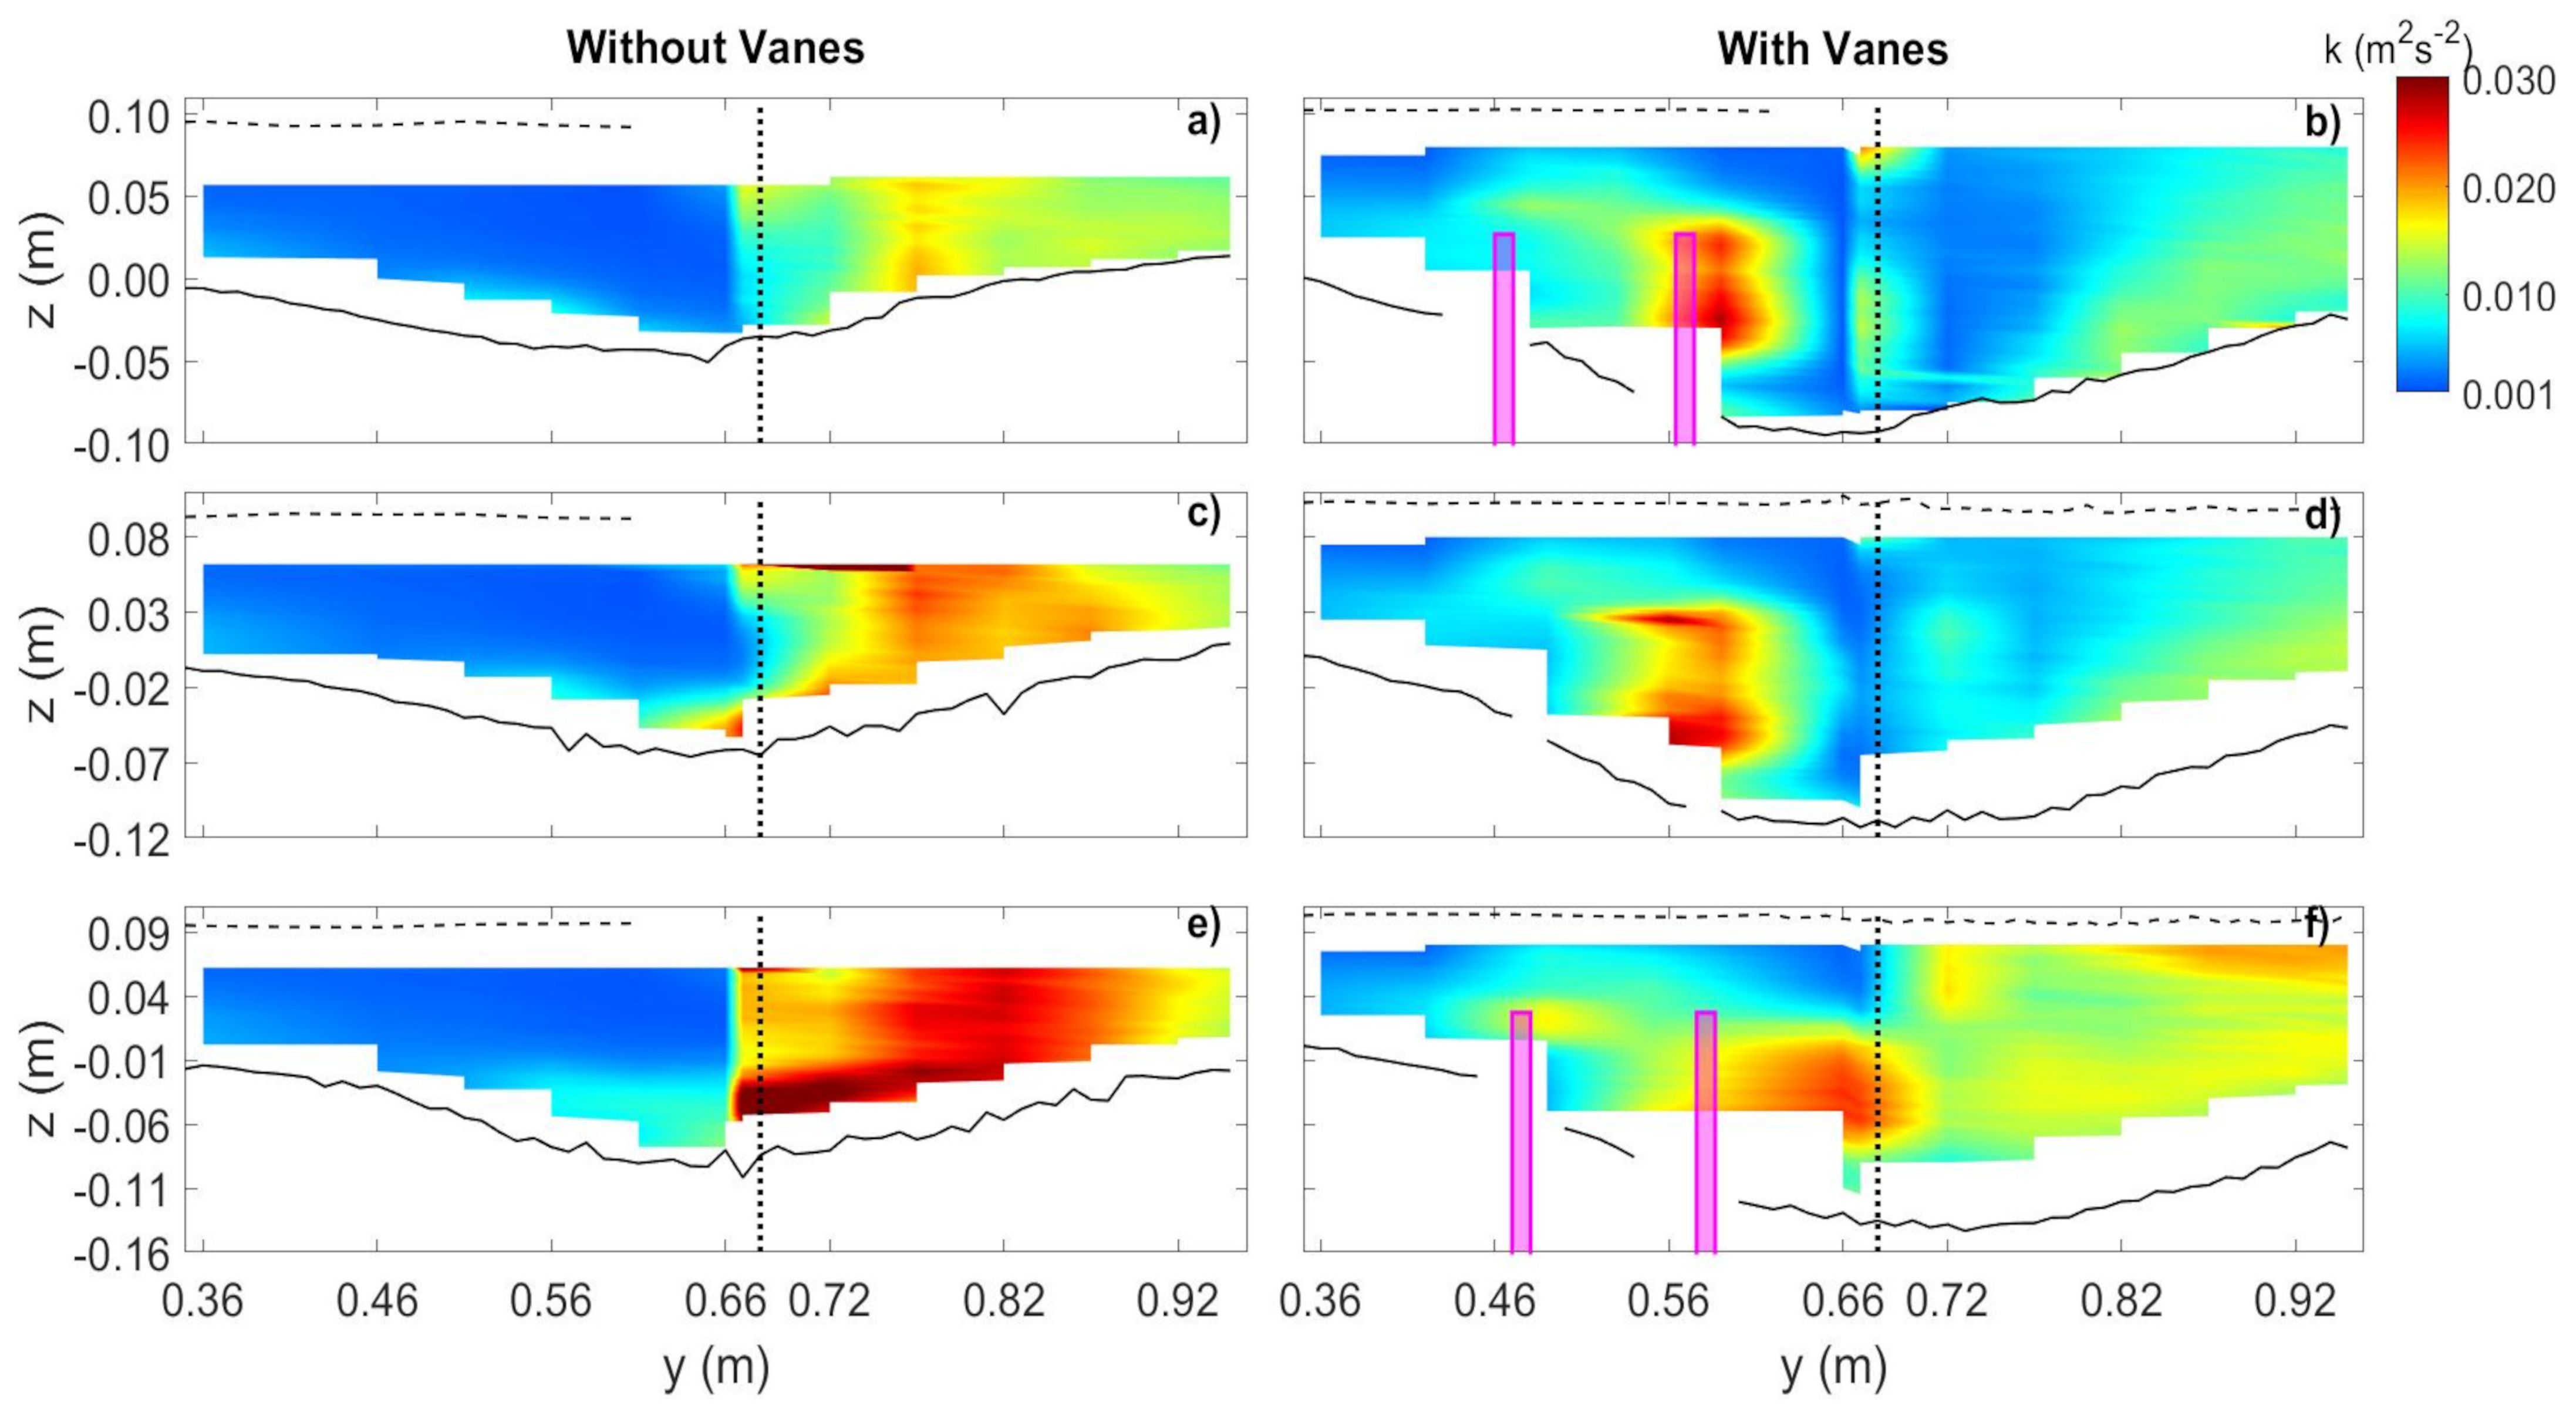
The turbulent kinetic energy was higher inside the diversion than in the main channel, at m (Figure 18a,c,e) in the NV case, increasing from the diversion inner wall towards the diversion axis. At cross-sections m, the maxima k were observed where the rising flow was also identified (Figure 13a,c and Figure 15c,e). The same occurred at cross-section m but, in this case, the turbulent kinetic energy was slightly higher close to the bed, due to the straining action of the diversion vortex (Figure 18c), as implicitly suggested by Sharma and Ahmad [24]. The enhanced turbulent kinetic energy promoted higher mobility of the sediment grains, possibly leading to their transportation in suspension. In contrast, for the VF case, k was higher along the downstream-looking face of the vanes closest to the diversion entrance (Figure 18a,f) as well as in the core of the vortex identified in Figure 15f (Figure 18d). Close to the vanes, the higher turbulent kinetic energy was generated by the tip vortices and the downflow, whereas the corresponding high core observed at cross-section m (Figure 18d) reflected the presence of the vortex originated at the upstream vanes and prevailing therein. The complex vortical structures whose axes were mostly aligned with the main channel, were responsible for promoting the movement of grains downstream close to the bed, preventing them from entering into the diversion (Barkdoll et al. [6]). Yet, those structures may also have suspended other bed particles making them available to be diverted into the diversion channel by the upper layers of the diverted flow. The balance between these two contributions was crucial for the efficiency of the vane-field as a sediment control structure. This balance must have been favorable in the VF experiment as compared with the amount of sand carried from the main channel by the diversion vortex observed in the NV case. The comparatively lower values of k observed within the diversion in the VF experiment, at m, were the consequence of the low flow velocities occurring within the separation zone. It is to be noted that the turbulent kinetic energy also increased downstream, from m (Figure 18b) to m (Figure 18f), as in the NV experiment.
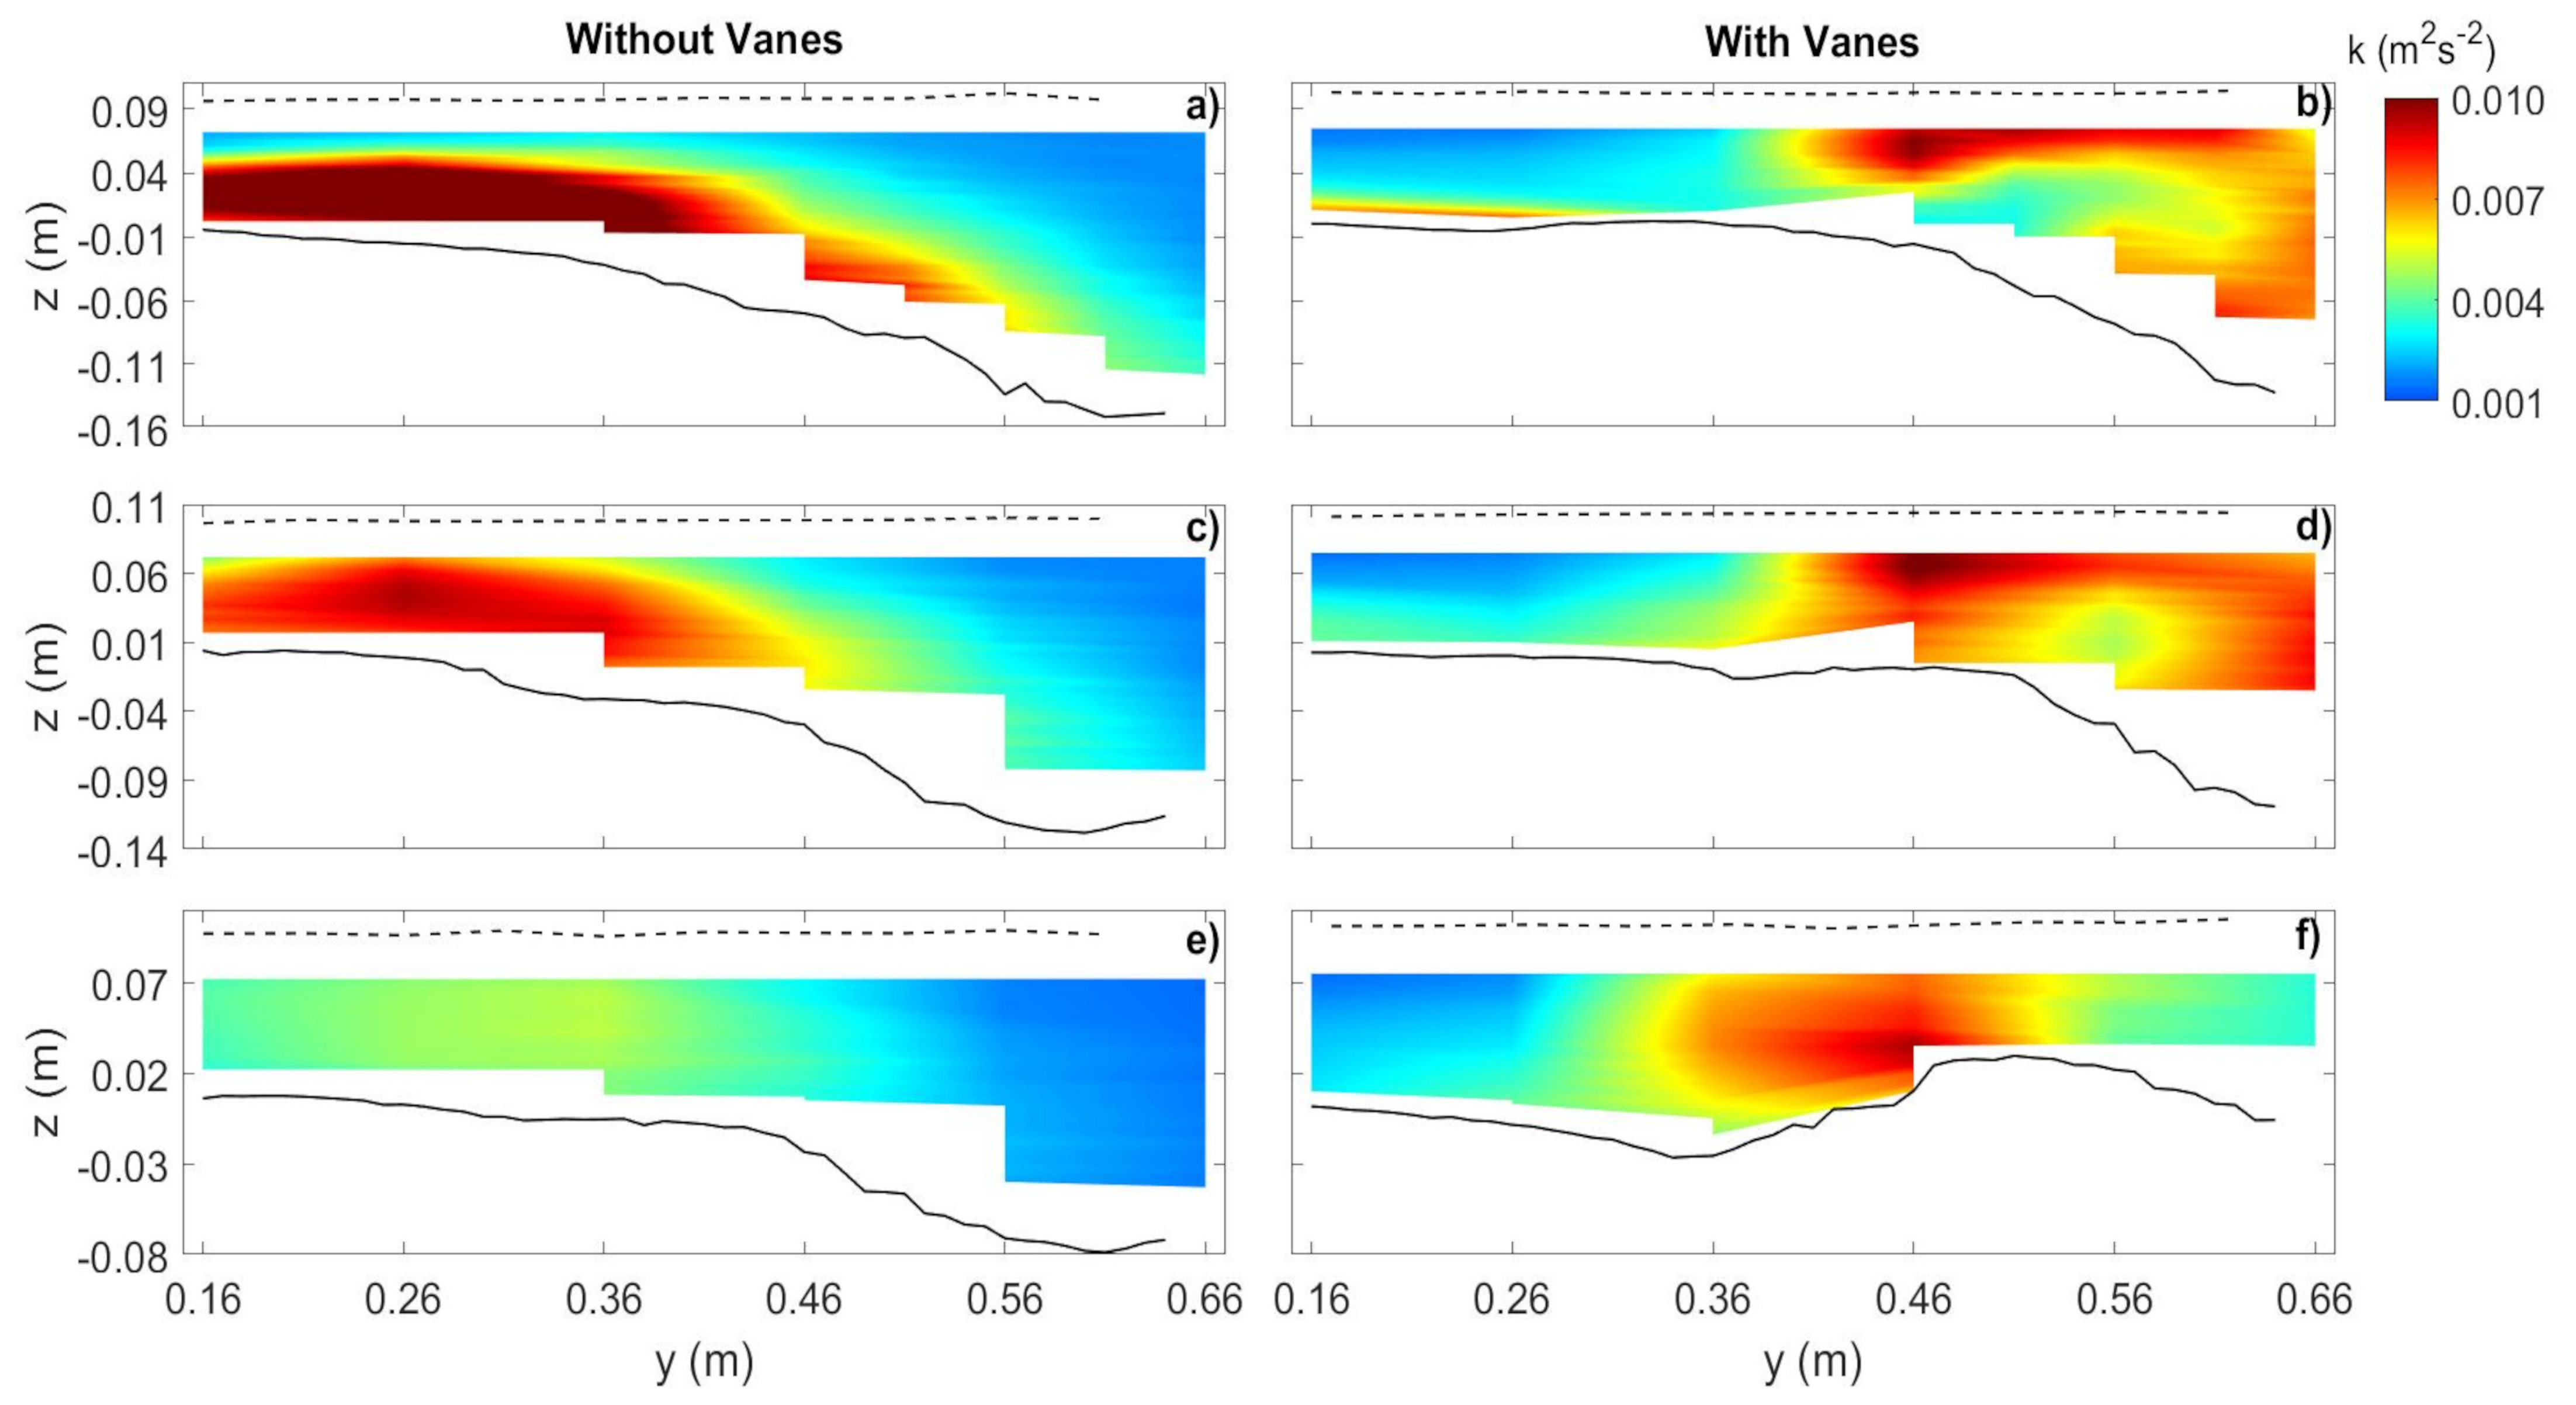
Downstream of the diversion channel, high values of k were observed in the NV case between the outer wall and the middle of the channel. This region narrowed and thickened to the free surface from m (Figure 19a) until m (Figure 19c). At these cross-sections, the crosswise velocity component was significant (Figure 12e and Figure 16a), reaching ≈0.05 ms−1 and originating the strain responsible for the increase of the turbulent kinetic energy. This energy decreased further downstream, namely at m (Figure 19e), approaching the values found in the approach flow reach, i.e., at m (Figure 17a).
In the VF case, the zones of higher turbulent kinetic energy kept their link to the main channel vortex generated upstream. In the core of this vortex, at m (Figure 19b), the values of k were comparatively modest due to the tendency for flow stagnation along x (Figure 9b). This decrease was less evident at m (Figure 19d) as u slightly increased. The core of higher k values moved towards the centre of the channel at m (Figure 19f) due to the tendency to flow separation underneath the crosswise flow observed at the outer slope of the sand deposit created downstream of the vanes in the VF experiment (Figure 6b).
4. Conclusions
The most important finding of this study was that the vane-field inhibited the development of the diversion vortex, which originated in the main channel in the absence of vanes. In the presence of the vane-field, this vortex only started inside the diversion, meaning that it could not directly contribute to winnowing sediment from the main channel. This partly explains why the amount of sediment entering the diversion decreased by ≈26% in the equilibrium phase of the experiment performed with the vanes.
Other important conclusions can be summarized as follows:
- (i)
- The vanes altered their near velocity field by creating tip vortices around them. The combination of the vane-induced circulation and the streamwise velocity caused a longitudinal vortex all along the vane-field, right from the most upstream vanes, which persisted downstream of the diversion, for a distance of between eight to ten times the flow depth.
- (ii)
- The longitudinal vortex was not identified in front of the diversion entrance in the absence of the vanes. In this case, the main channel vortex initiated downstream of the diversion due to the impact of the deflected flow on the inner lateral wall of the main channel.
- (iii)
- The flow deflection towards the diversion channel was enhanced above the vanes in the presence of the vane-field.
- (iv)
- The scoured trench inside the diversion was slightly deeper in the presence of vanes, whereas the bed material excavated along the vane-field originated a sediment deposition further downstream.
- (v)
- The vanes also originated downflows along their downstream faces which caused scour in the experiment with vanes.
- (vi)
- The vanes increased the dimensions of the separation zone identified inside the diversion channel relative to the vanes-free case, slightly decreasing the conveyance at equal flow levels.
- (vii)
- The increase of the size of the separation zone in the case of vane-field was accompanied by the decrease of the velocity magnitude as well as of the flow turbulent kinetic energy inside that zone.
- (viii)
- A rising flow zone, characterized by high turbulent kinetic energy, was observed, supposedly for the first time, side by side, underneath or immediately downstream of the separation zone, in both experiments, though it was clearly more pronounced in the experiment without vanes.
In the presence of vanes, the longitudinal vortex created along the vane-field clearly enhanced the turbulent kinetic energy in its core and in its vicinity, as compared to the no vanes case. This increase has the potential to increase the local suspended load. Part of this load may have been winnowed downstream by the vortex, adding to the enhanced bedload, but some suspended grains may also have been made available to be drawn into the diversion channel by the upper layers of the diverted flow. The balance of these contributions, together with the reduction of the diverted sediment due to the inhibition of the diversion vortex within the main channel, can be expected to determine the desilting efficiency of vane-fields. This conceptualization deserves to be investigated further in the future.
Author Contributions
Conceptualization, A.H.C.; Data curation, J.B.; Formal analysis, J.B.; Investigation, J.B., G.B. and A.H.C.; Resources, A.H.C.; Supervision, A.H.C.; Visualization, J.B.; Writing—original draft, A.H.C.; Writing—review & editing, J.B., E.A., G.B. and A.H.C. All authors have read and agreed to the published version of the manuscript.
Funding
The authors thank the Portuguese Foundation for Science and Technology (FCT) for the financial support with a full Ph.D. scholarship and through the project MIXFLUV-PTDC/ECI/31771/2017: mixing layers in fluvial systems.
Acknowledgments
The code used for the data analysis was adapted from the one of Ana Quaresma and Olga Canelas.
Conflicts of Interest
The authors declare no conflict of interest.
References
- Bertoldi, W.; Miori, S.; Salvaro, M.; Zanoni, L.; Tubino, M. Morphological description of river bifurcations in gravel-bed braided networks. In Proceedings of the International Conference on Fluvial Hydraulics, River Flow 2006, Lisbon, Portugal, 6–8 September 2006; Ferreira, R.M.L., Alves, E., Leal, J., Cardoso, A.H., Eds.; Taylor & Francis: London, UK, 2006; pp. 1311–1318. [Google Scholar]
- Nakato, T.; Kennedy, J.F. Pump-station intake-shoaling control with submerged vanes. J. Hydraul. Eng. 1990, 116, 119–128. [Google Scholar] [CrossRef]
- Sruthi, T.K.; Ranjith, K.B.; Chandra, V. Control of sediment entry into an intake canal by using submerged vanes. In Proceedings of the International Conference on Applied Physics and Engineering, Penang, Malaysia, 2–3 November 2016; Mohd, M.J., Mohd, A., Mohd, N.A., Eds.; American Institute of Physics: Melville, NY, USA, 2017. [Google Scholar]
- Wang, Y.; Odgaard, A.J.; Melville, B.W.; Jain, S.C. Sediment Control at Water Intakes. J. Hydraul. Eng. 1996, 122, 353–356. [Google Scholar] [CrossRef]
- Odgaard, A.J.; Spoljaric, A. Sediment Control by Submerged Vanes. J. Hydraul. Eng. 1986, 112, 1164–1180. [Google Scholar] [CrossRef]
- Barkdoll, B.D.; Ettema, R.; Odgaard, A.J. Sediment control at lateral diversions: Limits and enhancements to vane use. J. Hydraul. Eng. 1999, 125, 862–870. [Google Scholar] [CrossRef]
- Odgaard, A.J.; Kennedy, J.F. River-Bend Bank Protection by Submerged Vanes. J. Hydraul. Eng. 1983, 109, 1161–1173. [Google Scholar] [CrossRef]
- Herrero, A.; Bateman, A.; Medina, V. Water flow and sediment transport in a 90∘ channel diversion: An experimental study. J. Hydraul. Res. 2015, 53, 253–263. [Google Scholar] [CrossRef]
- Alomari, N.K.; Yusuf, B.; Mohammad, T.A.; Ghazalib, A.H. Experimental investigation of scour at a channel junctions of different diversion angles and bed width ratios. Catena 2018, 166, 10–20. [Google Scholar]
- Karami, H.; Farzin, S.; Sadrabadi, M.T.; Moazeni, H. Simulation of flow pattern at rectangular lateral intake with different dike and submerged vane scenarios. Water Sci. Eng. 2017, 10, 246–255. [Google Scholar] [CrossRef]
- Sarhadi, A.; Jabbari, E. Investigating Effect of Different Parameters of the Submerged Vanes on the Lateral Intake Discharge Located in the 180 Degree Bend Using the Numerical Model. Civ. Eng. J. 2017, 3, 1176–1187. [Google Scholar] [CrossRef] [Green Version]
- Michell, F.; Ettema, R.; Muste, M. Case Study: Sediment Control at Water Intake for Large Thermal-Power Station on a Small River. J. Hydraul. Eng. 2006, 132, 440–449. [Google Scholar] [CrossRef]
- Nakato, T.; Ogden, F.L. Sediment Control at Water Intakes along Sand-Bed Rivers. J. Hydraul. Eng. 1998, 124, 589–596. [Google Scholar] [CrossRef]
- Odgaard, A.J.; Wang, Y. Sediment Management with Submerged Vanes. II: Applications. J. Hydraul. Eng. 1991, 117, 284–302. [Google Scholar] [CrossRef]
- Firozjae, M.R.; Neyshabouri, S.A.; Sola, S.A.; Mohajeri, S.H. Numerical Simulation on the Performance Improvement of a Lateral Intake Using Submerged Vanes. Iran. J. Sci. Technol. Trans. Civ. Eng. 2019, 43, 167–177. [Google Scholar] [CrossRef]
- Moghadam, M.K.; Amini, A.; Keshavarzi, A. Intake design attributes and submerged vanes effects on sedimentation and shear stress. Water Environ. J. 2020, 4, 374–380. [Google Scholar] [CrossRef]
- Guillén-Ludeña, S.; Franca, M.; Cardoso, A.H.; Schleiss, A.J. Evolution of the hydromorphodynamics of mountain river confluences for varying discharge ratios and junction angles. Geomorphology 2015, 255, 1–15. [Google Scholar] [CrossRef]
- Bombar, G.; Cardoso, A.H. Effect of the sediment discharge on the equilibrium bed morphology of movable bed open-channel confluences. Geomorphology 2020, 367, 107329. [Google Scholar] [CrossRef]
- Chanson, H. Acoustic doppler velocimetry (adv) in the field and in laboratory: Practical experiences. In International Meeting on Measurements and Hydraulics of Sewers, Hydraulic Model Report No. CH70/08; Division of Civil Engineering, The University of Queensland: Brisbane, Australia, 2008. [Google Scholar]
- Goring, D.; Nikora, V. Despiking acoustic doppler velocimeter data. J. Hydraul. Eng. 2002, 128, 117–126. [Google Scholar] [CrossRef] [Green Version]
- Ramamurthy, A.S.; Qu, J.; Vo, D. Numerical and experimental study of dividing open-channel flows. J. Hydraul. Eng. 2007, 133, 1135–1144. [Google Scholar] [CrossRef]
- Melville, B.W.; Coleman, S.E. Bridge Scour; Water Resources Publications, LLC: Highlands Ranch, CO, USA, 2000. [Google Scholar]
- Nezu, I.; Nakagawa, H. Turbulence in Open-Channel Flows; IAHR Monograph Series; Balkema: Rotterdam, The Netherlands, 1993. [Google Scholar]
- Sharma, H.; Ahmad, Z. Turbulence characteristics of flow past submerged vanes. Int. J. Sediment Res. 2020, 35, 42–56. [Google Scholar] [CrossRef]
Figure 1.
Lateral diversion: (a) plan view. (b) vane submergence.

Figure 2.
Schematic plan of the channels (dimensions in meter): (a) broad plain view. (b) detail of the vane-field. (c) the origin of the coordinate system.
Figure 2.
Schematic plan of the channels (dimensions in meter): (a) broad plain view. (b) detail of the vane-field. (c) the origin of the coordinate system.

Figure 3.
(a) robot. (b) mini-echo-sounder, ultrasonic sensor and side-looking Acoustic Doppler Velocimeter (ADV) (all probes out of service).
Figure 3.
(a) robot. (b) mini-echo-sounder, ultrasonic sensor and side-looking Acoustic Doppler Velocimeter (ADV) (all probes out of service).

Figure 4.
Plan-view of the grid of measured points in the VF experiment (lengths in meter).

Figure 5.
Sediment amounts collected along time: (a) in the NV experiment. (b) in the VF experiment.
Figure 5.
Sediment amounts collected along time: (a) in the NV experiment. (b) in the VF experiment.

Figure 6.
Bed-topography at equilibrium represented by contour lines: (a) in the NV experiment ( 12 h). (b) in the VF experiment ( 13:30 h).
Figure 6.
Bed-topography at equilibrium represented by contour lines: (a) in the NV experiment ( 12 h). (b) in the VF experiment ( 13:30 h).

Figure 7.
Schematic of the flow hydrodynamics at a 90° diversion.

Figure 8.
Velocity u (ms−1) as color scale and direction and magnitude of the velocity components (ms−1) as vector arrows, in the NV and the VF experiments, at cross-sections of the approach-flow zone: (a) m. (b) m. (c) m. (d) m. (e) m. (f) m.
Figure 8.
Velocity u (ms−1) as color scale and direction and magnitude of the velocity components (ms−1) as vector arrows, in the NV and the VF experiments, at cross-sections of the approach-flow zone: (a) m. (b) m. (c) m. (d) m. (e) m. (f) m.

Figure 9.
Direction and magnitude of the velocity components (ms−1) as vector arrows, in the NV and the VF experiments, at horizontal plans: (a) m. (b) m. (c) m. (d) m. Plans (a,b) are defined ≈0.01 m below the top of the vanes; plans (c,d) are ≈0.035 m above the top of the vanes.
Figure 9.
Direction and magnitude of the velocity components (ms−1) as vector arrows, in the NV and the VF experiments, at horizontal plans: (a) m. (b) m. (c) m. (d) m. Plans (a,b) are defined ≈0.01 m below the top of the vanes; plans (c,d) are ≈0.035 m above the top of the vanes.

Figure 10.
Distribution of the flow deflection angle (°) along plane , in the NV and the VF experiments, at: (a) m. (b) m. (c) m. (d) m.
Figure 10.
Distribution of the flow deflection angle (°) along plane , in the NV and the VF experiments, at: (a) m. (b) m. (c) m. (d) m.

Figure 11.
Velocity v (ms−1) as color scale and direction and magnitude of the velocity components (ms−1) as vector arrows, in the NV and the VF experiments, at: (a) m. (b) m.
Figure 11.
Velocity v (ms−1) as color scale and direction and magnitude of the velocity components (ms−1) as vector arrows, in the NV and the VF experiments, at: (a) m. (b) m.

Figure 12.
Velocity u (ms−1) as color scale and direction and magnitude of the velocity components (ms−1) as vector arrows, in the NV and the VF experiments, at cross-sections: (a) m. (b) m. (c) m. (d) m. (e) m. (f) m.
Figure 12.
Velocity u (ms−1) as color scale and direction and magnitude of the velocity components (ms−1) as vector arrows, in the NV and the VF experiments, at cross-sections: (a) m. (b) m. (c) m. (d) m. (e) m. (f) m.

Figure 13.
Vertical velocity w (ms−1) as color scale and direction and magnitude of the velocity components in the diversion entrance zone (ms−1) as vector arrows, in the NV and the VF experiments, at horizontal plans: (a) m. (b) m. (c) m. (d) m.
Figure 13.
Vertical velocity w (ms−1) as color scale and direction and magnitude of the velocity components in the diversion entrance zone (ms−1) as vector arrows, in the NV and the VF experiments, at horizontal plans: (a) m. (b) m. (c) m. (d) m.

Figure 14.
Velocity v (ms−1) as color scale and direction and magnitude of the velocity components in the diversion entrance zone (ms−1) as vector arrows, in the NV and the VF experiments, at: (a) m. (b) m. (c) m. (d) m. (e) m. (f) m.
Figure 14.
Velocity v (ms−1) as color scale and direction and magnitude of the velocity components in the diversion entrance zone (ms−1) as vector arrows, in the NV and the VF experiments, at: (a) m. (b) m. (c) m. (d) m. (e) m. (f) m.

Figure 15.
Velocity u (ms−1) as color scale and direction and magnitude of the velocity components (ms−1) as vector arrows, in the NV and the VF experiments, in the vicinity of and within the diversion entrance, at cross-sections: (a) m. (b) m. (c) m. (d) m. (e) m (middle of diversion). (f) m (middle of diversion). (g) m. (h) m. White lines are tentative representations of the limits of the separation zone.

Figure 16.
Velocity u (ms−1) as color scale and direction and magnitude of the velocity components (ms−1) as vector arrows, in the NV and the VF experiments, at cross-sections: (a) m. (b) m. (c) m. (d) m. (e) m. (f) m. (g) m. (h) m.
Figure 16.
Velocity u (ms−1) as color scale and direction and magnitude of the velocity components (ms−1) as vector arrows, in the NV and the VF experiments, at cross-sections: (a) m. (b) m. (c) m. (d) m. (e) m. (f) m. (g) m. (h) m.

Figure 17.
Turbulent kinetic energy k (m2·s−2) as color scale, in the NV and the VF experiments, in the main channel upstream of the diversion, at cross-sections: (a) m. (b) m. (c) m. (d1) m. (d2) m.
Figure 17.
Turbulent kinetic energy k (m2·s−2) as color scale, in the NV and the VF experiments, in the main channel upstream of the diversion, at cross-sections: (a) m. (b) m. (c) m. (d1) m. (d2) m.

Figure 18.
Turbulent kinetic energy k (m2·s−2) as color scale, in the NV and the VF experiments, in the inner half of the main channel and part of the diversion channel, at cross-sections: (a) m. (b) m. (c) m. (d) m. (e) m. (f) m.
Figure 18.
Turbulent kinetic energy k (m2·s−2) as color scale, in the NV and the VF experiments, in the inner half of the main channel and part of the diversion channel, at cross-sections: (a) m. (b) m. (c) m. (d) m. (e) m. (f) m.

Figure 19.
Turbulent kinetic energy k (m2·s−2) as color scale, in the NV and the VF experiments, downstrem of the vane-field, at cross-sections: (a) m. (b) m. (c) m. (d) m. (e) m. (f) m.
Figure 19.
Turbulent kinetic energy k (m2·s−2) as color scale, in the NV and the VF experiments, downstrem of the vane-field, at cross-sections: (a) m. (b) m. (c) m. (d) m. (e) m. (f) m.

Publisher’s Note: MDPI stays neutral with regard to jurisdictional claims in published maps and institutional affiliations. |
© 2021 by the authors. Licensee MDPI, Basel, Switzerland. This article is an open access article distributed under the terms and conditions of the Creative Commons Attribution (CC BY) license (http://creativecommons.org/licenses/by/4.0/).
Share and Cite
MDPI and ACS Style
Baltazar, J.; Alves, E.; Bombar, G.; Cardoso, A.H. Effect of a Submerged Vane-Field on the Flow Pattern of a Movable Bed Channel with a 90° Lateral Diversion. Water 2021, 13, 828. https://doi.org/10.3390/w13060828
AMA Style
Baltazar J, Alves E, Bombar G, Cardoso AH. Effect of a Submerged Vane-Field on the Flow Pattern of a Movable Bed Channel with a 90° Lateral Diversion. Water. 2021; 13(6):828. https://doi.org/10.3390/w13060828
Chicago/Turabian StyleBaltazar, Joana, Elsa Alves, Gökçen Bombar, and António Heleno Cardoso. 2021. "Effect of a Submerged Vane-Field on the Flow Pattern of a Movable Bed Channel with a 90° Lateral Diversion" Water 13, no. 6: 828. https://doi.org/10.3390/w13060828
Note that from the first issue of 2016, this journal uses article numbers instead of page numbers. See further details here.