
From the Well to the Bottle: Identifying Sources of Microplastics in Mineral Water
by
 , , ,
, , ,
Jana Weisser
1,* ,
,
Irina Beer
2,
Benedikt Hufnagl
3,4,
Thomas Hofmann
1,
Hans Lohninger
3,
Natalia P. Ivleva
2 and
Karl Glas
1 1
Chair of Food Chemistry and Molecular Sensory Science, Group of Water Systems Technology, Technical University of Munich, Maximus-von-Imhof-Forum 2, D-85354 Freising, Germany
2
Institute of Hydrochemistry, Chair of Analytical Chemistry and Water Chemistry, Technical University of Munich, Elisabeth-Winterhalter-Weg 6, D-81377 Munich, Germany
3
Institute of Chemical Technologies and Analytics, Vienna University of Technology, Getreidemarkt 9, AT-1060 Vienna, Austria
4
Purency GmbH, Walfischgasse 8/34, AT-1010 Vienna, Austria
*
Author to whom correspondence should be addressed.
Water 2021, 13(6), 841; https://doi.org/10.3390/w13060841
Submission received: 8 February 2021
/
Revised: 15 March 2021
/
Accepted: 17 March 2021
/
Published: 19 March 2021
(This article belongs to the Section Water Quality and Contamination)
Abstract
:Microplastics (MP) have been detected in bottled mineral water across the world. Because only few MP particles have been reported in ground water-sourced drinking water, it is suspected that MP enter the water during bottle cleaning and filling. However, until today, MP entry paths were not revealed. For the first time, this study provides findings of MP from the well to the bottle including the bottle washing process. At four mineral water bottlers, five sample types were taken along the process: raw and deferrized water samples were filtered in situ; clean bottles were sampled right after they left the bottle washer and after filling and capping. Caustic cleaning solutions were sampled from bottle washers and MP particles isolated through enzymatic and chemical treatments. The samples were analyzed for eleven synthetic and natural polymer particles ≥11 µm with Fourier-transform infrared imaging and random decision forests. MP were present in all steps of mineral water bottling, with a sharp increase from <1 MP L−1 to 317 ± 257 MP L−1 attributed to bottle capping. As 81% of MP resembled the PE-based cap sealing material, abrasion from the sealings was identified as the main entry path for MP into bottled mineral water.
1. Introduction
Microplastics (MP, 1 µm–1 mm) are currently being studied extensively. MP have been found in various environments, but also in foodstuffs like seafood [1,2,3], salt [4,5], and drinking water, both from the tap and bottled [6,7,8,9,10].
Drinking water is one of the most frequently chosen research subjects to be investigated, as it is a relatively easy-to-handle substance from which MP can often be isolated simply by filtering it. In drinking water from ground water sources, Mintenig et al. [8] found a maximum of 7 MP m−3 (lower detection limit 20 µm), while Weber et al. [11] did not detect any MP (≥10 µm). In contrast, Schymanski et al. [7] and Oßmann et al. [6] observed high numbers of MP in bottled water; they both investigated mineral water in different packaging materials. In re-used polyethylene terephthalate (PET) bottles, Schymanski et al. found 118 ± 88 MP L−1 and 50 ± 52 MP L−1 in re-used glass bottles (≥5 µm). In single-use PET bottles, they found 14 ± 14 MP L−1 [7].
The results of Oßmann et al. showed a similar picture: they found 4889 ± 5432 MP L−1 in re-used PET bottles and 3074 ± 2531 MP L−1 in re-used glass bottles (≥1 µm). Compared to 2649 ± 2857 MP L−1 in single-use PET bottles, re-used bottles again held the highest MP loads.
Further, it was observed that apart from the packaging material itself, carbonization [7] and the bottle age [6] seem to play a role in MP load. Both studies suggested that the cleaning process of re-usable bottles may be a major entry path for MP particles, as well as other machinery like bottle fillers.
These possible entry paths along the filling process have not been addressed so far. To the best of our knowledge, this study is the first to take a closer look at the process of mineral water bottling and potential entry paths for MP at four German mineral water bottlers. The process of mineral water bottling was essentially the same at all bottlers and is briefly described in the following.
The first step of mineral water bottling is pumping it from a ground water source. Often, it contains ferric ions which can cause a metallic flavor of the water or precipitates in pipes and machinery. Therefore, soluble Fe(II) compounds are transferred into insoluble Fe(III) compounds by aeration and precipitates are removed in deep-bed filters [12].
The deferrized water is then filled into single-use or return and refillable glass or PET bottles.
To free returned bottles from germs, dirt, chemicals and odors, a multi-step cleaning process is necessary. Bottle caps are removed and the bottles are turned upside-down to drain beverage residues or coarse dirt. Inside and outside jetting with warm water further removes coarse soiling. Bottles are then submerged into the first caustic soda bath, containing sodium hydroxide (NaOH) and detergents to remove the labels. Subsequently, the bottles are disinfected in a hot (75–82 °C) caustic bath [13,14]. For environmental and economic reasons, the used caustic is re-used by removing bottle labels and other solid substances through sedimentation or filtration and adding NaOH and surfactants to their working concentrations. Depending on the washer design, bottles undergo one or more caustic and water baths. Finally, bottles are flushed with cool water jets.
Cleaned bottles are inspected using high-speed image processing. Only clean, undamaged bottles continue to the filler and capper. Caps are sorted and orientated in special machinery before being put on the bottle neck. While plastic screw caps are twisted on, aluminum caps are rolled onto the bottle neck thread. Lastly, paper or plastic labels are glued onto the bottles using synthetic or semi-synthetic glues [13,14,15].
It was our aim to (a) identify critical points for MP to enter the product along the filling process, (b) give hints at possible mitigation measures, and (c) to gain more insight on the occurrence of MP in drinking water. To investigate the influence of the bottle cleaning process, we chose to focus on returnable bottles. With a market share of 18.6% in 2019, glass bottles outnumbered returnable PET bottles (14.3%) in Germany [16]. Therefore, returnable glass bottles were chosen. To exclude possible MP entries through carbonization [7], only un-carbonized water was considered. Particles were isolated from the samples as is described in the following and analyzed using focal plane array (FPA)-Fourier-transform infrared imaging (µFTIR) and a customized random decision forest model (RDF) [17].
2. Materials and Methods
2.1. Sampling
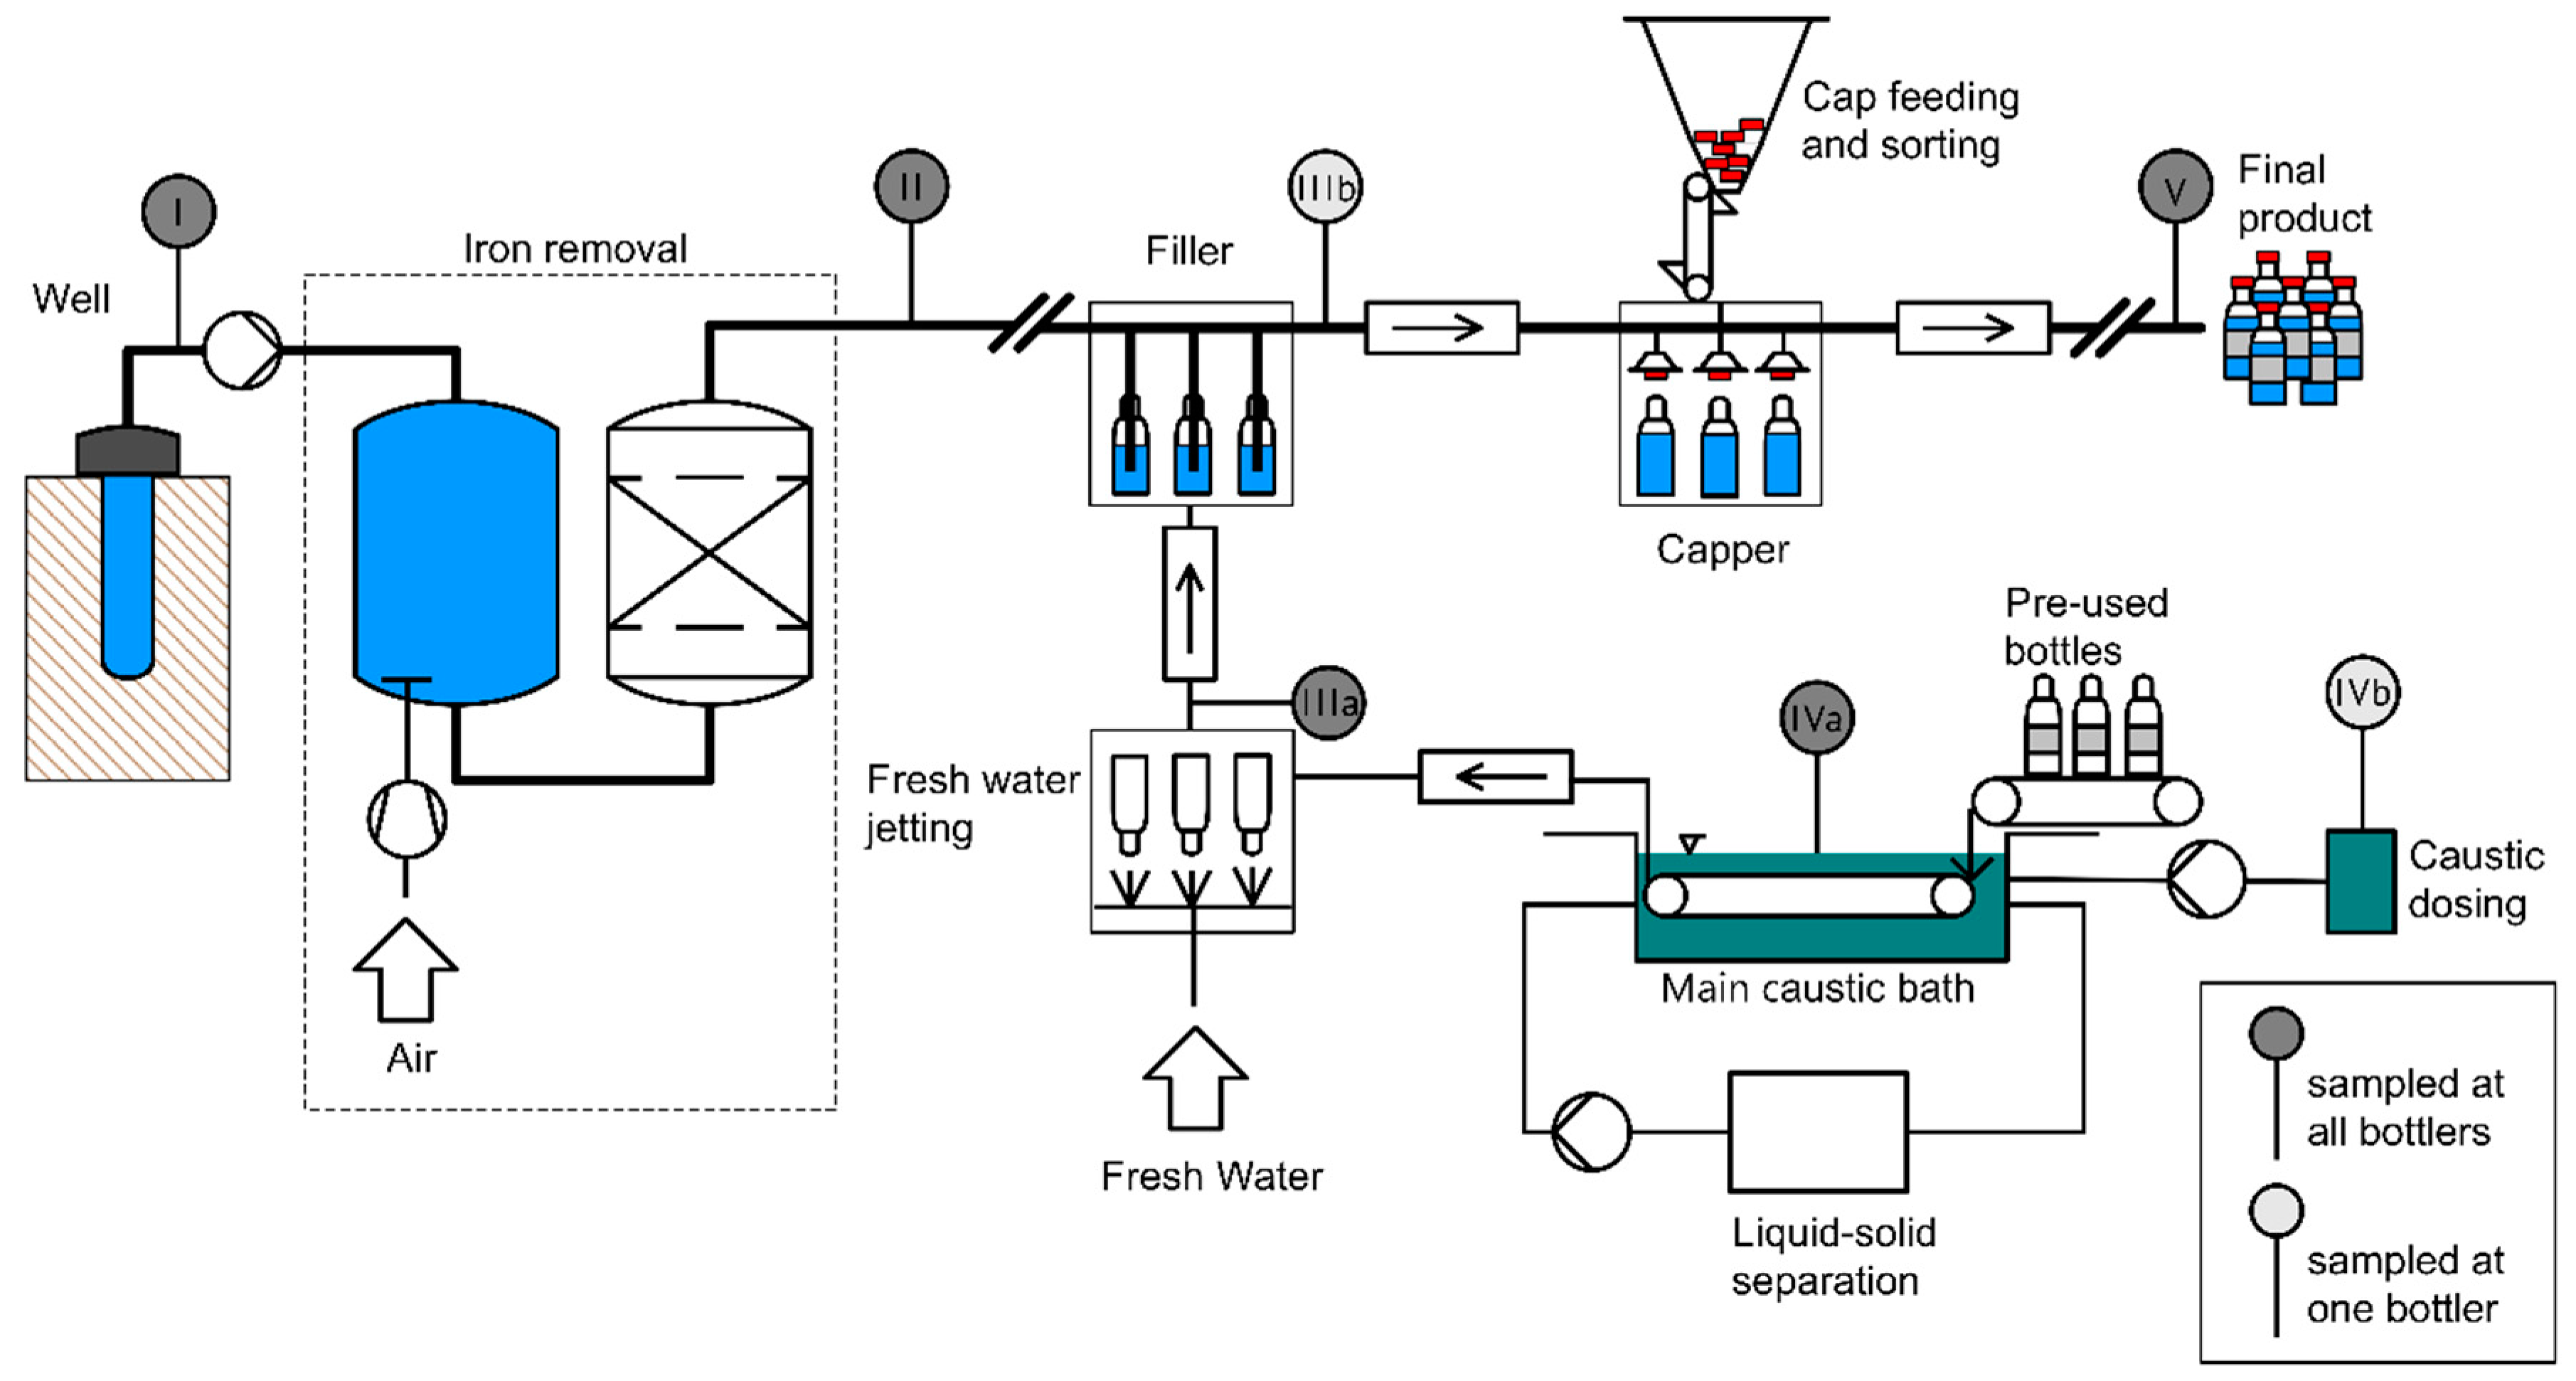
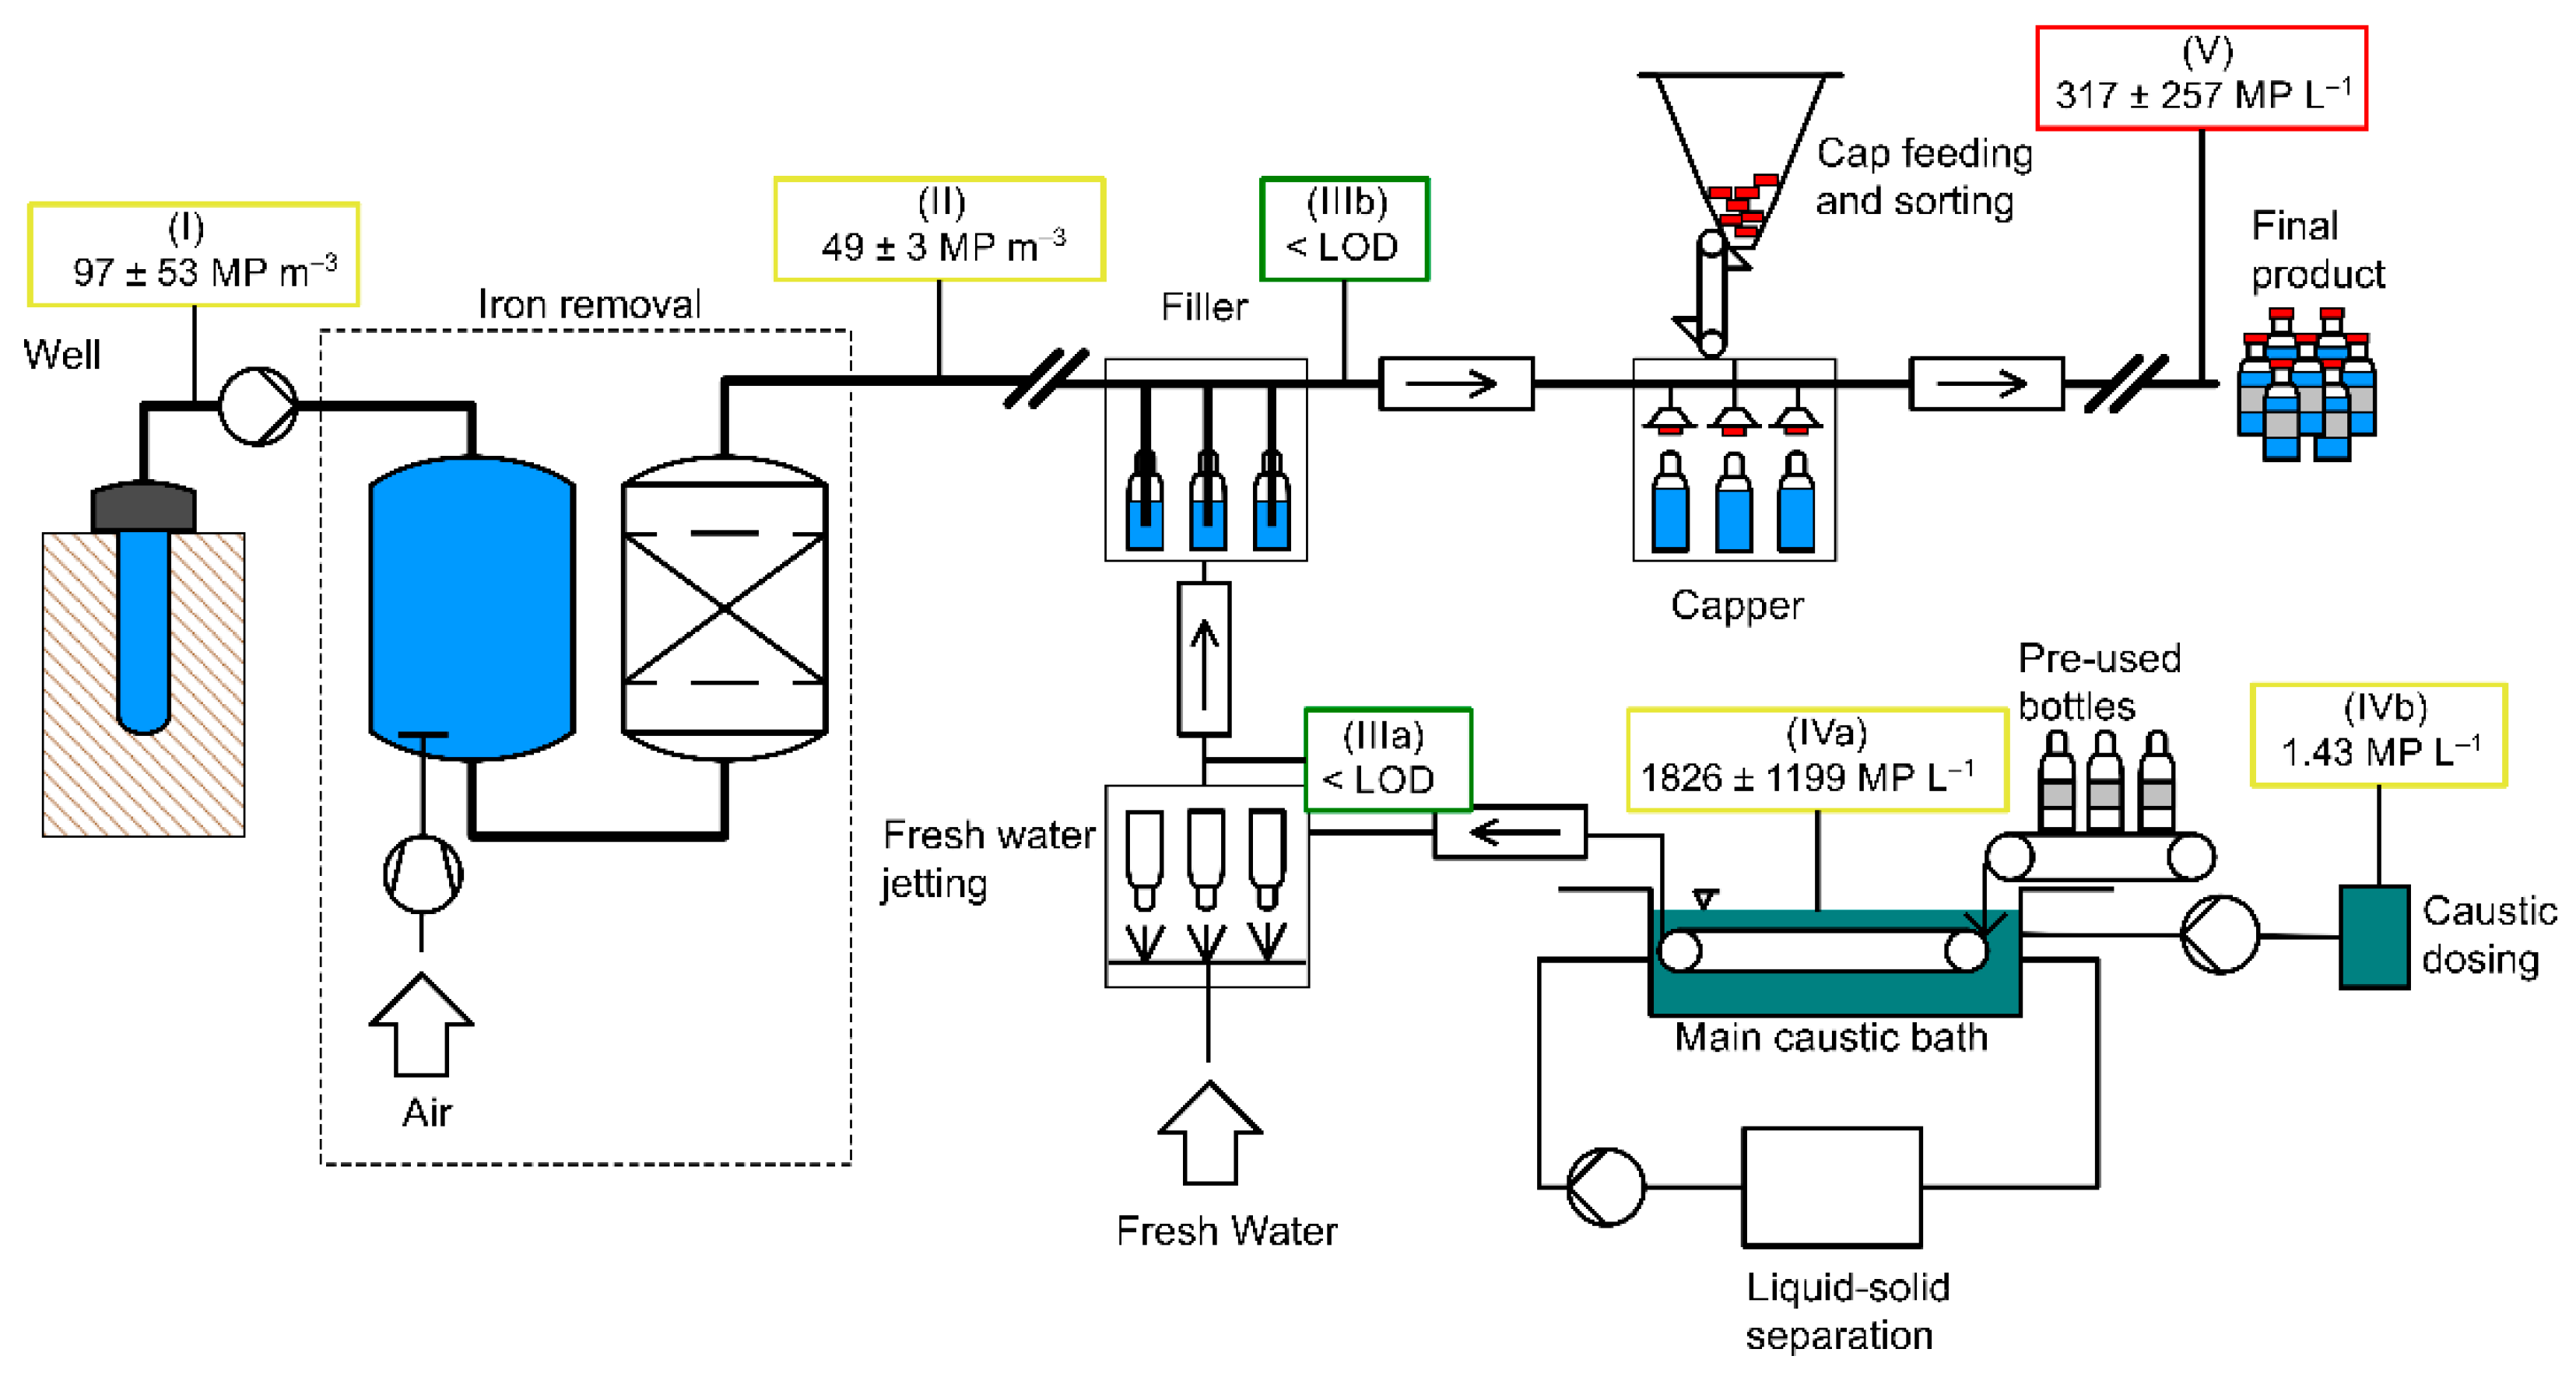
The steps described in the following were performed at all four bottlers (A, B, C, and D). Figure 1 (drawn with RI-CAD by HiTec Zang GmbH, Herzogenrath, Germany) depicts the process of water treatment and bottling which applies to at all four bottlers A, B, C, and D. It further shows the sampling points from the well to the bottle (I–V). During sampling and sample preparation, the contamination prevention measures described in Section 2.4.1 were followed.
2.1.1. Raw and Deferrized Water Samples
Water volumes between 1000 L and 1453 L were sampled at the well (“raw water”) and after deferrization and filtering (Figure 1, I and II), using stainless steel filter cartridges (meshes 50 µm and 5 µm, Wolftechnik Filtersysteme GmbH & Co. KG,, Weil der Stadt, Germany), similar to other studies [8,18]. Screw connections were sealed with hemp fibers. The device was enclosed for transport using valves and covering the openings with aluminum foil. It was attached directly to the sampling tap at the water pipe using custom-made adapters. In all cases, pipe pressure was sufficient to push the water through the filters. Detailed information on sampling is given in the supplementary information, Tables S1–S5.
2.1.2. Bottles
Three cleaned returnable glass bottles (volume 0.7 or 0.75 L) were collected and immediately covered with aluminum foil (IIIa). Three more glass bottles were sampled after the capper (V). All bottle caps were made of varnished aluminum and had a plastic sealing layer inside. To gain insight into MP concentrations before and after bottle capping, three additional bottles were sampled after the filler but before the capper (IIIb) at bottler B.
2.1.3. Caustic Cleaning Solution
Approximately 1 L of caustic from the main caustic bath in the bottle washer was sampled in pre-cleaned glass bottles with glass stoppers (IVa). At site D, the influence of caustic renewal and tank cleaning was investigated in addition by taking two more caustic samples six months later: right before the caustic was discarded and fresh caustic during the first production day. Additionally, the concentrated NaOH-detergent solution used for preparation of the caustic was sampled (214 mL, IVb). Results concerning the caustic renewal process are discussed separately in Section 5.
2.2. Sample Preparation
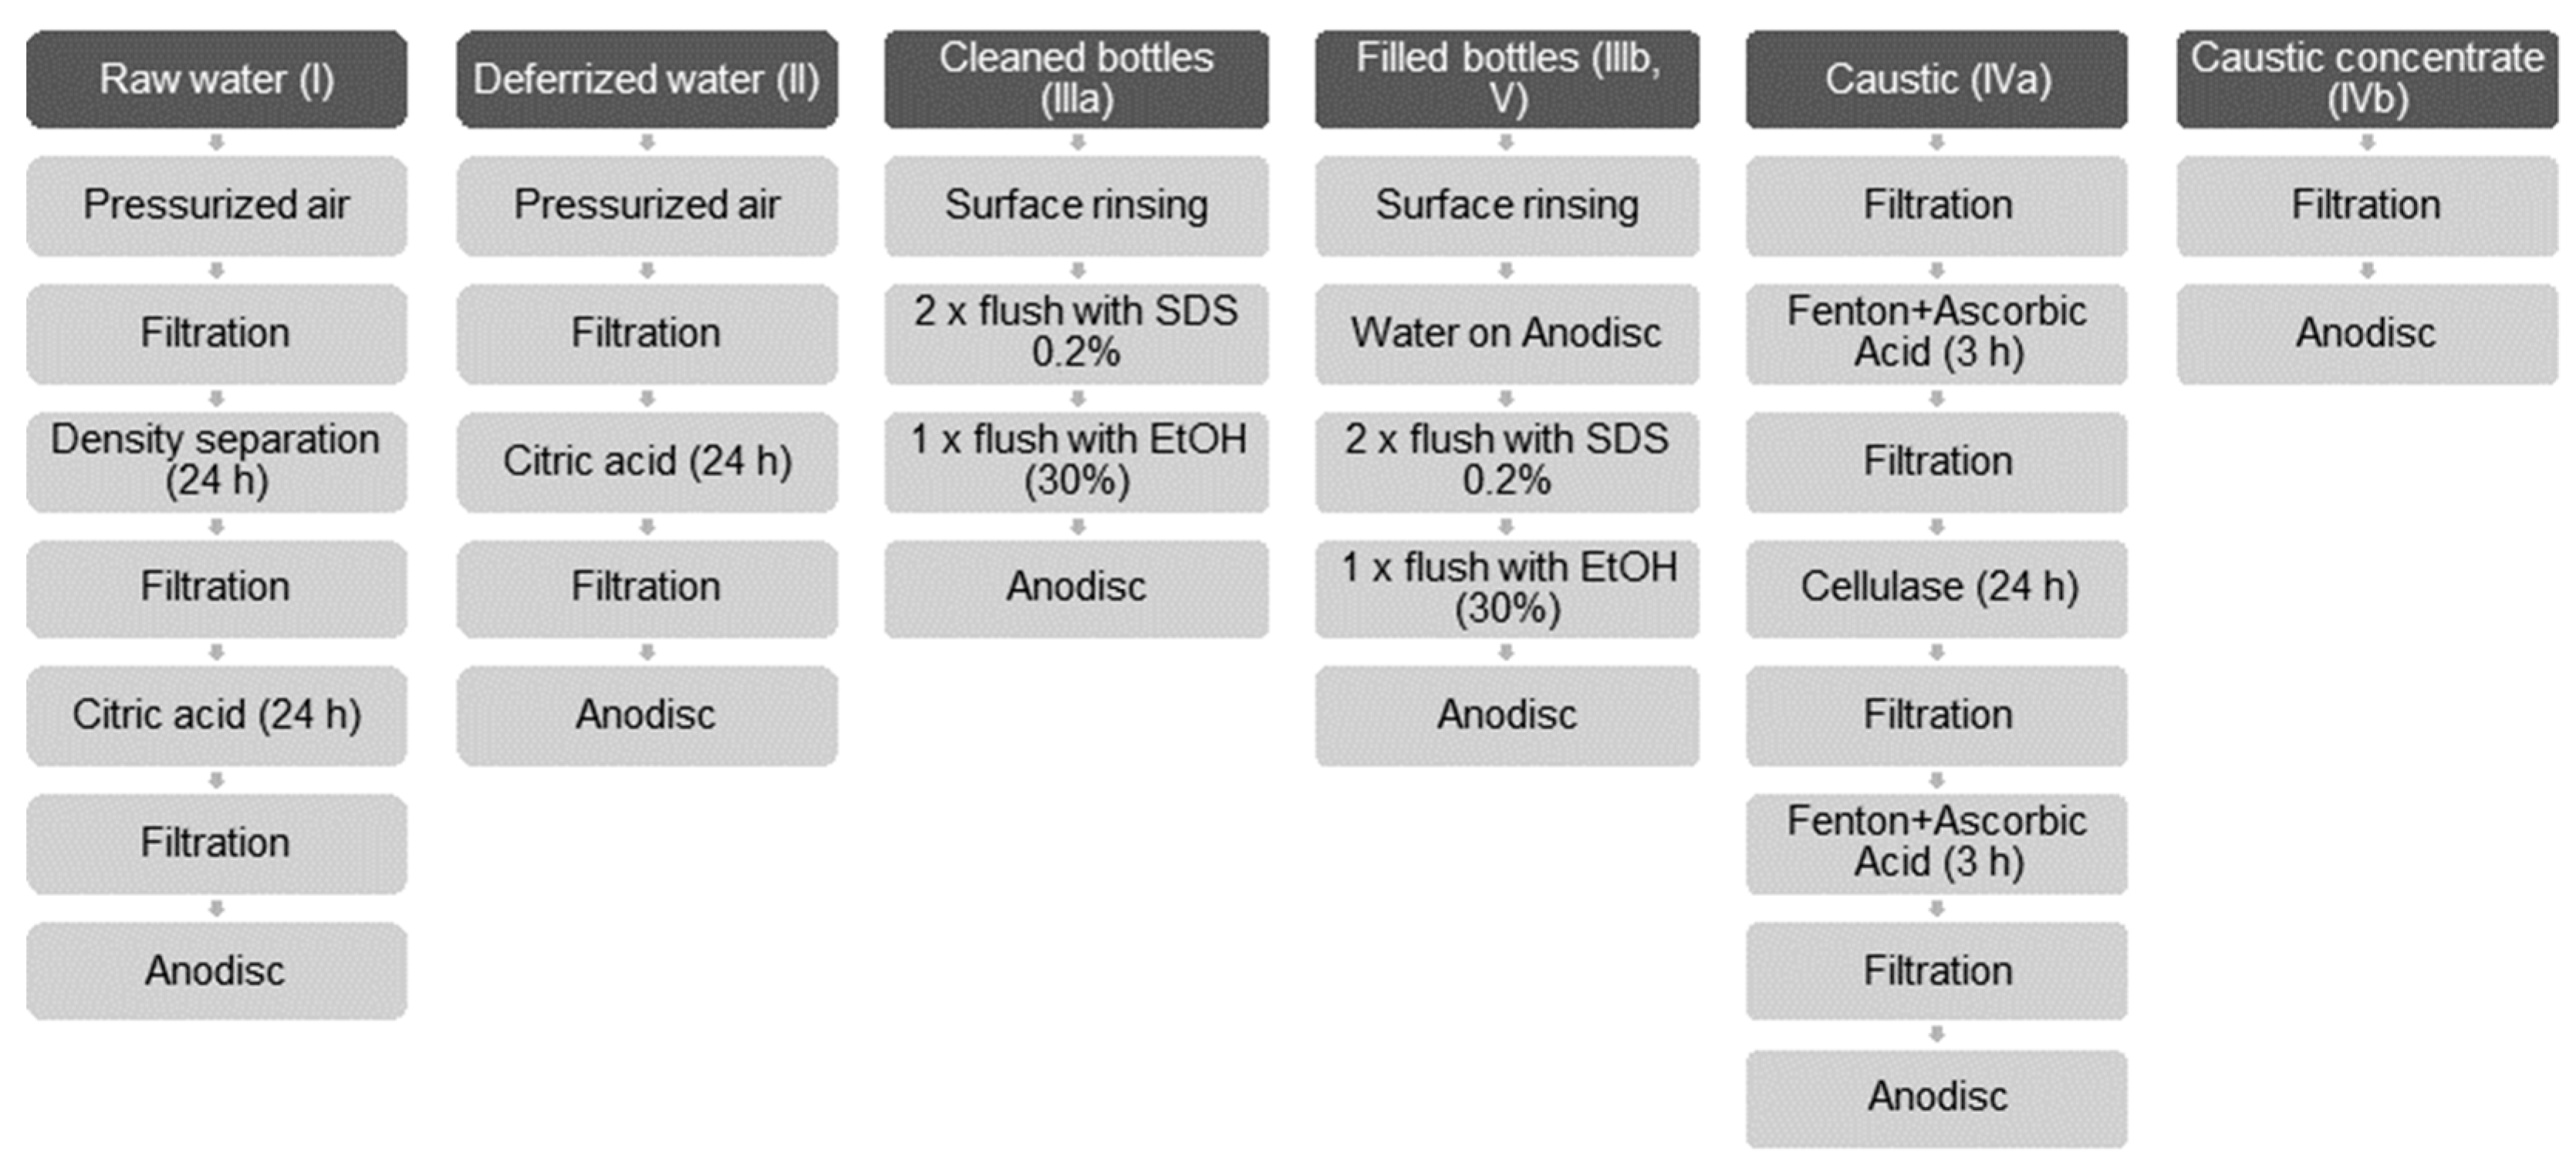
The strategies summarized in Figure 2 were pursued in order to isolate MP and to eliminate non-plastic particles.
2.2.1. Raw and Deferrized Water Samples (I, II)
In the laboratory, remaining water was pumped out of the sampling device using a vacuum pump. The device was backwashed with compressed air for two minutes to loosen particles from the filter meshes. The filter cartridges and housings were thoroughly rinsed into a beaker using 30% ethanol (EtOH). Washed-off particles were concentrated on a circular stainless-steel sieve (diameter 47 mm, mesh width 5 µm, Rolf Körner GmbH, Niederzier, Germany).
Raw water samples subsequently underwent density separation in a zinc chloride solution (ZnCl2, density 1.75 kg L−1) to remove inorganic precipitates. After 24 h, the upper third of the suspension was again filtered through the stainless-steel sieve. The funnel was flushed thoroughly with ultrapure water and EtOH (30%).
Deferrized and raw water samples after density separation were left in a citric acid solution (30 mL, 0.55 M) for 24 h to dissolve remaining inorganics. Particles were again concentrated on sieves and suspended in EtOH (30%). Finally, the particle-EtOH suspension was filtered through an aluminum oxide filter with a polypropylene (PP) support ring (Anodisc, diameter 25 mm, 0.2 µm pores, Whatman, Buckinghamshire, UK) and left to dry in a glass petri dish under a laminar flow cabinet (PV1300, HEPA H14, Alpina Polska Sp. Z o.o, Konin, Poland).
2.2.2. Bottle Samples (IIIa, IIIb, V)
Labels were removed and bottle surfaces were rinsed thoroughly before drying the bottles in the flow cabinet. It was attempted to obtain a mixed sample by filtering the content of three bottles through one Anodisc filter. However, this was possible only in two out of four cases because filters clogged. In these cases, additional filters were used and the results summarized. When empty, all bottles were flushed twice with 0.02% sodium dodecylsulfate (SDS) and once with 30% EtOH (both 100 mL per 1 L bottle volume).
2.2.3. Caustic Cleaning Solution (IVa)
To isolate MP particles from the caustic, a sequence of filtering, chemical and enzymatic purification was developed similar to Löder et al. [19]. The samples were filtered through a cascade of stainless steel sieves with 100, 50, 10, and 5 µm meshes. The sieves were put into a beaker and underwent Fenton’s reaction (100 mL 30% H2O2, 12.5 mL 0.5 M FeSO4). After 1 h, ascorbic acid (25 mL, 100 g L−1) was added and left to react for 2 h. Preliminary tests showed that ascorbic acid can increase the efficiency of Fenton’s reaction. After, the suspension was filtered and flushed with 1 L of ultrapure water. Sieves were submerged in a citric acid−NaOH buffer (100 mL, pH 6.0, 0.1 M) and cellulase TXL (1000 µL, ASA Spezialenzyme GmbH, Germany) and shaken moderately for 24 h in a water bath (40 °C). Filtering and the Fenton-ascorbic acid treatment were repeated before enriching the sample on an Anodisc filter.
From the concentrated NaOH solution, particles were isolated by filtering through a 5 µm stainless steel sieve and suspending in 30% EtOH before being enriched on an Anodisc filter.
2.3. FTIR Imaging and Data Evaluation
Sample filters were placed on a barium fluoride (BaF2) window (Korth Kristalle GmbH, Altenholz, Germany) in a custom-made sample holder. A subarea of 59.97 mm2 (32.19% of the total filtration area), oriented to the upper right part of the filtration area (depicted in Figure S2), was measured with µFTIR on Agilent Cary 620 coupled to Agilent Cary 670, equipped with a 128 × 128 pixel FPA detector (Agilent Technologies, Inc., Santa Clara CA, USA). Measurements were performed in transmission mode using a 15× objective, corresponding to a projected pixel size of 5.5 µm. Thirty sample scans were recorded at a spectral resolution of 8 cm−1 in the spectral range 3700–1250 cm−1. One hundred and twenty background scans were recorded on an unused Anodisc filter on a BaF2 window.
Particles >1 mm were carefully taken off the filters using forceps and measured using attenuated total reflection (ATR) FTIR (Pike MIRacle, PIKE Technologies, Madison WI, USA with Germanium crystal, same parameters as µFTIR with 16 background and sample scans).
FTIR images were converted from the instrument-specific format *.dmd to *.spe using siMPle (simple-plastics.eu), and imported to Epina ImageLab (Epina GmbH, Retz, Austria) for data evaluation. No spectra preprocessing algorithms were applied.
To establish an RDF model, labeled training data and a set of 28 spectral features (also called descriptors) were prepared. For details on this method, the reader is referred to Hufnagl et al. [20] and Breiman [17]. In this study, a total of 6036 spectra of MP (cryo-milled by Simone Kefer, Chair of Brewing and Beverage Technology, TUM, and sieved to 50−100 µm), natural substances and the background from Anodisc filters and the filter holder were sampled: polyethylene (PE), polypropylene (PP), polyethylene terephthalate as a representative of polyesters (PEST), polyvinylchloride (PVC), polystyrene (PS), polytetrafluoroethylene (PTFE), polyamide (PA), polylactic acid (PLA), ethylene vinyl alcohol (EvOH), cellulose fibers from lab coats and wipes, and skin particles to mimic proteinaceous contaminants. Impurities were found in Anodisc filters, which were included in the data set, as well. The parameters number of trees and R (percentage of training set used to build each tree) were optimized and set to 40 and 67%, respectively.
The model was applied to all samples. All classification results were checked manually and corrected when necessary. Particles <2 pixels were rejected. MP numbers were extrapolated to the total filter area and normalized to sample volumes of 1 m3 or 1 L. Results from sub-samples (see Tables S1–S5) were extrapolated to the whole sample.
Particle length and width were determined automatically by Epina ImageLab as the maximum and minimum Feret diameters, respectively. Particle length is used for size classification in this work. Particles were classified as fibers, when their length was at least three times their width [21]. Otherwise, they were classified as fragments.
2.4. Quality Assurance and Quality Control
The importance of establishing protocols for quality assurance and quality control has recently been stressed by Cowger et al. [22]. Besides contamination prevention, blank samples, recovery rates, and tests for chemical stability of MP towards chemicals, we tested the smallest detectable particle size of our FTIR imaging system and the performance of the RDF model.
2.4.1. Contamination Prevention
All personnel wore purple cotton lab coats and green PP hairnets. The colors were chosen to track contamination, however, green PP was not detected in any sample. Powder-free nitrile gloves were used only when required for safety reasons. Work was done under the laminar flow cabinet, whenever possible. Equipment was checked for cracks and scratches, cleaned manually and in an ultrasonic bath. All equipment was swiftly transferred into the laminar flow cabinet, rinsed thoroughly with ultrapure water (Synergy® Water Purification System, Millipak® Express 40 Filter 0.22 µm, Merck KGaA, Darmstadt, Germany) and air-dried. The glass filtration funnel used for the final filtration step was checked for cleanliness using a flush filter as proposed by Schymanski et al. [7]. Anodisc filters were checked for contamination under a stereomicroscope before usage. Samples and glassware were covered with watch glasses when not in use. To minimize particle loss, the same pieces of equipment that came in contact with a sample, e.g., beakers and stainless steel filters, were used throughout the whole sample preparation process.
For preparation of reagents and equipment cleansing, ultrapure water was used. Reagents were additionally filtered using glass microfiber filters (particle retention 1.2 µm, Th. Geyer GmbH & Co. KG, Renningen, Germany) before usage.
To the greatest extent possible, use of plastic materials was avoided. Exceptions are spray bottles (fluorocarbon polymer, Nalgene), sealing film for petri dishes (PARAFILM®, Bemis, Neenah, WI, USA) and gaskets used in the sampling device and filtration in the laboratory (black Viton™).
2.4.2. Blank Samples and LOD
To account for contamination of the samples, procedural blanks were prepared for each set of samples processed simultaneously. They were obtained preparing sampling equipment and conducting all treatment steps as was done with actual samples. In total, 14 procedural blanks were prepared during this study. Similar to other opuses, the limit of detection (LOD) for each sample type was calculated from the blanks as follows [23,24,25]:
LOD = meanblanks + 3 × standard deviationblanks.
Samples with MP concentrations below LOD are rated as free of MP.
2.4.3. Recovery Rates
We determined recovery rates in triplicates for all sample handling steps described above: extraction from cartridge filters (I, II), bottle flushing (IIIa, IIIb, V), density separation (I), and the sieving and re-suspending procedure (I, II, Iva).
Pink, fluorescent PS granules (2.5 × 2 mm, Glow-Side.com (accessed on 2 December 2020), Germany) were cryo-milled, and their surfaces hydrophilized, applying a protocol from von der Esch et al. [26], where, in brief, the particles are sonicated in potassium hydroxide. Approximately 100 particles (95−145 µm) were counted under a stereomicroscope (SMZ-171-TLED, MoticEurope S.L.U., Barcelona, Spain) and flushed into a filter housing, bottle, or beaker prior to carrying out the sample preparation steps. Lastly, the particles were enriched on polycarbonate membranes (Track Etched Polycarbonate, diameter 25 mm, pores 0.4 µm, GVS North America, Sanford, ME, USA), photographed and counted. The recovery rate was determined as the mean ± standard deviation of the number of recovered particles over the number of spiked-in particles.
2.4.4. Chemical Stability of MP
To account for polymer alterations potentially caused by aggressive reagents, all MP particle types (see Section 2.3, sieved to 125−200 µm) were left to react in citric acid, ZnCl2, Fenton’s reagent, and ascorbic acid for the same time and under the same conditions as during sample preparation. Treated and untreated particles were enriched on gold-coated polycarbonate membranes (diameter 25 mm, pores 0.8 µm, APC GmbH, Germany) for comparative FTIR measurements in reflection mode (settings as described in Section 2.3).
2.4.5. Verification of Size Measurement and Smallest Detectable Particle
In order to verify correct particle size determination using FTIR imaging, a false color image of reference particles reflecting their chemical identity was generated and overlaid with the sample photograph. The smallest detectable particle for each MP type was determined in samples or, when not present, using cryo-milled and sonicated reference particles deposited on Anodisc filters.
2.4.6. RDF Model
The RDF model was evaluated using Monte-Carlo cross validation [27]. In brief, the algorithm was trained using a random subset of 4888 from the complete set of labeled spectra (6036). The rest of the spectra were used as test data. This process was repeated ten times. The confusion matrix derived from cross validation was used to calculate class-based and global performance parameters using the script from Ballabio et al. [28] in MatLab (Version R2019a, The MathWorks, Inc., Natick, MA, USA).
The class-based parameters sensitivity, precision, and specificity reflect the model’s ability to correctly identify spectra belonging to a certain class, to avoid false predictions for a certain class, and to reject samples of other classes, respectively (Formulas in the supplementary materials). The global accuracy reflects the overall ratio of correct classifications. These metrics can all take values from 0 (poor class discrimination) to 1 (perfect class discrimination).
3. Results
3.1. Quality Assurance and Quality Control
3.1.1. Blanks and LODs
Despite the strict routines for minimizing contamination, procedural blanks were not free from MP. Blank and LOD values (Table 1) are given as particle numbers per sample, as the sample volumes varied slightly, while the sample preparation process stayed the same.
3.1.2. Recovery Rates
Mean recovery rates and standard deviations for all sample processing steps are shown in Table 2. The extraction of particles from the cartridge filters poses the highest risk of particle loss with a recovery rate of 58 ± 6%. Lenz and Labrenz [18] determined a recovery rate of 98.9% with cylindrical PA granules with a length of 480 µm. Big, regularly shaped particles should be easier to recover than small, irregularly shaped particles as was already suspected by others [29]. The latter may get trapped in filter meshes and cannot be removed unless applying mechanical force potentially, resulting in particle fragmentation.
Weber et al. [11] determined recovery rates of 55 ± 14% and 70 ± 15% for spherical PE particles (sizes 22−27 µm and 45−53 µm, respectively) placed on stainless steel sieves with a diameter of 80 mm. The disk-shaped sieves may be easier to rinse off than the cartridge filters used in this study, which can explain the higher recovery rate. This is supported by the higher recovery for particle extraction from circular sieves (83 ± 11%) found in this study.
Another step with high particle loss potential is density separation. Flushing the separation funnel is challenging in practice because of its shape and because ZnCl2 leaves a sticky film on the glass walls. The mean recovery rate for this process was 63 ± 8%.
Flushing of the water bottles resulted in the highest recovery rate with 86 ± 8%. Despite this process being relatively easy and straightforward, particle loss could not be fully avoided.
3.1.3. Polymer Persistence
All polymers included in the RDF model for data analysis were tested for their chemical stability against the chemicals used for sample preparation. All polymers were stable with the exception of EvOH and PA in ZnCl2. EvOH particles melted and agglomerated, PA particles aggregated strongly. IR spectra of both remained unchanged. The observation that MP are stable during Fenton’s reaction is in accordance with literature [30,31]. The slight aggressiveness of ZnCl2 towards PA should be taken into account in future experiments.
3.1.4. Particle Size Determination and Smallest Detectable Particle
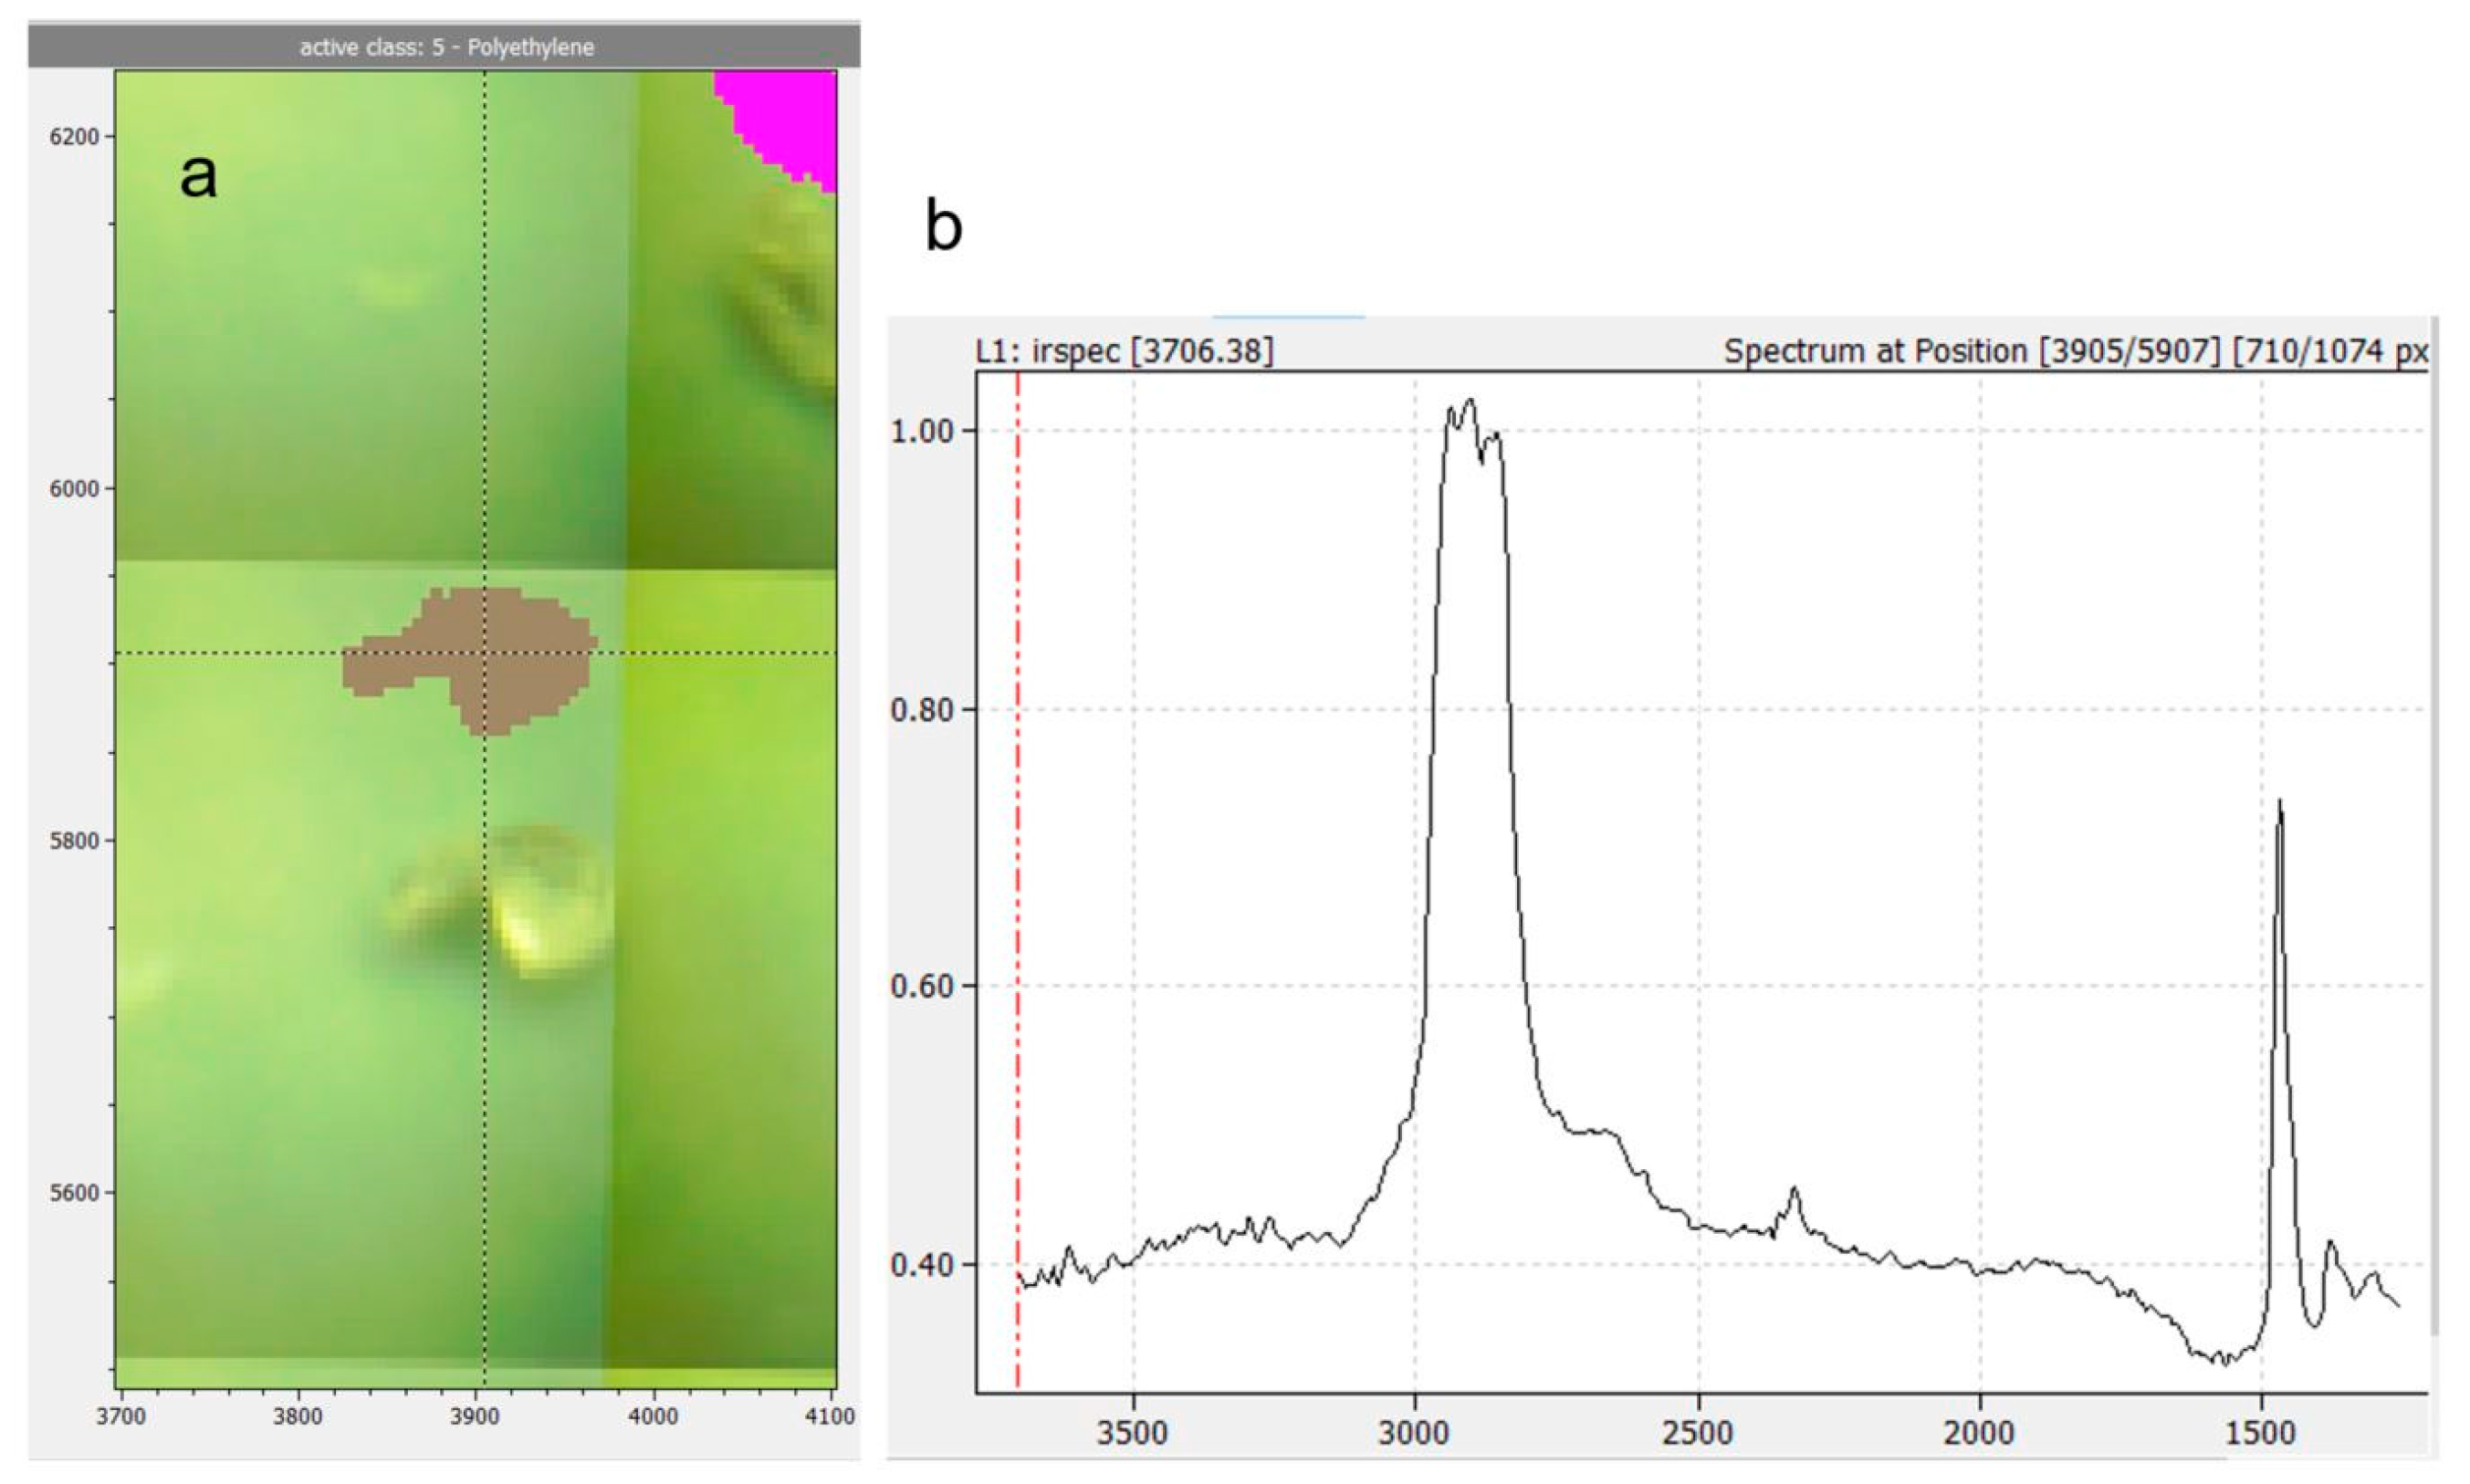
Figure 3a shows the false color image of a PE reference particle (grey) and a PET reference particle (pink) overlaid with the sample photograph. The false color image was slightly shifted upwards to show how it reflects particle size and shape.
A total of 122 particle lengths and widths were measured in photos (WebPlotDigitizer, https://automeris.io/WebPlotDigitizer/ (accessed on 2 December 2020)) and compared to the dimensions determined in the IR image. On average, particle sizes in the IR images differed from sizes determined in photos by −0.89 ± 2.44 pixels (Details in Figure S4). The high standard error reflects that particle sizes of some polymers tended to be overestimated (PA, PLA), while others tended to be underestimated (e.g., PET, PS, PVC). One pixel corresponds to a length of 5.5 µm on the sample. Therefore, the minimum error in particle size determination that can be expected is +/− one pixel or +/− 5.5 µm. Hence, particle sizes reported in this work on average are subject to this expectable error.
Example spectra of the smallest particles detected can be found in Table S6. Particles with a length of 2 pixels, corresponding to 11 µm, were successfully identified for PE, PP, PS, PEST, PVC, EvOH, and PA. The smallest PLA and PTFE particles found had a length of 17 and 21 µm. PLA was never detected in our samples and PTFE is in general likely to be underestimated because of its spectral properties (discussed in detail in the supplementary materials).
3.1.5. RDF Evaluation
Cross-validation of the model resulted in an accuracy of 0.9545, meaning that 95.45% of assignments made by the model were correct. With a sensitivity of 0.8854, PP is the polymer class with the highest risk for underestimation. Sensitivity for the other MP classes was always ≥0.9537, close to the optimum of 1 (details in Table S8). Precision, i.e., the avoidance of false predictions, was ≥0.9310 for all MP classes. The model’s high reliability in rejecting spectra not belonging to a certain class was reflected in specificity values ≥0.9948 for all MP classes. In general, performance for non-MP spectra like cellulose and skin was lower than for MP spectra. This shows that despite satisfying performance on MP spectra, there is still room for future model improvement which will result in quicker manual post-processing.
However, one needs to keep in mind that this performance was achieved on test data from a spiked reference sample. The performance in actual MP samples can be lower due to ageing effects and interference between MP and the sample matrix as was already discussed by Vinay Kumar et al. [3]. In order to further improve the model, more test and training data from real-world samples will be included in future steps.
3.2. MP Concentrations
MP (≥11 µm) were found in every step of water bottling except for the cleaned bottles. Out of four raw waters, one (A, 34 MP m−3) was below LOD (36 MP). The other raw waters contained 48–170 MP m−3 (mean 97 ± 53 MP m−3). MP concentrations in two deferrized waters (A, B, both 19 MP m−3) were below LOD (20 MP), and two had MP concentrations of 46 and 53 MP m−3, respectively. Hence, MP numbers were 37−69% lower after iron removal and filtering indicating that the filters act as a particle sink which is of course their purpose. When calculated to one liter, <1 MP particle (0.046–0.053 MP L−1) was present in deferrized water. It should be noted that cellulose and skin-like substances were abundant in all raw and deferrized water samples, and the corresponding blanks. Cellulose stemmed from the hemp fibers used to seal the sampling device. Thus, we recommend to rather use PTFE tape for sealing if PTFE is not among the target polymer classes (see also Table S6). Skin particles may have been generated while mounting the sampling device without gloves.
Proceeding to the bottle washer, MP concentrations (≥11 µm) in caustic cleaning solutions ranged from 489 to 3240 MP L−1 (mean 1826 ± 1199 MP L−1, LOD 81 MP). Cellulose fibers were not countable because they overlaid each other. Concentrations in cleaned glass bottles (IIIa) were all below LOD (0 to 24 particles L−1, LOD 40 MP). Lastly, in filled and capped bottles (V), a mean concentration of 317 ± 257 MP L−1 was detected, values ranging from 75 to 700 MP L−1 (LOD 40 MP). Up to 91% of particles were non-plastics.
Summarizing these findings, a significant rise of MP concentrations was observed in filled and capped bottles (V, Figure 4), which suggests that MP entered the bottles during filling, capping or both. To prove this, three filled uncapped bottles (IIIb) were sampled at bottler B. With 6 MP L−1, these bottles were found to be free of MP.
3.3. MP Polymer Types
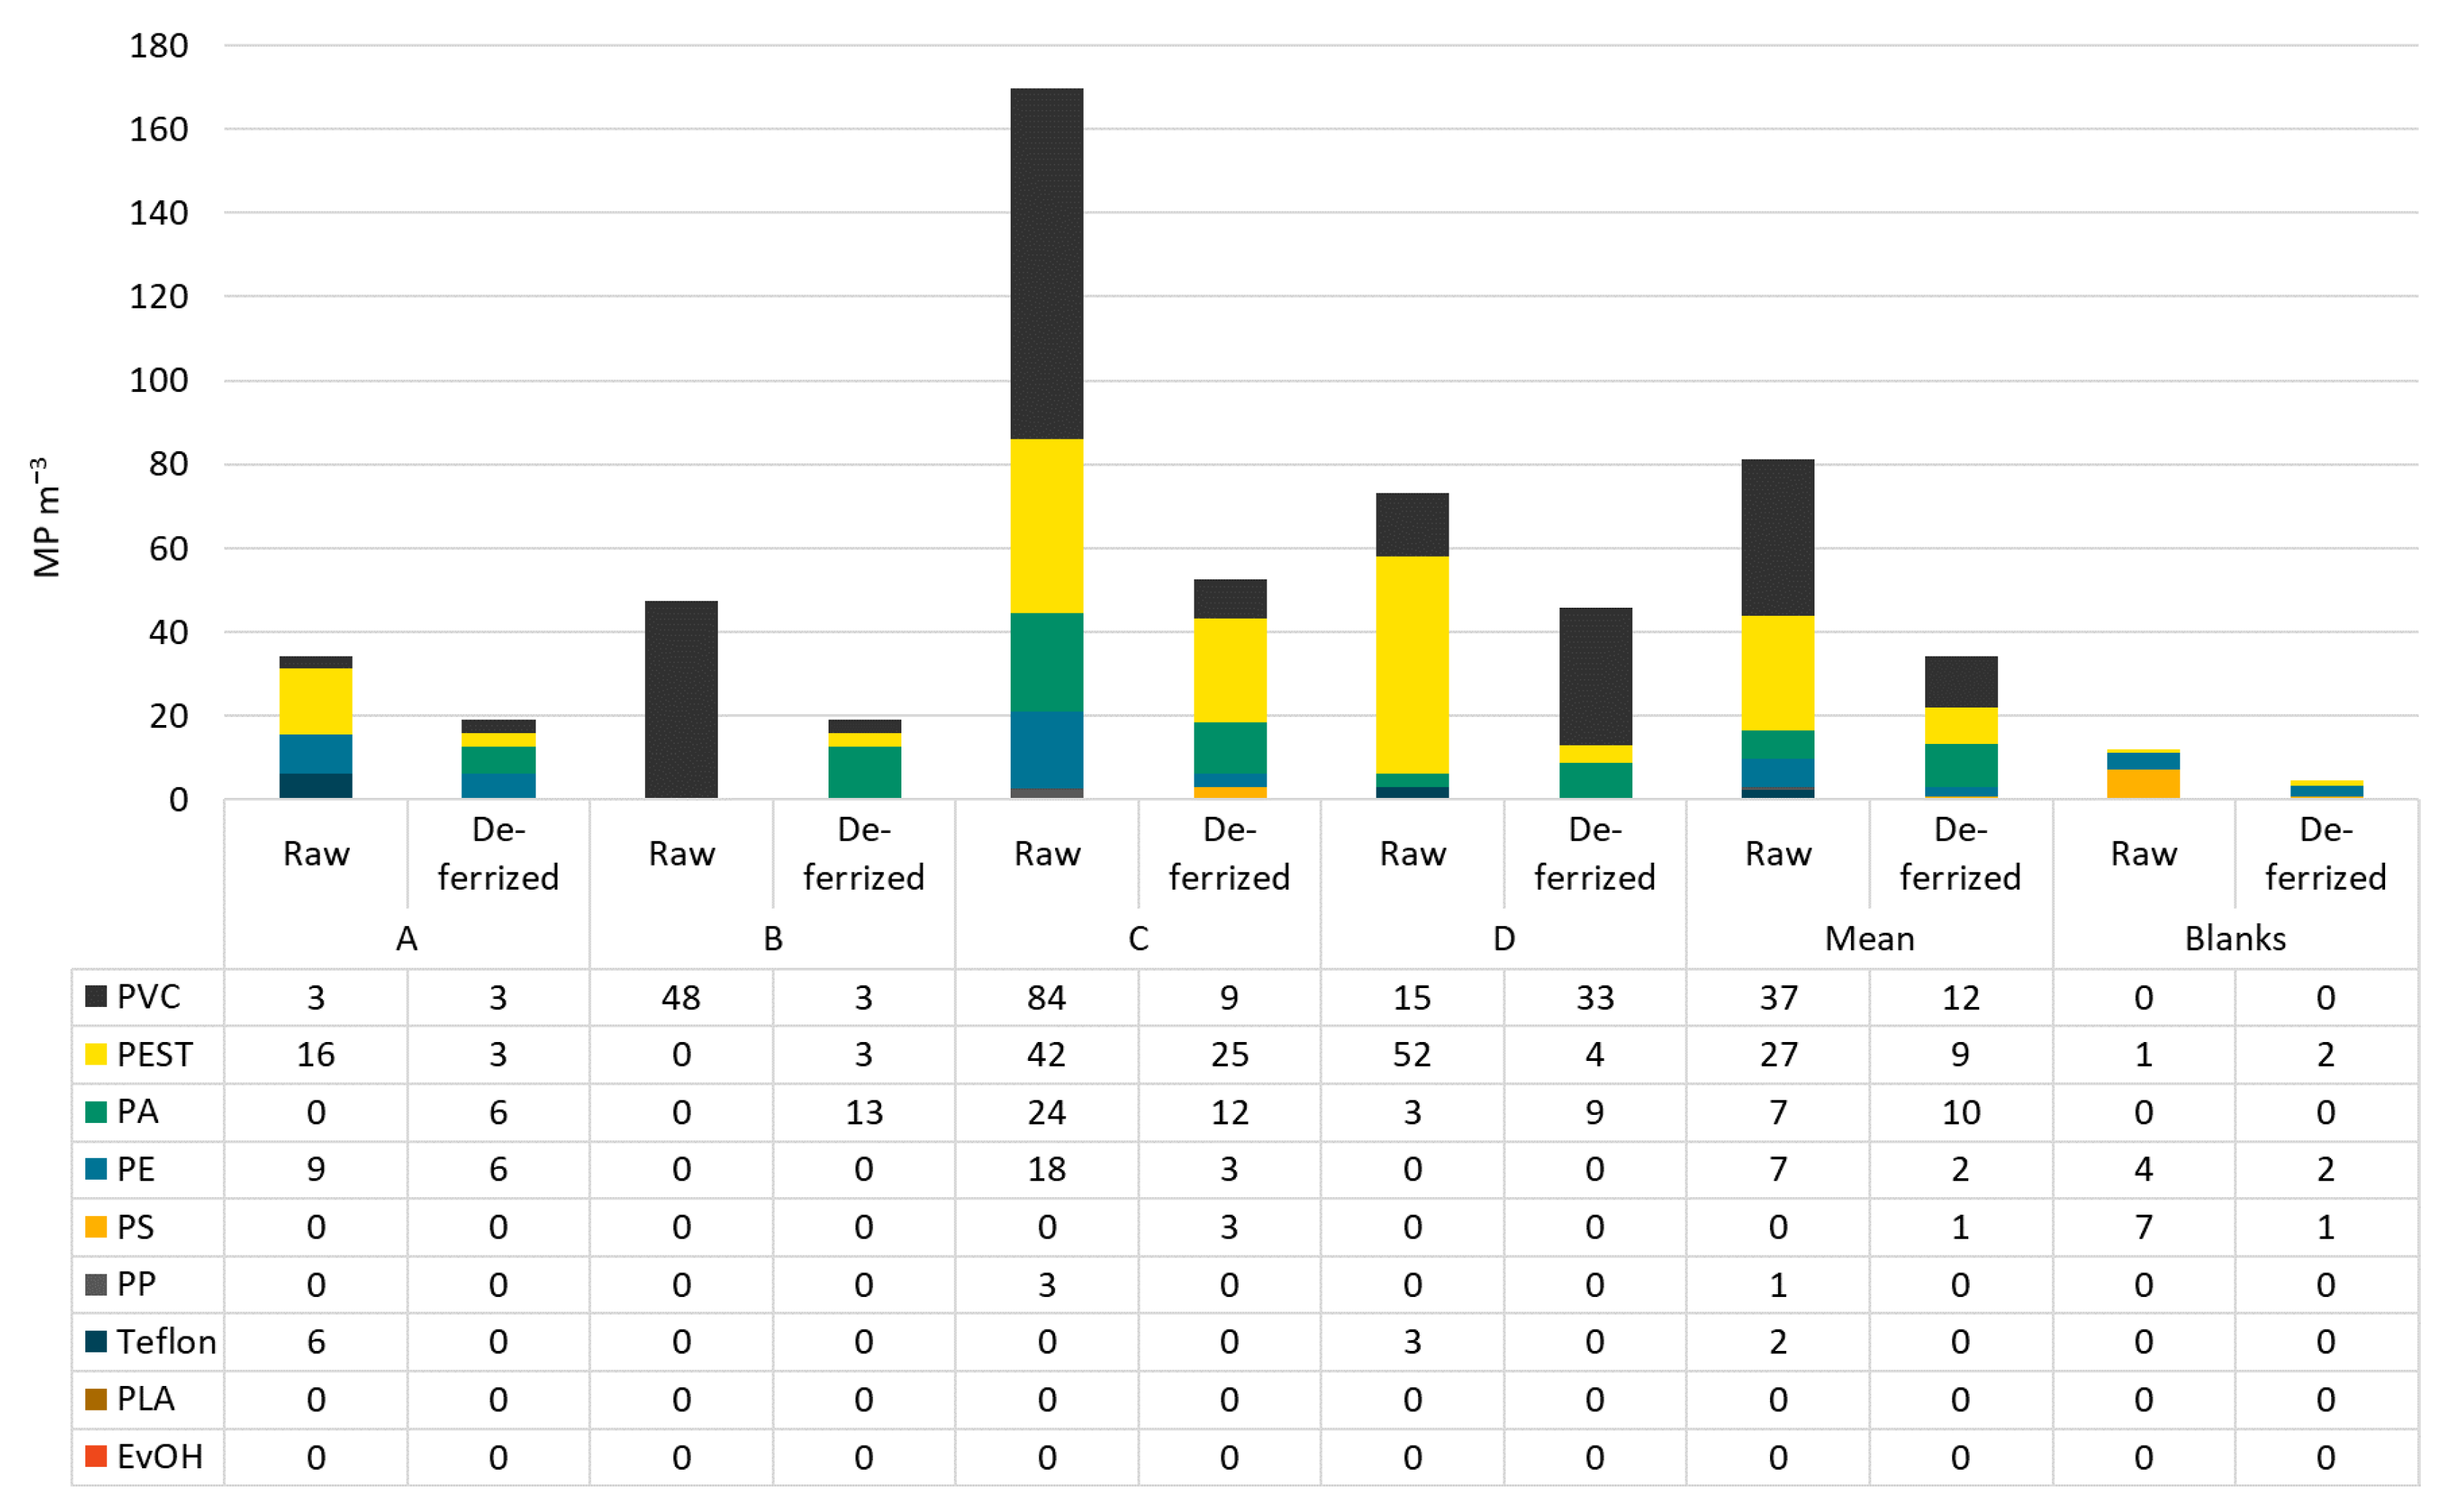
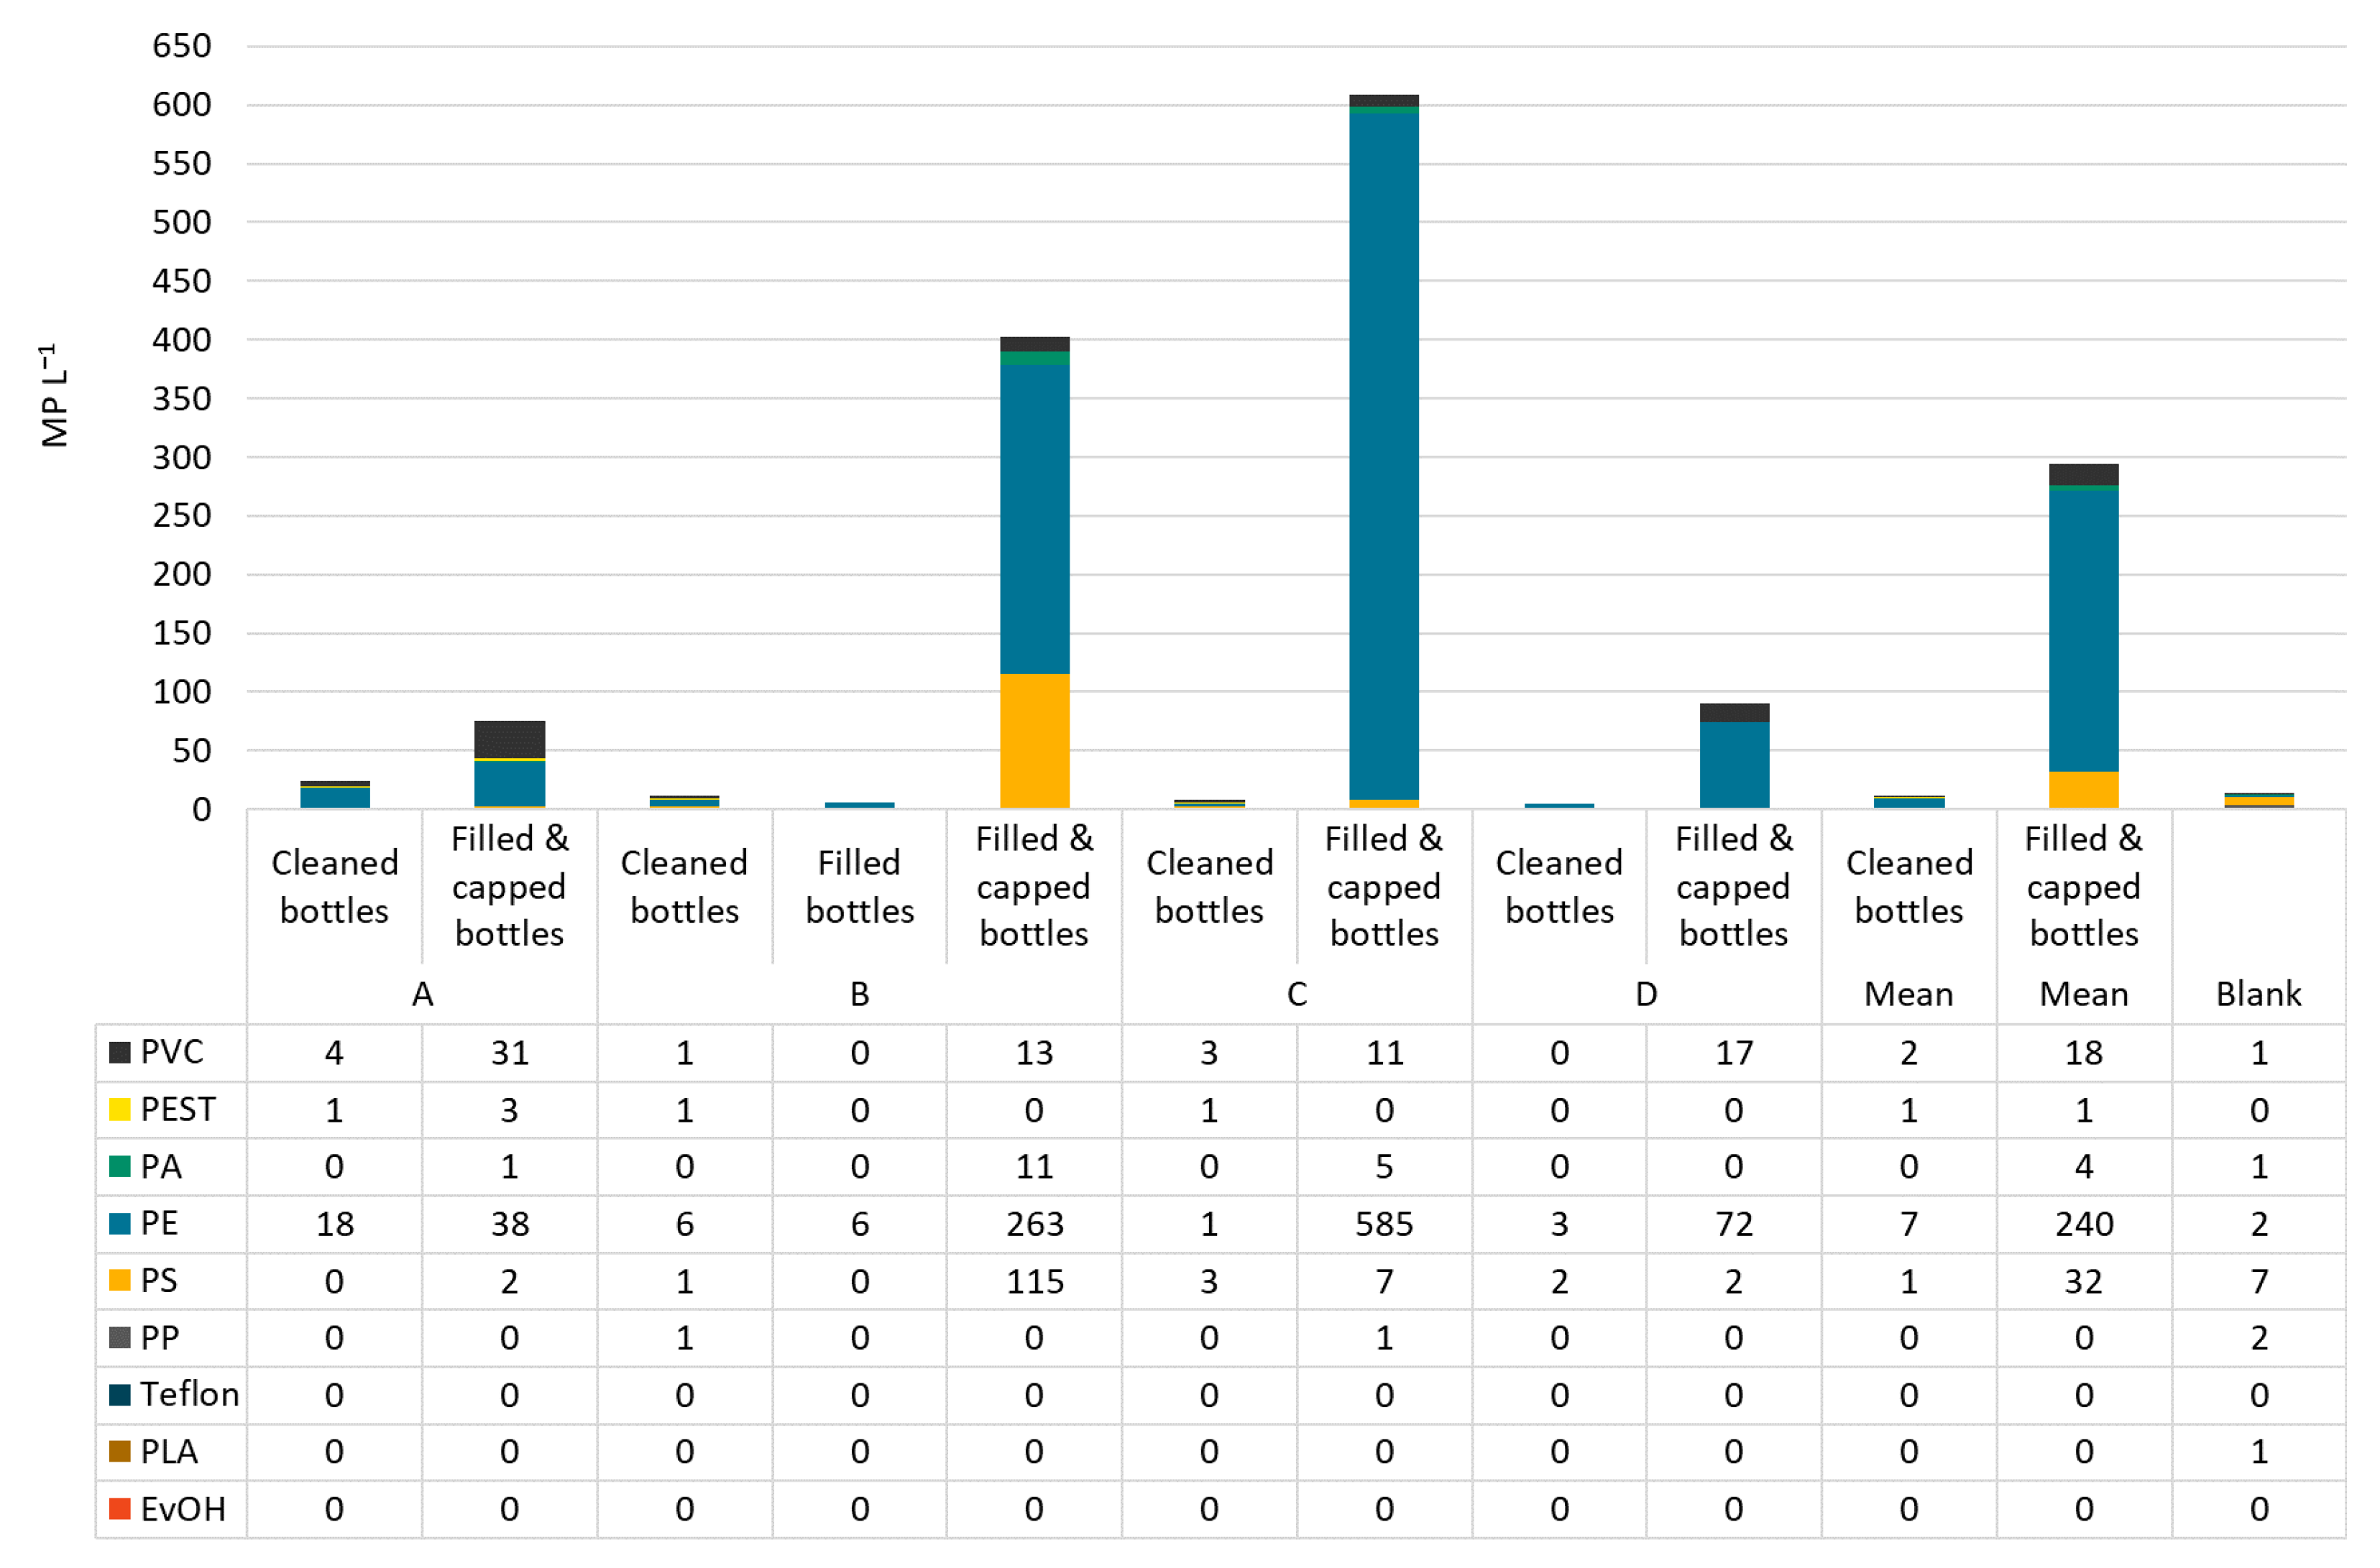
In raw water, PVC was the most abundant polymer type making up on average 46% of MP, followed by PEST with 34%. However, the polymer classes were distributed differently in all samples. In raw water from bottler B, 100% PVC was found. Dominating polymer types in deferrized waters were PVC (35%), PA (29%), and PEST (26%). PS and PE can be neglected in this analysis as they were found in the blanks in similar numbers as in the samples. In filled and capped bottles, the most abundant polymer class was PE (51−96%), followed by PS (1−29%). In Figure 5 and Figure 6, the polymer types per sample are shown in particles per m3 resp. per L.
3.4. MP Particle Size Distributions and Shapes
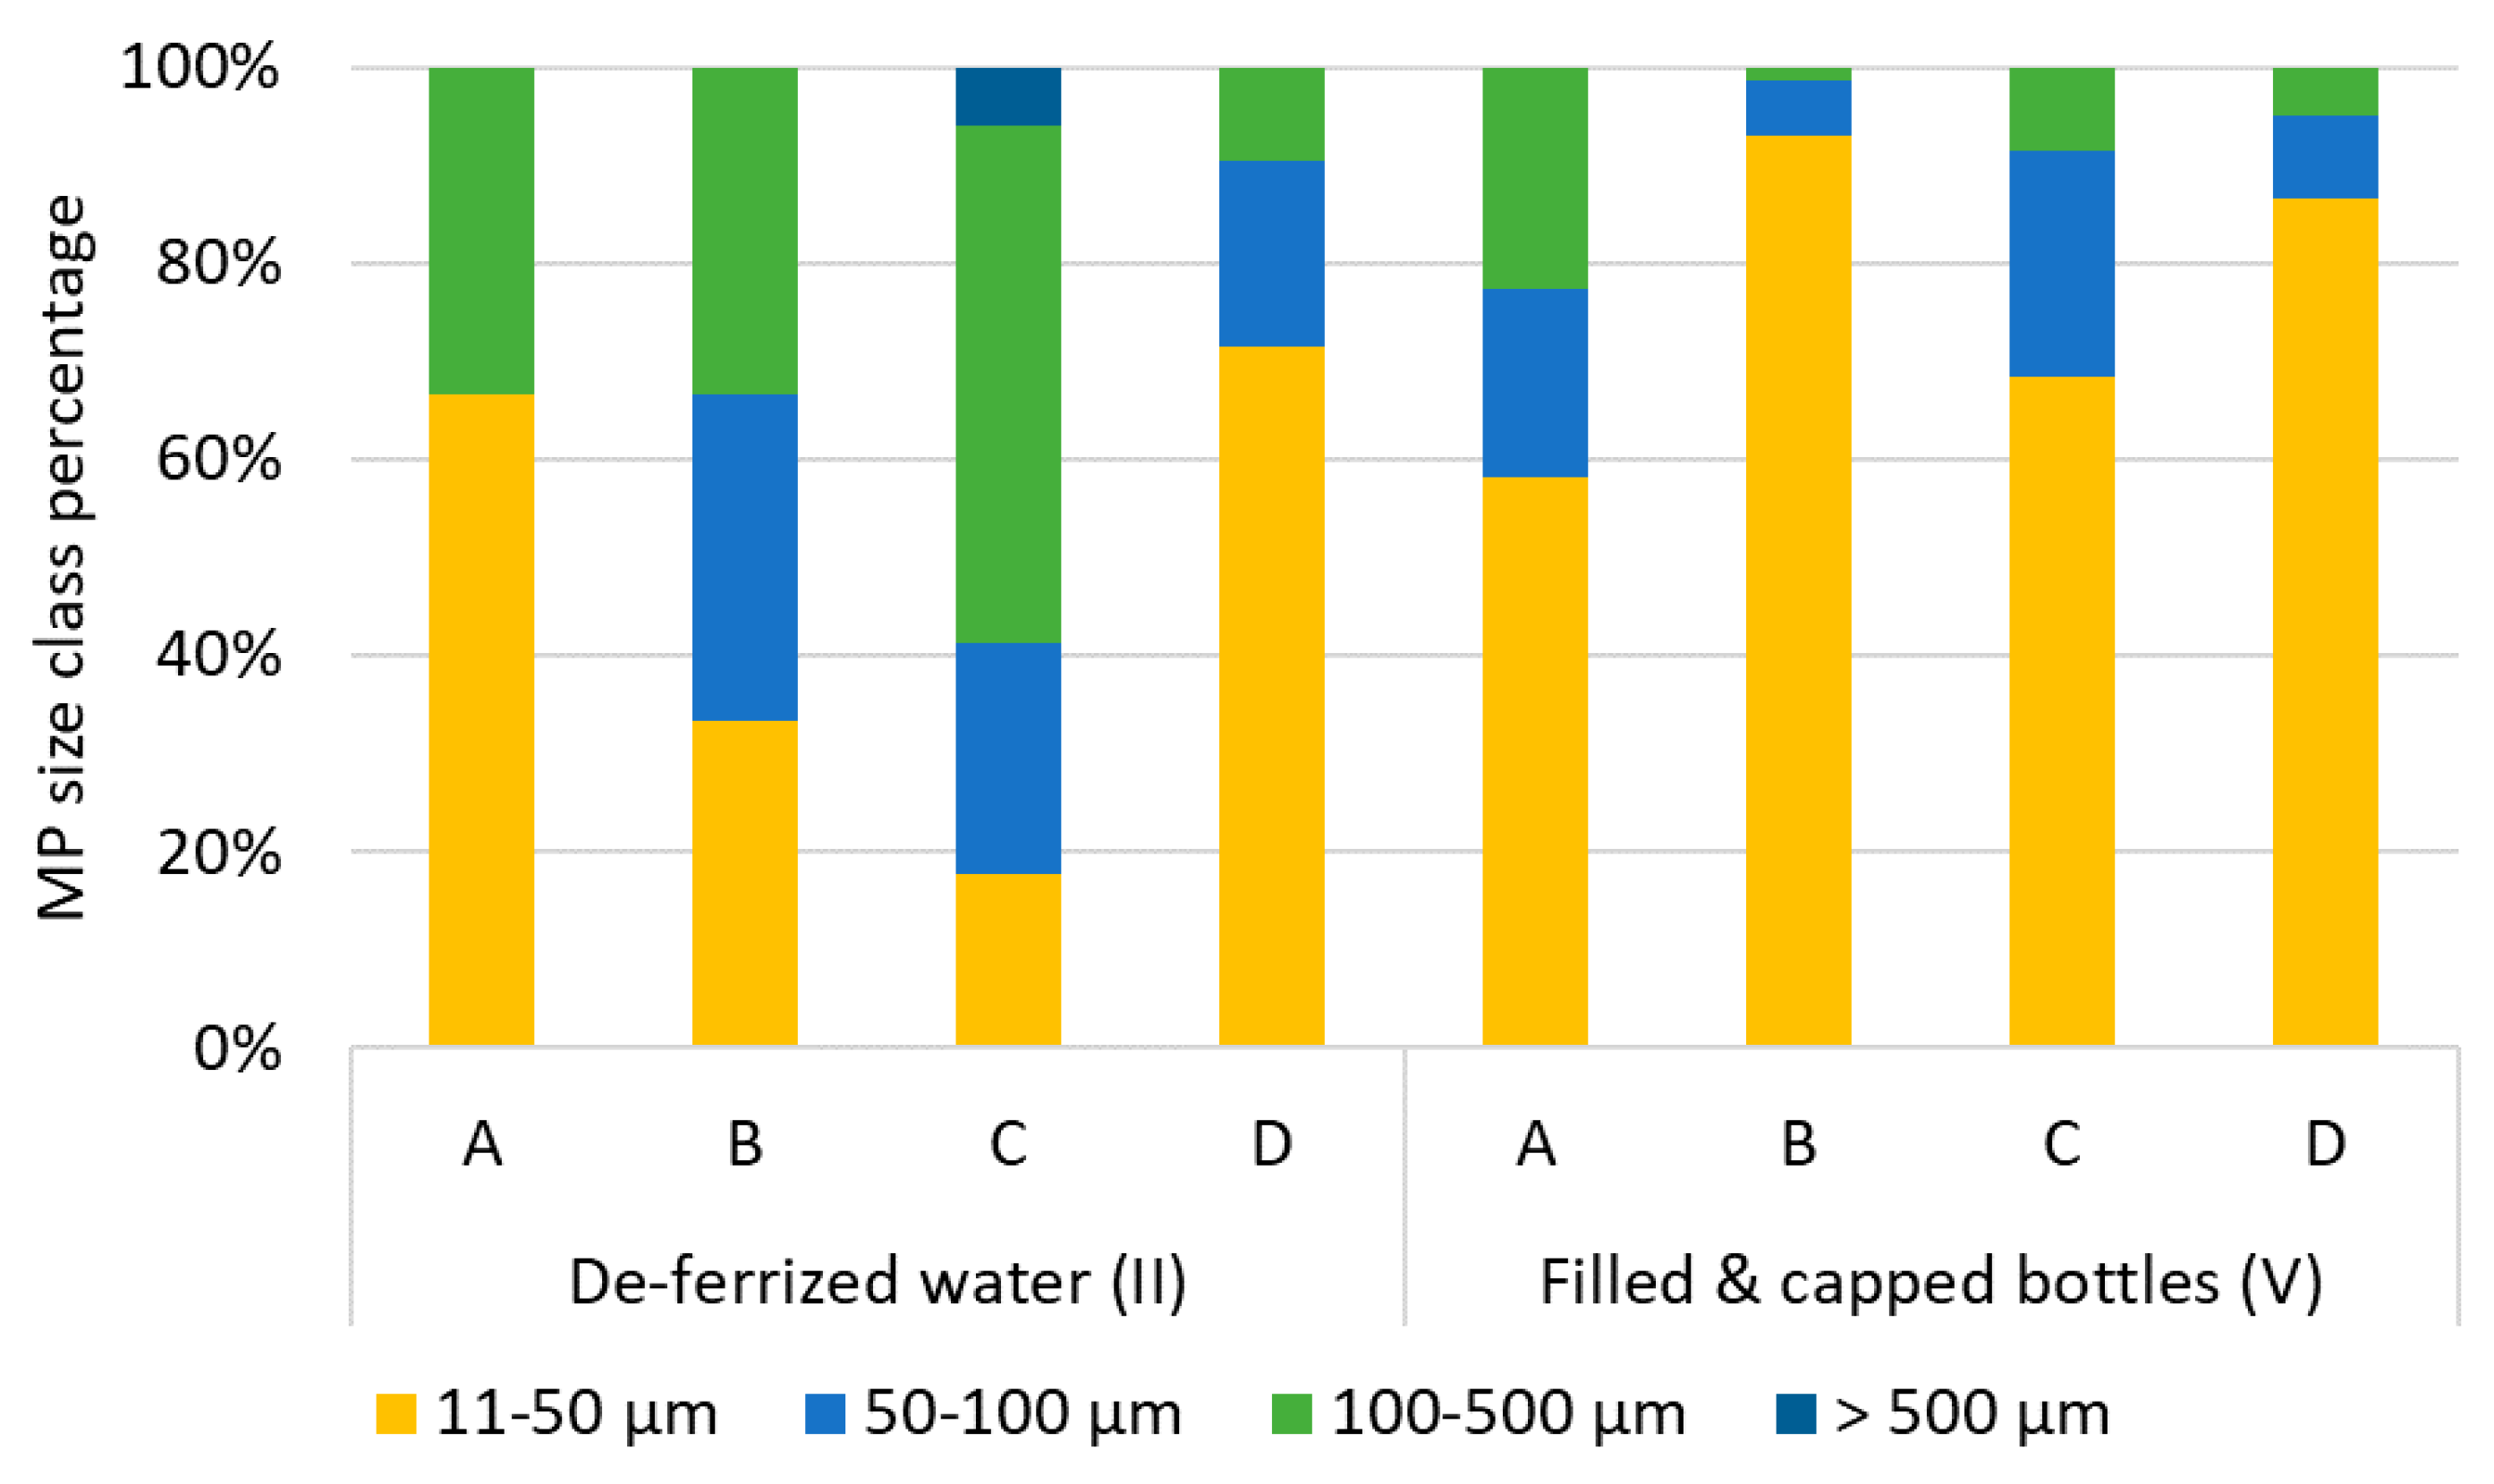
In raw waters, particle sizes ranged from 11 (lower size limit) to 530 µm. Particle size distributions show that more particles were found in the smaller size ranges: 1% were bigger than 500 µm, 21% fell into the size class 100−500 µm, 16% into the class 50−100 µm, and the class 11−50 µm made up for 63% of MP particles. Fibers made up for 0−11% of MP. Particle sizes in deferrized waters were represented as follows: 11−50 µm: 47%, 50−100 µm: 19%, 100−500 µm: 32%, >500 µm: 1%, with slightly more fibers than in raw water (5−17%).
In filled and capped bottles, again the smaller particle size ranges were the most frequent: 11−50 µm: 60−93%, 50−100 µm: 6−23%, 100−500 µm: 1−25%. No particles >500 µm were detected. Assuming that MP abundance stays constant from iron removal to the bottle filler, especially the smallest MP particles increased after bottle capping (Figure 7) 76−98% of MP were classified as fragments.
4. Discussion
As this is the first study to investigate MP abundance from the well to the bottle, we summarized findings of our and other studies dealing with drinking water from ground water sources and mineral water in glass bottles in Table 3. As comparability of studies applying different methods for sampling, sample preparation and sample analysis is limited [32], only results for particles >10 µm (calculated from total MP concentrations and stated percentage >10 µm, details in Table S9) and spectroscopic methods are taken into account.
Earlier investigations carried out by Mintenig et al. [8] revealed that MP were not present in all samples investigated. When present, they found a mean of 3.7 ± 2.5 MP m−3 in ground water samples using µFTIR, comprising 63% PEST and 13% PVC particles. Our study found PEST and PVC to be the most frequent polymer classes as well, yet, with 97 ± 53 MP m−3, MP concentrations were higher. Between 54% and 100% of MP were in the size range 11−50 µm, while Mintenig et al. [8] found no MP < 50 µm despite a lower detection limit of 20 µm. The differences in the findings of both studies as well as differences between the bottlers investigated in this study, may be attributed to different well and pipe ages, material properties and sample evaluation strategies.
The findings are similar for treated drinking water: Both studies found PEST, PA, and PVC to be the most frequent polymer types. MP concentrations (>50 µm) were 0.9 ± 0.8 MP m−3 in their study, while our samples contained 49 ± 3 MP m−3, of which 18−71% were between 11−50 µm. Overall, both studies agree that more MP were present in raw than in treated water, however, the abundance was always <1 MP L−1. Kirstein et al. [9] investigated MP in municipal drinking water derived from surface water through artificial groundwater infiltration and additional purification. Samples were analyzed using µFTIR and Py-GCMS. With µFTIR, treated water was found to contain on average 171 ± 398 MP m−3 in the range >10 µm (lower limit 6.6 µm). Most abundant were PA, PEST (both 0−100%) and acrylic (0−29%). The latter was not included in our RDF model, however, we found a high representation of PEST (26%) and PA (29%), as well. The most frequent class was PVC with 35%, which Kirstein et al. detected only in one sample using µFTIR, where it accounted for 50% of MP particles. Considering the results for Py-GCMS, which show that PVC was present in more than one sample, it can be argued that these particles were too small to be detected using µFTIR, yet numerous enough to exceed the LOD of Py-GCMS.
Contrarily, another study applying Raman micro spectroscopy (≥10 µm) found no evidence for MP in tap water, but only for pigment particles [11]. This highlights once again the need to identify risk factors for MP entry in drinking water.
Despite all differences and difficulties in comparing results of different studies, some aspects are consistent in the majority of data: (i) conventional drinking water treatment does not fully restrain MP, which is also stressed by 40−88% MP removal rates found by Pivokonsky et al. [33,34]. (ii) In drinking water like in environmental samples, most MP particles are found in the smaller size ranges. (iii) PEST, PA, and PVC seem to be the most frequent polymers in tap water. (iv) MP sources remain somewhat unclear despite suspecting machinery, treatment methods, and pipe materials [9,32]. Proofing them or other factors to release MP into water will require widespread and detailed investigations. (v) A trend towards using µFTIR and large sample volumes (≥1000 L) and more and more inclusion of method validation can be observed.
Regarding cleaned bottles, we could not confirm the presence of MP ≥ 11 µm, even though caustic cleaning solutions contained high loads of MP. This shows that either MP particles did not stick to the inner bottle walls or were completely rinsed out during fresh water jetting. Vice versa, fresh water jetting seems to be successful in minimizing carryover of MP particles in the studied size range from the caustic into the bottles. One more investigation on MP loads in cleaned glass bottles has been conducted utilizing Raman micro spectroscopy, resulting in 487 ± 257 MP L−1 in the size range > 10 µm [35]. These comparably high numbers may be attributed to the fact that in our study only nine kinds of plastics were included, potentially missing other plastic types. This is reflected in the most frequent polymer types identified by Oßmann [35]: styrene-butadiene-copolymer, PE and phenoxy resin. In addition, variance among beverage bottlers regarding machinery, bottle coatings, cap types and material surely play a role.
In addition to MP, Oßmann [35] found up to more than one million pigmented particles per L in cleaned glass bottles. Our study cannot replicate this finding through µFTIR because most pigments are not IR active, however, we can confirm the presence of blueish and metallic-glittery particles that most likely are pigments from the bottle labels or bottle cap varnishes.

Table 3.
Summary of results from this and other studies, confined to MP > 10 µm (calculated from published MP concentrations and size distributions, except for Mintenig et al. [8] whose lower detection limit was 20 µm, see Table S9) and spectroscopic detection methods. MP particle concentrations given in mean ± standard deviation. Results < LOD were excluded. MAPT = most abundant polymer types. n/a = not available. LOD = limit of detection.
| MP Detection Method | (I) Raw Water [MP m−3] | (II) Deferrized/Treated Tap Water [MP m−3] | (IIIb) Cleaned Glass Bottles [MP L−1] | (V) Filled & Capped Glass Bottles [MP L−1] | |||||
|---|---|---|---|---|---|---|---|---|---|
| MP Concentration m−3 | MAPT | MP Concentration m−3 | MAPT | MP Concentration L−1 | MAPT | MP Concentration L−1 | MAPT | ||
| This study (no blank subtraction) | µFTIR | 97 ± 53 (1 < LOD) | PVC 46% PEST 34% | 49 ± 3 (2 < LOD) | PVC 35%, PA 29% PEST 26% | all < LOD | n/a | 317 ± 257 | PE 81%, PS 11% |
| Mintenig et al. [8] (>20 µm, blanks subtracted) | µFTIR | 3.7 ± 2.5 | PEST 63%, PVC 13%, Epoxy resin 13% | 0.9 ± 0.8 | PEST 62%, PA 24%, PVC 14% | n/a | n/a | n/a | n/a |
| Kirstein et al. [9] (blanks subtracted) | µFTIR (and Pyr-GC/MS) | n/a | n/a | 171 ± 398 | PA 0–100%, PEST 0–100%, acrylic 0–29% | n/a | n/a | n/a | n/a |
| Weber et al. [11] | µRaman | n/a | n/a | 0 | n/a | n/a | n/a | n/a | n/a |
| Oßmann et al. [6,35] (excluding results for brand 1–2; no blank subtraction) | µRaman | n/a | n/a | n/a | n/a | 487 ± 257 | Styrene-butadiene-copolymer 35%, PE 22%, Phenoxy resin 18%, PS 10% | 212 ± 175 | PE 46%, PP 23% |
| Schymanski et al. [7] (no blank subtraction) | µRaman | n/a | n/a | n/a | n/a | n/a | n/a | 28 ± 29 | PEST 41%, PE 35% |
In capped glass bottles, filled with mineral water, other studies detected 28 ± 29 MP L−1 to 212 ± 175 MP L−1 in the size class >10 µm [6,7]. Thus, the concentrations we found, 317 ± 257 MP L−1, are relatively high, yet within the order of magnitude of the results of other groups.
All three studies found PE to be among the prevailing polymer types (see Table 3). A recent work drew attention to false positive findings stemming from disposable gloves [36]. We did not use gloves when handling bottle samples and can therefore exclude this source of contamination. Our examination shows that MP contamination is <1 MP L−1 until bottle capping. It is known that opening and closing of water bottles leads to abrasion from the bottlenecks and caps [10,37]. ATR-FTIR measurements of the cap sealings revealed that they were made from a PE-like material (see Figure 8), thus, we suspect that the PE particles detected were generated when opening the bottles. All bottlers used a cap sealing material specified as “PVC-free soft polyolefin”. Different variants of this material are on the market. Remarkably, the caps of the bottles with the highest MP concentrations (B, C) both had sealings made from the same variant. Besides the material, capping parameters (contact pressure, drawing depth) may play a role, as well.
Another factor which may explain why total MP concentrations increased, is that the caps are stored in open containers where they may be contaminated through the air. Additionally, bottle caps experience mechanical stress in cap feeding and sorting systems which may lead to abrasion of cap varnish or the cap security ring (PE).
Cap cleaning devices are available that work with ionized air, suction, or rinsing. The success of these strategies to effectively reduce MP loads in mineral water or other beverages, however, has not been proven yet. Keeping in mind that abrasion from the cap sealing seems to play a major role, it can be argued that such devices may not be able to entirely resolve the issue of MP in beverages.
5. Short Digression: Caustic Cleaning Solution Renewal
MP concentrations ≥11 µm in caustic solutions (IVa) ranged from 489 to 3240 MP L−1 (mean 1826 ± 1199 MP L−1, LOD 81 MP) (Figure 9). MP in three caustics comprised mostly PE (67−81%), while one was PP-dominated (62%). Sizes ranged from 11 to 642 µm, with 56% of particles in the size class 11−50 µm. The high share of PE particles most likely stems from abrasion of cap sealings generated when caps are twisted [10,37]. Particle concentrations rose from 489 MP L−1 to 2109 MP L−1 (Details in Figure S1), even though the caustic underwent regular sedimentation. However, due to the low density of plastics, sedimentation may rather enrich than remove MP.
Freshly prepared caustic, sampled during the first day in use, had a similar MP concentration as the old caustic (1798 MP L−1 and 2109 MP L−1), indicating that contamination took place very quickly. Oßmann [35] observed an increase of MP ≥1.5 µm in cleaned glass bottles after caustic renewal, as well, and concluded that either MP were already present in the fresh caustic or contamination took place very rapidly. The NaOH-detergent concentrate bore 1743 MP L−1 but is diluted for usage by a factor of 25 and therefore does not significantly contribute to the MP load in the caustic. Consequently, insufficient removal of MP during sedimentation and caustic renewal rather seem to play a major role here.
6. Conclusions
This study for the first time followed mineral water from the well to the bottle, aiming to identify entry paths for MP and to point out possible entry minimization strategies. Investigating samples from four mineral water bottlers revealed that MP is present throughout all steps of mineral water bottling. However, concentrations are <1 MP L−1 for raw ground water and further decrease during iron removal and filtering processes. The assumption, that MP particles particularly enter re-usable bottles during the bottle cleaning process, could not be confirmed; cleaned, unfilled bottles were found to be nearly free of MP in the size range analyzed (≥11 µm), even though the caustic bottle cleaning solution contained thousands of MP per L. It seems that carryover of MP particles from the caustics into the bottles was prevented by fresh water jetting. Instead, a drastic increase in MP numbers was found when comparing un-capped and capped bottles, hinting at capping and bottle opening to be the main entry paths for MP in bottled mineral water. Cap sealing materials should therefore be tested for abrasion resistance. Further, cap cleaning methods such as aspiration or rinsing should be conceived to minimize MP entry in bottled water.
Supplementary Materials
The following are available online at https://www.mdpi.com/2073-4441/13/6/841/s1, Tables S1–S5: Sampling details and microplastics (MP) findings in samples and blanks, Figure S1: MP concentrations in caustic cleaning solution from bottler D, Figure S2: Holder for Anodisc filters and measured area, Figure S3: Particle size determination in FTIR images, Figure S4: Deviation of particle dimensions, Table S6: Example spectra of smallest particles detected, Table S7: Confusion matric for evaluation of Random Decision Forest Model, Table S8: Evaluation results for Ransom Decision Forest Model, Table S9: Considerations for comparison with other studies.
Author Contributions
Conceptualization, J.W., I.B., T.H., N.P.I. and K.G.; methodology, J.W., I.B. and B.H.; software, J.W., B.H. and H.L.; validation, J.W. and B.H.; writing—original draft preparation, J.W.; writing—review and editing, J.W., I.B., B.H., T.H., H.L., N.P.I., K.G.; supervision, T.H., H.L., N.P.I., K.G. All authors have read and agreed to the published version of the manuscript.
Funding
This research was funded by the Bayerische Forschungsstiftung, grant number 1258-16. The APC was funded by the university library of TUM.
Data Availability Statement
The data presented in this study are available in this article and the supplementary materials.
Acknowledgments
The authors gratefully appreciate the contribution of the campus technicians for manufacturing the Anodisc filter holder and the laboratory filtration device. J.W. especially thanks the fellow Ph.D. students in the project for their support and fruitful discussions.
Conflicts of Interest
J.W., I.B., N.P.I., T.H. and K.G. declare that they are free of competing interests. H.L. and B.H. have to report competing interests: H.L. is the owner of Epina GmbH, which develops and sells Epina ImageLab. B.H. is co-funder and CTO of Purency GmbH, which develops a Random Decision Forest model for purchase. The model used in this work is not the commercial model and was developed by J.W. B.H. provided scripts for automation of the analysis pipeline. Further, there has not been any financial involvement in this research of any of the two companies. The funders had no role in the design of the study; in the collection, analyses, or interpretation of data; in the writing of the manuscript, or in the decision to publish the results.
Abbreviations
| BaF2 | barium fluoride |
| EtOH | ethanol |
| EvOH | ethylene vinyl alcohol |
| FPA | focal plane array (detector) |
| µFTIR | Fourier-transform-infrared imaging |
| MAPT | most abundant polymer types |
| MP | microplastics |
| n/a | not available |
| NaOH | sodium hydroxide |
| PA | polyamide |
| PE | polyethylene |
| PEST | polyesters |
| PET | polyethelene therephthalate |
| PLA | polylactic acid |
| PP | polypropylene |
| PS | polystryrene |
| PVC | polyvinylchloride |
| Py-GCMS | pyrolysis-gas chromatography mass spectrometry |
| SDS | sodium dodecylsulfate |
| RDF | random decision forest |
References
- Van Cauwenberghe, L.; Janssen, C.R. Microplastics in bivalves cultured for human consumption. Environ. Pollut. 2014, 193, 65–70. [Google Scholar] [CrossRef] [PubMed]
- Rochman, C.M.; Tahir, A.; Williams, S.L.; Baxa, D.V.; Lam, R.; Miller, J.T.; Teh, F.-C.; Werorilangi, S.; Teh, S.J. Anthropogenic debris in seafood: Plastic debris and fibers from textiles in fish and bivalves sold for human consumption. Sci. Rep. 2015, 5, 14340. [Google Scholar] [CrossRef] [PubMed]
- Vinay Kumar, B.N.; Löschel, L.A.; Imhof, H.K.; Löder, M.G.J.; Laforsch, C. Analysis of microplastics of a broad size range in com-mercially important mussels by combining FTIR and Raman spectroscopy approaches. Environ. Pollut. 2021, 269, 116147. [Google Scholar] [CrossRef]
- Karami, A.; Golieskardi, A.; Choo, C.K.; Larat, V.; Galloway, T.S.; Salamatinia, B. The presence of microplastics in commercial salts from different countries. Sci. Rep. 2017, 7, srep46173. [Google Scholar] [CrossRef] [Green Version]
- Yang, D.; Shi, H.; Li, L.; Li, J.; Jabeen, K.; Kolandhasamy, P. Microplastic Pollution in Table Salts from China. Environ. Sci. Technol. 2015, 49, 13622–13627. [Google Scholar] [CrossRef] [PubMed]
- Oßmann, B.E.; Sarau, G.; Holtmannspotter, H.; Pischetsrieder, M.; Christiansen, S.H.; Dicke, W. Small-sized microplastics and pig-mented particles in bottled mineral water. Water Res. 2018, 141, 307–316. [Google Scholar] [CrossRef]
- Schymanski, D.; Goldbeck, C.; Humpf, H.-U.; Fürst, P. Analysis of microplastics in water by micro-Raman spectroscopy: Release of plastic particles from different packaging into mineral water. Water Res. 2018, 129, 154–162. [Google Scholar] [CrossRef]
- Mintenig, S.; Löder, M.; Primpke, S.; Gerdts, G. Low numbers of microplastics detected in drinking water from ground water sources. Sci. Total. Environ. 2019, 648, 631–635. [Google Scholar] [CrossRef]
- Kirstein, I.V.; Hensel, F.; Gomiero, A.; Iordachescu, L.; Vianello, A.; Wittgren, H.B. Drinking plastics?—Quantification and qualification of microplastics in drinking water distribution systems by µFTIR and Py-GCMS. Water Res. 2021, 188, 116519. [Google Scholar] [CrossRef]
- Winkler, A.; Santo, N.; Ortenzi, M.A.; Bolzoni, E.; Bacchetta, R.; Tremolada, P. Does mechanical stress cause microplastic release from plastic water bottles? Water Res. 2019, 166, 115082. [Google Scholar] [CrossRef]
- Weber, F.; Kerpen, J.; Wolff, S.; Langer, R.; Eschweiler, V. Investigation of microplastics contamination in drinking water of a German city. Sci. Total. Environ. 2021, 755, 143421. [Google Scholar] [CrossRef]
- Krottenthaler, M.; Glas, K. Brew Water. In Handbook of Brewing. Processes, Technology, Markets; Eßlinger, H.M., Ed.; WILEY-VCH Verlag GmbH & Co. KGaA: Weinheim, Germany, 2009; pp. 105–118. [Google Scholar]
- Blüml, S. Filling. In Handbook of Brewing. Processes, Technology, Markets; Eßlinger, H.M., Ed.; WILEY-VCH Verlag GmbH & Co. KGaA: Weinheim, Germany, 2009; pp. 275–320. [Google Scholar]
- Ben, J.; Mohamed, A.; Muduli, K. Optimizing Bottle Washer Performance in Cleaning Returnable Glass Bottles for Reuse in Beverage Packaging. Int. J. Adv. Sci. Technol. 2020, 29, 8149–8159. [Google Scholar]
- Blüml, S.; Fischer, S. Zugeordnete Anlagenbestandteile. In Handbook of Filling; (German original title: Handbuch der Fülltechnik); Kronseder, V., Ed.; Behr’s Verlag: Hamburg, Germany, 2009; pp. 495–541. [Google Scholar]
- VDM. Branchendaten 2019; VDM Verband Deutscher Mineralbrunnen e.V.: Bonn, Germany, 2019; Available online: https://www.mineralwasser.com/fileadmin/user_upload/2_Branchendaten_2019_neu.pdf (accessed on 1 December 2020).
- Breiman, L. Random Forests. Mach. Learn. 2001, 45, 5–32. [Google Scholar] [CrossRef] [Green Version]
- Lenz, R.; Labrenz, M. Small Microplastic Sampling in Water: Development of an Encapsulated Filtration Device. Water 2018, 10, 1055. [Google Scholar] [CrossRef] [Green Version]
- Löder, M.G.J.; Imhof, H.K.; Ladehoff, M.; Löschel, L.A.; Lorenz, C.; Mintenig, S. Enzymatic purification of microplastics in en-vironmental samples. Environ. Sci. Technol. 2017, 14283–14292. [Google Scholar] [CrossRef] [PubMed]
- Hufnagl, B.; Steiner, D.; Renner, E.; Löder, M.G.J.; Laforsch, C.; Lohninger, H. A methodology for the fast identification and moni-toring of microplastics in environmental samples using random decision forest classifiers. Anal. Methods 2019, 11, 2277–2285. [Google Scholar] [CrossRef] [Green Version]
- Vianello, A.; Jensen, R.L.; Liu, L.; Vollertsen, J. Simulating human exposure to indoor airborne microplastics using a Breathing Thermal Manikin. Sci. Rep. 2019, 9, 1–11. [Google Scholar] [CrossRef] [PubMed]
- Cowger, W.; Gray, A.; Christiansen, S.H.; De Frond, H.; Deshpande, A.D.; Hermabessiere, L.; Lee, E.; Mill, L.; Munno, K.; Ossmann, B.E.; et al. Critical Review of Processing and Classification Techniques for Images and Spectra in Microplastic Research. Appl. Spectrosc. 2020, 74, 989–1010. [Google Scholar] [CrossRef] [PubMed]
- Johnson, A.C.; Ball, H.; Cross, R.; Horton, A.A.; Jürgens, M.D.; Read, D.S.; Vollertsen, J.; Svendsen, C. Identification and Quantification of Microplastics in Potable Water and Their Sources within Water Treatment Works in England and Wales. Environ. Sci. Technol. 2020, 54, 12326–12334. [Google Scholar] [CrossRef]
- Horton, A.A.; Cross, R.K.; Read, D.S.; Jürgens, M.D.; Ball, H.L.; Svendsen, C.; Vollertsen, J.; Johnson, A.C. Semi-automated analysis of microplastics in complex wastewater samples. Environ. Pollut. 2021, 268, 115841. [Google Scholar] [CrossRef]
- Waddell, E.N.; Lascelles, N.; Conkle, J.L. Microplastic contamination in Corpus Christi Bay blue crabs, Callinectes sapidus. Limnol. Oceanogr. Lett. 2020, 5, 92–102. [Google Scholar] [CrossRef] [Green Version]
- Von der Esch, E.; Lanzinger, M.; Kohles, A.; Schwaferts, C.; Weisser, J.; Hofmann, T. Simple Generation of Suspensible Sec-ondary Microplastic Reference Particles via Ultrasound Treatment. Front. Chem. 2020, 8, 169. [Google Scholar] [CrossRef] [Green Version]
- Xu, Q.-S.; Liang, Y.-Z. Monte Carlo cross validation. Chemom. Intell. Lab. Syst. 2001, 56, 1–11. [Google Scholar] [CrossRef]
- Ballabio, D.; Grisoni, F.; Todeschini, R. Multivariate comparison of classification performance measures. Chemom. Intell. Lab. Syst. 2018, 174, 33–44. [Google Scholar] [CrossRef]
- Olesen, K.B.; Stephansen, D.A.; Van Alst, N.; Vollertsen, J. Microplastics in a Stormwater Pond. Water 2019, 11, 1466. [Google Scholar] [CrossRef] [Green Version]
- Hurley, R.R.; Lusher, A.L.; Olsen, M.; Nizzetto, L. Validation of a Method for Extracting Microplastics from Complex, Organic-Rich, Environmental Matrices. Environ. Sci. Technol. 2018, 52, 7409–7417. [Google Scholar] [CrossRef] [PubMed] [Green Version]
- Al-Azzawi, M.S.M.; Kefer, S.; Weißer, J.; Reichel, J.; Schwaller, C.; Glas, K. Validation of Sample Preparation Methods for Mi-croplastic Analysis in Wastewater Matrices—Reproducibility and Standardization. Water 2020, 12, 2445. [Google Scholar] [CrossRef]
- Koelmans, A.A.; Nor, N.H.M.; Hermsen, E.; Kooi, M.; Mintenig, S.M.; De France, J. Microplastics in freshwaters and drinking water: Critical review and assessment of data quality. Water Res. 2019, 155, 410–422. [Google Scholar] [CrossRef] [PubMed]
- Pivokonsky, M.; Cermakova, L.; Novotna, K.; Peer, P.; Cajthaml, T.; Janda, V. Occurrence of microplastics in raw and treated drinking water. Sci. Total. Environ. 2018, 643, 1644–1651. [Google Scholar] [CrossRef]
- Pivokonský, M.; Pivokonská, L.; Novotná, K.; Čermáková, L.; Klimtová, M. Occurrence and fate of microplastics at two different drinking water treatment plants within a river catchment. Sci. Total Environ. 2020, 741, 140236. [Google Scholar] [CrossRef]
- Oßmann, B. Determination of microparticles, in particular microplastics in beverages. Ph.D. Thesis, Friedrich-Alexander-Universität, Erlangen-Nürnberg, Erlangen, Germany, 3 April 2020. [Google Scholar]
- Witzig, C.S.; Földi, C.; Wörle, K.; Habermehl, P.; Pittroff, M.; Müller, Y.K. When Good Intentions Go Bad—False Positive Mi-croplastic Detection Caused by Disposable Gloves. Environ. Sci. Technol. 2020, 54, 12164–12172. [Google Scholar] [CrossRef] [PubMed]
- Sobhani, Z.; Lei, Y.; Tang, Y.; Wu, L.; Zhang, X.; Naidu, R.; Megharaj, M.; Fang, C. Microplastics generated when opening plastic packaging. Sci. Rep. 2020, 10, 1–7. [Google Scholar] [CrossRef] [PubMed] [Green Version]
Figure 1.
Schematic representation of water bottling and sampling locations: (I) raw water, (II) deferrized filtered water, (IIIa) cleaned glass bottles, (IIIb) filled glass bottles, (IVa) caustic cleaning solution, (IVb) caustic concentrate, (V) filled and capped glass bottles.
Figure 1.
Schematic representation of water bottling and sampling locations: (I) raw water, (II) deferrized filtered water, (IIIa) cleaned glass bottles, (IIIb) filled glass bottles, (IVa) caustic cleaning solution, (IVb) caustic concentrate, (V) filled and capped glass bottles.

Figure 2.
Sample preparation steps for sample types I–V.

Figure 3.
Shifted overlay of false color image and photograph of a PE particle (grey) and a PET particle (pink) (a). Axes in µm. Crosshairs indicate position of spectrum shown in (b): FTIR spectrum of the PE particle, absorption mode. Horizontal axis in wavenumbers, vertical axis dimensionless intensity counts.

Figure 4.
MP concentrations per L mineral water along the bottling process of four bottling sites (A–D), corresponding mean (error bars indicate standard deviation) and LODs for each sample type.
Figure 4.
MP concentrations per L mineral water along the bottling process of four bottling sites (A–D), corresponding mean (error bars indicate standard deviation) and LODs for each sample type.

Figure 5.
MP types and concentrations in raw and deferrized water from bottlers A–D.

Figure 6.
MP types and concentrations in cleaned, filled (B only) and filled and capped bottles from bottlers A–D.
Figure 6.
MP types and concentrations in cleaned, filled (B only) and filled and capped bottles from bottlers A–D.

Figure 7.
Percentage of MP per particle size class (particle length) in deferrized water (II) and filled and capped bottles (V) from bottlers A–D.
Figure 7.
Percentage of MP per particle size class (particle length) in deferrized water (II) and filled and capped bottles (V) from bottlers A–D.

Figure 8.
Example of transmission spectrum of a PE-like particle from a filled and capped water bottle compared to ATR spectra of cap sealing and PE reference material.
Figure 8.
Example of transmission spectrum of a PE-like particle from a filled and capped water bottle compared to ATR spectra of cap sealing and PE reference material.

Figure 9.
MP concentrations found in this study along the process of mineral water bottling (Drawn using RI-CAD, HiTec Zang GmbH, Germany).
Figure 9.
MP concentrations found in this study along the process of mineral water bottling (Drawn using RI-CAD, HiTec Zang GmbH, Germany).

Table 1.
MP in blank samples and calculated LOD for each sample type, rounded to integers.
| Blank Sample Type and Quantity | Raw Qater (I) n = 4 | Deferrized Water (II) n = 3 | Bottles (IIIa, IIIb, V) n = 4 | Caustic (IVa, IVb) n = 3 |
|---|---|---|---|---|
| MP in blanks (Mean ± Standard Deviation) | 12 ± 8 | 5 ± 5 | 13 ± 9 | 36 ± 15 |
| LOD | 36 | 20 | 40 | 81 |
Table 2.
Recovery rates determined with 95–145 µm PS particles for all sample preparation steps.
| Process | Extraction From Stainless Steel Cartridge | Bottle Flush Process | Density Separation | Sieving and Re-Suspending Procedure |
|---|---|---|---|---|
| Recovery rate and standard deviation [%] | 58 ± 6 | 86 ± 8 | 63 ± 8 | 83 ± 11 |
Publisher’s Note: MDPI stays neutral with regard to jurisdictional claims in published maps and institutional affiliations. |
© 2021 by the authors. Licensee MDPI, Basel, Switzerland. This article is an open access article distributed under the terms and conditions of the Creative Commons Attribution (CC BY) license (http://creativecommons.org/licenses/by/4.0/).
Share and Cite
MDPI and ACS Style
Weisser, J.; Beer, I.; Hufnagl, B.; Hofmann, T.; Lohninger, H.; Ivleva, N.P.; Glas, K. From the Well to the Bottle: Identifying Sources of Microplastics in Mineral Water. Water 2021, 13, 841. https://doi.org/10.3390/w13060841
AMA Style
Weisser J, Beer I, Hufnagl B, Hofmann T, Lohninger H, Ivleva NP, Glas K. From the Well to the Bottle: Identifying Sources of Microplastics in Mineral Water. Water. 2021; 13(6):841. https://doi.org/10.3390/w13060841
Chicago/Turabian StyleWeisser, Jana, Irina Beer, Benedikt Hufnagl, Thomas Hofmann, Hans Lohninger, Natalia P. Ivleva, and Karl Glas. 2021. "From the Well to the Bottle: Identifying Sources of Microplastics in Mineral Water" Water 13, no. 6: 841. https://doi.org/10.3390/w13060841
Note that from the first issue of 2016, this journal uses article numbers instead of page numbers. See further details here.