Article

Quantitative Ascription of Sediment Discharge Changes of Two Highly Sediment-Loaded Tributaries of the Yellow River in China: The Importance of Selecting Rainfall Index and Timescale

1
Key Laboratory of Water Cycle and Related Land Surface Processes, Institute of Geographic Sciences & Natural Resources Research, Chinese Academy of Sciences, Beijing 100101, China
2
College of Resources and Environment, University of Chinese Academy of Sciences, Beijing 100049, China
*
Author to whom correspondence should be addressed.
Water 2021, 13(6), 845; https://doi.org/10.3390/w13060845
Submission received: 25 February 2021 / Revised: 15 March 2021 / Accepted: 17 March 2021 / Published: 19 March 2021
(This article belongs to the Section Water Erosion and Sediment Transport)

Abstract

:
River sediment load has been changing conspicuously worldwide. The famous sediment-laden Yellow River in China has also had a declining sediment load in the past decades. This study made a quantitative ascription of the sediment discharge changes by non-parametric Pettitt test, rainfall and sediment discharge characteristic index calculation, correlation test, double cumulative curve regression and solving differential equation in the Huangfu and the Kuye basins in the main sediment sources of the Yellow River. The results indicated that: (1) The sediment discharge decreased significantly from 1956 to 2016, while the rainfall and rainfall erosivity only had a visible but insignificant decreasing trend. (2) Rainfall erosivity is better than other rainfall characteristic indexes in relation with sediment discharge. (3) The anthropogenic factor was the main driver for the reduction of sediment discharge with a percentage of 70.2–90.5% in different periods. The contribution of rainfall changes in flood season to sediment discharge reduction surpassed that in the whole year. (4) A percentage of 88% and 93% of suspended sediment yield reduction was attributed to streamflow reduction, and 12% and 7% to changes in C-Q relationship in the Huangfu and the Kuye basins, respectively.

1. Introduction

The longer-term records of annual sediment discharge data from 4307 of the world’s rivers showed that 40% of the rivers had a significantly declining sediment load, and they were mainly and widely distributed in North America and Eastern Asia [1]. As the river sediment load plays an important role in many aspects, including water use, nutrient and pollute transport, aquatic/riverbank environment and landform evolution, etc., the causes for the changes in river sediment load have become a hot topic of scholars for many years [2,3,4]. Soil erosion and sediment discharge in rivers are affected by rainfall, soil characteristics, topography, vegetation cover and soil and water conservation management [5,6,7]. Among these factors, rainfall is a natural factor that is hardly affected by human activities, hence the natural changes of sediment discharge were usually ascribed to and also estimated by rainfall variations [8]. The characteristic indexes of rainfall include annual rainfall, flood season rainfall, rainfall erosivity, rainfall concentration and so on. Numerous previous studies applied annual precipitation to analyze the impact of rainfall on annual sediment discharge [9,10,11,12].
In recent decades, investigating the effects of climate variability and human activities on sediment discharge were mainly done by the empirical regression method, soil erosion model method and differential method. The empirical regression method (such as linear regression method and double cumulative curve method) develops the correlation between sediment discharge and precipitation [13,14,15,16]. Soil erosion models, including RUSLE (Revised Universal Soil Loss Equation), WATEM/SEDEM (Water and Tillage Erosion Model and Sediment Delivery Model), SEDD (Sediment Delivery Distributed) and SWAT (Soil and Water Assessment Tool), have been widely applied under different land use scenarios at different spatial and temporal scales [17,18]. The distributed hydrological model SWAT is successful used in many countries to predict the impacts of land management practices on sediment transport [19,20,21]. However, the application of the erosion models is limited because of the high requirements for data quality, difficulty of data acquisition and complex calculation processes. The differential approach derived by Zhang [22] partitions the sediment discharge changes caused by temporal variations of water-yielding capacity and runoff–sediment relationship, and further divides the impacts of factors on sediment discharge into the variations of precipitation, evaporation, sediment concentration and anthropogenic runoff changes, providing guidance for long-term soil and water conservation strategy.
Soil erosion remains the critical environmental case in the Yellow River basin in China and has been a research hotspot for years [23,24,25,26]. The Hekouzhen-Longmen reach in the middle Yellow River is the principal source of sediment in the Yellow River [27]. The drainage area of the river reach accounts for 15.1%, but its sediment yield accounts for 61% of the Yellow River basin [28]. The areas underlain by soft sandstone in the north Hekouzhen-Longmen section are the major coarse sediment sources of the Yellow River, with a specific sediment yield of up to 30,000–40,000 t·km−2·a−1 [29]. The fragile ecological environment and the acute soil erosion in the areas seriously restrict the sustainable development of local economy and society [30,31]. Hydrological data show that the annual sediment discharge in the Yellow River basin has been decreasing, and studies have been done on the contributions of climate change and human activities to the sediment discharge reduction. Zuo [32] concluded that the changes in precipitation and temperature decreased runoff and sediment yield in a watershed in the Loess Plateau of China by 53.7% and 81.0% respectively, using the calibrated SWAT model. Qin [33] argued that rainfall in the flood season significantly influenced the annual sediment discharge in the Luoyugou basin. Gao [27] calculated the influence of precipitation, soil and water conservation and other human activities on sediment discharge and found that soil and water conservation practices played a critical role in reducing soil erosion intensity and sediment discharge in the Hekouzhen-Longmen reach. However, the annual or seasonal means of rainfall were considered in these previous studies. This may give an improper estimate of natural sediment discharge changes. Thus, it is necessary to reevaluate the rainfall effects on sediment discharge changes by taking into account the rainfall intensity and rainfall distribution within the year for clarifying the virtual mechanism of sediment yield changes and for improving watershed management and soil and water conservation strategies.
Based on the precipitation, runoff and sediment data from 1956 to 2016, this study did a quantitative ascription of sediment discharge changes of two major basins, the Huangfu and the Kuye, in the areas underlain by soft sandstone. The purpose of this paper is to (1) examine the correlation between different rainfall characteristics and sediment discharge and determine the best rainfall indexes relating with sediment discharge, (2) partition effects of climate factors and human activities on sediment discharge changes by empirical regression at both annual and monthly scales and (3) utilize the differential method to separate the proportion of sediment concentration and runoff changes in causing sediment discharge changes.

2. Materials and Methods

2.1. Study Area

The Kuye and Huangfu basins rank the first and second largest catchments in the areas underlain by soft sandstone. These two catchments are characterized by a continental monsoon climate, and the intra- and inter-annual variations of precipitation are striking, with 80% of the annual rainfall being concentrated in summer [34]. The Huangfu basin (110°18′–112°12′ E, 39°12′–39°54′ N) covers an area of 3246 km2 and the mainstream is 137 km long. It is located in the transitional area between the Loess Plateau and the grassland in desertification with a large area of exposed soft sandstone in the northwest, so the terrain of the basin is characterized by hills and gullies covered by soft sandstone, loess and sandy loess [35]. The landscape of the basin is mainly grassland, and partly farmland and woodland [10]. The Kuye basin (119°0′–110°52′ E, 38°23′–39°52′ N) covers an area of 8706 km2 and the mainstream is 241.8 km long. This basin is in the transitional band between Maowusu Desert and the soft sandstone and loess hilly-gully region. The dominant vegetation types are grasses, shrubs and psammophytes with a low coverage [36]. The major types of soil erosion in the Kuye and the Huangfu catchments include water erosion, wind erosion, gravity erosion and combined water–wind erosion.

2.2. Data

The monthly rainfall data from 1956 to 2016 were extracted from the monthly mean rainfall dataset of the Loess Plateau with 1 km resolution provided by National Earth System Science Data Center-Subcenter of Loess Plateau (http://loess.geodata.cn/, accessed on 30 July 2020). The data format is netcdf, which can be combined with ncread in MATLAB. The daily and monthly runoff and sediment discharge data from 1956 to 2016 (except 1990–2005) were collected from hydrological yearbooks of the Yellow River basin. The annual runoff and sediment discharge data from 1990 to 2005 were obtained from the Yellow River Sediment Bulletin. All the hydrologic data were measured by the Yellow River Conservancy Commission based on the Chinese national hydrographic standard criterion.

2.3. Methods

2.3.1. Detection of Change-Points

The non-parametric Pettitt test [37] was utilized to determine change-points in the sediment discharge sequences. It has been widely applied in detecting change-points in hydrological and meteorological series [38,39]. The Pettitt test statistic is defined as:
K T = m a x U t , T
U t , T = i = 1 t j = t + 1 T sgn ( X i X j )
where the function sgn (XiXj) equals −1 if XiXj < 0, 1 if XiXj > 0 and 0 if XiXj = 0. The change-point of the series is located at KT, and the probability of KT is estimated by:
p 2 exp ( 6 K T 2 T 3 + T 2 )
The change-point is significant if p ≤ 0.05.

2.3.2. Characteristic Indexes of Rainfall and Sediment Discharge

The rainfall and sediment indexes selected in this study include rainfall erosivity (R) and the modified Fournier index (MFI), which has been widely applied to develop the simple models of R factor [40], the variation coefficients of precipitation/sediment (Cvp/Cvs), the precipitation/sediment concentration index (PCI/SCI) and the precipitation/sediment concentration degree (PCD/SCD). Table 1 lists the formulas of these indexes. The standard algorithm for calculating the R value is formulated in RUSLE, but the algorithm needs pluviography records at < 15 min intervals [7] which are difficult to acquire. Studies have focused on developing simple models for the R factor using daily, monthly and annual rainfall data [6,8,15,41]. Ma [41] evaluated the applicability of 15 simple models in eastern China, and considered that among the monthly models, the model established by Wu [15] yielded the best calculation results, so we applied it to calculate the R in this study.

2.3.3. Meng’s Test for Correlation Coefficient

The correlation coefficient test was applied to evaluate the correlation between rainfall index and sediment discharge, and the rainfall index with the prior correlation was selected to analyze the contribution of rainfall changes on sediment discharge variation. The comparison of correlations involved dependent and independent methods. The correlations between sediment discharge and rainfall index are dependent because they have a common dependent variable, the sediment discharge. Meng’s test is a dependent correlation test and has been widely applied in psychological research [42]. Zheng and Chen [43] applied the test to determine the best rainfall erosivity indices of single storms in the Chinese Loess Plateau. Meng’s test was used to compare the correlations between rainfall index and sediment discharge in this study.
For comparing the correlations (r1 and r2) between two rainfall indexes and a common dependent variable, the sediment discharge, Meng’s test uses a Z statistic as follows:
Z = ( Z r 1 Z r 2 ) N 3 2 ( 1 r x ) h
h = 1 f r i 2 ¯ 1 r i 2 ¯
f = 1 r x 2 ( 1 r i 2 ¯ )
where zri is the Fisher z-transformed value for ri (i = 1 or 2), Z r i = 1 2 ln 1 + r i 1 r i , rx is the correlation between the two independent variables, N is the sample size, r i 2 ¯ = (r12 + r22)/2 and f is set to 1 if the value is greater than 1. The calculation process could be completed by the cocor package in R language. The probability of Z value is estimated by:
p 1 1 2 π e   z 2 2
The correlation of r1 is significantly better than r2 if p ≤ 0.05.

2.3.4. Attribution of Sediment Discharge Change to Natural and Anthropogenic Factors

a. Simple linear and double cumulative curve regression.
Studies have proven that the sediment discharge can be linearly related with rainfall factors [4,16,27,33]. Thus, the linear regression method was applied to analyze the relationship between rainfall erosivity and sediment discharge in the periods from 1956 to 2016 divided by change-points. The period before the first change-point is referred to as the baseline period and a later period as the change period. The formula for each period has a form of
S D = a R + b
where SD and R indicate the annual sediment discharge and rainfall erosivity, respectively.
The double cumulative curve method is a simple and practical method to determine the consistency of the hydrometeorological series. Previous studies indicated that the double cumulative curve method could successfully evaluate the relationship between runoff/sediment discharge and rainfall [15,16]. We used the method to establish the regression relationship between accumulated rainfall erosivity and sediment discharge, and then distinguish the contribution rate of precipitation and human activities. The regression equation for a period is as follows:
i = 1 k S D = a i = 1 k R + b ,   k = 1 ,   2 ,   3 ,   , n
where n is the number of years in a period, and SD and R represent the sediment discharge and rainfall erosivity, respectively.
The above two regression methods define the sediment discharge in the baseline period as SD1. The sediment discharge in the change period that is calculated by the regression equation of the baseline period is denoted by SD2, and the measured sediment discharge in the change period by SD3. Then, the changes of sediment discharge caused by climate change reflected here by rainfall variation are estimated as ∆SDcli = SD1SD2, and those by human activities as ∆SDhum = SD2SD3.
b. The differential equation.
The suspended sediment yield (SSY) is a product of streamflow and sediment concentration. In consideration of this relationship, Zhang [22] made an ascription analysis of SSY changes to variations of streamflow and sediment concentration, in which the latter was termed as C-Q relationship by Zhang [22] since it changes with streamflow. Applying the differential equation derived by Zhang [22] to quantify the contributions of streamflow and C-Q relationship comprises the following three steps:
(1) Dividing the daily runoff and sediment data over N years into n nonoverlapping discharge classes of equal length, λ = L/n, where L is the variation range of the streamflow (L and λ are defined on the log-discharge scale). The mean annual SSY for each period can be computed by:
Q s = 1 N i = 1 n j = 1 m q j · c j
where qj and cj are daily streamflow (mm) and the corresponding C-Q relationship (kg/m3) respectively, and m is the amount of data in each class. According to Zhang [22], discharge classification by a much lower or higher scaling interval may lead to the instability of calculation. Taking the middle value can ensure the accuracy of the estimation. The streamflow was divided into 100 classes on the log-discharge scale in our study.
(2) Calculating the mean annual frequency of streamflow fi and mean C-Q relationship c ¯ i at each class i, then the mean annual SSY can be written as:
Q s = i = 1 n q i · c ¯ i · f i
(3) The changes of mean annul SSY between two periods can be obtained as:
Δ Q s = i = 1 n q i · c ¯ i , 1 ( f i , 2 f i , 1 ) + i = 1 n q i · f i , 2 ( c ¯ i , 2 c ¯ i , 1 )
where subscripts 1 and 2 refer to the periods. The first summation in Equation (12) represents the effect of streamflow variations on SSY changes ( Δ Q s , Q ), and the second one represents that of C-Q relationship variations on SSY changes ( Δ Q s , v c ), that is:
Δ Q s , Q = i = 1 n q i · c ¯ i , 1 ( f i , 2 f i , 1 ) ,   Δ Q s , v c = i = 1 n q i · f i , 2 ( c ¯ i , 2 c ¯ i , 1 )

3. Results and Discussion

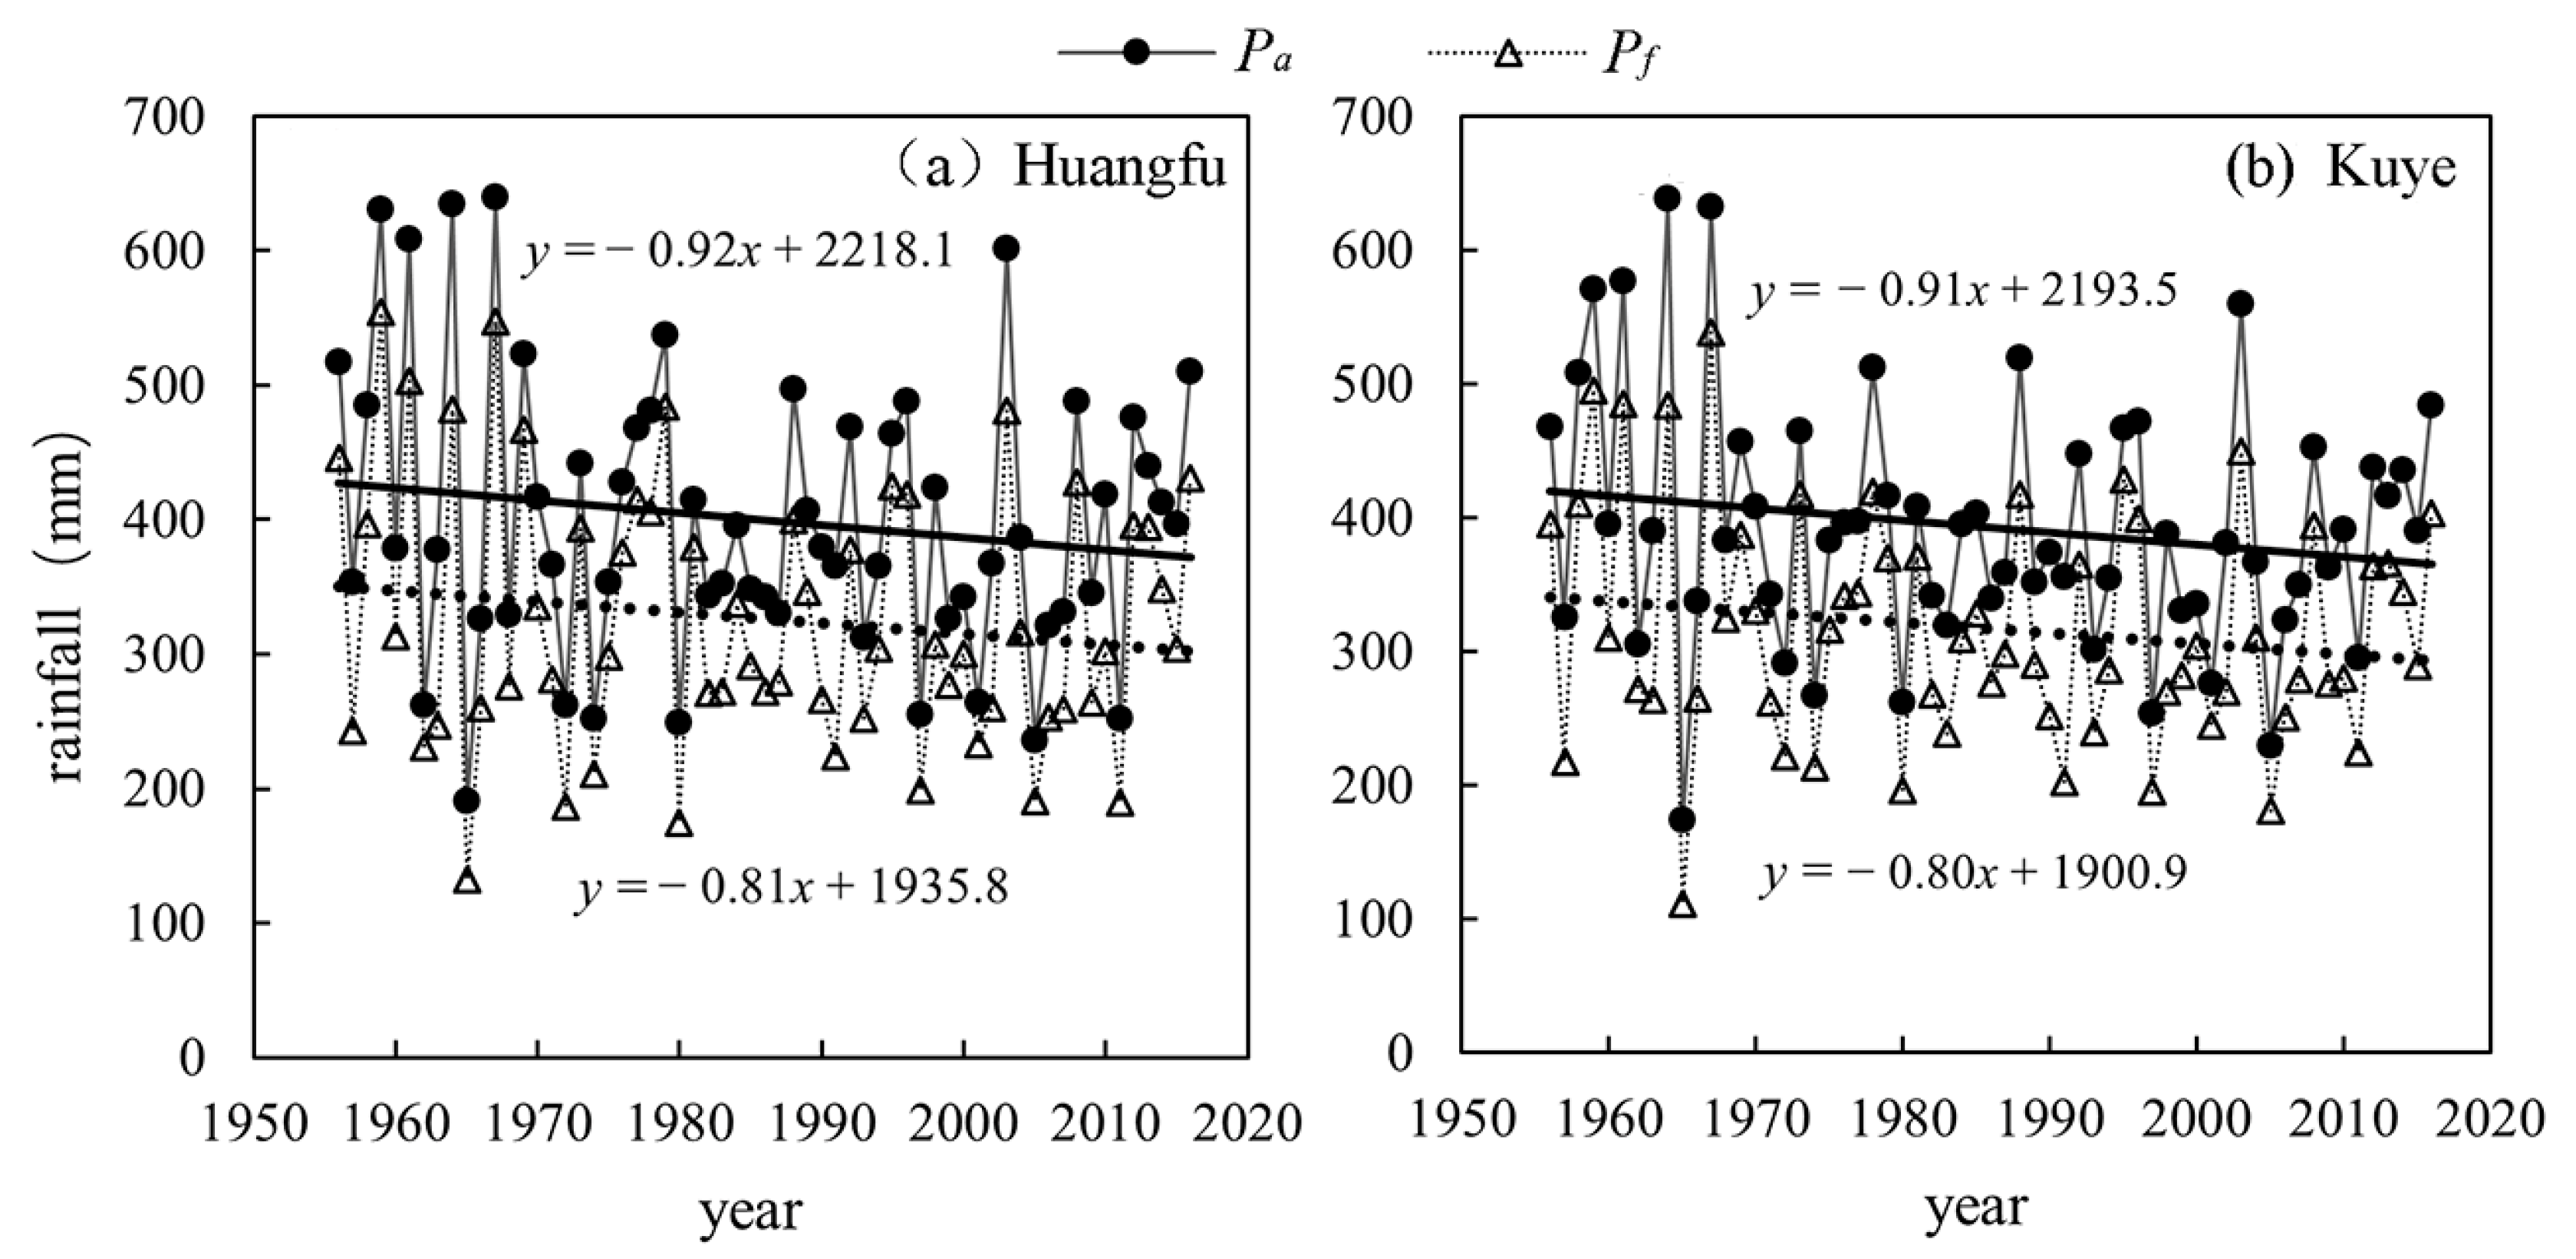
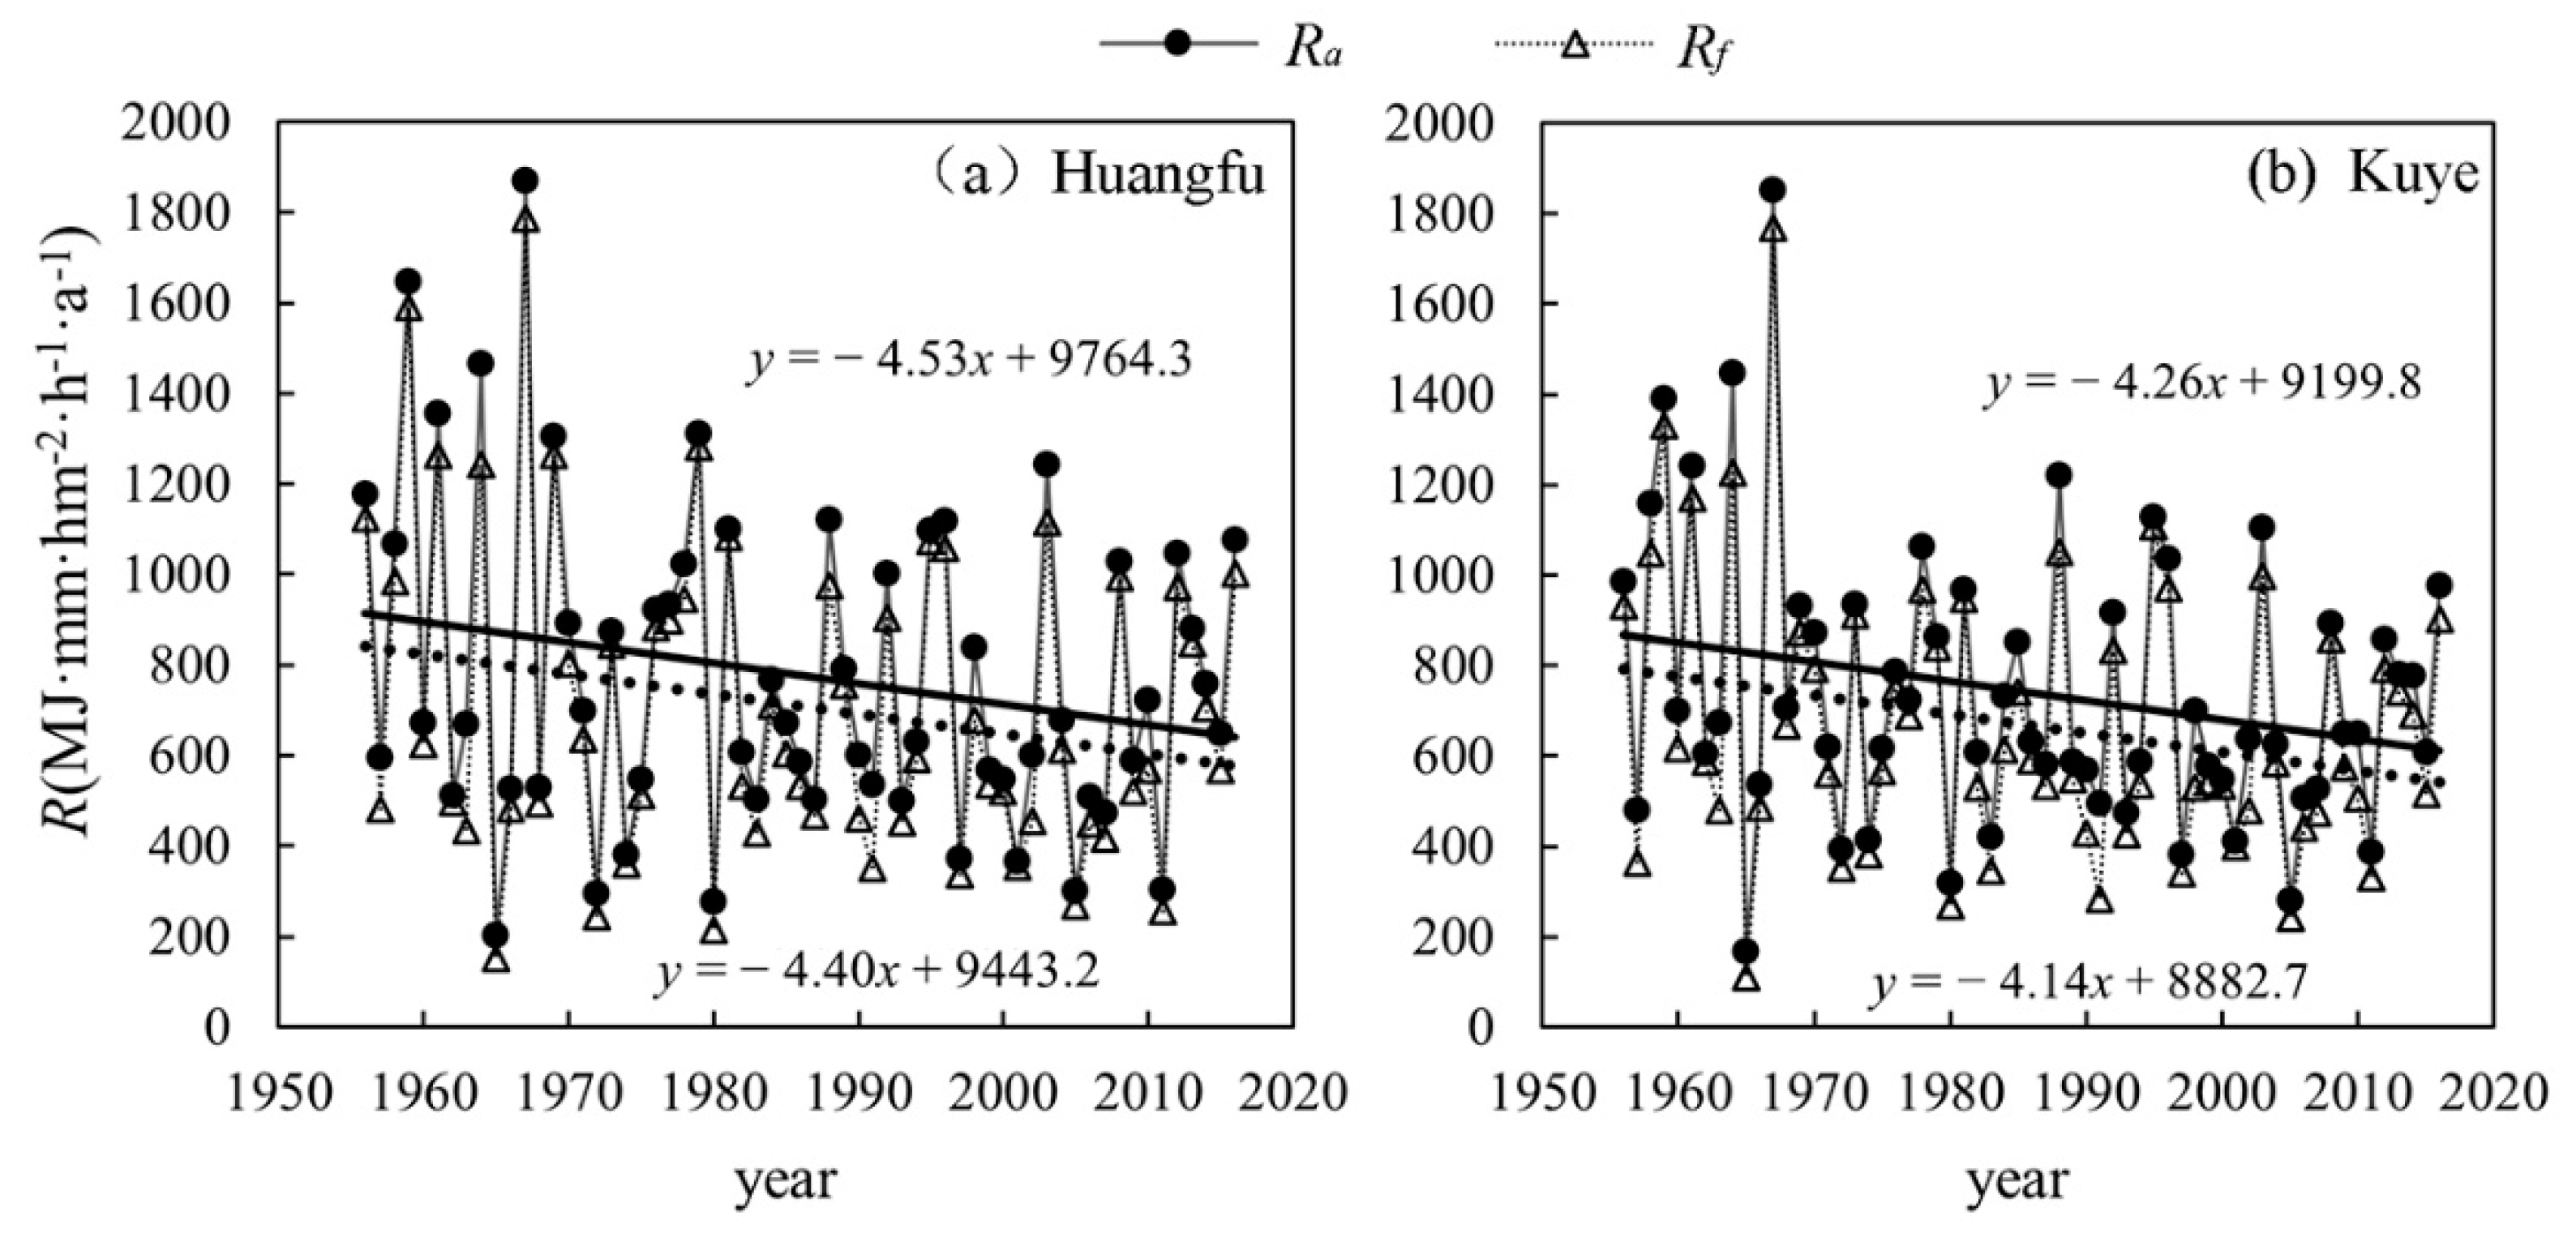
3.1. Rainfall Characteristic Values from 1956 to 2016

Figure 1 indicated that the interannual variations of rainfall and rainfall erosivity in the Huangfu and the Kuye basins from 1956 to 2016 were intense and reflected a visible but statistically insignificant decreasing trend (p > 0.057). In addition, the change-point was not detected by the non-parametric Pettitt test. The reduction rate of annual rainfall was 0.92 and 0.91 mm·a−1 respectively, and the rainfall in flood season was decreased by 0.81 and 0.80 mm·a−1, which accounted for 88.0% and 87.9% of the annual rainfall reduction rate, respectively. Rainfall erosivity expressed an annual decreasing rate of 4.53 and 4.26 MJ·mm·hm−2·h−1·a−1, and the annual decreasing rate in rainfall erosivity in flood season was 4.40 and 4.14 MJ·mm·hm−2·h−1·a−1 (Figure 2), which were 97.1% and 97.2% of the annual rainfall erosivity reduction rate, respectively. Hence, the variation of rainfall erosivity is significantly higher than rainfall in flood season.
The annual rainfall in the Huangfu basin ranged from 190.4 to 639.5 mm with an average of 396.5 mm and a variation coefficient of 0.26. The maximum and minimum rainfall were recorded in 1967 and 1965, respectively. The annual rainfall in the Kuye basin ranged from 174.3 to 638.1 mm, with an average of 391.1 mm and a variation coefficient of 0.24. The recorded maximum and minimum rainfall occurred in 1964 and 1965, respectively. The rainfall erosivity in the Huangfu and the Kuye basins ranged in 200–1868 and 168–1851 MJ·mm·hm−2·h−1·a−1, and the variation coefficients were 0.46 and 0.42 respectively, which were higher than rainfall. Thus, the annual rainfall and rainfall erosivity in the study area showed a similar variation trend, but the variability of rainfall erosivity was remarkably higher than rainfall.
The average values of rainfall characteristic indexes (CVP, PCI, MFI, PCD) also expressed a decreasing trend. The rainfall characteristic indexes CVP, PCI, MFI and PCD of the Huangfu basin in 2006–2016 decreased by 10.08%, 12.13%, 18.09% and 25.00% respectively, compared with those in 1956–1965 (Table 2). They were 7.96%, 9.82%, 17.52% and 33.33% respectively, in the Kuye basin. The rainfall characteristic indexes reflected the intra-annual distribution of rainfall. The mentioned reduction in rainfall characteristic indexes indicated that the intra-annual distribution of rainfall in 2006–2016 was more uniform than that in 1956–1965, and the concentration degree of rainfall decreased. The reduction of rainfall in flood season was dominant with a percentage of 67.7% in the Huangfu basin and 70.9% in the Kuye basin. Therefore, the reduction of sediment discharge caused by rainfall showed diversity on the intra-annual scale and analyzing the influence of rainfall factors on sediment discharge on a monthly rainfall scale was essential.

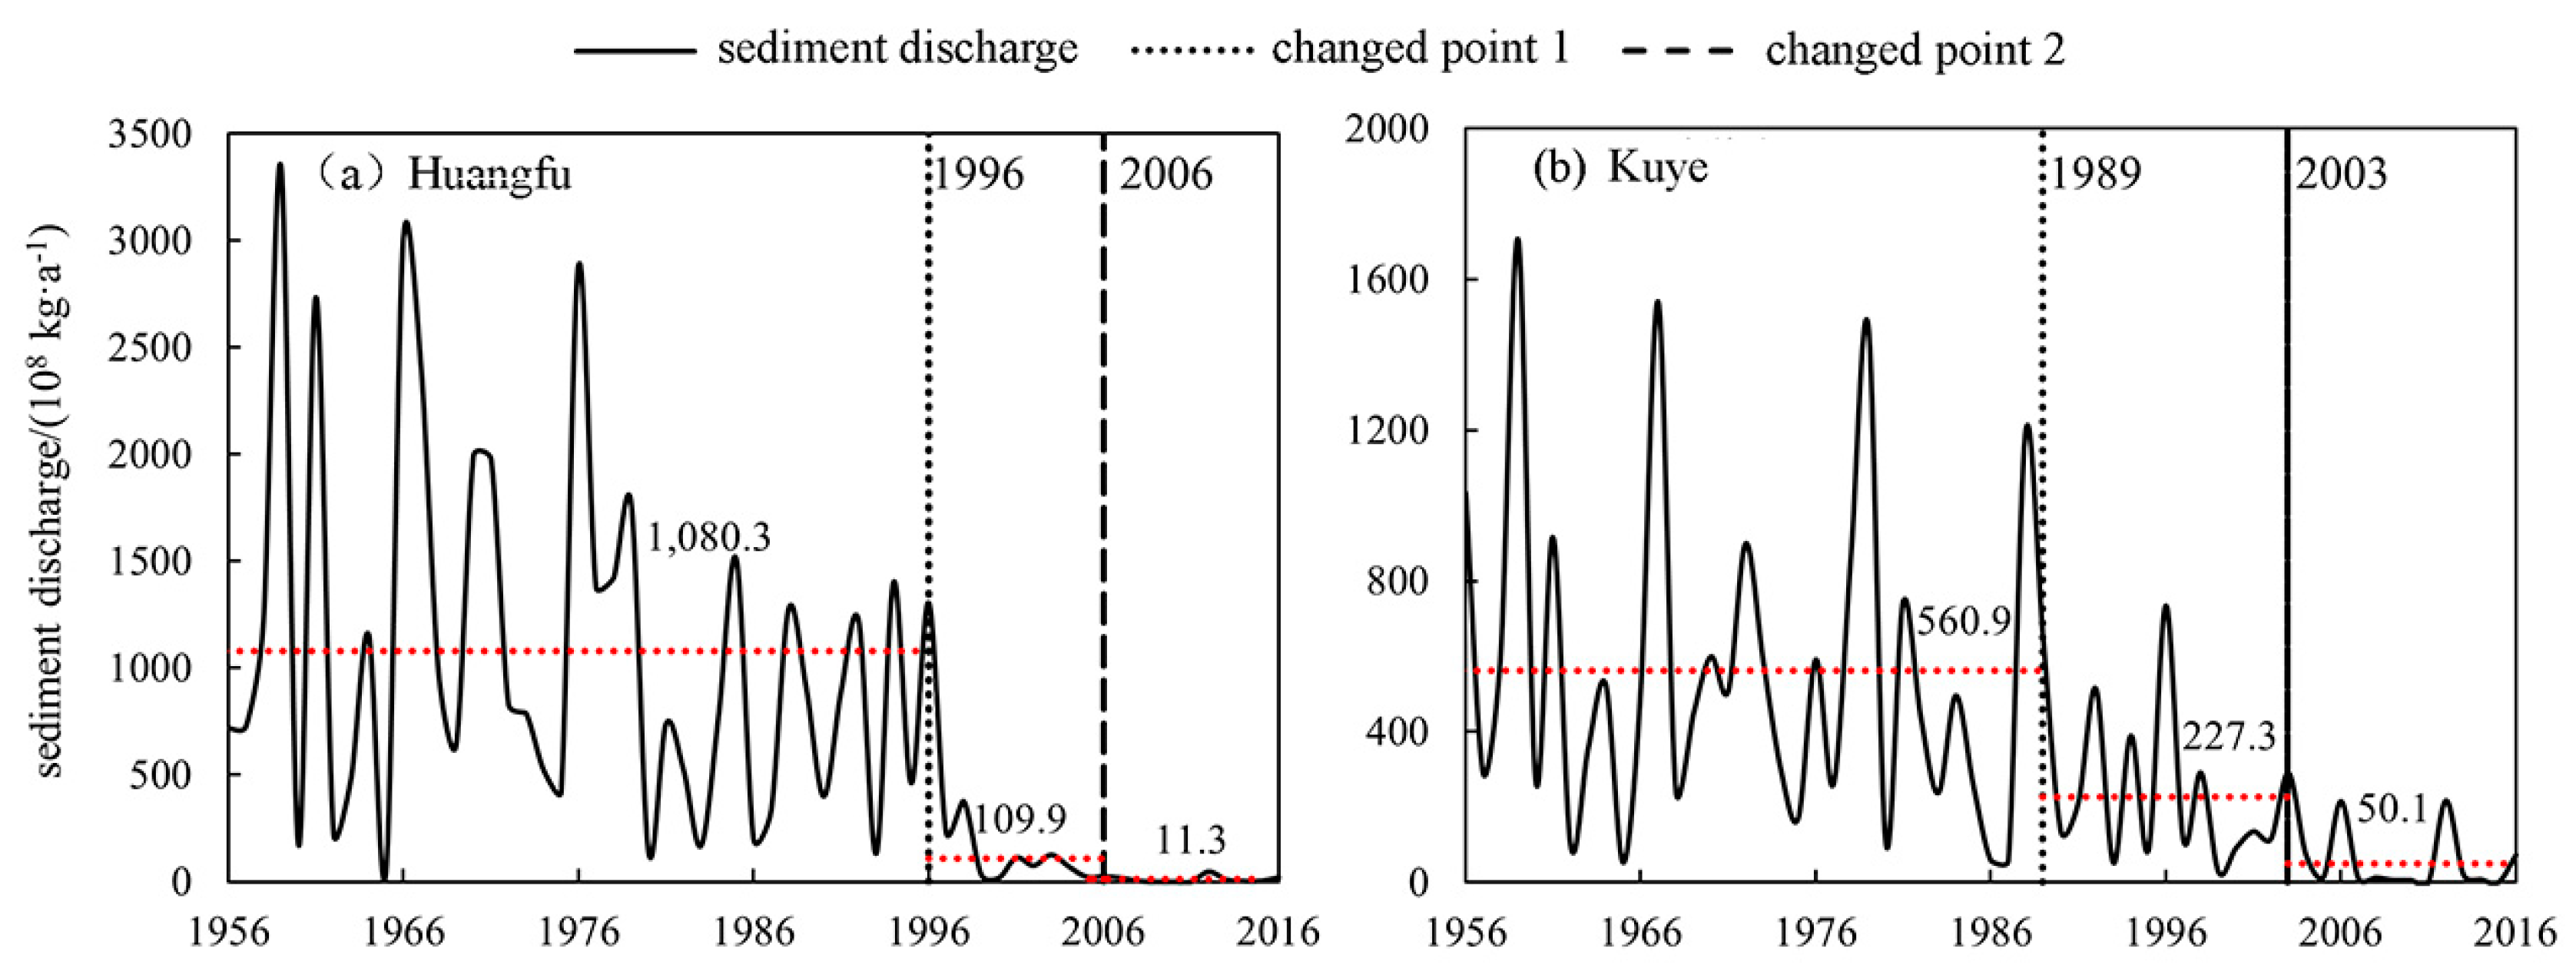
3.2. Changes of Sediment Discharge

Figure 3 indicates that the sediment discharge of the Huangfu and the Kuye basins had a significant stepwise decreasing trend, with a gradient of 12.37 × 10⁸ kg·a−1 and 15.26 × 10⁸ kg·a−1, respectively. Two change-points, i.e., the years 1989 and 2003, were identified by the non-parametric Pettitt test in the Huangfu basin. Therefore, the sediment discharge series could be divided into three periods: 1956–1989, 1990–2003 and 2004–2016, and the average annual sediment discharge in the three periods were 560.9 × 10⁸ kg·a−1, 227.3 × 10⁸ kg·a−1 and 50.1 × 10⁸ kg·a−1, respectively. The change-points in the Kuye basin were the years 1996 and 2006, and the average annual sediment discharge in 1956–1996, 1997–2006 and 2007–2016 were 1080.3 × 108 kg·a−1, 109.9 × 10⁸ kg·a−1 and 11.3 × 10⁸ kg·a−1, respectively. Clearly, the decrease of sediment discharge in the Kuye basin was much more notable than that in the Huangfu basin. The ratio of the annual mean sediment discharge of the Huangfu basin to that of the Kuye basin changed from 0.52 through 2.07 to 4.81 in turn in the three periods.
Because the monthly sediment discharge data from 1990 to 2005 are not available and the change-points of annual sediment discharge of the two basins occurred between the years 1989 and 2006, the monthly sediment discharge was divided into two periods: 1956–1989 and 2006–2016. The annual and flood season sediment discharges in 1956–1989 were significantly higher than those in 2006–2016. The annual sediment discharges of the Huangfu and the Kuye basins in 1956–1989 were 9.9 and 88.2 times of those in 2006–2016, and for flood seasons, they were 9.0 and 93.4 times, respectively. Figure 4 shows the conspicuous contrast of monthly mean sediment discharge between the two periods in the Huangfu and the Kuye basins. In the Huangfu basin, the indexes Cvs, SCI and SCD increased from the period of 1956–1989 to the period of 2006–2016, indicating that the intra-annual distribution of sediment discharge was more concentrated, with the sediment discharge in flood season accounting for 100% in the latter period (Table 3). In contrast, the indexes Cvs, SCI and SCD decreased in the Kuye basin from the period of 1956–1989 to the period of 2006–2016, indicating that the concentration degree of sediment discharge was reduced.

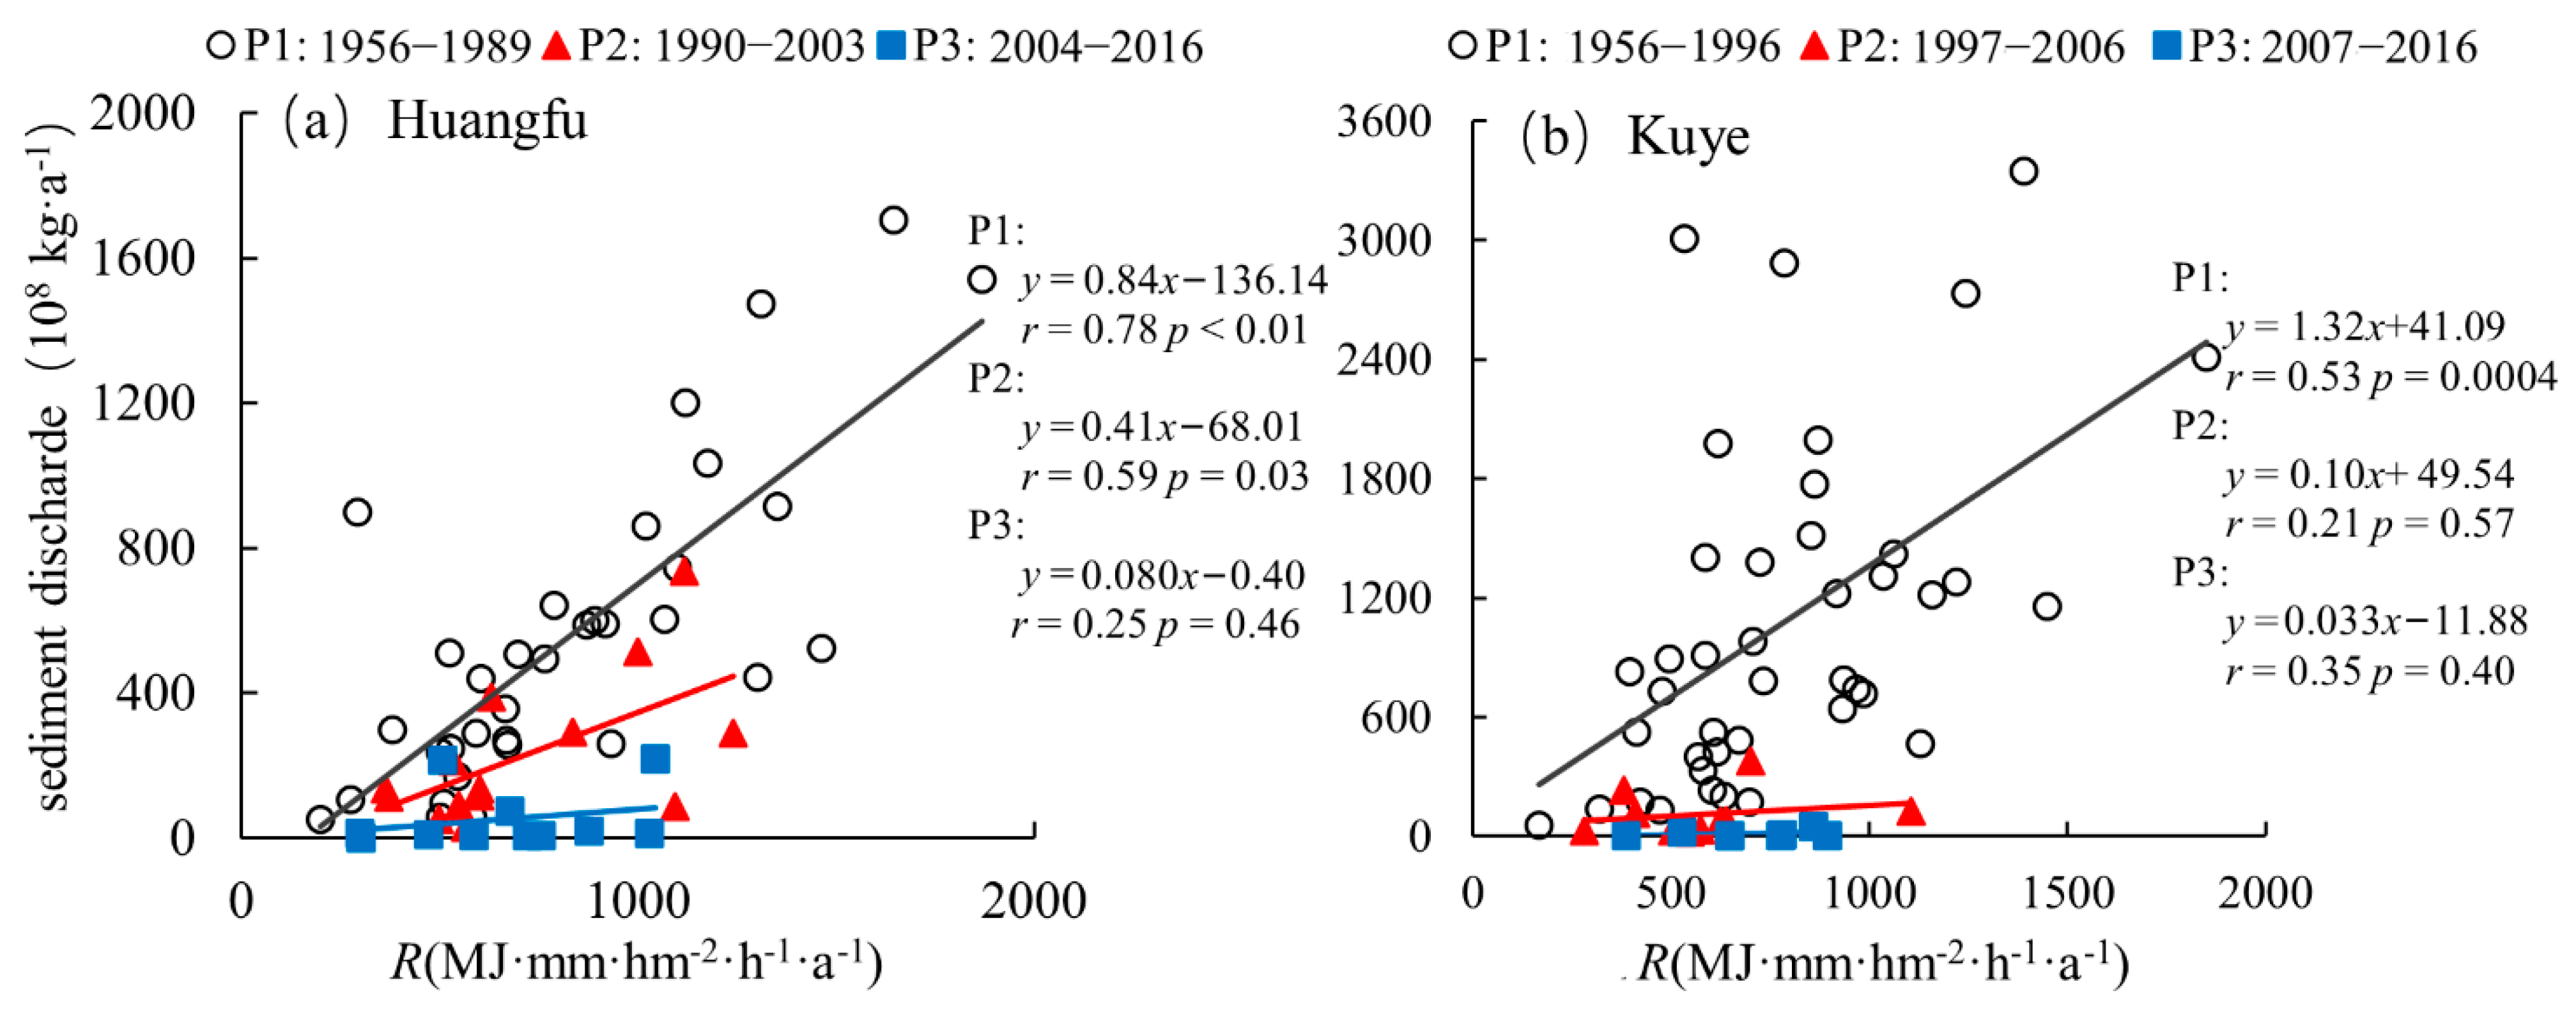
3.3. Significance Analysis of Correlation Coefficient

Based on the paired Meng’s test, the order of correlation between rainfall index and sediment discharge in the Huangfu basin was as follows: R > P = CVP > MFI > PCI = PCD, in which the correlation of rainfall erosivity R with sediment discharge was remarkably higher than the other indexes and the correlation of PCI and PCD with sediment discharge was the lowest (Table 4). In the Kuye basin, the correlations of PCI, PCD and CVP with sediment discharge were significantly lower than the other three rainfall indexes, the correlation of CVP was strikingly higher than PCI and no significant difference was examined between P, R and MFI, so the correlation of indexes with sediment discharge was ranked as P = R = MFI > CVP > PCI = PCD. It can be seen that for both basins, indexes R and P were at the top of ranks of correlation of indexes with sediment discharge, and R was better than P in the Huangfu basin. Hence, the contribution of climate change to sediment discharge change could be estimated more accurately by rainfall erosivity R than the other indexes.

3.4. Attribution of Sediment Discharge Variations

3.4.1. Attribution Analysis on Yearly Scale

Based on the aforementioned results of the change-point test, the annual sediment discharge series of the Huangfu basin was divided into the baseline period P1 (1956–1989), change periods P2 (1990–2003) and P3 (2004–2016), and that of the Kuye basin was divided into the baseline period P1 (1956–1996) and change periods P2 (1997–2006) and P3 (2007–2016). The relationships between annual sediment discharge and yearly rainfall erosivity and between cumulative sediment discharge and cumulative rainfall erosivity are shown in Figure 5 and Figure 6. Using the simple linear regression method, as given in Table 5, it was estimated that the contributions of human factors to sediment discharge reductions were 70.34% and 85.73%, and those of R factor were 29.66% and 70.34% respectively, in the two change periods in the Huangfu basin. They were 75.19% and 87.96% by human factor and 24.81% and 12.04% by R factor respectively, in P2 and P3 periods using the double cumulative curve method. In the Kuye basin, the contributions of human factor in P2 and P3 periods were 71.41% and 90.53% by simple linear regression method, and 70.19% and 89.87% by double cumulative curve method. The rainfall erosivity accounted for 28.59% and 9.47% by simple linear regression method, and 29.81% and 10.13% by double cumulative curve method in P2 and P3 periods, respectively. The above results revealed that the dominant factor inducing sediment discharge reduction was human activities in both the basins in the change periods, and the contribution of human activities increased from P2 period to P3 period by a percentage of 12.8–19.7%. Differences exist between the contribution rates derived using the simple linear regression method and the double cumulative curve method but are below 5%.

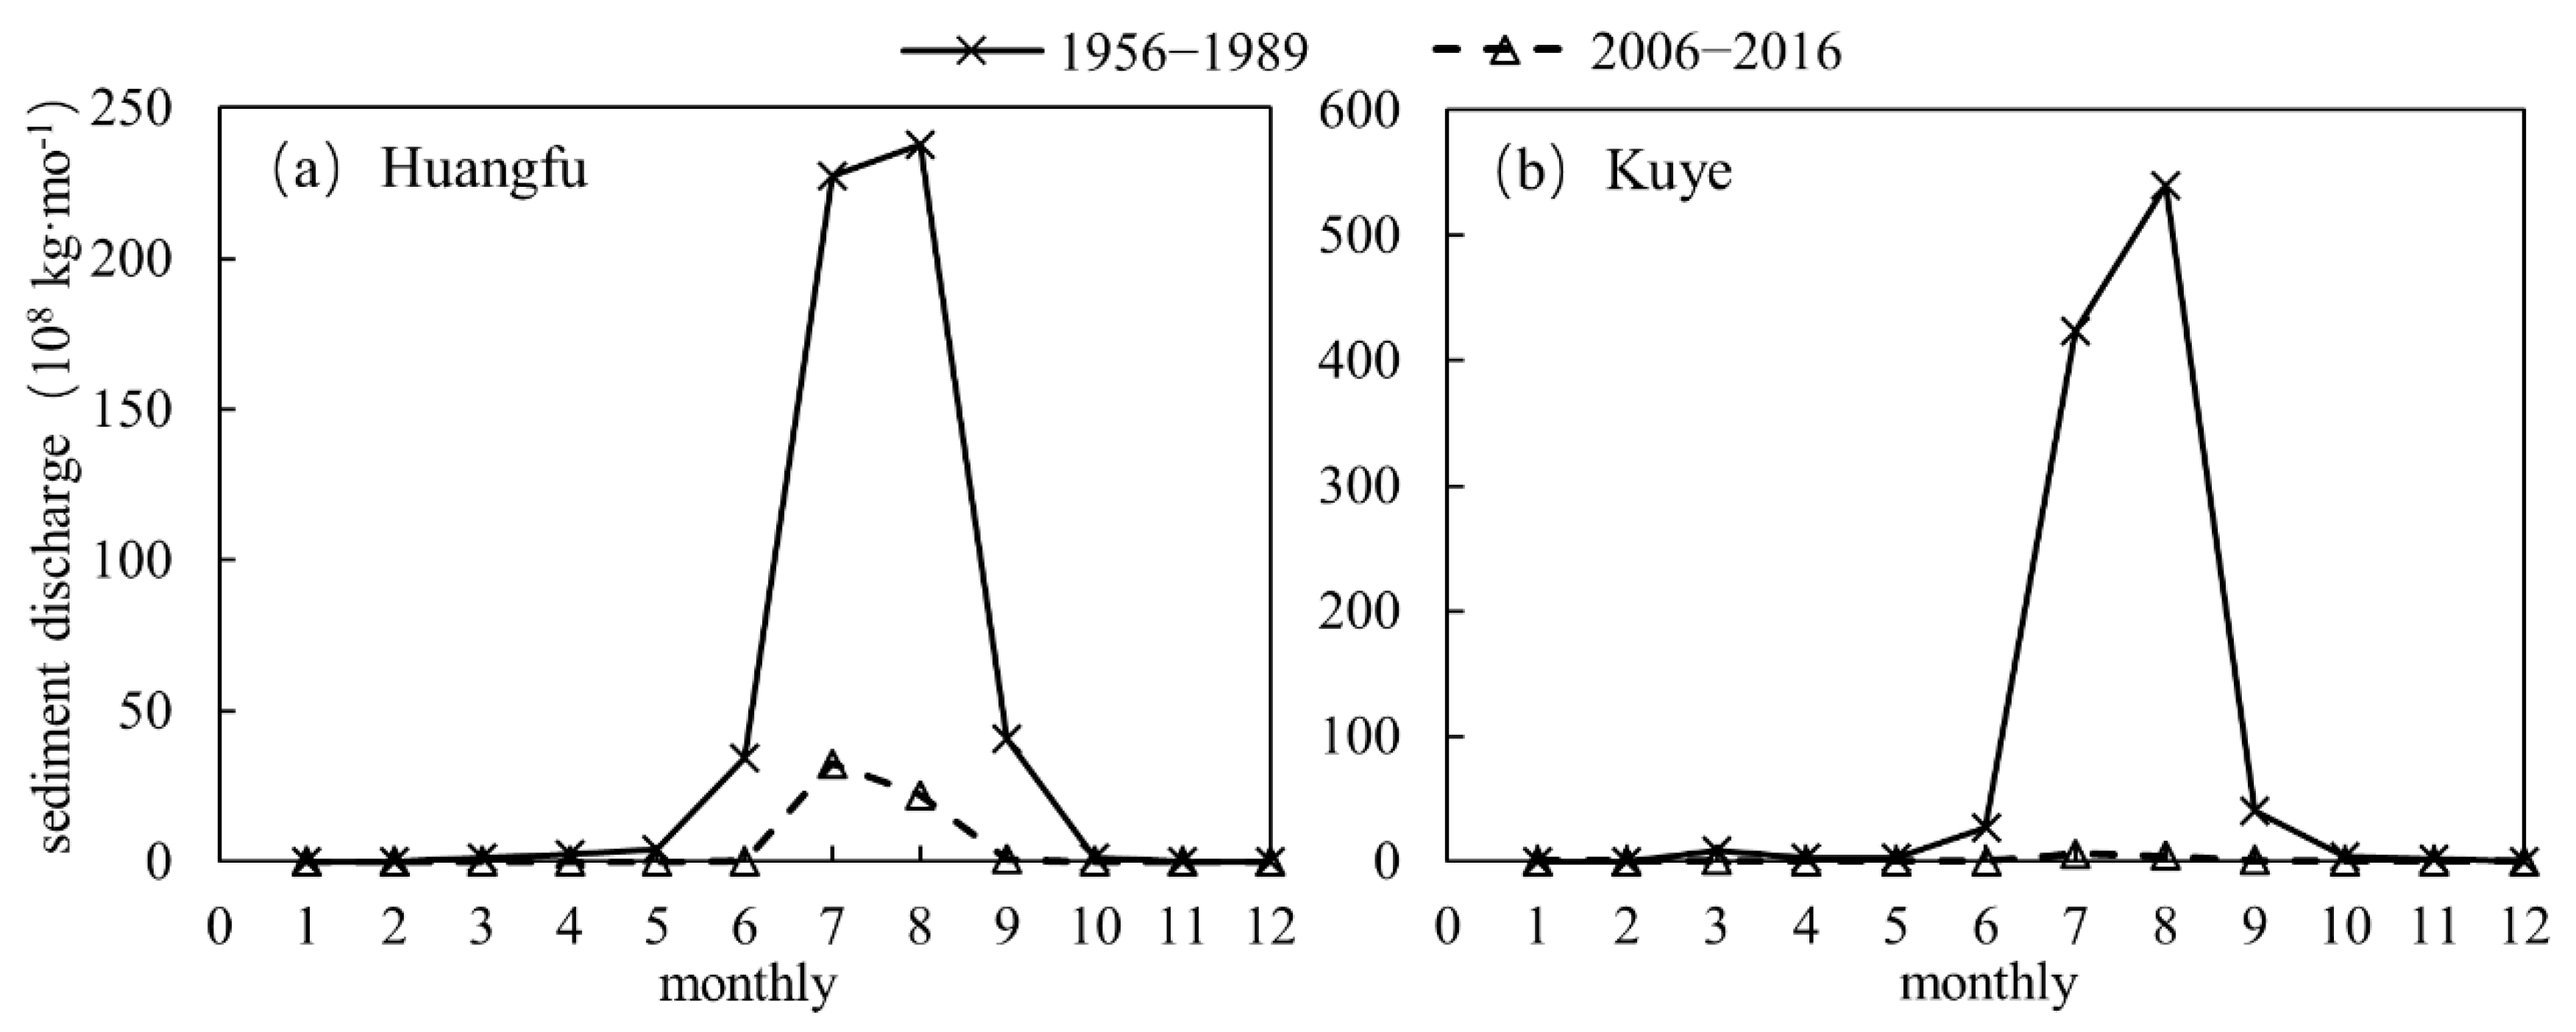
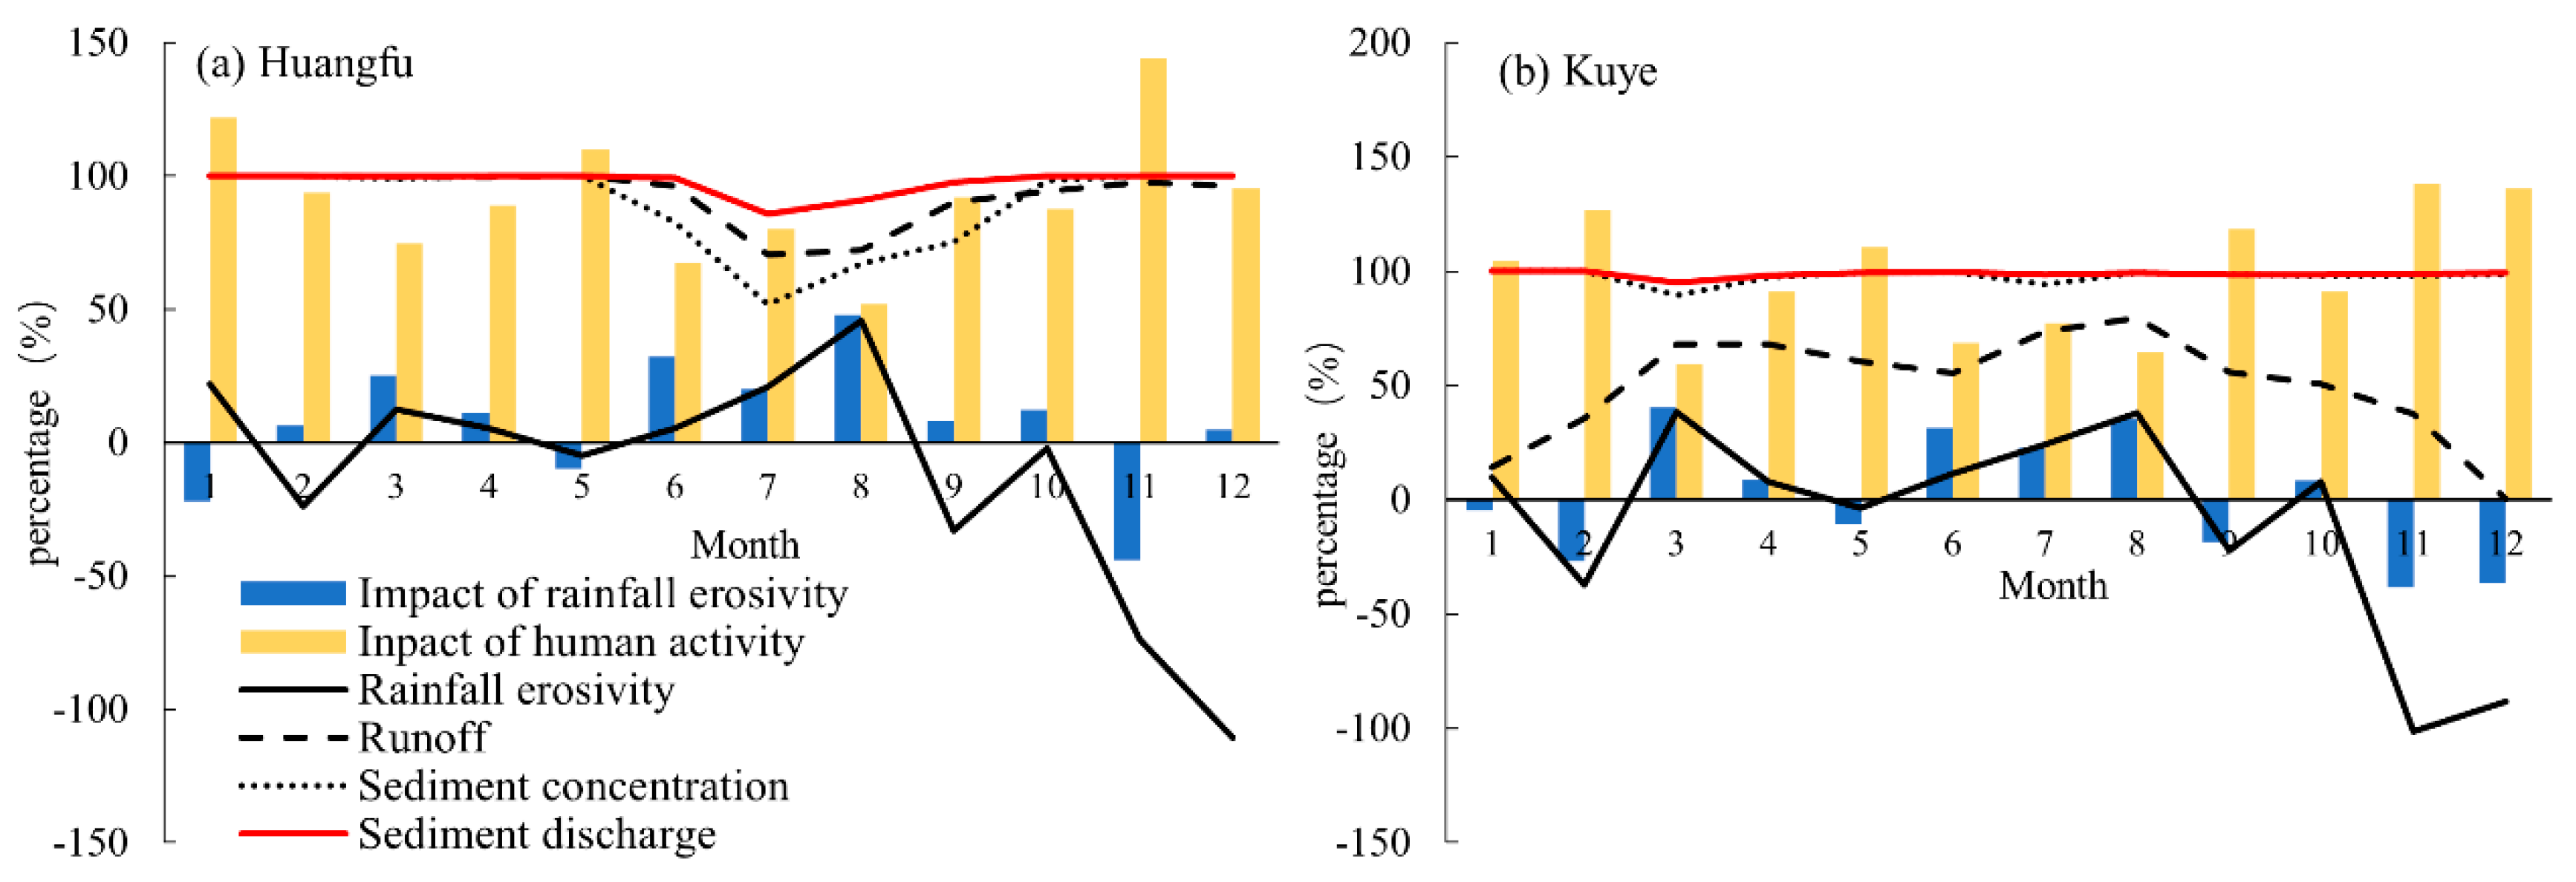
3.4.2. Attribution Analysis on Monthly Scale

The analysis on the monthly scale was done for the two periods of 1956–1989 and 2006–2016. The monthly linear regression equations in 1956–1989 are listed in Table 6. Clearly, cumulative monthly rainfall erosivity and cumulative monthly sediment discharge within a year were all significantly correlated (r > 0.75, p < 0.01), whereas the correlation between monthly rainfall erosivity and monthly sediment discharge were significant principally in flood season (June to September) and not significant mostly in non-flood season. Thus, the double cumulative curve method was used for further attribution analysis on the monthly scale. Figure 7 shows that the discrepancy in the influence of climate change and human factors on sediment discharge was significant between different months, and that rainfall erosivity had a higher impact on the reduction of sediment discharge in flood season.
The contribution of rainfall factors to sediment discharge reduction in the Huangfu basin was less than 10% in six months, including February, September, December, January, May and November, and in the latter three months, rainfall erosivity increased sediment discharge in 2006–2016. The rainfall erosivity in May and November in the change period were 1.11 and 1.45 times of that in the baseline period, respectively. The contribution was more than 30% in June (32%) and August (48%). In the Kuye basin, the contribution rate of rainfall erosivity of eight months to sediment discharge reduction was less than 10%, including negative ones for six months. The computed rainfall erosivity values in February, May, September, November and December in the change period were 1.37, 1.03, 1.22, 1.52 and 1.50 times of those in the baseline period, respectively. A contribution rate of over 30% occurred in March (41%), June (32%) and August (35%). It is clear that the rainfall erosivity impacted on sediment discharge strongly in flood season (June–August) but weakly in non-flood season in the Huangfu and the Kuye basins. The changes in rainfall erosivity of flood season (June–August) were responsible for 33% (the Huangfu basin) and 30% (the Kuye basin) of sediment discharge reduction from 1956–1989 to 2006–2016, which exceeded the contribution rates of rainfall erosivity changes to sediment discharge reduction from P1 period to P3 period (14.27% or 12.04% in the Huangfu basin and 9.47% or 10.13% in the Kuye basin) calculated by annual rainfall data, as given in Table 5.
The ratios of the reductions (or reduction percentages) of monthly mean runoff and sediment concentration in 2006–2016 to the monthly mean runoff and sediment concentration in 1956–1989 are also drawn in Figure 7a. It is shown that the change of sediment discharge in the Huangfu basin was consistent with the change of runoff and sediment concentration but not with the rainfall erosivity, and that the reductions of the sediment discharge, runoff and sediment concentration were all close to 100% in non-flood season. Figure 7b indicates that the variations of runoff in the Kuye basin disaccorded with the variations of sediment discharge and sediment concentration, and the reduction percentages of runoff in flood season were higher than those in non-flood season but were all below 80%. However, the reduction percentages of sediment concentration and sediment discharge in most months were above 89%. Clearly, there was an obvious discrepancy in the reduction percentage of monthly mean runoff between the two basins. Considering the effects of changes in runoff and C-Q relationship according to Equation (12), there should exist different causes for sediment discharge reduction between the two basins, and we applied the differential method to quantify the contributions of changes in runoff and sediment concentration in the following section.

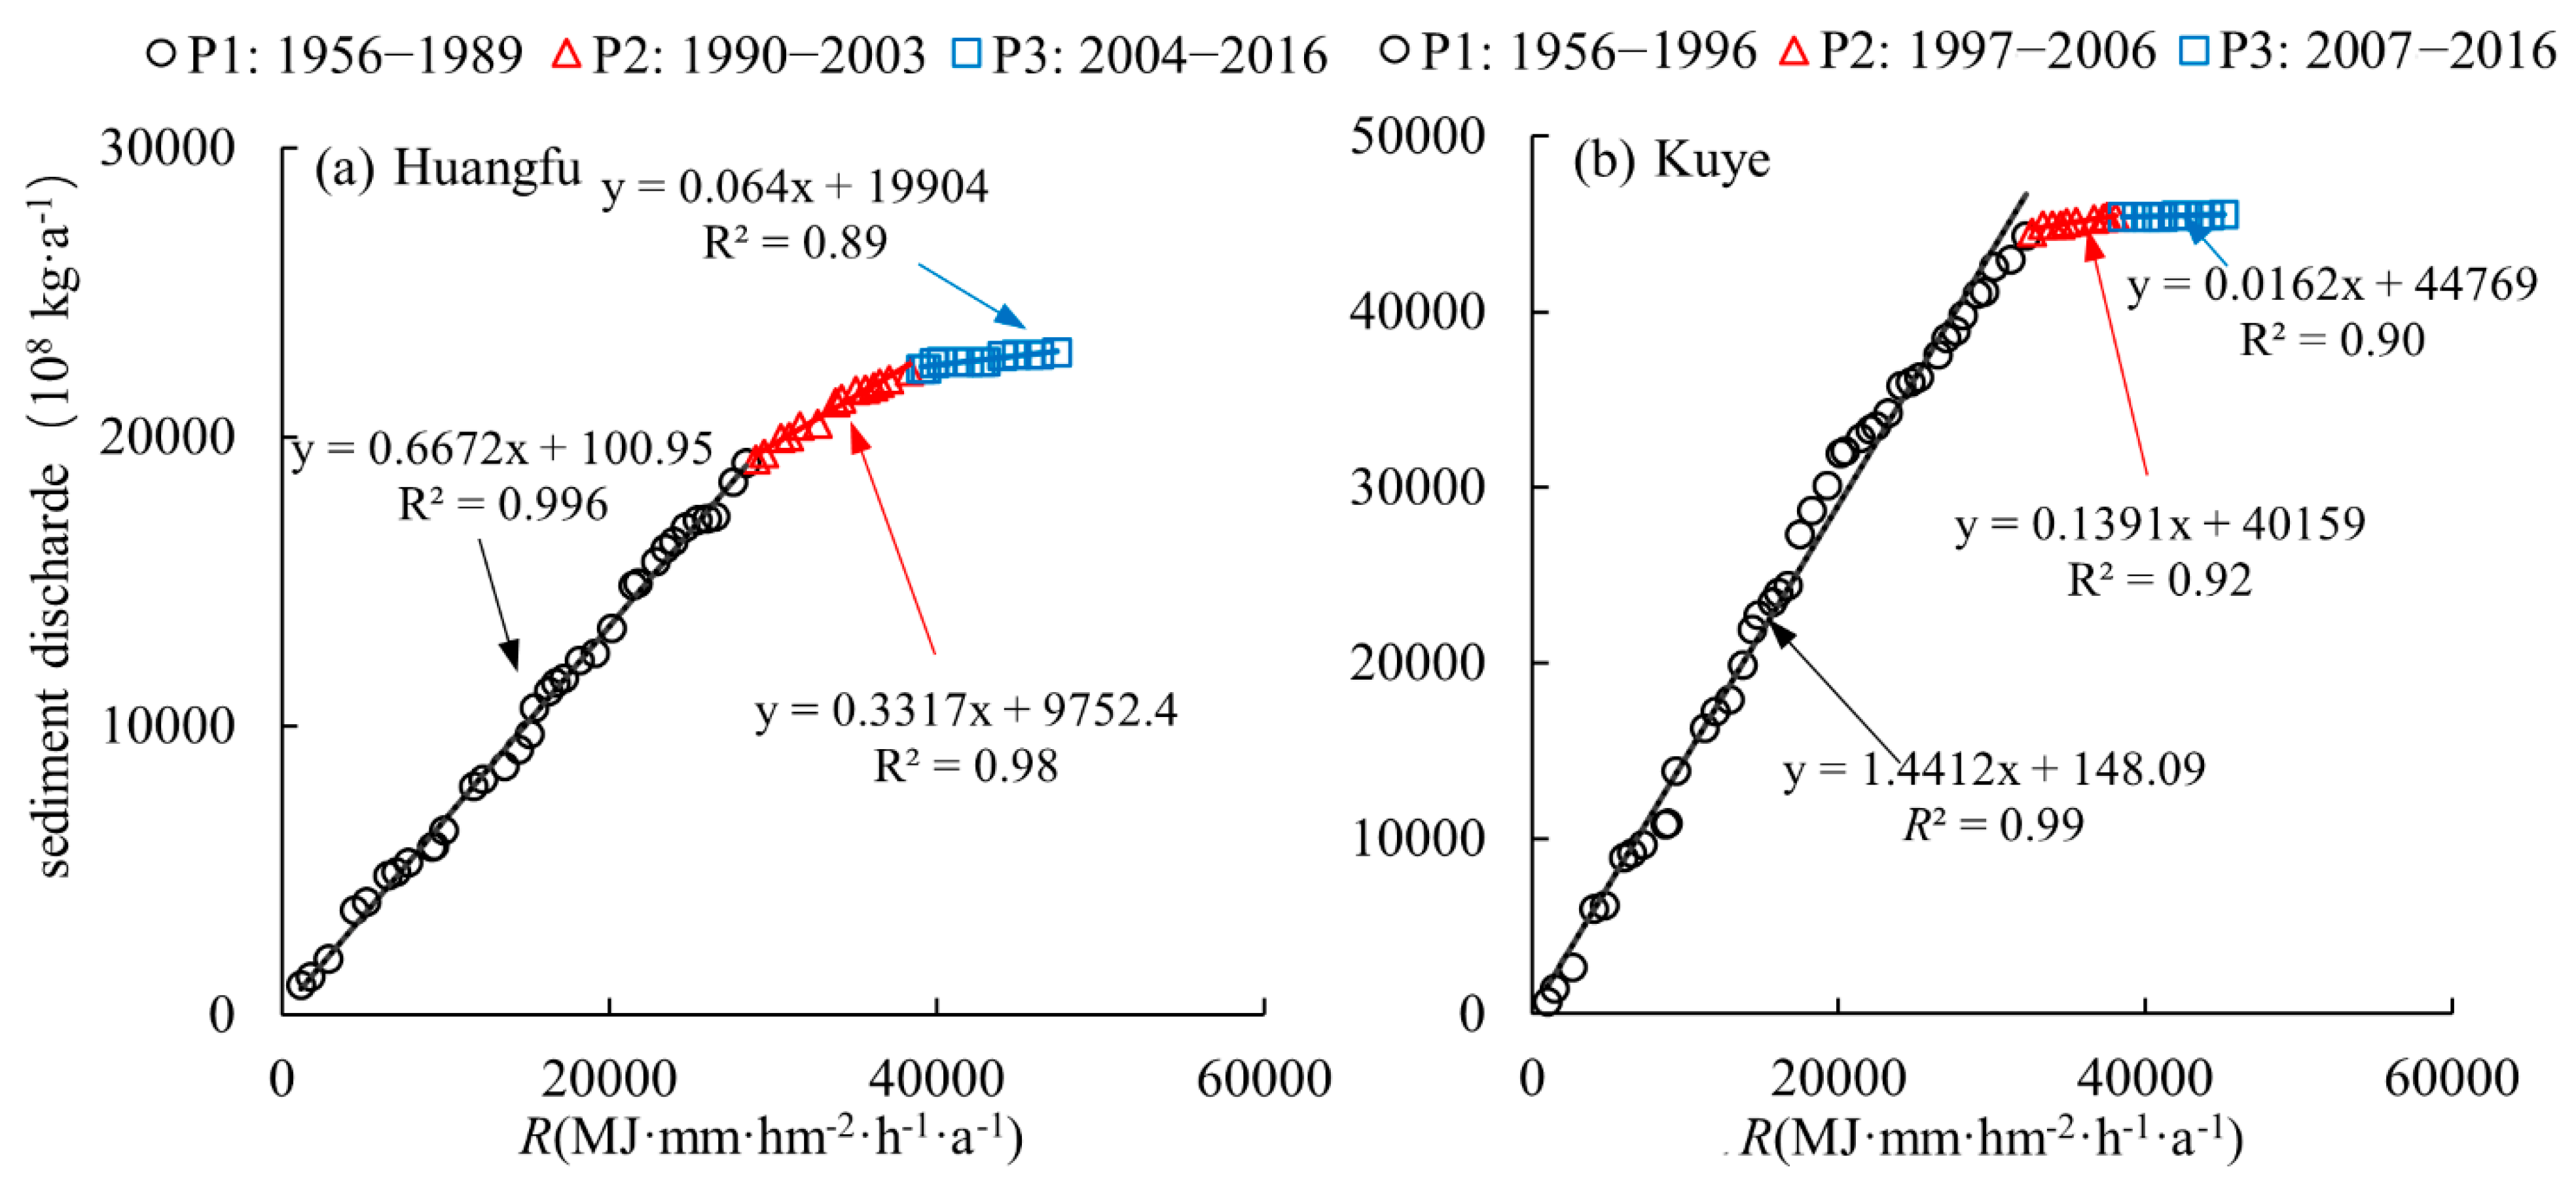
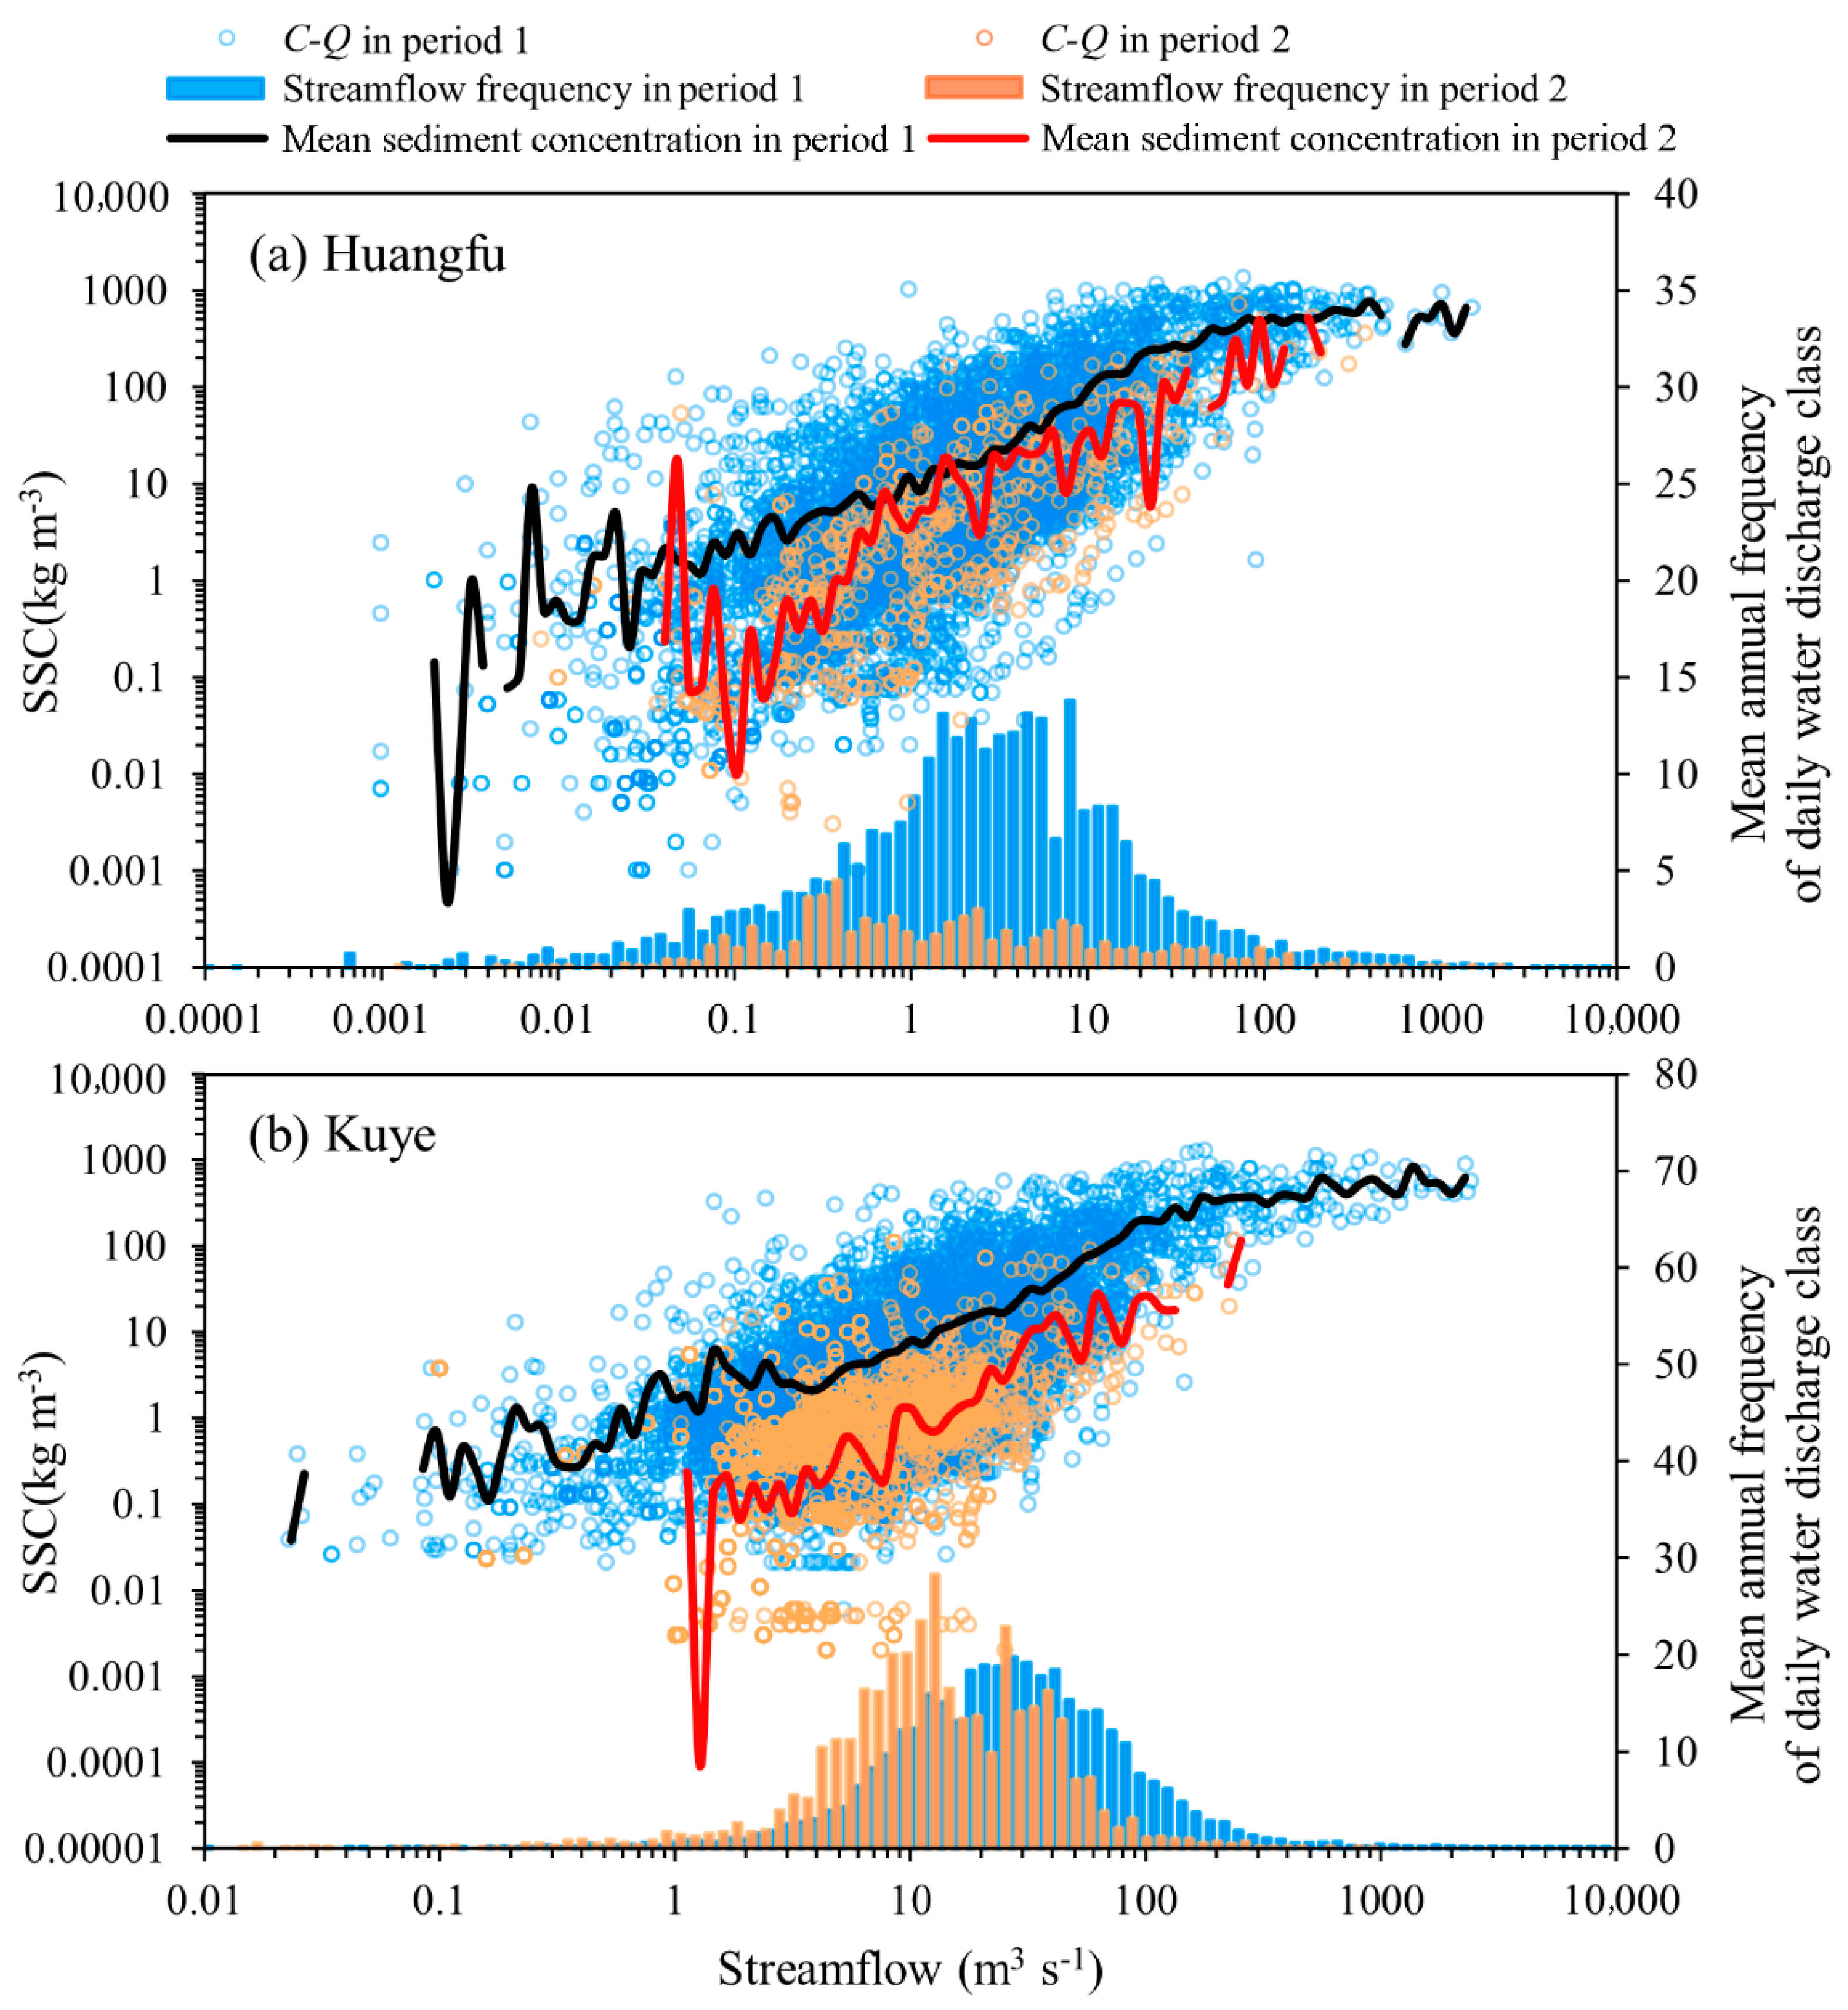
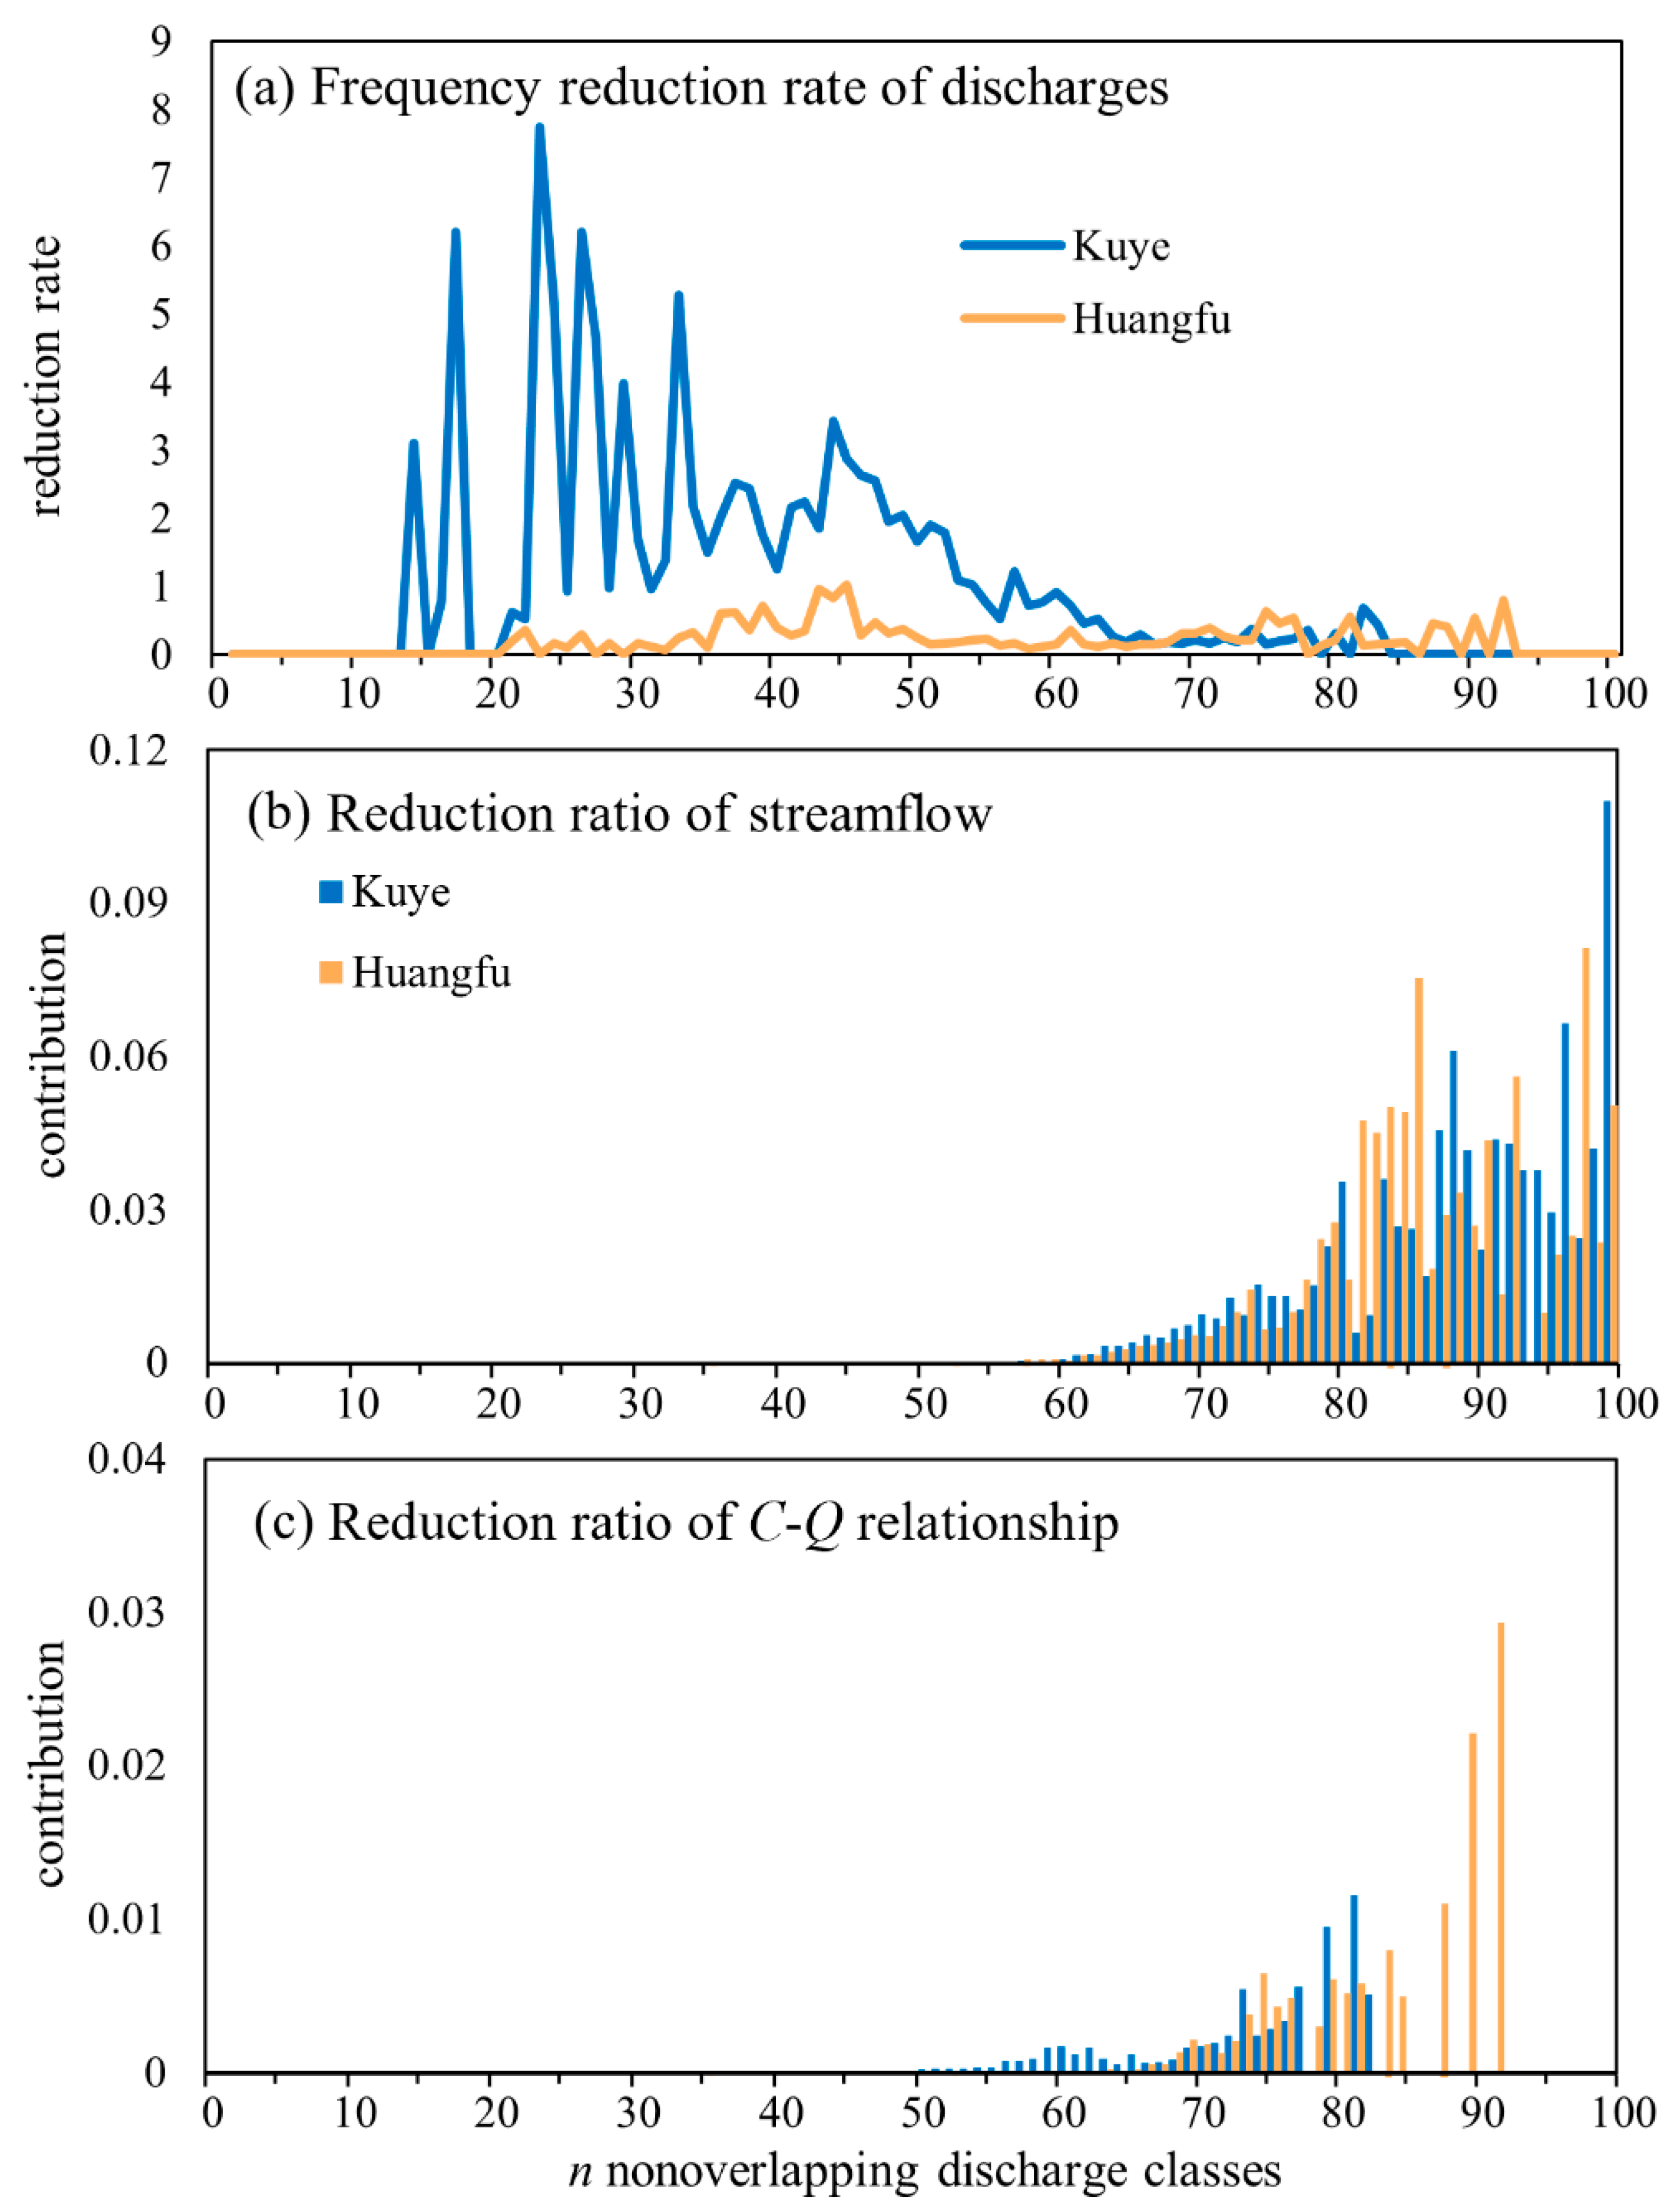
3.4.3. Partition of Effects of Streamflow and C-Q Relationship Changes on Sediment Discharge Variations

From the period 1956–1989 to the period 2006–2016, the SSY declined from 17,575 t·km−2·a−1 to 1616 t·km−2·a−1 in the Huangfu basin, and from 12,552 t·km−2·a−1 to 139 t·km−2·a−1 in the Kuye basin. By the differential equation method, the percentages of SSY reduction attributable to changes in streamflow and C-Q relationship were reckoned to be 88% and 12% in the Huangfu basin, and 93% and 7% in the Kuye basin, respectively.
Figure 8 indicates that the frequency of each streamflow class in the Huangfu basin decreased conspicuously, and the change of C-Q relationship was non-significant, whereas the frequency of low flows increased, and that of the high flows decreased notably in the Kuye basin; besides, the C-Q relationship in the change period was lower than that in the baseline period. However, the quantitative attribution analysis illustrated that 88% of the reduction of SSY in the Huangfu basin was due to streamflow reduction, while streamflow contributed 93% of the decreased SSY in the Kuye basin, indicating that the streamflow reduction played a more crucial role in SSY variations in the Kuye basin. It can be seen that the contribution of streamflow reduction to SSY decrease was higher, although as mentioned above, the reduction of total flow was less in the Kuye basin in the change period. This is because the high flow classes (n > 83) disappeared in the Kuye basin in the change period (Figure 9a), and they made a contribution of 71% to the SSY reduction, which was raised to 93% by the reduction of low flows in the n < 83 classes (Figure 9b). The main cause for the decrease of SSY in the two basins was same as that for the whole Yellow River basin claimed in Wang [44]. In contrast, the streamflow reduction was not accompanied by an equivalent decrease in sediment concentration because a high portion of the streamflow reduction in the middle Yellow River resulted from water consumption [45] and as a ratio of sediment load to water discharge, the sediment concentration would be elevated by the streamflow reduction. Figure 8a shows that the C-Q curve of the Huangfu basin in the change period was not much lower than that in the baseline period. In other words, the muddy water has not turned limpid, and high hyper-concentrated flows have not been well-controlled. In contrast, the C-Q relationship of low flows declined, and high flows did not occur in the Kuye basin in the change period. Hence, the lowered C-Q relationships only made a minor contribution to SSY reduction in both the basins, as illustrated by a comparison of Figure 9c with Figure 9b.
On the whole, the sediment reduction effectiveness of the Kuye basin was better than that of the Huangfu basin. The specific sediment yield of the Kuye basin has declined from 12,409 t·km−2·a−1 in 1956–1996 to 130 t·km−2·a−1 in 2006–2016, which was achieved mainly by removing the high flows and partly by reducing the C-Q relationship of low flows, suggesting that the soil erosion conservation in this basin was effective and might have a reference value for further soil erosion conservation on the Loess Plateau and in other areas.

3.4.4. Impact of Human Activity on the Sediment Discharge

Clearly, anthropogenic factors occupied the crucial position affecting sediment yield in the Huangfu and the Kuye basins on both the annual and monthly scales. The soil and water conservation in the Huangfu basin started in the 1950s and this basin was listed as a key management region in the middle Yellow River since the 1970s. In 1983, it was classified as one of the eight focal points of soil and water conservation area [46], and the first change-point (1989 in Figure 3a) of sediment discharge in the Huangfu basin occurred after a series of comprehensive harnessing practices. The second change-point (2006 in Figure 3a) of sediment discharge in this basin coincided with the time of implementing the check-dam construction project, by which 507 check dams had been built in the period from 2003 to 2008 with a total silting storage capacity of 144 million m3 and a total storage capacity of 438 million m3 [18]. The major human impacts on sediment yield in the Kuye basin were coal mining, vegetation restoration and construction of soil and water conservation measures [47]. Large-scale ecological restoration projects such as returning farmland to forest and grassland were carried out in the Kuye basin since the 1990s. The area of forest land increased significantly since 1996, and the total afforestation area and grass planting area were 2561.89 and 938.23 km2 by 2006, respectively. The construction of ecological restoration projects reduced the runoff and sediment in the Kuye basin [48], which may be the cause for the first change-point (1996 in Figure 3b) of sediment discharge. Abundant coal resources were distributed in the Kuye basin and the amount of coal mining increased sharply after 1996. Jiang [49] evaluated a contribution rate of 54.8% for coal mining to runoff reduction from 1997 to 2006. Accompanying the development of vegetation restoration and soil and water conservation measures, the area of industrial land, especially coal mining land, road and urban land, increased rapidly since 2006, probably leading to the occurrence of the second change-point (2006 in Figure 3b) of sediment discharge of the Kuye River.
Previous studies show that the runoff and sediment discharge of the Yellow River basin have a significant downward trend since the 1950s [9,10,27,35]. Human activities played a major role in reducing the sediment discharge in the middle reaches of the Yellow River. The average percentage of anthropogenic sediment discharge reduction reached 90% in the middle reaches of the Yellow River [27,50]. The construction of terraces, forests and grasses, warping dams, reservoir construction, industrial and agricultural water diversion and sediment diversion are considered to be the main human activities that affect the changes of runoff and sediment discharge in the middle reaches of the Yellow River [27,46,49]. The results of our study were consistent with previous studies which indicate human activities being the key factor for the reduction of sediment discharge. Nevertheless, the proportion of anthropogenic effects was smaller than that given in previous studies that applied the annual rainfall to partition of effects of human activities and climate change in the Huangfu and the Kuye basins. Li [51] calculated that the contribution of human activities to the reduction of sediment discharge was 96.4% in the Kuye basin, and Mu [52] concluded that the contribution of human factors to sediment discharge reduction was 89.2% in the Huangfu basin, which were higher than our results, 89.9% and 87.9% in the Kuye and the Huang basins, respectively (Table 5). The contribution rates in this study were estimated by the rainfall erosivity, which should be better than other rainfall indexes according to the statistical test and its higher variation coefficient. Therefore, we considered that the annual rainfall underestimated the effect of the rainfall factor to sediment discharge reduction, and the rainfall erosivity was recommended based on our results.
Human activities can reduce sediment discharge by affecting the runoff and C-Q relationship. We found that human activities brought down sediment discharge mainly by reducing runoff, but only slightly by improving the C-Q relationship in the Kuye and the Huangfu basins. Further studies should be focused on the attribution of the changes of runoff and C-Q relationship. It will improve our understanding of the mechanism of how human activities affect sediment discharge.

4. Conclusions

Based on the rainfall and sediment discharge data in the period from 1956 to 2016 in the Huangfu and the Kuye basins, the merit order of common rainfall characteristic indexes and attribution of sediment discharge changes in the two basins were quantitatively analyzed by non-parametric Pettitt test, rainfall and sediment discharge characteristic index calculation, correlation test, double cumulative curve regression and solving differential equation. The main conclusions are listed as follows.
(1) In both the Huangfu and the Kuye basins, rainfall and rainfall erosivity showed an observable but insignificant decreasing trend and did not have significant change-points in 1956–2016. The analysis of rainfall characteristic indexes (CVP, PCI, MFI, PCD) indicated that the seasonal distribution of rainfall in 2006–2016 was more uniform than that in 1956–1965.
(2) The sediment discharge of the Huangfu and the Kuye basins showed a significant stepwise decreasing trend in 1956–2016, with two change-points at years 1989 and 2003 in the Huangfu basin and at years 1996 and 2006 in the Kuye basin. Using the change-points, the annual sediment discharge series were divided into the baseline and two change periods. The mean annual sediment discharge of the Huangfu basin decreased from 560.9 × 10⁸ kg·a−1, 227.3 × 10⁸ kg·a−1 to 50.1 × 10⁸ kg·a−1, and that of the Kuye basin decreased from 1080.3 × 108 kg·a−1, 109.9 × 10⁸ kg·a−1 to 11.3 × 10⁸ kg·a−1 in the three periods, respectively. The sediment discharge indexes illustrated that the degree of sediment reduction in the Kuye basin was greater than that in the Huangfu basin, and the reduction in flood season was particularly significant.
(3) It was found that the rainfall erosivity was the best index among six common rainfall indexes in the relations to the sediment discharge. The reductions of sediment discharge in the two change periods were quantitatively ascribed to human activities and rainfall changes through developing regression relations between sediment discharge and rainfall erosivity using yearly and cumulative data. The human contributions to sediment discharge reduction were estimated to be 70.2–75.2% in the first change period and 85.7–90.5% in the second change period. By applying the double cumulative curve method, the contributions of rainfall and human factors in different months were found to be significantly diverse. The proportions of sediment discharge reduction induced by changes of rainfall erosivity in flood season (June–August) were 30–33% in the period of 2006–2016, which were higher than the yearly total, 10.1–12%.
(4) The differential equation method quantitatively distinguished the contributions of streamflow and C-Q relationship to SSY variation to be 88% and 12% in the Huangfu basin, and 93% and 7% in the Kuye basin, respectively. The sediment reduction of the Kuye basin was more significant than the Huangfu basin as the C-Q relationship was much more depressed and the high flow component was reduced in the Kuye basin.

Author Contributions

Data curation, X.M.; Formal analysis, X.M.; Methodology, X.M. and J.P.; Supervision, C.S.; Writing—original draft, X.M.; Writing—review and editing, C.S.; Offering suggestions, J.P. and W.L. All authors have read and agreed to the published version of the manuscript.

Funding

This study was funded by National Key Research and Development Program of China (No. 2016YFC0402502), National Natural Science Foundation of China (No. 41971008; 41671004), and National Key Research and Development Program of China (No. 2017YFC0405506).

Institutional Review Board Statement

Not applicable.

Informed Consent Statement

Not applicable.

Data Availability Statement

The data presented in this study are available on request from the corresponding author.

Acknowledgments

We are grateful to the two anonymous reviewers for their detailed and instructive comments which helped improve this paper.

Conflicts of Interest

The authors declare no conflict of interest.

References

  1. Li, L.; Ni, J.; Chang, F.; Yue, Y.; Frolova, N.; Magritsky, D.; Borthwick, A.G.; Ciais, P.; Wang, Y.; Zheng, C.; et al. Global trends in water and sediment fluxes of the world’s large rivers. Sci. Bull. 2020, 65, 62–69. [Google Scholar] [CrossRef] [Green Version]
  2. Naik, P.K.; Jay, D.A. Distinguishing human and climate influences on the Columbia River: Changes in mean flow and sediment transport. J. Hydrol. 2011, 404, 259–277. [Google Scholar] [CrossRef]
  3. Gupta, H.; Kao, S.-J.; Dai, M. The role of mega dams in reducing sediment fluxes: A case study of large Asian rivers. J. Hydrol. 2012, 464–465, 447–458. [Google Scholar] [CrossRef]
  4. Zhao, Y.; Zou, X.; Liu, Q.; Yao, Y.; Li, Y.; Wu, X.; Wang, C.; Yu, W.; Wang, T. Assessing natural and anthropogenic influences on water discharge and sediment load in the Yangtze River, China. Sci. Total Environ. 2017, 60–608, 920–932. [Google Scholar] [CrossRef] [PubMed]
  5. Xin, Z.; Yu, X.; Lu, X.X. Factors controlling sediment yield in China’s Loess Plateau. Earth Surf. Process. Landf. 2010, 36, 816–826. [Google Scholar] [CrossRef]
  6. Nearing, M.A.; Yin, S.-Q.; Borrelli, P.; Polyakov, V.O. Rainfall erosivity: An historical review. Catena 2017, 157, 357–362. [Google Scholar] [CrossRef]
  7. Wischmeier, W.H.; Smith, D.D. Predicting Rainfall Erosion Losses: A Guide to Conservation Planning; United States Department of Agriculture: Washington, DC, USA, 1978.
  8. Angulo-Martínez, M.; Beguería, S. Estimating rainfall erosivity from daily precipitation records: A comparison among methods using data from the Ebro Basin (NE Spain). J. Hydrol. 2009, 379, 111–121. [Google Scholar] [CrossRef] [Green Version]
  9. Miao, C.; Ni, J.; Borthwick, A.G.L. Recent changes of water discharge and sediment load in the Yellow River basin, China. Prog. Phys. Geogr. Earth Environ. 2010, 34, 541–561. [Google Scholar] [CrossRef] [Green Version]
  10. Li, H.; Shi, C.; Zhang, Y.; Ning, T.; Sun, P.; Liu, X.; Ma, X.; Liu, W.; Collins, A.L. Using the Budyko hypothesis for detecting and attributing changes in runoff to climate and vegetation change in the soft sandstone area of the middle Yellow River basin, China. Sci. Total Environ. 2020, 703, 135588. [Google Scholar] [CrossRef]
  11. Hadour, A.; Mahé, G.; Meddi, M. Climatic and anthropogenic impacts on the decrease of sediment discharge to the Mediterranean coast from the largest river of Maghreb. Int. J. Sediment Res. 2021, 36, 268–278. [Google Scholar] [CrossRef]
  12. Sharafati, A.; Pezeshki, E.; Shahid, S.; Motta, D. Quantification and uncertainty of the impact of climate change on river discharge and sediment yield in the Dehbar river basin in Iran. J. Soils Sediments 2020, 20, 2977–2996. [Google Scholar] [CrossRef]
  13. Miao, C.; Ni, J.; Borthwick, A.G.L.; Yang, L. A preliminary estimate of human and natural contributions to the changes in water discharge and sediment load in the Yellow River. Glob. Planet. Chang. 2011, 76, 196–205. [Google Scholar] [CrossRef] [Green Version]
  14. Tang, Q.; He, X.; Bao, Y.; Zhang, X.; Guo, F.; Zhu, H. Determining the relative contributions of climate change and multiple human activities to variations of sediment regime in the Minjiang River, China. Hydrol. Process. 2012, 27, 3547–3559. [Google Scholar] [CrossRef]
  15. Wu, C.; Yang, S.; Lei, Y.-P. Quantifying the anthropogenic and climatic impacts on water discharge and sediment load in the Pearl River (Zhujiang), China (1954–2009). J. Hydrol. 2012, 452–453, 190–204. [Google Scholar] [CrossRef] [Green Version]
  16. Yang, S.L.; Xu, K.H.; Milliman, J.D.; Yang, H.F.; Wu, C.S. Decline of Yangtze River water and sediment discharge: Impact from natural and anthropogenic changes. Sci. Rep. 2015, 5, 12581. [Google Scholar] [CrossRef]
  17. Fu, B.; Liu, Y.; Lü, Y.; He, C.; Zeng, Y.; Wu, B. Assessing the soil erosion control service of ecosystems change in the Loess Plateau of China. Ecol. Complex. 2011, 8, 284–293. [Google Scholar] [CrossRef]
  18. Zhao, G.; Kondolf, G.M.; Mu, X.; Han, M.; He, Z.; Rubin, Z.; Wang, F.; Gao, P.; Sun, W. Sediment yield reduction associated with land use changes and check dams in a catchment of the Loess Plateau, China. Catena 2017, 148, 126–137. [Google Scholar] [CrossRef]
  19. Arnold, J.G.; Srinivasan, R.; Muttiah, R.S.; Williams, J.R. Large area hydrologic modeling and assessment part I: Model development. JAWRA J. Am. Water Resour. Assoc. 1998, 34, 73–89. [Google Scholar] [CrossRef]
  20. Ouyang, W.; Wu, Y.; Hao, Z.; Zhang, Q.; Bu, Q.; Gao, X. Combined impacts of land use and soil property changes on soil erosion in a mollisol area under long-term agricultural development. Sci. Total Environ. 2018, 613–614, 798–809. [Google Scholar] [CrossRef]
  21. Pandey, A.; Himanshu, S.K.; Mishra, S.; Singh, V.P. Physically based soil erosion and sediment yield models revisited. Catena 2016, 147, 595–620. [Google Scholar] [CrossRef]
  22. Zhang, J.; Gao, G.; Fu, B.; Zhang, L. Explanation of climate and human impacts on sediment discharge change in Darwinian hydrology: Derivation of a differential equation. J. Hydrol. 2018, 559, 827–834. [Google Scholar] [CrossRef]
  23. Shi, H.; Shao, M. Soil and water loss from the Loess Plateau in China. J. Arid. Environ. 2000, 45, 9–20. [Google Scholar] [CrossRef] [Green Version]
  24. Han, H.; Hou, J.; Huang, M.; Li, Z.; Xu, K.; Zhang, D.; Bai, G.; Wang, C. Impact of soil and water conservation measures and precipitation on streamflow in the middle and lower reaches of the Hulu River basin, China. Catena 2020, 195, 104792. [Google Scholar] [CrossRef]
  25. Liu, Y.-F.; Liu, Y.; Shi, Z.-H.; López-Vicente, M.; Wu, G.-L. Effectiveness of re-vegetated forest and grassland on soil erosion control in the semi-arid Loess Plateau. Catena 2020, 195, 104787. [Google Scholar] [CrossRef]
  26. Yang, K.; Lu, C. Evaluation of land-use change effects on runoff and soil erosion of a hilly basin—the Yanhe River in the Chinese Loess Plateau. Land Degrad. Dev. 2018, 29, 1211–1221. [Google Scholar] [CrossRef]
  27. Gao, P.; Deng, J.; Chai, X.; Mu, X.; Zhao, G.; Shao, H.; Sun, W. Dynamic sediment discharge in the Hekou–Longmen region of Yellow River and soil and water conservation implications. Sci. Total Environ. 2017, 578, 56–66. [Google Scholar] [CrossRef] [PubMed]
  28. Tang, K. Soil and Water Conservation in China; Science China Press: Beijing, China, 2004. (In Chinese) [Google Scholar]
  29. Ma, W.; Zhang, X. Effect of Pisha sandstone on water infiltration of different soils on the Chinese Loess Plateau. J. Arid. Land 2016, 8, 331–340. [Google Scholar] [CrossRef] [Green Version]
  30. Ziadat, F.M.; Taimeh, A.Y. Effect of rainfall intensity, slope, land use and antecedent soil moisture on soil erosion in an arid environment. Land Degrad. Dev. 2013, 24, 582–590. [Google Scholar] [CrossRef]
  31. Li, X.; Yue, G.; Su, R.; Yu, J. Research on Pisha-sandstone’s anti-erodibility based on grey multi-level comprehensive evaluation method. J. Groundw. Sci. Eng. 2016, 4, 103–109. (In Chinese) [Google Scholar]
  32. Zuo, D.; Xu, Z.; Yao, W.; Jin, S.; Xiao, P.; Ran, D. Assessing the effects of changes in land use and climate on runoff and sediment yields from a watershed in the Loess Plateau of China. Sci. Total Environ. 2016, 544, 238–250. [Google Scholar] [CrossRef] [PubMed]
  33. Qin, R.; Li, G.; Li, P. Impacts of precipitation and land use change on runoff and sediment in Luoyugou watershed. J. Soil Water Cons. 2018, 32, 29–34, 40. (In Chinese) [Google Scholar]
  34. Wan, L.; Zhang, X.P.; Ma, Q.; Zhang, J.J.; Ma, T.Y.; Sun, Y.P. Spatiotemporal characteristics of precipitation and extreme events on the Loess Plateau of China between 1957 and 2009. Hydrol. Process. 2013, 28, 4971–4983. [Google Scholar] [CrossRef]
  35. Wang, S.; Yan, Y.; Yan, M.; Zhao, X. Quantitative estimation of the impact of precipitation and human activities on runoff change of the Huangfuchuan River basin. J. Geogr. Sci. 2012, 22, 906–918. [Google Scholar] [CrossRef]
  36. Fan, L. Consideration and countermeasure on water interception of Kuye River—The first level branch in middle reaches of the Yellow River. Groundwater 2004, 26, 236–241. (In Chinese) [Google Scholar]
  37. Pettitt, A.N. A non-parametric approach to the change-point problem. J. R. Stat. Soc. Ser. C (Appl. Stat.) 1979, 28, 126. [Google Scholar] [CrossRef]
  38. Martínez, M.D.; Serra, C.; Burgueño, A.; Lana, X. Time trends of daily maximum and minimum temperatures in Catalonia (ne Spain) for the period 1975–2004. Int. J. Clim. 2009, 30, 267–290. [Google Scholar] [CrossRef] [Green Version]
  39. Zuo, D.; Xu, Z.; Wu, W.; Zhao, J.; Zhao, F. Identification of streamflow response to climate change and human activities in the Wei River basin, China. Water Resour. Manag. 2014, 28, 833–851. [Google Scholar] [CrossRef]
  40. Arnoldus, H.M.J. Methodology used to determine the maximum potential average annual soil loss due to sheet and rill erosion in Morocco. Nature 1977, 414, 405–416. [Google Scholar]
  41. Ma, X.Q.; Zheng, M.G. Statistical evaluation of proxies for the R factor of the Universal Soil Loss Equation. Resour. Sci. 2018, 40, 1622–1633. (In Chinese) [Google Scholar]
  42. Meng, X.L.; Rosenthal, R.; Rubin, D.B. Comparing correlated correlation-coefficients. Psychol. Bull. 1992, 111, 172–175. [Google Scholar] [CrossRef]
  43. Zheng, M.; Chen, X. Statistical determination of rainfall-runoff erosivity indices for single storms in the Chinese Loess Plateau. PLoS ONE 2015, 10, e0117989. [Google Scholar] [CrossRef]
  44. Wang, S.; Fu, B.; Piao, S.; Lü, Y.; Ciais, P.; Feng, X.; Wang, Y. Reduced sediment transport in the Yellow River due to anthropogenic changes. Nat. Geosci. 2016, 9, 38–41. [Google Scholar] [CrossRef]
  45. Shi, C.; Zhou, Y.; Fan, X.; Shao, W. A study on the annual runoff change and its relationship with water and soil conservation practices and climate change in the middle Yellow River basin. Catena 2013, 100, 31–41. [Google Scholar] [CrossRef]
  46. Zhu, Z.W.; Fan, W.; Jia, Y.Y.; Xing, G. Analysis of water and sediment reduction by soil and water conservation measures in Huangfuchuan watershed. Yellow River 2003, 9, 26–27. (In Chinese) [Google Scholar]
  47. Guo, Q.; Yang, Y.; Xiong, X. Using hydrologic simulation to identify contributions of climate change and human activity to runoff changes in the Kuye River basin, China. Environ. Earth Sci. 2016, 75, 1–10. [Google Scholar] [CrossRef]
  48. Gao, P.; Li, P.; Zhao, B.; Xu, R.; Zhao, G.; Sun, W.; Mu, X. Use of double mass curves in hydrologic benefit evaluations. Hydrol. Process. 2017, 31, 4639–4646. [Google Scholar] [CrossRef]
  49. Jiang, X.H.; Gu, X.W.; He, H.M. The influence of coal mining on water resources in the Kuye River basin. J. Nat. Resour. 2010, 25, 300–307. (In Chinese) [Google Scholar]
  50. Zhao, Y.; Hu, C.; Zhang, X.M.; Wang, Y.S.; Cheng, C.; Yin, X.L.; Xie, M. Analysis on runoff and sediment regimes and its causes of the Yellow River in recent 70 years. Trans. Chin. Soc. Agric. Eng. 2018, 34, 112–119. (In Chinese) [Google Scholar]
  51. Li, H.; Shi, C.; Ma, X.; Liu, W. Quantification of the influencing factors of runoff and sediment discharge changes of the Kuye River catchment in the middle reaches of the Yellow River. Resour. Sci. 2020, 42, 499–507. [Google Scholar] [CrossRef]
  52. Li, E.H. Response of Runoff and Sediment to Climate and Human Activities in the Huangfuchuan Watershed of the Middle Reaches of the Yellow River. Doctoral Dissertation, Northwest A&F University, Xianyang, China, 2015. [Google Scholar]
Figure 1. Variations of annual precipitation (Pa) and flood season precipitation (Pf) in the Huangfu basin (a) and the Kuye basin (b).
Water 13 00845 g001
Figure 2. Variations of annual rainfall erosivity (Ra) and flood season rainfall erosivity (Rf) in the Huangfu basin (a) and the Kuye basin (b).
Water 13 00845 g002
Figure 3. Variations of annual sediment discharge in the Huangfu basin (a) and the Kuye basin (b).
Water 13 00845 g003
Figure 4. Variations of monthly average sediment discharge in the Huangfu basin (a) and the Kuye basin (b).
Water 13 00845 g004
Figure 5. Relationships between annual rainfall erosivity and sediment discharge in baseline and change periods in the Huangfu basin (a) and the Kuye basin (b).
Water 13 00845 g005
Figure 6. Relationships between cumulative rainfall erosivity and sediment discharge in baseline and change periods in the Huangfu basin (a) and the Kuye basin (b).
Water 13 00845 g006
Figure 7. The contribution of rainfall and human factors to the changes of monthly sediment discharge and the percentages of decreased rainfall, runoff and sediment concentration in the change period compared with the baseline period in the Huangfu basin (a) and the Kuye basin (b) (a reduction percentage of 100% for an item means that the item became none in the change period).
Water 13 00845 g007
Figure 8. Comparison of daily C-Q relationship at 100 discharge classes between the baseline period and change period in the Huangfu basin (a) and the Kuye basin (b).
Water 13 00845 g008
Figure 9. Comparison of (a) frequency reduction rate of discharges from baseline period to change period and contributions of (b) streamflow and (c) C-Q relationship reductions to suspended sediment yield (SSY) reductions in 100 discharge classes (the discharge was divided into 100 classes from low to high by an interval which is a hundredth of variation range of daily streamflows on the log-discharge scale, refer to the Methods Section for details) between the Huangfu and the Kuye basins.
Water 13 00845 g009
Table 1. The formula of rainfall and sediment discharge indexes.
IndexFormula
R, rainfall erosivity R = 10 × i = 1 12 0.0125 p i 1.6295
MFI, modified Fournier index M F I = i = 1 12 p i 2 P
Cvp/Cvs, variation coefficients of precipitation/sediment C v p ( s ) = 1 12 i = 1 12 ( x i 1 12 i = 1 12 x i ) 2 ( 1 12 i = 1 12 x i )
PCI/SCI, precipitation/sediment concentration index P ( S ) C I = 100 i = 1 12 x i 2 X 2
PCD/SCD, precipitation/sediment concentration degree P ( S ) C D = ( i = 1 12 x i · s i n θ i ) 2 + ( i = 1 12 x i · c o s θ i ) 2 i = 1 12 x i
pi, the rainfall in month i (mm). P, annual rainfall (mm). xi, monthly rainfall (mm) or sediment discharge in the ith month (kg). X, annual rainfall (mm) or annual sediment discharge (kg). θi, the vector angle of each month. The vector angle of January is 0° and it is added cumulatively by an angle of 30° for the next month until December.
Table 2. Average values of rainfall indexes in different decades.
HuangfuKuye
CVPPCIMFIPCDCVPPCIMFIPCD
1956–19651.1920.5389.00.241.1319.3583.90.24
1966–19751.2020.7383.70.221.2020.5682.90.24
1976–19851.2121.1486.40.231.1820.2979.20.24
1986–19951.2020.9080.40.231.1820.3078.10.22
1996–20051.1218.9169.20.201.1218.9567.30.20
2006–20161.0718.0472.90.181.0417.4569.20.16
Table 3. Average values of sediment indexes in two periods.
HuangfuKuye
CvsSCISCDCvsSCISCD
1956–19892.3154.340.693.5456.490.74
2006–20162.5267.90.782.1448.020.71
Table 4. Correlation coefficient test between rainfall indexes and sediment discharge.
HuangfuKuye
PRCVPPCIMFIPCDPRCVPPCIMFIPCD
P * 0.2910.571 0.410.950.960.620.9
R0.97 0.7710.9410.59 0.970.980.750.93
CVP0.710.23 10.991** 0.96**0.31
PCI****** **0.26*** **0.22
MFI0.430.06*1 10.380.250.990.99 0.94
PCD******0.74** **0.690.78*
Note: ** significantly different at the level of 0.01. * significantly different at the level of 0.05. The p-value (significance level) indicates whether the index in the column is significantly greater than that in the row. For instance, the asterisk * in the third column of row 1 indicates that the correlation between R and sediment discharge is significantly greater than P index.
Table 5. Estimates of sediment discharge reductions attributed to rainfall erosivity and human activity.
SD
(108 kg·a−1)
Simple Linear RegressionDouble Cumulative
Curve Regression
ΔSp
(108 kg·a−1)
ΔSh
(108 kg·a−1)
ΔSp
(%)
ΔSh
(%)
ΔSp
(108 kg·a−1)
ΔSh
(108 kg·a−1)
ΔSp
(%)
ΔSh
(%)
HuangfuP1560.87
P2227.35100.00237.1529.6670.3482.39249.7324.8175.19
P357.0872.43434.9814.2785.7360.50441.8912.0487.96
KuyeP11080.26
P2109.87277.34692.5828.5971.41306.42721.3929.8170.19
P311.29101.16967.349.4790.53114.061012.3410.1389.87
Table 6. Regression relationships between monthly sediment discharge and monthly rainfall erosivity (simple) and between cumulative ones (double cumulative) in 1956–1989.
MonthHuangfuKuye
Simple pDouble CumulativepSimple pDouble Cumulativep
1Y = −0.00014x + 0.000860.57Y = 0.0054x − 0.0091**Y = 0.0071x + 0.0610.19Y = 0.056x − 0.34**
2Y = −0.0018x + 0.010.46Y = 0.0054x − 0.11**Y = 0.014x + 0.130.07Y = 0.069x + 0.41**
3Y = −0.047x + 0.880.05Y = 0.17x + 6.38**Y = 0.032x + 7.880.59Y = 1.03x + 1.51**
4Y = 0.086x + 0.091**Y = 0.20x + 5.64**Y = 0.073x + 1.76**Y = 0.17x − 0.83**
5Y = −0.066x + 1.610.05Y = 0.14x − 7.08**Y = 0.050x + 0.97**Y = 0.088x − 6.80**
6Y =−0.32x − 0.32**Y = 0.24x + 325.05**Y = 0.24x + 2.71**Y = 0.24x + 215.39**
7Y = −0.52x + 76.85**Y = 0.80x − 357.02**Y = 1.25x + 113.02*Y = 1.73x − 312.49**
8Y = −0.99x − 4.33**Y = 0.98x − 313.20**Y = 1.89x + 73.30**Y = 2.33x − 824.21**
9Y = −0.35x + 8.940.06Y = 0.34x + 437.97**Y = 0.74x − 27.85**Y = 0.45x + 48.04**
10Y = −0.051x + 0.051**Y = 0.051x + 5.43**Y = 0.11x + 1.25**Y = 0.18x + 0.71**
11Y = −0.084x + 0.027**Y = 0.030x + 0.97**Y = 0.11x + 1.09**Y = 0.30x − 0.44**
12Y = −0.0019x − 0.000580.62Y = 0.0014x + 0.031**Y = 0.14x + 0.11*Y = 0.37x − 0.040**
Note: ** significant at the level of 0.01. * significant at the level of 0.05.
Publisher’s Note: MDPI stays neutral with regard to jurisdictional claims in published maps and institutional affiliations.

