
Conjunctive Operation of Surface and Subsurface Dams Based on Drought Severity


Department of Civil and Environmental Engineering, Dongguk University, Seoul 04620, Korea
*
Author to whom correspondence should be addressed.
Water 2021, 13(6), 847; https://doi.org/10.3390/w13060847
Submission received: 18 February 2021
/
Revised: 12 March 2021
/
Accepted: 16 March 2021
/
Published: 19 March 2021
(This article belongs to the Section Water Resources Management, Policy and Governance)
Abstract
:As an effective water management method to respond to the increasing severity of drought, this study proposed a conjunctive operation using a surface reservoir and subsurface dams. The proposed methodology predicts the probable rainfall according to the drought severity and the water demand, and uses these as the basis for water allocation. Sokcho City, located in South Korea, was used as the study case. Sokcho is a tourist city that has suffered from water shortages for many years due to its excessive dependence on a single groundwater dam. Considering conjunctive operation, drought frequency, and drought duration, a total of 80 cases under four scenarios were generated and simulated to determine the water supply capability over the entire year. The results indicate that domestic water can be supplied throughout the year with appropriate water allocation, even when a once-in-50-year drought lasts for 120 days. Furthermore, the water supply potential, which is the additionally available capacity in a reservoir, was used to assess the effects of conjunctive operation. It was estimated that, for a once-in-10-year drought, up to 318% of the annual water demand was available in the reservoir. As the proposed methodology is relatively simple, it offers a useful water resource management tool for sites with similar social and environmental conditions.
1. Introduction
The severity of drought, in terms of both frequency and duration, is increasing rap-idly worldwide due to climate change, leading to greater negative economic, environmental, and social effects. To cope with this, effective water management strategies are required, particularly for drought-prone areas with a high dependence on one source. The conjunctive use of surface water (e.g., reservoirs, rivers, streams, and canals) and subsurface water (groundwater dams, aquifer) is considered an effective solution to mitigate water shortage problems caused by drought [1,2,3]. The advantages of conjunctive operation are not limited to avoiding water shortages and enhancing the water use efficiency [1,4]. It is also useful for stabilizing the water supply by increasing the available water capacity in areas where new water resource development is limited or where the water supply is unbalanced [5].
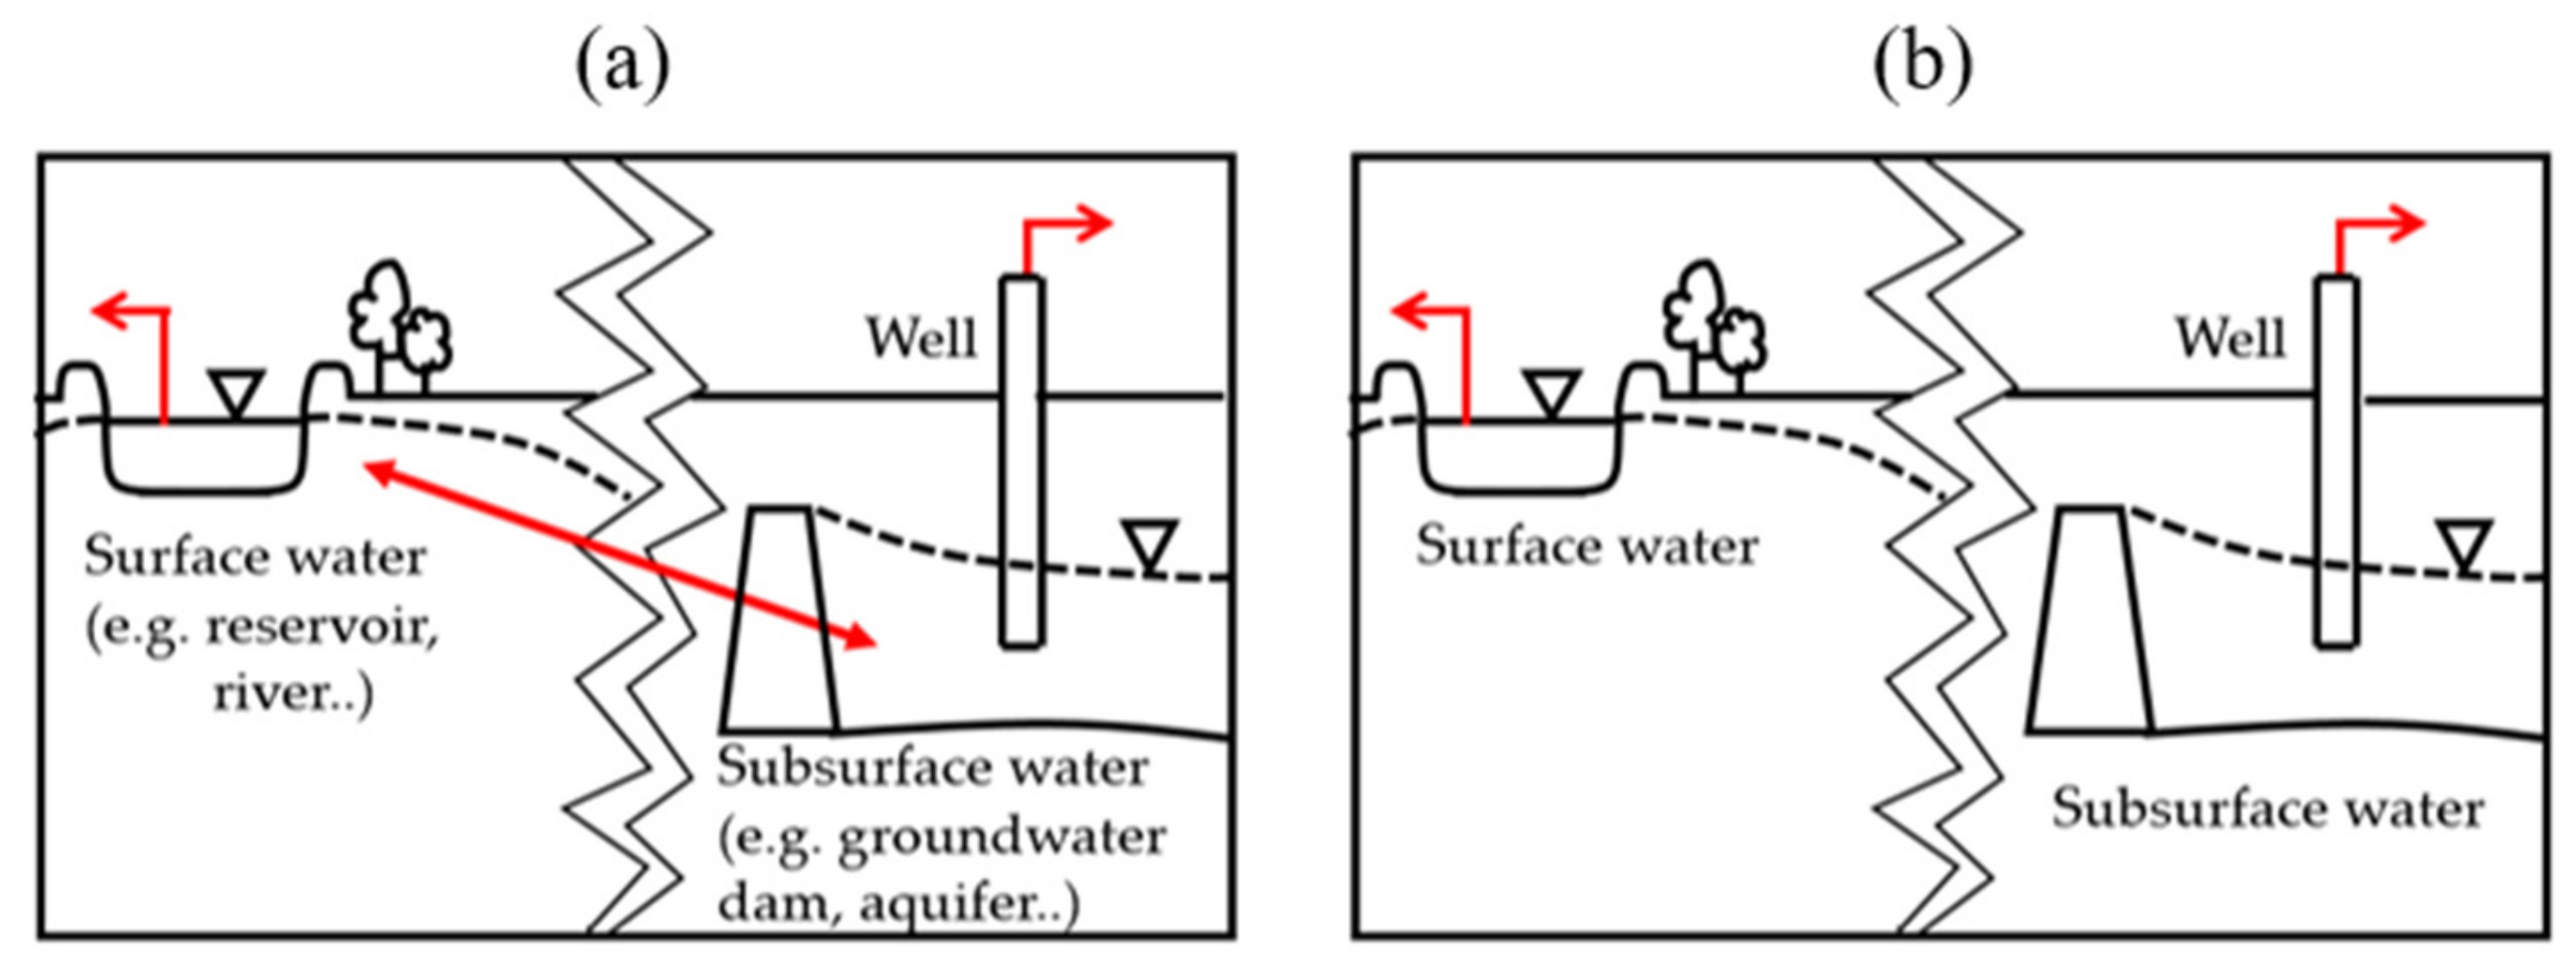
Conjunctive operation can be classified into two types, active and passive (Figure 1). Active operation includes artificial water transport between the surface and subsurface water, such as aquifer storage and recharge (ASR) [6,7,8]. Passive operation involves the independent use of the surface and subsurface water. This is usually employed in water management systems that have the scalability to utilize water sources through virtual connections, without restrictions on location, distance, or usage, which are obstacles to physical links.
Table 1 lists some recent studies on conjunctive operation. Examples can be found in many countries, including the United States, Germany, Israel, and Japan. The purpose of conjunctive operation includes stabilizing irrigation [9,10,11,12,13,14,15,16,17,18,19], guaranteeing an efficient water supply [20,21,22,23,24,25,26,27,28,29,30], improving water quality [12,21,31,32], and preventing saltwater intrusion [33].
With limited resources, it is necessary to solve water supply problems by utilizing water resources and facilities as efficiently as possible. As such, passive conjunctive use offers an approach for the stable and optimal utilization of surface water and subsurface water resources. In this study, passive conjunctive operation for practical water management is investigated using local underground dams and a reservoir under various drought conditions. The novelty of the proposed methodology is that it considers the water supply allocation ratio between the available water resources in relation to the frequency and duration of drought. The present study develops water allocation scenarios based on various drought severity levels and evaluates the performance of scenario-based reservoir operation. The water supply potential (WSP) of the reservoir is also assessed as an additional effect of conjunctive operation.
2. Study Area
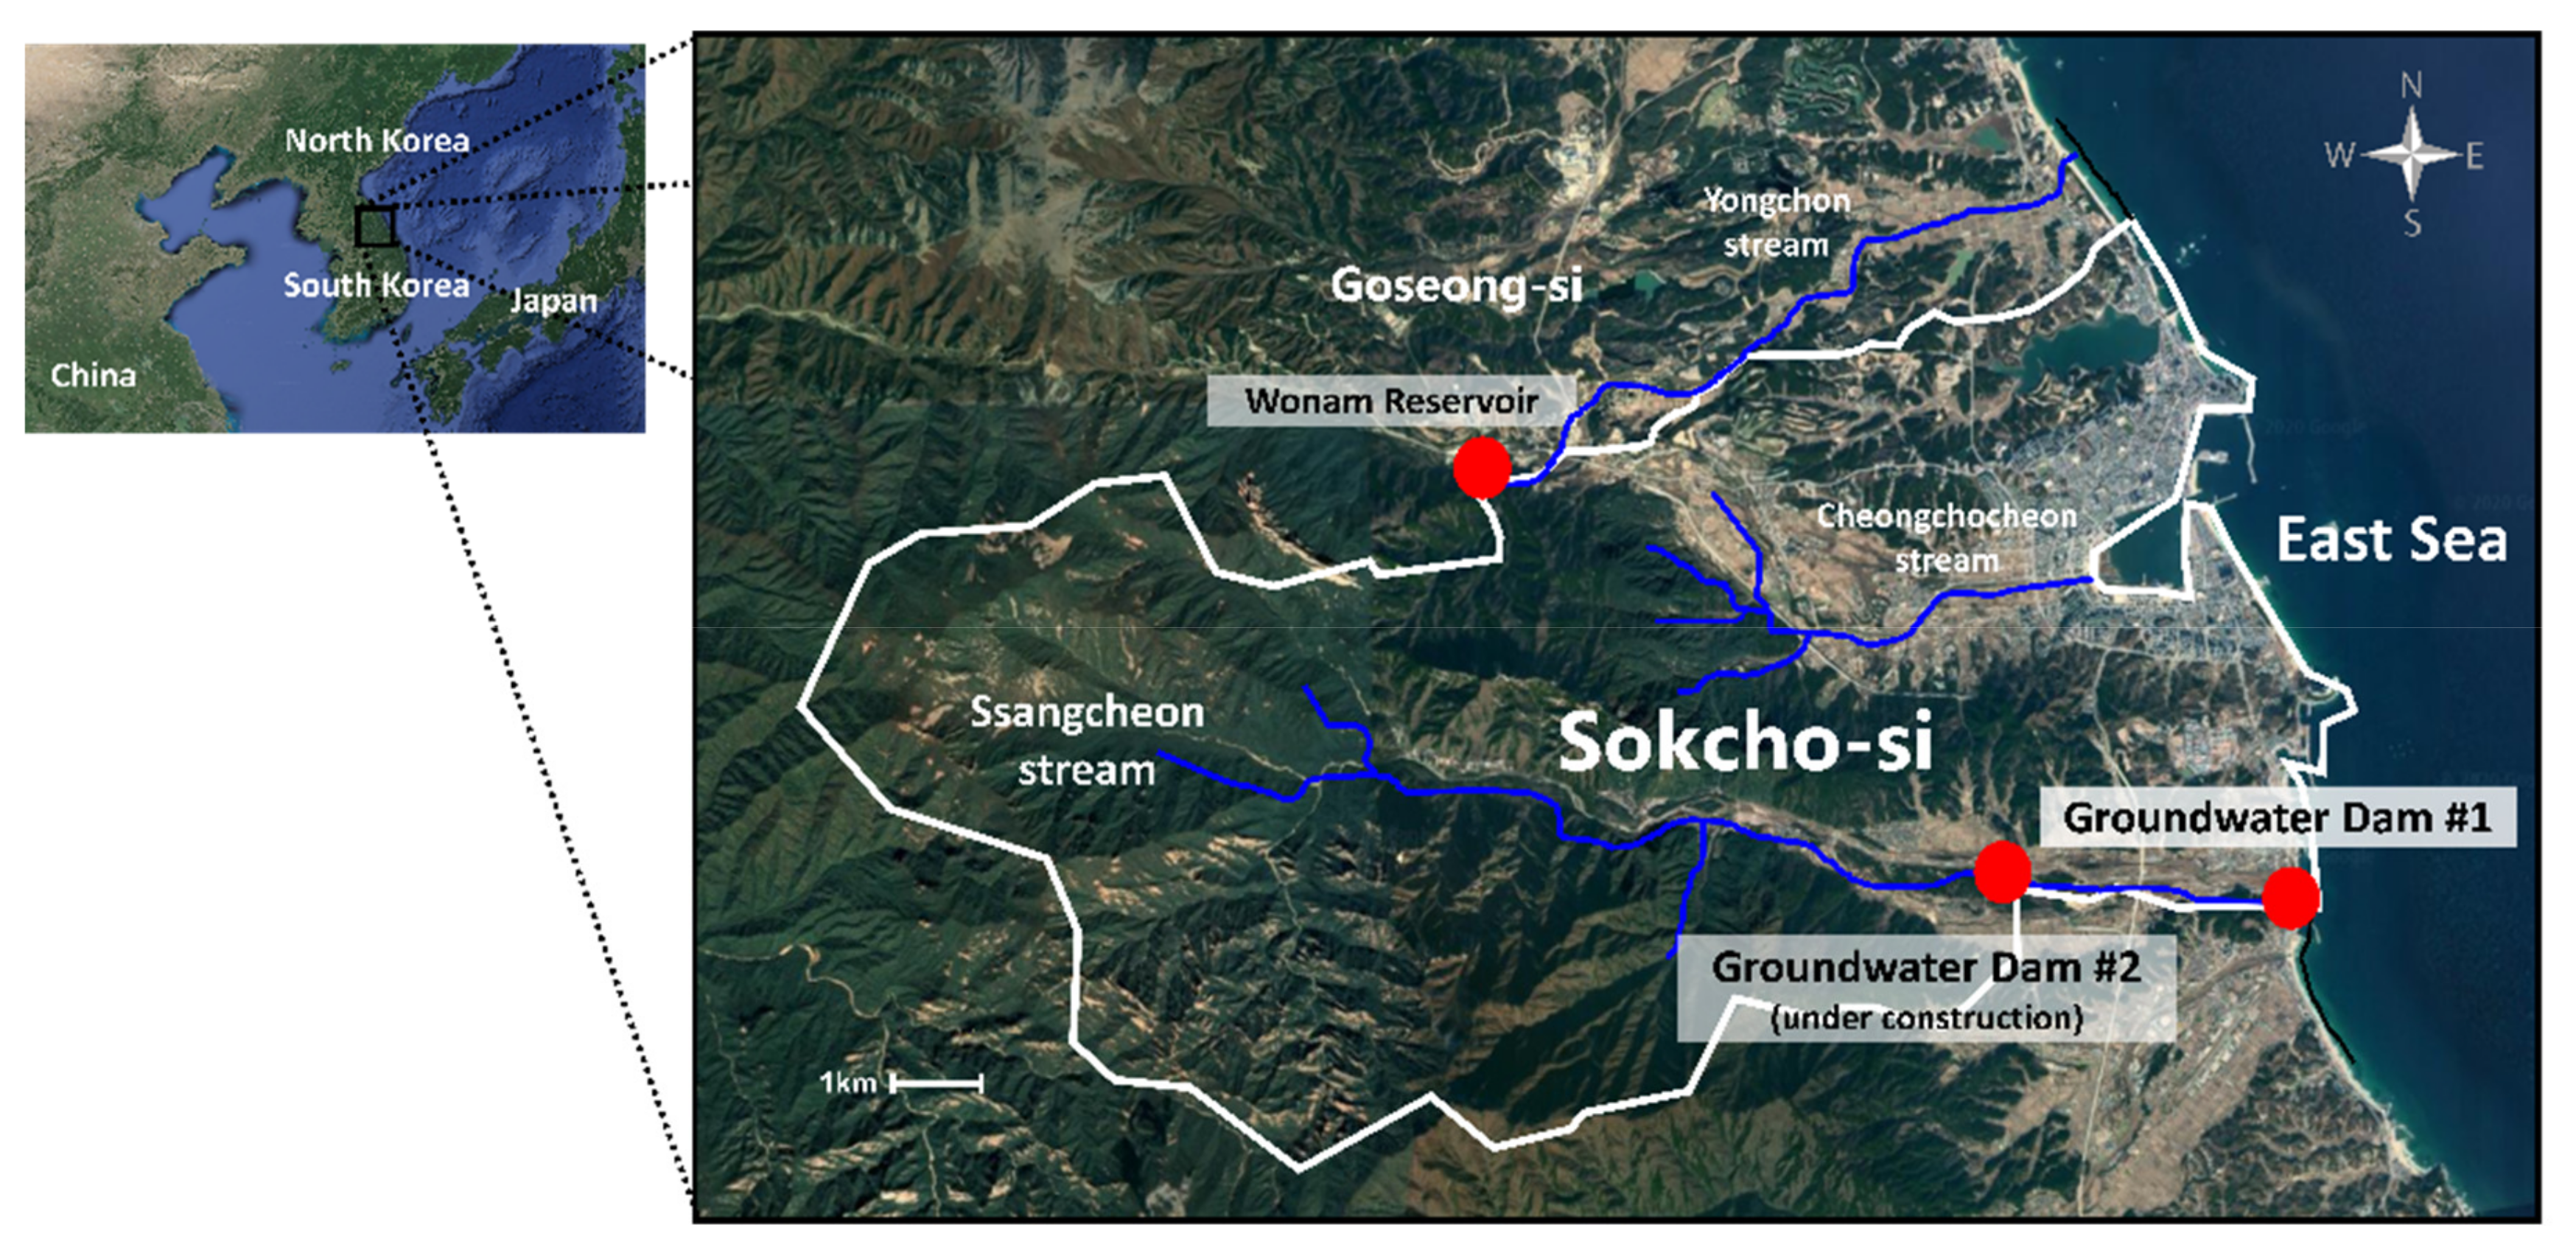
Sokcho City, located in Gangwon-do Province, South Korea, was selected for the study case because it frequently experiences water shortage problems. Located 284 km east of Seoul, the capital of South Korea, Sokcho is a famous tourist city, with numerous tourist attractions, such as mountains, sea, lakes, hot springs, and beaches. Figure 2 presents the watershed and water supply sources for the city. Ssangcheon Stream is the main water source, but its length is short and its slope is steep; consequently, most rainfall flows directly into the East Sea. The groundwater dam downstream of Ssangcheon Stream supplies about 90% of the total domestic water and up to 41,000 m3 of water per day to the city [34]. However, because this groundwater dam is located close to the coast, continuous large-scale pumping can cause ground subsidence and saltwater intrusion. Once unbalanced, significant time and money is required to restore the water level and quality of a groundwater source, and it often cannot be completely recovered [35].
In its current state, securing additional water resources for Sokcho is vital to avoid dry streams due to drought and to conserve groundwater resources. However, the construction of a new water source is costly and time-consuming, while also being practically limited by the lack of land and environmental challenges. Therefore, it is necessary to find ways to increase the utilization efficiency of the current water resources. Near the study area, Wonam Reservoir supplies agricultural water to surrounding farmland. It is used to provide irrigation water during the farming season from April to September. If this reservoir was used effectively to supply both agricultural and domestic water, it would lower the dependence on the underground dams in the area and guarantee a stable supply of water. As a result, two groundwater dams (one existing, one currently under construction) and Wonam Reservoir were selected for analysis (Figure 2). Details of the water facilities in the study area are provided in Table 2 and Table 3.
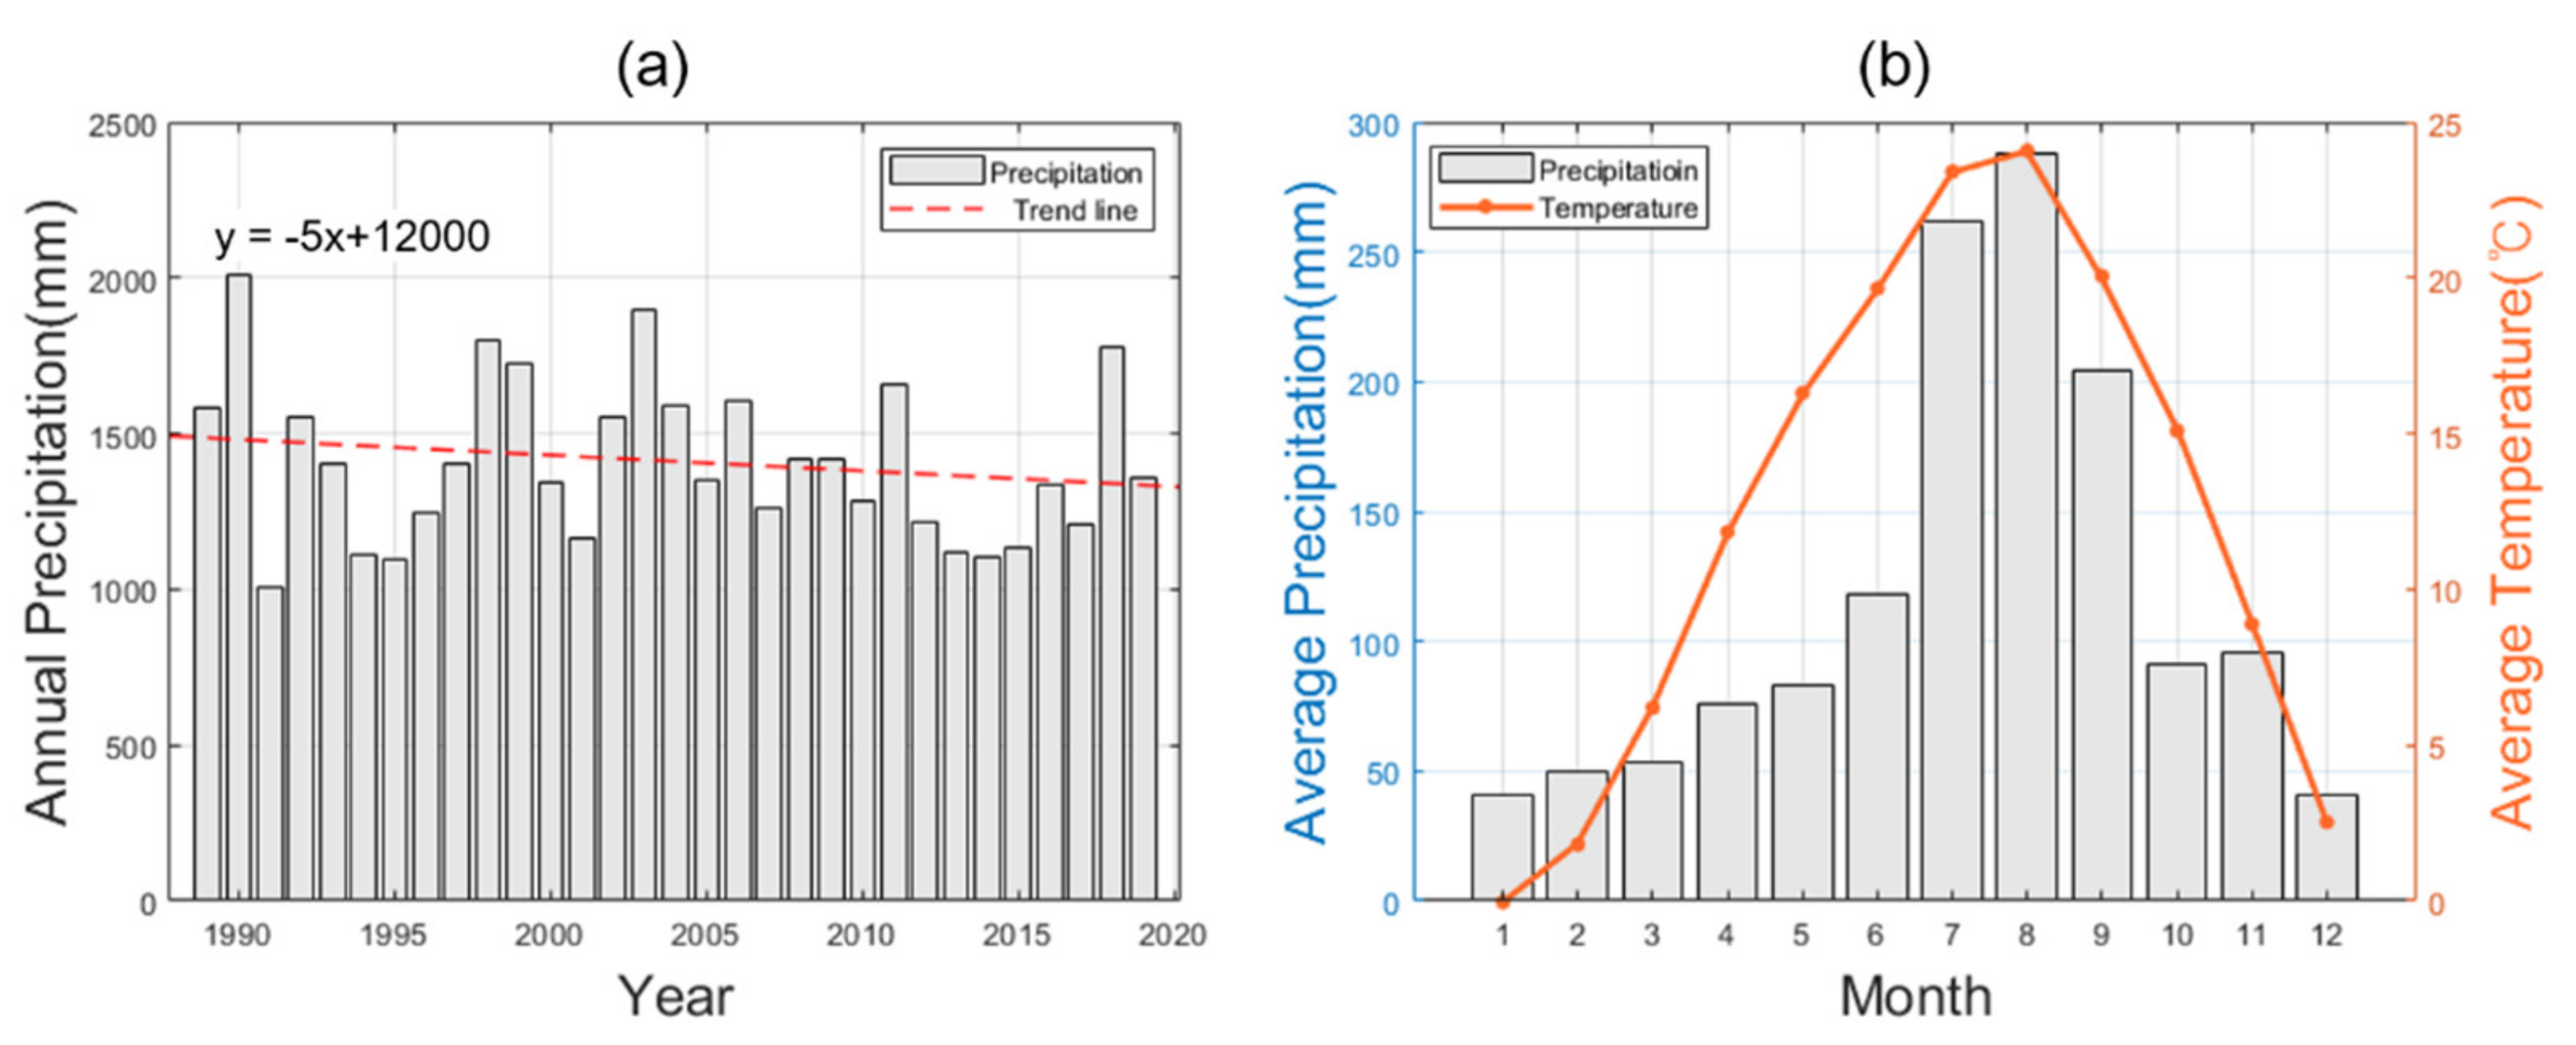
Historical rainfall data for the area show that, in the last 30 years the annual rainfall data has fluctuated, with a generally decreasing trend (Figure 3a) [36]. More than 53% of the annual precipitation occurs during the July–September period, and the average, maximum, and minimum temperatures have all increased since the 1980s (Figure 3b), which represents suboptimal conditions for the maintenance of surface water as a stable water supply resource [37]. In addition, episodes of drought have become more severe in the area, with the local community suffering from water restrictions once every 1 to 2 years since 1995.
3. Preliminary Analysis
3.1. Estimation of Water Demand
In the present study, the population for the target year (2050) was estimated first and multiplied with the average daily water consumption to determine the water demand in 2050. The population of Sokcho was 81,786 in 2019, and the number of residents is de-creasing annually. However, Sokcho’s floating population is more than 12 million a year, which is twice as many as in the early 2000s, which must be taken into account.
The population was estimated using four common methods: arithmetic series, least squares, geometric series, and logistic curves. The arithmetic series approach is most suitable for short-term estimates and large cities in which development is slow or almost complete:
where is the population n years later, is the present population, and is the number of years from the present to the target year. is the average population growth rate, which is estimated as , with denoting the population size t years earlier.
The least-squares method is useful when future variables cannot be accurately estimated. It assumes that future changes will follow a linear regression equation:
The constants and are obtained as follows.
where is the number of population data, is the number of years since the base year, and is the population size.
The geometric series method estimates the population under the assumption that the population growth rate is almost constant every year:
where is the average annual population growth rate, calculated as , and is the population t years earlier.
The logistic curve method is useful to estimate the change in the urban population:
where is the saturated population. The constants and are obtained from Equation (6).
The calculation results are shown in Table 4. The arithmetic series and geometric series methods produced similar estimates, while the least-squares method predicted the lowest population. The logistic curve method has the largest estimate, and this was used for this study because there is expected to be an increase in the number of visitors as Sokcho grows rapidly as a tourist city. Based on this figure and the average daily water supply per person of 500 ℓ, the required water supply in 2050 was estimated to be about 50,000 m3/day, approximately 44% higher than the current water supply.
3.2. Drought Analysis
Drought is a natural hazard that makes water resource planning more difficult due to its long-lasting effects [38]. The drought frequency for this study was determined based on drought indicators, which allow the severity and duration of droughts to be determined and provide important information that can be used in establishing future drought-related plans. The most common drought indices are the standardized precipitation index (SPI), the Palmer drought severity index (PDSI), the US drought monitor (USDM), and the normalized difference vegetation index (NDVI) [39]. The SPI is a meteorological drought index that has been widely adopted in research, while the PDSI is more comprehensive than precipitation-only indices. The USDM is a composite drought index that integrates multiple indices such as the SPI and PDSI. The NDVI uses remote sensing to monitor vegetation conditions. These drought indices can be used to identify trends and establish a minimum and maximum drought frequency.
The SPI was used for the drought analysis in the present study. The drought analysis classifications for this index are presented in Table 5 [40]. The SPI for three months of accumulated precipitation data (SPI-3) was used to assess short-term drought, and the SPI for 12 months of accumulated data (SPI-12) was used to assess long-term drought.
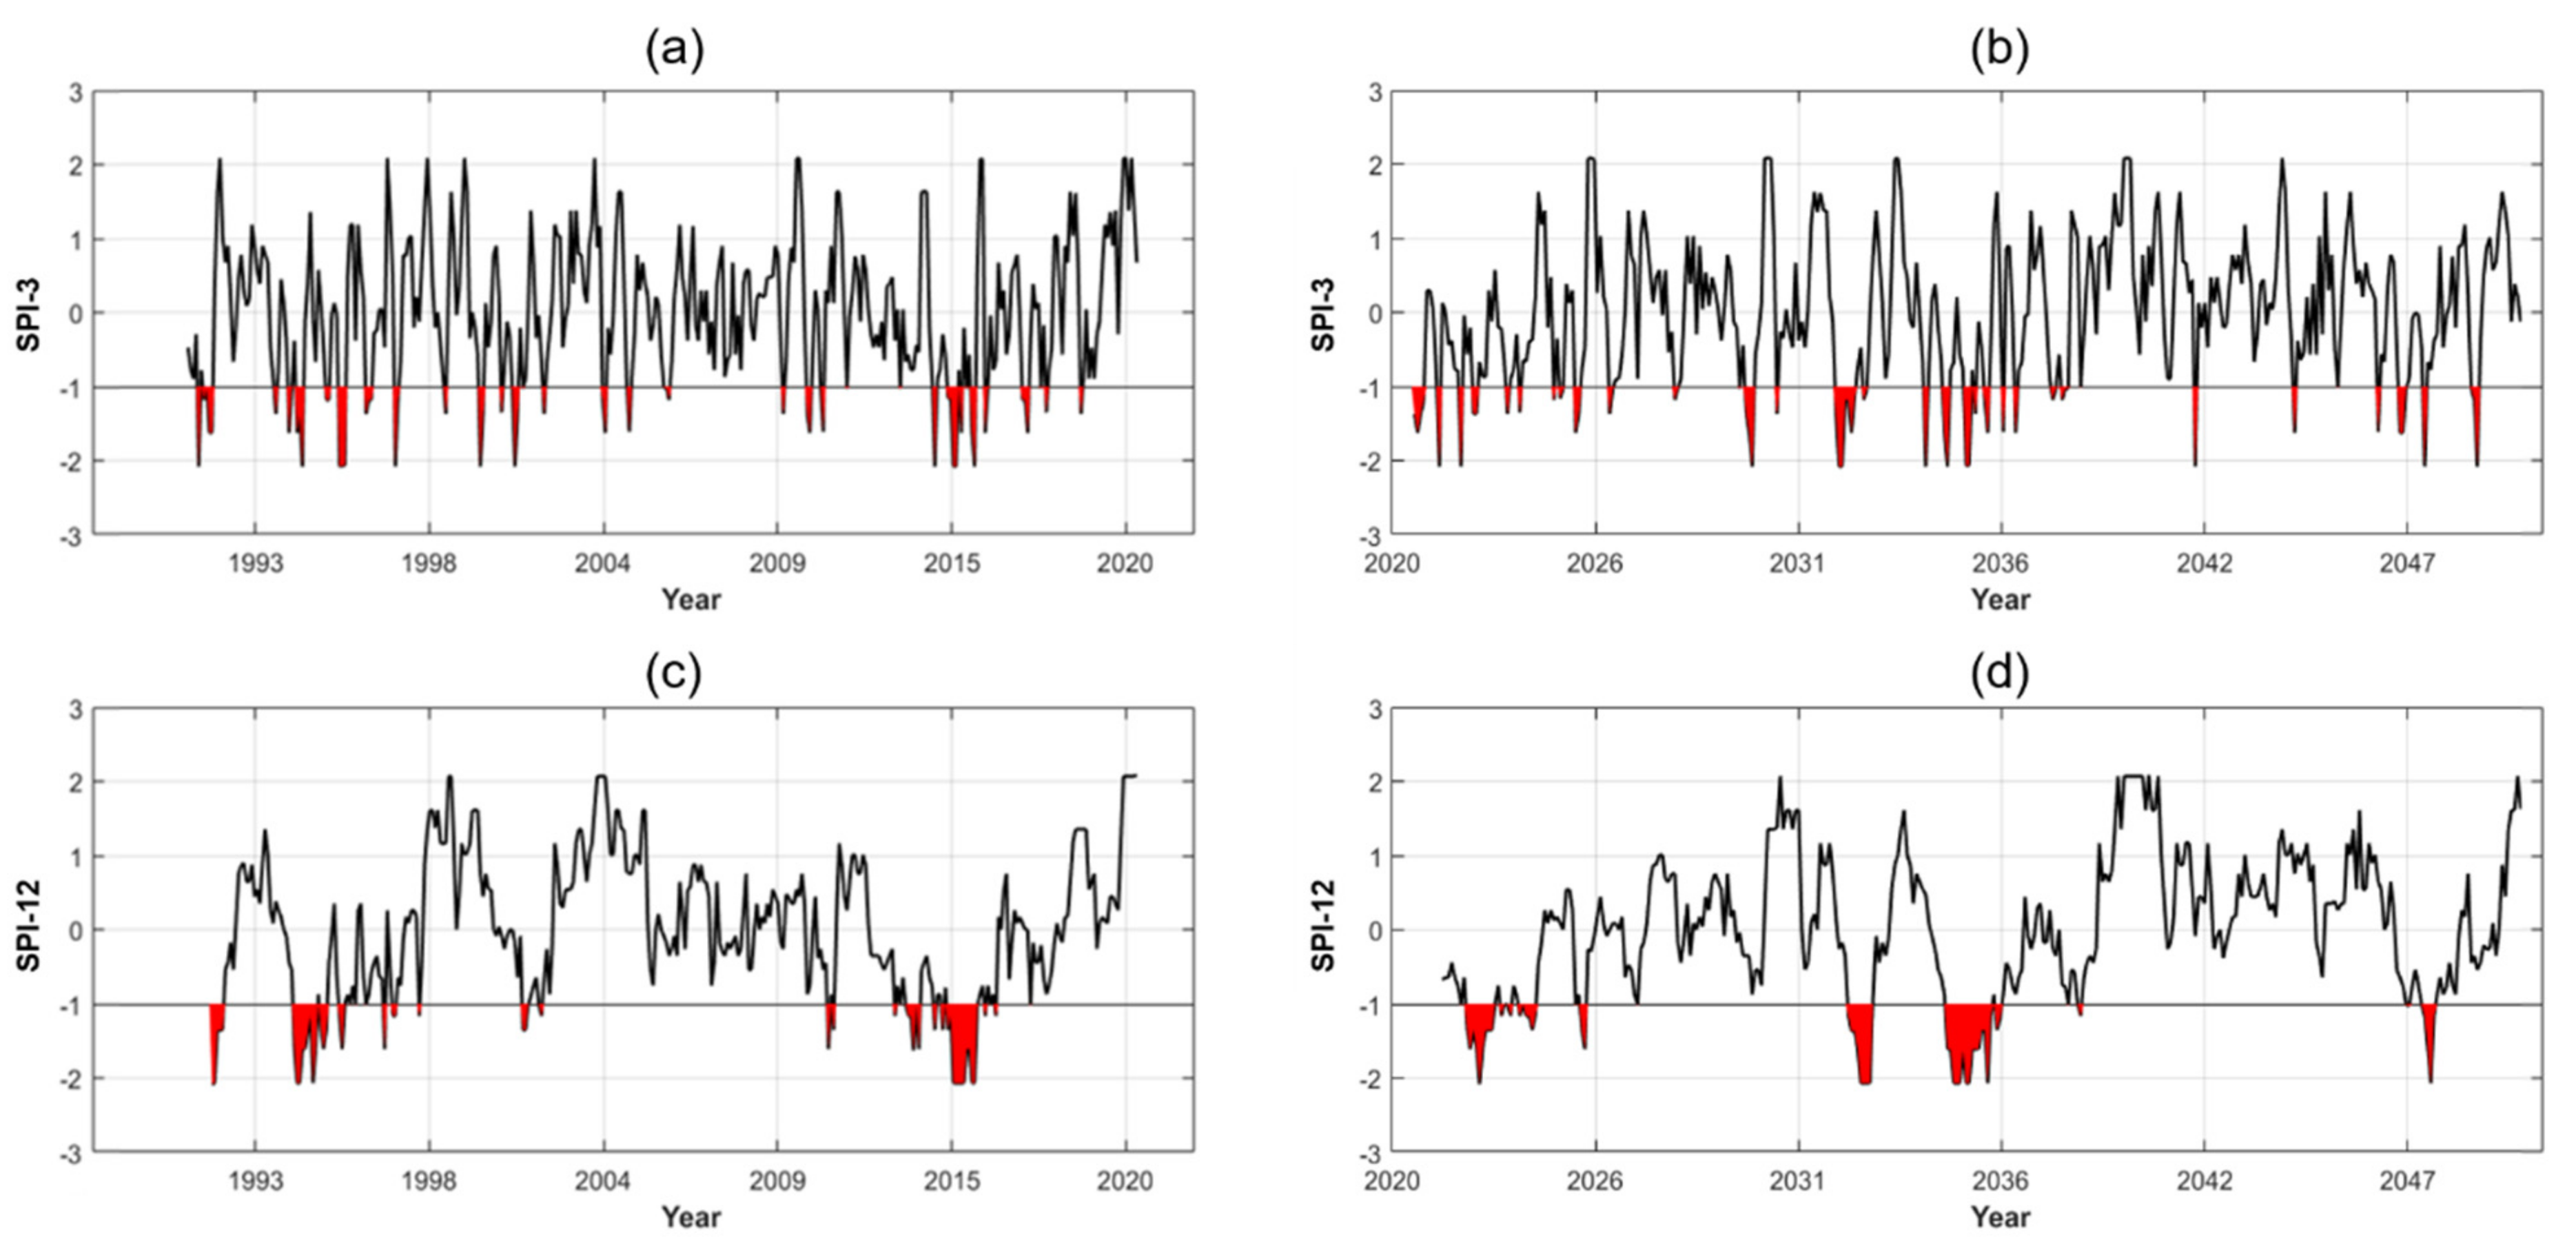
The SPI-3 and SPI-12 were calculated using a total of 360 months of precipitation data (from December 1990 to November 2020). Future rainfall data (2021–2050) were simulated using the HadGEM3-RA regional climate model, under the RCP4.5 scenario [41]. Figure 4 presents the change in SPI-3 and SPI-12 over the past 30 years and the estimates for 30 years into the future. In both the past and future periods, the SPI-3 results show that moderate droughts occur almost every year (Figure 4a,b), while extreme droughts occur approximately once every 10 years (Figure 4c,d). It is thus necessary to prepare for once-in-10-year droughts by identifying the frequency of extreme droughts using SPI-12. Currently, Korean government water resource plans consider severe droughts that occur once every 30 years. However, once-in-50-year droughts were also included in the present study to account for the possibility of more severe droughts. Consequently, this study attempted to establish water allocation scenarios based on three drought severity cases: once-in-10, -30-, and -50-year droughts. In Section 3.3, the annual rainfall for once-in-10-, 30-, and -50-year droughts is converted to monthly data and then used for the reservoir simulations in Section 4.2.
3.3. Rainfall Estimates according to Drought Severity
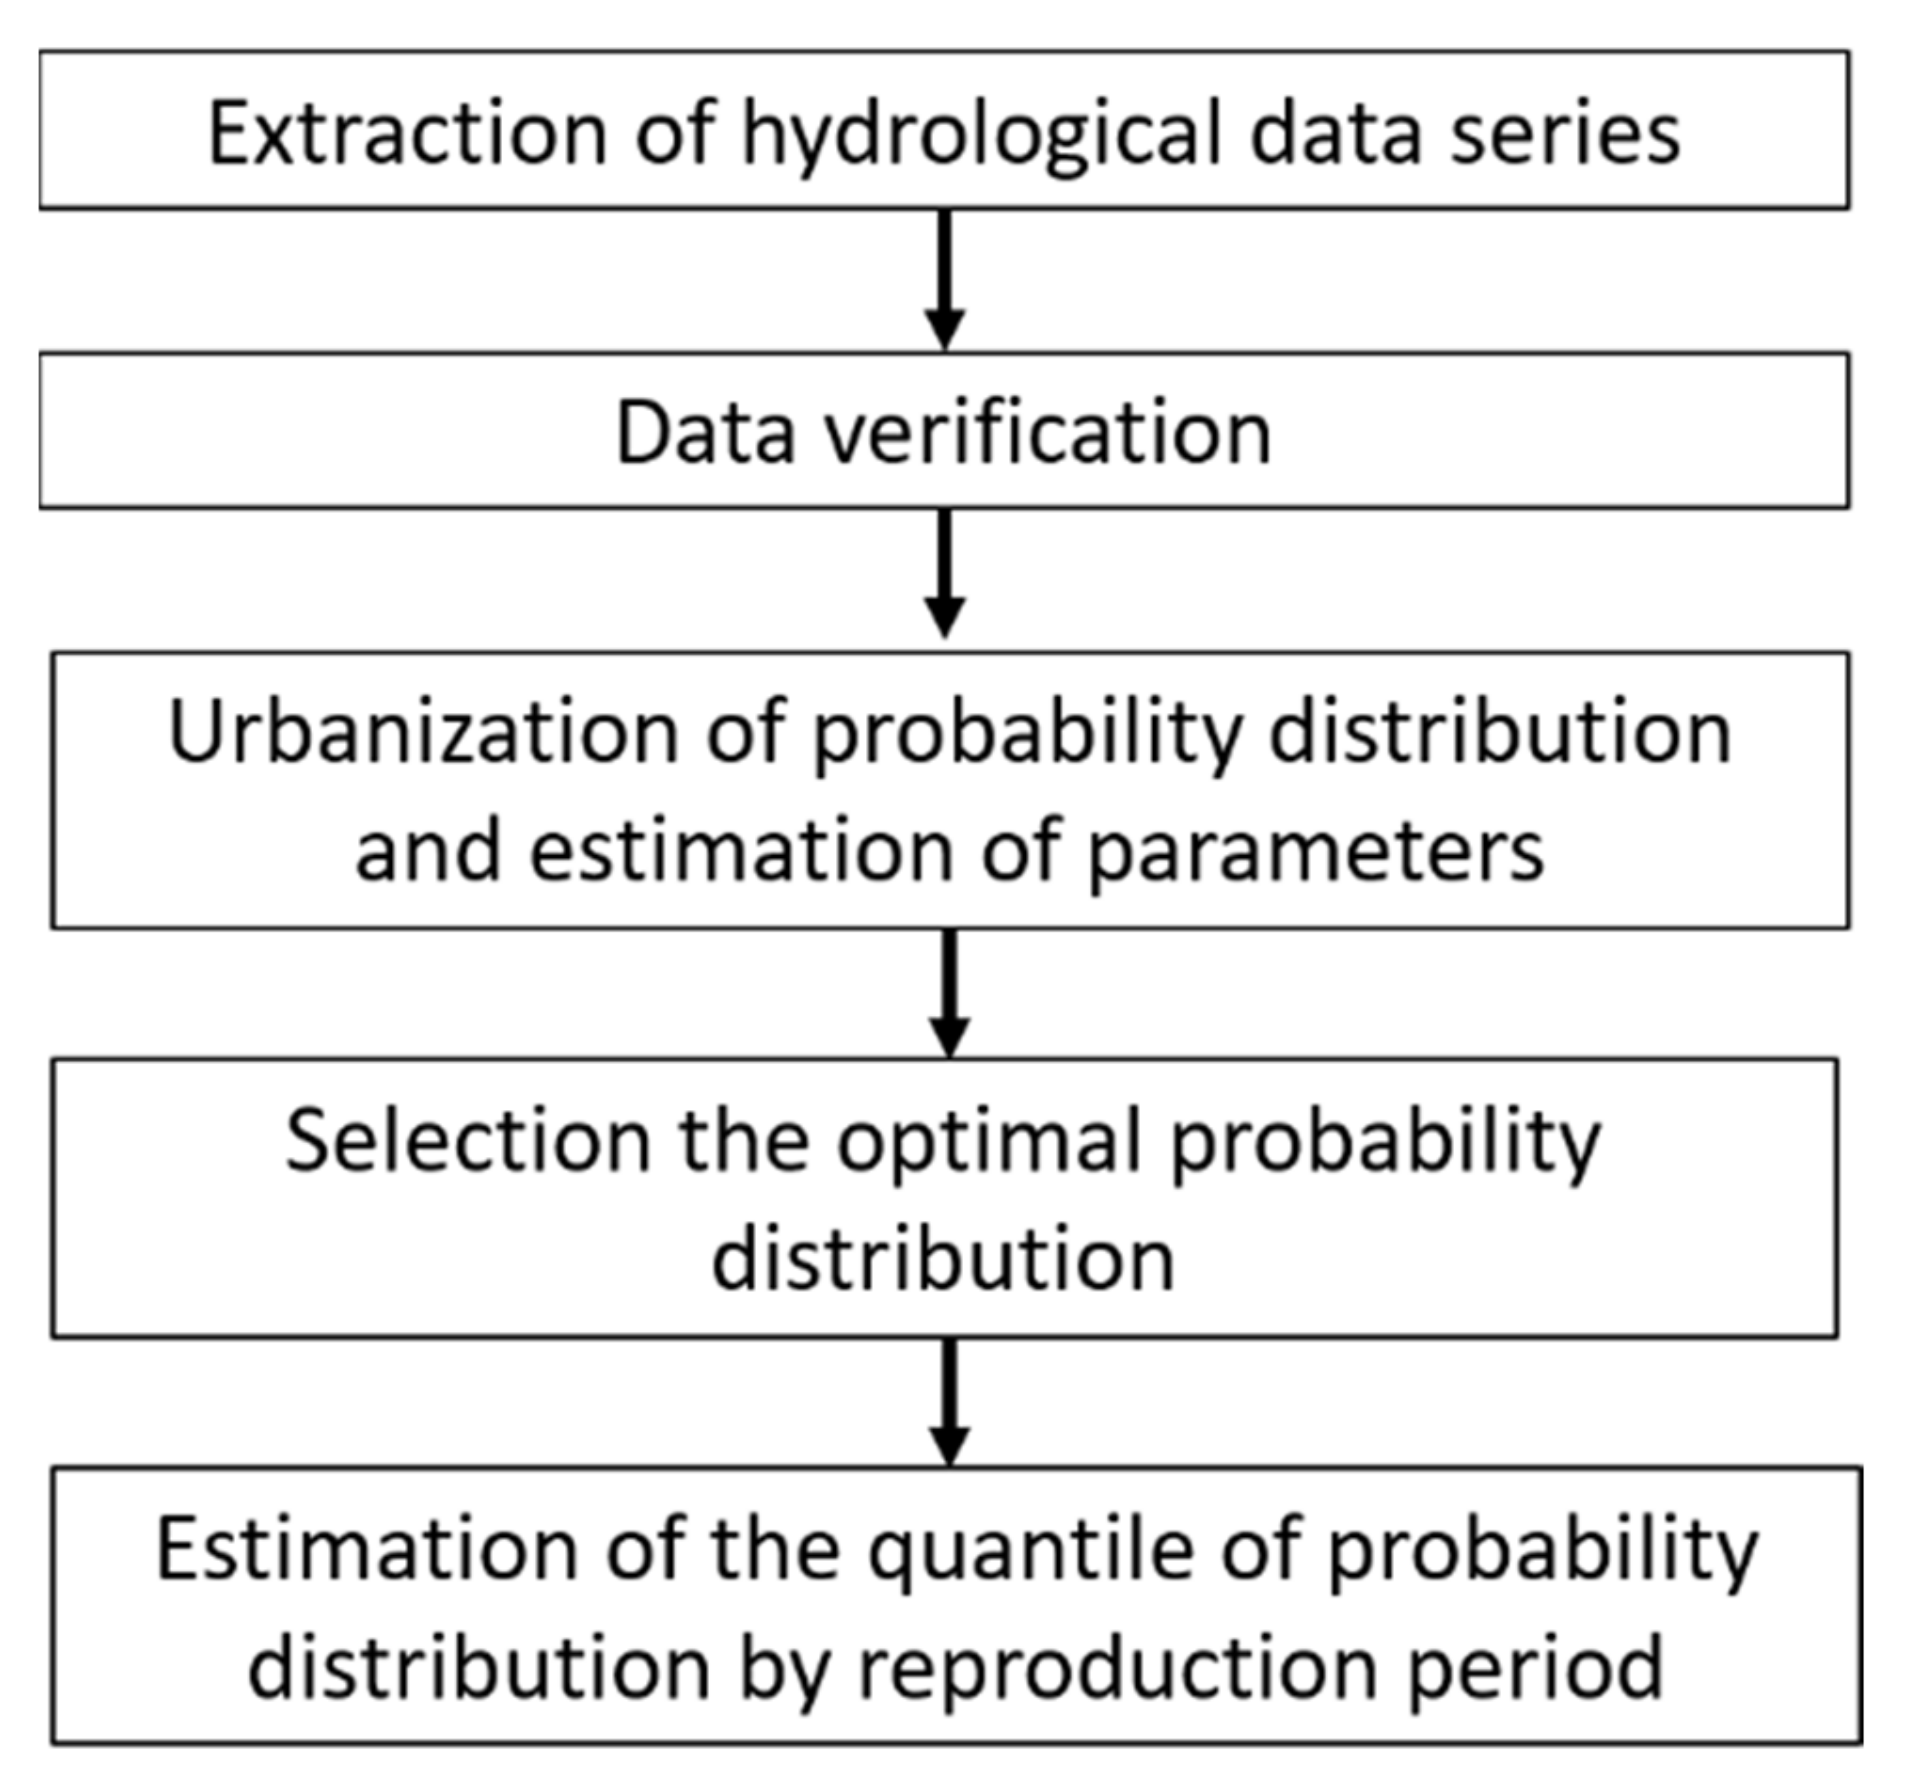
Rainfall is very difficult to accurately predict because it varies due to weather and environmental factors. Thus, hydrological rainfall analysis uses statistical techniques based on past observational data. In this study, rainfall was estimated using the frequency analysis process shown in Figure 5. In general, hydrological frequency analysis uses annual maximums to predict flooding and estimates the upper quantile of the probability distribution (i.e., the right tail) corresponding to the extended reproduction period. In contrast, the lower quantile of the probability distribution (i.e., the left tail) for each extended reproduction period was estimated in the present study; as the reproduction period increases, a quantile is interpreted as a smaller value, and this is regarded as the rainfall during drought [42].
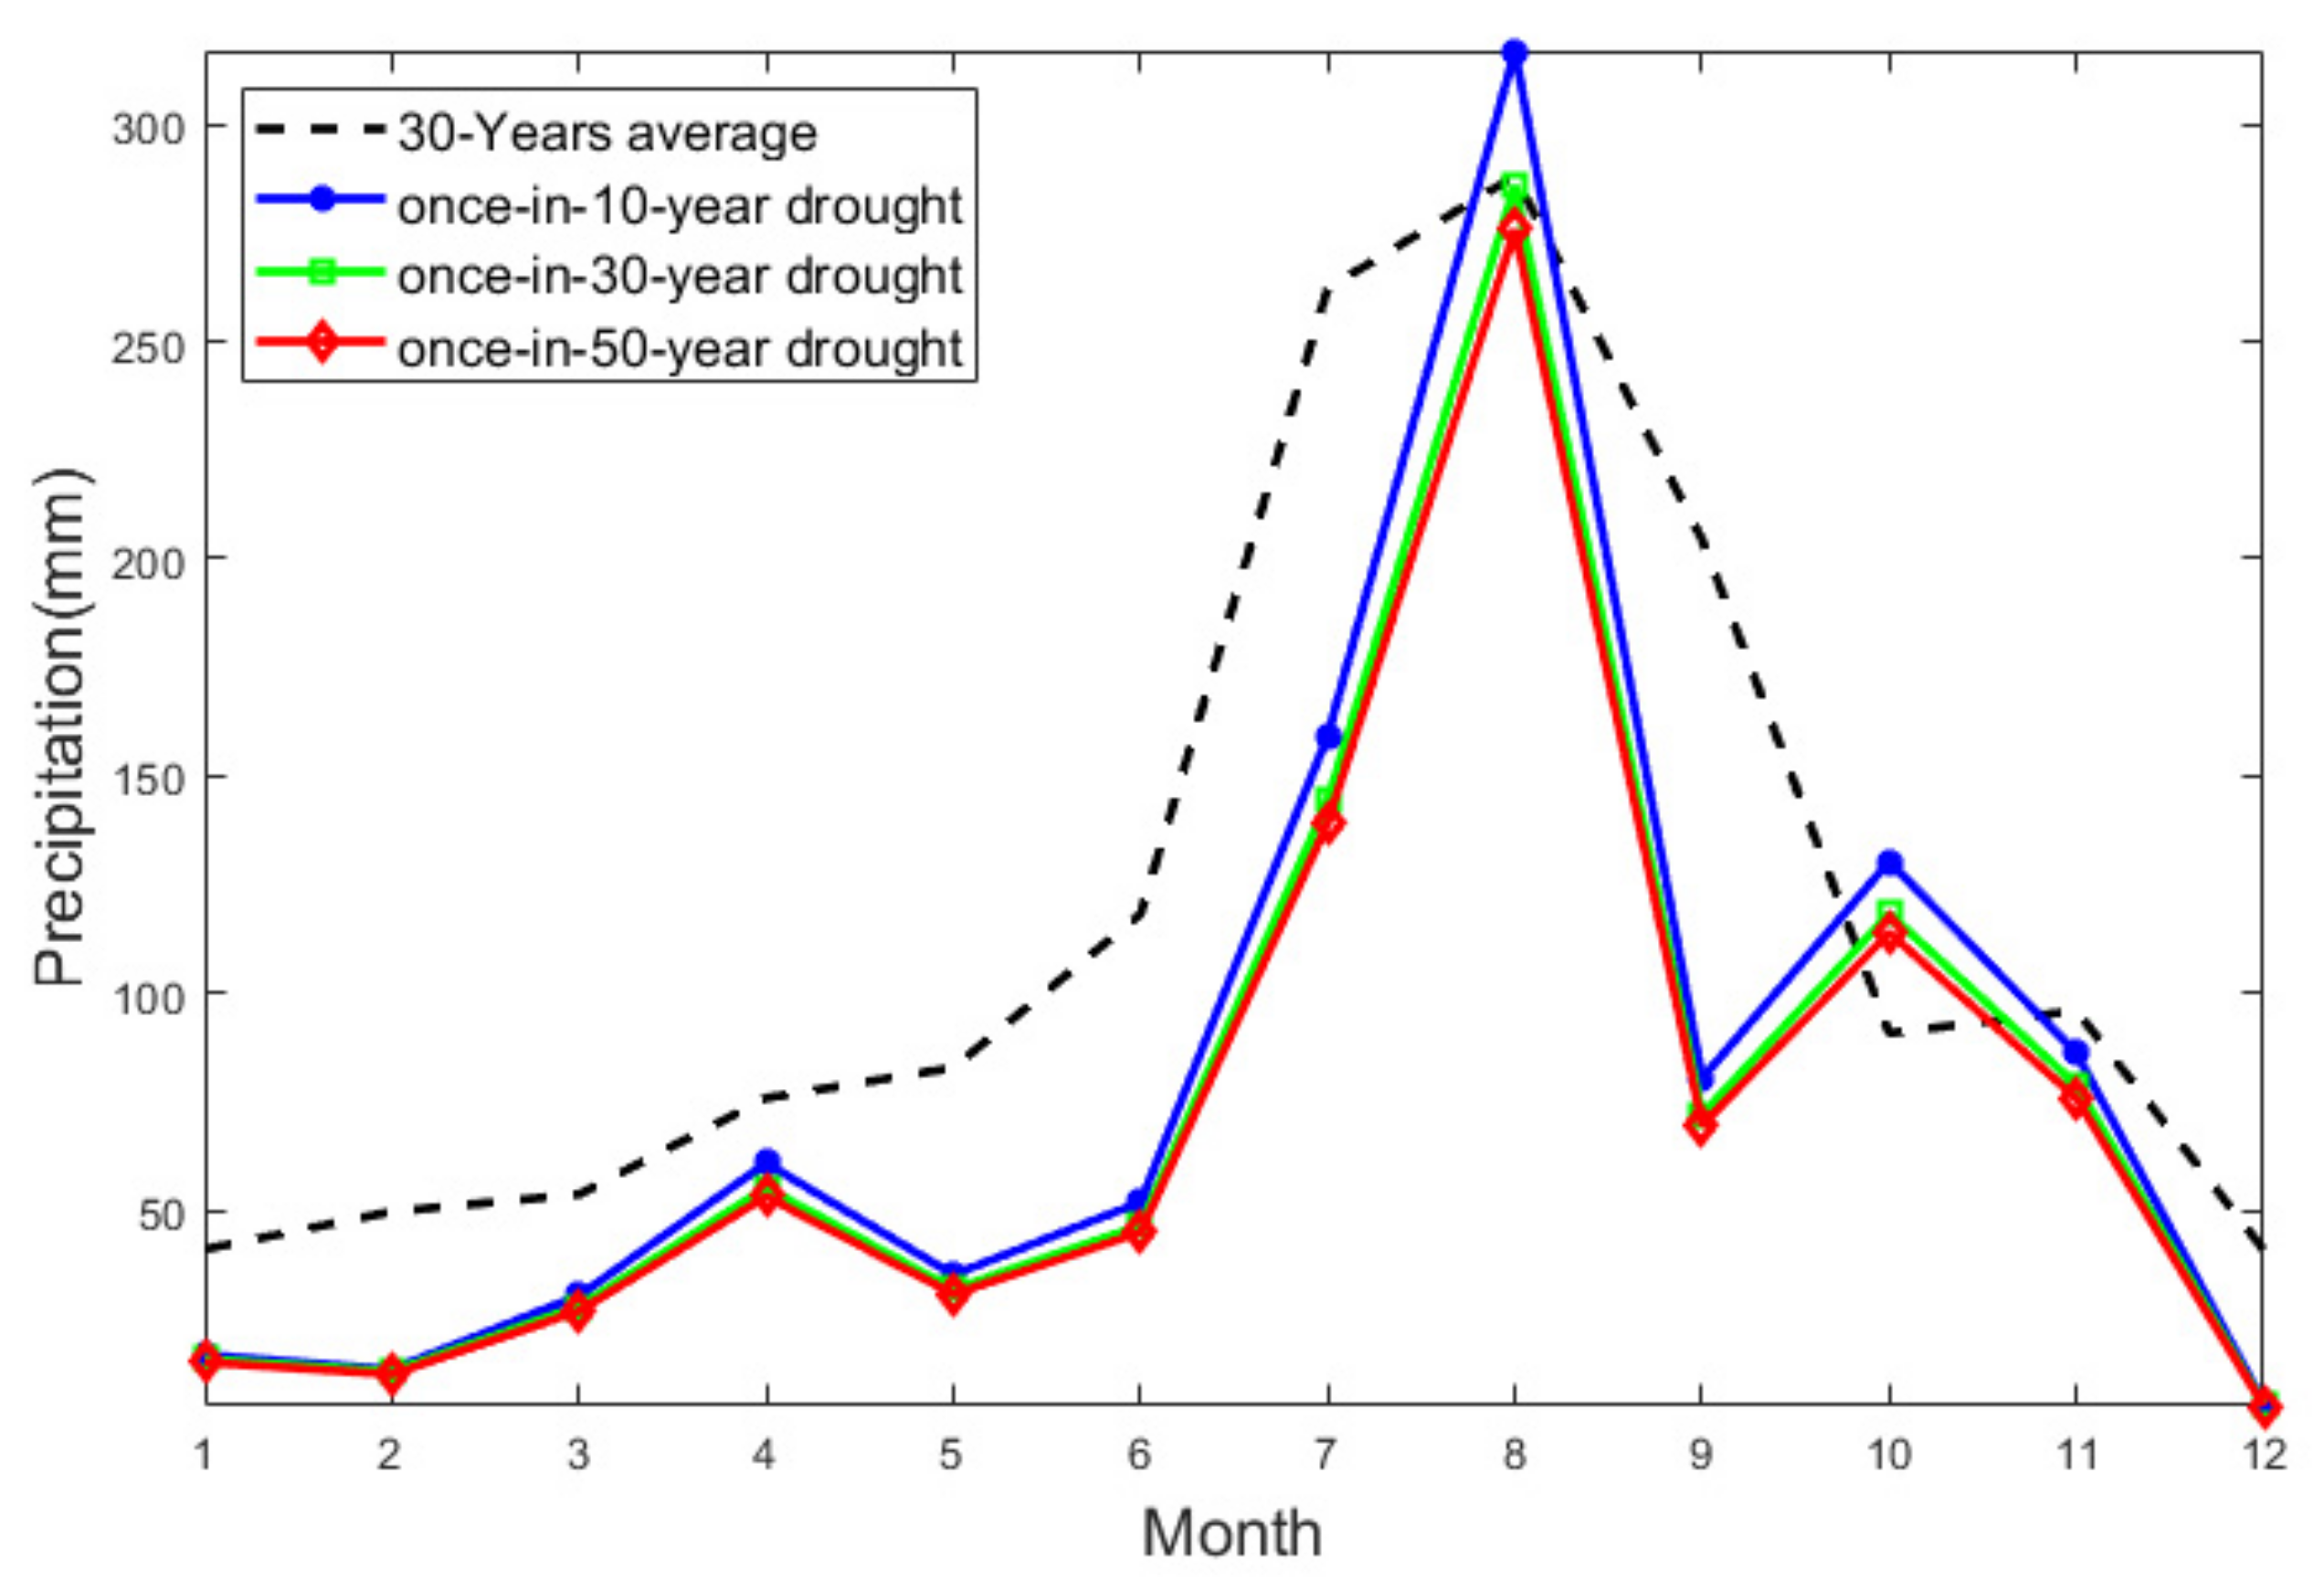
The rainfall was calculated to be 998.8 mm, 897 mm, and 864.1 mm per year for a once-in-10-year, 30-year, and 50-year drought, respectively. As these figures represented annual rainfall, they were transformed into monthly rainfall by employing the distribution trends of the average precipitation for the last three years to determine the total monthly rainfall according to drought severity (Figure 6). The estimated monthly rainfall was then used as a component of the inflow data when assessing reservoir performance.
4. Water Allocation
4.1. Scenarios for Conjunctive Operation
Various conjunctive operation scenarios were created based on the available water sources. Depending on the environmental conditions, active or passive conjunctive operation can be considered (Figure 1). This study considered practical aspects such as geological location, physical connectivity, and hydro-meteorological characteristics. As a result, two groundwater dams and Wonam Reservoir were selected for water allocation (Figure 2), and based on the passive conjunctive operation of the subsurface and surface water. As the distance between the reservoir and the existing groundwater dam was around 10 km, their hydro-meteorological characteristics were similar. In addition, there is a national park between the existing dam and the reservoir, preventing the construction of waterways or pipelines. Even if it were allowed, it would be unlikely to be cost-effective. The second groundwater dam under construction on Ssangcheon Stream is located 4 km upstream of the existing groundwater dam and will provide 5000 tons of water a day once it is completed in 2022.
To prevent the depletion of the reservoir and to operate flexibly in response to increasing demand for water, conjunctive operation should be in place for both normal and emergency situations. As such, the scenarios investigated in the present study were generated based on the severity and duration of drought. Since surface water is more sensitive to drought than subsurface water, the proportion of the water supply coming from the reservoir becomes lower and that from the groundwater dams becomes higher as a drought intensifies. This hydrological situation was considered when establishing the four scenarios used to identify the optimal water allocation in the present study for passive conjunctive operation of the three water resources.
As estimated in Section 3.1, the water management plan for Sokcho should prepare for a maximum 44% increase in the water demand by 2050. Currently, the dependence on the existing underground dam is very high; the second underground dam is still under construction, and Wonam Reservoir is used only for agriculture. By combining these three water resources, scenarios were set up to allocate the water supply to the study area.
Table 6 presents the four scenarios based on the daily allocation of domestic water needed in 2050. The main scenarios were classified by their allocation ratio (i.e., the proportion of the water supply coming from each water source) and subdivided into four drought severity levels (normal, once-in-10-year drought, once-in-30-year drought, and once-in-50-year drought). For each drought severity level, five drought periods were considered (one to five months). This is because when the rainfall data for the last 30 years were listed by month, the values below the average lasted up to 5 months. Thus, a total of 80 subscenarios were assessed for water supply availability.
Scenario 1 involved the use of the first groundwater dam and Wonam Reservoir to supply 70% (35,000 m3/day) and 30% (15,000 m3/day) of the domestic water needed in Sokcho, respectively. It represented the simplest conjunctive operation scenario. In Scenario 2, the second groundwater dam supplied 10% of domestic water, the first underground dam 70%, and the reservoir 20% (10,000 m3/day). In this scenario, the second underground dam was added to reduce the burden on the existing groundwater dam. Scenario 3 utilized only the first underground dam and reservoir as in Scenario 1, but flexible operation allowed for the water supply allocation ratio for the two sources to be adjusted. For example, during a once-in-10-year drought, 75% (37,500 m3/day) of the water supply would come from the groundwater dam and 25% (12,500 m3/day) from the reservoir (Scenario 3b). For a more severe drought (once-in-50-year), the amount of water available from the reservoir would fall to 15% (7500 m3/day) of the total (Scenario 3d). Scenario 4 was based on the conjunctive operation of all three water sources with flexible operation. Given the maximum water supply capacity of the second underground dam, its allocation ratio was fixed at 10% (5000 m3/day) of the total supply, while that for the first underground dam ranged from 70% to 85% (42,500m3/day), and that for the reservoir ranged from 5% to 20%, depending on the drought severity.
In all scenarios, it was assumed that the underground dams were capable of supplying the allocated daily water supply. Therefore, the reservoir simulation results were an indicator of the performance of the proposed conjunctive operation system. If the water supply was available all year round in the reservoir, it meant that the conjunctive operation was effective. However, if the water supply was not available for several months, it meant that the operation was only partially effective and, if water was not available most of the year from the reservoir, the operation design needed to be modified.
4.2. Reservoir Simulation
Owing to the focus on the effects of drought in this study, the water supply from the reservoir was simulated from the perspective of long-term operation. Due to the characteristics of drought, the drought duration was considered, because it is not known exactly when they will occur. Based on the simulation of the reservoir water supply using the flexible water supply scenarios for multiple water resources in Table 6, it was determined whether the agricultural reservoir was able to supply agricultural, domestic, and environmental water, and how long it could supply that water according to the severity of the drought.
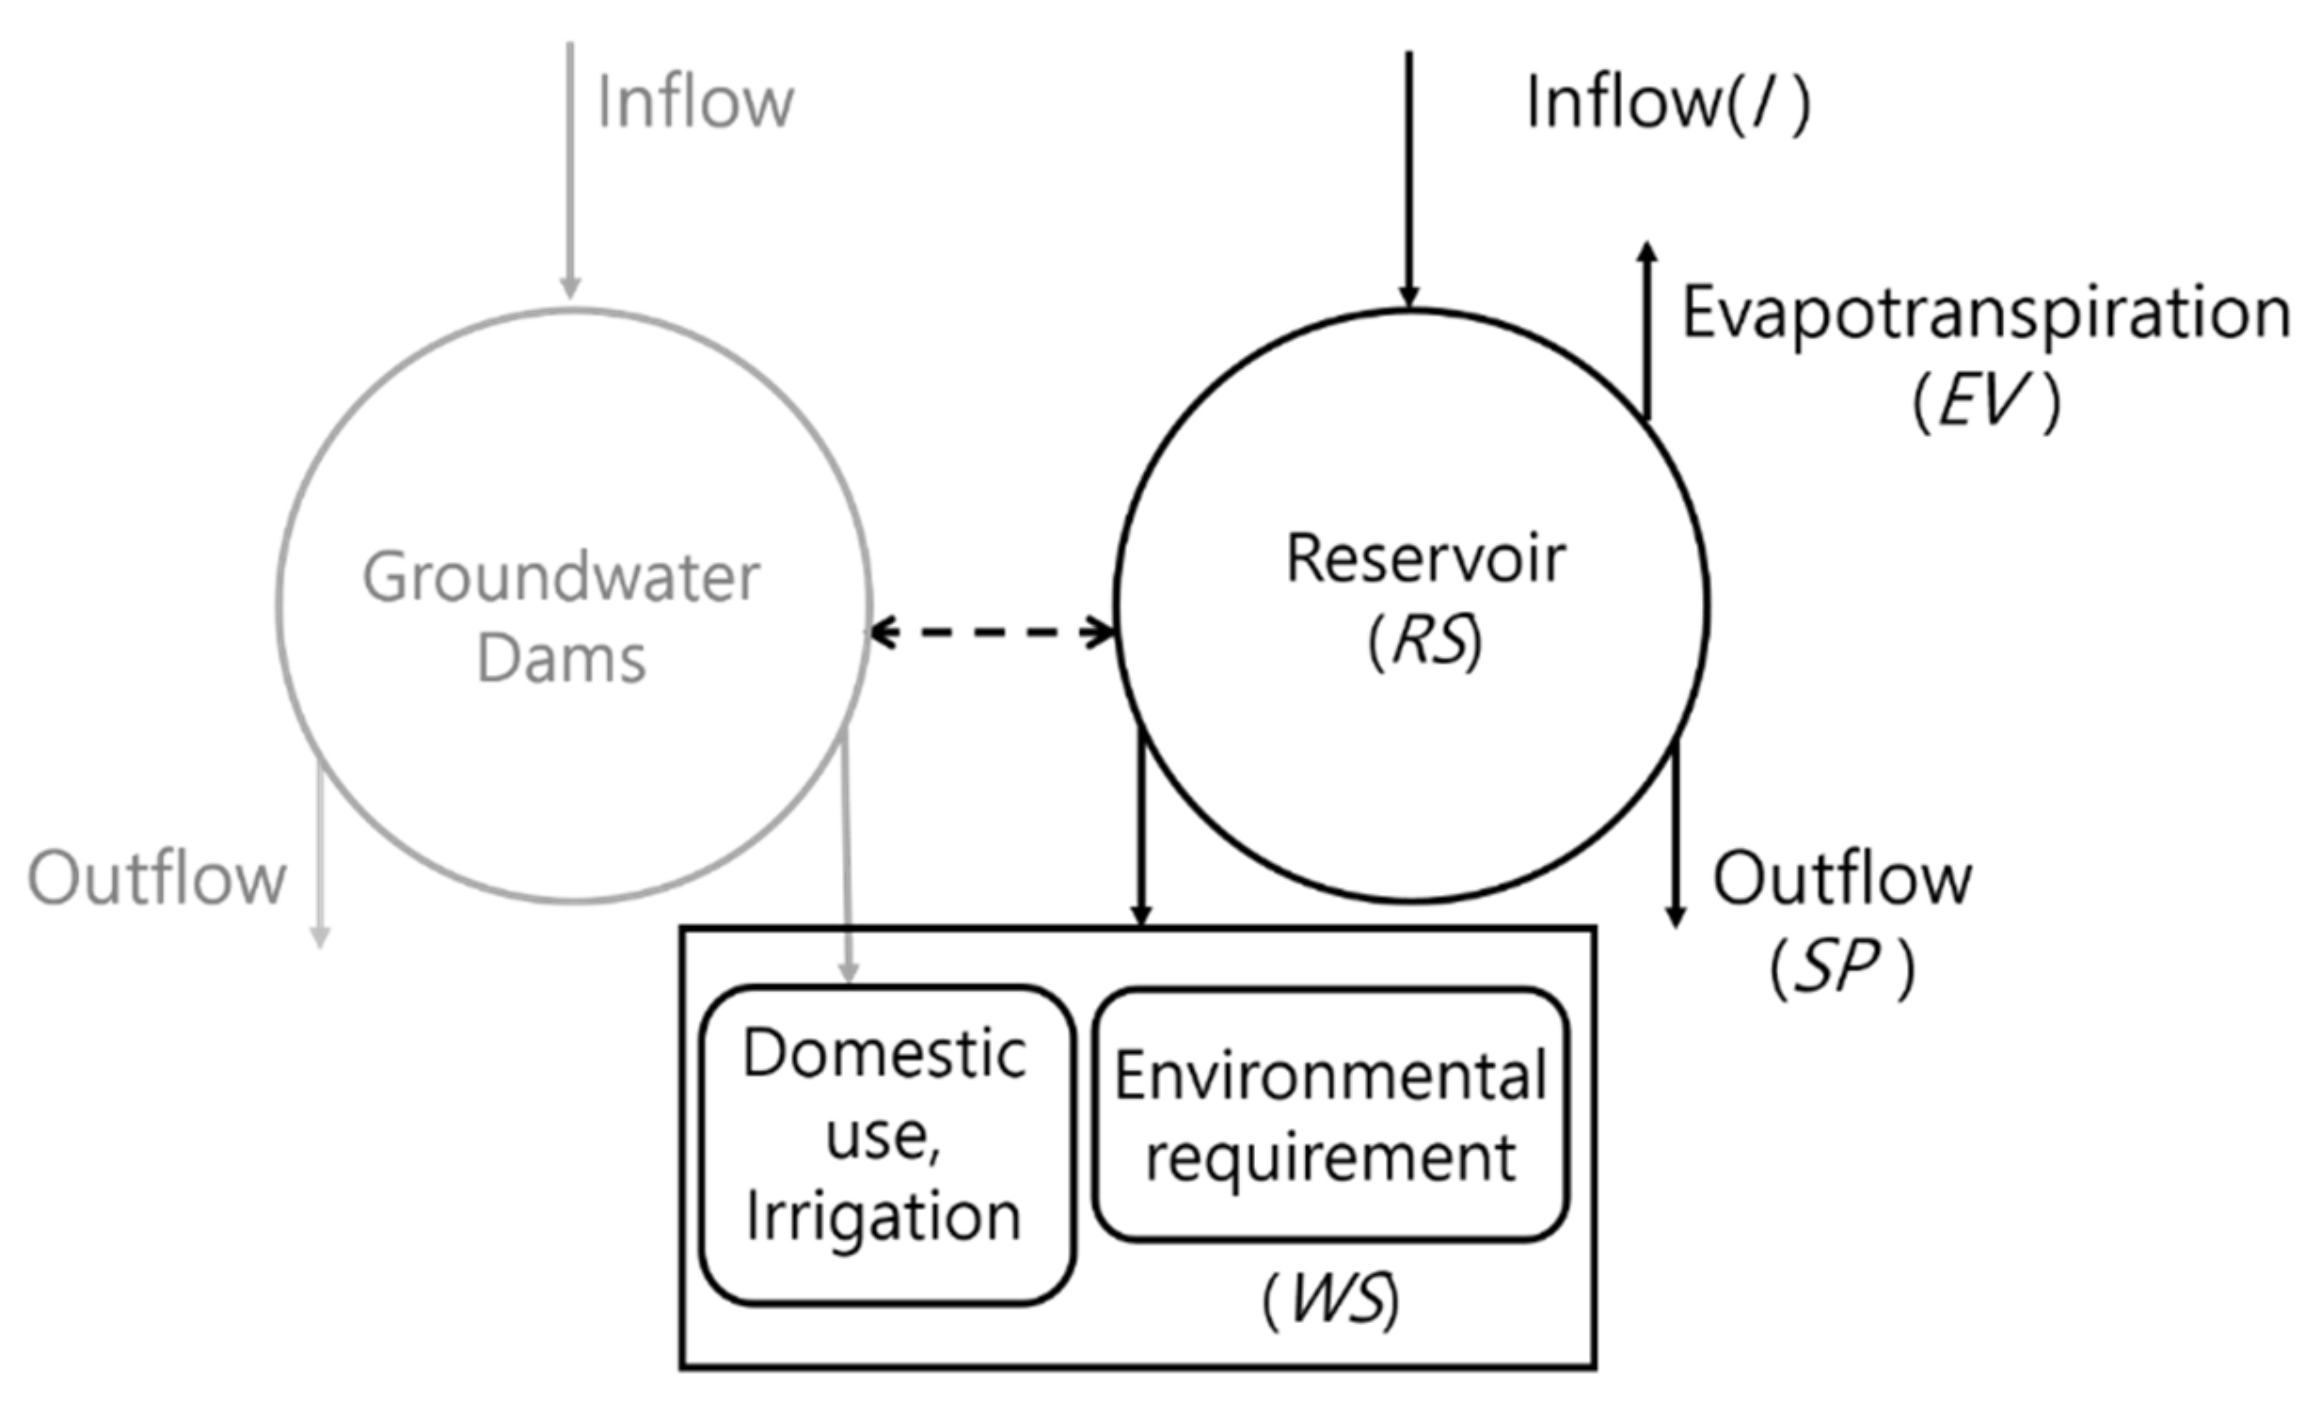
Figure 7 presents the components of the reservoir simulation employed in this study. To simulate the time-varying storage levels, the reservoir simulation model was formulated as follows:
where is the reservoir storage in year and month , I is the dam inflow in year and month , is the total water supply in year and month , is the average evaporation loss in year and month , and is the overflow at the spillway in year and month . Many monthly water balance models have been presented for , but the Kajiyama formula was used in this study due to the limitations of data accessibility [43,44].
Here is the depth of the runoff and is the basin area. However, because the available runoff data were insufficient, an appropriate method was needed to calculate the inflow to the reservoir. If the relationship between rainfall and runoff depth can be established, the inflow can be calculated based on the runoff depth and the catchment area. For this, the Kajiyama formula, which is widely used for the calculation of monthly runoff depth in Korea, was employed:
where represents the runoff depth in mm, is the monthly rainfall, is the runoff coefficient, and is the coefficient for monthly rainfall depth. Here, the monthly rainfall was applied to the probability rainfall distribution for drought severity calculated in Section 3.3 to simulate a normal year, and once in 10-, 30-, and 50-year drought.
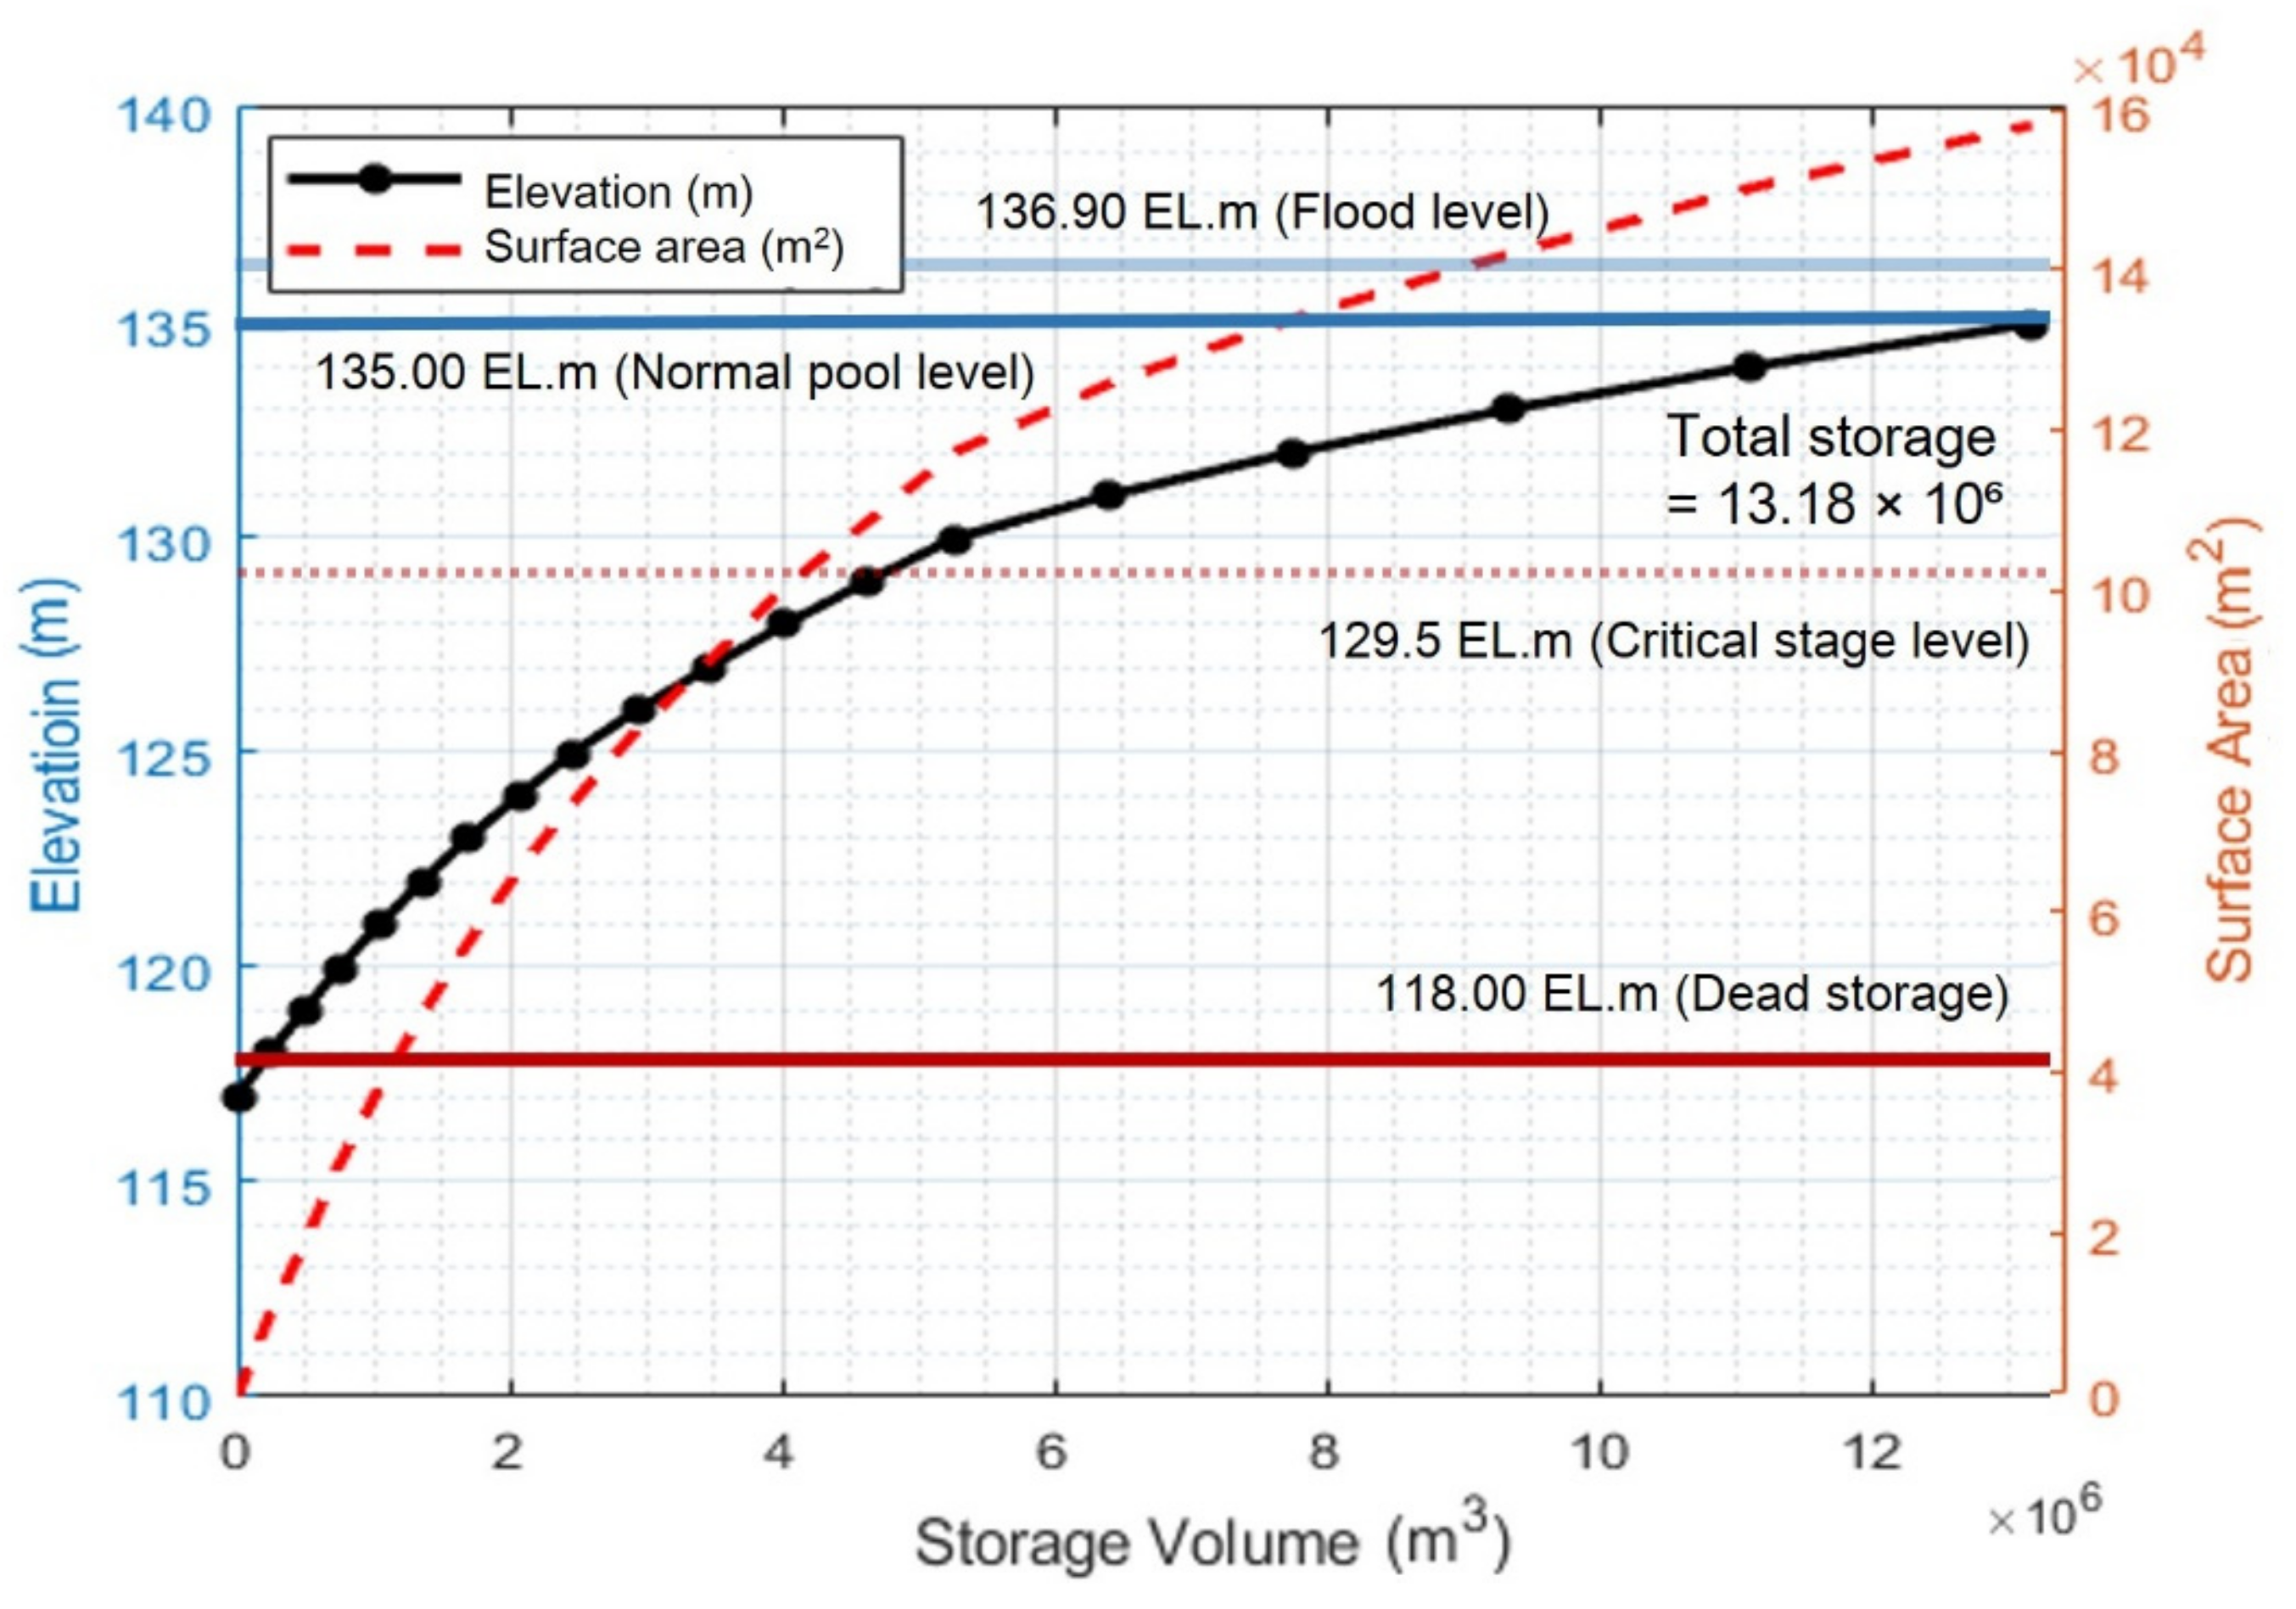
In Equation (7), the water supply consists of domestic, agricultural, and environmental maintenance uses. Domestic water was calculated as the proportion of the daily water that the reservoir needed to supply for each scenario. Wonam Reservoir is mainly employed to supply agricultural water to farms from April to September, and the water supply was available for domestic use if the reservoir did not fall below the dead storage level. The storage rate curves for each elevation of the reservoir were used. The environmental water use for the reservoir was estimated by multiplying the minimum number of days required for the maintenance of the stream by 2700 m3 per day. As the water level data for the reservoir were not accurate, real-time reservoir data were collected and used to create elevation–surface area–storage curves (Figure 8) [45]. The average evaporation loss was obtained from the closest measurements to the reservoir.
4.3. Conjunctive Operation Effects
The effect of the conjunctive operation can be quantitatively assessed based on two fictive capacities. The first is the groundwater preservation capacity, which represents the amount that can be preserved by conjunctive operation that utilizes other water sources compared to doing nothing. In the groundwater dam, it was assumed that the underground water is preserved due to the reduction of the underground dam burden. In particular, the damage caused by the continuous and excessive use of one resource (i.e., the groundwater dam), water shortages due to depletion, and the impact on the natural environment can be reduced by conjunctive operation, and water resources can be conserved through the use of other water sources (i.e., the other groundwater dam and the reservoir in the present study). Therefore, the domestic water allocated to other sources can be considered part of the conjunctive operation effect.
The second measure is the water supply potential (WSP) for the agricultural reservoir. The WSP was introduced by Chilton et al. (1995) as the supply “availability” related to transmissivity in an aquifer [46], while Jemcov (2007) assessed the WSP as based on the groundwater budget and that it expressed the available “loan capacity” of deep-stored water [47]. Accordingly, in this study, the WSP was based on the reserve of the total input in the reservoir. In other words, the sum of the monthly storage () and overflow () minus the minimum storage needed to maintain the water supply () was used to calculate the WSP (Equation (10)). M was determined based on practical considerations because supplying water is impossible if the water falls below a critical level. Thus, the WSP was calculated by excluding the storage of the critical zone. In this study, the ratio of the WSP to the total water demand was assessed for each scenario.
5. Results and Discussion
5.1. Performance of Scenario-Based Operation
In all cases, the groundwater dams were assumed to be capable of supplying the amount allocated in each scenario. Accordingly, if the amount remaining after subtracting the allocation from the underground dams from the total supply of domestic water required each month can be supplied by the reservoir, then conjunctive operation can be considered feasible. In Scenarios 1 and 2, the reservoir operated under a fixed water allocation ratio for all drought severity levels. In the other scenarios, the water allocation ratio varied according to the drought severity.
The simulated results for the reservoir were assessed according to the changes in the water level with the storage amount over time. In some cases, the amount of water flowing out of the reservoir (through the water supply) was significantly higher than the amount flowing into the reservoir through rainfall. In these cases, if the water level fell below the dead storage level, it was impossible to use the reservoir to supply the water supply. Thus, it would be necessary to reduce the amount of water allocated to the reservoir and make up the deficit using another water source or a water tank.
A total 80 cases were analyzed based on the different scenarios, drought severities, and drought durations (Table 7). The probability of a continuous supply of water throughout the year was expressed as the number of months that had a consistent supply of water out of 12. Cases with a high probability of a continuous supply of water are marked in dark grey, and it can be seen that Scenarios 4 had the highest water supply probabilities.
In Scenario 1, water shortages in the reservoirs occurred for at least two months (i.e., an 83% probability of continuous water supply) and up to six months (50%) for both normal and drought-affected years. Under Scenario 2, some cases had a 100% probability of a continuous supply of water, but when a drought was long-lasting, water shortages occurred for 1–2 months during summer. In Scenario 3, when a once-in-10-year drought lasted for 30 days, the water level fell below the dead storage level from May to June (i.e., 83%) and when it lasted for more than 60 days, water shortages occurred for 3–4 months (i.e., 67–75%). For once-in-30-year and -50-year droughts, water shortages lasted for 2–3 months until early summer, depending on the duration (i.e., 75–83%). Under Scenario 4, water could be supplied throughout the year until a drought duration of 30 days for a once-in-10-year drought, with 1 month of insufficient water up to a duration of 120 days and 2 months up to a duration of 150 days (i.e., 83–92%). However, for more severe and longer droughts, the water shortages did not last for more than two months. For example, for a once-in-50-year drought that lasts for 150 days, the reservoir fell below the critical water level only in June (i.e., 92%).
Overall, as shown by the results for Scenarios 1 and 3, water supply operation using only the first underground dam and the reservoir is not sufficient to prepare for future droughts. On the other hand, continuous water supply over the entire year is possible in some cases under Scenarios 2 and 4. In particular, when the three water sources are operated flexibly according to the drought severity, the system can even handle a once-in-50-year drought that lasts for up to 4 months.
5.2. Assessment of the Conjunctive Operation Effect
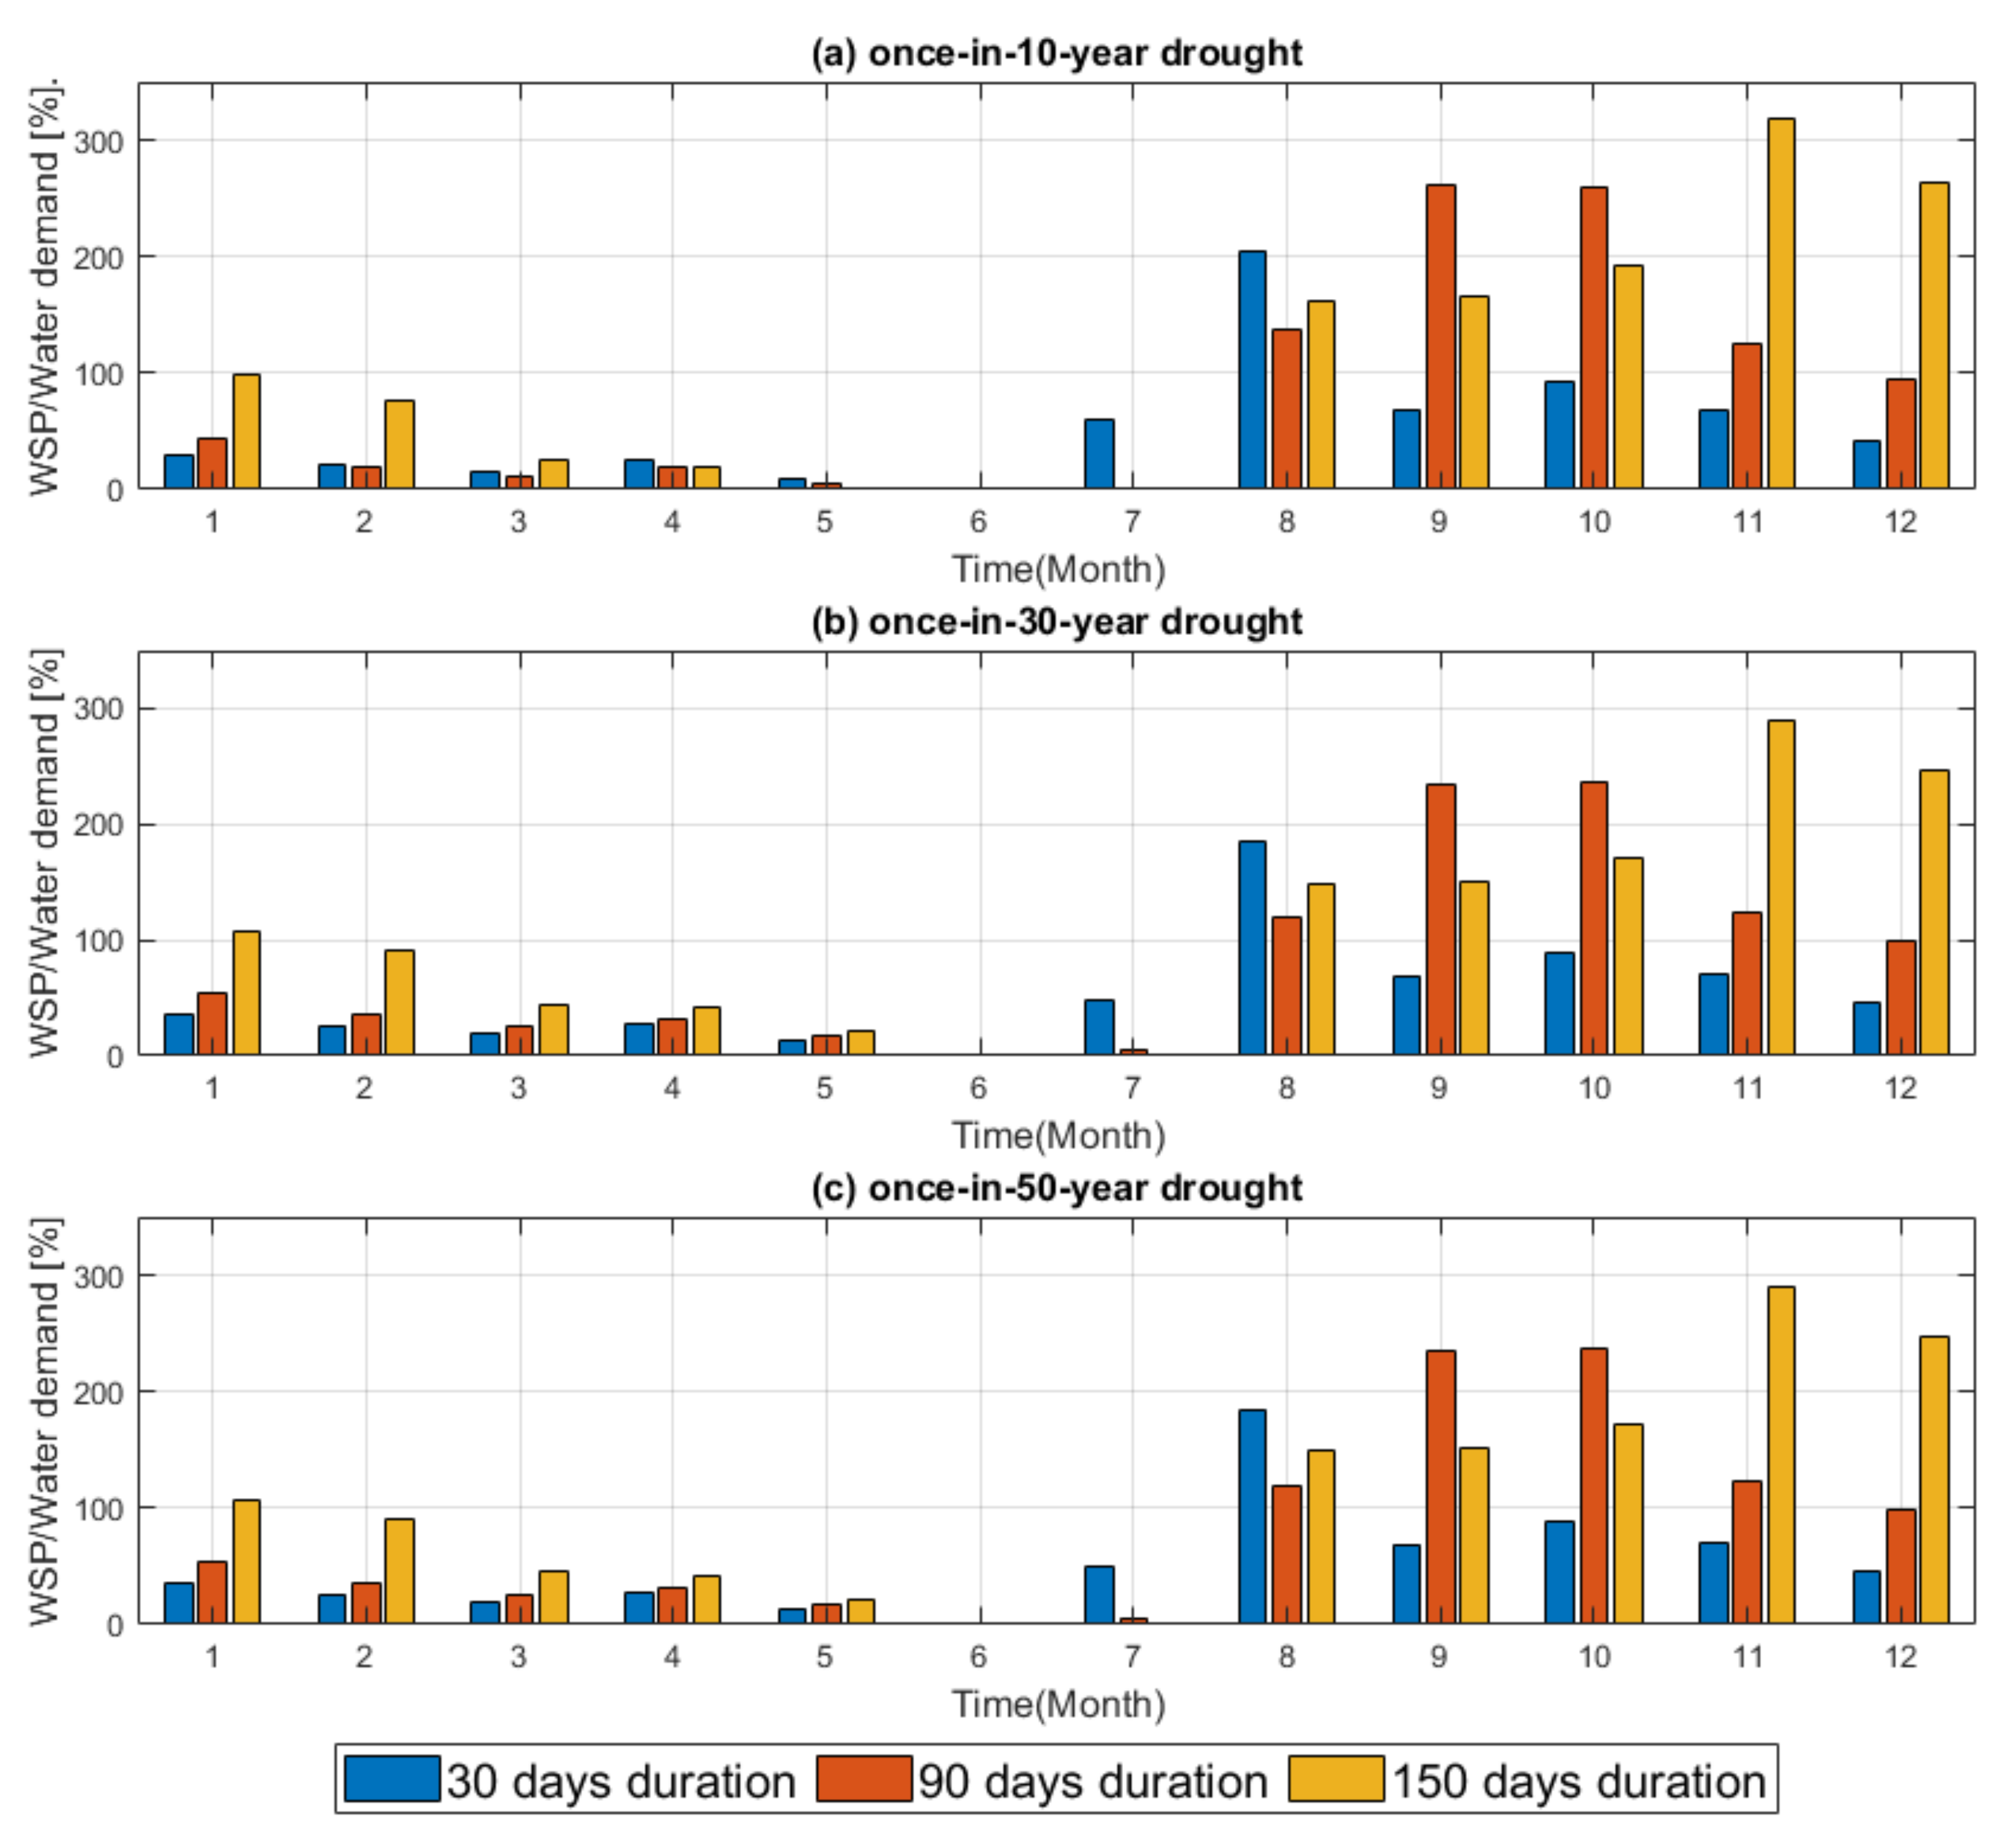
The WSP of Scenario 4, evaluated as the most effective, was calculated. Figure 9a–c presents the monthly ratio of the WSP to the water demand for Scenario 4, according to the drought severity. The WSP ratio for the reservoir was 318% in November during a once-in-10-year drought that lasted 150 days. For a once-in-30-year drought, a maximum WSP ratio was 296%, while 290% was produced for a once-in-50-year drought. The decrease in the WSP ratio from March to July was a result of the start of the farming season and the decrease in autumn–spring rainfall. After July, the rainfall increased sharply and the agricultural season ended, meaning that the WSP ratio increased significantly from fall to winter. Furthermore, the WSP ratio did not decrease significantly according to drought severity because there was no significant difference in the estimated rainfall (Figure 6). On the other hand, as the duration of the drought increased, the WSP ratio to water demand increased, because the amount of domestic water required during that period was lower than in a normal year, increasing the reservoir’s storage and overflow.
6. Conclusions
The conjunctive operation of a surface reservoir and subsurface dams for effective water resource management was proposed in the present study. A study area using a single water source that has long suffered from water shortages was selected for analysis. The demand for domestic water was predicted, and then three levels of drought severity were set and the corresponding annual rainfall estimated. Operational scenarios were then developed, in which the proportion of water allocation to the water sources differed for conjunctive operation.
Based on a simulation of the water supplied in these scenarios, the most effective operating conditions were selected. The most effective set-up was found to be the use of two subsurface dams and one surface reservoir, in which the first dam provided 70 to 85% of the average daily domestic water in 2050, while the second dam supplied 10%, and the remainder came from the agricultural reservoir. It was assumed that the dams were always capable of meeting their required allocations, thus the supply of domestic water allocated to the reservoir was used to determine the effectiveness of the conjunctive operation. Simulations revealed that a continuous water supply was possible throughout the year, even during once-in-30-year and -50-year droughts that lasted up to 120 days. This means that the proposed conjunctive operation scenario represents an effective alternative strategy for supplying water during times of drought.
In addition, the effect of conjunctive operation was quantified using the WSP of the reservoir. This fictive capacity represents the surplus water that can be supplied to the study area. Regardless of the severity of the drought, a higher WSP was observed from autumn to early winter than from spring to summer. Over the course of a year, the ratio of the WSP to the total water demand could reach 318% and 296% under a once-in-10-year and once-in-50-year drought, respectively. Unexpectedly, there was no significant change in the WSP according to the drought severity, and it was found that the longer the duration of the drought, the higher the WSP, due to differences in water allocation.
The conjunctive operation scheme presented in this work allocates water from surface and subsurface facilities in a flexible way, and according to the drought severity. We believe that it can be effective for the planning and operation of water management in areas where new development of water resources is difficult, and the capability to adapt to the drought situations can be significantly enhanced.
Author Contributions
B.R.K. led manuscript writing and conducted the research under the guidance of S.-I.L. S.-I.L. contributed to preparation of the manuscript through review and comments. All authors have read and agreed to the published version of the manuscript.
Funding
This work was supported by Korea Environment Industry & Technology Institute (KEITI) through Demand Responsive Water Supply Service Program, funded by Korea Ministry of Environment (MOE) (146515).
Institutional Review Board Statement
Not applicable.
Informed Consent Statement
Not applicable.
Data Availability Statement
Not applicable.
Acknowledgments
The authors would like to thanks the reviewers for their valuable comments and suggestions.
Conflicts of Interest
The authors declare no conflict of interest.
References
- Azaiez, M.N.; Hariga, M. A single-period model for conjunctive use of ground and surface water under severe overdrafts and water deficit. Eur. J. Oper. Res. 2001, 133, 653–666. [Google Scholar] [CrossRef]
- Singh, A. Optimizing the use of land and water resources for maximizing farm income by mitigating the hydrological imbalances. Hydrol. Eng. 2014, 19, 1447–1451. [Google Scholar] [CrossRef]
- Cosgrove, D.M.; Johnson, G.S. Aquifer management zones based on simulated surface-water response functions. Water Resour. Plan. Manag. 2005, 131, 89–100. [Google Scholar] [CrossRef]
- Azaiez, M.N. A model for conjunctive use of ground and surface water with opportunity costs. Eur. J. Oper. Res. 2002, 143, 611–624. [Google Scholar] [CrossRef]
- Ejaz, M.S.; Peralta, R.C. Maximizing conjunctive use of surface and groundwater under surface water quality constraints. Adv. Water Resour. 1995, 18, 61–75. [Google Scholar] [CrossRef] [Green Version]
- Asano, T. Artificial Recharge of Groundwater; Butterworth Publishers: Boston, MA, USA, 1985. [Google Scholar]
- Molano, C.; Bonilla, R.; Mejia, J.; Rodnguez, C. Artificial Recharge of the Santa Marta Aquifer, Colombia. In Artificial Recharge of Ground Water II; American Society of Civil Engineers: New York, NY, USA, 1995; pp. 446–454. [Google Scholar]
- Liu, P.; Liu, Z.; Duan, Z. A case study on artificial recharge of groundwater in the coastal aquifer of Longkou, China. In Artificial Recharge of Ground Water II; American Society of Civil Engineers: New York, NY, USA, 1995; pp. 464–470. [Google Scholar]
- Panda, R.K.; Sethi, R.R.; Rautaray, S.K.; Mohanty, R.K.; Panigrahi, P.; Ambast, S.K. Enhancing water productivity through conjunctive use of surface and groundwater resources in upland plateau regions of Odisha. Indian J. Soil Conserv. 2018, 46, 139–145. [Google Scholar]
- Karamouz, M.; Zahraie, B.; Kerachian, R.; Eslami, A. Crop pattern and conjunctive use management: A case study. Irrig. Drain. 2008, 59, 161–173. [Google Scholar] [CrossRef]
- Wu, X.; Zheng, Y.; Wu, B.; Tian, Y.; Han, F.; Zheng, C. Optimizing conjunctive use of surface water and groundwater for irrigation to address human-nature water conflicts: A surrogate modeling approach. Agric. Water Manag. 2016, 163, 380–392. [Google Scholar] [CrossRef]
- Heydari, F.; Saghafian, B.; Delavar, M. Coupled quantity-quality simulation-optimization model for conjunctive surface-groundwater use. Water Resour. Manag. 2016, 30, 4381–4397. [Google Scholar] [CrossRef]
- Wang, C.X.; Li, Y.P.; Huang, G.H.; Zhang, J.L. A type-2 fuzzy interval programming approach for conjunctive use of surface water and groundwater under uncertainty. Inf. Sci. 2016, 340–341, 209–227. [Google Scholar] [CrossRef]
- Bejranonda, W.; Koch, M.; Koontanakulvong, S. Surface water and groundwater dynamic interaction models as guiding tools for optimal conjunctive water use policies in the central plain of Thailand. Environ. Earth Sci. 2011, 70, 2079–2086. [Google Scholar] [CrossRef]
- Vedula, S.; Mujumdar, P.P.; Sekhar, G.C. Conjunctive use modeling for multicrop irrigation. Agric. Water Manag. 2005, 73, 193–221. [Google Scholar] [CrossRef] [Green Version]
- Belaineh, G.; Peralta, R.C.; Hughes, T.C. Simulation/optimization modeling for water resources management. ASCE J. Water Resour. Plan. Manag. 1999, 125, 154–161. [Google Scholar] [CrossRef]
- Hamamouche, M.F.; Kuper, M.; Riaux, J.; Leduc, C. Conjunctive use of surface and groundwater resources in a community-managed irrigation system—The case of the Sidi Okba palm grove in the Algerian Sahara. Agric. Water Manag. 2017, 193, 116–130. [Google Scholar] [CrossRef]
- Nikan, N.G.; Regulwar, D.G. Optimal operation of multipurpose reservoir for irrigation planning with conjunctive use of surface and groundwater. Water Resour. Prot. 2015, 7, 636–646. [Google Scholar] [CrossRef] [Green Version]
- Mohan, S.; Jyothiprakash, V. Development of priority-based policies for conjunctive use of surface and groundwater. Water Int. 2003, 28, 254–267. [Google Scholar] [CrossRef]
- Shekhar, S.; Kumar, S.; Sinha, R.; Gupta, S.; Densmore, A.; Rai, S.P.; Kumar, M.; Singh, A.; Dijk, W.; Joshi, S.; et al. Efficient conjunctive use of surface and groundwater can prevent seasonal death of non-glacial linked rivers in groundwater stressed areas. In Clean and Sustainable Groundwater in India; Springer: Singapore, 2018; pp. 117–124. [Google Scholar]
- Rafipour-Langeroudi, M.; Kerachian, R.; Bazargan-Lari, M. Developing operating rules for conjunctive use of surface and groundwater considering the water quality issues. KSCE J. Civ. Eng. 2014, 18, 454–461. [Google Scholar] [CrossRef]
- Rezapour Tabari, M.M.; Yazdi, A. Conjunctive use of surface and groundwater with inter-basin transfer approach: Case study Piranshahr. Water Resour. Manag. 2014, 28, 1887–1906. [Google Scholar] [CrossRef]
- Safavi, H.R.; Esmikhani, M. Conjunctive use of surface water and groundwater: Application of support vector machines (SVMs) and genetic algorithms. Water Resour. Manag. 2013, 27, 2623–2644. [Google Scholar] [CrossRef]
- Yang, C.C.; Chang, L.C.; Chen, C.S.; Yeh, M.S. Multi-objective Planning for conjunctive use of surface and subsurface water Using Genetic Algorithm and Dynamics Programming. Water Resour. Manag. 2009, 23, 417–437. [Google Scholar] [CrossRef]
- Bazargan-Lari, M.R.; Kerachian, R.; Mansoori, A. A conflict resolution model for conjunctive use of surface and groundwater resources considering the water quality issues: A case study. Environ. Manag. 2008, 43, 470–482. [Google Scholar] [CrossRef]
- Dai, C.; Cai, Y.P.; Lu, W.T.; Liu, H.; Guo, H.C. Conjunctive water use optimization for watershed-lake water distribution system under uncertainty: A case study. Water Resour. Manag. 2016, 30, 4429–4449. [Google Scholar] [CrossRef]
- Parsapour-Moghaddam, P.; Abed-Elmdoust, A.; Kerachian, R. A heuristic evolutionary game theoretic methodology for conjunctive use of surface and groundwater resources. Water Resour. Manag. 2015, 29, 3905–3918. [Google Scholar] [CrossRef]
- Barlow, D.P.M.; Ahlfeld, P.; Dickerman, D.C. Conjunctive management model for sustained yield of stream–aquifer systems. ASCE J. Water Resour. Plan. Manag. 2003, 129, 35–48. [Google Scholar] [CrossRef]
- Chen, C.W.; Wei, C.C.; Liu, H.J.; Hsu, N.S. Application of neural networks and optimization model in conjunctive use of surface water and groundwater. Water Resour. Manag. 2014, 28, 2813–2832. [Google Scholar] [CrossRef]
- Khare, D.; Jat, M.K.; Sunder, J.D. Assessment of water resources allocation options: Conjunctive use planning in a link canal command. Resour. Conserv. Recycl. 2007, 51, 487–506. [Google Scholar] [CrossRef]
- El-Rawy, M.; Zlotnik, V.A.; Al-Raggad, M.; Al-Maktoumi, A.; Kacimov, A.; Abdalla, O. Conjunctive use of groundwater and surface water resources with aquifer recharge by treated wastewater: Evaluation of management scenarios in the Zarqa River Basin, Jordan. Environ. Earth Sci. 2016, 75, 1146. [Google Scholar] [CrossRef]
- Karamouz, M.; Kerachian, R.; Zahraie, B. Monthly water resources and irrigation planning: Case study of conjunctive use of surface and groundwater resources. Irrig. Drain. Eng. 2004, 130, 391–402. [Google Scholar] [CrossRef]
- Li, P.; Qian, H.; Wu, J. Conjunctive use of groundwater-surface water to reduce soil salinization in the Yinchuan Plain, northwest China. Int. J. Water Resour. Dev. 2018, 34, 337–353. [Google Scholar] [CrossRef]
- Sokcho. Available online: www.sokcho.go.kr/portal (accessed on 5 December 2018).
- Kim, S.M.; Lee, S.I.; Kim, B.C. Effective use of water resources through conjunctive use-(2) Application. Korea Water Resour. Assoc. 2004, 37, 799–812. [Google Scholar] [CrossRef] [Green Version]
- KMA: Korea Meteorological Administration. Available online: http://www.kma.go.kr/ (accessed on 5 July 2019).
- Water Resources Management Information System. Available online: http://www.wamis.go.kr/ (accessed on 20 August 2019).
- Seo, S.B.; Mahinthakumar, G.; Sankarasubramanian, A.; Kumar, M. Conjunctive management of surface water and groundwater resources under drought conditions using a fully-coupled hydrological model. ASCE J. Water Resour. Plan. Manag. 2018, 144, 04018060. [Google Scholar] [CrossRef] [Green Version]
- Zargar, A.; Sadiq, R.; Naser, B.; Khan, F.I. A review of drought indices. Environ. Rev. 2011, 19, 333–349. [Google Scholar] [CrossRef]
- McKee, T.B.N.; Doesken, J.; Kleist, J. The relationship of drought frequency and duration to time scales. In Eighth Conference on Applied Climatology; American Meteorological Society: Anaheim, CA, USA, 1993; pp. 179–184. [Google Scholar]
- Korea Meteorological Administration Policy. Available online: http://www.climate.go.kr/home (accessed on 20 December 2020).
- National Drought Information-Analysis Center. NDIC-FAT Drought Frequency Analysis Program User’s Manual. Available online: http://drought.go.kr/menu/m50/m50.do?tabValue=5 (accessed on 20 November 2020).
- Xiong, L.; Guo, S. A two-parameter monthly water balance model and its application. Hydrology 1999, 216, 111–123. [Google Scholar] [CrossRef]
- Kim, S.J.; Hong, S.J.; Kang, N.R.; Noh, H.S.; Kim, H.S. A comparative study on the simple two-parameter monthly water balance model and Kajiyama formula for monthly runoff estimation. Hydrol. Sci. 2015, 61, 1244–1252. [Google Scholar] [CrossRef]
- Rural Agriculture Water Information System. Available online: https://rawris.ekr.or.kr/main.do (accessed on 30 July 2019).
- Chilton, P.J.; Foster, S.S.D. Hydrogeological characterization and water-supply potential of basement aquifers in tropical Africa. Hydrogeol. J. 1995, 3, 36–49. [Google Scholar] [CrossRef]
- Jemcov, I. Water supply potential and optimal exploitation capacity of karst aquifer systems. Environ. Geol. 2007, 51, 767–773. [Google Scholar] [CrossRef]
Figure 1.
Types of conjunctive operation for surface and subsurface water: (a) active and (b) passive.
Figure 1.
Types of conjunctive operation for surface and subsurface water: (a) active and (b) passive.

Figure 2.
Overview of Sokcho City and the available water resources (groundwater dams and reservoir).
Figure 2.
Overview of Sokcho City and the available water resources (groundwater dams and reservoir).

Figure 3.
Meteorological data over the past thirty years in Sokcho: (a) annual rainfall and trend line, (b) monthly average precipitation and temperature
Figure 3.
Meteorological data over the past thirty years in Sokcho: (a) annual rainfall and trend line, (b) monthly average precipitation and temperature

Figure 4.
Change in the SPI in the past (a,c) and future (b,d) for moderate to extreme droughts (<−1).
Figure 4.
Change in the SPI in the past (a,c) and future (b,d) for moderate to extreme droughts (<−1).

Figure 5.
Drought frequency analysis process

Figure 6.
Estimated monthly rainfall according to drought severity.

Figure 7.
Reservoir simulation components for passive conjunctive operation.

Figure 8.
Schematic side view of Wonam Reservoir and its elevation–surface area–storage curves.

Figure 9.
Ratio of the water supply potential (WSP) to water demand over time for Scenario 4


Table 1.
Recent works on conjunctive operation.
| Objectives | Type | Region (Country) | Details | Ref. No. |
|---|---|---|---|---|
| Securing irrigation water | Passive | Upland plateau of Odisha, India | Evaluated the impact of integrated water resource development and management strategies on agricultural production using flow-regulating devices in a canal-linked service reservoir and a dug well adjacent to the canal | [9] |
| Securing irrigation water | Passive | Tehran, Iran | Simulated scenarios to determine the optimal crop pattern considering water allocation priorities and river water and groundwater availability | [10] |
| Securing irrigation water | Passive | Heihe River Basin, China | Optimized the conjunctive use of surface water and groundwater for irrigation | [11] |
| Securing irrigation water and managing water quality | Passive | Zayanderood River Basin, Iran | Developed a water allocation model for the conjunctive use of surface water and groundwater | [12] |
| Securing irrigation water | Passive | Zhangweinan River Basin, China | Developed a type-2 fuzzy interval programming method for the conjunctive use of surface water with different groundwater utilization ratios | [13] |
| Securing irrigation water | Active | Chao Phraya Plain, Thailand | Suggested a simulation-based tool for optimal conjunctive use | [14] |
| Securing irrigation water | Passive | Chitradurga District, India | Suggested an optimal conjunctive use policy for irrigation in a reservoir-canal-aquifer system | [15] |
| Securing irrigation water | Passive | Hypothetical domain | Developed a simulation/optimization model to integrate reservoir rules, simulations of stream/aquifer flow, conjunctive use, and delivery via branching canals to water users | [16] |
| Securing irrigation water | Passive | Sidi Okba, Algeria | Explored the history and problems associated with community-managed conjunctive use allocation | [17] |
| Securing irrigation water | Passive | Jayakwadi Reservoir, India | Developed a linear programming model for the conjunctive use of surface water and groundwater to obtain the optimal operating policy for a multipurpose reservoir | [18] |
| Securing irrigation water | Passive | Godavari River, India | Developed an optimal cropping pattern and optimal pumping strategy for the operation of a reservoir/aquifer system | [19] |
| Securing an efficient and stable water supply | Active | India | Proposed efficient conjunctive use of surface and groundwater to prevent the death of a river using a conceptual framework | [20] |
| Securing an efficient and stable water supply and improving water quality | Active | Tehran Plain, Iran | Developed Bayesian network-based operating rules for the conjunctive use of surface water (river and canal) and groundwater | [21] |
| Securing an efficient and stable water supply | Passive | Urmia Lake Basin, Iran | Proposed a model for water allocation based on consumption and resource priorities and groundwater level constraints | [22] |
| Securing an efficient and stable water supply | Passive | Zayandehrood River Basin, Iran | Developed a linked simulation-optimization model for the conjunctive use of river water and groundwater | [23] |
| Securing an efficient and stable water supply | Passive | Tsengwen and Kaopin Rivers, Taiwan | Suggested a novel approach by integrating tools for the conjunctive use of a reservoir and wells | [24] |
| Securing an efficient and stable water supply | Passive | Tehran Metropolitan Area, Iran | Developed a conflict-resolution methodology for the conjunctive use of river water and groundwater | [25] |
| Securing an efficient and stable water supply | Passive | Yunnan Province, China | Suggested a cost-effective water allocation scheme for the conjunctive use of surface water and groundwater | [26] |
| Securing an efficient and stable water supply | Passive | Rafsanjan Plain, Iran | Developed a methodology to determine evolutionary stable equilibrium strategies for surface and groundwater allocation | [27] |
| Securing an efficient and stable water supply | Active | Rhode Island, USA | Simulated conjunctive-management models for the water supply in an alluvial-valley stream-aquifer system | [28] |
| Securing an efficient and stable water supply | Passive | Chou-Shui Alluvial Fan, Taiwan | Developed an optimization model for the large-scale conjunctive use of surface water and groundwater resources using linear programming | [29] |
| Securing an efficient and stable water supply | Passive | Andra Pradesh, India | Developed a linear programming-based optimization model using water allocation scenarios | [30] |
| Managing water quality | Active | Zarpa River Basin, Jordan | Developed a conceptual model of an aquifer to gain a better understanding of water dynamics in the basin and to investigate different management scenarios using managed aquifer recharge | [31] |
| Managing water quality | Passive | Tehran, Iran | Developed a dynamic programming model for conjunctive use to manage river water quality | [32] |
| Reducing the intrusion of saline water | Passive | Yinchuan Plain, China | Determined the optimal conjunctive use of surface water and groundwater to alleviate soil salinization | [33] |
Table 2.
Details of the groundwater dams in the Sokcho area.
| Groundwater Dam #1 | Groundwater Dam #2 | ||
|---|---|---|---|
| Purpose | Domestic water supply | Domestic water supply | |
| Basin area (km3) | 65.33 | 65.33 | |
| Length of the wall (m) | 830 | 1107 | |
| Design daily maximum water supply (m3) | 43,000 | 5000 | |
| Material of bed rock | Banded gneiss | Banded gneiss | |
| Material of aquifer | Sands and gravels | Sands and gravels | |
| Coefficent of permeability (m/s) | 9.71 10−4 ~1.03 10−2 | 9.71 10−4 ~1.03 10−2 | |
| Porosity | 0.35 | 0.35 | |
| Completion year | 1998 | To be completed in 2022 |
Table 3.
Details of Wonam Reservoir
| Purpose | Agricultural Water Supply |
|---|---|
| Basin Area (km3) | 14.19 |
| Dead level (m) | 118.0 |
| Full water level (m) | 135.0 |
| Total storage (m3) | 1,318,200 |
| Completion year | 1963 |
Table 4.
Prediction of the domestic water demand for Sokcho according to the estimated population size
Table 4.
Prediction of the domestic water demand for Sokcho according to the estimated population size
| Population Projection Method | Estimated Population Size in 2050 | Water Demand (m3/day) |
|---|---|---|
| Arithmetic series | 68,332 | 40,713 |
| Least-squares | 64,703 | 39,219 |
| Geometric series | 69,922 | 40,739 |
| Logistic curve | 98,844 | 50,883 |
Table 5.
The standard precipitation index (SPI) classifications.
| SPI Range | Drought Severity |
|---|---|
| −1.0 < SPI ≤ 0 | Near normal |
| −1.5 < SPI ≤ −1.0 | Moderate drought |
| −2.0 < SPI ≤ −1.5 | Severe drought |
| SPI ≤ −2 | Extreme drought |
Table 6.
Water supply ratio under the various drought conditions.
| Scenario | Drought Condition (Frequency) | Water Supply Ratio (%) | ||
|---|---|---|---|---|
| Groundwater Dam #1 | Groundwater Dam #2 | Wonam Reservoir | ||
| 1 | a. Normal | 70 | 0 | 30 |
| b. 10 year | ||||
| c. 30 year | ||||
| d. 50 year | ||||
| 2 | a. Normal | 70 | 10 | 20 |
| b. 10 year | ||||
| c. 30 year | ||||
| d. 50 year | ||||
| 3 | a. Normal | 70 | 0 | 30 |
| b. 10 year | 75 | 25 | ||
| c. 30 year | 80 | 20 | ||
| d. 50 year | 85 | 15 | ||
| 4 | a. Normal | 70 | 10 | 20 |
| b. 10 year | 75 | 15 | ||
| c. 30 year | 80 | 10 | ||
| d. 50 year | 85 | 5 | ||
Table 7.
Operation performance for the four scenarios, depending on drought severity and duration. Darker cells represent a higher probability of continuous water supply.
Table 7.
Operation performance for the four scenarios, depending on drought severity and duration. Darker cells represent a higher probability of continuous water supply.
| Scenario | Drought Frequency | Probability of Continuous Supply Throughout the Year (%) | |||||
|---|---|---|---|---|---|---|---|
| 30 Days | 60 Days | 90 Days | 120 Days | 150 Days | Average | ||
| 1 |
| 50 | 83 | 83 | 83 | 83 | 65 |
| 83 | 58 | 58 | 58 | 58 | ||
| 75 | 58 | 58 | 50 | 58 | ||
| 75 | 58 | 58 | 50 | 58 | ||
| 2 |
| 50 | 100 | 100 | 100 | 100 | 90 |
| 100 | 92 | 92 | 92 | 83 | ||
| 100 | 92 | 92 | 83 | 83 | ||
| 100 | 92 | 92 | 83 | 83 | ||
| 3 |
| 50 | 83 | 83 | 83 | 83 | 78 |
| 83 | 75 | 75 | 67 | 67 | ||
| 83 | 75 | 75 | 75 | 75 | ||
| 83 | 83 | 83 | 83 | 83 | ||
| 4 |
| 50 | 100 | 100 | 100 | 100 | 94 |
| 100 | 92 | 92 | 92 | 83 | ||
| 100 | 100 | 100 | 100 | 83 | ||
| 100 | 100 | 100 | 100 | 92 | ||
Publisher’s Note: MDPI stays neutral with regard to jurisdictional claims in published maps and institutional affiliations. |
© 2021 by the authors. Licensee MDPI, Basel, Switzerland. This article is an open access article distributed under the terms and conditions of the Creative Commons Attribution (CC BY) license (http://creativecommons.org/licenses/by/4.0/).
Share and Cite
MDPI and ACS Style
Kim, B.R.; Lee, S.-I. Conjunctive Operation of Surface and Subsurface Dams Based on Drought Severity. Water 2021, 13, 847. https://doi.org/10.3390/w13060847
AMA Style
Kim BR, Lee S-I. Conjunctive Operation of Surface and Subsurface Dams Based on Drought Severity. Water. 2021; 13(6):847. https://doi.org/10.3390/w13060847
Chicago/Turabian StyleKim, Bo Ram, and Sang-Il Lee. 2021. "Conjunctive Operation of Surface and Subsurface Dams Based on Drought Severity" Water 13, no. 6: 847. https://doi.org/10.3390/w13060847
Note that from the first issue of 2016, this journal uses article numbers instead of page numbers. See further details here.